
Submitted:
09 December 2024
Posted:
10 December 2024
You are already at the latest version
Abstract
Nature provides red blood cell types (RBCs) with diverse mechanical properties, making possible to examine native blood in the presence of different RBC properties (size, shape, aggregability, deformability) without chemically changing the cell membranes, and without modifying the surrounding plasma. We investigated whether the shelf life of cow blood (stiff RBCs, low aggregability) is longer compared to pig blood (deformability/aggregability comparable to human) during cold storage due to a delay in RBC clustering and decomposition. Blood was drawn from conscious pigs and cows (CPDA-1) in their familiar environment to reduce stress, and stored 30 days at +7°C. RBCs remained intact in cow samples whereas pig samples became hemolytic after day 20. White blood cells and platelets decreased with similar percentage in both species. Hematocrit (HCT) decreased due to RBC shrinking in bovine, and due to RBC decay in porcine samples. Blood viscosity increased in both species although HCT decreased. In porcine samples shear-thinning decreased progressively, indicating gradual loss of sample cohesion with storage time. Also, yield stress and storage modulus decreased with hemolysis. In cow samples shear-thinning, yield stress, and storage modulus showed high intraindividual variability, but the mean values did not change over the time course.
Keywords:
cow blood ageing
; pig blood ageing
; blood storage
; rheology
; hematology
1. Introduction
Animal blood is used in biomedical research if practical or ethical considerations do not allow the use of human blood, and if artificial solutions are not available or do not fulfill the desired demands. In mock circulations or device testing apparatus, large blood volumes are needed, and only large animals can serve as donors [1], among them are ruminants and pigs. Due to the propensity of equine red blood cells (RBCs) to spiculate and their pronounced aggregability [4], horse blood is unsuitable for most applications. Animal blood can generally be viewed as an experimental model system that offers the possibility of studying blood suspensions containing erythrocytes (RBCs) with various intrinsic and extrinsic properties. The benefit is the presence of native suspensions, in which the natural cohesion between the components is unaltered. Attempts to chemically stiffen RBCs by aldehyde incubation, or to modify their aggregation by adding dextran, generates unphysiological blood.
We have recently shown that stains from pig blood become smaller with storage time [5], whereas stain diameters change only slightly when cow blood is used that was stored under identical conditions [6]. This quality preservation of bovine blood is obviously based on the rigidity and low aggregability of bovine in contrast to porcine RBCs [7]. Despite the advantages of bovine blood, porcine blood is more comparable to human standards [8] and is therefore essential for many applications, including clinical treatment strategies and recommendations in transfusion medicine [2,3]; specifically, genetically modified pig blood is intended for xenotransfusion [9]. In the following, we describe the changes in hematology and hemorheology in pig and cow blood during 30 days of cold storage in direct comparison. This listing is intended to become a decision-making aid for animal blood users.
2. Materials and Methods
2.1. Blood Samples
Blood was drawn from eleven pigs (age: 4.5 months, 8 females, 3 castrated males) and six cows (age: 5.5 ± 2.4 years), by puncturing the V. cava cranialis (pigs) and the V. jugularis (cows). Blood was drawn into 50 mL syringes that were prepared as follows. CPDA-1 was extracted from standard CPDA-1 blood bags (Fresenius Kabi, Germany) and inserted into sterile perfusor syringes (Braun, Germany; 7 mL of CPDA-1 + 43 mL of blood, resulting in a 1:7 dilution of blood). The syringes were connected to short sterile IV lines attached to sterile needles. All air was removed from these systems prior to punctuation of the vein and blood was drawn to the 50 mL mark. The skin of the animals was cleaned by using a skin disinfectant (Sterillium®, Bode Chemie, Hamburg, Germany) prior to punctuation. Blood samples were used as drawn. Due to the physiological species-specific differences of RBC size and count, the HCT was different between the blood types. Samples were stored in the syringes at 4°C for 30 days and analysed every second day. Prior to each analysis the syringes were placed in an overhead agitator (REAX2, Heidolph, Germany) at the lowest available speed for a minimum of ten minutes to allow tempering of syringes and re-suspension of blood cells. For performing the porcine blood smears, blood was taken from three pigs of another cohort but same race (Large White x Landrace) present in the same institution at a later occasion, to be stored in the fridge for 30 days.
Withdrawal of blood was approved by the institutional ethics and animal welfare committee and the national authority according to §§ 26ff. of Animal Experiments Act, Tierversuchsgesetz 2012 - TVG 2012, reference number BMBWF-68.205/0092-V/3b/2019 (cows) and BMWF-66.009/0372-WF/V/3b/2014, resp. BMWFW-68.205/0188-WF/V/3b/2015 (pigs).
2.2. Hemograms and Free Hemoglobin
Hematology was performed using an ADVIA 2120i system (Siemens, Germany) that applies photometry, flow cytometry and impedance measurement. To observe the onset of hemolysis, aliquots of the blood samples were centrifuged using a Haematokrit 2010 centrifuge (Hettich, Germany). A change in the colour of blood plasma in the glass capillaries was assessed visually and the capillaries were photographed. RBC shape was assessed microscopically in bright field at days 0 and 30 (Olympus IMT-2 mounted to a Nikon DS-Fi1 camera / DS-U3 digital sight tool, Japan). Plasma free hemoglobin (fHb) was measured in pig samples with a colorimetric method using a Cobas c 311 analyser (Roche, Basel, Switzerland).
2.3. Rheometry
Physica MCR 301 and 302 rheometers (Anton Paar, Austria) equipped with a Peltier controlled steel double gap cylinder (pigs: internal gap: 0.417 mm, external gap: 0.462 mm, cup length: 42 mm) or with a cone-plate shear cell (cows: diameter: 50 mm, angle: 0.992°, truncation: 0.100 mm) were used. The cone-plate cell was mounted to the rheometer within with a tempered hood equipped with an evaporation blocker to avoid sample drying. Blood exactly filled the whole gap, there was no asymmetric filling or overfilling. Before blood was filled in the gap, the test surfaces were cleaned by a detergent followed by rinsing with distilled water and 98% ethanol. Thereafter the surfaces were dried and mounted to the rheometer so that they could be perfectly tempered before the blood was filled in. Tests were performed at 22°C.
2.3.1. Tests in Simple Shear Flow
To obtain shear viscosity (η) we created shear strain-controlled flow curves (shear rates 1000 - 10 s-1 on a logarithmic shear rate ramp; 11 data points). The software calculates viscosity from the shear stress versus shear strain relationship (η [Pa * s] = τ [Pa] / [s-1]).
2.3.2. Tests in Oscillatory Shear Flow
New portions of blood were exposed to increasing shear stress amplitudes at constant 1 Hz frequency (1 – 1000 mPa, logarithmic ramp), as well as to increasing frequencies (0.5 – 5 Hz in cows; 0.1 – 10 Hz in pigs; logarithmic ramp) at dynamically (sinusoidally) changing shear stresses with maximal amplitude of 10 mPa. The amplitude sweep tests served to identify the linear viscoelastic range (LVER) and the yield points of the suspensions. The LVER was ≥ 10 mPa at start. Due to the frequency dependence of which is why this amplitude was selected in the frequency sweep tests in both species. From the frequency spectrum, the shear moduli (G´, G´´) at 1 Hz (pig) or 0.8 Hz (cow) were extracted and the loss factor was calculated.
Tests in the oscillating shear field obtain the shear moduli of the samples. The storage (same as elastic, G´) and loss (same as viscous, G´´) moduli were calculated out of the stress-strain-relationship during the sinusoidal change of time and amplitude (G* = τ(ω,A) / (ω,A)), by using the phase shift angle (δ). The phase shift angle identifies the lag phase between the applied shear stress and the resulting shear strain. It decreases the more a material changes from fluidic to elastic; G´ equals G* cosδ; G´´ equals G* sinδ. Both values can be combined in the loss factor (tanδ = G´´/G´). The yield stress was extracted manually from the G´-curve in the amplitude sweep tests by using the method described in [10).
2.4. Data Processing and Statistics
The following software programs were used for data handling, analysis, and illustration: RheoCompass (version 1.22; Anton Paar, Austria), Excel (version 2016; Microsoft, USA), GraphPad Prism (version 6; GraphPad, USA), and NIS-Elements (version D 4. 13.5; Nikon, Japan). For comparative reasons, hematological values and blood viscosity are presented in Figure 2 and Figure 3 as relative changes to baseline, except for HCT due to the high species-specific difference of HCT between cow and pig. Rheological parameters obtained in the dynamic shear field are presented as absolute values. Data are displayed as mean ± SD. The Wilcoxon matched pairs signed rank test was used to analyse if values differ at storage day 30 compared to storage day 0 (α=0.05).
3. Results
3.1. Hemograms and Hemolysis
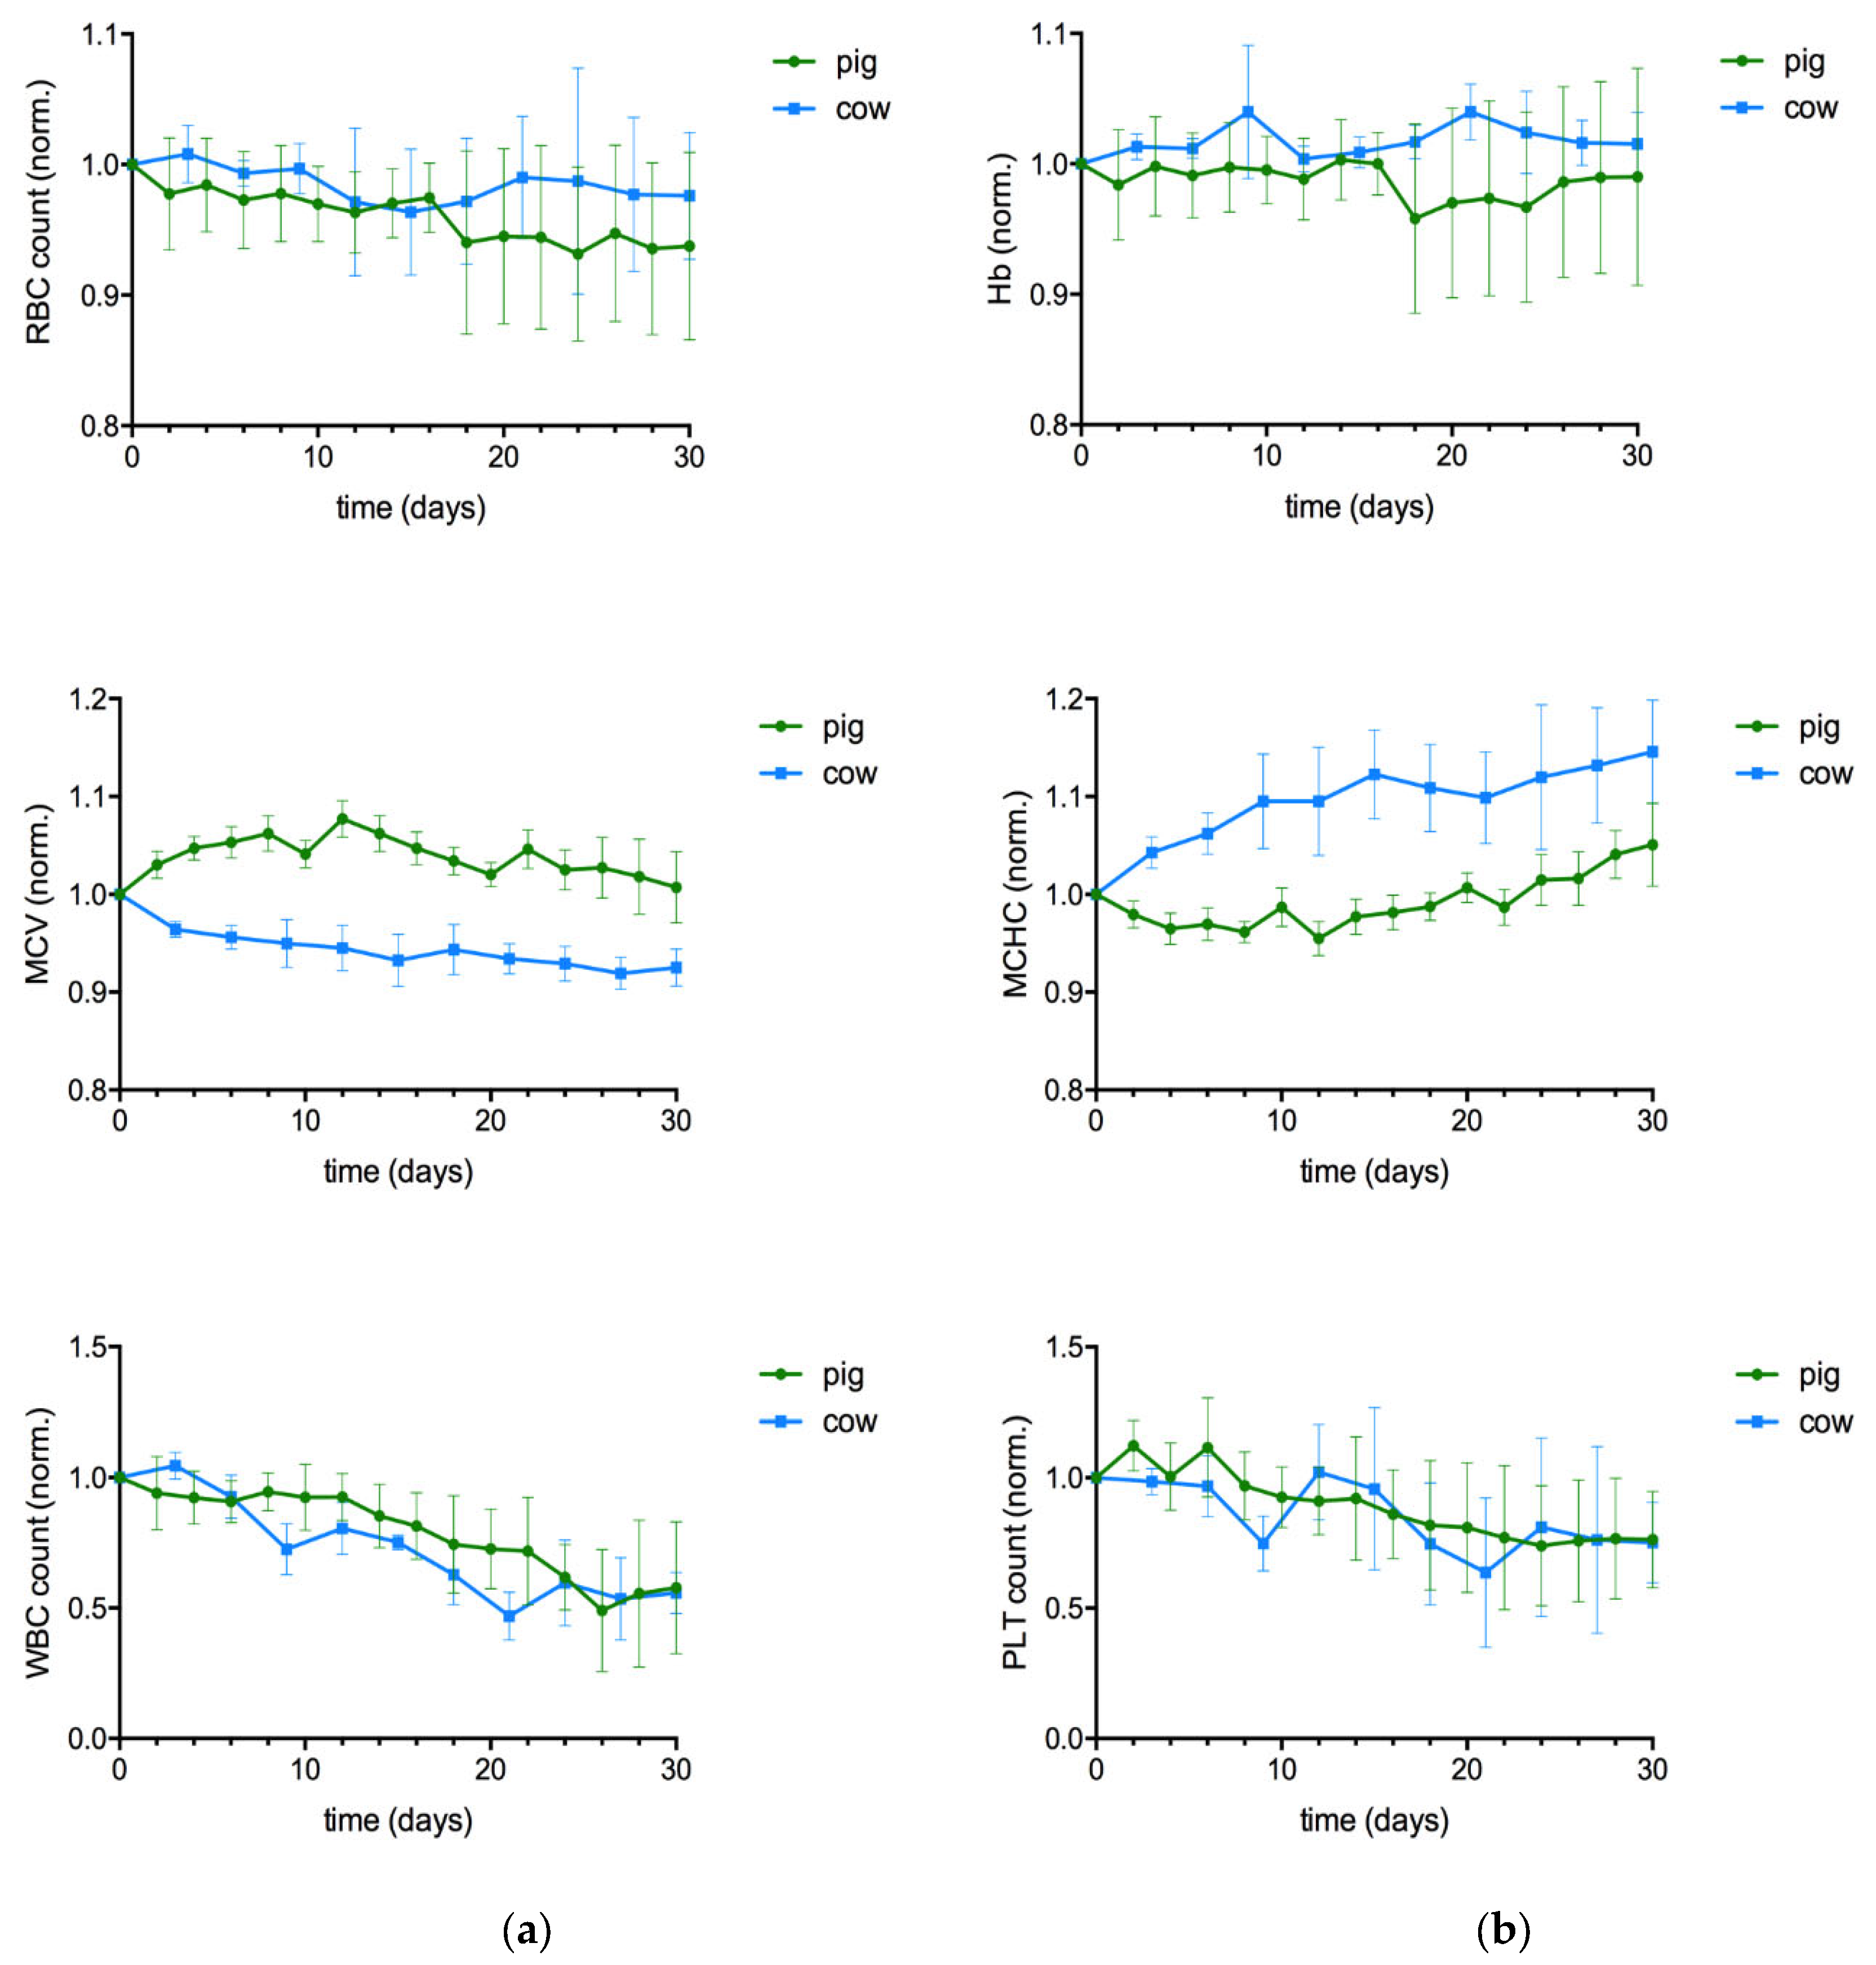
Bovine RBCs remained intact in contrast to porcine RBCs. In the blood smears of aged pig blood, ghosts and debris were found, whereas in cow blood slightly smaller round RBCs were present and there was no debris (Figure 1). In addition, the RBC count was better preserved in cow blood samples than in pig blood samples. WBC counts were species-specifically higher in pig than in cow, but in both species the WBC count decreased by ≈43%. PLT counts decreased by 25% in both blood types (Table 1, changes relative to baseline are presented in Figure 2).
Porcine RBCs swelled during the first 14 days of storage and returned to their initial volume at the end of storage time (n.s.), whereas bovine RBCs shrank continuously without initial swelling. Thus, the bovine RBCs became successively dense with storage time, indicated by the continuous increase of MCHC that reached a maximum of +12% on day 32. In pig blood the MCHC was maintained up to day 22 of storage due to the initial cell swelling but increased thereafter as well (all p<0.05).
Figure 2.
change of the hemograms of porcine (n=11) and bovine (n=6) whole blood samples with storage time. Data present mean ± standard deviation of changes relative to baseline.
Figure 2.
change of the hemograms of porcine (n=11) and bovine (n=6) whole blood samples with storage time. Data present mean ± standard deviation of changes relative to baseline.
Hemolysis occurred in all pig blood samples and became severe from day 22: mean plasma free hemoglobin concentration was of over 200 g dL-1 on day 30. In contrast, the cow plasma did not show signs of hemolysis during the whole storage period, except in one case. In this cow sample, the plasma was severely reddish on day 9. The analyzer did not identify a reduction in RBC count on that day (4.66 vs. 4.54 T/L at start of storage), suggesting that membrane damage had just started. Three days later the RBC count and the HCT were reduced and remained on a lower level throughout. The MCV of the remaining RBCs in this sample was fairly constant until day 18 of storage, when this value decreased as in the other samples.
The combined changes of cell count and cell volume affect the HCT, which has a major influence on the rheology of blood. HCT decreased with storage time in both species (Figure 3d), but with different quantitative and temporal characteristics. The initial RBC swelling prevented the HCT decrease in pig blood during the first two weeks, although the RBC count decreased right from the beginning. A progressive hemolysis started on day 20, which reduced the HCT significantly in the second half of the observation period. In contrast, the HCT decreased right from the beginning in cow blood, as no cell swelling occurred (both species p<0.05). To note, due to the use of native blood and the species-specific difference in HCT, the bovine HCT value was always less than half that of the pig samples. Since the representation of changes relative to the baseline are misleading if the initial values vary strongly, the change of HCT with storage duration is shown in the form of absolute values in Figure 3d.
3.2. Rheology
3.2.1. Tests at Simple Shear Flow (Blood Viscosity)
In both species the high shear rate (1000 s-1) viscosity increased continuously (cow p<0.05; pig p<0.01; Figure 3b), although at same time the HCT decreased.
In both species the low shear rate (10 s-1) viscosity was not different at storage day 30 compared to day 0. However, the timely course of this viscosity value varied between the species. In pig, it showed a relationship to HCT. HCT increased during the first ten days due to RBC swelling and so did low shear viscosity. HCT decreased thereafter due to the RBC decay to values little below the baseline, and low shear viscosity followed this course. The minute decrease in low shear rate viscosity along with the significant increase in high shear rate viscosity resulted in a continuous reduction in shear thinning during storage of pig blood (p<0.001). In contrast, in cow blood no change of shear thinning was present (n.s.; Figure 3c). This is because low shear viscosity mostly varied around the baseline value up to the 24th day of storage. Thereafter, in half of the samples the value increased, whereas the other half of samples - including the haemolytic sample - it decreased, giving rise to a mean value not different from the baseline. The development of low shear rate viscosity in native cow blood did not follow the course of HCT and appeared unpredictable.
3.2.2. Tests at Oscillating Shear Flow (Shear Moduli)
3.2.2.1. Amplitude Sweep Tests
The LVER was ≥ 10 mPa in all pig and cow samples at start of storage. But we had to observe that during storage it became increasingly difficult to discern a truly linear behavior of the samples as the G' curves at low shear deformation plateaued less and less as the samples aged. This means that it was progressively difficult to assess the yield stress value directly from the G´-curve. In many cases it was necessary to apply a quadratic regression to the G´-values and to read the yield stress from the regression curve. Apart from the gradual loss of the quasi-static behavior within the observable shear stress range, there was also an intraindividual variability in the yield stress values in the samples during the time course (see Figure 4c,d). This variability of yield stress values was much higher in cow samples than in pig samples. In cow samples it did not allow to detect a trend towards more solidifying or more fluidifying with the progression of storage (Figure 4a,e). In contrast, the yield stress of pig samples decreased continuously during the time course, albeit with high error bars (Figure 4b). At storage day 30, the yield stress was three times lower than at start (Figure 4f, p<0.01). In addition to the yield stress, we also draw the degree of solid-like property from the amplitude sweep tests. Due to the fact that a true G´-plateau was difficult to detect as ageing proceeded, we pooled the first three G´-values of the test (values between 1-5 mPa shear stress and constant 1 Hz) and calculated the mean value out of it. In cow samples, these mean G´ values were 56 ± 45 mPa on day 3 and 55 ± 37 mPa on day 30 (compare with Figure 4e; n.s.). In pig samples, the mean G´-moduli decreased with storage duration (115 ± 110 at day 0 and 48 ± 35 mPa on day 30; p<0.01), supporting the observation of sample fluidification with storage time (compare with Figure 4f).
3.2.2.2. Frequency Sweep Tests
The difficulty of aging cow samples to remain in a quasi-static state is also reflected in the timely change of the loss factor. This parameter, which combines both shear moduli to one value showed high intraindividual variability (Figure 5c), resulting in no change of mean values during the time course, except once due to the exorbitantly high loss factor value (reflecting high fluidity) of cow E after 24 days of storage (Figure 5e). This is supported by the frequency spectra of cow blood obtained before and after storage (Figure 5a); the curves do not indicate any change in suspension behavior. In contrast, in pig samples the loss factor increased in all samples (Figure 5d) after a lag of 3 weeks. This reduction of sample cohesion after the 20th day of storage (p<0.05) occurred in parallel with the onset of hemolysis. The frequency spectra of pig samples before and after storage thus indicate the material deterioration: G´1 Hz decreased from 69 ± 55 mPa at day 0 to 23 ± 11 mPa at day 30 (p<0.001); G´´1Hz decreased from 91 ±26 mPa at day 0 to 68 ± 17 mPa on day 30 (p<0.05; Figure 5b).
3.2.3. Summary of Similarities and Differences Between Pig and Cow Blood During Ageing
RBCs remained intact in cow samples whereas there was significant hemolysis in pig samples after day 20. WBCs and PLTs decreased with similar percentage in both species. HCT decreased due to RBC shrinking in cow samples and due to RBC decay in pig samples. Blood viscosity at high shear rate increased in both species although HCT decreased. Blood viscosity at low shear rate was unchanged in both species if one compares the values at start and end of storage. In pig samples there was a pronounced reduction of shear-thinning indicating a gradual loss of sample cohesion with time. This conclusion is supported by the three times smaller yield stress and storage modulus at storage day 30 compared to day 0, and by the rise of loss factor in parallel with the degree hemolysis. In cow samples we did not observe changes in shear-thinning, yield stress, storage modulus, and loss factor with storage duration. However, the intraindividual variability of those values that are obtained in the low shear field during the several days of storage was high. The mechanical properties of native cow blood suspensions thus develop unpredictably.
4. Discussion
We showed the preservation of the RBC count and the maintenance of the round shape of cow RBCs compared to pig RBCs together with the associated flow behavior of native whole blood during 30 days of storage at equal conditions: use of CPDA-1 as anticoagulant, refrigeration (4°C) of native samples, mixing samples by gently turning the containers upside down for 10 minutes every 2 or 3 days. The finding that cow RBCs can better maintain their integrity is supported by their longer circulatory lifetime (130-160 days; compared to porcine RBCs (70-100 days [11])).
Storage lesions are well described [12,13]. Briefly, within the first week the intracellular ATP levels fall, and the reactive oxygen species progressively oxidize the cellular structures. Lactate is generated, proteins are carbonylated, and the enzymes lose their function, which aggravates the metabolic emergency. Senescent signals appear on the cell surface, oxidized hemoglobin and membrane proteins aggregate, or form heterologous clusters. Membrane clusters (e.g., band 3 protein, hemoglobin) can be expelled through blebbing, but vesiculation indicates also the final stage of RBC damage and has several inflammatory, immunological and hemostatic consequences [14,15,16]. The presence of spherocytes and echinocytes are thus the result of membrane loss and cytoskeleton re-arrangement. We showed that cow RBCs shrank and became dense, which indicates vesiculation. But the cells remained their round shape and there was no hemolysis present (except in one case). In contrast, all porcine samples became hemolytic. The reason for the preservation of bovine RBC´s integrity is not fully explored, indeed the higher resistance of bovine RBC against eryptotic shape changes at oxidative stress was described also earlier [17]. On whole cell level, bovine RBCs are stiffer, which points to a better stabilization of the healthy membrane; when exposed to a Couette shear field the cells show a by 7% reduced EImax median value compared to porcine RBCs [7]. Details that may contribute to the cell integrity during storage are the stability of cow band 3 oligomers [18] and the weak cohesion between the membrane phospholipids [19], which will stabilize the connection between cytoskeleton and membrane, and balance the membrane area between the transmembrane proteins. But the metabolic situation is not trivial for the cells. A metabolomics study showed that stored cow RBCs accumulated pro-inflammatory prostaglandins faster than horse, dog, and donkey, and displayed the lowest glycolysis rate among these species, together with blockage at the level of fructose-1,6-bisphosphate, resulting in low ATP levels [20]. However, the bovine RBCs utilize still more glucose than porcine RBCs [21]. The low permeability of the porcine RBC membranes to glucose makes other sources like inosine necessary [22,23]. As for the stability of the band 3 complex in stored porcine cells, the abundance of 2,3-BPG [24,25] can stabilize the membrane through quickly available deoxyhemoglobin binding to band 3, but this effect may have very little influence on long-term storage since intracellular 2,3-BPG is typically lost and samples remain O2 deprived. Porcine RBCs lysed in our study, and they often crenate ex-vivo, describing such finding as “pathologically normal deviations” of a healthy blood smear [26]. We found ghosts in the pig blood smears, which we did not find in the cow samples. This indicates that pig RBC membranes tend to be more vulnerable when stored.
Membrane shedding and crenation makes RBCs less deformable, which enhances their flow resistance. As a result, at fast shear flow blood viscosity increases with storage time. This is described for several mammalian species [5,27,28,29]. Viscosity increased although HCT decreases. And yet, the cause of the HCT decrease does not seem to play a role. Shrinkage of RBCs without lysis (observed in cow blood), or lysis with a parallel reduction of RBC count (observed in pig blood) have the same effect. In both circumstances the flow resistance increases, by either the presence of dense and stiff cells, or the clustering of remaining unlysed RBCs with themselves and the surrounding proteins (Figure 6).
To note, a step in the timely increase of high shear viscosity (Figure 3b) can be seen in pig samples after storage day 18 due to the onset of hemolysis around that date. Although high shear flow experiments provide information about the deformability of the components in which the RBCs make the largest contribution, the information about the extent to which a suspension is still homogeneous can be better obtained from low shear flow experiments. In simple shear, the degree of shear thinning gives insight into the correlation between the components of the suspension. A decrease in shear thinning, as in pig blood, is a sign of reduced interaction; cluster formation with subsequent phase separation can be the cause.
In small amplitude oscillating mode, the sample remains largely undisturbed by the flow in its quasi-static state. Fluidification is displayed by a reduction of G´ and yield stress. This occurred in porcine samples due to RBC destruction. In addition to the decrease in deformability as RBCs age, the reduction of the cohesiveness is the corresponding quality feature for the bulk blood sample. Stored porcine blood showed clear signs of ageing on both, cell, and bulk level. In contrast, the change in quality was less pronounced in bovine blood. To note, the yield stress varied intraindividually in the time course (compare with Figure 4c), so that the averaged shear elasticity (G´) and shear thinning values across all samples remained unchanged during storage, but the high errors indicate the uncertainty of this assumption. The reason for this individual variability may be steric factors such as temporal changes in the size and random orientation of components – obviously clusters - in the gap. A further explanation is a more technical one that refers to the interface between sample and test substrate. If the adherence of blood to the metallic fixture changes with ageing (due to altered chemistry and conformation of plasma proteins, and accumulating free hemoglobin), the recorded moments also vary because the shear stress cannot be always transmitted perfectly through the sample [30]. This simulates a change in bulk elasticity where there is none.
5. Conclusions
Cow blood is a good option when it must be stored long term. Pig blood is a good option when it can be consumed within 14 days. A disadvantage of using bovine blood is the low physiological HCT, which will require the adjustment to human standards in many applications. A disadvantage of using pig blood is the risk of RBC lysis. But hemolysis does not occur always. While hemolysis occurred in all porcine samples from the first cohort, in the second cohort only one sample out of three became hemolytic. While the reason for this disparity is unclear, it could be related to factors not assessed in this study - e.g. bacterial sample contamination or release of stress related messenger molecules before or during phlebotomy. In any case, blood collection that is as stress-free as possible is to be welcomed for animal welfare reasons and will certainly improve the quality of the drawn sample. Further chances to maintain the integrity of porcine RBC is the addition of inosine, being the energy source for the RBCs [31]. For both blood types applies that storage containers other than 50 mL syringes may allow a better resuspension of cell clusters in the regular intervals during storage, and using blood bags with low plasticizer release should be preferred [32]. In this study, native samples were used. In clinical practice, the RBCs are washed and stored in SAG-mannitol. But the washing steps also change the interface between cells and medium. RBCs that are suspended in autologous plasma are surrounded by an elastic halo [33], composed of plasma components. This halo protects the cells against damage. It is no more present when the cells are suspended in a buffer medium, therefore the exposure of the denuded membrane can contribute to the release of hemoglobin by the stored red cells [34]. All initial steps undertaken not only during, but also before the blood is going to be stored are crucial for the survival of the RBCs and the maintenance of a good suspension quality.
Author Contributions
U.W.: conceptualization, methodology, formal analysis, investigation, ressources, project administration, writing (original draft). A.S.: investigation, methodology, data curation, visualisation, writing (editing and review). All authors have read and agreed to the published version of the manuscript.
Funding
This research did not receive any specific grant from funding agencies in the public, commercial, or not-for-profit sectors.
Data Availability Statement
Data can be obtained from the corresponding author.
Acknowledgments
we acknowledge blood withdrawal by Dr. Lukas Schwarz (pig) and Johannes Huber (cow).
Conflicts of Interest
The authors declare there are no conflicts of interest.
References
- Berndt M, Buttenberg M, Graw JA. Large Animal Models for Simulating Physiology of Transfusion of Red Cell Concentrates—A Scoping Review of The Literature. Vol. 58, Medicina (Lithuania). MDPI; 2022.
- Watts S, Nordmann G, Brohi K, Midwinter M, Woolley T, Gwyther R, et al. Evaluation of prehospital blood products to attenuate acute coagulopathy of trauma in a model of severe injury and shock in anesthetized pigs. Shock. 2015 Aug 1;44:138–48.
- Gourlay T, Simpson C, Robertson CA. Development of a portable blood salvage and autotransfusion technology to enhance survivability of personnel requiring major medical interventions in austere or military environments. J R Army Med Corps. 2018 ;164(2):96–102. 1 May.
- Baskurt OK, Farley RA, Meiselman HJ. Erythrocyte aggregation tendency and cellular properties in horse, human, and rat: A comparative study. Am J Physiol Heart Circ Physiol. 1997;273(6 42-6).
- Sparer A, Serp B, Schwarz L, Windberger U. Storability of porcine blood in forensics: How far should we go? Forensic Sci Int. 2020;311:110268.
- Windberger U, Sparer A, Huber J, Windberger U, Sparer A, Huber J. Cow blood - a superior storage option in forensics? 2022.
- Windberger, U. Blood suspensions in animals. In: Dynamics of Blood Cell Suspensions in Microflows [Internet]. CRC Press; 2019. p. 371–419. [CrossRef]
- Ecker P, Sparer A, Lukitsch B, Elenkov M, Seltenhammer M, Crevenna R, et al. Animal blood in translational research: How to adjust animal blood viscosity to the human standard. Physiol Rep. 2021;9(10):1–10.
- Cooper DKC, Hara H, Yazer M. Genetically Engineered Pigs as a Source for Clinical Red Blood Cell Transfusion. Clin Lab Med. 2010 Jun;30(2):365–80.
- Windberger, U; Sparer, A; Elsayad K. The role of plasma for the yield stress of blood. Clin Hemorheol Microcirc. 2023;1–15.
- Bush JA, Berlin NI, Jensen WN, Brill AB, Cartwright GE, Wintrobe MM. Erythrocyte life span in growing swine as determined by glycine-2-C14. J Exp Med. 1955 ;101(5):451–9. 1 May.
- Blasi B, D’Alessandro A, Ramundo N, Zolla L. Red blood cell storage and cell morphology. Transfusion Medicine. 2012;22(2):90–6.
- Flatt, F. JF, Bawazir M. WM, Bruce LJ. The involvement of cation leaks in the storage lesion of red blood cells. Vol. 5 JUN, Frontiers in Physiology. Frontiers Research Foundation; 2014.
- Leal JKF, Adjobo-Hermans MJW, Bosman GJCGM. Red blood cell homeostasis: Mechanisms and effects of microvesicle generation in health and disease. Vol. 9, Frontiers in Physiology. Frontiers Media S.A.; 2018.
- Buttari B, Profumo E, Riganò R. Crosstalk between Red Blood Cells and the Immune System and Its Impact on Atherosclerosis. Biomed Res Int. 2015;2015:1–8.
- Rubin O, Canellini G, Delobel J, Lion N, Tissot JD. Red Blood Cell Microparticles: Clinical Relevance. Transfusion Medicine and Hemotherapy. 2012;39(5):342–7.
- Kennedy B, Mirza S, Mandiangu T, Bissinger R, Stotesbury TE, Jones-Taggart H, et al. Examination of Bovine Red Blood Cell Death in Vitro in Response to Pathophysiologic Proapoptotic Stimuli. Frontiers in Bioscience-Landmark. 2023 Dec 6;28(12):331.
- Nakashima, H; Nakagawa, Y; Makino S. Detection of the associated state of membrane proteins by polyacrylamide gradient gel electrophoresis with non-denaturing detergents Application to band 3 protein from erythrocyte membranes. BBA - Biomembranes. 1981;643(3):509–18.
- Burger SP, Fujii T, Hanahan DJ. Stability of the Bovine Erythrocyte Membrane. Release of Enzymes and Lipid Components. Biochemistry. 1968;7(10):3682–700.
- Miglio A, Maslanka M, Di Tommaso M, Rocconi F, Nemkov T, Buehler PW, et al. ZOOMICS : comparative metabolomics of red blood cells from dogs, cows, horses and donkeys during refrigerated storage for up to 42 days. Blood Transfusion. 2023 Jul 1;21(4):314–26.
- Magnani M, Piatti E, Dachà M, Fornaini G. Comparative studies of glucose metabolism on mammals’ red blood cells. Comparative Biochemistry and Physiology Part B: Comparative Biochemistry. 1980 Jan;67(1):139–42.
- Hyun Dju Kim, McManus TJ. Studies on the energy metabolism of pig red cells. Biochimica et Biophysica Acta (BBA) - General Subjects. 1971 Jan;230(1):1–11.
- Young J, Paterson A, Henderson J. Nucleoside transport and metabolism in erythrocytes from the Yucatan miniature pig. Evidence that inosine functions as an in vivo energy substrate. Biochimica et Biophysica Acta (BBA) - General Subjects. 1985 Oct 17;842(2–3):214–24.
- Condo SG, Corda M, Sanna MT, Pellegrini MG, Ruitz MP, Castagnola M, et al. Molecular basis of low-temperature sensitivity in pig hemoglobins. Eur J Biochem. 1992;209(2):773–6.
- Tellone E, Russo A, Giardina B, Galtieri A, Ficarra S. Metabolic Effects of Endogenous and Exogenous Heterotropic Hemoglobin Modulators on Anion Transport: The Case of Pig Erythrocytes. OAlib. 2015;02(10):1–11.
- Fink, KD. Microfluidic Analysis of Vertebrate Red Blood Cell Characteristics. [Berkeley]: University of California; 2016.
- Orr A, Gualdieri R, Cossette ML, Shafer ABA, Stotesbury T. Whole bovine blood use in forensic research: Sample preparation and storage considerations. Science and Justice. 2021;61(3):214–20.
- Li G, He H, Yan H, Zhao Q, Yin D. Does carbonyl stress cause increased blood viscosity during storage? Clin Hemorheol Microcirc. 2010;44(2):145–54.
- Windberger U, Sparer A, Huber J. Cow Blood - A Superior Storage Option in Forensics? Heliyon. 2023;9:e14296.
- Noirez, L. Probing Submillimeter Dynamics to Access Static Shear Elasticity from Polymer Melts to Molecular Fluids. In: Palsule S, editor. Polymers and Polymeric Composites: A Reference Series. Springer, Germany; 2020. p. 1–23.
- Sartorelli P, Paltrinieri S, Agnes F, Baglioni T. Role of inosine in prevention of methaemoglobinaemia in the pig: In vitro studies. Journal of Veterinary Medicine Series A: Physiology Pathology Clinical Medicine. 1996;43(8):489–93.
- Larsson L, Sandgren P, Ohlsson S, Derving J, Friis-Christensen T, Daggert F, et al. Non-phthalate plasticizer DEHT preserves adequate blood component quality during storage in PVC blood bags. Vox Sang. 2021 Jan 1;116(1):60–70.
- Baier D, Müller T, Mohr T, Windberger U. Red Blood Cell Stiffness and Adhesion Are Species-Specific Properties Strongly Affected by Temperature and Medium Changes in Single Cell Force Spectroscopy. Molecules [Internet]. 2021;26:2771. [CrossRef]
- Woźniak MJ, Qureshi S, Sullo N, Dott W, Cardigan R, Wiltshire M, et al. A Comparison of Red Cell Rejuvenation versus Mechanical Washing for the Prevention of Transfusion-Associated Organ Injury in Swine. Anesthesiology. 2018 Feb 1;128(2):375–85.
Figure 1.
Blood smears of porcine and bovine blood samples at the beginning and the end of storage. After 30 days of storage shows pig 1: ghosts and debris; pig 2: crenated cells; pig 3: ghosts. After 30 days of storage shows cow 1 and 3: regular round shapes; cow 2: crenated cells. Error bar: 20 μm.
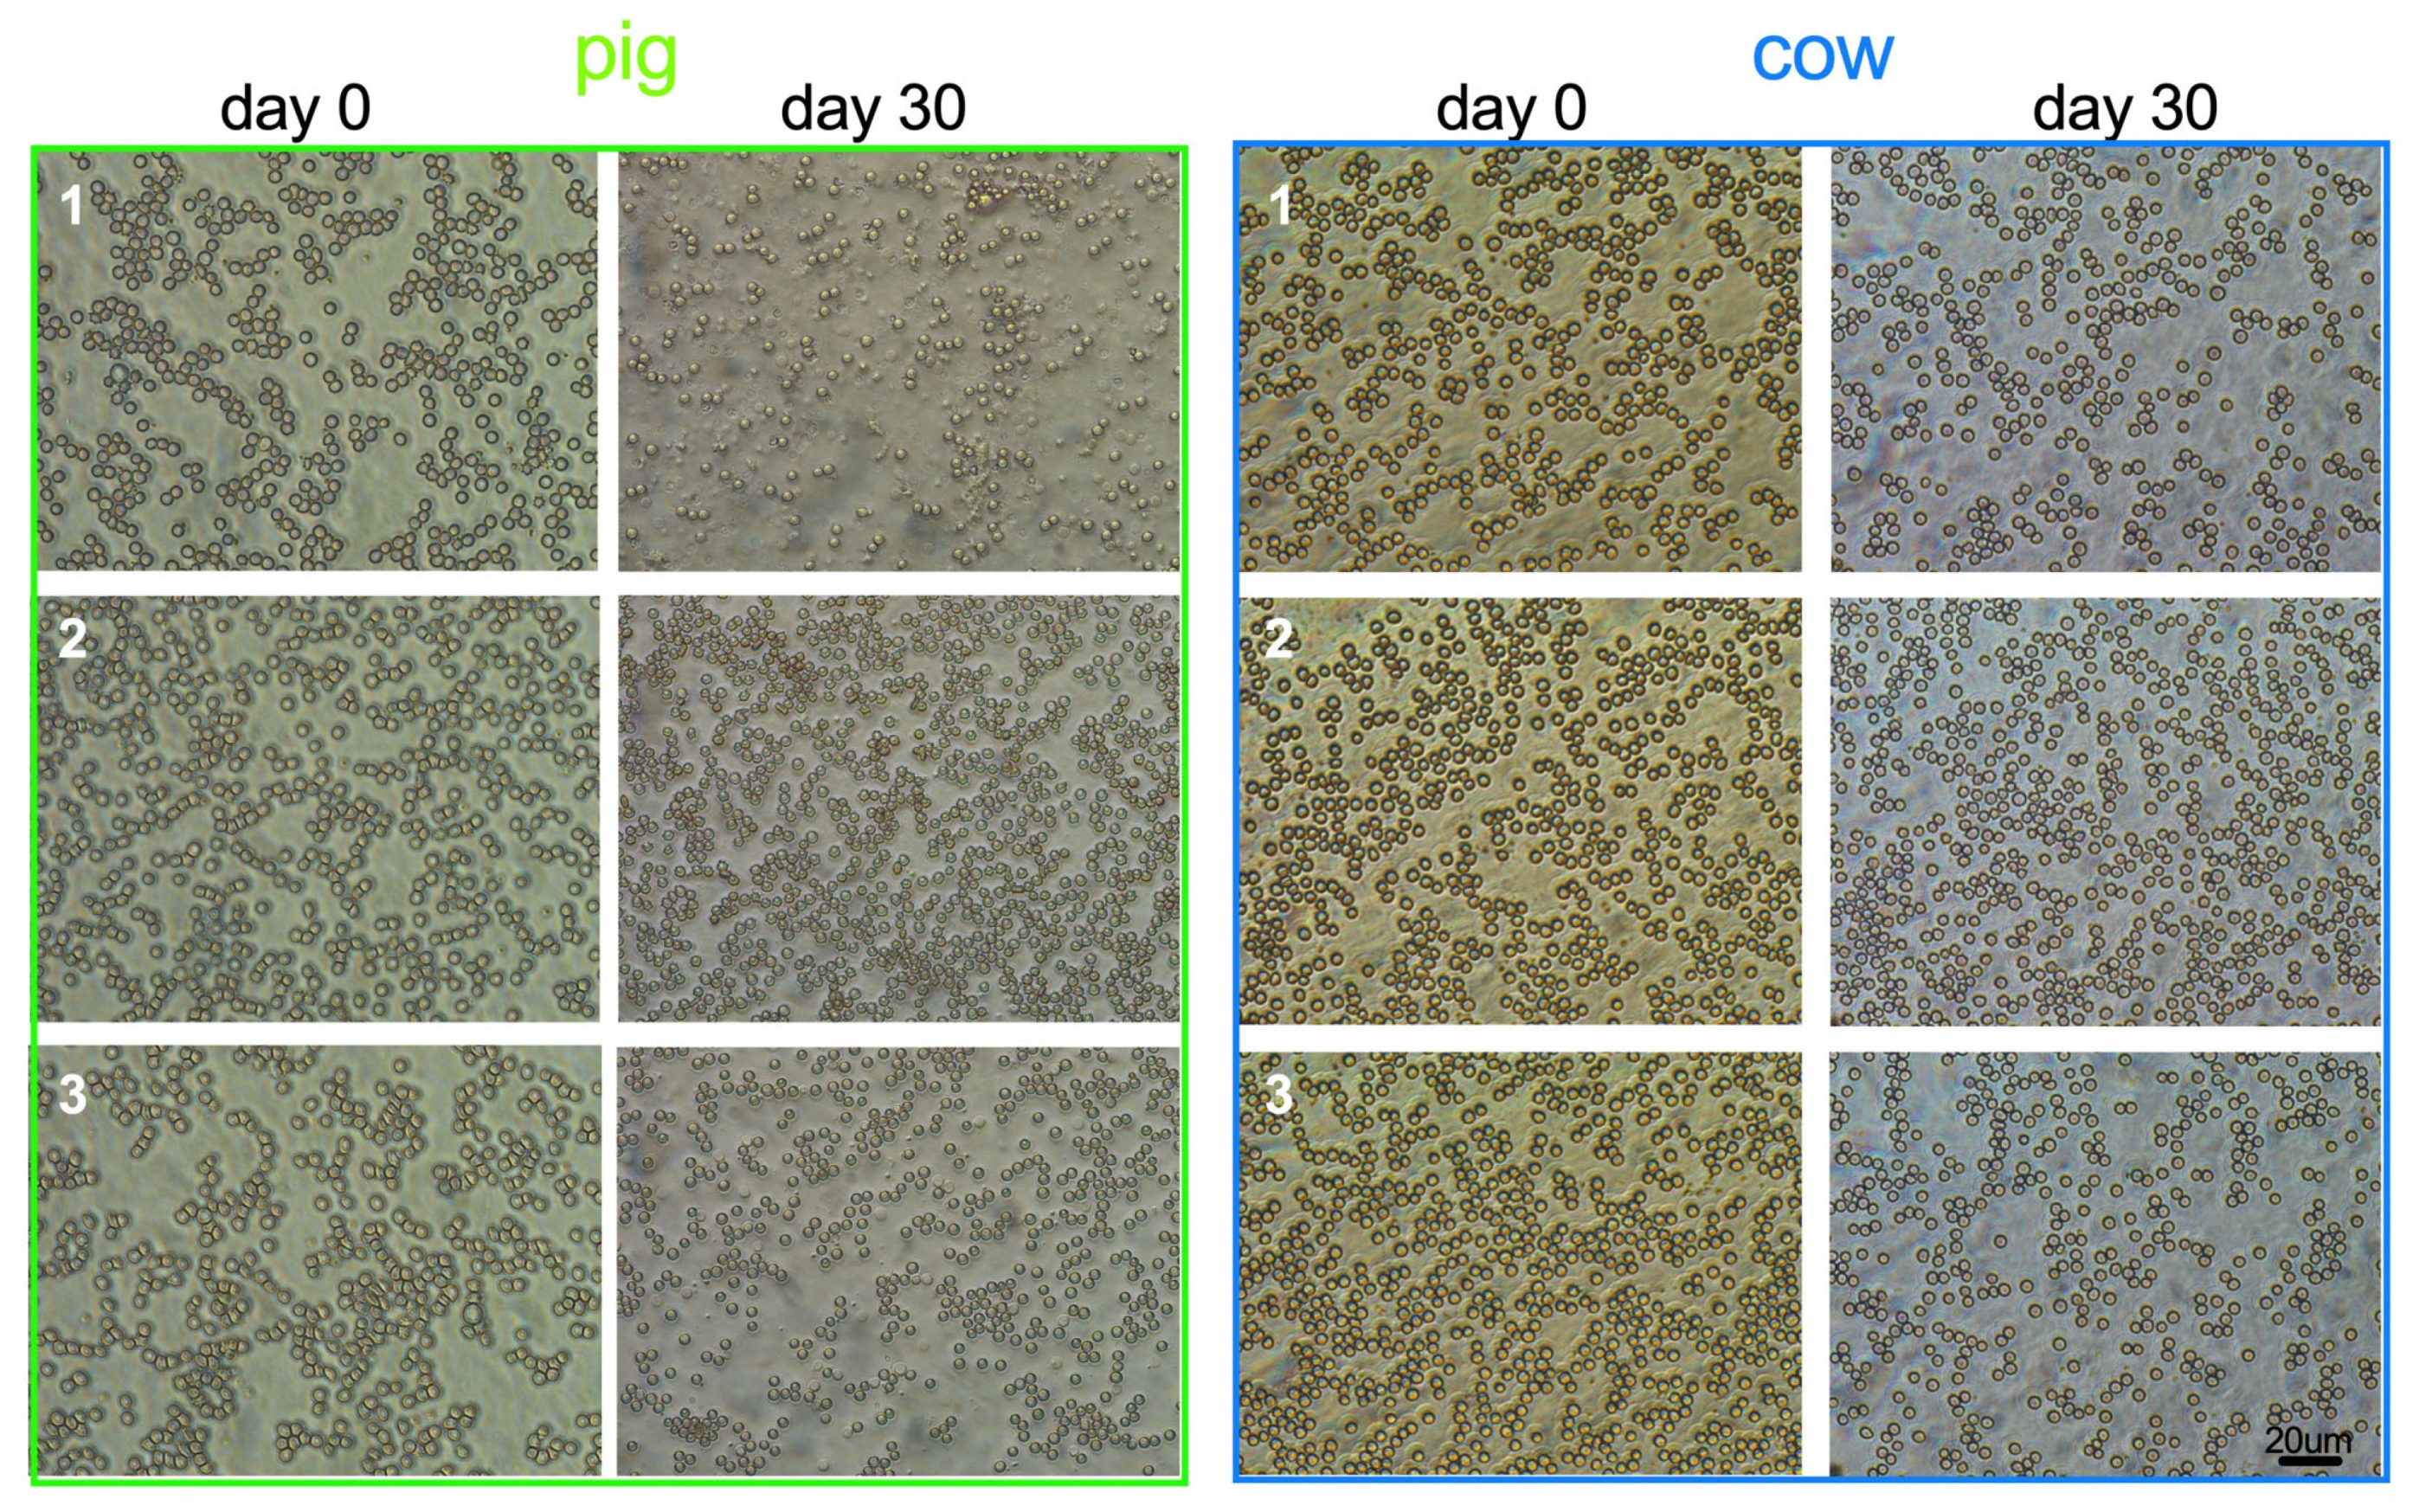
Figure 3.
change of the rheological behavior and HCT of porcine (n=11) and bovine (n=6) whole blood samples with storage time. Rheological data present mean ± standard deviation of changes relative to baseline. Due to the species-specific difference, the HCT is displayed as absolute values.
Figure 3.
change of the rheological behavior and HCT of porcine (n=11) and bovine (n=6) whole blood samples with storage time. Rheological data present mean ± standard deviation of changes relative to baseline. Due to the species-specific difference, the HCT is displayed as absolute values.
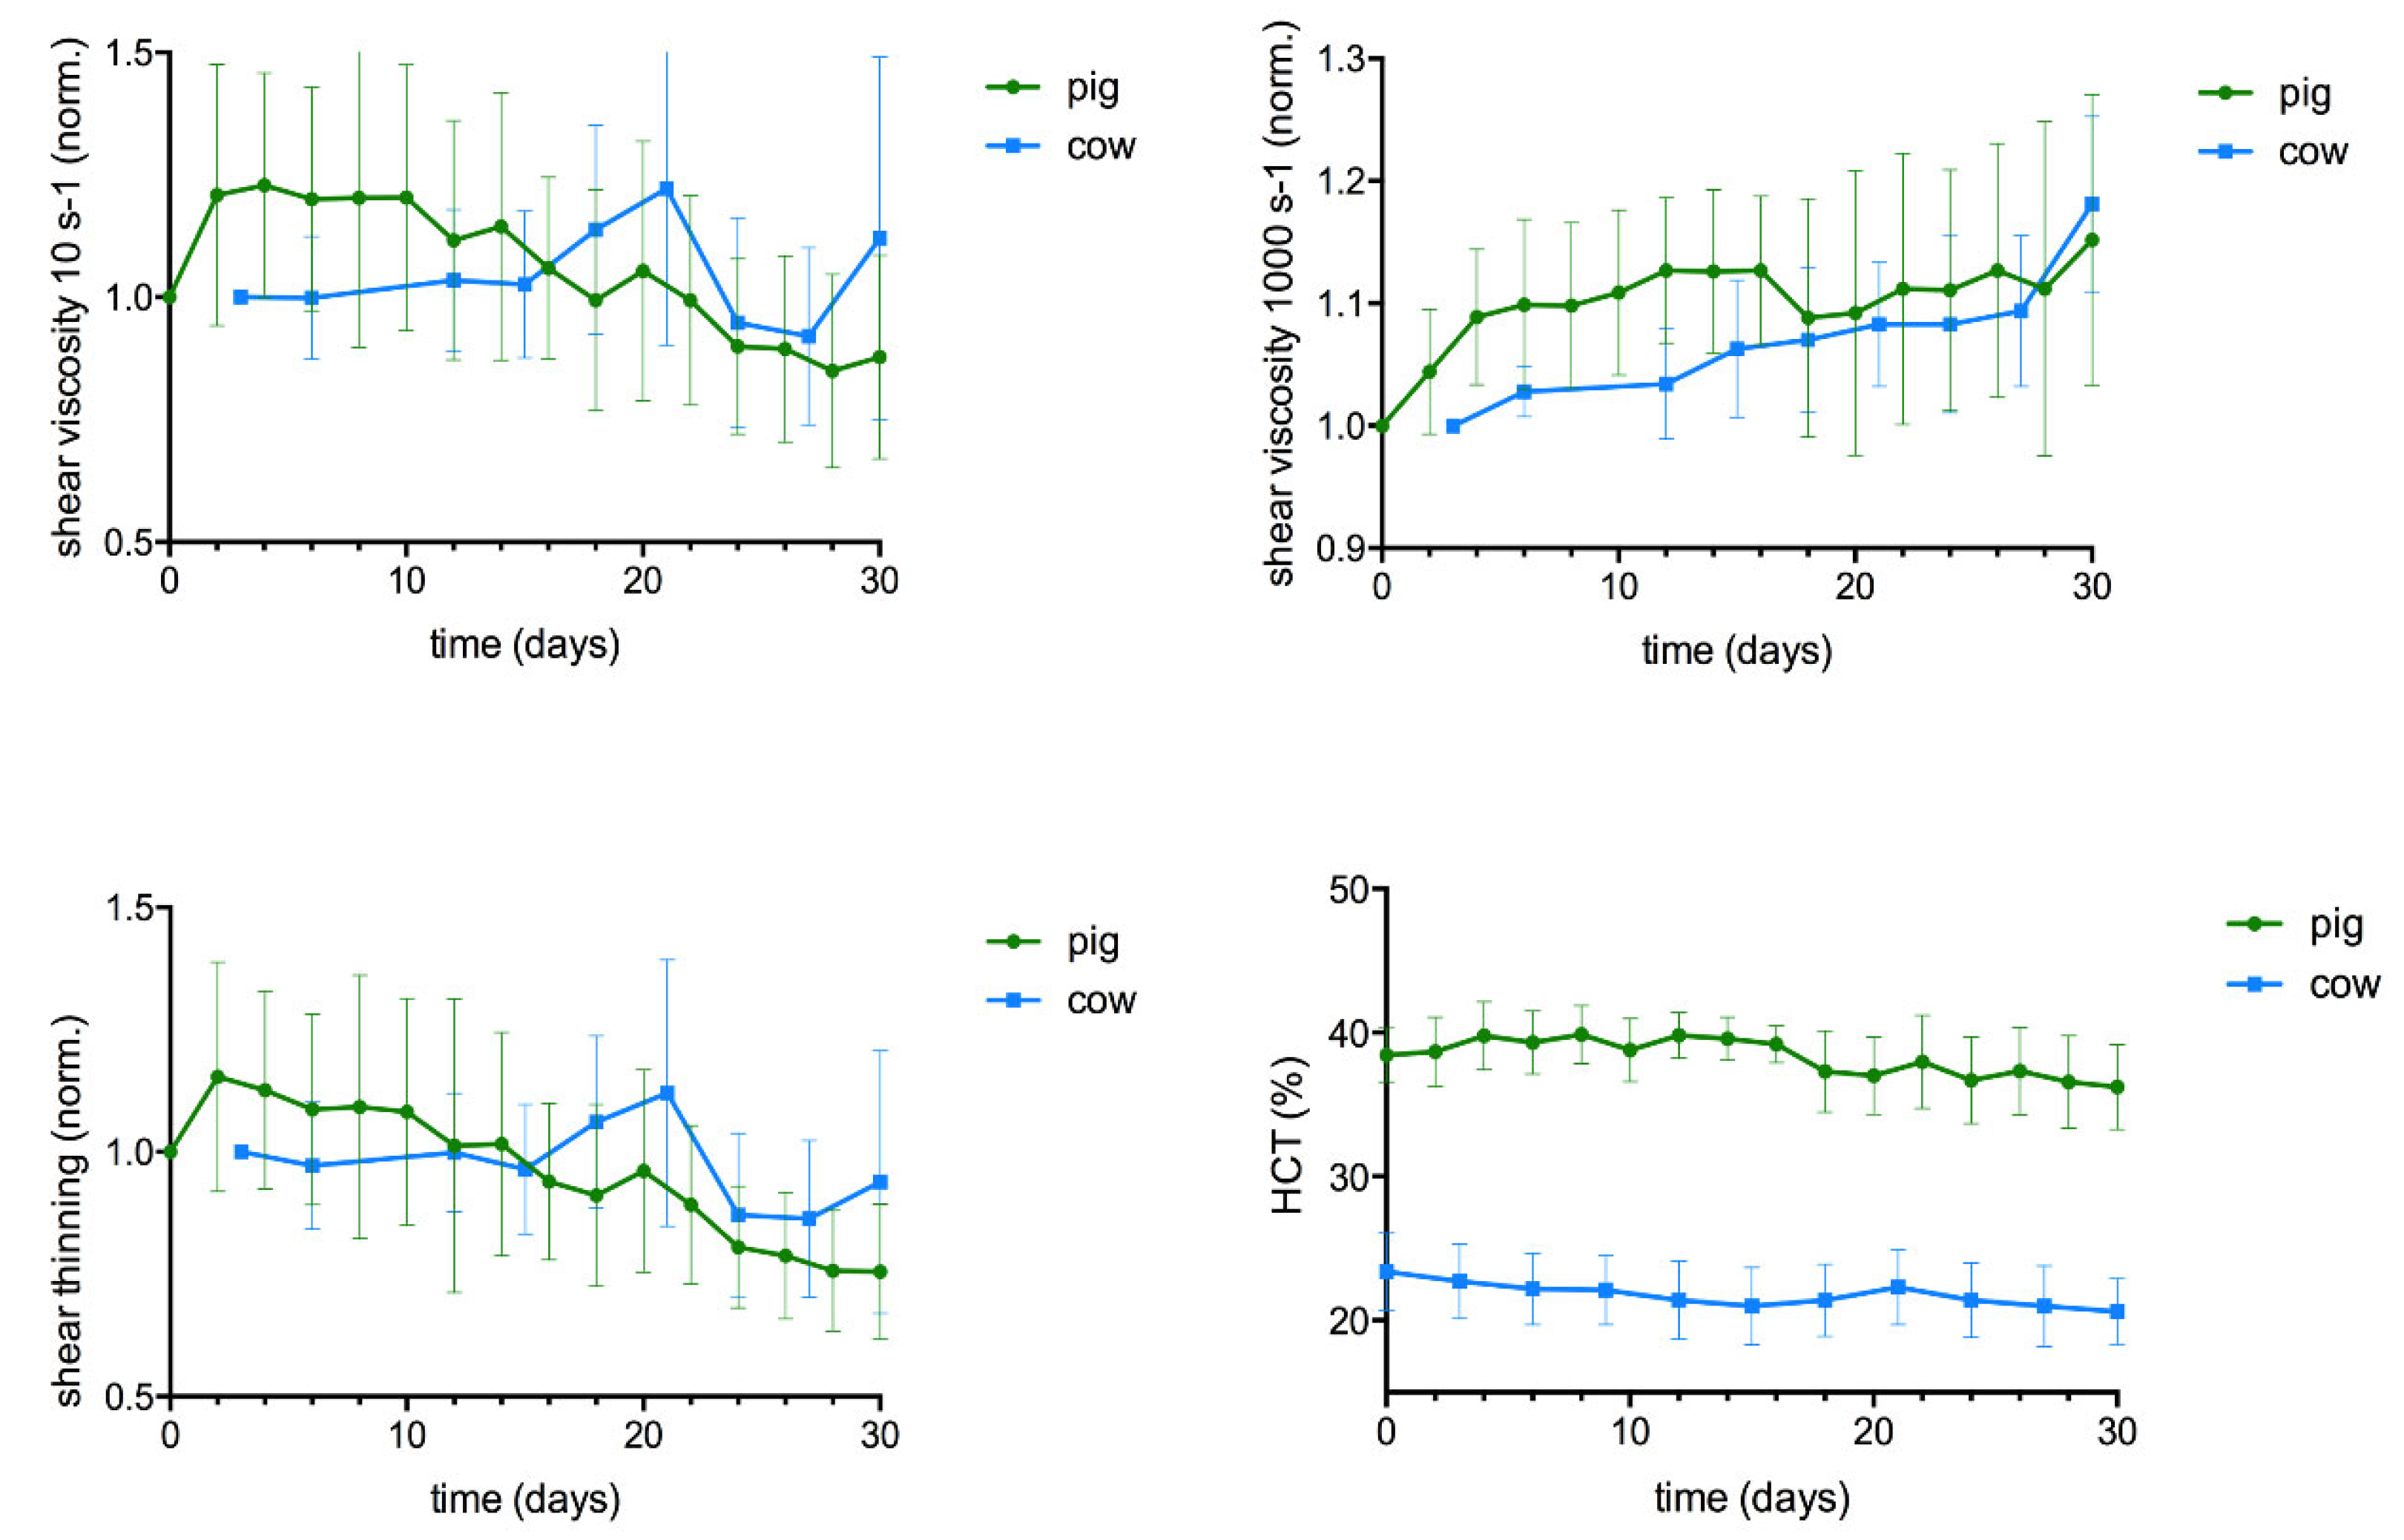
Figure 4.
yield points of bovine (n=6) and porcine (n=11) whole blood obtained by amplitude sweep tests. (a), (b): change of yield point with storage duration; the boxes represent median and interquartile distance, asterisks show the mean value. (c), (d): intraindividual variability of yield points during the time course; (e), (f): yield point of fresh blood and aged blood on the 30th storage day: a quadratic regression curve interpolates the G´-values. The yield stress is obtained from the crossing point of the tangent that was drawn on the inflection point of this regression curve and crossed with a horizontal line through the first G′-values, that was extrapolated to the x-axis (method described in [10]).
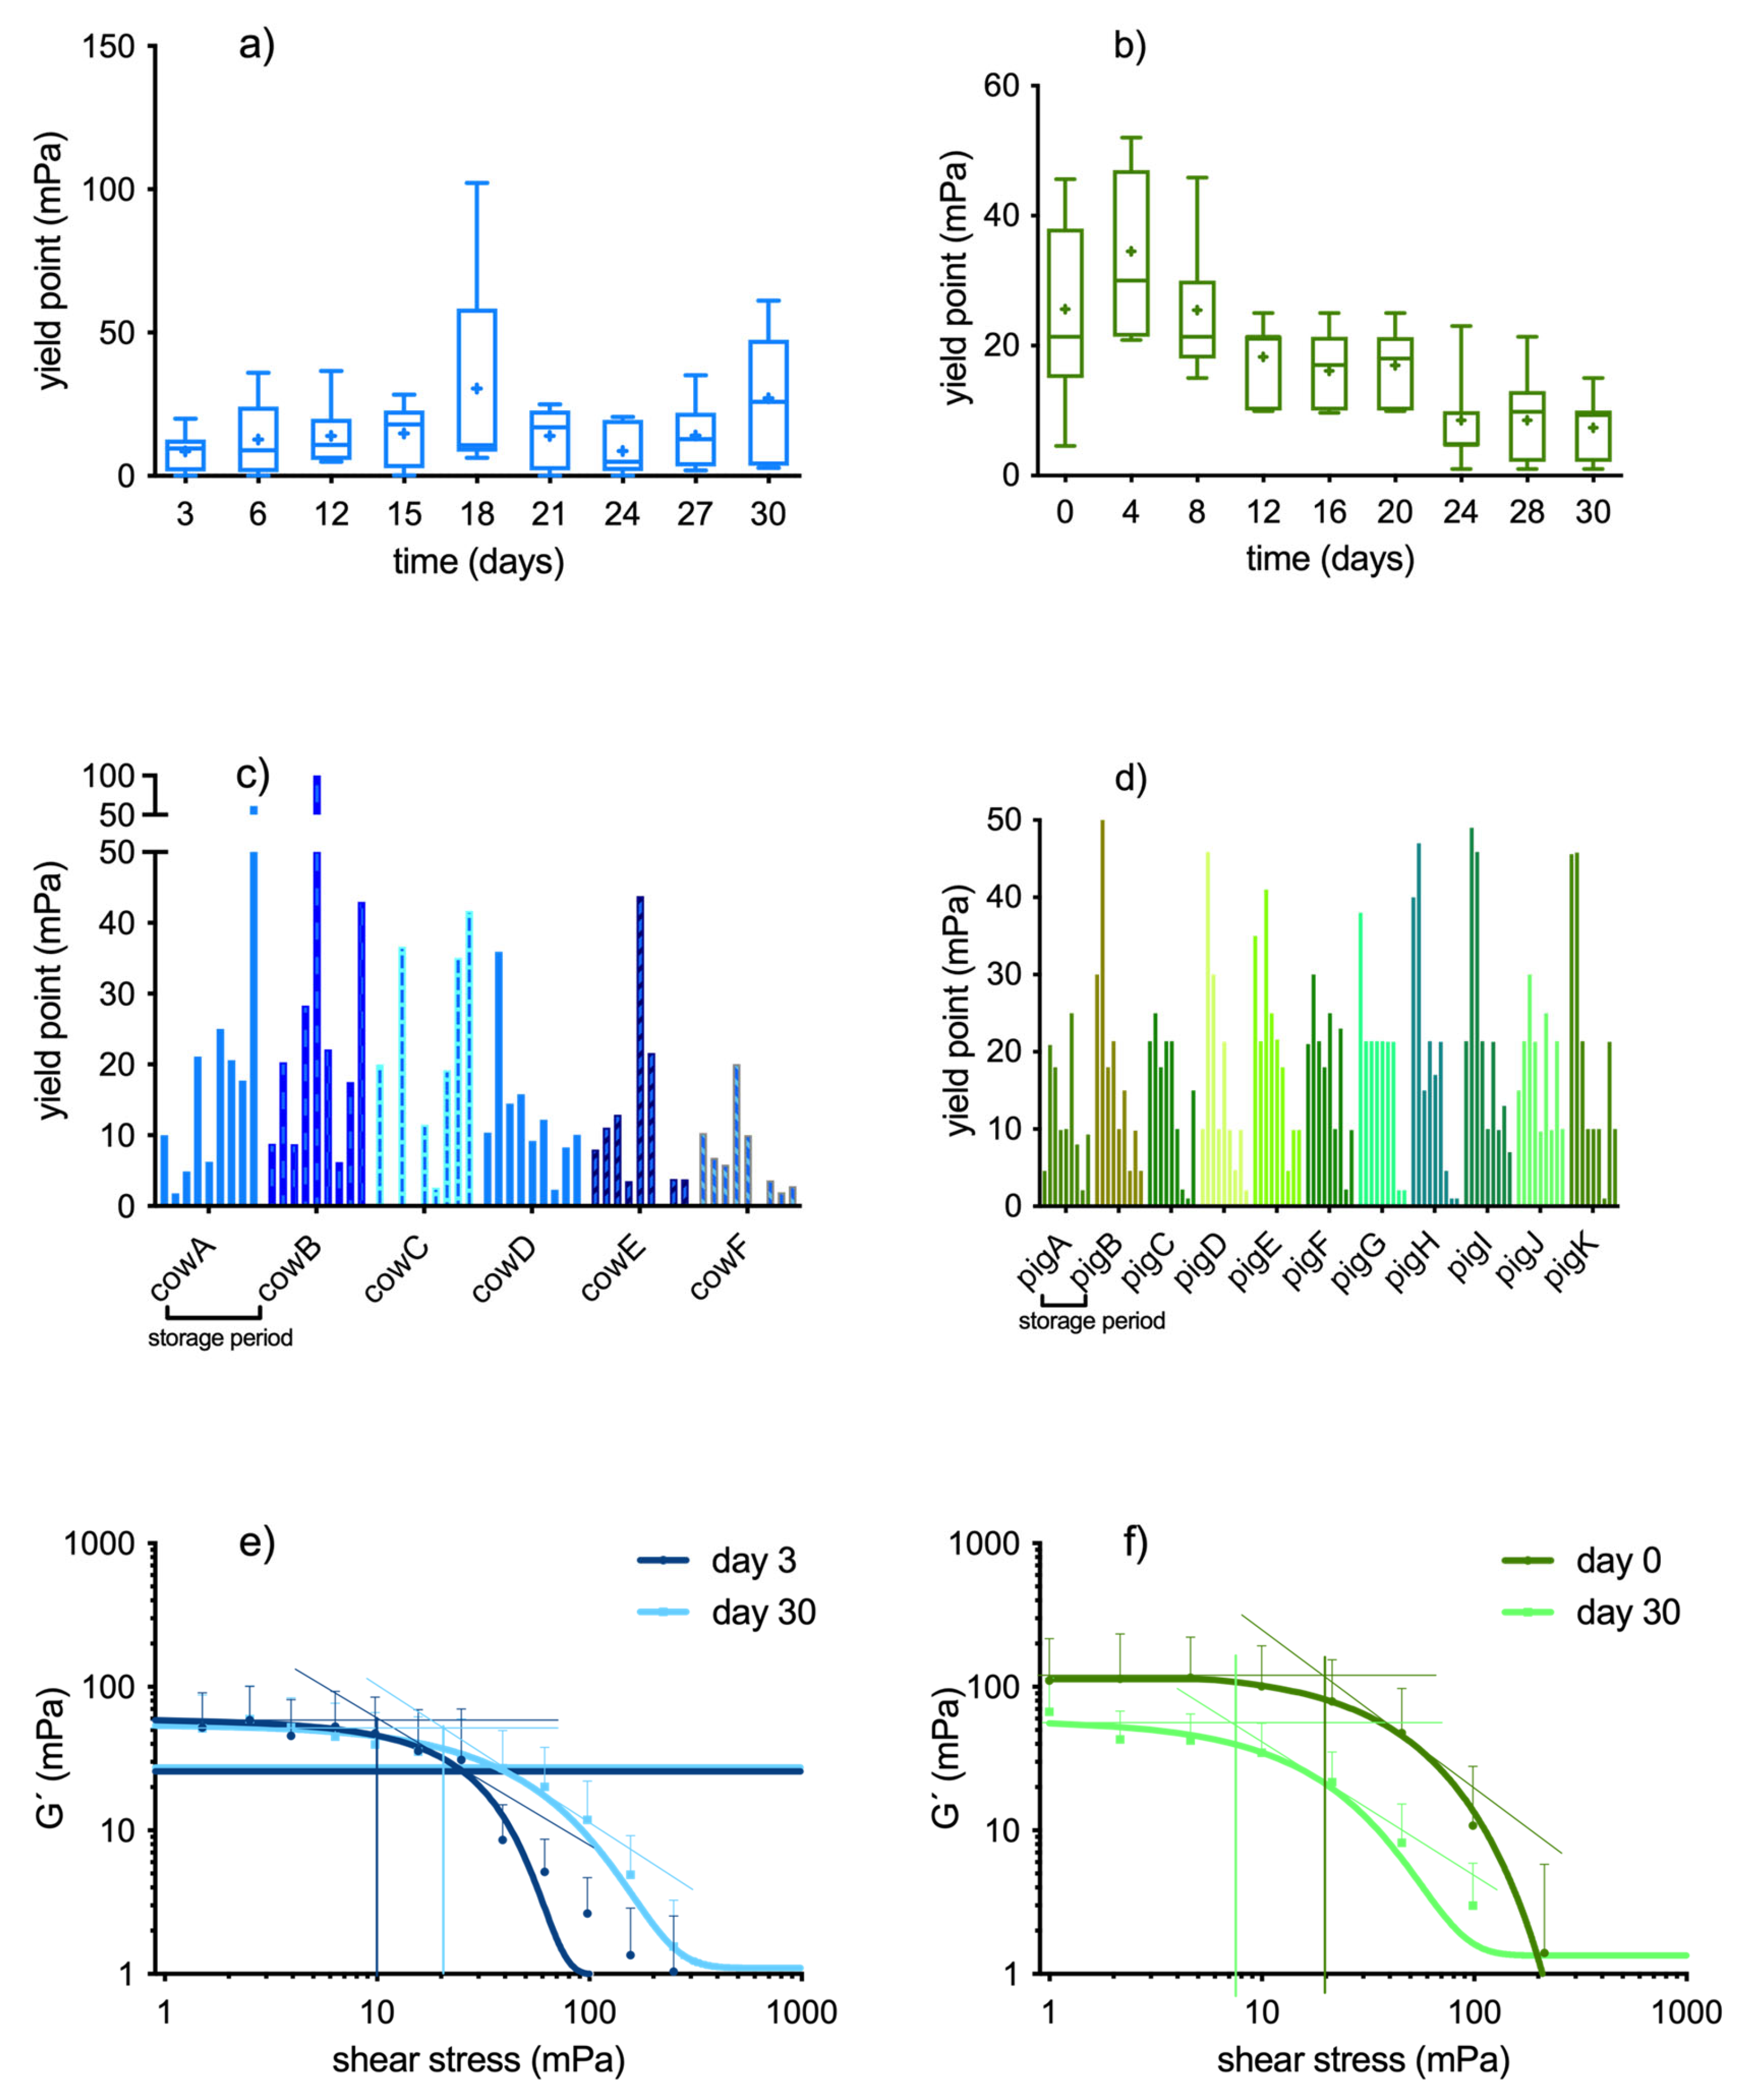
Figure 5.
(a), (b): frequency spectrum of G´ and G´´ of cow (n=6) and pig (n=11) whole blood at start and end of storage. Pig blood fluidified, as indicated be the decrease of G´, whereas the shear moduli of bovine blood are hardly altered. (c), (d): intraindividual variability of loss factor (G´´/G´ at 0.8 Hz) during the time course. (e), (f): change of loss factor with storage duration: loss factor values vary more in bovine samples but do not change with storage time (except one outlier at +24 days, cow E). In porcine samples, loss factor values increase beyond day 22 due to hemolysis. Boxes represent median and interquartile distance, asterisks show the mean value.
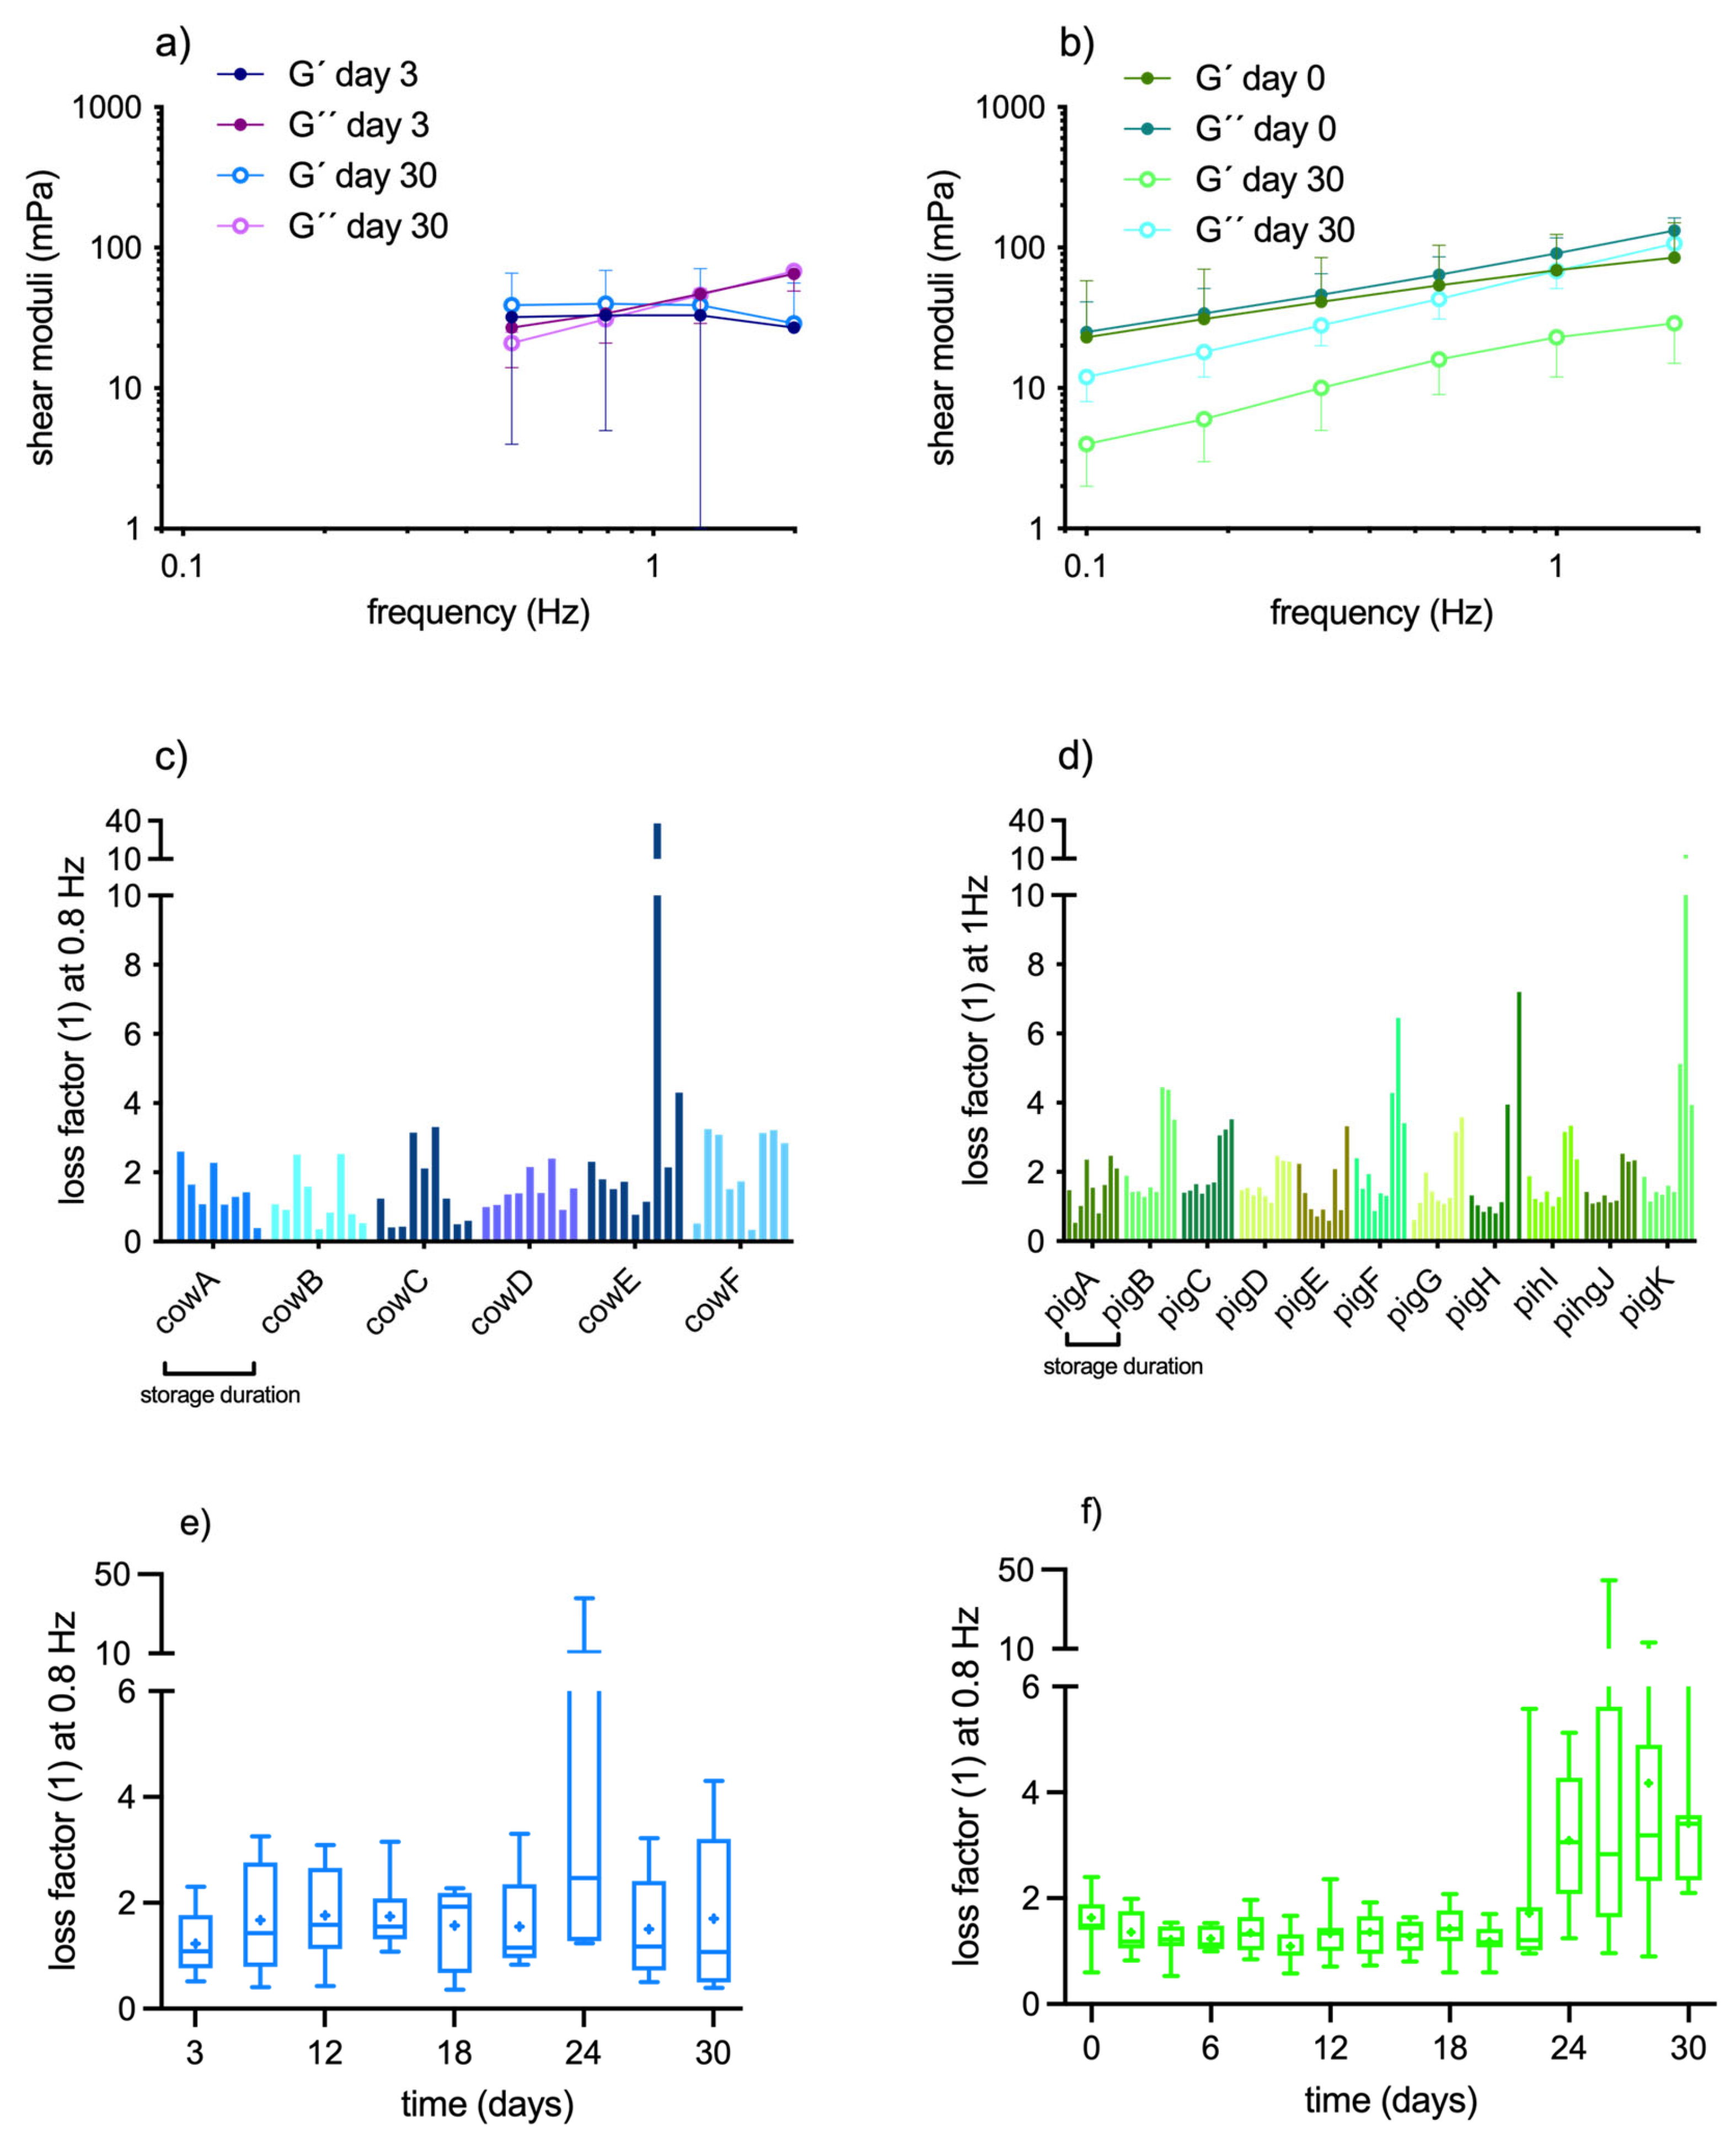
Figure 6.
blood smear from pig 1 (a different window from this smear is also shown in Figure 1) showing the clusters of cell debris and cell-free hemoglobin.
Figure 6.
blood smear from pig 1 (a different window from this smear is also shown in Figure 1) showing the clusters of cell debris and cell-free hemoglobin.
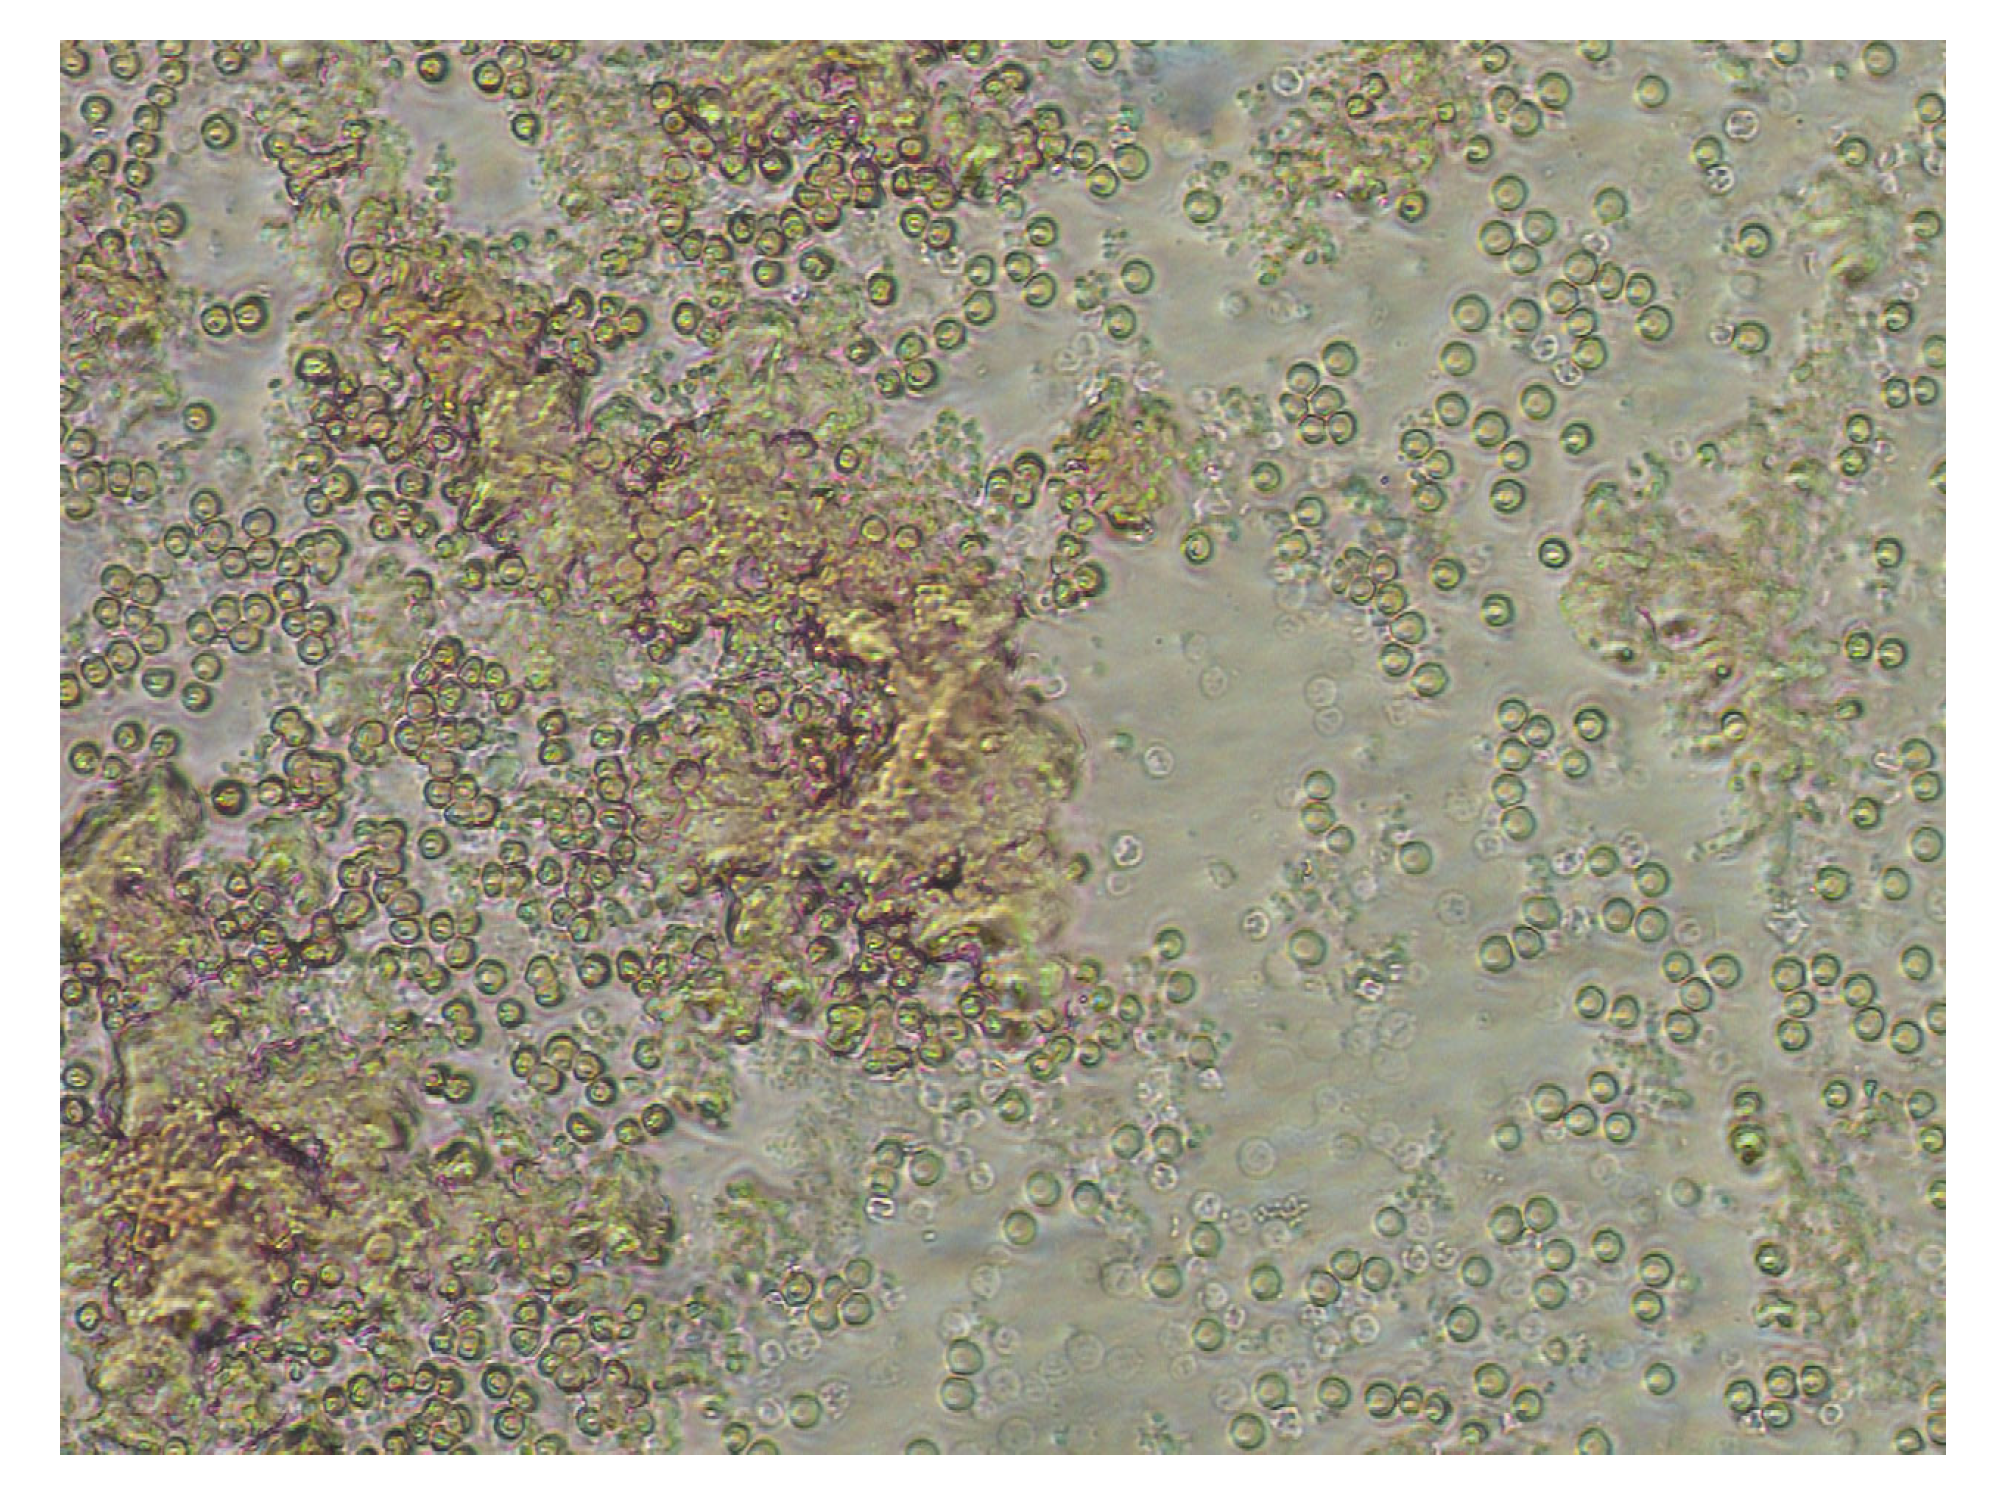

Table 1.
cell counts in bovine and porcine samples at start and end of refrigerated storage. Asterisks mark the significance level (* p = 0.05; ** p = 0.01).
Table 1.
cell counts in bovine and porcine samples at start and end of refrigerated storage. Asterisks mark the significance level (* p = 0.05; ** p = 0.01).
| Day 0 cow | Day 30 cow | cow | Day 0 pig |
Day 30 pig | pig | |
|---|---|---|---|---|---|---|
| RBC count (T/L) | 4.96 ± 0.7 | 4.75 ± 0.7 | -4.2% | 7.33 ± 0.4 | 6.86 ± 0.4** | -6.4% |
| WBC count (G/L) | 6.01 ± 1.1 | 3.4 ± 1.0* | -43% | 15.5 ± 3.3 | 8.3 ± 3.9** | -44% |
| PLT count (G/L) | 266 ± 77 | 198 ± 67 | -25% | 262 ± 43 | 200 ± 63** | -25% |
Disclaimer/Publisher’s Note: The statements, opinions and data contained in all publications are solely those of the individual author(s) and contributor(s) and not of MDPI and/or the editor(s). MDPI and/or the editor(s) disclaim responsibility for any injury to people or property resulting from any ideas, methods, instructions or products referred to in the content. |
© 2024 by the authors. Licensee MDPI, Basel, Switzerland. This article is an open access article distributed under the terms and conditions of the Creative Commons Attribution (CC BY) license (http://creativecommons.org/licenses/by/4.0/).
Copyright: This open access article is published under a Creative Commons CC BY 4.0 license, which permit the free download, distribution, and reuse, provided that the author and preprint are cited in any reuse.


