
Submitted:
07 December 2024
Posted:
09 December 2024
You are already at the latest version
Abstract
We have examined the temperature dependence of the viscosity of lead and boron containing binary oxide glasses in the context of transition from the liquid to the vitreous state, including analysis of kinetic criterion of glass transition. Both the temperature interval determining the glass transition and the structural relaxation time were found near the glass transition temperature of PbO-SiO2, PbO-GeO2, B2O3-Bi2O3, B2O3-Li2O, B2O3-BaO, B2O3-Na2O3 glasses based on Williams-Landel-Ferry equation.
Keywords:
viscosity
; glass transition criterion
; liquid-glass transition
; Williams-Landel-Ferry equation
; glass transition
1. Introduction
The glass transition being a universal feature of amorphous state of matter is analyzed with novel insides aiming to reveal its nature. Transformation of a liquid on cooling into a glass (i.e. vitrification) can take place at melt cooling rates rapid enough that crystallization is kinetically avoided. Glass transition phenomena are observed universally, and any liquid can be in practice vitrified provided that the rate of cooling is suitable selected so that crystallization is avoided kinetically. Experimentally the glass transition is usually observed as a second order-like phase transformation when the material volume and entropy are continuous functions of temperature exhibiting kinks at glass transition, and have discontinuities observed for their derivatives. Namely these characteristics are used in practice to detect where transformation occurs with “calorimetric glass transition” typically used as a standard term, see Chapter 3.2 of Ref. [1]. Understanding the nature of glass transition is, however, difficult due to almost undetectable changes in the structure of amorphous materials using conventional techniques despite the qualitative changes in characteristics such as embrittlement and extremely large change in the time scale of relaxation processes [2]. As for the second-order thermodynamic transition which occurs at the calorimetric glass transition temperature its nature is related to the structural changes in the bonding system of materials and effectively unveiled by the mathematical set theory which assigns a Hausdorff-Besicovitch dimensionality D of bonding system equal to 3 alike for crystals and a fractal one equal to 2.5 in the molten state, see e.g. Table 3 of Ref. [3], and Refs. [4,5] for details. The Kantor-Webman theorem which states that “the rigidity threshold of an elastic percolating network is identical to the percolation threshold” is then providing explanation of ductile to brittle transition which is a feature of the calorimetric glass transition [6]. The concept of dimensionality change at glass transition is receiving further support via statistical analysis of random processes activated by temperature in various materials including metals and polymers [7,8].
Often the glass transition is however considered as just a gradual although considerable change of material viscosity with an arbitrarily defined glass transition temperature at which the equilibrium viscosity of the melt reaches 1012 Pa·s [3]. The definition of a glass as an amorphous material at high viscosities is inconsistent for at least the reasons that (i) the viscosity is a continuous function of temperature in contrast with derivative thermodynamic parameters such as heat capacity, and (ii) the viscosity is not necessarily equal to 1012 Pa·s varying 4 orders of magnitude (10,000 times) from 108.8 Pa·s to 1013 Pa·s at the calorimetric glass transition temperature, see e.g. Table 4 of Ref. [9]. Also, in many marginal glass-formers equilibrium viscosity of 1012 Pa·s (or any other similarly high value) can never be reached owing to competing crystallization process.
Viscosity quantifies the resistance of material to flow and indicates the ability to dissipate momentum where microscopically it arises because of a transfer of momentum between fluid layers moving at different velocities [10,11,12,13]. Therefore, the tighter the layers are bound to each other the more difficult their motion occurs and hence the resulting viscosity is higher. In principle the viscous flow is mediated by flow defects so that the viscosity is inversely proportional to their concentration. There are at least three crossover temperatures in the viscosity-temperature dependence which are directly related to structural changes which occur in glass-forming systems [14,15]. Viscosity of glass-forming systems changes by many orders of magnitude, attaining values typically exceeding 1012 in the vitreous state and decreasing to less than 10 Pa·s at the melting temperature [9,10,11,12,13,14,15]. The typical viscosity temperature dependencies of glass-forming systems show two distinct Arrhenius-type behaviors at high and low temperatures (at high-viscosity and low-viscosity ends) and a temperature-dependent activation energy of flow caused by structural rearrangements (Figure 1).
The first crossover temperature T1 occurs at the high-viscosity end and is equal to glass transition temperature Tg above which the thermodynamically unstable yet kinetically stable glass transforms into a metastable supercooled liquid. The second crossover temperature T2 occurs at the low-viscosity end and is the temperature above which the liquid becomes fully depolymerized, it is found to be about 10 – 15% higher than the melting temperature Tm. The third crossover temperature T3 occurs when the liquid reaches its minimum possible viscosity, and the viscous flow becomes non-activated. Estimations show that T3 is very high and can barely be reached in practical uses, although at temperatures close to T3 the contribution of the non-activated regime of the flow must be accounted in calculations [14,15].
In various classes of amorphous substances in the glass transition region, freezing of the mobility of various kinetic units occurs differently, which is associated with the different nature of particle interactions. However, it is surprising that the basic laws of the transition from the liquid state to glass are the same for different glass-forming systems, regardless of their nature. This is confirmed by the presence of universal rules and equations in the glass transition region [16,17,18,19,20,21,22]. As glass-forming melts cool in the glass transition range, their flow resistance i.e. the viscosity increases sharply. As a first approximation is typically assumed that they vitrify upon reaching the same ultimate viscosity ηg = η(Tg)= 1012 Pa·s [3]. Mazurin has showed [23] that for most of the studied glasses the temperature Tg corresponds to viscosity values ηg in the range from 1011 to 1012 Pa∙s. Although these values fluctuate with noticeable spread observed the approximate within logarithmic scale constancy ηg = const is better fulfilled in glassy systems of one class [23]. Within the crossover temperatures Tg ≤ T ≤ TA the viscosity of amorphous materials is a complex function of temperature (see Figure 1) where most often the Vogel–Fulcher–Tammann (VFT) model is used to approximate its temperature dependence although the Douglas–Doremus–Ojovan (DDO) double-exponential model (see Chapter 8 of Ref. [14]) model is that one providing the most exact data with correct both high and low temperature asymptotes [14,15]. Another classical model is the Williams–Landel–Ferry (WLF) equation [9,17,22,24,25]:
where η0 and B0 are temperature-independent constants and material-dependent parameters, aT is the relative viscosity , C1 and C2 are empirical temperature-independent constants, Tr is the reference temperature typically taken as the glass transition temperature Tr = Tg. The validity of WLF equation is confirmed for various glass-forming systems including polymers, organic, and inorganic substances, and metallic amorphous alloys [26,27,28,29,30,31,32,33].
This work is devoted to the study of the glass transition of binary oxide systems PbO-SiO2, PbO-GeO2, B2O3-Bi2O3, B2O3-Li2O, B2O3-BaO, B2O3-Na2O3 based on WLF approach and the discussion of some aspects of the liquid-glass transition, in particular, the kinetic criterion of glass transition, using them as an example.
2. Methodology Based on WLF Equation
Let us check the linearity of the dependence y = – (T – Tg)/ln(aT) on temperature departure from glass transition x = (T – Tg). We use experimental data [34] on the temperature dependence of the viscosity of PbO-SiO2 glasses with results shown in Figure 2.
Analysis of Figure 2 shows that for one of the compositions of the studied lead-silicate glasses, the dependence y(x) in the glass transition region is linear. This indicates the applicability of the WLF equation. Similar linear dependences were obtained for other glass compositions. From these dependences, the parameters C1 and C2 of the WLF equation were determined, and on their basis, the characteristics of the glass transition process were calculated (Table 1 and Table 2).
3. Relaxation Character of Glass Transition
Analysis of Table 1 and Table 2 shows that the parameter of the WLF equation C1 in the studied glasses demonstrates a low dependence on their nature. For example, in lead-silicate glasses with different component contents, the value of C1 in the first approximation turns out to have an insignificant spread C1 ≈ Const ≈ 34 – 40. Similar value can be obtained from the assessment of C1 ≈ ln( accounting that typically η0 ≈ 10-3 – 10-5 Pa·s which gives C1 ≈ 35 – 39. The weak dependence of C1 on the nature of the glass is due to the fact that the viscosity at the glass transition temperature ηg and its so-called high-temperature limit η0 remain practically constant for different glasses. We note however that there is not any high-temperature limit of viscosity (see Figure 1), instead there is always a minimum of it [40,41,42].
It follows from the interpretation of the WLF equation within the framework of the delocalized atom model [22,43,44] that the parameter C1 is the reciprocal of the fraction of the fluctuation volume fg frozen at the glass transition temperature: C1 = 1/fg. Thus, the volume fraction of the fluctuation volume fg, obtained from the data on the parameter C1, weakly depends on the nature of the amorphous substances (Tables 1 and 2): fg ≈ 0.01 – 0.03.
In the glass transition range the molecular rearrangements occur so slowly that structural changes in the melt during cooling cannot keep up with the change in temperature which is an indication of non-ergodic regime. As a result, alike the viscosity, the relaxation time of the structure τ(T) increases sharply, which is directly related to the cooling rate of the liquid q = (dT/dt). In 1951, Bartenev [45], based on general reasoning, put forward the following relationship between these quantities, known as the kinetic criterion of glass transition:
where τg is the structural relaxation time at the glass transition temperature Tg, C is an empirical parameter with the dimension of temperature (see also Refs. [22] and [46]). Here and below, q should be understood as the absolute value of the rate of change of temperature ǀqǀ during cooling (q<0) of the melt or heating (q>0) of the glass.
In the relaxation theory of Volkenstein and Ptitsyn [22,47,48,49], it is assumed that particles in a glass-forming system can exist in two states: ground and excited ones. The states are separated by an energy barrier which is typical for utilizing the two-state modelling of glass transition [4,5,50]. The solution of the compiled kinetic equation shows that at a certain temperature, called the glass transition temperature moving particles freeze in the ground state. In this approach the glass transition of the system occurs when the transitions of particles between the ground and excited states cease and the rate of transition of particles through the energy barrier becomes comparable to the rate of cooling of the system, i.e. the ergodic to non-ergodic transition occurs. This leads to the fact that the particles "get stuck" in the ground state and the system transit into a glassy state. The glass transition temperature is then found from the condition:
In this theory, the kinetic criterion for the liquid-glass transition is the glass transition equation [26]:
The designation of the right-hand side of this equality as δTg was proposed by Nemilov as Schmelzer noted in [51]. The value δTg characterizes the temperature range of vitrification i.e. the transition from liquid to glass during cooling. The parameter of the Bartenev equation C in the Volkenstein-Ptitsyn theory (see equation (3)) acquires the meaning of the temperature interval δTg.
Let us consider the estimate of the parameter of the glass transition equation δTg for the studied glasses. Substitution of the dependence τ(T) from the WLF equation into the relation (4) leads to equality
comparison of which with the glass transition equation (5) allows us to obtain a formula for calculating the temperature interval δTg based on the data on the parameters of the WLF equation:
For the studied glasses (Tables 1 and 2) the value of δTg is as high as 9 – 17 K.
The second parameter of WLF equation C2 is equal to the ratio of fg to the coefficient of thermal expansion of the fluctuation volume at the glass transition temperature βf [26]:
where the product βf ∙Tg is a single-valued function of fg:
Accounting that C1 = 1/fg, (7) and for (7), (8) and (9) we see that the parameter of the glass transition equation δTg is determined by the glass transition temperature and the fraction of the fluctuation volume fg:
Since for glasses of the same class it is assumed that fg ≈ const, a linear correlation between the values of δTg and Tg is hence expected. As we can see from Figure 2, for lead-silicate glass the temperature interval δTg, within which the transition from liquid to glass occurs, linearly depends on the glass transition temperature Tg. An approximate linear correlation is observed for lead-germanate (PbO-GeO2) and borate glasses (B2O3-Bi2O3, B2O3-Li2O, B2O3-BaO, B2O3-Na2O3) as shown in Figure 2 and Figure 3.
4. Generalization of Schmelzer Vitrification Criterion
Schmelzer has proposed a characteristic time change in temperature: τT = T/q. At τ << τT the liquid is in a state of thermodynamic equilibrium, and at τ >> τT – in a frozen glassy state [51,52]. It is then assumed that the liquid-glass transition (vitrification) corresponds to the condition: τ ≈ τT. Based on these considerations Schmelzer formulated the following kinetic criterion for glass transition:
The glass transition equation (5) in the account of expression (10) for the temperature interval δTg, receives the following interpretation:
Dividing both parts of this equality by the glass transition temperature Tg with an average value of fg ≈ 0.02 we arrive at a generalized version of the kinetic glass transition criterion [30]:
which, taking into account that q = (dT/dt), can be written as an expression for determining the transition temperature Tg:
The equation (14) is a generalization of the Schmelzer glass transition criterion (11). Based on it we conclude that the constant C3 acquires a certain physical meaning and a different numerical value:
Constancy in the first approximation of Cg is observed in glass of the same family (Table 1). Hence it follows that the value of fg (as well as of Cg) is determined by the viscosity ηg ≈ const at Tg and the conventional high-temperature viscosity limit η0 ≈ const ≈ ηmin [12,13,15,42,53]:
The interpretation of the generalized criterion (13), (14) is as follows: the liquid passes into a frozen glassy state (vitrifies) when the cooling rate q reaches a certain constant fraction Cg of the characteristic cooling rate q = (Tg/τg), closely related to the relaxation time of the structure τg at the glass transition temperature Tg, e.g. see for details [30].
5. Structural Relaxation Time
The glass transition temperature, although weakly i.e. logarithmically [16,22], depends on the cooling rate of the melt q. The temperature at which the viscosity ηg ≈ 1012 Pa∙s is achieved is conventionally considered as the glass transition temperature Tg, and the corresponding cooling rate
which is considered a standard cooling rate [17,23,40,54]. Approximately the same cooling rate is almost universally used as well in the dilatometric investigations of inorganic glasses and polymers. Due to the weak dependence of Tg on q, small fluctuations of q around the standard value (17) practically do not affect the value of Tg. Therefore, it is usually assumed that the vast majority of available data on Tg actually relate to the standard cooling rate (17) with few data for other cooling rates q. Using formula (6) at the standard cooling rate q = 0.05 K/s and data on the parameters of the WLF equation C1 and C2, one can calculate the structural relaxation time τg at the glass transition temperature as follows:
Table 1 and Table 2 show the results of calculating the structural relaxation time for lead and boron containing glasses. It is seen that τg depends on the nature of the glass-foming substance.
Let us now estimate the calculated values of the structural relaxation time. For this we calculate τ using the Maxwell formula: τ = η/G, where G is the shear modulus. For most inorganic glasses, the value of the shear modulus G is approximately (20 – 25) ∙ 109 Pa and remains virtually unchanged with temperature as at T = Tg it is only 3 – 5% less than at room temperature. For a significant number of oxide inorganic glasses, at a standard cooling rate of q = 0.05 K/s, the logarithm of viscosity at the glass transition temperature is lg(ηg, Pa∙s) = 12.76 ± 0.26. From these data on the values of G∞ and ηg at T = Tg, at the level of qualitative estimates, we have [3,14,19]:
which by the order of magnitude coincides with the results of calculation using formula (18) based on the data on the parameters C1 and C2 of WLF equation.
6. Conclusions
The regularities of liquid transition to the glassy state were considered using lead and boron containing glasses as an example. It is established that the fraction of the fluctuation volume fg frozen at the glass transition temperature Tg varies within small limits for the studied systems in the first approximation, since the value of fg weakly depends on the nature of glasses. Based on the data on the parameters of the Williams-Landel-Ferry equation at a standard cooling rate, the temperature interval δTg, within which the liquid passes into glass (vitrifies), is calculated. For the studied glasses, the value of δTg is as high as 9 – 17 K. The obtained results contribute to a deeper understanding of the glass transition mechanism and allow us to establish quantitative relationships between the parameters of the empirical equations and the fundamental characteristics of glass-forming systems. This is also important for predicting the properties of new vitreous materials and optimizing the technological processes for their production.
Author Contributions
Conceptualization, A.A.M.; methodology, A.A.M. and M.V.D.; validation, A.A.M., M.I.O. and M.V.D.; formal analysis, A.A.M., M.I.O. and M.V.D.; resources, A.A.M.; data curation, A.A.M., M.I.O. and M.V.D.; writing—original draft preparation, A.A.M.; writing—review and editing, A.A.M., M.I.O. and M.V.D.; funding acquisition, A.A.M. and M.V.D. All authors have read and agreed to the published version of the manuscript.
Funding
The APC was funded by MDPI. This research was funded with the support of the Banzarov Buryat State University Federal State Budgetary Educational Institution of Higher Education, grant no. 24-03-01.
Data Availability Statement
Data supporting reported results can be found within the text.
Acknowledgments
In this section, you can acknowledge any support given which is not covered by the author contribution or funding sections.
Conflicts of Interest
The authors declare no conflicts of interest.
References
- Mazurin, O.V.; Gankin, Yu.V. Glass transition temperature: problems of measurement procedures. Glass Technology, 2008, 49, 229-233.
- Zheng, Q.; Zhang, Y.; Montazerian, M.; Gulbiten, O.; Mauro, J.C.; Zanotto, E.D.; Yue, Y. Understanding glass through differential scanning calorimetry. Chem. Rev. 2019, 119, 7848–7939.
- Encyclopedia of Glass Science, Technology, History, and Culture. Richet, P., Conradt, R., Takada, A., Dyon, J. Eds., Wiley, Hoboken, NJ, 2021. 1568 p., e.g. [CrossRef]
- Ojovan, M.I.; Lee, W.E. Topologically disordered systems at the glass transition. J. Phys. Condens. Matter 2006, 18, 11507–11520.
- Ojovan, M.I., Tournier R.F. On structural rearrangements near the glass transition temperature in amorphous silica. Materials 2021, 14, 5235, 19 pp.
- Kantor, Y.; Webman, I. Elastic properties of random percolating systems. Phys. Rev. Lett. 1984, 52, 1891–1894.
- Ojovan, M.I.; Louzguine-Luzgin, D.V. Revealing Structural Changes at Glass Transition via Radial Distribution Functions. J. Phys. Chem. B, 2020, 124 , 3186-3194 . [CrossRef]
- Glova, A.; Karttunen M. Learning glass transition temperatures via dimensionality reduction with data from computer simulations: Polymers as the pilot case. J. Chem. Phys. 2024, 161, 184902 . [CrossRef]
- Sanditov, D.S.; Ojovan, M.I. ; Darmaev, M.V. Glass transition criterion and plastic deformation of glass. Physica B, 2020, 411914. [CrossRef]
- Douglas, R.W. The flow of glass. J. Soc. Glass Tech. 1949, 33, 138–162.
- Doremus, R.H. Viscosity of silica. J. Appl. Phys. 2002, 92, 7619.
- Ojovan, M. Viscous flow and the viscosity of melts and glasses. Phys. Chem. Glas. 2012, 53, 143–150.
- Zheng, Q.; Mauro, J.C. Viscosity of glass-forming systems. J. Am. Ceram. Soc. 2017, 100, 1551–2916.
- Hrma, P.; Ferkl, P.; Kruger, A.A. Arrhenian to non-Arrhenian crossover in glass melt viscosity. J. Non-Cryst. Solids 2023, 619, 122556. [CrossRef]
- Ojovan, M.I.; Louzguine-Luzgin, D.V. On Crossover Temperatures of Viscous Flow Related to Structural Rearrangements in Liquids. Materials 2024, 17, 1261. [CrossRef]
- Zarzycki, J. Glasses and the Vitreous State. Cambridge: Cambridge University Press. 1982.
- Sanditov, D.S.; Bartenev, G.M. Physical Properties of Disordered Structures, Nauka: Novosibirsk, Russia, 1982.
- Angel, C.A. Perspective on the glass transition. J. Phys. Chem. Solids, 1988, 49, 863-871.
- Volf, M.B. Mathematical approach to glass; Elsevier: Amsterdam, 1988.
- Angel, C.A.; Ngai, K.L.; McKenna, G.B.; McMillan, P.F.; Martin, S.W. Relaxation in glass forming liquids and amorphous solids. J. Appl. Phys. 2000, 88, 3113-3157.
- Varshneya, A.K. (2006). Fundamentals of Inorganic Glasses. Sheffield: Society of Glass Technology, 2006.
- Sanditov, D.S.; Ojovan, M.I. Relaxation aspects of the liquid—glass transition. Physics Uspekhi 2019, 62 111 - 130. [CrossRef]
- Mazurin, O.V. Problems of compatibility of the values of glass transition temperatures published in the world literature. Glass Phys Chem 2007, 33, 22–36. [CrossRef]
- Williams, M.L.; Landel, R.F.; Ferry, J.D. The Temperature Dependence of Relaxation Mechanisms in Amorphous Polymers and Other Glass-forming Liquids. J. Am. Chem. Soc., 1955, 77, 3701–3707.
- Ferry, J.D. Viscoelastic Properties of Polymers; Wiley: New York, NY, USA, 1970.
- Sanditov, D.S. Model of delocalized atoms in the physics of the vitreous state. J. Exp. Theor. Phys. 2012, 115 112–124.
- Sanditov, D.S.; Razumovskaya, I.V. New Approach to Justification of the Williams–Landel–Ferry Equation. Polym. Sci. Ser. A, 2018, 60, 156–161.
- Nemilov, S.V.; Petrovskii, G.T. A Study of the Viscosity of Glasses in the As–Se System. Zh. Prikl. Khim. 1963, 36, 977–981.
- Sanditov, D.S.; Mashanov, A.A.; Razumovskaya, I.V. On the temperature dependence of the glass transition activation energy. Polym. Sci. Ser. A 2020, 62, 588–596.
- Sanditov, D. S.; Mashanov, A. A. Some General Aspects of the Liquid–Glass Transition in Sodium Germanate Glasses. Inorganic Materials, 2022, 58, 630. [CrossRef]
- Darmaev, M.V.; Ojovan, M.I.; Mashanov, A.A.; Chimytov, T.A. The Temperature Interval of the Liquid–Glass Transition of Amorphous Polymers and Low Molecular Weight Amorphous Substances. Appl. Sci. 2023, 13, 2742. [CrossRef]
- Mashanov A.A., Ojovan M.I., Darmaev M.V., Razumovskaya I.V. The Activation Energy Temperature Dependence for Viscous Flow of Chalcogenides. Appl. Sci. 2024, 14, 4319. [CrossRef]
- Sanditov, D.S.; Darmaev, M.V.; Sanditov, B.D. Application of the model of delocalized atoms to metallic glasses. Tech. Phys. 2017, 62, 53–57.
- Nemilov S.V., Ignatiev A.I. Viscosity of melts of the PbO–SiO2 system in the region of softened and liquid states. Glass Phys. Chem. (RUS), 1990, 16, 85-93.
- Nemilov, S.V., Viscosity and Structure of Binary Germanate Glasses in the Range of Softening Temperatures, Zh. Prikl. Khim. (Leningrad), 1970, 43, 2602-2610.
- Nemilov, S.V., Burunova, O.N., and Gilev, I.S., Viscosity and Elasticity of Glasses in the Bi2O3–B2O3 System, Zh. Prikl. Khim. (Leningrad), 1972, 45, 1193–1198.
- Volkova, N.E. and Nemilov, S.V., The Influence of Heat Treatment on the Low-Temperature Viscosity of Glasses in the Li2O–B2O3 System, Fiz. Khim. Stekla, 1990, 16, 207–212.
- Romanova, N.V. and Nemilov, S.V., A Study of the Viscosity of Glasses in the BaO–B2O3, BaO–B2O3–La2O3, and CdO–B2O3–La2O3 Systems in the Softening Range, Izv. Akad. Nauk SSSR, Neorg. Mater., 1970, 6,1322–1326.
- Nemilov, S.V., Structural Investigation of Glasses in the B2O3–Na2O System by Viscometry, Izv. Akad. Nauk SSSR, Neorg. Mater., 1966, 2, 349–356.
- Ojovan, M.I. Configurons: thermodynamic parameters and symmetry changes at glass transition. Entropy 2008, 10, 334-364.
- Trachenko, K.; Brazhkin, V.V. Minimal quantum viscosity from fundamental physical constants. Sci. Adv. 2020, 6, eaba3747.
- Ojovan, M.I.; Louzguine-Luzgin, D.V. The Minima of Viscosities. Materials 2024, 17, 1822. [CrossRef]
- Sanditov, D.S. On the nature of the liquid-to-glass transition equation. J. Exp. Theor. Phys. 2016, 123, 429–442. [CrossRef]
- Sanditov D.S., Mashanov A.A. Some regularities of the transition of sodium germanate glasses from the liquid to the glassy state. Inorganic materials. 2022, 58, 630-636. [CrossRef]
- Bartenev, G.M. On the relation between the glass transition temperature of silicate glass and rate of coolingor heating. Dokl. Akad. Nauk SSSR 1951, 76, 227–230. Available from: https://www.researchgate.net/publication/322890519_Glass_Transition_Crystallization_of_Glass-Forming_Melts_and_Entropy [accessed Nov 13 2024].
- Schmelzer, J.W.P.; Tropin, T.V. Glass Transition, Crystallization of Glass-Forming Melts, and Entropy. Entropy 2018, 20, 103. [CrossRef]
- Volkenshtein M. V., Ptitsyn O. B. Relaxation theory of glass transition. J. Tech. Physics. 1956, 10, 2204–2222.
- Nemilov, S.V. Maxwell equation and classical theories of glass transition as a basis for direct calculation of viscosity at glass transition temperture. Glass Phys Chem 2013, 39, 609–623. [CrossRef]
- Sanditov, D.S., Mantatov, V.V., Sangadiev, S.S. Generalized Kinetic Criterion of the Liquid–Glass Transition. Phys. Solid State 2020, 62, 1924–1927. [CrossRef]
- Benigni, P. CALPHAD modeling of the glass transition for a pure substance, coupling thermodynamics and relaxation kinetics. Calphad 2021, 72, 102238.
- Schmelzer J.W.P. Kinetic Criteria of Glass Formation and the Pressure Dependence of the Glass Transition Temperature. J. Chem. Phys. 2012, 36, 074512. [CrossRef]
- Tropin T.V., Shmeltzer Yu.V.P., Aksenov V.L. Modern aspects of the kinetic theory of glass transition. Physics-Uspekhi 2016, 186, 47-73. [CrossRef]
- Mauro, J.C.; Yue, Y.; Ellison, A.J.; Gupta, P.K.; Allan, D.C. Viscosity of glass-forming liquids. Proc. Natl. Acad. Sci. USA 2009, 106, 19780–19784.
- Bartenev, G.M., Luk’yanov, I.A., Dependence of the Glass Transition Temperature on the Heating Rate for Amorphous Materials and the Relation of the Glass Transition Temperature to the Activation Energy, Zh. Fiz. Khim., 1955, 29, 1486–1498.
Figure 1.
Generic temperature dependence of the viscosity of glass-forming systems (modified after [15]).
Figure 1.
Generic temperature dependence of the viscosity of glass-forming systems (modified after [15]).
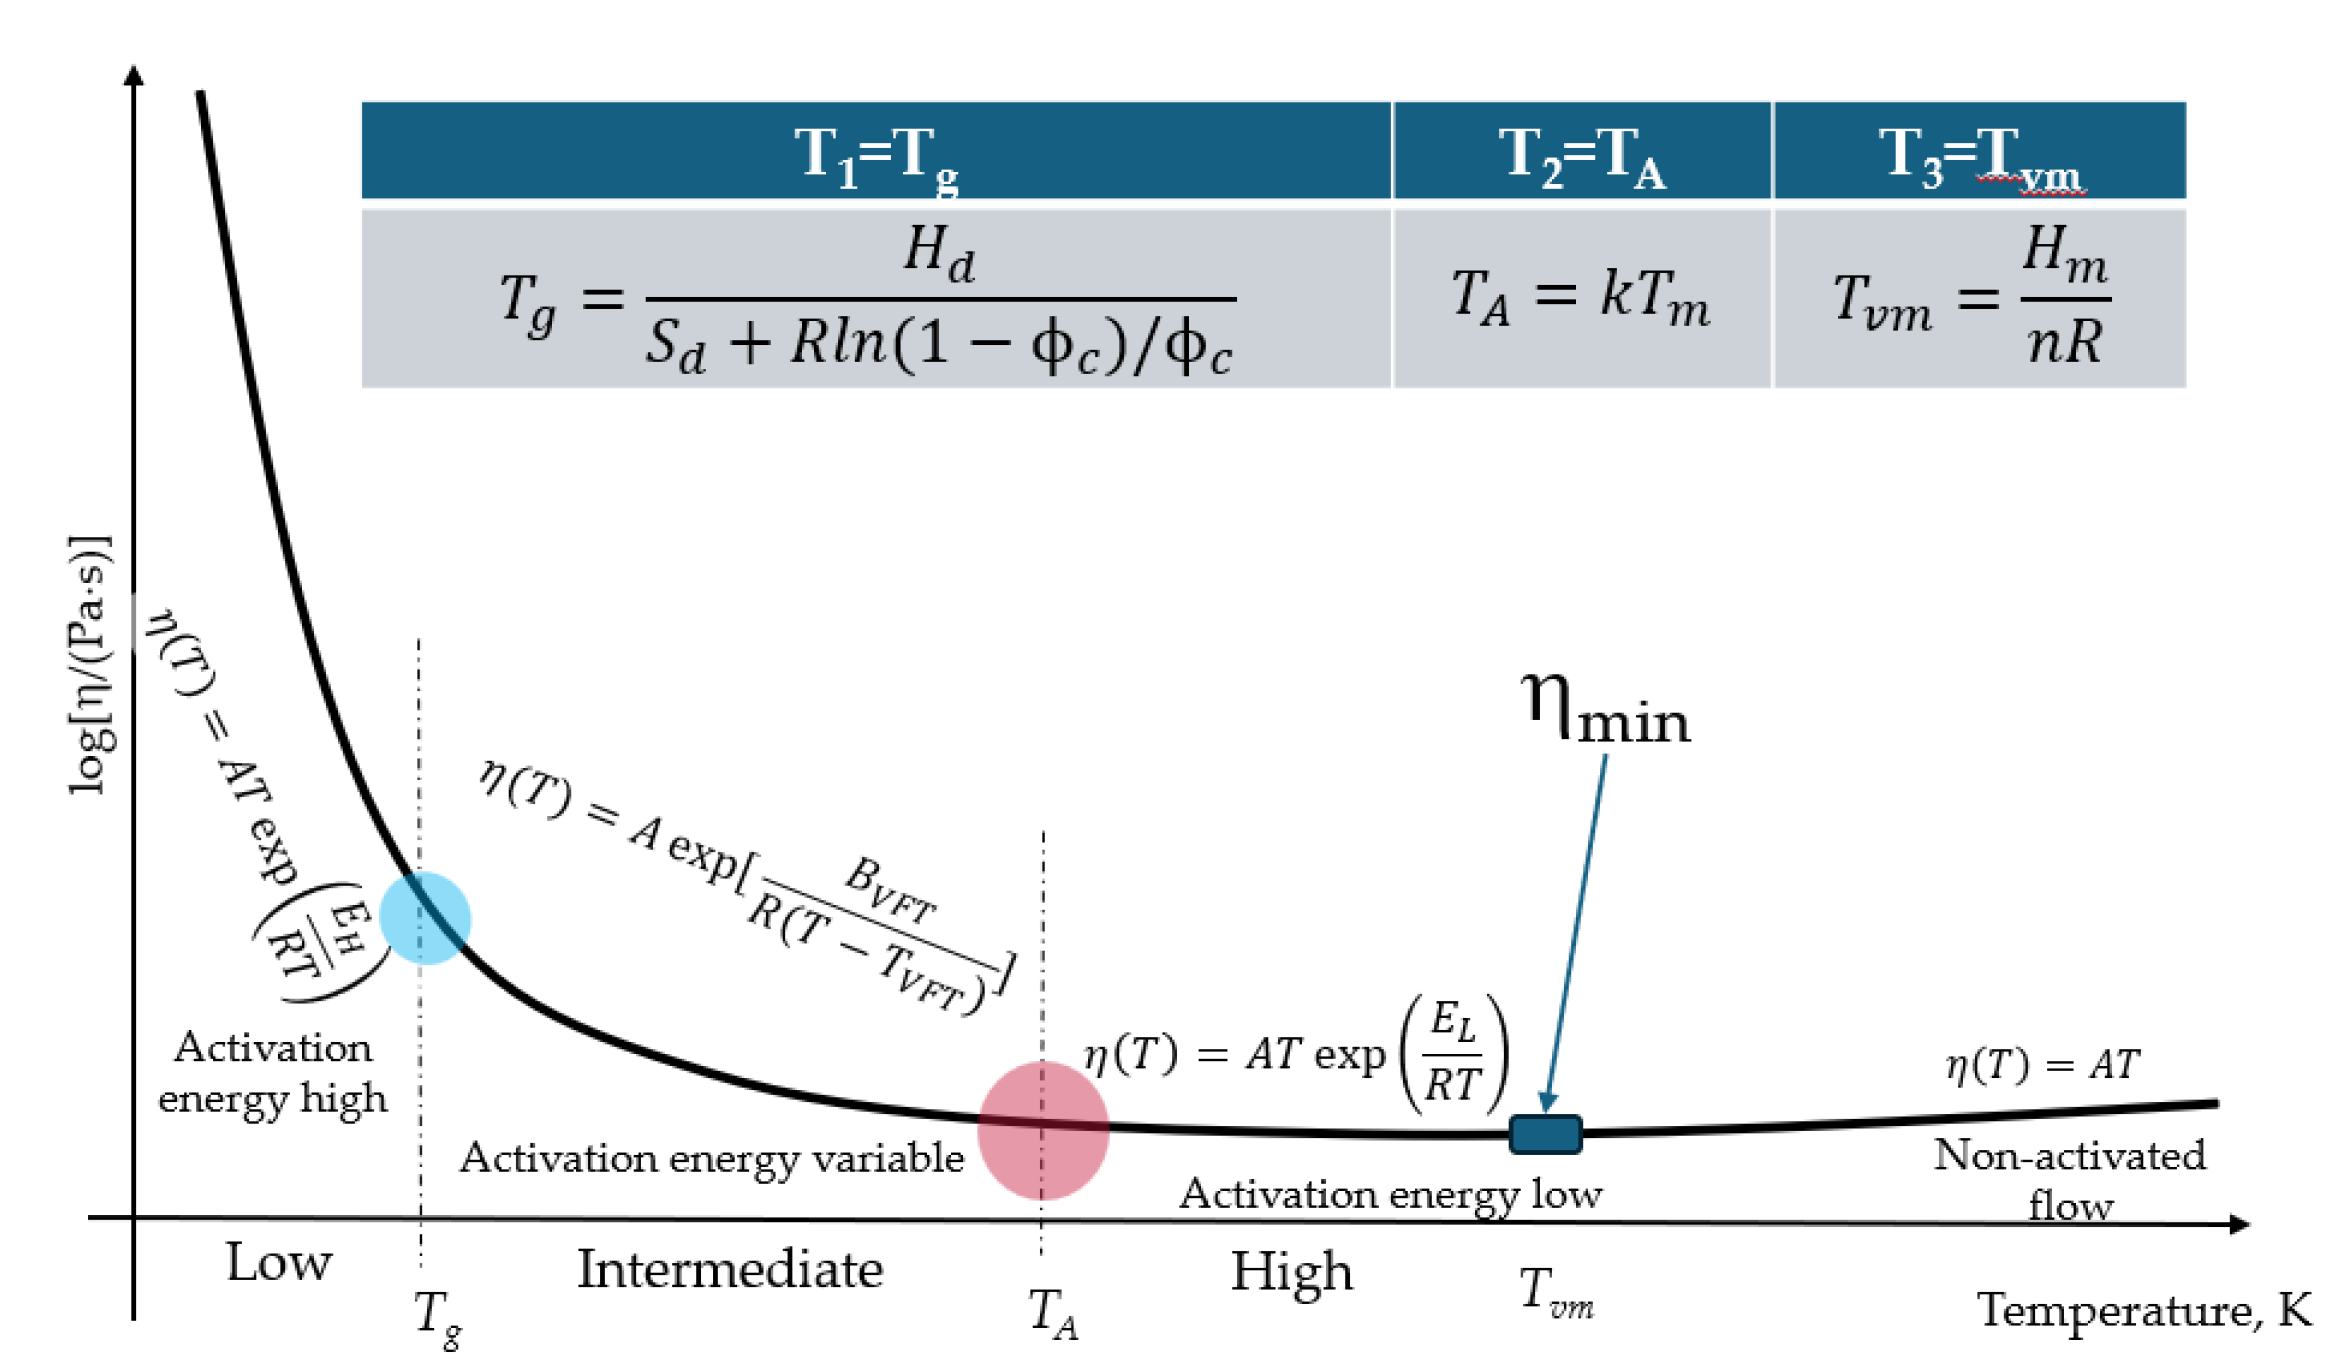
Figure 2.
Temperature dependence of viscosity of lead-silicate glasses in coordinates corresponding to the Williams-Landel-Ferry equation. PbO content is 62.29 mol.%.
Figure 2.
Temperature dependence of viscosity of lead-silicate glasses in coordinates corresponding to the Williams-Landel-Ferry equation. PbO content is 62.29 mol.%.
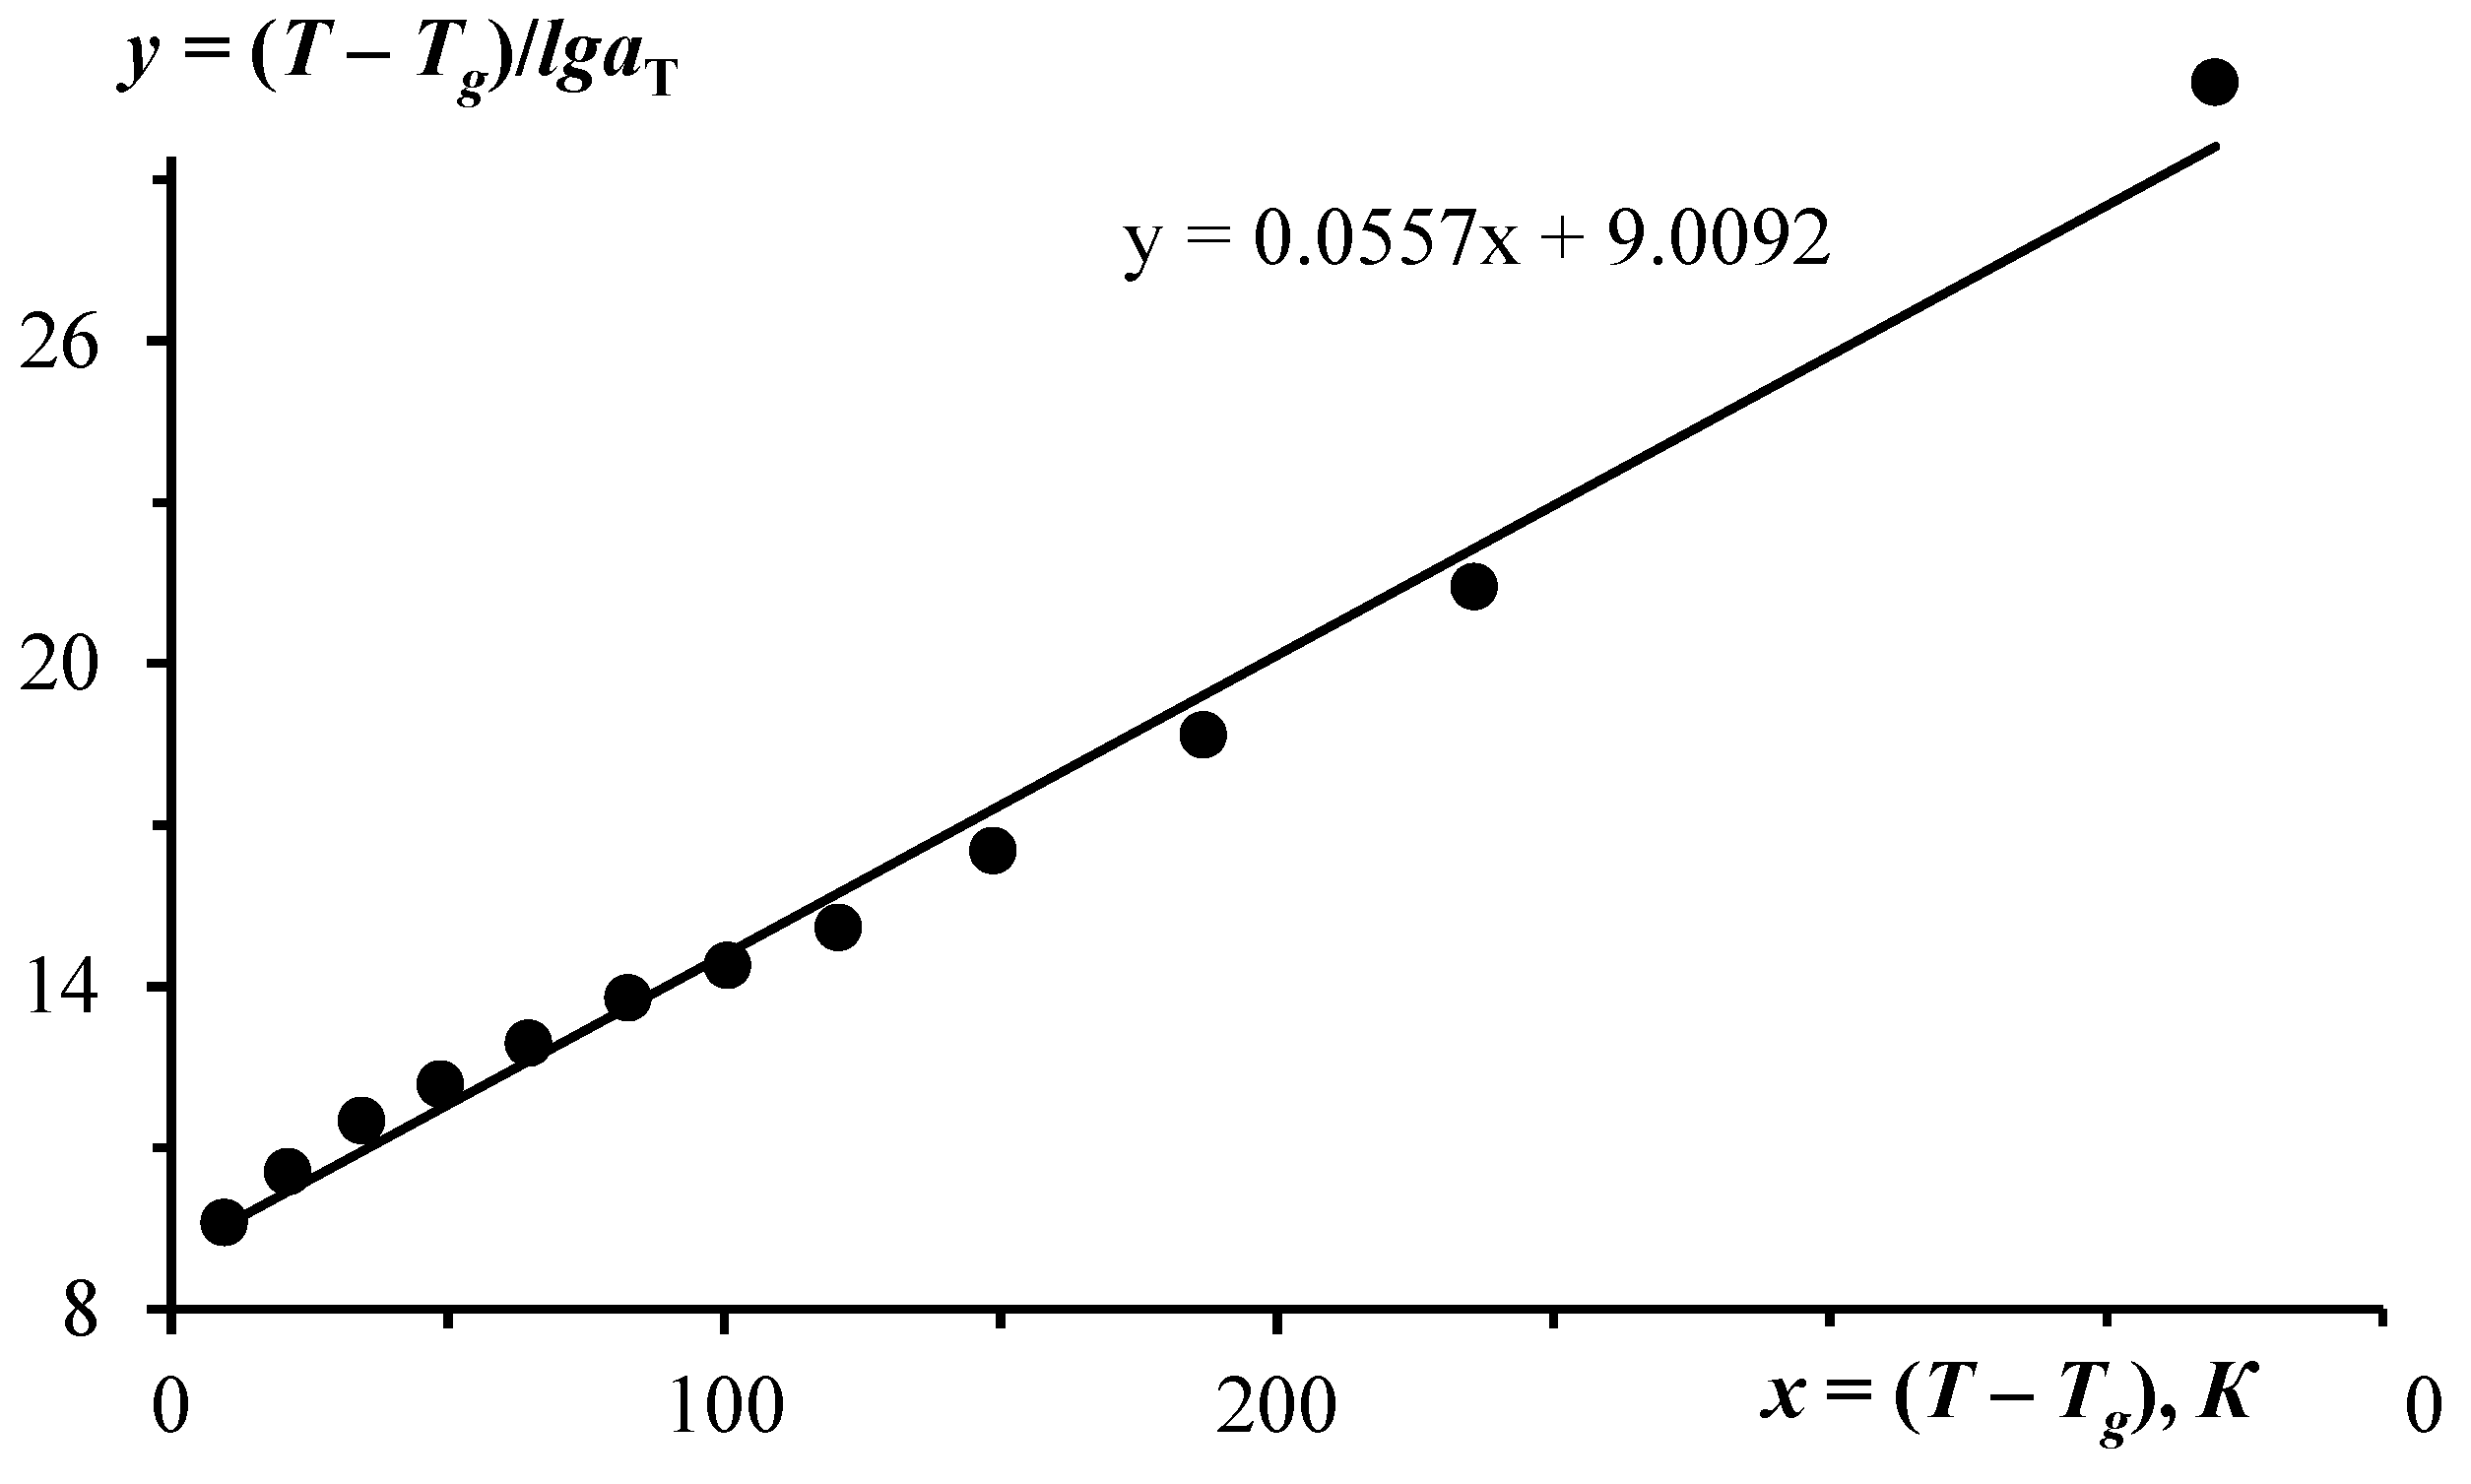
Figure 3.
Correlation between the temperature interval δTg, characterizing the glass transition range, and the glass transition temperature Tg for lead-silicate and lead-germanate glasses.
Figure 3.
Correlation between the temperature interval δTg, characterizing the glass transition range, and the glass transition temperature Tg for lead-silicate and lead-germanate glasses.
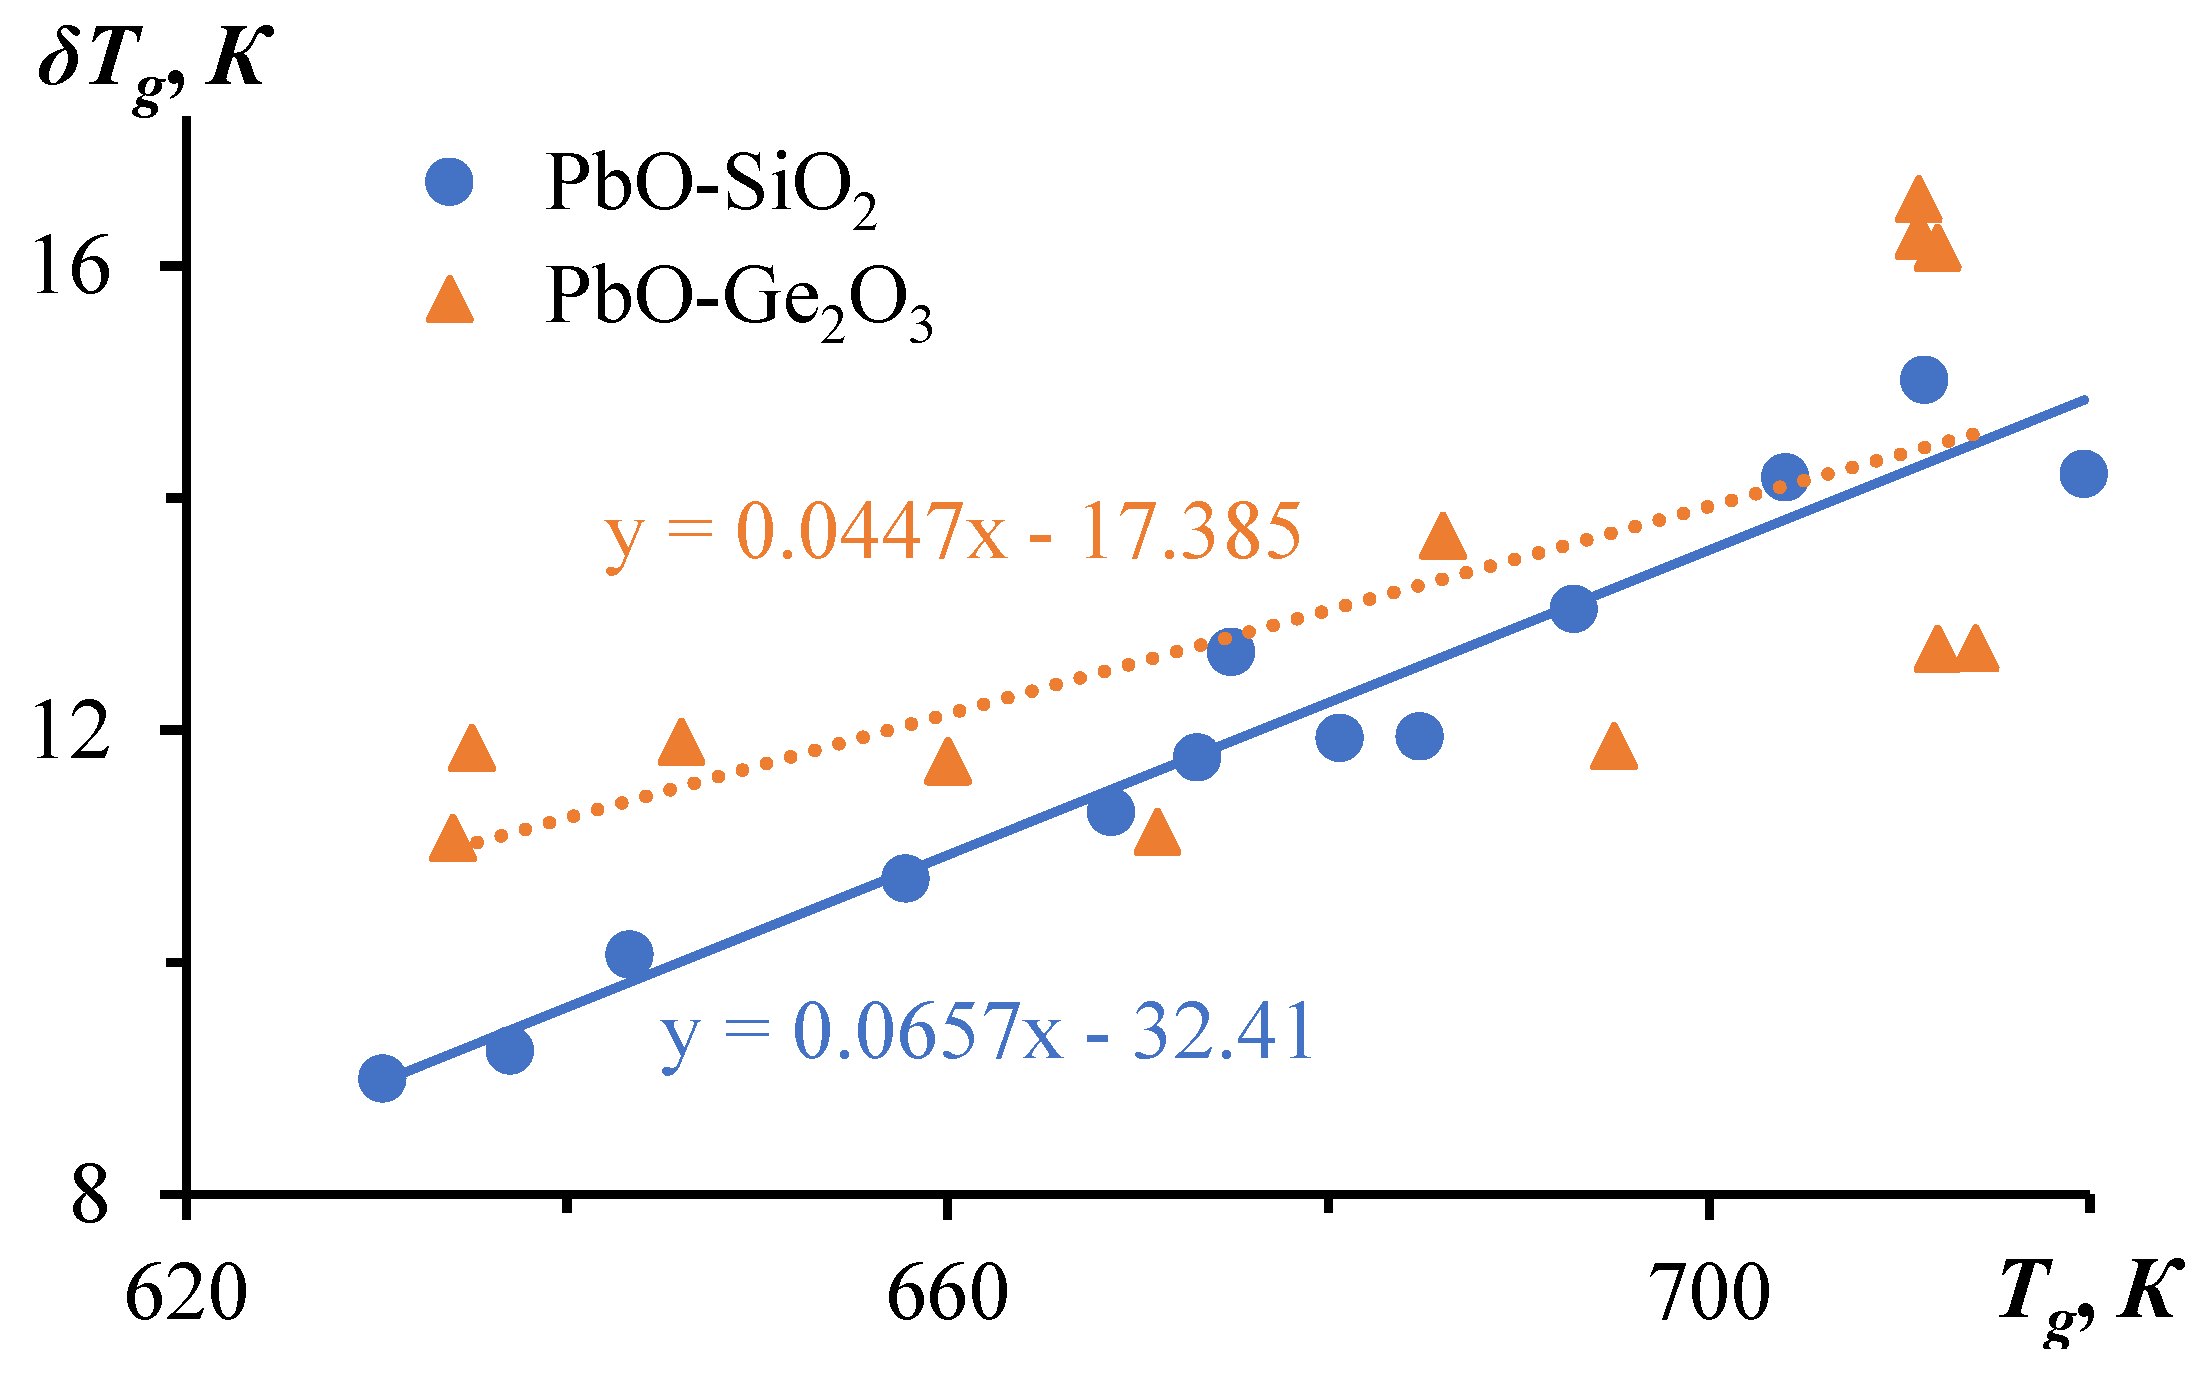
Figure 4.
Example of correlation between δTg and Tg for B2O3-Bi2O3 glasses.
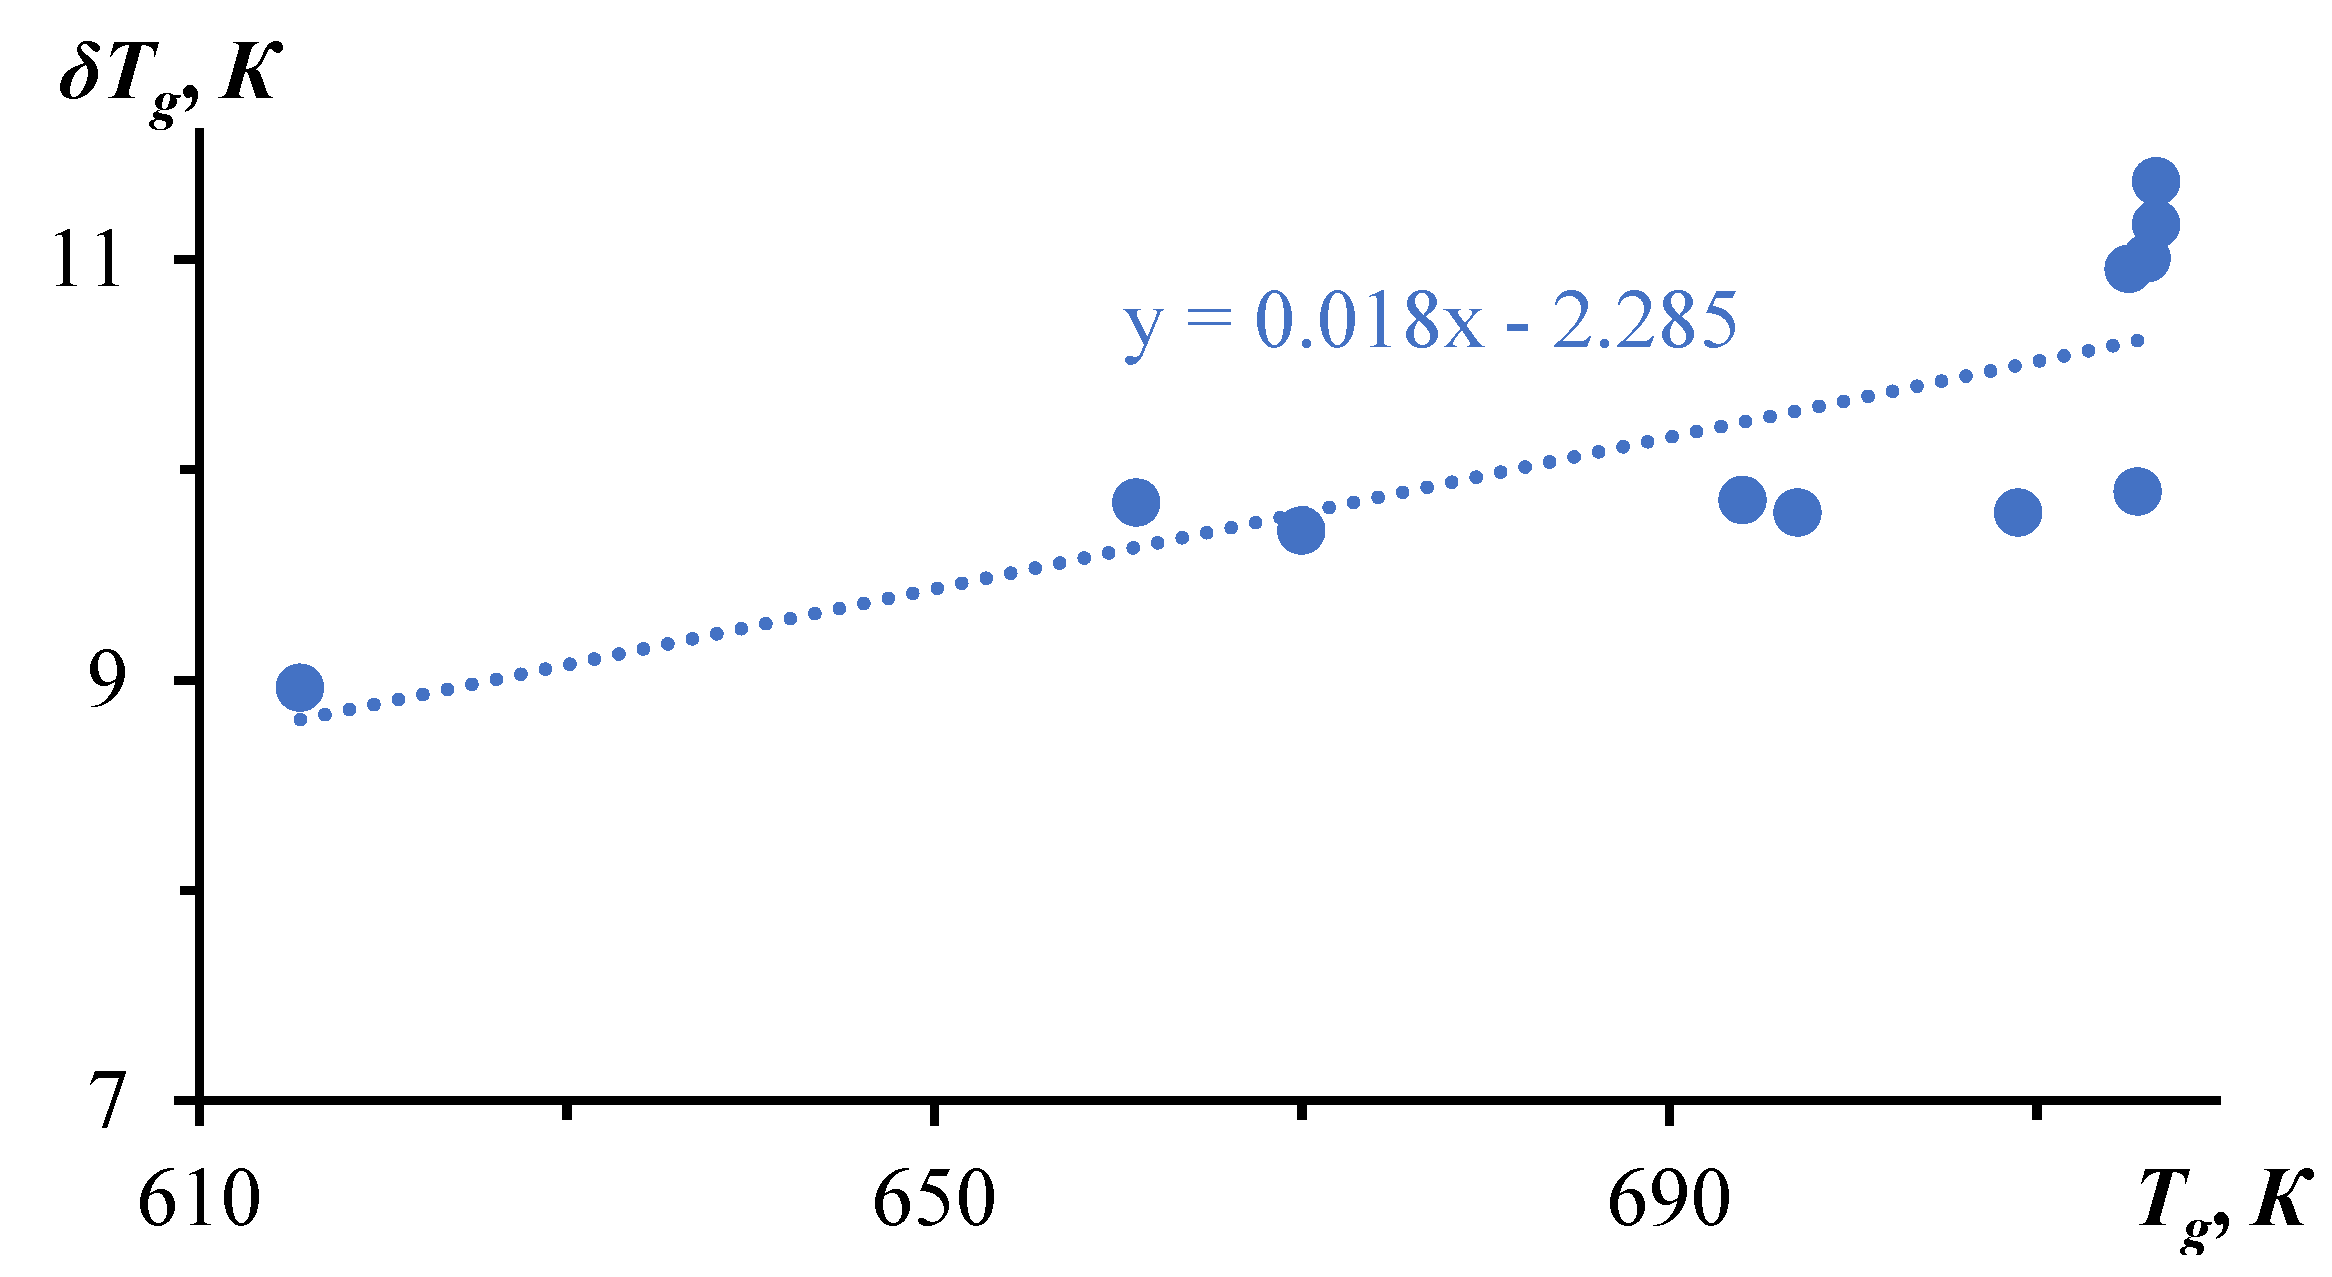

Table 1.
Parameters of the WLF equation C1 and C2 for lead-silicate and lead-borate glasses, as well as characteristics of the glass transition process based on experimental data from [34,35].
| № | Glass | С1 | С2, К | Tg, К | δTg, К | fg | Cg ∙ 103 | τg, s | |
| mol.% | |||||||||
| PbO | SiO2 | ||||||||
| 1 2 3 4 5 6 7 8 9 10 11 12 13 |
40.27 42.07 44.64 47.25 48.73 49.54 50.24 51.19 52.25 55.02 57.53 60.16 62.29 |
59.73 57.93 55.36 52.75 51.27 50.46 49.76 48.81 47.75 44.98 42.47 39.84 37.71 |
34.3 35.7 36.8 36.6 36.5 36.5 37.8 37.2 37.2 38.5 38.4 39.1 41.2 |
211.8 233.3 226.6 207.7 189.3 189.2 208.0 190.4 182.8 179.3 168.1 157.0 161.2 |
720 711 704 693 685 681 675 673 669 658 643 637 630 |
14.2 15.0 14.2 13.0 11.9 11.9 12.7 11.8 11.3 10.7 10.1 9.2 9.0 |
0.029 0.028 0.027 0.027 0.027 0.027 0.026 0.027 0.027 0.026 0.026 0.026 0.024 |
8.3 7.8 7.5 7.6 7.6 7.6 7.3 7.4 7.4 7.1 7.1 7.0 6.5 |
284.1 300.3 283.5 260.8 238.8 238.6 253.4 235.3 225.8 214.4 201.2 184.7 179.9 |
| PbO | GeO2 | ||||||||
| 1 2 3 4 5 6 7 8 9 10 11 12 |
15 18 20 25 27 33 35 40 42 45 48 50 |
85 82 80 75 73 67 65 60 58 55 52 50 |
32.2 38.2 34.6 33.0 35.9 34.9 54.9 28.9 41.2 46.1 56.6 73.7 |
520.8 633.2 561.9 418.8 455.9 413.6 751.0 321.9 483.0 549.0 627.0 873.6 |
712 711 711 714 712 695 686 671 660 646 634 635 |
16.2 16.6 16.3 12.7 12.7 11.9 13.7 11.1 11.7 11.9 11.1 11.8 |
0.013 0.011 0.013 0.013 0.012 0.012 0.008 0.015 0.011 0.009 0.008 0.006 |
3.1 2.5 2.9 3.0 2.7 2.8 1.6 3.6 2.3 2.0 1.6 1.1 |
323.2 331.5 325.2 254.1 254.0 237.2 273.5 222.5 234.6 238.0 221.4 237.0 |
Table 2.
Parameters of the WLF equation C1 and C2 for various borate glasses and characteristics of the glass transition process based on experimental data from [21,22,23,24,36,37,38,39].
| № | Glass | С1 | С2, К | Tg, К | δTg, К | fg | Cg ∙ 103 | τg, s | |
| mol.% | |||||||||
| B2O3 | Bi2O3 | ||||||||
| 1 2 3 4 5 6 7 8 9 10 11 |
79 78.2 77.21 76.95 72 69 64.03 62.2 57.98 56.91 43.19 |
21 21.8 22.79 23.05 28 31 35.97 37.8 42.02 43.09 56.81 |
46.4 33.9 44.2 64.9 40.1 63.4 63.4 99.7 27.5 59.0 85.4 |
517.9 385.7 437.4 713.8 439.2 620.6 620.6 982.5 266.6 580.9 765.5 |
717 717 716 716 715 709 697 694 670 661 616 |
11.2 11.4 9.9 11.0 11.0 9.8 9.8 9.9 9.7 9.8 9.0 |
0.009 0.013 0.010 0.007 0.011 0.007 0.007 0.004 0.016 0.007 0.005 |
2.0 2.9 2.1 1.3 2.4 1.4 1.4 0.8 3.8 1.5 1.0 |
223.3 227.4 197.9 220.1 219.0 195.9 195.9 197.1 194.2 196.9 179.3 |
| B2O3 | Li2O | ||||||||
| 1 2 3 4 5 6 |
98 94.9 93 89.6 87.8 84.8 |
2 5.1 7 10.4 12.2 15.2 |
25.3 27.6 29.4 31.7 29.8 38.2 |
400.5 433.0 492.3 544.6 520.0 601.6 |
286 323 332 364 386 414 |
15.9 15.7 16.7 17.2 17.4 15.8 |
0.017 0.016 0.015 0.014 0.015 0.011 |
4.2 3.8 3.5 3.2 3.4 2.5 |
317.2 313.6 334.5 343.2 348.7 315.0 |
| B2O3 | BaO | ||||||||
| 1 2 3 4 5 6 7 |
98.44 98.13 95.52 91.55 90.44 87 85.8 |
1.56 1.87 4.48 8.45 9.56 13 14.2 |
25.5 15.3 17.3 21.6 20.2 45.9 24.6 |
394.3 231.2 259.9 355.4 317.4 855.2 403.6 |
524 530 659 720 732 735 739 |
15.5 15.1 15.0 16.5 15.7 18.6 16.4 |
0.017 0.028 0.025 0.020 0.022 0.009 0.018 |
4.2 8.0 6.8 5.2 5.6 2.0 4.4 |
309.1 302.8 300.2 329.7 314.9 372.7 327.5 |
| B2O3 | Na2O | ||||||||
| 1 2 3 4 5 6 7 8 9 10 11 12 |
94.6 92 89.3 86.5 84.7 78.7 76.8 75.7 75.4 72.6 67.4 61.5 |
5.4 8 10.7 13.5 15.3 21.3 23.2 24.3 24.6 27.4 32.6 38.5 |
21.9 23.1 23.1 19.9 29.2 28.3 21.0 20.8 21.6 22.6 20.4 23.4 |
367.4 377.1 377.1 307.7 457.0 375.7 255.4 253.5 253.6 261.1 215.8 241.5 |
293 319 343 373 391 455 460 460 463 466 467 461 |
16.8 16.3 16.3 15.4 15.7 13.3 12.2 12.2 11.8 11.5 10.6 10.3 |
0.020 0.019 0.019 0.022 0.015 0.015 0.021 0.021 0.020 0.019 0.021 0.019 |
5.1 4.7 4.7 5.7 3.5 3.7 5.3 5.4 5.2 4.9 5.5 4.7 |
336.2 325.9 325.9 308.9 313.2 265.3 243.4 243.3 235.0 230.5 211.5 206.6 |
* Note that: δTg = C2/C1, fg = 1/C1, Сg = fg / ln(1/fg), τg = (C2/C1)q.
Disclaimer/Publisher’s Note: The statements, opinions and data contained in all publications are solely those of the individual author(s) and contributor(s) and not of MDPI and/or the editor(s). MDPI and/or the editor(s) disclaim responsibility for any injury to people or property resulting from any ideas, methods, instructions or products referred to in the content. |
© 2024 by the authors. Licensee MDPI, Basel, Switzerland. This article is an open access article distributed under the terms and conditions of the Creative Commons Attribution (CC BY) license (http://creativecommons.org/licenses/by/4.0/).
Copyright: This open access article is published under a Creative Commons CC BY 4.0 license, which permit the free download, distribution, and reuse, provided that the author and preprint are cited in any reuse.


