
Submitted:
06 December 2024
Posted:
09 December 2024
You are already at the latest version
Abstract
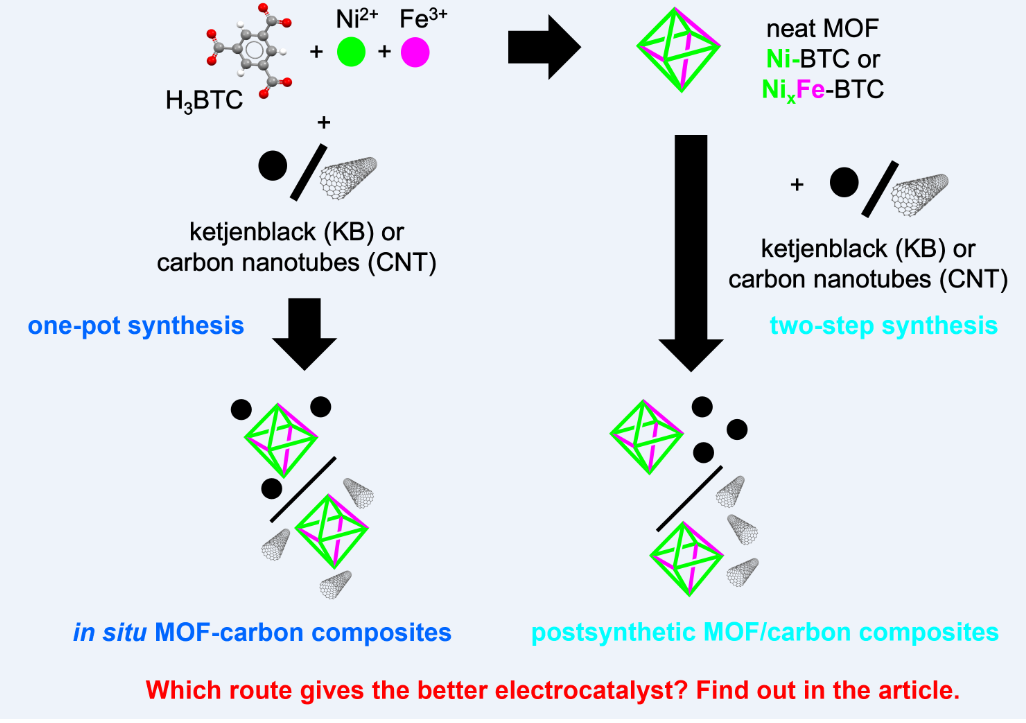
Mixed-metal nickel-iron, NixFe materials draw attention as affordable earth-abundant electrocatalysts for the oxygen evolution reaction (OER). Here nickel and mixed-metal nickel-iron metal-organic framework (MOF) composites with the carbon materials ketjenblack (KB) or carbon nanotubes (CNT) were synthesized in situ in a one-pot solvothermal reaction. As a direct comparison to these in situ synthesized composites, the neat MOFs were postsynthetically mixed by grinding with KB or CNT, to generate physical mixture composites. The in situ and postsynthetic MOF/carbon samples were comparatively tested as (pre-)catalysts for the OER and most of them outperformed the RuO2 benchmark. Depending on the carbon material and metal ratio the in situ or postsynthethic composites performed better, showing that the method to generate the composite can influence the OER activity. The best material Ni5Fe-CNT was synthesized in situ and achieved an overpotential (η) of 301 mV (RuO2 η = 354 mV), a Tafel slope (b) of 58 mV/dec (RuO2 b = 91 mV/dec), a charge transfer resistance (Rct) of 7 Ω (RuO2 Rct= 39 Ω) and a faradaic efficiency (FE) of 95% (RuO2 FE = 91%). Structural changes in the materials could be seen through a stability test in the alkaline electrolyte and chronopotentiometry over 12 h showed that the derived electrocatalysts and RuO2 have a good stability.
Keywords:
Metal-organic frameworks (MOFs)
; electrocatalysis
; oxygen evolution reaction (OER)
; nickel
; iron
; carbon nanotubes
; ketjenblack
; carbon paper
; in situ
; postsynthetic
1. Introduction
Nickel-based materials have emerged as promising electrocatalysts for the oxygen evolution reaction (OER), one of the two half reactions in electrochemical water splitting (OER, alkaline conditions: 4 OH- → O2 + 4 e- + 2 H2O, E° = 1.23 V vs. the reversible hydrogen electrode, RHE) [1,2,3,4,5,6,7,8,9,10,11,12,13,14,15,16,17,18,19,20,21,22,23]. The OER is the bottleneck of electrochemical water splitting and requires a higher activation energy than the hydrogen evolution reaction (HER, alkaline conditions: 4 H2O + 4 e- → 2 H2 + 4 OH-, E° = 0.00 V vs. RHE) [2]. To produce one oxygen molecule in the OER four electron-proton coupled reaction steps, which require a larger applied potential than the theoretical potential of 1.23 V for electrochemical water splitting, have to be gone through [3,4]. The difference of the applied potential (E) to the theoretical potential of E° = 1.23 V, which still needs to be corrected for the internal resistance (IR) because of the ohmic drop, is called overpotential η (η = E – E° (1.23 V) – IR (1)) [5]. The overpotential is a parameter to check the efficiency of an electrocatalyst and is determined at a defined current density, with often 10 mA/cm2 being used as a reference point [2,6].
Currently noble-metal-based catalysts like ruthenium oxide (RuO2) and iridium oxide (IrO2) are seen as benchmark electrocatalysts for the OER [7,8]. RuO2 is known to efficiently drive the OER in alkaline and acidic media [9,10,11]. However, the high costs due to the scarcity of the noble-metals, impede a large-scale industrial utilization of those electrocatalysts [12]. Nickel presents an attractive option for the OER due to its abundance, its lower cost and electrocatalytic activity [3,12,13]. Ni3+ is assumed to be the main active site in nickel-based materials, leading to an improved conductivity and accelerated reaction kinetics [8,12,14,15]. The incorporation of iron into nickel-based materials can be advantageous for electrocatalytic water splitting, because iron promotes the nickel oxidation from Ni2+ to Ni3+ [15,16,17]. In recent years, various nickel(-iron)-based materials, including oxides, (oxy)hydroxides, phosphides, sulfides, nitrides and metal-organic frameworks (MOFs), have been extensively studied for their electrocatalytic ability in the OER [1,3,18]. MOFs usually act as pre-catalyst that only form the active phase under the electrochemical reaction conditions [19]. The resulting electrocatalysts, often metal (oxy)hydroxides, can potentially retain some of the porosity of the MOFs, which help in lessening diffusion limitations and increasing the electrocatalytic activity of the material [12,1][–[1]. For mixed-metal MOFs the intimate and uniform mixture of the involved metals is retained at the nanoscale in the derived electrocatalyst.
MOFs and also the derived metal (oxy)hydroxide electrocatalysts have low electrical conductivity, which needs to be increased through the combination with a carbon material [22,23,24]. The admixture of a carbon material, that is, the formation of a MOF/carbon composite improves the efficiency of charge transfer processes in electrochemical applications [25]. Ketjenblack (KB) or carbon nanotubes (CNTs) are often utilized to produce composite materials. KB is a carbon black material and displays good electrical conductivity, a high surface area and thermal stability [22,26,28]. CNTs are cylindrical nanostructures composed of carbon atoms arranged in a hexagonal lattice, forming seamless tubes with diameters typically on the order of nanometers. CNTs have good mechanical stability, high thermal stability, high electrical and thermal conductivities, which make them interesting to use as an alternative to carbon black materials in composites [25,29,30,31]. Preceding research presented different highly active MOF-composite-derived materials for the alkaline OER [32,33,34,35].
The MOF and the carbon material can be combined in situ, that is, by carrying out the MOF synthesis in the presence of the carbon material or postsynthetically, that is, by combining the separately prepared MOF with the carbon material through physical mixing [36]. Both routes are used in the literature but mostly without direct comparison. Studies on in situ prepared Ni-MOF/carbon composites [37] are, of course, difficult to compare with studies on postsynthetically prepared physical mixtures [38]. Few Ni-MOF/carbon works on OER include a comparison of both routes [39].
Here we present the direct comparison of Ni(Fe)-MOF/carbon composites which were prepared in situ and postsynthetically with the same weight percent of carbon with respect to their electrocatalytic activity as electrode material in the oxygen evolution reaction. The parent MOF was Ni-BTC of formula [Ni3(BTC)2(Me2NH)3]·(DMF)4(H2O)4 (BTC = benzene-1,3,5-tricarboxylate, DMF = N,N-dimethylformamide) [40].
2. Results and Discussion
2.1. Synthesis and Characterization of the MOF Composites
For the in situ synthesis the nickel and nickel-iron MOF composites were synthesized by a simple one-pot solvothermal reaction at 170 °C for 48 h from Ni(NO3)2·6 H2O or a mixture of Ni(NO3)2·6 H2O, Fe(NO3)3·9 H2O (molar Ni:Fe ratio 10:1 or 5:1), 1,3,5-benzenetricarboxylic acid (H3BTC), 2-methylimidazole (2-MeImH), and ketjenblack (KB) or carbon nanotubes (CNT) in N,N-dimethylformamide (DMF) (Figure 1a). The amount of carbon materials was set to give about 10% of KB or CNT in the composite.
For the postsynthetic admixture the neat Ni-, Ni10Fe and Ni5Fe-MOFs were generated through the same procedure as noted above [40] but without the presence of a carbon material. The neat MOFs were physically mixed with 10 wt% of KB or CNT with respect to the MOF amount with a vortex mixer at 40 Hz for 20 min (Figure 1b).
A hyphen is used for the in situ MOF-composites, i.e., NiXFe-CNT or NiXFe-KB depending on the used carbon material. A slash indicates the postsynthetically physically-mixed MOFs/carbon materials, i.e., NiXFe/CNT or NiXFe/KB.
To assess also the influence of iron on the electrocatalytic performance the Ni-only MOF and its carbon composites were prepared and investigated in comparison to the NiXFe materials.
The verification of the MOF synthesis had to be carried out for the neat MOFs and for the in situ prepared MOF-carbon composites. For the latter it had to be seen if and to what extent the presence of carbon would influence the MOF crystallinity and the porosity. The crystallinity was assessed by powder X-ray diffraction (PXRD), the surface area determination and porosity were calculated by BET and NLDFT on the volumetric gas sorption isotherms. For the postsynthetically admixed MOF/carbon composites PXRD and gas sorption measurements confirmed the superposition of the MOF and carbon contribution.
It was verified by energy-dispersive X-ray spectroscopy in the scanning electron microscope (SEM-EDX) of the reaction products that the used molar 10:1 and 5:1 nickel to iron ratios in the in situ synthetic procedure were also present in the nickel-iron containing MOFs and their composites (Table S1, SI). SEM-EDX element mapping displays a homogeneous distribution of Ni and Fe inside the samples (Figure 2 and Figure S2 to S4, SI). The morphology of the MOF particles ranges from an octahedral to a cuboctahedral shape. The change in shape was also seen by Qiao et al. and correlated with the iron content in their samples [41]. Noteworthy, the average particle size for the in situ MOF-CNT composites (Ø(Ni-CNT) = 16 µm, Ø(Ni10Fe-CNT) = 6 µm, Ø(Ni5Fe-CNT) = 6 µm) is smaller than for the neat MOF (Ø(Ni) = 27 µm, Ø(Ni10Fe) = 15 µm, Ø(Ni5Fe) = 7 µm) and the in situ MOF-KB composites (Ø(Ni-KB) = 27 µm, Ø(Ni10Fe-KB) = 14 µm. Ø(Ni5Fe-KB) = 15 µm) (Figure 2, S2 to S9).
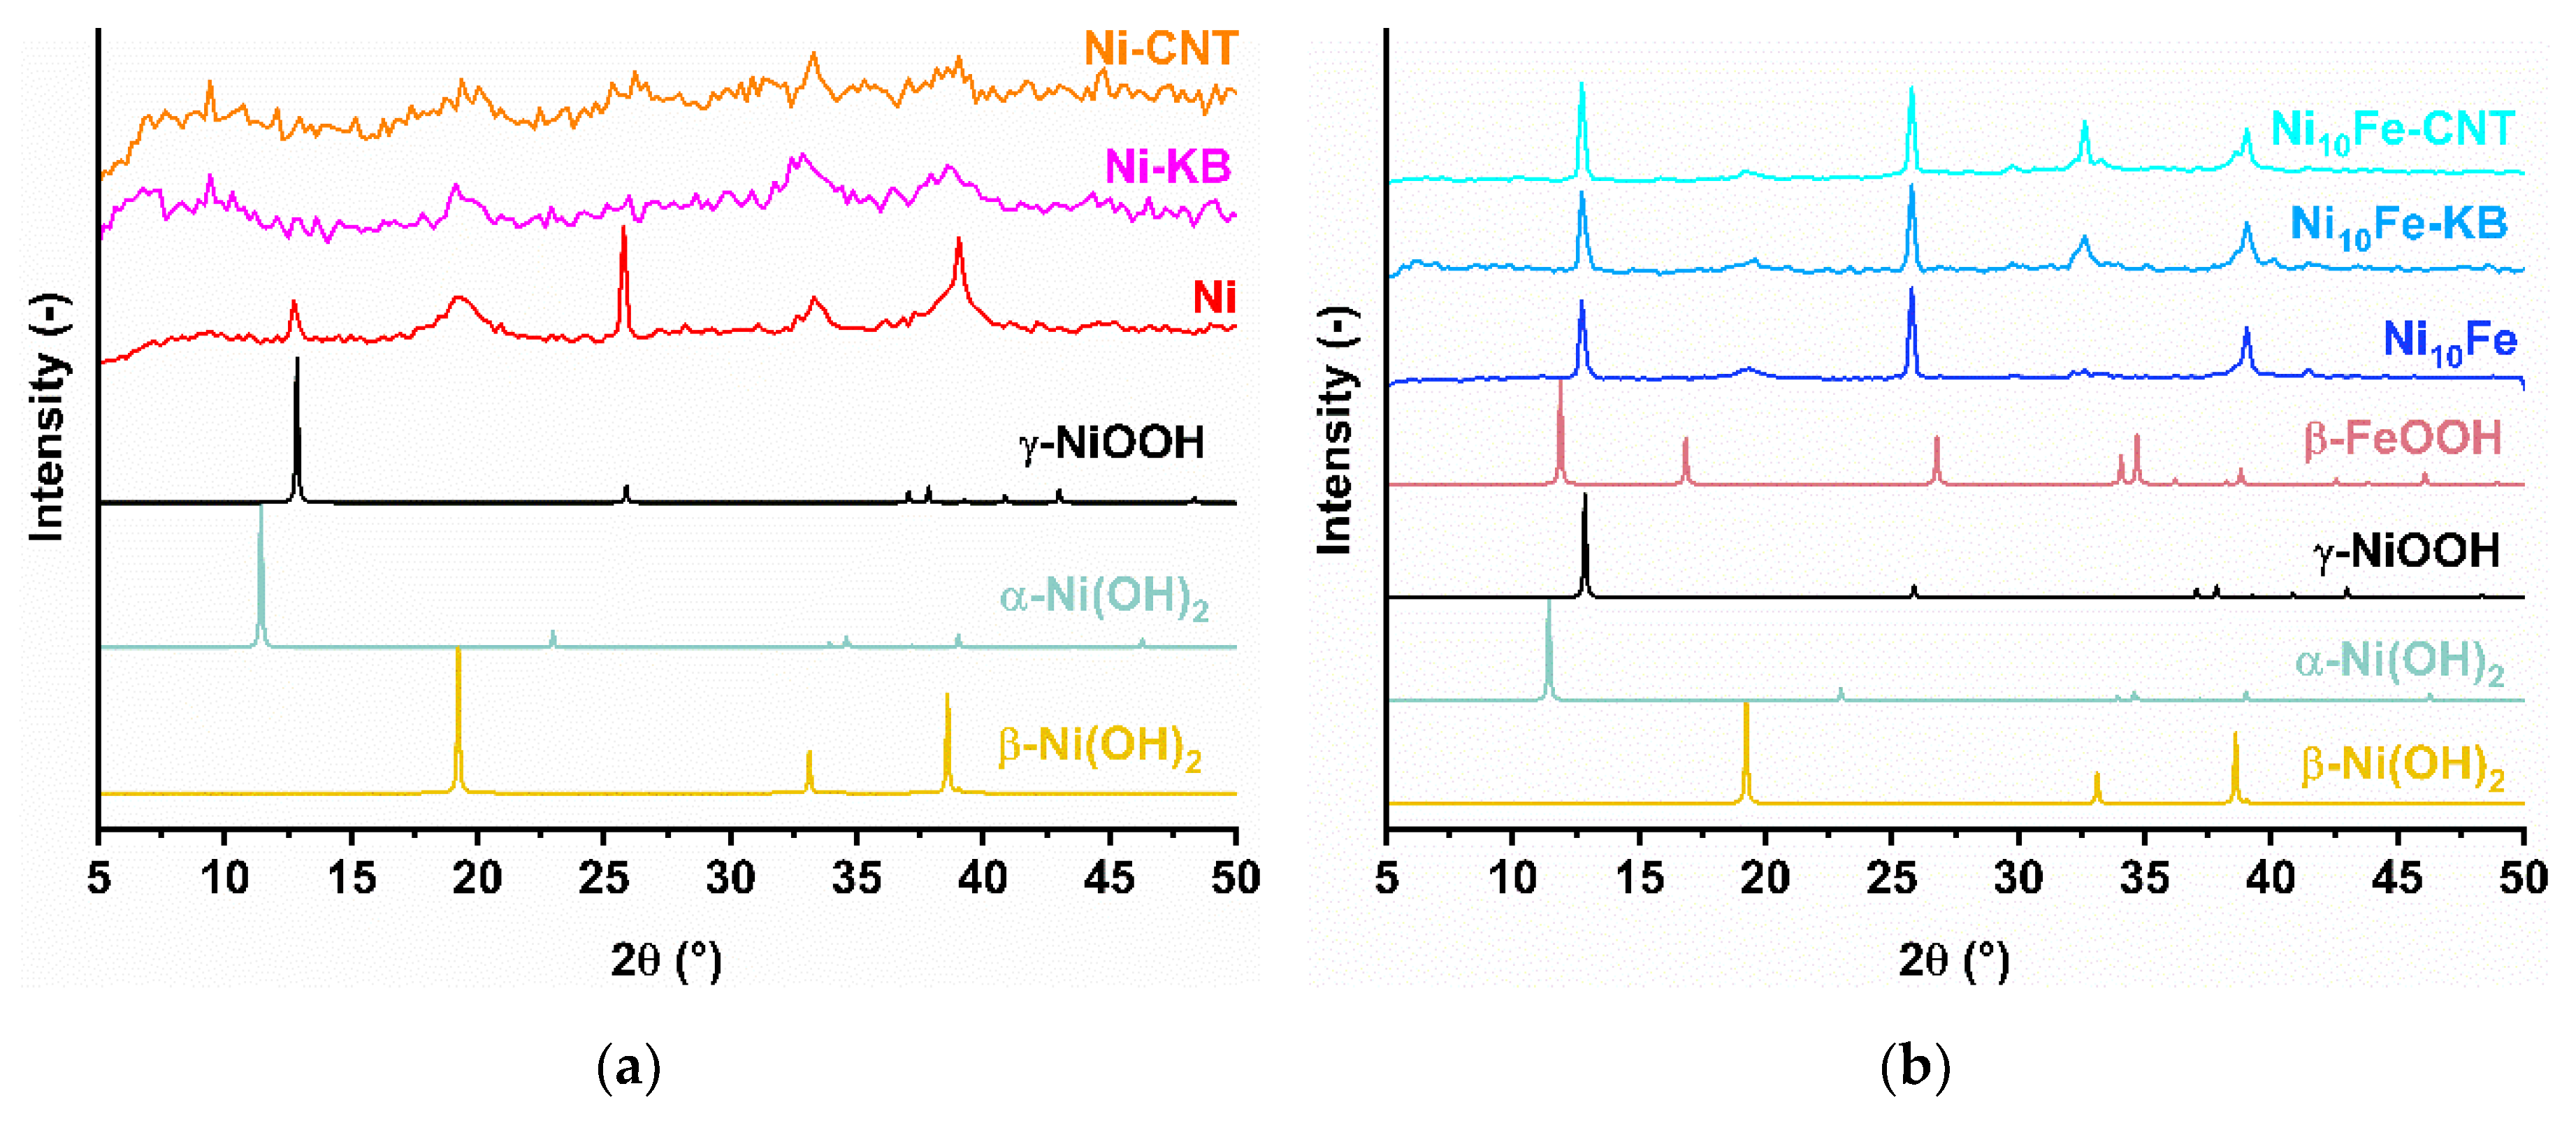
Powder X-ray diffraction (PXRD) patterns of the neat MOFs, the in situ and postsynthetic formed composites present the same reflexes as the simulated pattern of the structurally authenticated Ni-MOF (Ni-BTC) in Figure 4, S1 and S10 (see Figure S1, SI for the building unit and packing diagram of the parent MOF Ni-BTC). Thereby, the in situ incorporation of KB had less influence on the MOF crystallinity than did CNT, that is the width of the reflections and signal-to-noise ratio of the KB samples was similar to those in the neat MOF diffractograms For the in situ CNT samples the reflexes were broader and the noise increased. The lower crystallinity of the in situ CNT samples correlates with the seemingly smaller crystallites which formed in the presence of CNT (Figure 2, Figure S2 to S9, SI). In addition, there could be more defects in the MOF-CNT composite samples [42,43,44,45]. Mazlan et al. reviewed recent works on the growth of MOFs in the presence of graphene oxide and also showed that depending on the MOF, on the functional groups of the graphene oxide (GO) and on the synthesis method of the composite, the crystal growth of the MOFs could be influenced to result in ordered or disordered (nanosized) MOF-GO structures [45]. No additional other reflexes than for Ni-BTC were detected in the NixFe-MOF samples, which indicates that iron was well incorporated into the structure of the Ni-MOF. KB presented three broad diffraction peaks at 8, 26 and 44° matching to the (100), (002), (101) planes of graphitized carbon, respectively [22,46]. CNT displayed its two broad diffraction peaks at 26° (002) and 44° (101) [47].
Thermogravimetric analysis (TGA) of the neat MOFs and their in situ composites was performed on the as-synthesized samples without activation and under N2 atmosphere (Figure S11a-c, SI). Two major mass loss steps were recorded, where the first one 350 °C can be attributed to the evaporation of coordinated and crystal solvent molecules from the porous Ni-BTC structure (~20–30% mass loss) [40,48,49,50,51]. The second mass loss step after 350 °C can be ascribed to the decomposition of the BTC-linker and the disintegration of the MOF structure (~45–55% mass loss) [40,48,49,50,51]. The carbon materials KB and CNT show a good stability until 600 °C under the measurement conditions (Figure S11d, SI). In general, the residual masses of the MOFs without any carbon material are lower than their corresponding composites, which can be used to calculate the amount of carbon material inside of the in situ composites via subtraction of the residual mass of the neat MOFs from the residual mass of their composites Table S2, SI):
Fourier transform infrared (FT-IR) spectra (Figure S12, SI) of the in situ composite materials display the characteristic bands of the neat Ni-BTC MOF (Table S3, SI). All spectra show a broad band in the region of 3600–3000 cm–1, which can be ascribed to the stretching vibration of the hydroxy group from adsorbed or coordinated water (Figure S1, SI) [40,52,53]. The samples were not activated before the FT-IR measurement. The bands around 1629–1559 cm–1 and 1440–1345 cm–1 can be assigned to the asymmetric and symmetric stretching vibrations of carboxylate groups [24,49,52,54]. Characteristic metal-oxygen bond vibrations can be seen for a mixed-metal-oxygen (FeNi-O, Fe2Ni-O) bond around 722–713 cm–1 (Lit. ~720 cm–1 [55,56]) and a Fe/Ni-O bond around 589–453 cm–1 (Lit. 587–461 cm–1 [24,35,55,57]) in all spectra.
To examine the porosity of the materials N2-sorption measurements were conducted. The N2-adsorption isotherms at 77 K were used to calculate the specific Brunauer-Emmett-Teller (BET) surface areas (S(BET)) and pore volumes of the materials (Figure 5 and S13 to S15, ) and are summarized in Table S4 and S5, SI.
The isotherm shape of the neat Ni-MOF and Ni10Fe-MOFs are close to type I with a slight type II increase with pressure and a slight H4 hysteresis. The distinct uptake at low relative pressure originates from the filling of the micropores. The type II branch and the hysteresis loops derive here from the texture effect of the physisorption in the meso- and macroporous voids of the aggregated crystallites [58,59]. Ni5Fe demonstrates a steeper uptake approaching a relative pressure of 1 with a more pronounced H3 hysteresis loop than the other neat MOF samples, which could be due to a stronger capillary condensation in this sample and is an indication that the sample exhibits more aggregates and larger pores from defects, which are not completely filled with pore condensate [59].
The isotherms of the neat carbon materials are displayed in Figure 5d. KB is a mesoporous carbon material (S(BET) = 1415 m2/g, pore volume: 1.59 cm3/g, pore size: ~ 4 ± 2 nm, Figure S13d, SI). KB shows a mixed adsorption isotherm consisting of an IUPAC type I and II branch at low and high relative pressure, respectively, with an H3 hysteresis at p/p0 >0.9 and H4 hysteresis between 0.4 < p/p0 < 0.9, [59]. CNT is a carbon material, where the inner surface area of the tubes is not accessible and only their outer surface area was measured (S(BET) = 117 m2/g, Figure S6d, SI) [60]. CNT gives a type III isotherm with a slight H3 hysteresis, characteristic of nonporous or macroporous materials [59].
The MOF-KB isotherms are evidently a superposition of the neat MOF and KB isotherm and have the same KB-characteristic type II branch at high relative pressure with the H3 and H4 hysteresis upon desorption. There are also bimodal pore size distributions with maxima at ~ 2 nm and ~ 4 nm (Figure S13 and S15, SI). The BET surface areas for the MOF samples and their in situ composites fit into the range of published values for Ni-BTC and their analogs (Lit. 86-596 m2/g [35,57,61], Ni-MOF: 648 m2/g, Ni-KB: 414 m2/g, Ni-CNT: 301 m2/g, Ni10Fe: 859 m2/g, Ni10Fe-KB: 526 m2/g, Ni10Fe-CNT: 387 m2/g, Ni5Fe: 698 m2/g, Ni5Fe-KB: 599 m2/g, Ni5Fe-CNT: 67 m2/g) [28]. The sorption isotherms of the postsynthetic composites show a similar curvature as the in situ synthesized composites (Figure S14, Table S5, SI).
2.2. Electrocatalytical Results
Multiple electrochemical measurements were performed in order to assess the electrocatalytic ability of the neat MOF, in situ and postsynthetically-mixed carbon composite samples in the alkaline (1 mol/L KOH electrolyte, pH = 14) towards the oxygen evolution reaction (OER). A three-electrode setup with an ink-coated carbon paper as the working electrode was utilized (see experimental section for details). MOFs are usually of low stability in alkaline medium where they form metal hydroxides. Metal hydroxides are recognized as electrocatalytically active species. Mixed-metal MOFs allow to achieve a defined mixed-metal hydroxide composition with a uniform distribution of the metals on the nano-level [62,63,64,65]. The electrochemical parameters overpotential (η) (Figure 7 and S23, SI) and Tafel slope (b) (Figure 9 and S24a, SI) were derived from activated linear sweep voltammetry (LSV) measurements (Figure 6). A comparison of the overpotentials before and after 1000 cyclic voltammetry cycles (CVs) and a 12 h chronopotentiometry (Figure S25, SI) was carried out to test the stability of the electrocatalysts. The electrochemical parameter charge transfer resistance (Rct), was achieved through electrochemical impedance spectroscopy (EIS) (Figure 10 and Figure S24b, SI). Measurement details are given in the experimental section.
The electrocatalytic performance of the electrocatalysts derived from the neat MOFs, from the in situ synthesized MOF-carbon composites and from the postsynthetic mixtures of Ni-MOF, Ni10Fe and Ni5Fe were contrasted to the performance of the RuO2 benchmark.
The LSV plots in Figure 6 demonstrate that Ni5Fe-CNT achieves the highest current density (j) of all samples before and after the stability test. All samples except for Ni-MOF reached higher current densities than the commercial RuO2 and the neat carbon materials KB and CNT. With regards to the current density a higher iron content in the composites allows to attain higher current densities at a given potential. Regarding the type of carbon material in case of the postsynthetically mixed Ni10Fe composites KB managed to gain a slightly higher current density than CNT, but in case of the Ni5Fe-BTC composites the CNT composite reaches a higher current density (Figure S22). For most samples the current densities before and after the stability test were similar or only slightly lower after 1000 CV cycles except for the Ni-MOF composites, where higher current densities were attained after the 1000 CV cycles. The oxidation of Ni2+ to Ni3+ is visible by the peak around and above 1.4 V vs. RHE (Figure 6), and shifts to higher potentials when iron included into the samples which indicates a stabilization of the Ni2+ state [55,66].
From the potential at the current density of 10 mA/cm2 (E10), which is often chosen for comparison, the overpotential (η10) is derived by subtracting the standard potential of 1.23 V, i.e., η10 = E10 – 1.23 V. The overpotentials before and after the 1000 CV cycle stability test are summarized in the bar diagrams in Figure 7 (values are listed in Table S6, SI). The initial overpotential of Ni-MOF is 372 mV and after the stability test it has slightly increased to 379 mV. With the addition of a carbon material, the overpotential for Ni-MOF decreases, and unexpectedly is lowered further after the CV cycles, both in situ and the more so when postsynthetically mixed [35,67].
In general, the addition of Fe into the Ni-MOF at a 5:1 molar Ni:Fe ratio led to a significant and anticipated [66,68] decrease of the overpotential, down to below 300 mV before the activation cycles (Ni5Fe: η10 = 296 mV, Ni5Fe/KB: 297 mV, Ni5Fe-CNT η10 = 289 mV, Ni5Fe/CNT: 294 mV) (Figure 7 and Table S6, SI). Activation with 1000 CV cycles then gives the normally seen increase in overpotential to values between 300 and 340 mV. Still, all NixFe-MOF-carbon samples outperformed the benchmark RuO2 (η10 = 360 mV, before to 354 mV, after activation). The overall lowest overpotential, i.e., highest activity for OER is given by Ni5Fe-CNT with η10 = 289 mV, before to 301 mV, after activation. It can be clearly seen that an increase in Fe content from the Ni10Fe to the Ni5Fe series is advantageous with the latter giving lower overpotentials.
Judged from the lower overpotential, the in situ synthesized CNT composites perform better than the in situ KB composites (Figure 7a, Table S6, SI). Comparing the in situ and the respective postsynthetically-mixed composites, for KB the postsynthetic ones and for CNT the in situ ones have the lower overpotential (Figure 8).
Figure 7.
Overpotentials η10 calculated from LSV curves in Figure 6 (a-d) of (a) MOFs and in situ MOF-carbon samples, (b) MOFs and postsynthetic MOF/carbon mixtures; each with KB, CNT and RuO2 for comparison. No η10 value of KB could be determined after 1000 CVs, because KB did not reach 10 mA/cm2 anymore. Error bars are derived from the highest and lowest achieved η10 value in multiple measurements.
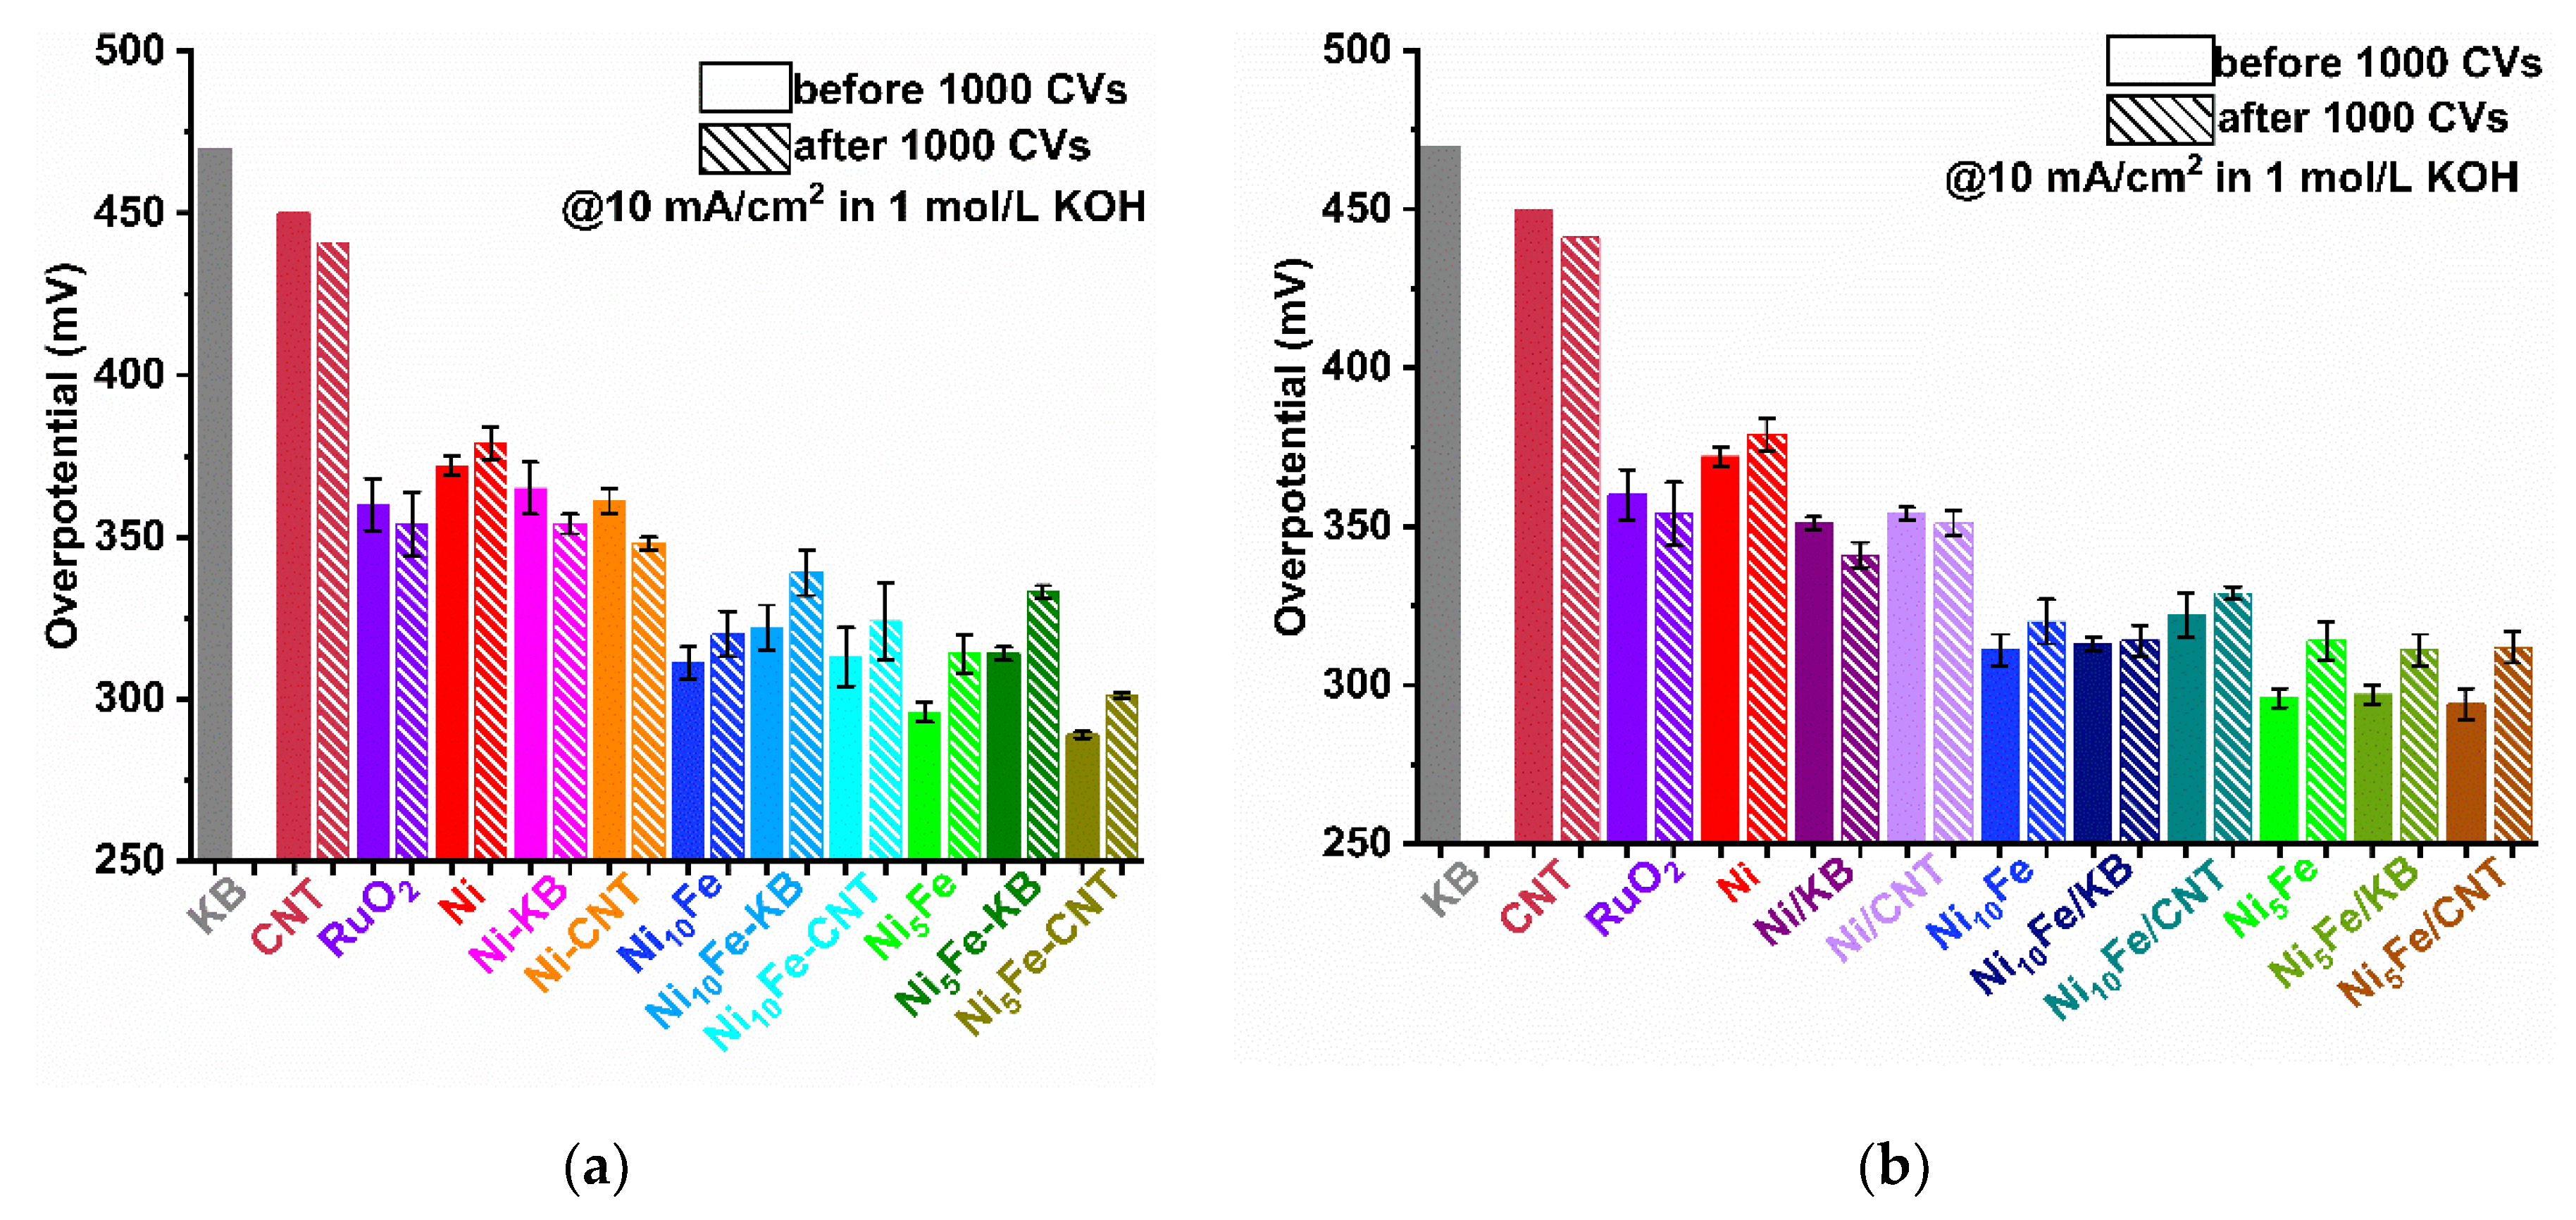
Figure 8.
Overpotentials η10 calculated from LSV curves in Figure 6 of in situ MOF-carbon samples and postsynthetic MOF/carbon mixtures for comparison. For clarity, only the data after 1000 CVs is presented (see Figure S23, SI for the additional data before the 1000 CVs). Error bars are derived from the highest and lowest achieved η10 value in the multiple measurements.
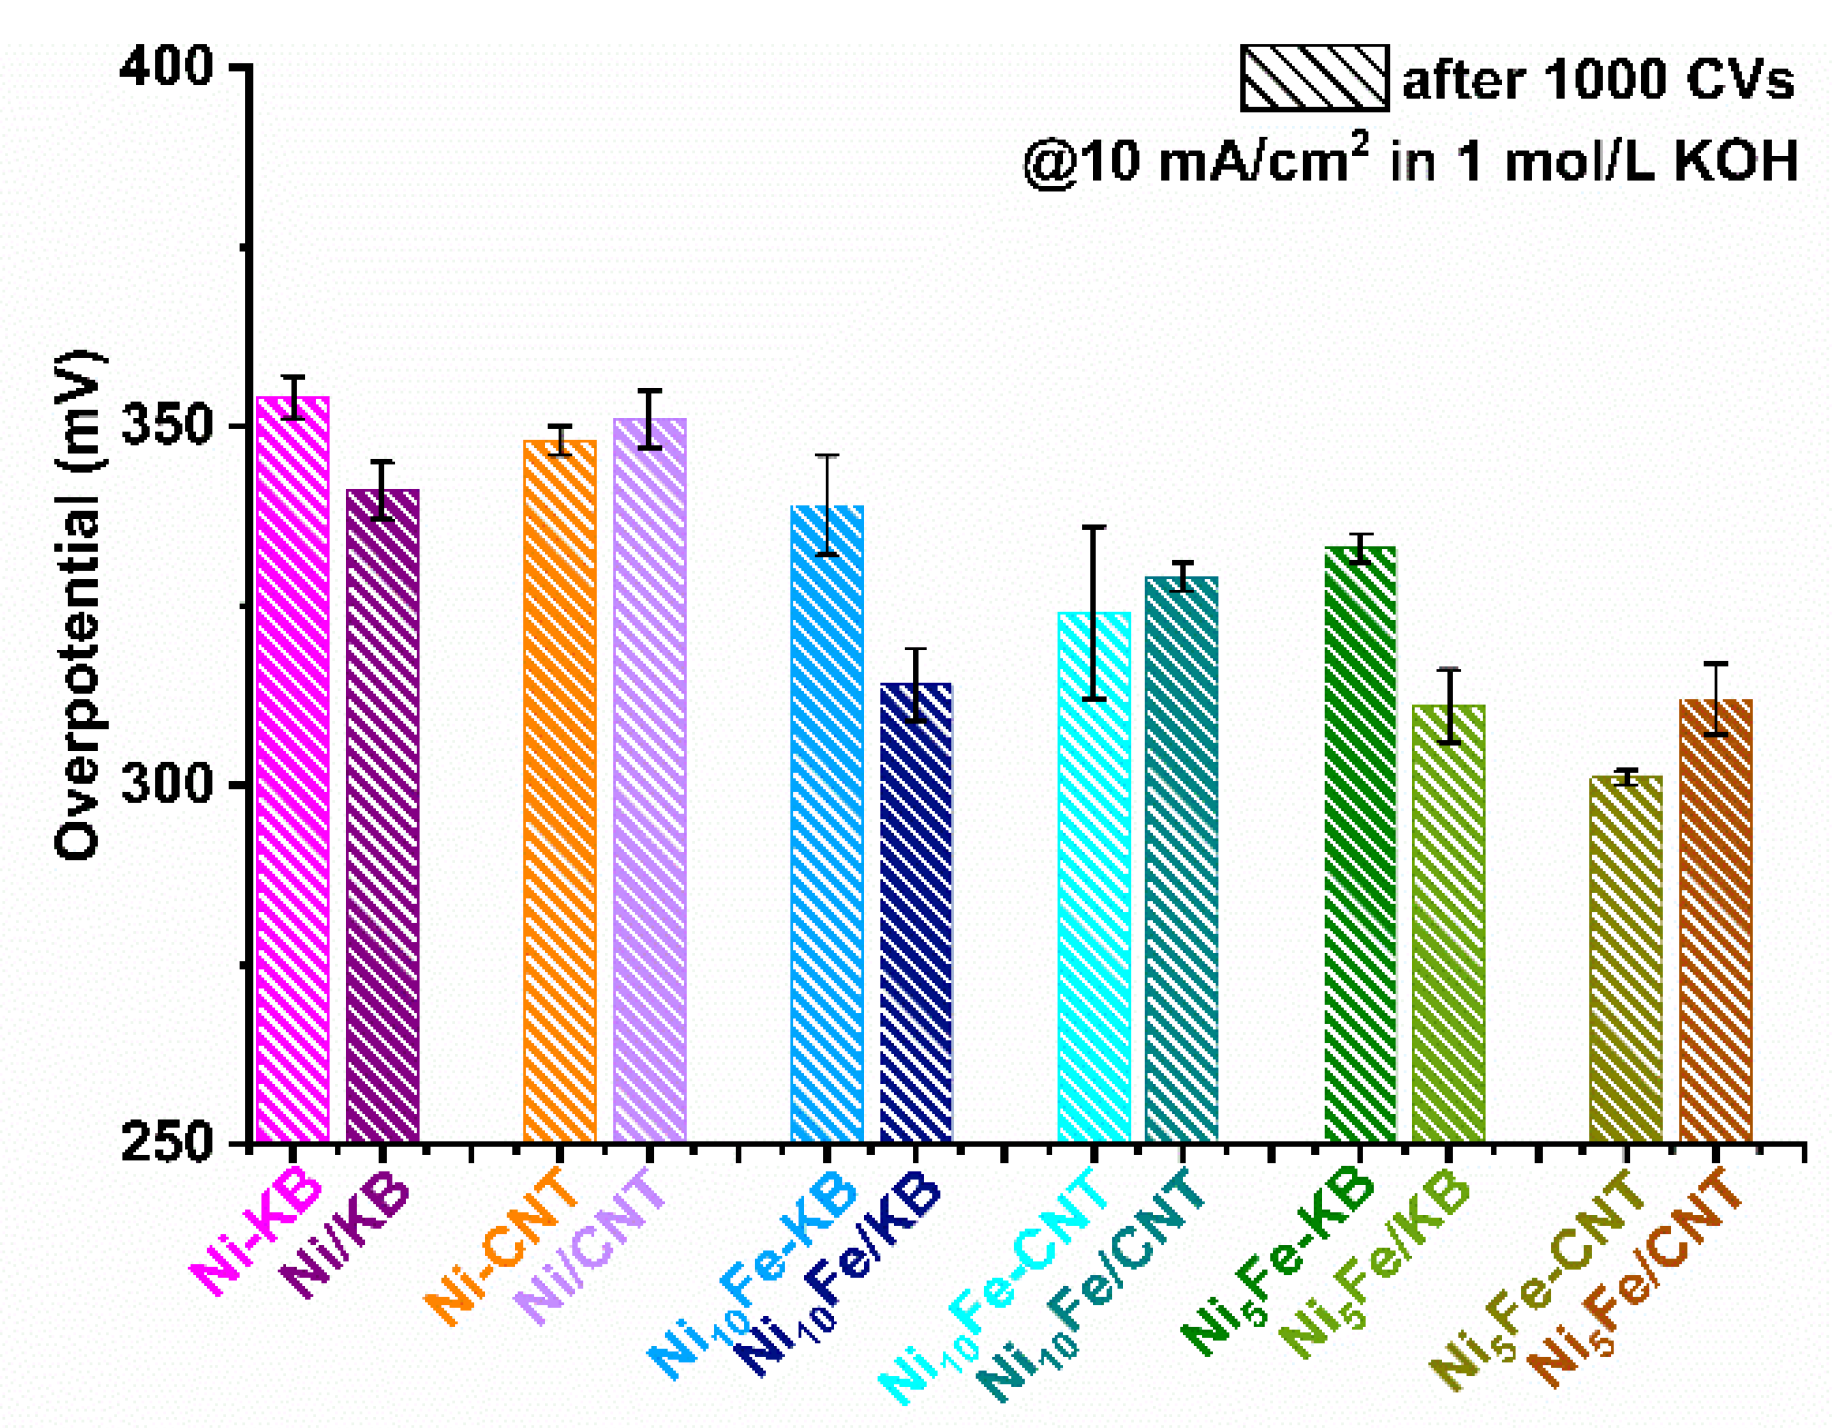
Figure 9.
Tafel plots with Tafel slope b (given in mV/dec) of (a) MOFs, in situ MOF-carbon samples and RuO2 and (b) postsynthetically mixed MOF/carbon composites.
Figure 9.
Tafel plots with Tafel slope b (given in mV/dec) of (a) MOFs, in situ MOF-carbon samples and RuO2 and (b) postsynthetically mixed MOF/carbon composites.
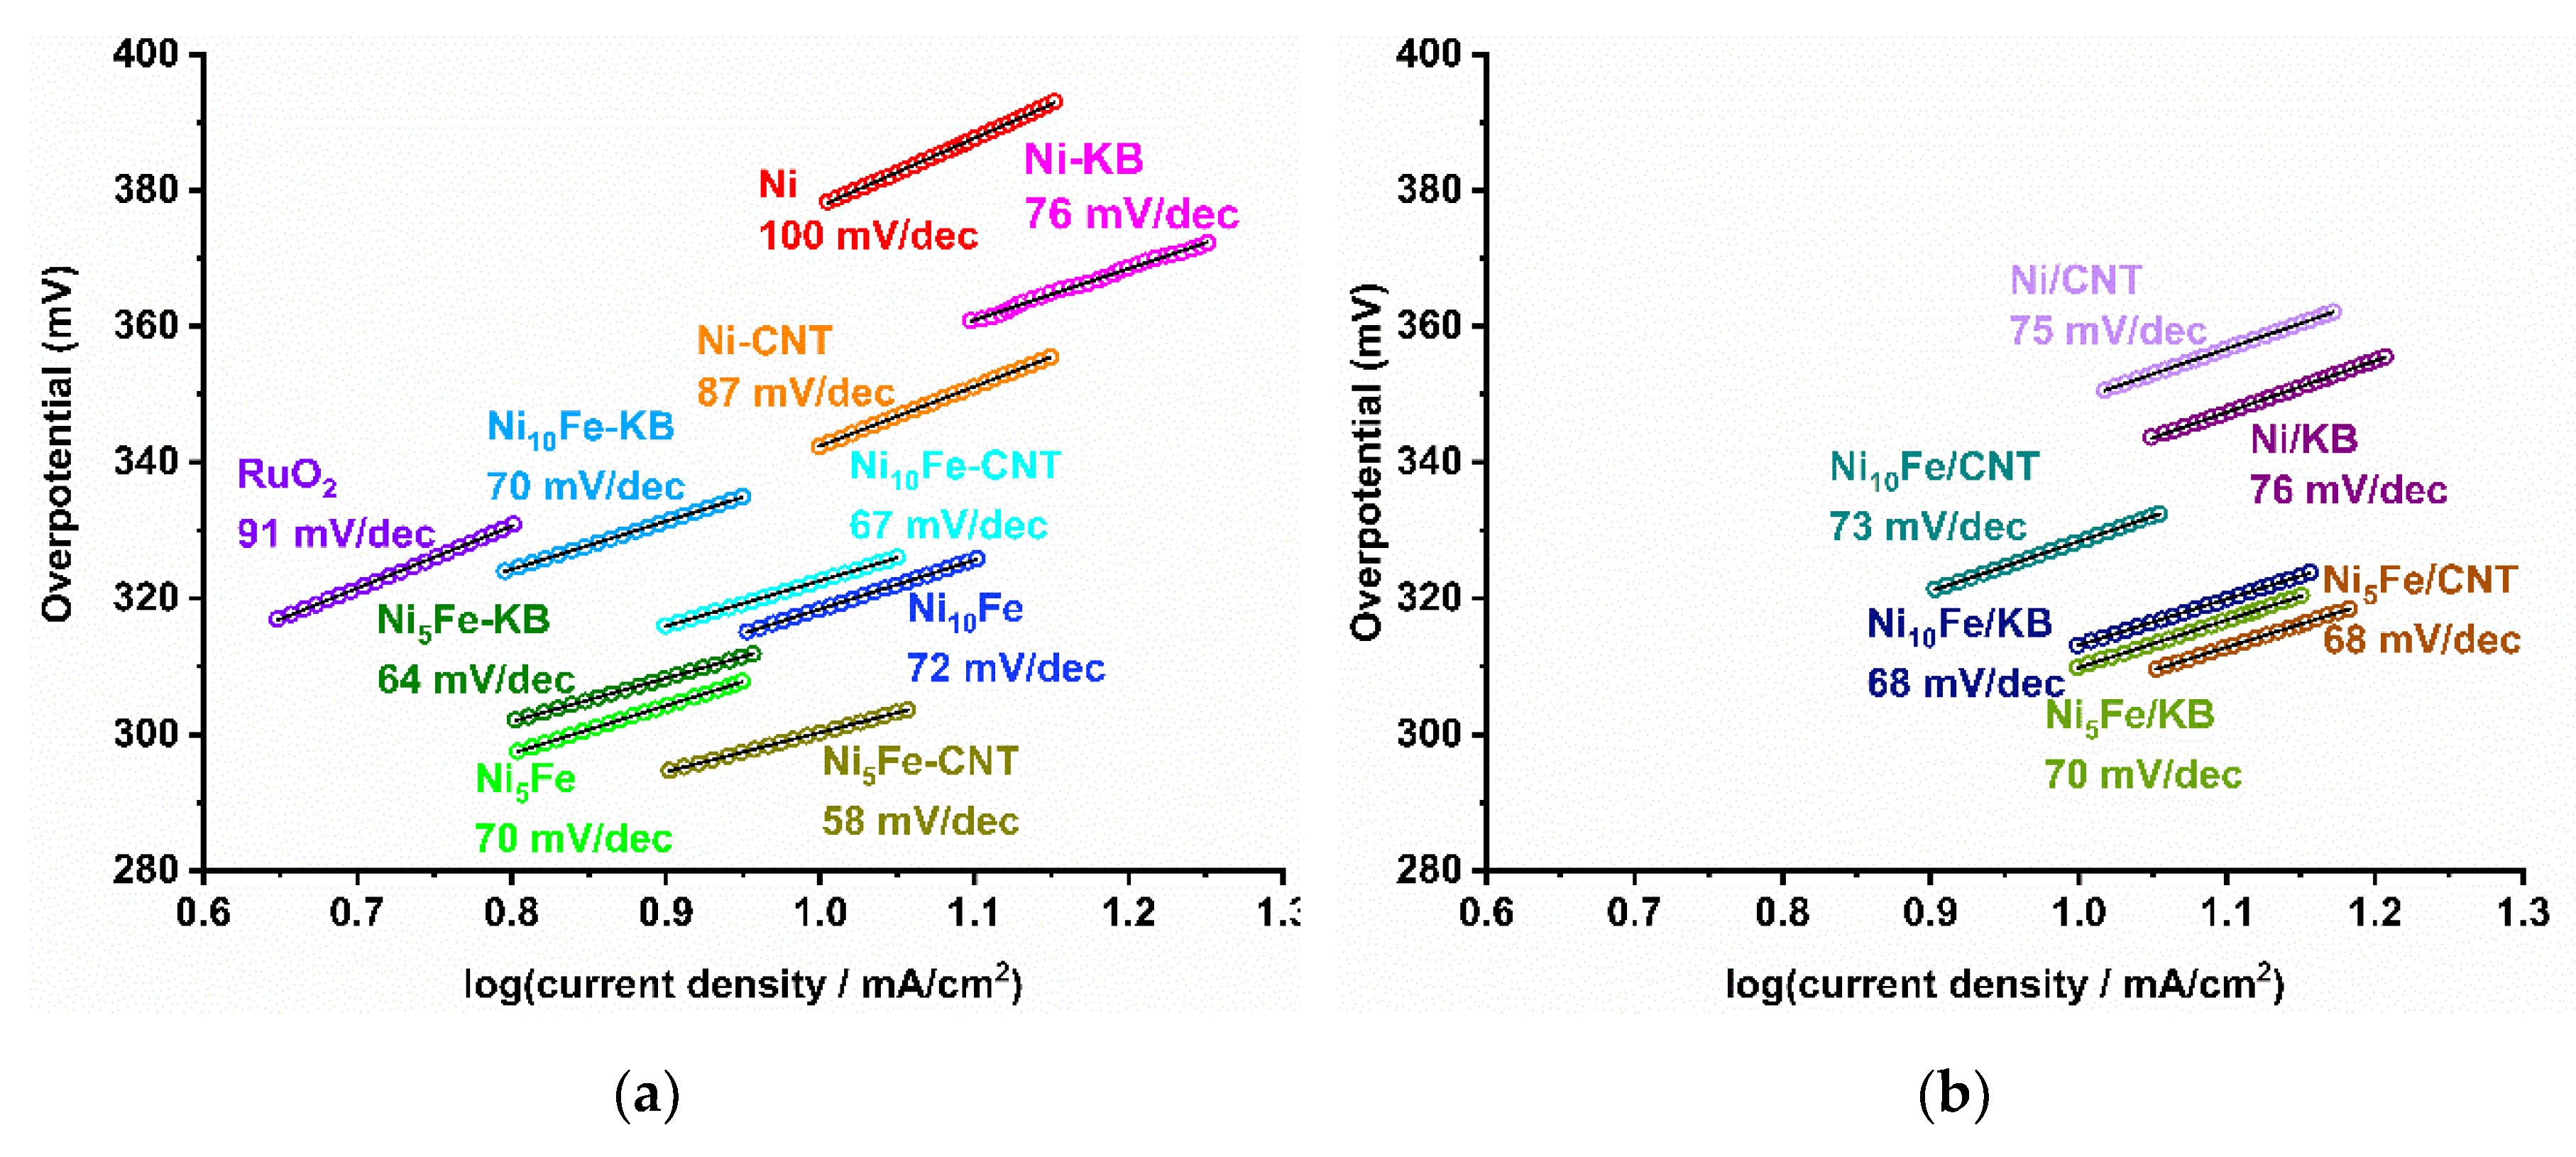
The correlation of the overpotential from the LSV curves in Figure 6 with the decadic logarithm of the current density is the Tafel plot (Figure 9 and S24a) in which the data points can be fitted by the linear Tafel equation (η = a + b × log(j) (2)) with slope b (tabulated in Table S6, SI) [69]. A smaller Tafel slope b represents a steeper increase in current density together with a smaller increase in overpotential. Both suggest a faster reaction rate and a better electrocatalytic performance [70]. The Tafel plots of RuO2 and the MOF samples are presented in Figure 9. The Tafel plot of KB and CNT is displayed in Figure S23a, SI. The smallest Tafel slope is seen for Ni5Fe-CNT with 58 mV/dec but for all MOFs and their carbon composites the Tafel slopes lie in a narrow range of 64 to 76 mV/dec, except for neat Ni-MOF (100 mV/dec) and Ni-CNT (87 mV/dec). Thus, the Tafel slopes of the NixFe-MOF carbon composites, both in-situ and postsynthetically mixed, are much smaller than for RuO2 (b = 91 mV/dec [58]) or the neat carbon materials (KB b = 134 mV/dec, CNT b = 137 mV/dec). The Tafel slopes from our study agree with published values of comparable materials such as Ni(Fe)(OH)2/KB b = 66 mV/dec [28], FeNiNH2BDC MOF@2-6 wt% CNT b = 69-84 mV/dec [55] and Ni-BTC b = 114 mV/dec [71].
The Tafel slope provides also information on the rate determining step (rds) according to eqn. (3)–(6) (M = active site) when assuming Krasil’shchikov’s OER mechanism [69,72]. The Tafel slope of 58 mV/dec for Ni5Fe-CNT and the range of Tafel slopes of 64 to 76 mV/dec for the other NixFe-MOF composites suggests that the metal hydroxide deprotonation reaction (eqn. 4) with b = 60 mV/dec is the rate limiting step.
The charge transfer resistance (RCT) gives insight into the OER kinetics. A low RCT indicates a fast charge transfer rate during a redox reaction [73]. The RCT values were obtained by electrochemical impedance spectroscopy (EIS) which was conducted at 1.5 V vs. RHE in a frequency range of 0.01 Hz to 10 kHz at an alternating current (AC) with a potential amplitude of 10 mV. The resulting Nyquist plots, fitted to a simple Randles cell model, are presented in Figure 10 and Figure S23b, SI [74]. The diameter of the displayed semi-circles give insight into the RCT value, a smaller semi-circle indicates a lower RCT and following faster OER kinetics [20,75].
Figure 10.
Nyquist plots of RuO2, pristine MOFs and (a) in situ and (b) postsynthetically mixed composites. The inset is a magnification between Re(Z) = 0 – 40 Ω.
Figure 10.
Nyquist plots of RuO2, pristine MOFs and (a) in situ and (b) postsynthetically mixed composites. The inset is a magnification between Re(Z) = 0 – 40 Ω.
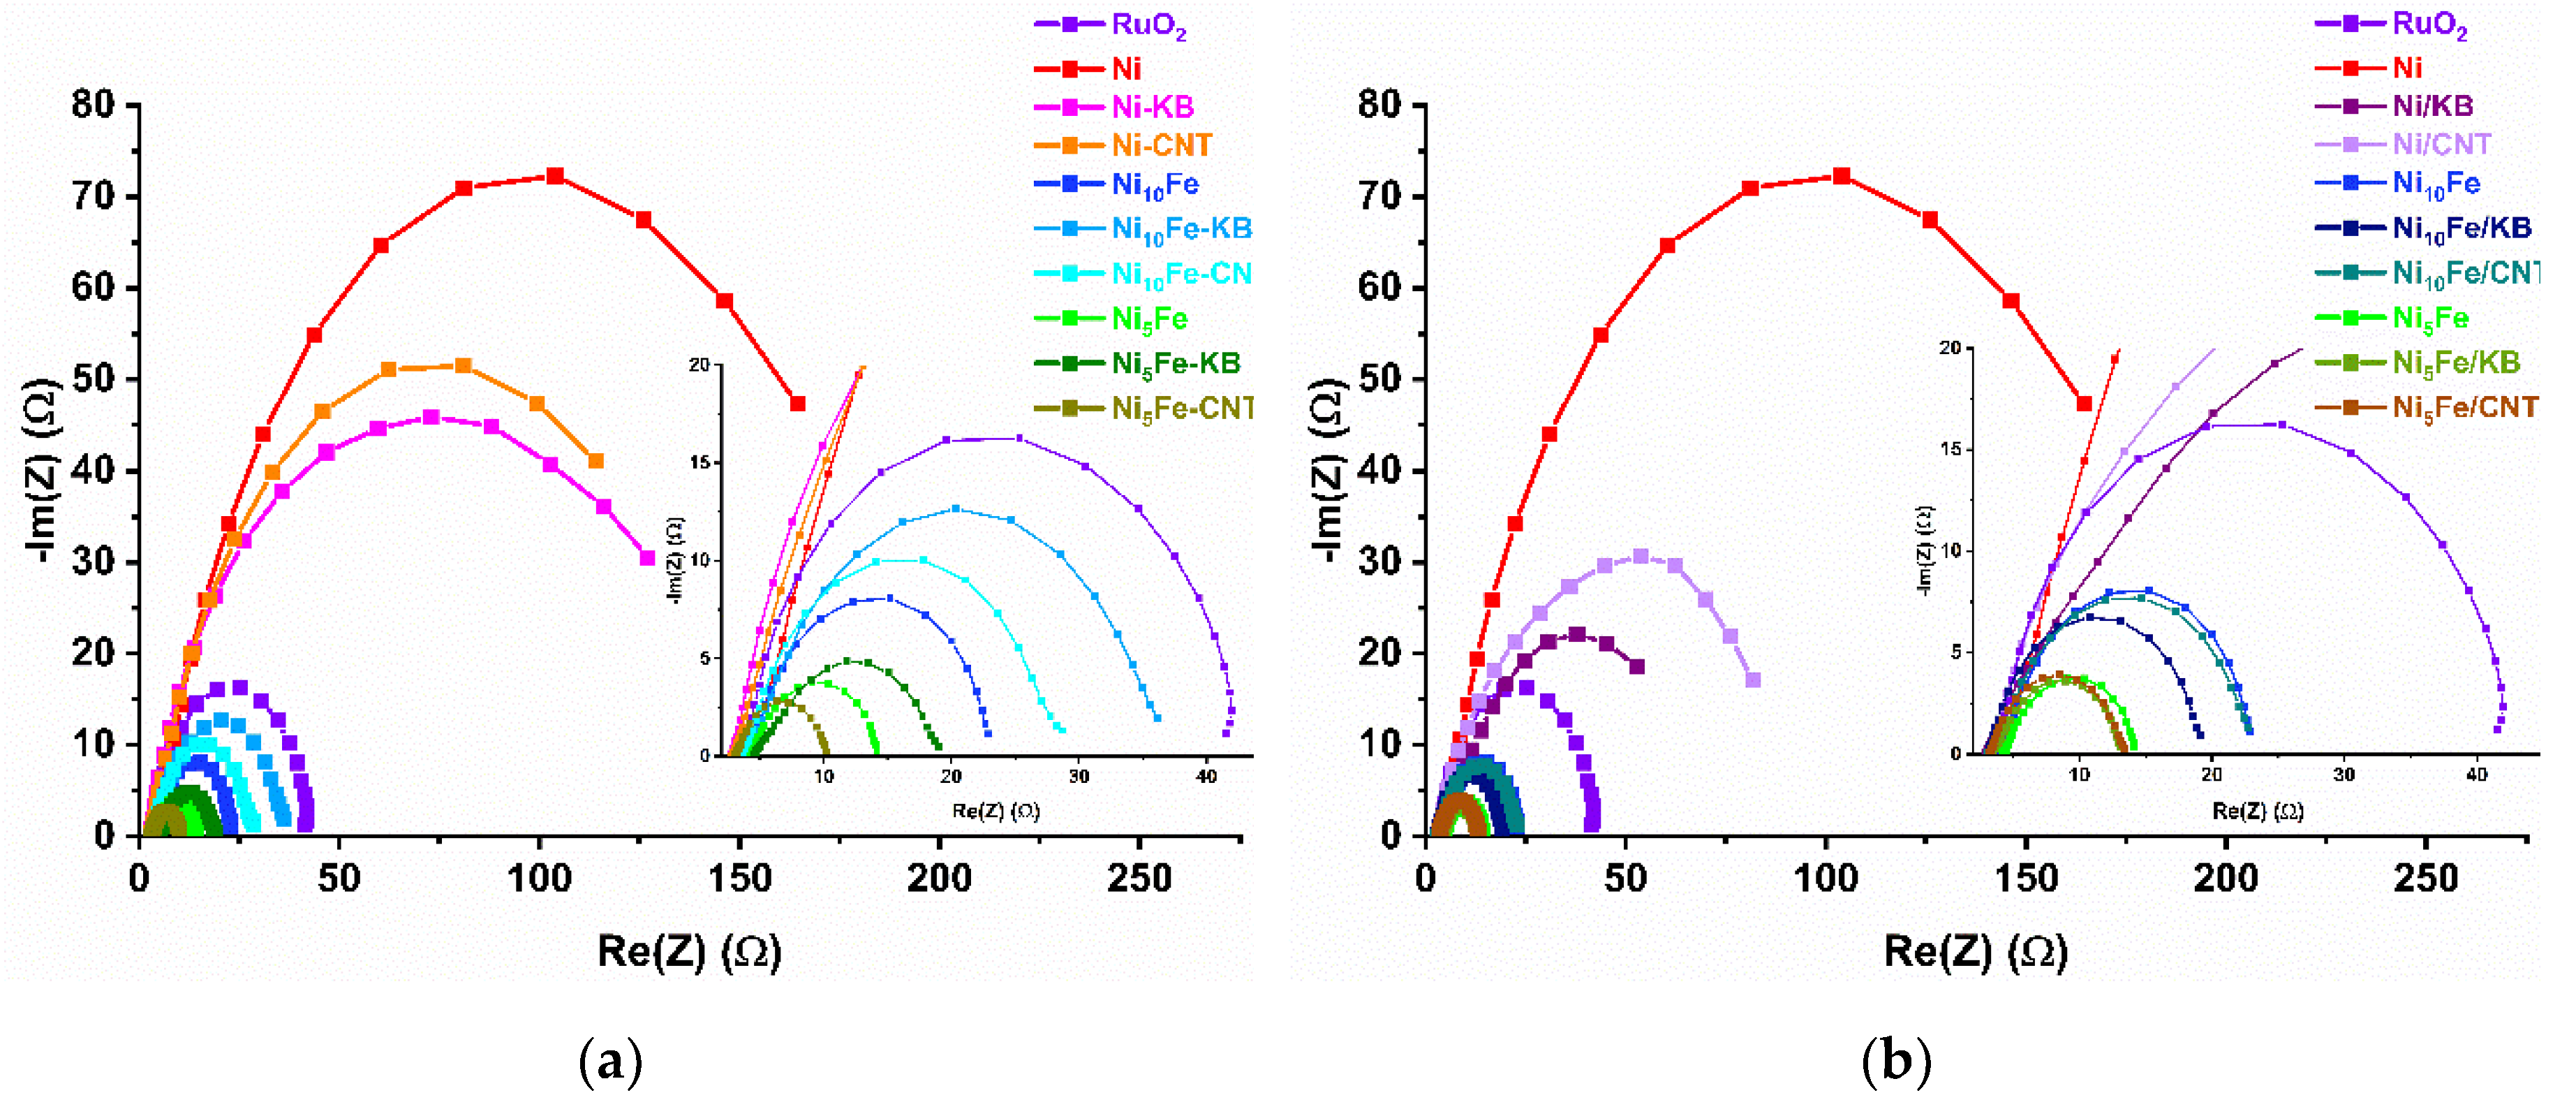
The mixed-metal NixFe-MOF samples and their carbon composites exhibit a much lower RCT values (<33 Ω) than neat Ni-MOF and its composites (RCT 80 Ω, Table S7, SI). The mixed-metal NixFe-MOF samples and their carbon composites differ primarily by the Ni:Fe ratio, with the Ni10Fe materials between 17-33 Ω and the Ni5Fe materials between 7-15 Ω, such that the carbon composites vary around the value of the neat MOF (Ni10Fe, RCT = 20 Ω and Ni5Fe, RCT = 10 Ω). Overall, the in situ synthesized Ni5Fe-CNT has the lowest RCT = 7 Ω corroborating our above low overpotential and low Tafel-slope results that assigns Ni5Fe- CNT the highest electrocatalytic OER activity. RuO2 has an RCT of 39 Ω, which matches the literature (RuO2 RCT = 40 Ω [76]).
Since the mixed-metal samples with the highest amount of iron (Ni5Fe) have the best OER performance they were further characterized with their faradaic efficiencies (FE) (using the method of Galán-Mascarós et al. [77]; see materials and methods for details). Ni5Fe-BTC achieved the highest FE with 96%, closely followed by Ni5Fe-CNT with FE = 95% and Ni5Fe-KB with FE = 94% (Table S7, SI). The postsynthetically mixed Ni5Fe/KB reached a FE of 92% and Ni5Fe/CNT a FE of 86%. All samples, with the exception of Ni5Fe/CNT (FE = 86%), attained a higher FE than RuO2 (FE = 91%) (Lit. FE ~93% [78]). The neat carbon materials KB achieved a FE of 72% and CNT a FE of 77%. A graphical illustration of the FEs is displayed in Figure S26, SI.
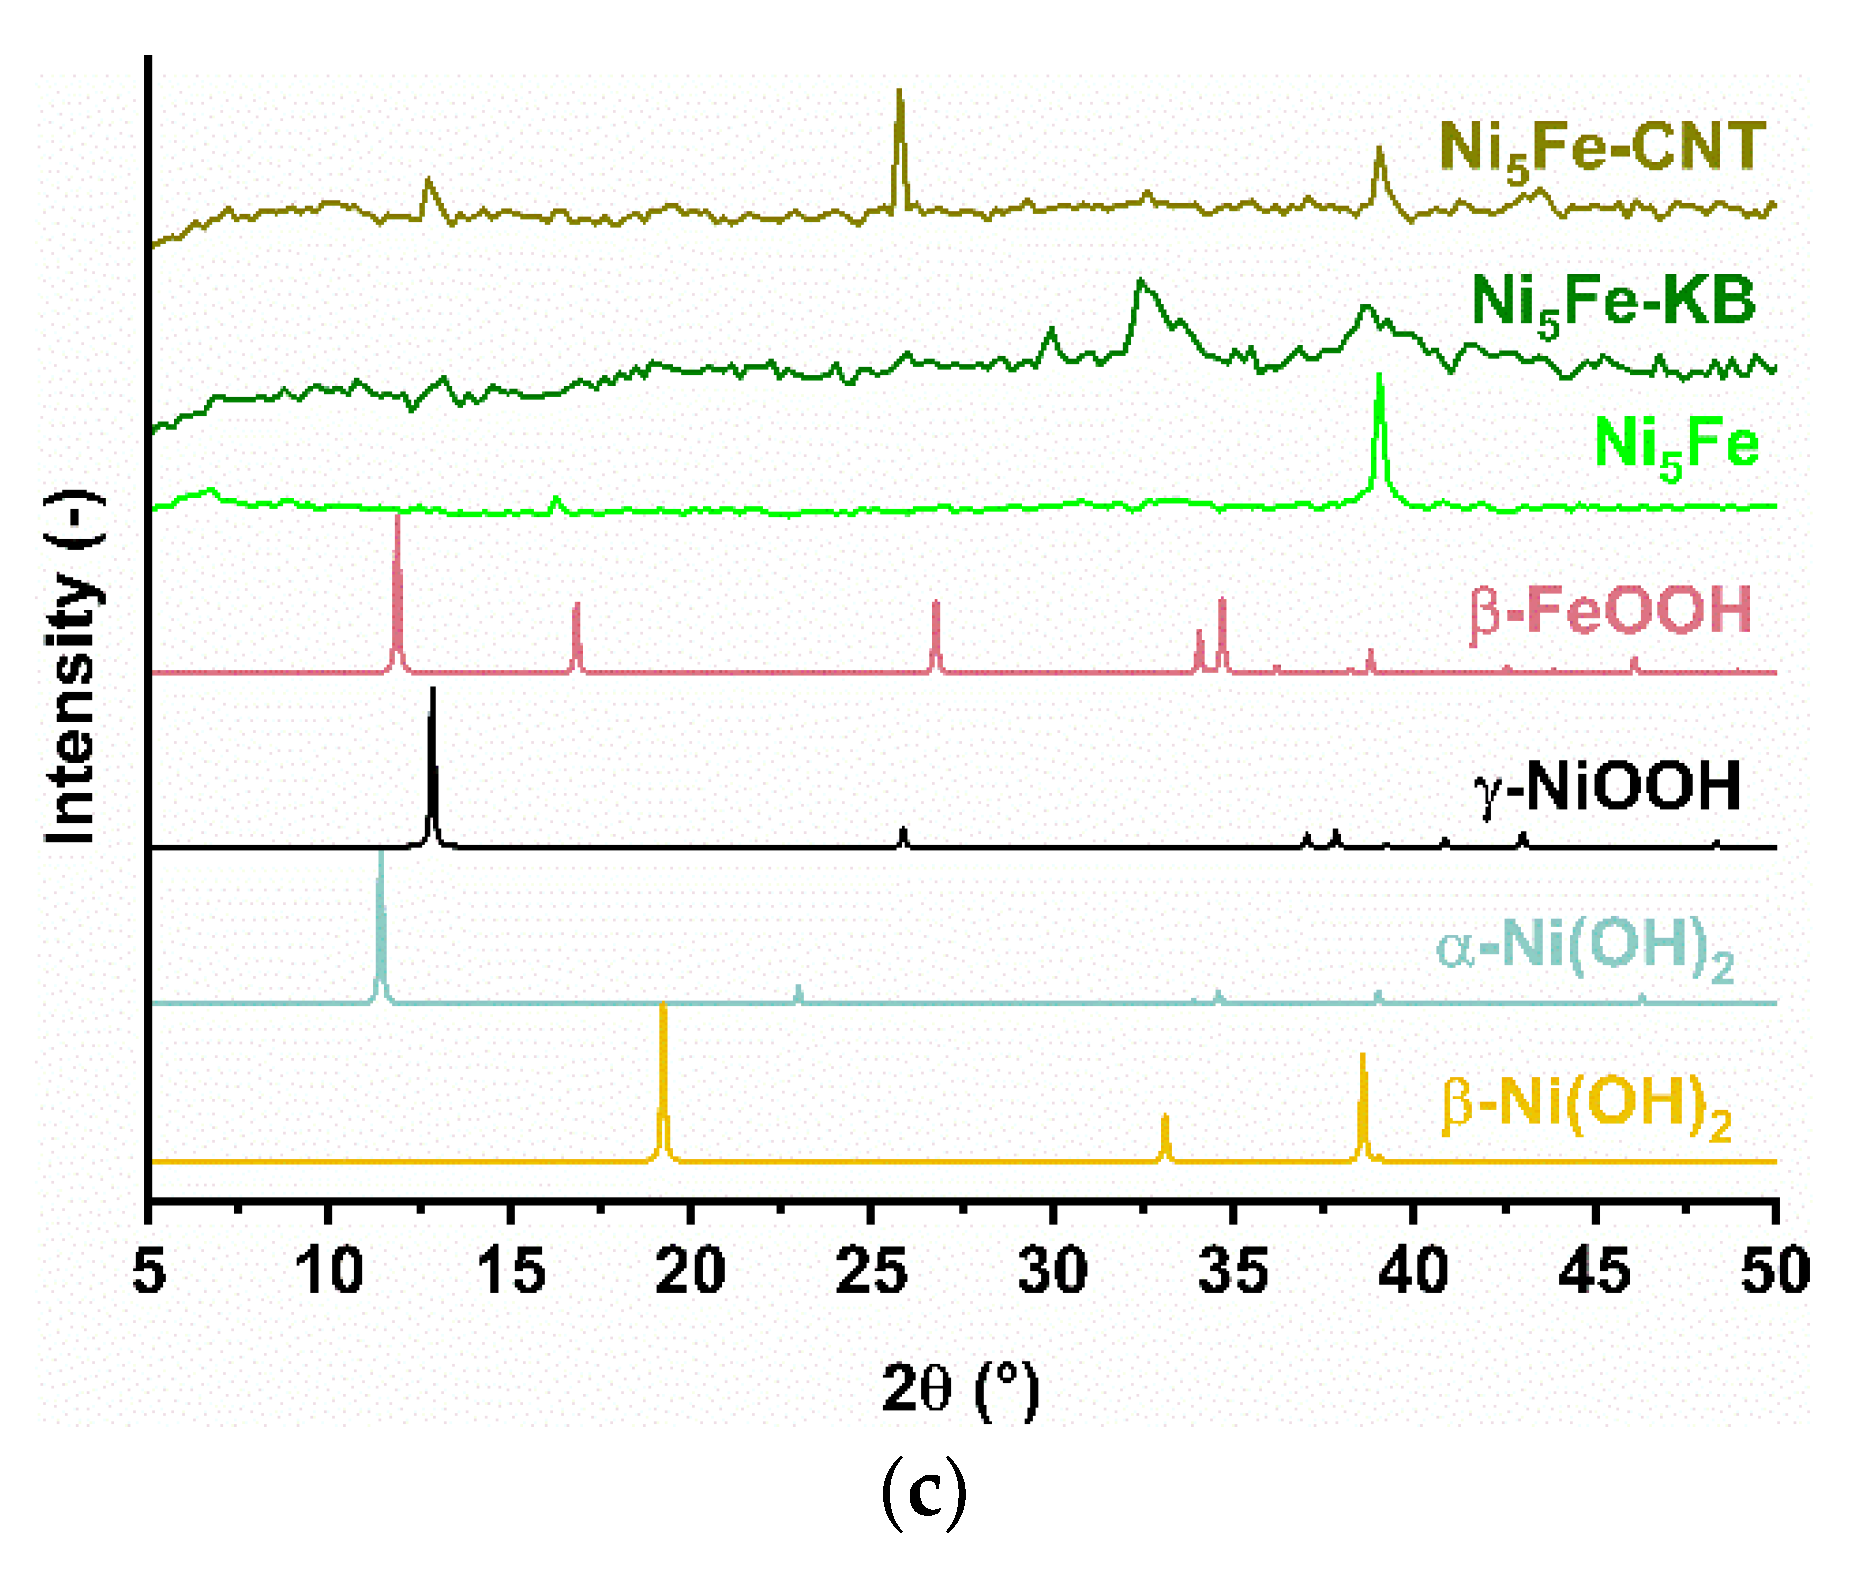
As mentioned in the introduction and at the beginning of this electrochemical section, MOFs typically act as pre-catalysts, that form the active phase (often metal (oxy)hydroxides) in the alkaline electrolyte and under the electrochemical reaction conditions due to their instability in the electrolyte medium [12,19,20,21]. The behavior of the MOFs and their carbon composites in the alkaline electrolyte was investigated through soaking the materials in 1 mol/L KOH for 24 h. In the PXRD patterns of all samples (Figure 11) a change from the MOF structure to their metal (oxy)hydroxides can be observed through reflexes, which fit to β-Ni(OH)2 (ICSD: 169978) and/or γ-NiOOH (COD: 9012319). Similar structural changes and loss of crystallinity of NixFe-MOFs and their composites were already observed in the reported literature [14,20,28,35]. Noteworthy, the crystallinity of the hydrolysis products varies strongly from largely amorphous for the Ni-MOF-carbon composites and Ni5Fe-KB to well crystalline for the Ni10Fe-MOF and its carbon composites. In a 12 h chronopotientiometric measurement a good stability of all derived electrocatalysts and RuO2 could be shown.
3. Materials and Methods
3.1. Materials
The used chemicals were obtained from commercial sources and no further purification was carried out. The carbon nanotubes were multi-walled carbon nanotubes (OD: 10-30°nm; L: 5-15°µm; 95+%) from IOLITEC Ionic Liquids Technologies GmbH (Heilbronn, Germany). Ketjenblack EC 600 JD was purchased from AkzoNobel, The Netherlands. The MOFs Ni-BTC, Ni10Fe, Ni5Fe and their carbon composites were synthesized according to our previous work NixCo-MOF work with some modifications [35].
3.2. Synthesis of the In Situ MOF-Composites
For the Ni-BTC sample 378 mg (1.3 mmol) Ni(NO3)2·6 H2O, 205 mg (0.98 mmol) H3BTC and 55 mg (0.67 mmol) 2-MeImH were dissolved in 15 mL of DMF at RT and stirred for 30 min [40]. For the in situ Ni-KB or CNT samples the same amounts were used and 10°wt% KB or CNT with respect to the educts for the MOF were added.
For the Ni10Fe sample 349 mg (1.2 mmol) Ni(NO3)2·6 H2O, 48 mg (0.11 mmol) Fe(NO3)3·9 H2O, 205 mg (0.98 mmol) H3BTC and 55 mg (0.67 mmol) 2-MeImH were dissolved in 15 mL of DMF at RT and stirred for 30 min. For the in-situ Ni10Fe-KB or -CNT samples the same amounts were used and 10°wt% CNT or KB in regards to the weighted educts for the MOF were added.
For the Ni5Fe sample 314 mg (1.08 mmol) Ni(NO3)2·6 H2O, 89 mg (0.22 mmol) Fe(NO3)3·9 H2O, 205 mg (0.98 mmol) H3BTC and 55 mg (0.67 mmol) 2-MeImH were dissolved in 15 mL of DMF at RT and stirred for 30 min. For the in-situ Ni5Fe-KB or -CNT samples the same amounts were used and 10°wt% CNT or KB in regards to the weighted educts for the MOF were added.
The prepared solutions were transferred into a Teflon-lined stainless-steel autoclave and then heated to 170 °C for 48 h. The resulting dark green (Ni-MOF), dark olive-green (Ni10Fe, Ni5Fe) and black (NixFe-KB or -CNT) precipitates were separated by centrifugation (15 min, 6000 rpm). The precipitates were washed once with DMF (15 mL, 5 h) and twice with EtOH (15 mL each, 10 h) and centrifuged again (15 min, 6000 rpm). The products were dried overnight in a vacuum drying cabinet at 120 °C and a reduced pressure of less than 50 mbar.
Yields:
Ni-MOF: 277 mg; Ni-KB: 353 mg; Ni-CNT: 318 mg
Ni10Fe: 320 mg; Ni10Fe-KB: 434 mg; Ni10Fe-CNT: 358 mg
Ni5Fe: 366 mg; Ni5Fe-KB: 430 mg; Ni5Fe-CNT: 472 mg
For the postsynthetically-mixed MOF/carbon composites, the synthesized neat MOFs were physically mixed with 10 wt% KB or CNT in regards to the weighted neat MOF amount. Specifically, 50 mg of the neat MOFs and 5.5 mg of the carbon material (KB or CNT) were mixed at 40 Hz for 20 min with a vortex mixer.
3.3. Materials Characterization
A Bruker D2 Phaser powder diffractometer (Bruker AXS, Karlsruhe, Germany) with a power of 300°W and an acceleration voltage of 30 kV at 10 mA using Cu-Kα radiation (λ = 1.5418 Å) was used to make the PXRD measurements at ambient temperature. The diffractograms were gathered on a low background flat silicon sample holder and evaluated with the Match 3.11 software. The measuring range was from 5 to 50° 2θ with a scan speed of 2 s/step and 0.057° (2θ) step size.
The FT-IR spectra were measured in KBr mode on a Bruker TENSOR 37 IR spectrometer (Bruker, Rosenheim, Germany) in the range of 4000-400 cm–1.
Nitrogen sorption isotherms were recorded with a Nova 4000e from Quantachrome (Anton Paar QuantaTec, Boynton Beach, Florida, USA) at 77 K. The sorption isotherms were analyzed with the NovaWin 11.03 software. Before the measurements the samples were activated for 5 h under vacuum (<10–2 mbar) at 120 °C. Brunauer–Emmett–Teller (BET) surface areas were determined from the adsorption branches of the isotherms and the pore size distributions were derived by non-local density functional theory (NLDFT) calculations based on N2 at 77 K on carbon with slit/cylindrical pores.
TGA was performed with a Netzsch TG 209 F3 Tarsus device (Erich NETZSCH B.V. & Co. Holding KG, Selb, Germany) equipped with an Al crucible. A heating rate of 10 K/min under a N2 atmosphere was applied for the measurements.
SEM images were acquired with a JEOL JSM-6510 LV QSEM advanced electron microscope (Jeol, Akishima, Japan) with a LaB6 cathode at 20 kV. The microscope was equipped with a Bruker Xflash 410 silicon drift detector (Bruker, Berlin, Germany) and the Bruker ESPRIT software for the EDX analysis. The Au, Cu and Zn detected in the EDX spectra can be attributed to the sputtering of the sample with gold prior to the investigation and the brass sample holder, which was utilized.
The vortex mixer, which was used to generate the postsynthetic composites, is a REAX 2000 from Heidolph (Heidolph Scientific Products GmbH, Schwabach, Germany).
3.4. Electrocatalytic Measurements
A three-electrode setup was used for the electrocatalytic measurements, which were recorded with a SP-50e potentiostat from BioLogic (BioLogic Science Instruments, Göttingen, Germany). The counter electrode was a Pt plate, the reference electrode was a reversible hydrogen electrode (RHE) from Gaskatel (Kassel, Germany), and the working electrode was an ink-coated carbon paper. A carbon paper sheet was sliced into 1x1 cm pieces. The electrocatalyst inks contained 2.5 mg of electrocatalyst, 0.5 mL ethanol and 20 μL Nafion (5 wt.%) and were sonicated for 30 min. 100 μL ink was drop-casted onto a sliced carbon paper piece (geometric area of 1 cm2), which resulted in a catalyst loading of 0.5 mg/cm2. The loading of the electrocatalyst onto the carbon paper was additionally checked with the weight gain of the carbon paper piece, which showed also a catalyst loading of 0.5 mgsample/gcarbon paper.
SEM images of the carbon paper with and without ink-coating before and after the electrochemical measurements for the mixed-metal samples in Figure S16 to S21, SI show a good adherence of the materials to the carbon paper substrate. 1 mol/L KOH was utilized as the electrolyte for all electrocatalytic measurements, which has been purged with N2 for 10 min before the electrocatalytic experiments. The samples were activated by cycling the working electrode between 1.0 V and 1.7 V vs. RHE at a scan rate of 100 mV/s for 10 cycles. The LSV polarization curves were measured in a potential range of 1.0 to 1.7 V vs. RHE at a scan rate of 5 mV/s. The cycling stability was measured by comparing activated LSV curves before and after 1000 CVs between 1–1.7 V with a scan rate of 100 mV/s. EIS data was collected in a frequency range of 0.01 Hz to 10 kHz at a potential of 1.5 V vs. RHE. Chronopotentiometry was conducted following the above mentioned electrocatalytic measurements. The current density was held at 10 mA/cm2 for 12 h. The overpotential was calculated as shown in equation 1: η = E – E° (1.23 V) – IR. The OER performance of the MOF samples and their composites were compared with commercial RuO2 (Sigma-Aldrich), multi-walled CNTs (OD: 10-30°nm; L: 5-15°µm; 95+%; IOLITEC Ionic Liquids Technologies GmbH, Heilbronn, Germany) and KB (AkzoNobel Netherlands). At least two measurements were done for each sample to determine the overpotentials, Tafel slopes and RCT in order to reduce the experimental contingency error and the averaged results were displayed in the figures and tables. All electrochemical measurements were automatically corrected with the IR.
To determine the FE the method of Galán-Mascarós et al.[77] was followed. A chronopotentiometric measurement was conducted at a fixed current density of 10 mA/cm2, while an Ocean Optics NeoFOX sensor system coupled with a FOSPOR probe was used to record the O2 level in the headspace of the electrochemical cell. The calibration of the FOSPOR probe was done through a two-point calibration with N2 atmosphere (0% O2) as one calibration point and ambient air (21% O2) as the other calibration point. Before the chronopotentiometric test the electrolyte underwent thorough deaeration by continuous purging with N2 for at least 1 h. To calculate the molar amount of O2 evolved during the electrochemical measurement, equation 7 was used, which considers ideal gas behavior:
where % O2,det is the detected percentage of oxygen measured by the FOSPOR probe (corrected by the % O2,det from a measurement without any applied current to consider the oxygen leakage from ambient air); Ptotal is 1 atm; Vgas (L) is the developed gas volume at atmospheric pressure; R is the universal gas constant (0.082 atm × L / K × mol); and T is the absolute temperature (293 K). The theoretically generated faradaic oxygen is obtained through equation 8:
where, Q (measured in Coulomb, C) stands for the total electric charge passed through the system; ne represents the needed molar amount of electrons to produce one mol of O2 (equals to 4), and F is the Faraday constant (96485 C/mol). The FE (expressed in percentage) is determined by equation 9:
nO2,exp = (% O2,det × Ptotal × Vgas / R × T) / 100
nO2,far = Q / ne × F
FE = 100 × nO2,exp / nO2,far
4. Conclusions
In this work a series of Ni-, mixed-metal NixFe-MOFs and their composites with the carbon materials ketjenblack, KB and carbon nanotubes, CNT were synthesized both in situ through a simple one-pot solvothermal reaction which contains the MOF precursors and the carbon material or postsynthetically mixed from the prepared MOF and carbon material. The in situ synthesized MOF-carbon composites were fully characterized concerning the successful MOF formation in the presence of carbon. As seen before, in the alkaline electrochemical environment, the MOFs act as precursors to the actual metal (oxide)hydroxide catalysts and provide an intimate mixture of the mixed metals and with the carbon material on the nanoscale in the derived catalyst material. The carbon materials KB and CNT increase the low electrical conductivity of the derived metal (oxide)hydroxide electrocatalysts. All of the tested Ni10Fe- and Ni5Fe-MOF-carbon electrocatalysts outperformed the RuO2 benchmark, whereas the nickel-only Ni-BTC and its carbon composite was similar or worse as RuO2. Thus, through an increasing amount of Fe the electrocatalytic activity regarding the OER could be improved. Concerning the assessed comparison of the in situ and postsynthetic preparation of the MOF mixtures with KB and CNT for KB the postsynthetic materials and for CNT the in situ ones have the lower overpotential while the Tafel slopes, charge transfer resistance RCT and faradaic efficiency are rather similar. Evidently, no clear advantage can be seen for one type of MOF-carbon composite formation over the other, although a large number of experiments were carried out. At the same time, the addition of Fe to neat Ni-BTC had a significant effect on reducing the overpotential, Tafel slope and charge transfer resistance. The best performing MOF-derived electrocatalyst came from in situ synthesized Ni5Fe-CNT with an overpotential (η) of 301 mV (RuO2 η = 354 mV), a Tafel slope (b) of 58 mV/dec (RuO2 b = 91 mV/dec), a charge transfer resistance (Rct) of 7 Ω (RuO2 Rct= 39 Ω) and a faradaic efficiency (FE) of 95% (RuO2 FE = 91%) but the postsynthetic materials Ni5Fe/KB and /CNT were close behind. Yet, for the composite of Ni10Fe with KB the postsynthetic mixture performed significantly better in terms of overpotential and RCT than the in situ material (314 vs 339 mV and 17 vs 33 Ω, respectively) which shows that the type of mixing can still present an additional improvement. Future research could take the effect on the OER activity of in situ and postsynthetically mixed composites with a higher amount of KB or CNT into account and other carbon materials could be further added to the comparison.
Supplementary Materials
The following supporting information can be downloaded at the website of this paper posted on Preprints.org, Section S1: Ni-BTC structure; Section S2: Energy-dispersive X-ray spectroscopy (EDX) from scanning electron microscopy (SEM); Section S3: Scanning electron microscopy (SEM); Section S4: Powder X-ray diffraction (PXRD); Section S5: Thermogravimetric analysis (TGA); Section S6: Fourier transform infrared (FT-IR) spectroscopy; Section S7: Porosity related parameters derived from N2-soprtion measurements; Section S8: Electrochemical Data; Section S9: References.
Author Contributions
Conceptualization, C.J. and L.S.; Methodology, L.S.; Validation, L.S.; Formal analysis, L.S.; Investigation, L.S., L.V, A.V. and T.S.; Resources, C.J.; Data Curation, L.V. and L.S.; Writing-Original Draft, L.S.; Writing-Review & Editing, C.J.; Visualization, L.S.; Supervision, C.J.; Project administration, C.J.; Funding acquisition, C.J. All authors have read and agreed to the published version of the manuscript.
Funding
The research was funded by the Deutsche Forschungsgemeinschaft (DFG) within the Priority Program SPP 1928/2 COORNETs (grant Ja466/43-1).
Institutional Review Board Statement
Not applicable.
Informed Consent Statement
Not applicable.
Data Availability Statement
The data presented in this study are available on request from the corresponding author.
Acknowledgments
The authors thank Birgit Tommes for carrying out the FTIR experiments.
Conflicts of Interest
The authors declare that they have no known competing financial interests or personal relationships that could have appeared to influence the work reported in this paper.
References
- Xin, Y.; Hua, Q; Li, C.; Zhu, H.; Gao, L.; Ren, X.; Yang, P.; Liu, A. Enhancing electrochemical performance and corrosion resistance of nickel-based catalysts in seawater electrolysis: focusing on OER and HER. J. Mater. Chem. A 2024, 12, 23147–23178. [CrossRef]
- Wei, C.; Rao, R.R.; Peng, J.; Huang, B.; Stephens, I.E.L.; Risch, M.; Xu, Z.J.; Shao-Horn, Y. Recommended Practices and Benchmark Activity for Hydrogen and Oxygen Electrocatalysis in Water Splitting and Fuel Cells. Adv. Mater. 2019, 31, 1806296. [Google Scholar] [CrossRef] [PubMed]
- Chen, Y.; Rui, K.; Zhu, J.; Dou, S. X.; Sun, W. Recent Progress on Nickel-Based Oxide/(Oxy)Hydroxide Electrocatalysts for the Oxygen Evolution Reaction. Chem. Eur. J. 2019, 25, 703–713. [Google Scholar] [CrossRef] [PubMed]
- Zhang, K.; Zou, R. Advanced Transition Metal-Based OER Electrocatalysts: Current Status, Opportunities, and Challenges. Small 2021, 17, 2100129. [Google Scholar] [CrossRef] [PubMed]
- Over, H. Fundamental Studies of Planar Single-Crystalline Oxide Model Electrodes (RuO2, IrO2) for Acidic Water Splitting. ACS Catal. 2021, 11, 8848–8871. [Google Scholar] [CrossRef]
- McCrory, C.C.L.; Jung, S.; Ferrer, I.M.; Chatman, S.M.; Peters, J.C.; Jaramillo, T.F. Benchmarking Hydrogen Evolving Reaction and Oxygen Evolving Reaction Electrocatalysts for Solar Water Splitting Devices. J. Am. Chem. Soc. 2015, 137, 4347–4357. [Google Scholar] [CrossRef]
- Sun, H.; Jung, W. Recent advances in doped ruthenium oxides as high-efficiency electrocatalysts for the oxygen evolution reaction. J. Mater. Chem. A, 2021, 9, 15506–15521. [Google Scholar] [CrossRef]
- Zhao, Z; Shao, Q.; Xue, J.; Huang, B.; Niu, Z; Gu, H; Huang, X.; Lang, J. Multiple structural defects in ultrathin NiFe-LDH nanosheets synergistically and remarkably boost water oxidation reaction. Nano Res. 2022, 15, 310–316. [CrossRef]
- Liang, Q.; Bieberle-Hütter, A.; Brocks, G. Anti-Ferromagnetic RuO2: A Stable and Robust OER Catalyst over a Large Range of Surface Terminations. J. Phys. Chem. C 2022, 126, 1337–1345. [Google Scholar] [CrossRef]
- Cong, N.; Han, Y.; Tan, L.; Zhai, C.; Chen, H.; Han, J.; Fang, H.; Zhou, X.; Zhu, Y.; Ren, Z. Nanoporous RuO2 characterized by RuO(OH)2 surface phase as an efficient bifunctional catalyst for overall water splitting in alkaline solution. J. Electroanal. Chem. 2021, 881, 114955. [Google Scholar] [CrossRef]
- Wang, C.; Jin, L.; Shang, H.; Xu, H.; Y. Shiraishi; Du, Y. Advances in engineering RuO2 electrocatalysts towards oxygen evolution reaction. Chin. Chem. Lett. 2021, 32, 2108–2116. [Google Scholar] [CrossRef]
- Xie, S.; Yan, Y.; Lai, S.; He, J.; Liu, Z.; Gao, B.; Javanbakht, M.; Peng, X.; Chu, P.K. Ni3+-enriched nickel-based electrocatalysts for superior electrocatalytic water oxidation. Appl. Surf. Sci. 2022, 605, 154743. [Google Scholar] [CrossRef]
- Cherevkoa, S.; Geigera, S.; Kasiana, O.; Kulyka, N.; Grote, J.-P.; Savan, A.; Ratna Shrestha, B.; Merzlikin, S.; Breitbach, B.; Ludwig, A.; Mayrhofer, K. J.J. Oxygen and hydrogen evolution reactions on Ru, RuO2, Ir, and IrO2 thin film electrodes in acidic and alkaline electrolytes: A comparative study on activity and stability. Catal. Today 2016, 262, 170–180. [Google Scholar] [CrossRef]
- Beglau, T. H. Y.; Rademacher, L.; Oestreich, R.; Janiak, C. Synthesis of Ketjenblack Decorated Pillared Ni(Fe) Metal-Organic Frameworks as Precursor Electrocatalysts for Enhancing the Oxygen Evolution Reaction. Molecules 2023, 28, 4464. [Google Scholar] [CrossRef]
- Burke, M. S.; Enman, L. J.; Batchellor, A. S.; Zou, S.; Boettcher, S. W. Oxygen Evolution Reaction Electrocatalysis on Transition Metal Oxides and (Oxy)hydroxides: Activity Trends and Design Principles. Chem. Mater. 2015, 27, 7549–7558. [Google Scholar] [CrossRef]
- Martirez, J. M. P.; Carter, E. A. Unraveling Oxygen Evolution on Iron-Doped β-Nickel Oxyhydroxide: The Key Role of Highly Active Molecular-like Sites. J. Am. Chem. Soc. 2019, 141, 693–705. [Google Scholar] [CrossRef]
- Wartner, G.; Hein, D.; Bergmann, A.; Wendt, R.; Roldan Cuenya, B.; Seidel, R. Insights into the electronic structure of Fe–Ni thin-film catalysts during the oxygen evolution reaction using operando resonant photoelectron spectroscopy. J. Mater. Chem. A, 2023, 11, 8066–8080. [Google Scholar] [CrossRef]
- Mohammed-Ibrahim, J. A review on NiFe-based electrocatalysts for efficient alkaline oxygen evolution reaction. J. Power Sources 2020, 448, 227375. [Google Scholar] [CrossRef]
- Zheng, W.; Lee, L. Y. S. Metal–Organic Frameworks for Electrocatalysis: Catalyst or Precatalyst? ACS Energy Lett. 2021, 6, 2838–2843. [Google Scholar] [CrossRef]
- Abdpour, S.; Fetzer, M. N. A.; Oestreich, R.; Beglau, T. H. Y.; Boldog, I.; Janiak, C. Bimetallic CPM-37(Ni,Fe) metal–organic framework: enhanced porosity, stability and tunable composition. Dalton Trans., 2024, 53, 4937–4951. [Google Scholar] [CrossRef]
- Son, Y. J.; Kim, S.; Leung, V.; Kawashima, K.; Noh, J.; Kim, K.; Marquez, R. A.; Carrasco-Jaim, O. A.; Smith, L. A.; Celio, H.; Milliron, D. J.; Korgel, B. A.; Buddie Mullins, C. Effects of Electrochemical Conditioning on Nickel-Based Oxygen Evolution Electrocatalysts ACS Catal. 2022, 12, 10384−10399. [CrossRef]
- Lee, J.-S.; Park, G. S.; Lee, H. I.; Kim, S. T.; Cao, R.: Liu, M.; Cho, J. Ketjenblack Carbon Supported Amorphous Manganese Oxides Nanowires as Highly Efficient Electrocatalyst for Oxygen Reduction Reaction in Alkaline Solutions. Nano Lett. 2011, 11, 5362–5366. [Google Scholar] [CrossRef]
- Lin, C.; He, X.; Li, H.; Zou, J.; Que, M.; Tian; J.; Qian, Y. Tunable metal–organic framework nanoarrays on carbon cloth constructed by a rational self-sacrificing template for efficient and robust oxygen evolution reactions. CrystEngComm 2021, 23, 7090–7096. [Google Scholar] [CrossRef]
- Arul, P.; Abraham John, S. Size controlled synthesis of Ni-MOF using polyvinylpyrrolidone: New electrode material for the trace level determination of nitrobenzene. J. Electroanal. Chem. 2018, 829, 168–176. [Google Scholar] [CrossRef]
- Pérez-López, B.; Merkoçi, A. Carbon nanotubes and graphene in analytical sciences. Microchim. Acta 2012, 179, 1–16. [Google Scholar] [CrossRef]
- Li, J.; Zhou, Z.; Liu, K.; Li, F.; Peng, Z.; Tang, Y.; Wang, H. Co3O4/Co-N-C modified ketjenblack carbon as an advanced electrocatalyst for Al-air batteries. J. Power Sources 2017, 343, 30e38. [Google Scholar] [CrossRef]
- Pritchard, G. Plastic Additives, Springer-Science + Business Media, Dordrecht, 1998. [CrossRef]
- Öztürk, S.; Moon, G.; Spieß, A.; Budiyanto, E.; Roitsch, S.; Tüysüz, H.; Janiak, C. A Highly-Efficient Oxygen Evolution Electrocatalyst Derived from a Metal-Organic Framework and Ketjenblack Carbon Material. ChemPlusChem 2021, 86, 1106–1115. [Google Scholar] [CrossRef]
- Kinloch, I. A.; Suhr, J.; Lou, J.; Young R., J.; Ajayan, P. M. Composites with carbon nanotubes and graphene: An outlook. Science 2018, 362, 547–553. [Google Scholar] [CrossRef]
- Dinadayalane, T. C.; Leszczynski, J. Remarkable diversity of carbon–carbon bonds: structures and properties of fullerenes, carbon nanotubes, and graphene. Struct. Chem. 2010, 21, 1155–1169. [Google Scholar] [CrossRef]
- Sonia, S. K.; Thomasa, B.; Karb, V. R. A comprehensive review on CNTs and CNT-reinforced composites: syntheses, characteristics and applications. Mater. Today Commun. 2020, 25, 101546. [Google Scholar] [CrossRef]
- Li, C.; Zhang, H.; Liu, M.; Lang, F.-F.; Pang, J.; Bu, X.-H. Recent progress in metal–organic frameworks (MOFs) for electrocatalysis Ind. Chem. Mater., 2023, 1, 9–38. [Google Scholar] [CrossRef]
- Li, S.; Gao, Y.; Li, N.; Ge, L.; Bu, X.; Feng, P. Transition metal-based bimetallic MOFs and MOF-derived catalysts for electrochemical oxygen evolution reaction Energy Environ. Sci., 2021, 14, 1897–1927. [Google Scholar] [CrossRef]
- Zhou, Y.; Abazari, R.; Chen, J.; Tahir, M.; Kumar, A.; Ramadhan Ikreedeegh, R.; Rani, E.; Singh, H.; Kirillov, A. M. Bimetallic metal–organic frameworks and MOF-derived composites: Recent progress on electro- and photoelectrocatalytic applications Coord. Chem. Rev. 2022, 451, 214264. [Google Scholar] [CrossRef]
- Sondermann, L.; Jiang, W.; Shviro, M.; Spieß, A.; Woschko, D.; Rademacher, L.; Janiak, C. Nickel-based metal-organic frameworks as electrocatalysts for the oxygen evolution reaction (OER). Molecules 2022, 27, 1241. [Google Scholar] [CrossRef]
- Wang, Z.; Huang, J.; Mao, J.; Guo, Q.; Chen, Z.; Lai, Y. Metal–organic frameworks and their derivatives with graphene composites: preparation and applications in electrocatalysis and photocatalysis J. Mater. Chem. A, 2020, 8, 2934–2961. [Google Scholar] [CrossRef]
- Kiran, S.; Yasmeen, G.; Shafiq, Z.; Abbas, A.; Manzoor, S.; Hussain, D.; Adel Pashameah, R.; Alzahrani, E. ; Alanazi; A. K.; Naeem Ashiq, M. Nickel-based nitrodopamine MOF and its derived composites functionalized with multi-walled carbon nanotubes for efficient OER applications Fuel, 2023, 331, 125881. [Google Scholar] [CrossRef]
- Azadfalah, M.; Sedghi, A.; Hosseini, H.; Saber Mirhosseini, S. Synergic effect of physically-mixed metal organic framework based electrodes as a high efficient material for supercapacitors J. Energy Storage 2021, 44, 103248. [Google Scholar] [CrossRef]
- Yin, H.-J.; Yuan, K.; Zheng, Y.-L.; Sun, X.-C.; Zhang, Y.W. In Situ Synthesis of NiO/CuO Nanosheet Heterostructures Rich in Defects for Efficient Electrocatalytic Oxygen Evolution Reaction J. Phys. Chem. C 2021, 125, 16516–16523. [Google Scholar] [CrossRef]
- Maniam, P.; Stock, N. Investigation of Porous Ni-Based Metal-Organic Frameworks Containing Paddle-Wheel Type Inorganic Building Units via High-Throughput Methods. Inorg. Chem. 2011, 50, 5085–5097. [Google Scholar] [CrossRef]
- Qiao, H.; Yang, Y.; Dai, X.; Zhao, H.; Yong, J.; Yu, L.; Luan, X.; Cui, M.; Zhang, X. ; Huang. X. Amorphous (Fe)Ni-MOF-derived hollow (bi)metal/oxide@N-graphene polyhedron as effectively bifunctional catalysts in overall alkaline Electrochimica Acta 2019, 318, 430–439. [Google Scholar] [CrossRef]
- Kodjie, S. L.; Li, L.; Li, B.; Cai, W.; Li, C. Y.; Keating, M. Morphology and Crystallization Behavior of HDPE/CNT Nanocomposite J. Macromol. Sci. B, 45:2, 231–245. [CrossRef]
- Wang, C.; Zhou, M.; Ma, Y.; Tan, H.; Wang, Y.; Li, Y. Hybridized Polyoxometalate-Based Metal Organic Framework with Ketjenblack for the Nonenzymatic Detection of H2O2. Chem. Asian, J. 2018, 13, 2054–2059. [Google Scholar] [CrossRef]
- Carpenter, B. P.; Talosig, A. R.; Rose, B.; Di Palma, G.; Patterson, J. P. Understanding and controlling the nucleation and growth of metal–organic frameworks Chem. Soc. Rev., 2023, 52, 6918–6937. [Google Scholar] [CrossRef]
- Mazlan, N. A; Butt, F. S.; Lewis, A.; Yang, Y.; Yang, S.; Huang, Y. The Growth of Metal–Organic Frameworks in the Presence of Graphene Oxide: A Mini Review Membranes 2022, 12, 501. 12. [CrossRef]
- Li, K.; Liu, Q.; Cheng, H.; Hu, M.; Zhang, S. Classification and carbon structural transformation from anthracite to natural coaly graphite by XRD, Raman spectroscopy, and HRTEM. Spectrochim. Acta Part A 2021, 249, 119286. [Google Scholar] [CrossRef] [PubMed]
- Li, Z.Q.; Lu, C.J.; Xia, Z.P.; . Zhou, Y.; Luo, Z. X-ray diffraction patterns of graphite and turbostratic carbon Carbon 2007, 45, 1686–1695. [CrossRef]
- Wade, C. R.; Dincă, M. Investigation of the synthesis, activation, and isosteric heats of CO2 adsorption of the isostructural series of metal–organic frameworks M3(BTC)2 (M = Cr, Fe, Ni, Cu, Mo, Ru). Dalton Trans. 2012, 41, 7931–7938. [Google Scholar] [CrossRef] [PubMed]
- Zhang, M.; Hu, D.; Xu, Z.; Liu, B.; Boubeche, M.; Chen, Z.; Wang, Y.; Luo, H.; Yan, K. Facile synthesis of Ni-, Co-, Cu-metal organic frameworks electrocatalyst boosting for hydrogen evolution reaction. J. Mater. Sci. Technol. 2021, 72, 172–179. [Google Scholar] [CrossRef]
- Manyani, N.; Siwatch, P.; Rana, S.; Sharma, K.; Tripathi, S.K. Study of electrochemical behaviour of binder-free nickel metal-organic framework derived by benzene-1,3,5-tricarboxylic acid for supercapacitor electrode Mater. Res. Bull., 2023, 165, 112320. [Google Scholar] [CrossRef]
- Israr, F.; Chun, D.; Kim, Y.; Kim, D. K. High yield synthesis of Ni-BTC metal–organic framework with ultrasonic irradiation: Role of polar aprotic DMF solvent. Ultrason. Sonochem. 2016, 31, 93–101. [Google Scholar] [CrossRef]
- Meier, H.; Bienz, S.; Bigler, L.; Fox, T. Spektroskopische Methoden in der organischen Chemie, 9th ed.; Georg Thieme, Stuttgart, Germany, 2016.
- Pretsch, E.; Bühlmann, P.; Badertscher, M. Spektroskopische Daten Zur Strukturaufklärung organischer Verbindungen, 5th ed.; Springer: Berlin/Heidelberg, Germany, 2010. [Google Scholar]
- Wu, Y.; Song, X.; Li, S.; Zhang, J.; Yang, X.; Shen, P.; Gao, L.; Wei, R.; Zhang, J.; Xiao, G. 3D-monoclinic M–BTC MOF (M = Mn, Co, Ni) as highly efficient catalysts for chemical fixation of CO2 into cyclic carbonates. J. Ind. Eng. Chem. 2018, 58, 296–303. [Google Scholar] [CrossRef]
- Yaqoob, L.; Noor, T.; Iqbal, N.; Nasir, H.; Zaman, N.; Talha, K. Electrochemical synergies of Fe–Ni bimetallic MOF CNTs catalyst for OER in water splitting. J. Alloys Compd. 2021, 850, 156583. [Google Scholar] [CrossRef]
- Vuong, G.-T.; Pham, M.-H.; Do, T.-O. Synthesis and engineering porosity of a mixed metal Fe2Ni MIL-88B metal–organic framework. Dalton Trans. 2013, 42, 550–557. [Google Scholar] [CrossRef]
- Chau, N. T. K.; Chung, Y.-M. Ethylene oligomerization over mesoporous FeNi-BTC catalysts: Effect of the textural properties of the catalyst on the reaction performance Mol. Catal. 2023, 541, 113094. [Google Scholar] [CrossRef]
- Beglau, T. H. Y.; Fei, Y.; Janiak, C. Microwave-Assisted Ultrafast Synthesis of Bimetallic Nickel- Cobalt Metal-Organic Frameworks for Application in the Oxygen Evolution Reaction Chem. Eur. J. 2024, 30, e202401644. [Google Scholar] [CrossRef]
- Thommes, M.; Kaneko, K.; Neimark, A.V.; Olivier, J.P.; Rodriguez-Reinoso, F.; Rouquerol, J.; Sing, K.S.W. Physisorption of gases, with special reference to the evaluation of surface area and pore size distribution (IUPAC Technical Report). Pure Appl. Chem. 2015, 87, 1051–1069. [Google Scholar] [CrossRef]
- Eletskiĭ, A. V. Sorption properties of carbon nanostructures Physics–Uspekhi 2004, 47, 1119–1154. [CrossRef]
- Gan, Q.; He, H.; Zhao, K.; He, Z.; Liu, S. Morphology-dependent electrochemical performance of Ni-1,3,5-benzenetricarboxylate metal-organic frameworks as an anode material for Li-ion batteries. J. Colloid Interface Sci. 2018, 530, 127–136. [Google Scholar] [CrossRef] [PubMed]
- Yang, L.; Zhu, G.; Wen, H.; Guan, X.; Sun, X.; Feng, H.; Tian, W.; Zheng, D.; Cheng, X.; Yao, Y. Constructing a highly oriented layered MOF nanoarray from a layered double hydroxide for efficient and long-lasting alkaline water oxidation electrocatalysis J. Mater. Chem. A 2019, 7, 8771–8776. [Google Scholar] [CrossRef]
- Dolgopolova, E. A.; Brandt, A. J.; Ejegbavwo, O. A.; Duke, A. S.; Maddumapatabandi, T. D.; Galhenage, R. P.; Larson, B. W.; Reid, O. G.; Ammal, S. C.; Heyden, A.; Chandrashekhar, M.; Stavila, V.; Chen, D. A.; Shustova, N. B. Electronic Properties of Bimetallic Metal−Organic Frameworks (MOFs): Tailoring the Density of Electronic States through MOF Modularity J. Am. Chem. Soc. 2017, 139, 5201–5209. [Google Scholar] [CrossRef]
- Zhao, S.; Wang, Y.; Dong, J.; He, C.-T.; Yin, H.; An, P.; Zhao, K.; Zhang, X.; Gao, C.; Zhang, L.; Lv, J.; Wang, J.; Zhang, J.; Khattak, A. M.; Khan, N. A.; Wei, Z.; Zhang, J.; Liu, S.; Zhao, H.; Tang, Z. Ultrathin metal–organic framework nanosheets for electrocatalytic oxygen evolution Nat. Energy 2016, 1, 16184. [Google Scholar] [CrossRef]
- Senthil Raja, D.; Lin, H.-W.; Lu, S.-Y. Synergistically well-mixed MOFs grown on nickel foam as highly efficient durable bifunctional electrocatalysts for overall water splitting at high current densities Nano Energy 2019, 57, 1–13. [CrossRef]
- Wu, Y.; Zhao, M.-J.; Li, F.; Xie, J.; Li, Y.; He, J.-B. Trace Fe Incorporation into Ni-(oxy)hydroxide Stabilizes Ni3+ Sites for Anodic Oxygen Evolution: A Double Thin-Layer Study Langmuir 2020, 36, 5126–5133. [CrossRef]
- Li, X; Wei, D. ; Li, M.; Wang, Y. Unveiling the real active sites of Ni based metal organic framework electrocatalysts for the oxygen evolution reaction Electrochimica Acta 2020, 354, 136682. [CrossRef]
- Enman, L. J.; Burke, M. S.; Batchellor, A. S.; Boettcher, S. W. Effects of Intentionally Incorporated Metal Cations on the Oxygen Evolution Electrocatalytic Activity of Nickel (Oxy)hydroxide in Alkaline Media ACS Catal. 2016, 6, 2416–2423. [CrossRef]
- Beglau, T. H. Y.; Fetzer, M. N. A.; Boldog, I.; Heinen, T.; Suta, M.; Janiak, C.; Yücesan, G. Exceptionally Stable And Super-Efficient Electrocatalysts Derived From Semiconducting Metal Phosphonate Frameworks Chem. Eur. J. 2024, 30, e202302765. [Google Scholar] [CrossRef]
- Raveendran, A.; Chandran, M.; Dhanusuraman, R. A comprehensive review on the electrochemical parameters and recent material development of electrochemical water splitting electrocatalysts RSC Adv. 2023, 13, 3843–3876. [CrossRef]
- Naik Shreyanka, S.; Theerthagiri, J.; Lee, S. J.; Yu, Y.; Choi, M. Y Multiscale design of 3D metal–organic frameworks (M-BTC, M: Cu, Co, Ni) via PLAL enabling bifunctional electrocatalysts for robust overall water splitting. Chem. Eng. J 2022, 446, 137045. [Google Scholar] [CrossRef]
- Matsumoto, Y.; Sato, E. Electrocatalytic properties of transition metal oxides for oxygen evolution reaction. Mater. Chem. Phys. 1986, 14, 397–426. [Google Scholar] [CrossRef]
- Sánchez, Y. P.; Santos, A.; Bueno, P. R. Quantum Mechanical Meaning of the Charge Transfer Resistance J. Phys. Chem. C 2022, 126, 3151–3162. [Google Scholar] [CrossRef]
- Simić, M.; Stavrakis A. K., Stojanović, G. M. A Low-Complexity Method for Parameter Estimation of the Simplified Randles Circuit With Experimental Verification IEEE Sens. J., 2021, 21, 24209–24217. 2021, 21, 24209–24217. [CrossRef]
- Anantharaj, S.; Noda, S. Appropriate Use of Electrochemical Impedance Spectroscopy in Water Splitting Electrocatalysis ChemElectroChem 2020, 7, 2297–2308. [CrossRef]
- Ma, H.; Liu, C.; Liao, J.; Su, Y.; Xue, X. , Xing, W. Study of ruthenium oxide catalyst for electrocatalytic performance in oxygen evolution J. Mol. Catal. A: Chem. 2006, 247, 7–13. [Google Scholar] [CrossRef]
- Yu, J.; Giancola, S.; Khezri, B.; Nieto-Castro, D.; Redondo, J.; Schiller, F.; Barja, S.; Spadaro, M. C.; Arbiol, J.; Garcés-Pineda, F.A.; Galán-Mascarós, J. R. A survey of Earth-abundant metal oxides as oxygen evolution electrocatalysts in acidic media (pH <1) EES Catal., 2023, 1, 765–773. [CrossRef]
- Jiang, R.; Tran, D.T.; Li, J.; Chu, D. Ru@RuO2 Core-Shell Nanorods: A Highly Active and Stable Bifunctional Catalyst for Oxygen Evolution and Hydrogen Evolution Reactions Energy Environ. Mater. 2019, 2, 201–208. [CrossRef]
Figure 1.
Schematic illustration of the (a) in situ MOF composite synthesis and (b) postsynthetic MOF composite formation. The building unit and packing diagram of the parent Ni-MOF (Ni-BTC) are shown in Figure S1, Supporting Information (SI).
Figure 1.
Schematic illustration of the (a) in situ MOF composite synthesis and (b) postsynthetic MOF composite formation. The building unit and packing diagram of the parent Ni-MOF (Ni-BTC) are shown in Figure S1, Supporting Information (SI).
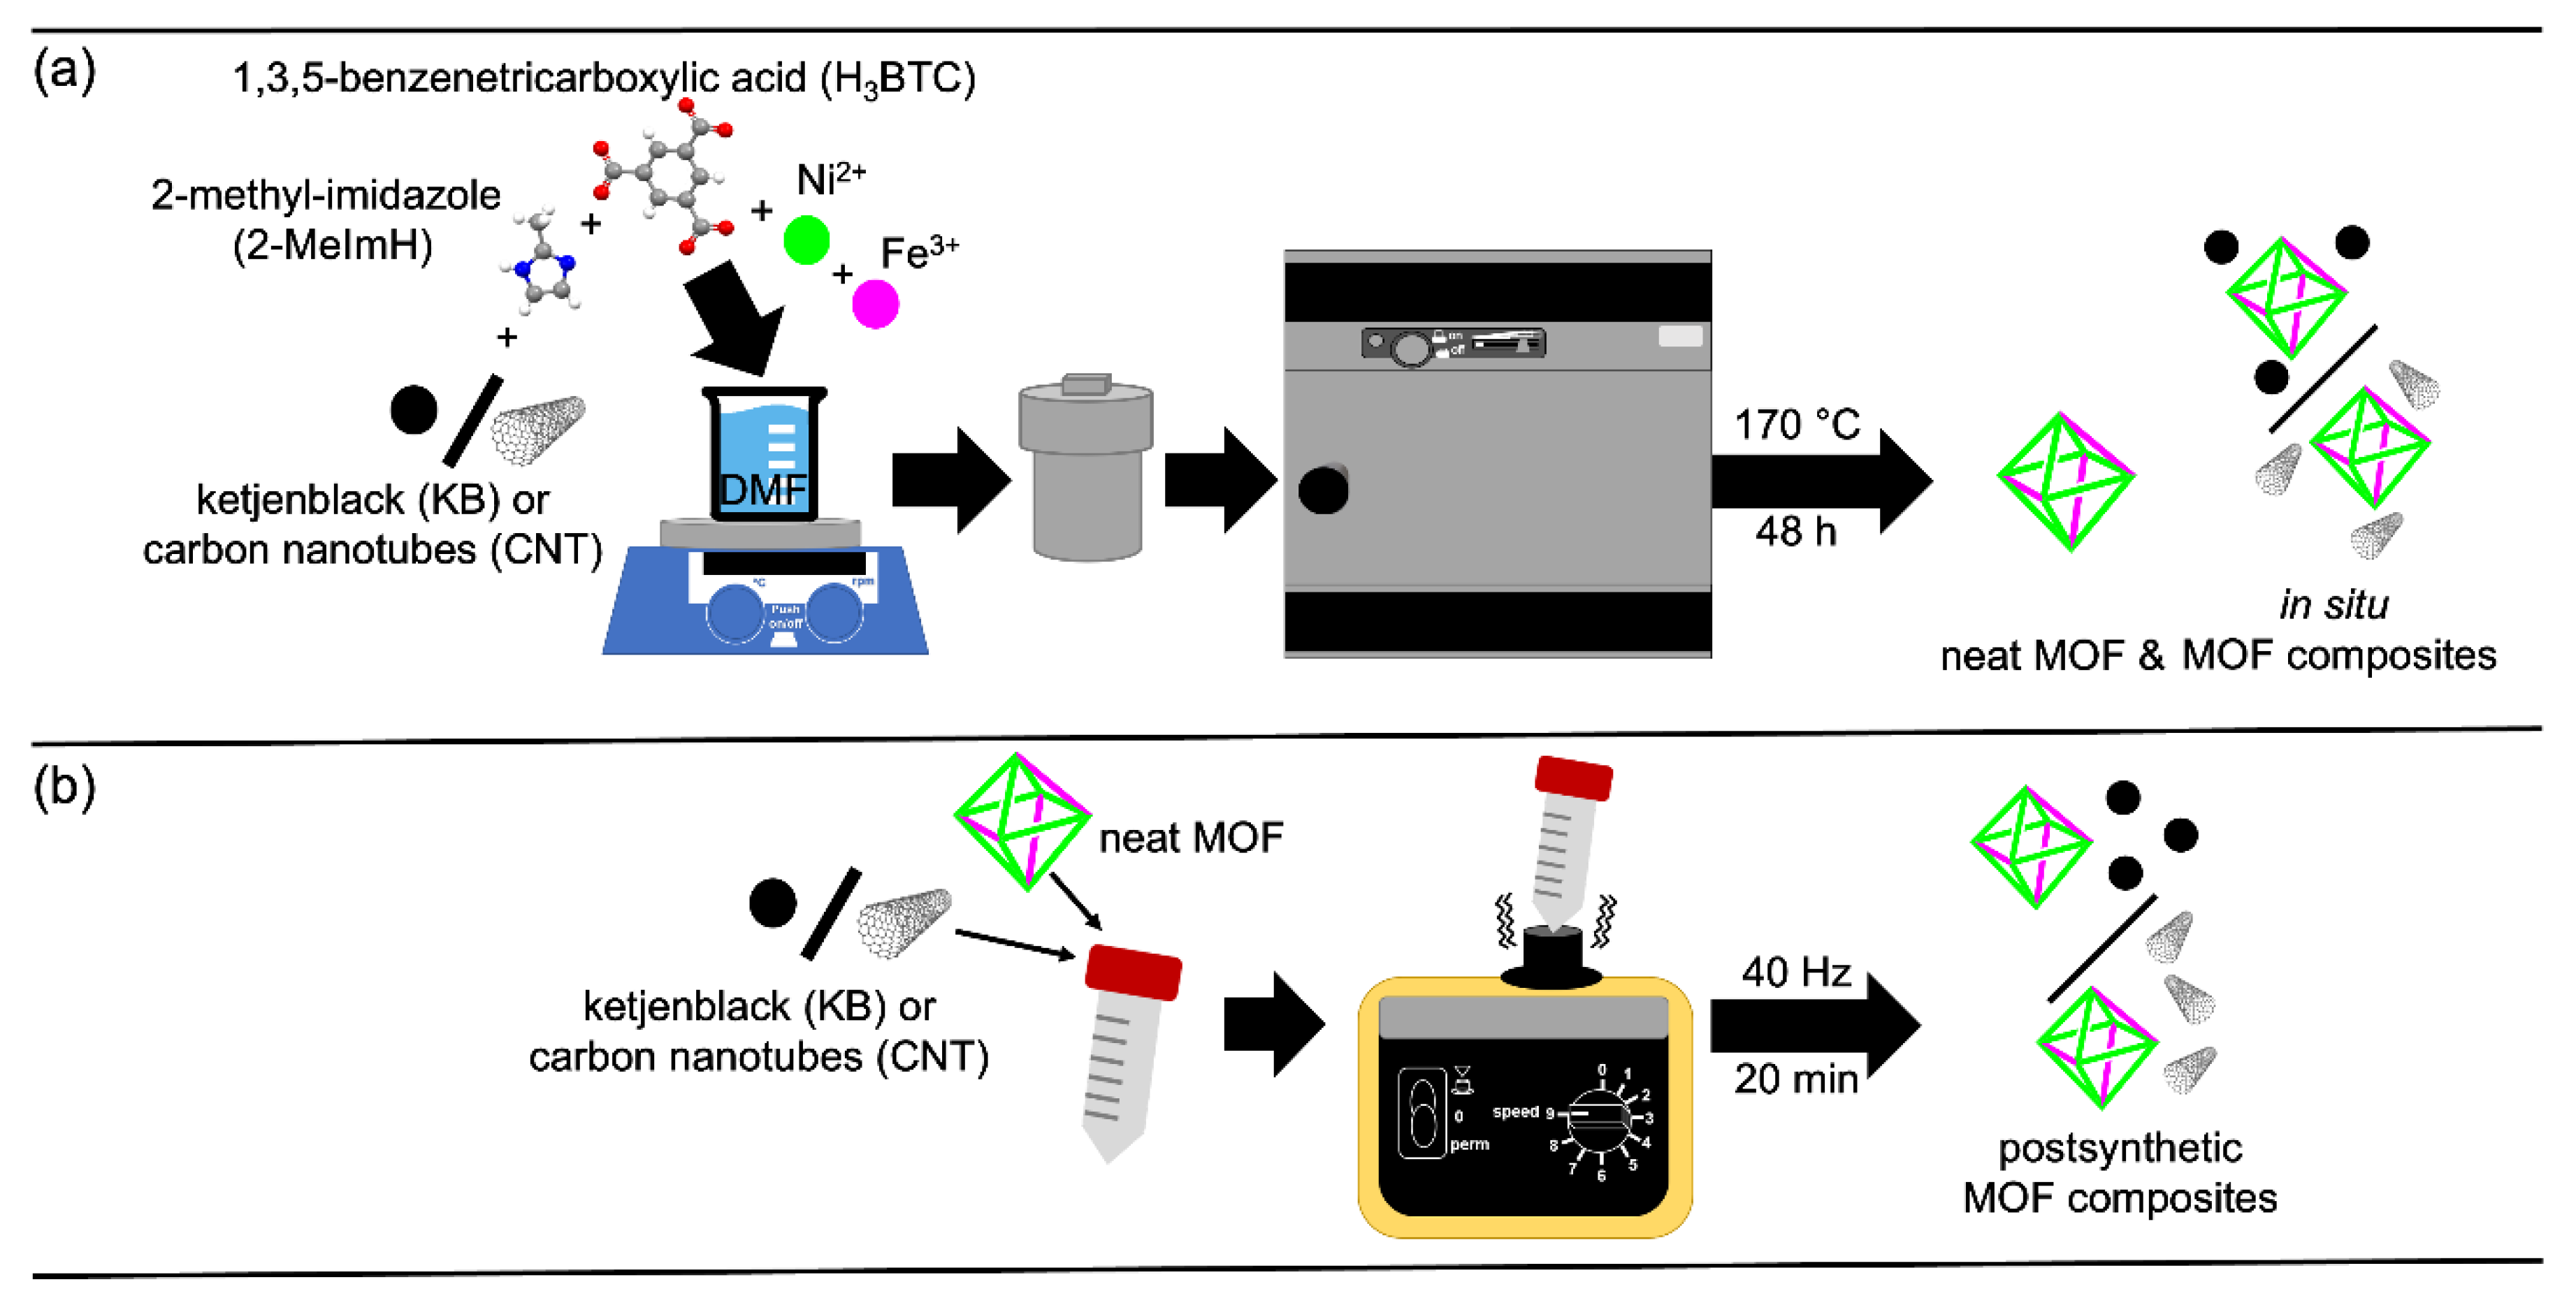
Figure 2.
SEM images (first row) and EDX elemental mapping for Ni (second row) and Fe (third row) for (a) Ni10Fe, (b) Ni10Fe-KB and (c) Ni10Fe-CNT. Further SEM images and the SEM-EDX spectra are displayed in Figure S2 to S9, SI. Note the smaller scale for the CNT composite vs. the neat MOF and MOF-KB composite.
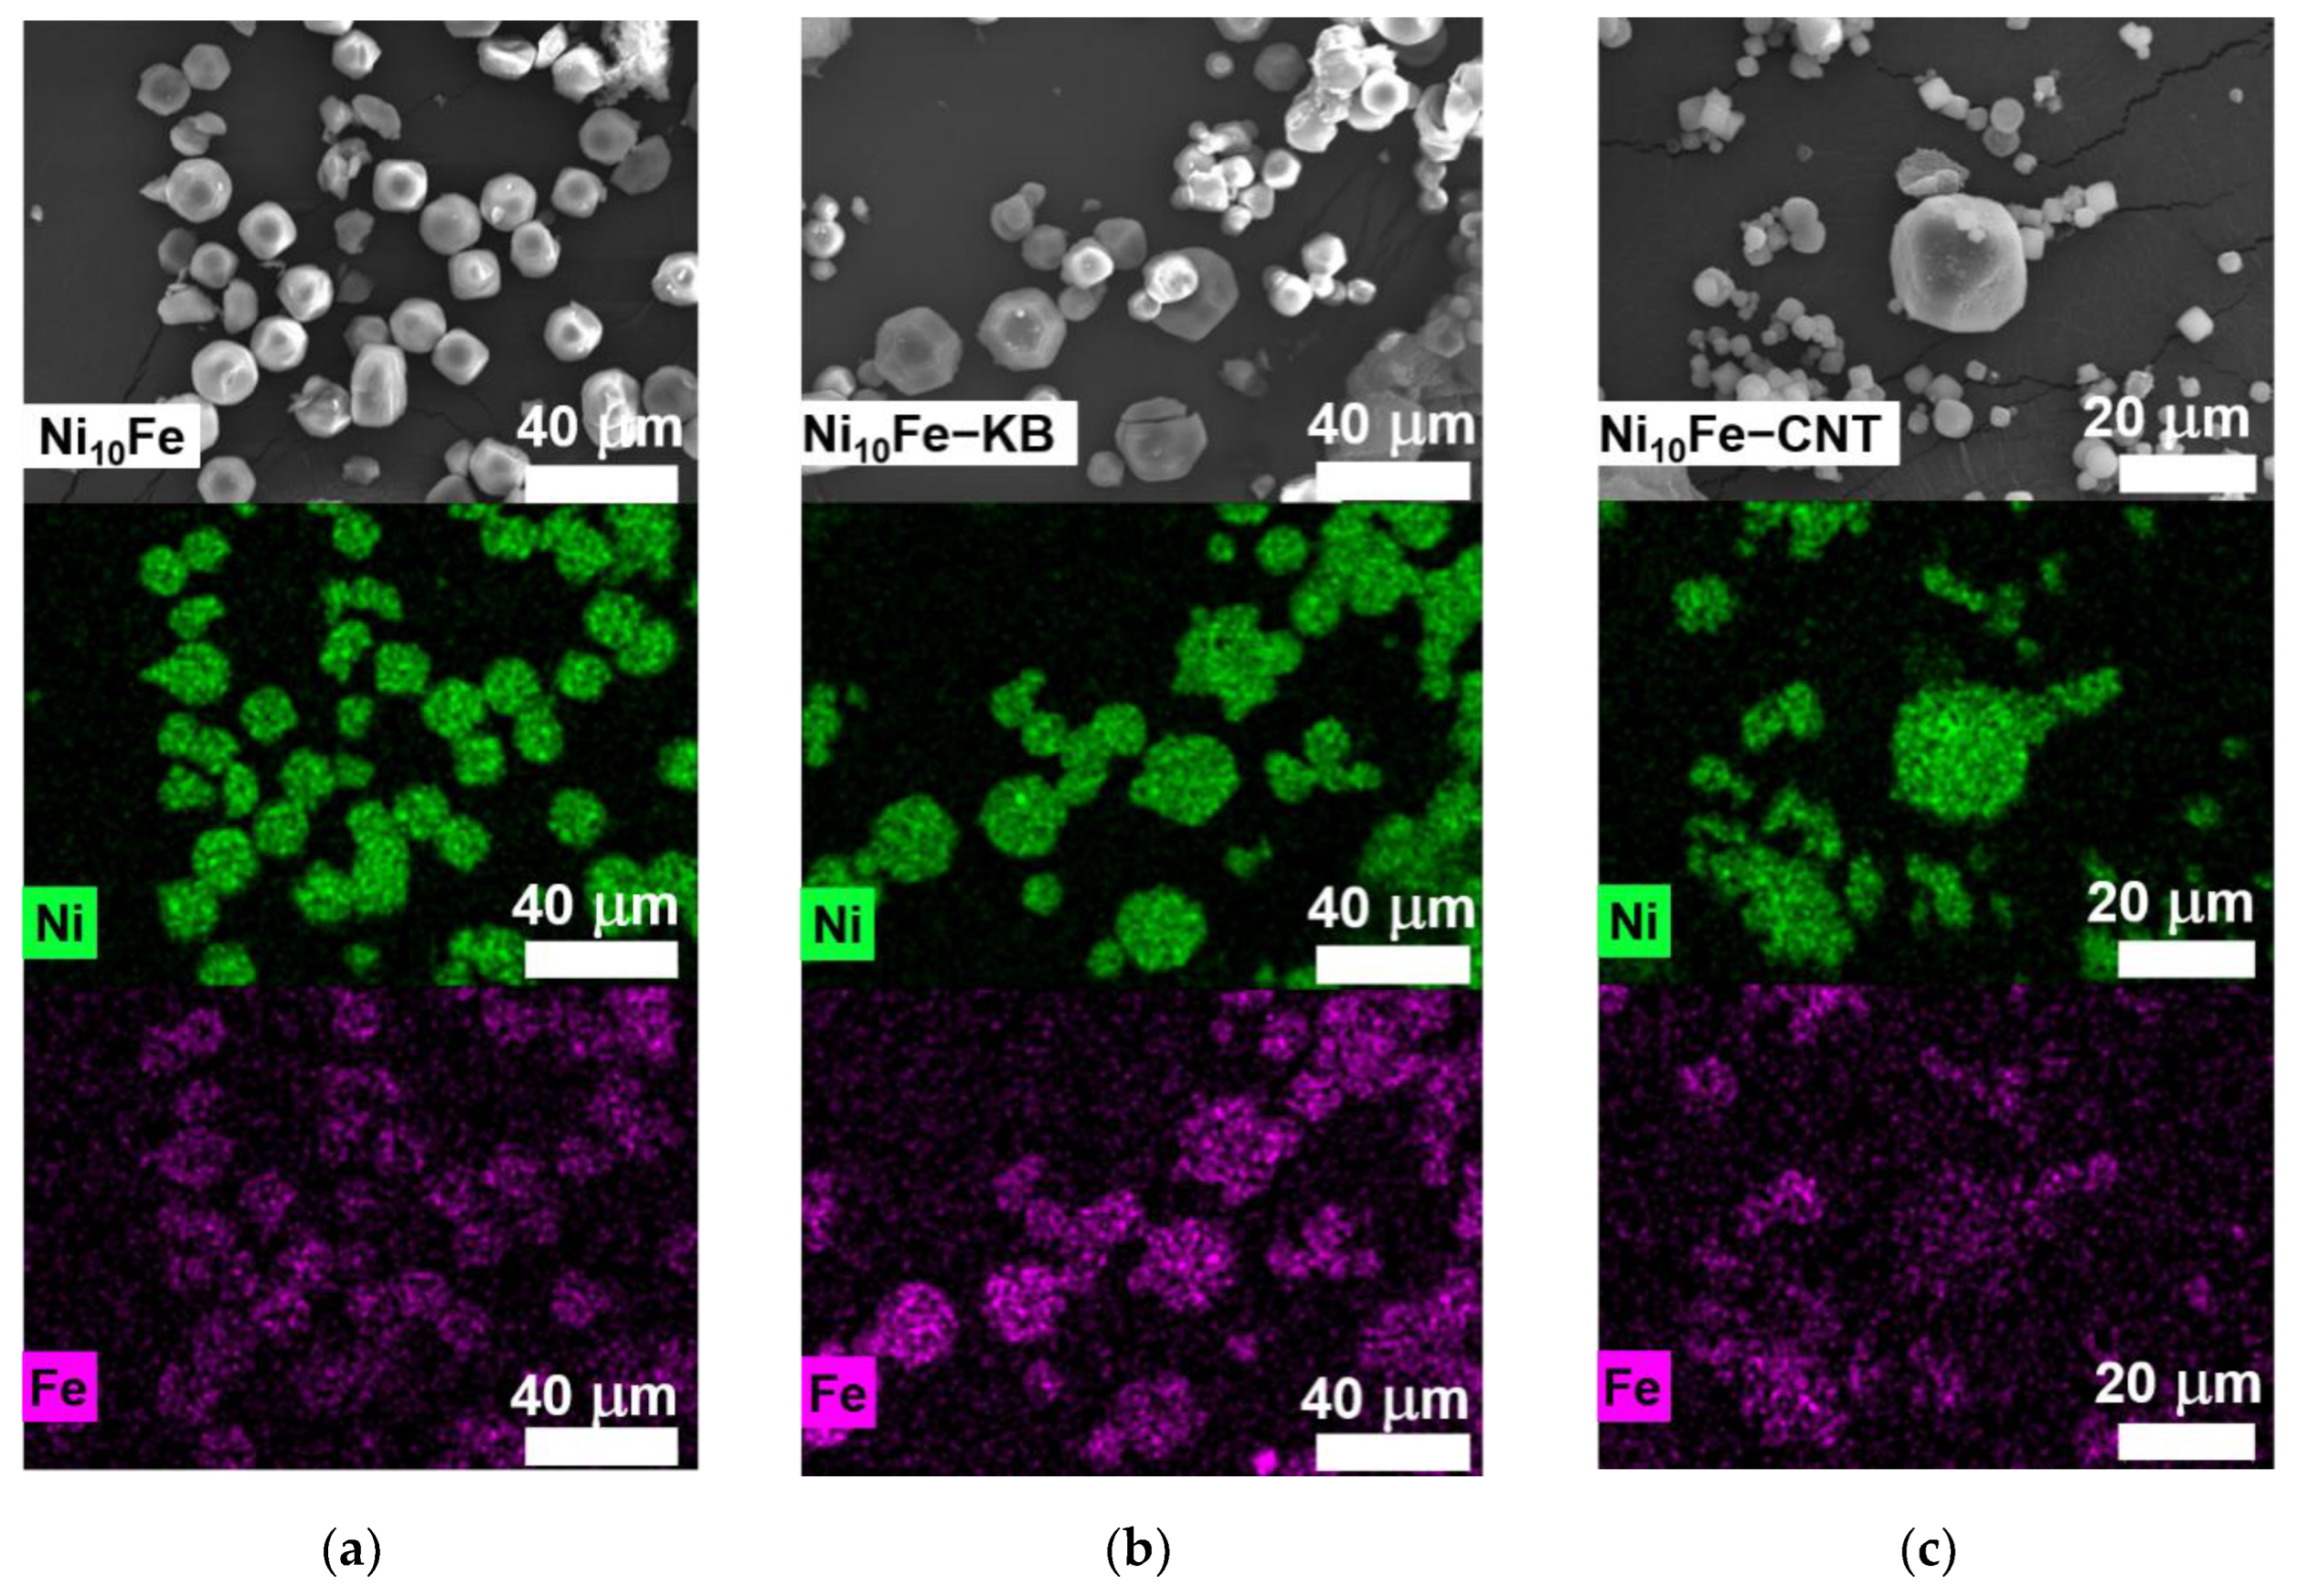
Figure 4.
PXRD patterns of neat MOFs and their in situ composites together with the experimental diffractograms for CNT, KB and the simulated one for Ni-BTC (CCDC Nr. 802889). (a) Ni-MOF, Ni-KB, Ni-CNT, (b) Ni10Fe, Ni10Fe-KB, Ni10Fe-CNT, (c) Ni5Fe, Ni5Fe-KB, Ni5Fe-CNT. The low intensity of reflections at 2θ < 7° is due to strong broadening of the beam spot on the flat sample holder such that only a fraction of the diffracted radiation reaches the detector.
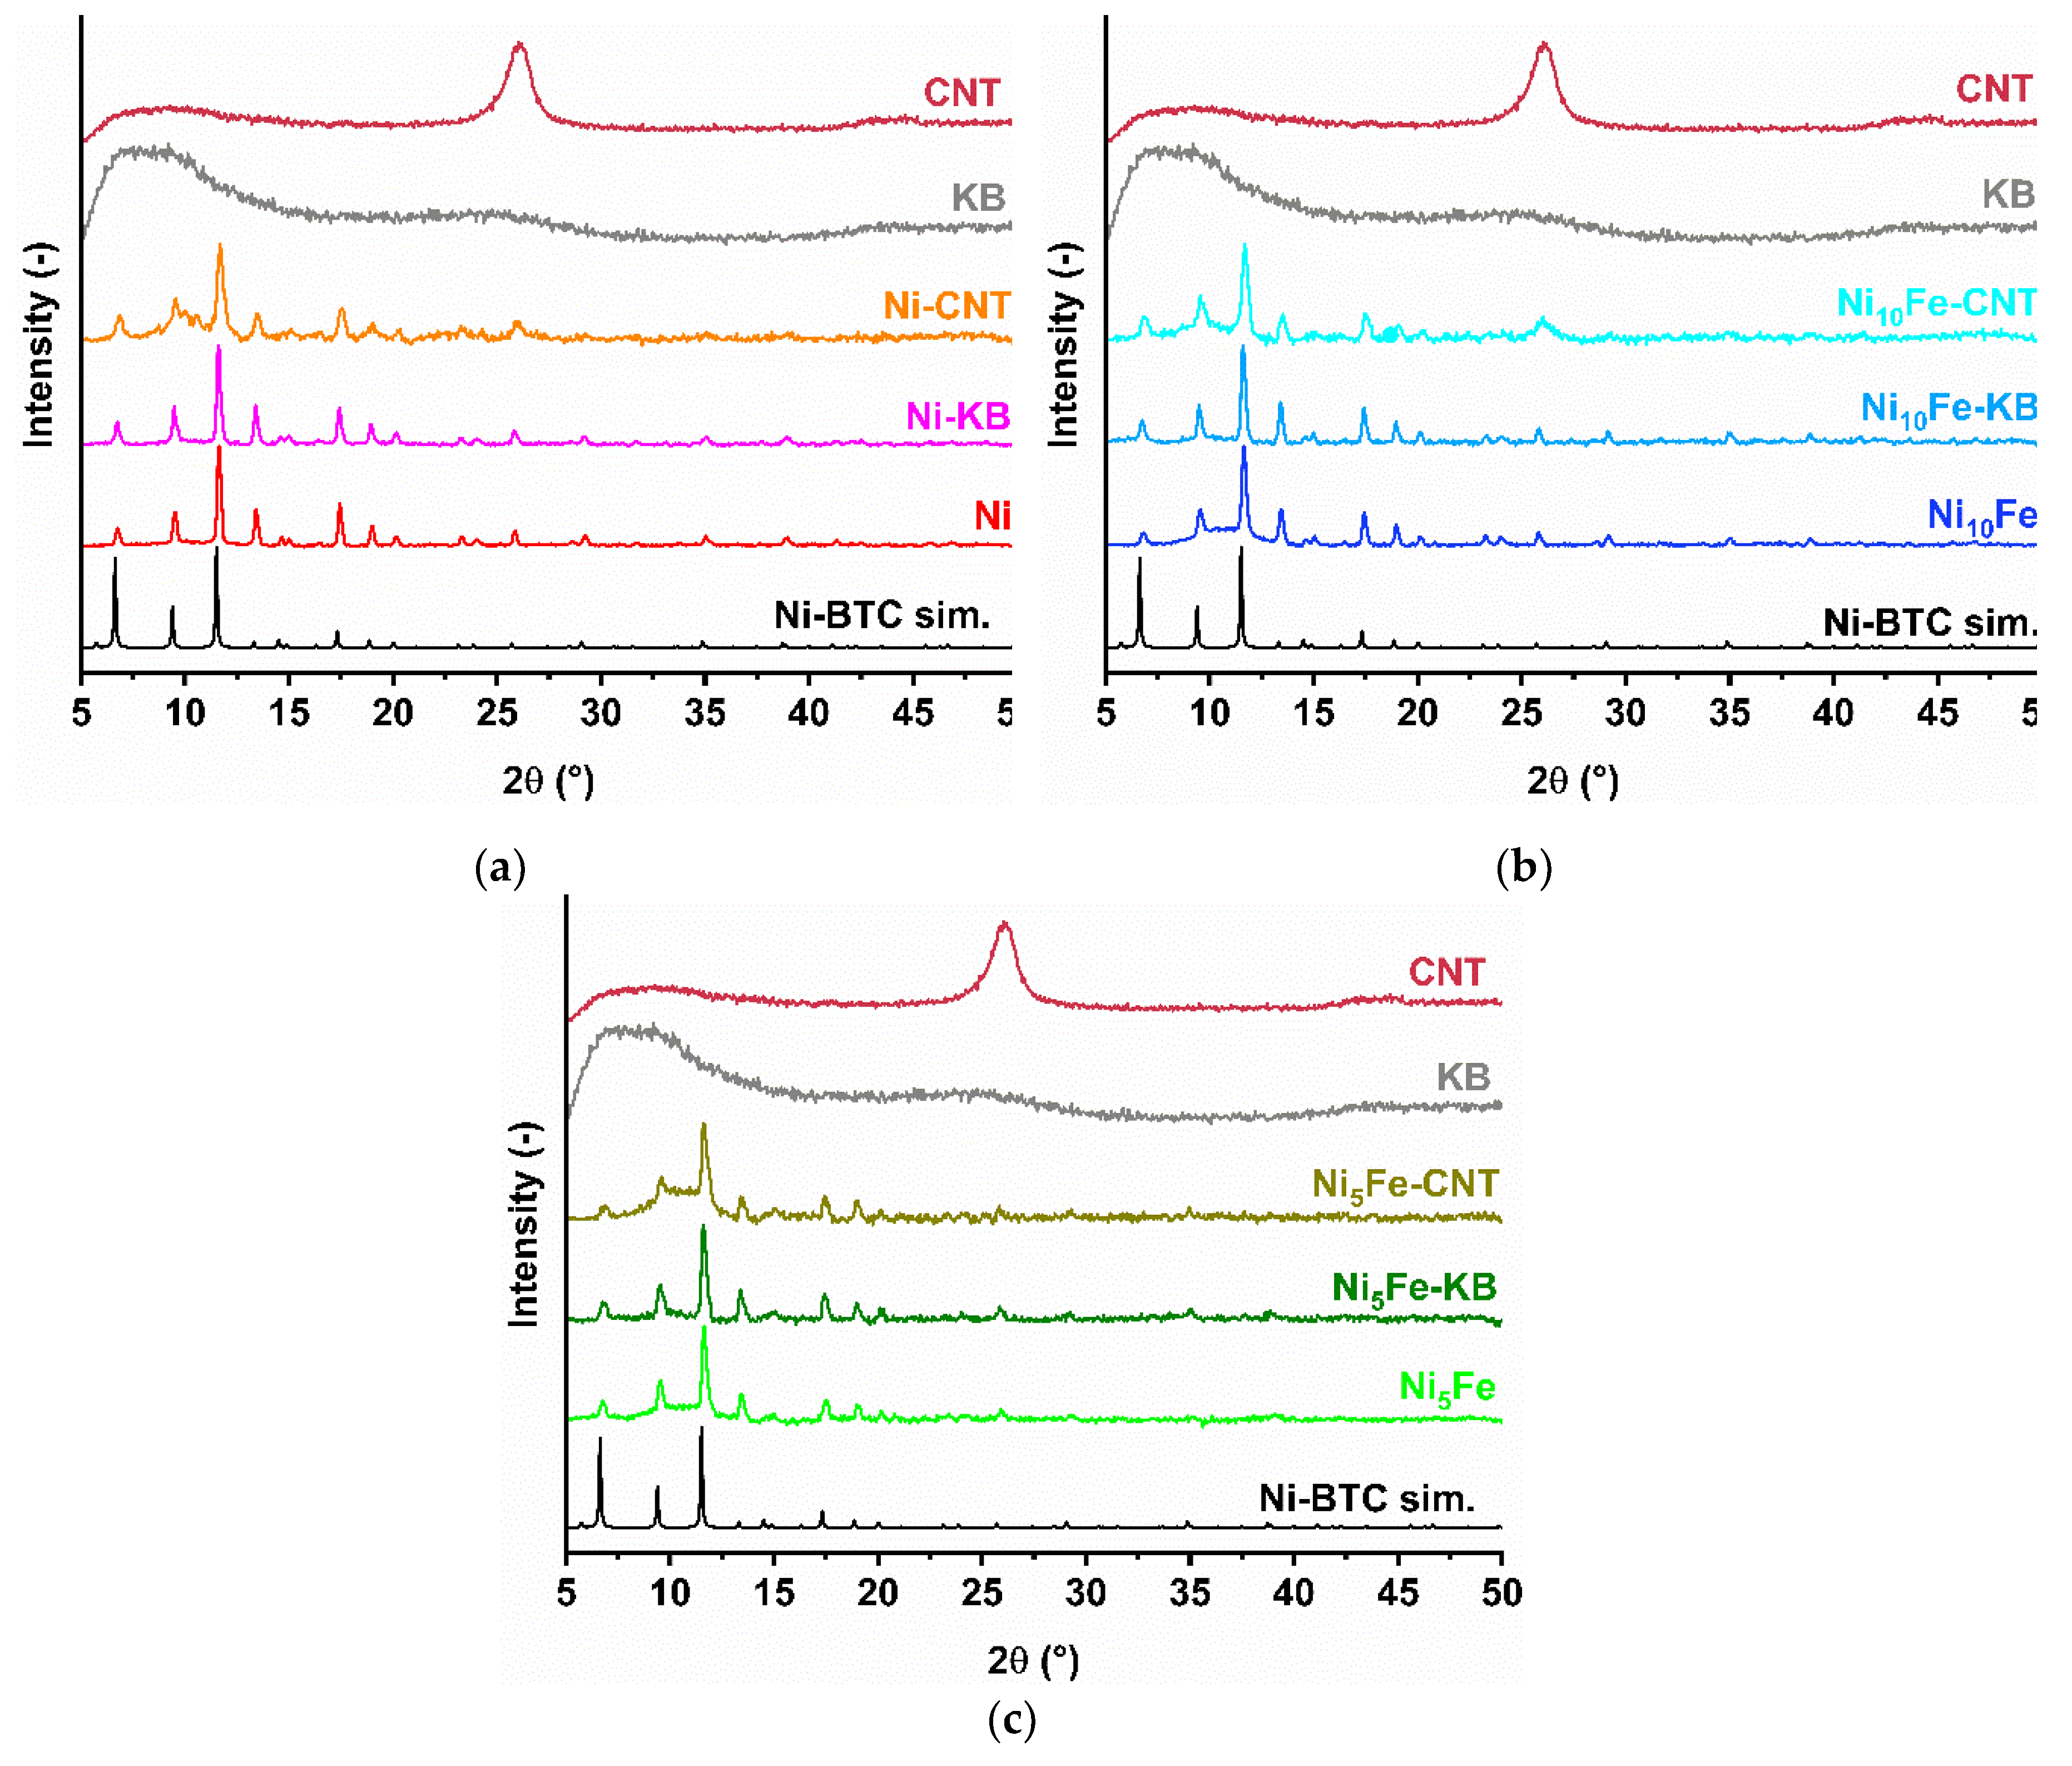
Figure 5.
N2-sorption isotherms neat MOFs and their in situ composites at 77 K (adsorption: filled circles; desorption: empty circles) (a) Ni-MOF, Ni-KB, Ni-CNT, (b) Ni10Fe, Ni10Fe-KB, Ni10Fe-CNT, (c) Ni5Fe, Ni5Fe-KB, Ni5Fe-CNT, (d) KB and CNT.
Figure 5.
N2-sorption isotherms neat MOFs and their in situ composites at 77 K (adsorption: filled circles; desorption: empty circles) (a) Ni-MOF, Ni-KB, Ni-CNT, (b) Ni10Fe, Ni10Fe-KB, Ni10Fe-CNT, (c) Ni5Fe, Ni5Fe-KB, Ni5Fe-CNT, (d) KB and CNT.
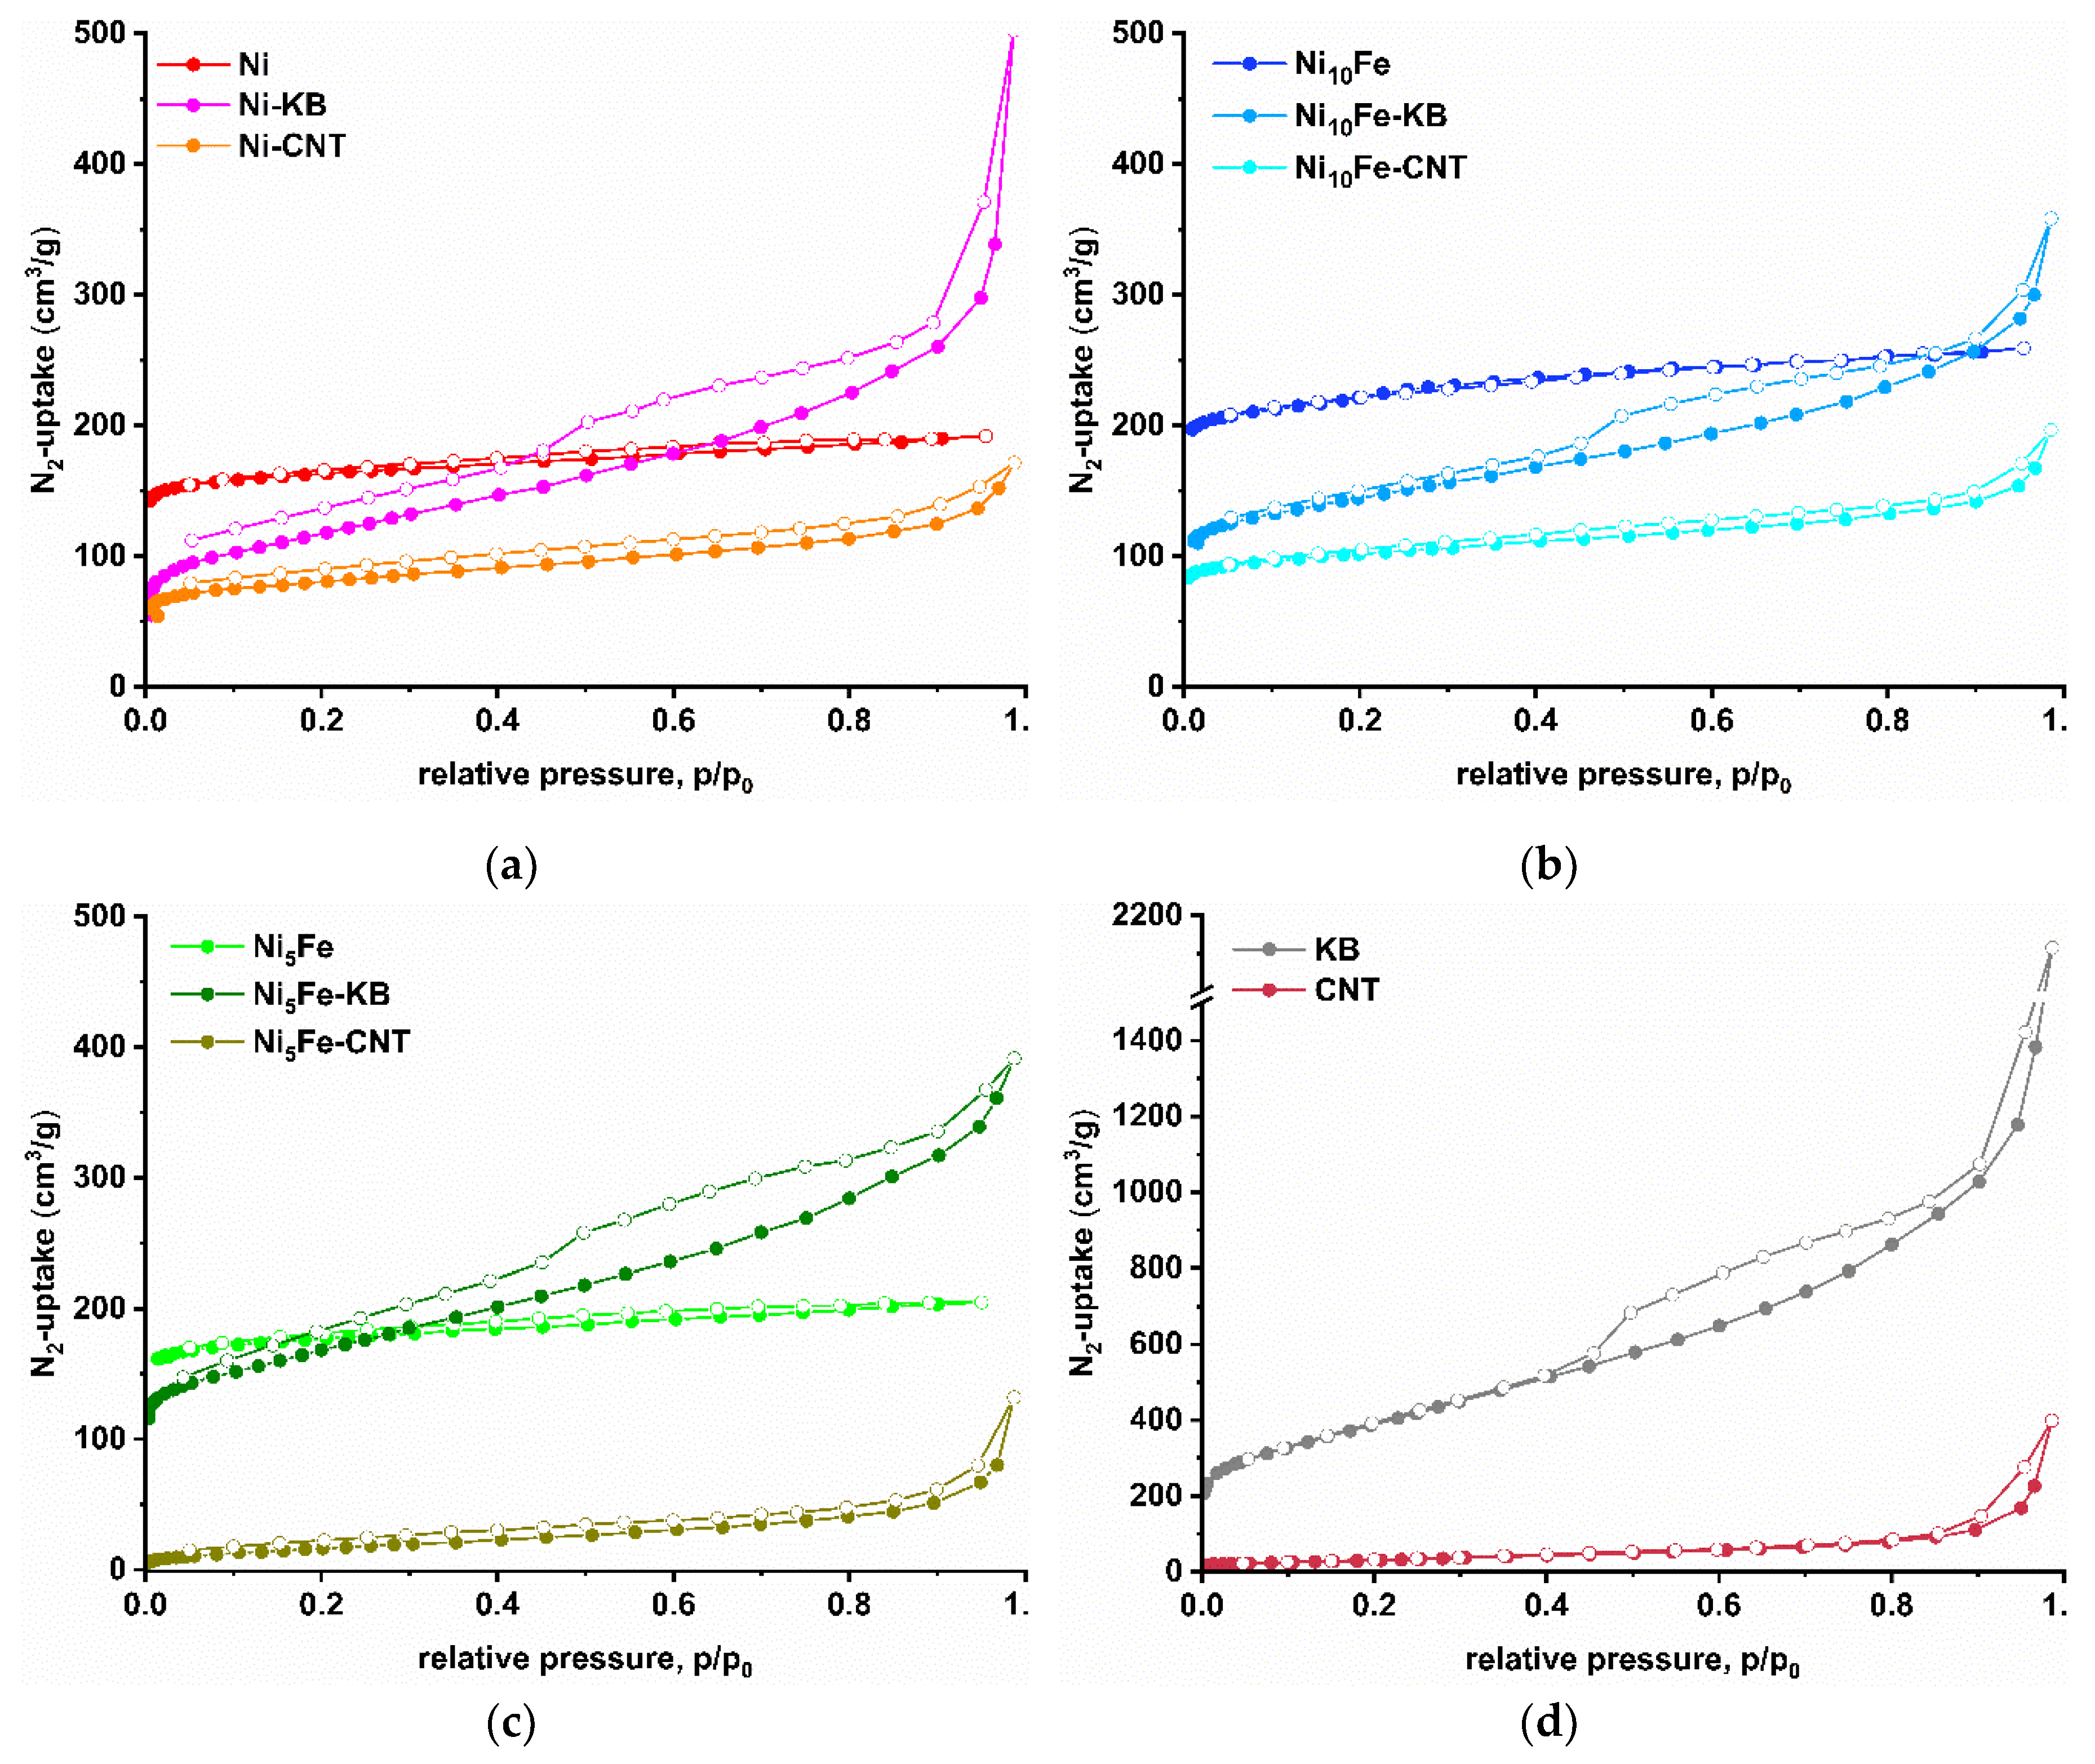
Figure 6.
LSV plots before and after 1000 CVs of (a) Ni-MOF (Ni), (b) Ni10Fe, (c) Ni5Fe with their in situ carbon composites compared to KB, CNT and RuO2, (d) postsynthetic physical mixtures of Ni- and NixFe-MOFs with KB or CNT.
Figure 6.
LSV plots before and after 1000 CVs of (a) Ni-MOF (Ni), (b) Ni10Fe, (c) Ni5Fe with their in situ carbon composites compared to KB, CNT and RuO2, (d) postsynthetic physical mixtures of Ni- and NixFe-MOFs with KB or CNT.
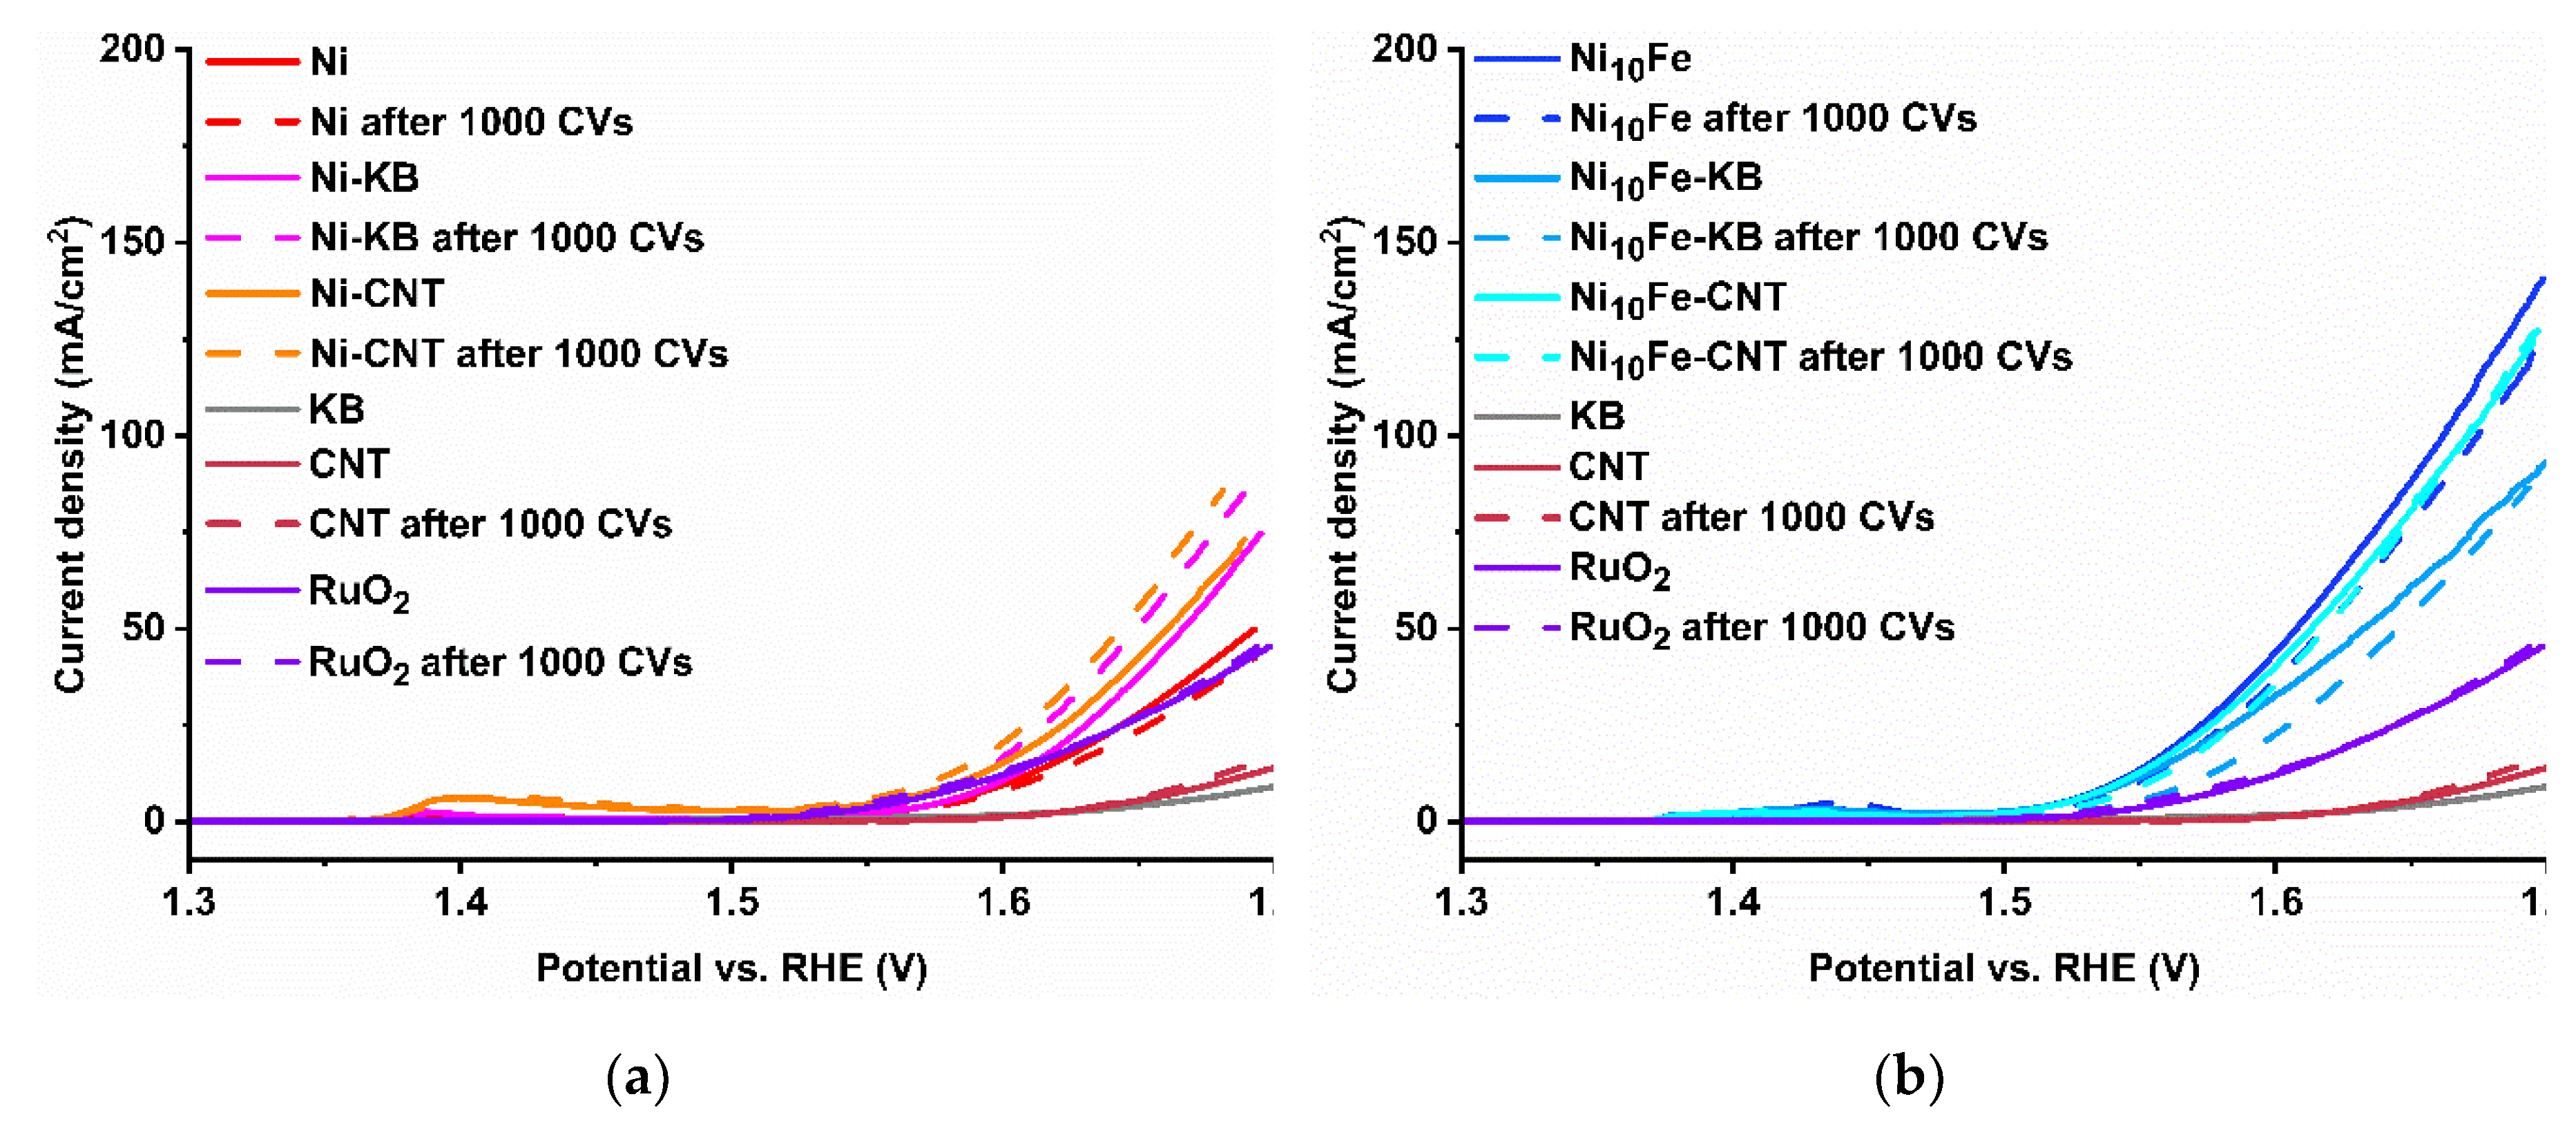
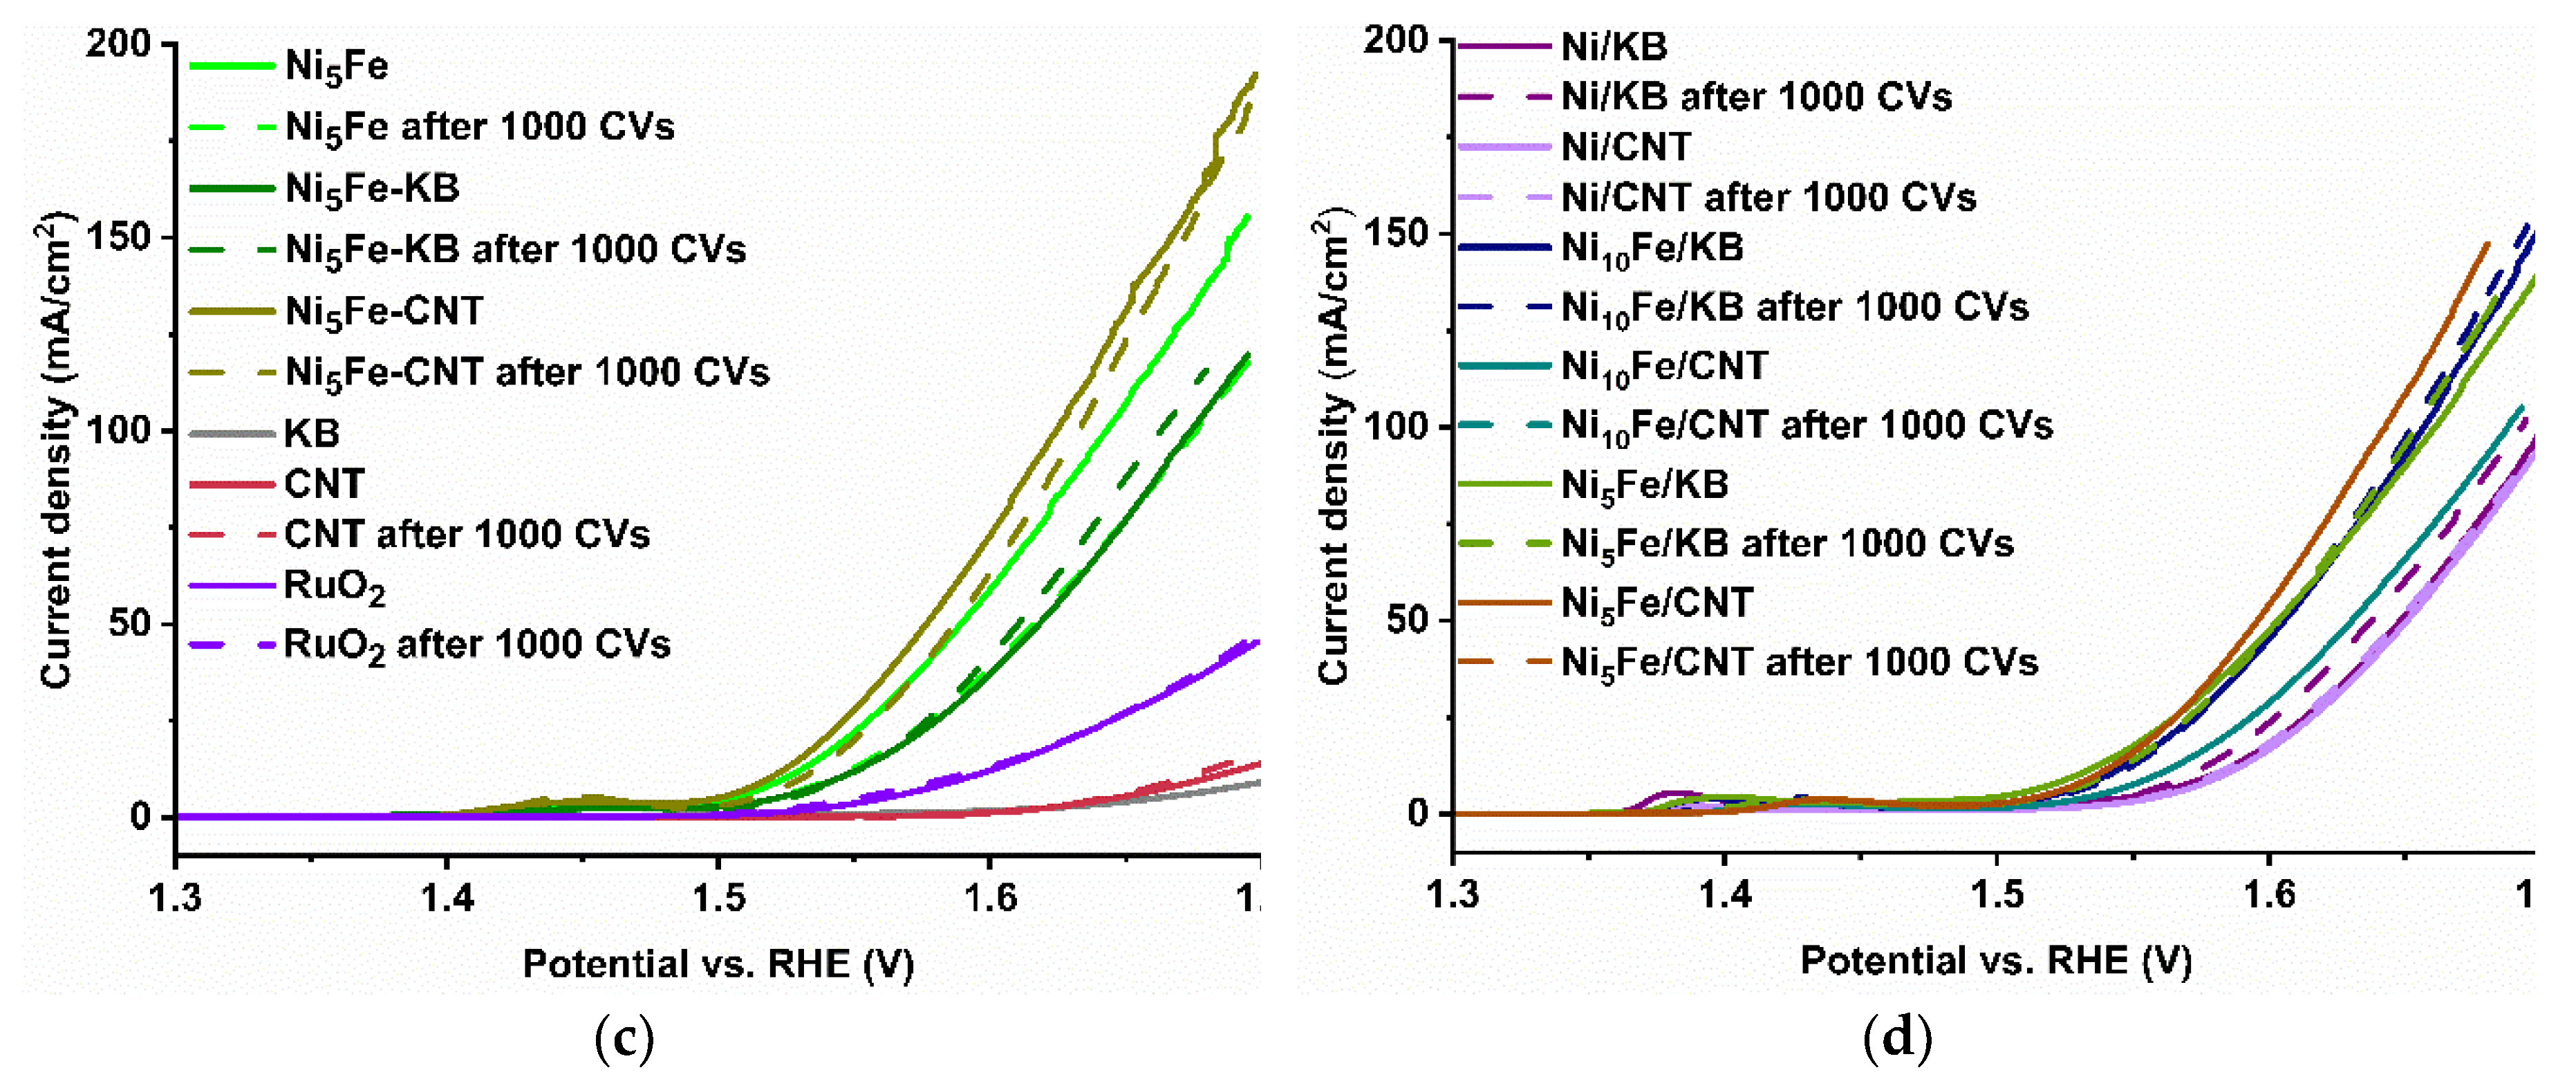
Figure 11.
PXRD patterns of (a) Ni-MOF, (b) Ni10Fe, (c) Ni5Fe and their carbon composites after 24 h in 1 mol/L KOH and the simulated diffractograms of α-Ni(OH)2 (COD: 9012316), β-Ni(OH)2 (ICSD: 169978), γ-NiOOH (COD: 9012319) and β-FeOOH (ICSD: 167358).
Figure 11.
PXRD patterns of (a) Ni-MOF, (b) Ni10Fe, (c) Ni5Fe and their carbon composites after 24 h in 1 mol/L KOH and the simulated diffractograms of α-Ni(OH)2 (COD: 9012316), β-Ni(OH)2 (ICSD: 169978), γ-NiOOH (COD: 9012319) and β-FeOOH (ICSD: 167358).
Disclaimer/Publisher’s Note: The statements, opinions and data contained in all publications are solely those of the individual author(s) and contributor(s) and not of MDPI and/or the editor(s). MDPI and/or the editor(s) disclaim responsibility for any injury to people or property resulting from any ideas, methods, instructions or products referred to in the content. |
© 2024 by the authors. Licensee MDPI, Basel, Switzerland. This article is an open access article distributed under the terms and conditions of the Creative Commons Attribution (CC BY) license (http://creativecommons.org/licenses/by/4.0/).
Copyright: This open access article is published under a Creative Commons CC BY 4.0 license, which permit the free download, distribution, and reuse, provided that the author and preprint are cited in any reuse.


