
Submitted:
08 December 2024
Posted:
09 December 2024
You are already at the latest version
Abstract
This study examines the influence of ligand design on the structural, optical, and electrical properties of copper-based coordination complexes. Ligands H2L1 and H2L2 were synthesized via reaction of 5-nitrosalicylaldehyde with 2-hydroxy- or 4-hydroxybenzhydrazide, respectively. H4L3 was obtained from the reaction of carbohydrazide and salicylaldehyde, while H4L4 was prepared by condensing 4-methoxysalicylaldehyde with thiocarbohydrazide. The research focuses on two key design elements: (1) the effect of hydroxyl group positioning on the aroyl ring in hydrazide ligands (H2L1 vs. H2L2) and (2) the impact of carbonyl versus thiocarbonyl groups and aldehyde substituents in hydrazone ligands (H4L3 vs. H4L4). The resulting complexes, [Cu2(L1)2], [Cu2(L2)2]∙3MeOH, [Cu2(L3)(H2O)2], and [Cu2(L4)(H2O)2], were synthesized and characterized using attenuated total reflectance infrared (IR-ATR) spectroscopy, thermogravimetric analysis (TG), and UV-Vis diffuse reflectance spectroscopy. Their electrical properties were investigated using solid-state impedance spectroscopy (IS). This study underscores the pivotal role of ligand modifications in modulating the functional properties of coordination complexes, offering valuable insights for the advancement of materials chemistry.
Keywords:
copper complexes
; (thio)carbohydrazones
; aroylhydrazones
; impedance spectroscopy
; electrical properties
1. Introduction
Schiff bases and their metal complexes have garnered significant scientific interest due to their pivotal roles in the main group and transition-metal coordination chemistry, a consequence of their straightforward synthesis and structural diversity [[1],[2]]. These compounds are typically synthesized through a condensation reaction between primary amines and active carbonyl compounds in the presence of an appropriate solvent, preferably alcohol [[3]]. The corresponding metal complexes are prepared by reacting Schiff-base ligands with metal precursors in controlled stoichiometric ratios under suitable experimental conditions [[4],[5]]. The versatility of Schiff bases and their metal complexes is reflected in their wide-ranging applications, which include their use as chelating ligands in coordination chemistry, catalysts, dyes, polymerization initiators, and luminescent materials [[6],[7],[8],[9],[10],[11],[12]].
Furthermore, Schiff bases and their metal complexes exhibit notable biological activities, having been investigated as antibacterial, antifungal, antitumor, and antiviral agents, as well as insecticides. The advent of clinically significant metal-based drugs such as cisplatin in the 1970s and auranofin in the 1990s has further driven the exploration of metal complexes as potential therapeutic agents. Among these, copper-based complexes have shown promise as anticancer candidates, with studies revealing their ability to induce cancer cell death via diverse mechanisms, including proteasome inhibition, generation of reactive oxygen species (ROS), and DNA damage [[13],[14]]. These findings underscore the multifaceted nature of Schiff bases and their metal complexes in both fundamental and applied research domains. Another significant application of copper-based complexes lies in their use as semiconductors. The incorporation of transition metals into the organic ligands can enhance the electrical properties of these materials, making them suitable for various electronic and optoelectronic applications. The ability of copper to adopt different oxidation states, coupled with the tuneable electronic structure of Schiff-base ligands, provides a platform for designing materials with improved conductivity and tailored energy band gaps. This synergy between organic ligands and metal centers offers promising pathways for advancements in semiconductor technology, including organic field-effect transistors (OFETs), photovoltaic cells, and light-emitting diodes (LEDs) [[15],[16],[17]]. Structural parameters, including ligand environment, solvent coordination, and metal centres typically influence the conduction mechanisms within such complexes. In that regard, we have reported the electrical properties of molybdenum and vanadium-based complexes with a similar class of Schiff-based ligands [[18],[19],[20],[21]]. This study aimed to expand the scope of research into copper-based materials by exploring the effects of ligand design on their properties. The selected ligands, shown in Scheme 1, were chosen to investigate two key factors: (1) impact of hydroxyl position on the aroyl ring of hydrazide (H2L1 vs. H2L2) and (2) the influence of carbonyl versus thiocarbonyl groups in hydrazide ligands, along with variations in substituents on the aldehyde moiety of hydrazone ligands (H4L3 vs. H4L4). By systematically varying these structural elements, the study aimed to elucidate how these modifications affect the coordination environment, electronic properties, and functional performance of the resulting copper complexes, providing deeper insights into their structure-property relationships.
2. Results and discussion
2.1. Preparation, spectroscopic and thermal characterization
The preparation of all the ligands used in this research has been previously reported [18,[22],[23],[24],[25]]. The freshly prepared ligands were analyzed using IR spectroscopy to confirm their structural features. The IR spectra for ligands H₂L1 and H₂L2 exhibits similar characteristics. Notable absorption bands include the C=O stretching at 1651 cm⁻¹ for both ligands. Bands at 1601 cm⁻¹ and 1588 cm⁻¹ for H₂L1 and H₂L2, respectively, are attributed to C=N stretching. Additionally, C–Ophenolic vibrations are observed at 1275 cm⁻¹ for H₂L1 and 1238 cm⁻¹ for H₂L2.
For ligands H₄L3 and H₄L4, characteristic bands appear at 3241 cm⁻¹ and 3238 cm⁻¹ (N–H), 1616 cm⁻¹ and 1610 cm⁻¹ (C=N), 1533 cm⁻¹ (C–N), and 744 cm⁻¹ (C=S). DSC analysis provided insights into the melting points and purity of the ligands. For H₂L1 and H₂L2, previously reported DSC results [18], were confirmed by the freshly prepared samples, showing identical thermal behaviour. The endothermic peak for H₄L3 appeared at 197 °C, indicating its melting point, while H₄L4 displayed a melting onset at 213 °C.
The copper complexes were synthesized by reacting [Cu(OAc)₂]·H₂O with the respective ligands in methanol, yielding dark green powders. The complex derived from H₂L1 displayed a Cu–O stretching band at 664 cm⁻¹, with additional bands at 1576 cm⁻¹ and 1236 cm⁻¹ corresponding to C=Nimine and C–Ophenol, respectively. Similarly, the complex formed with H₂L₂ exhibited bands at 640 cm⁻¹ (Cu–O), 1602 cm⁻¹ (C=Nimine), and 1271 cm⁻¹ (C–Ophenol).
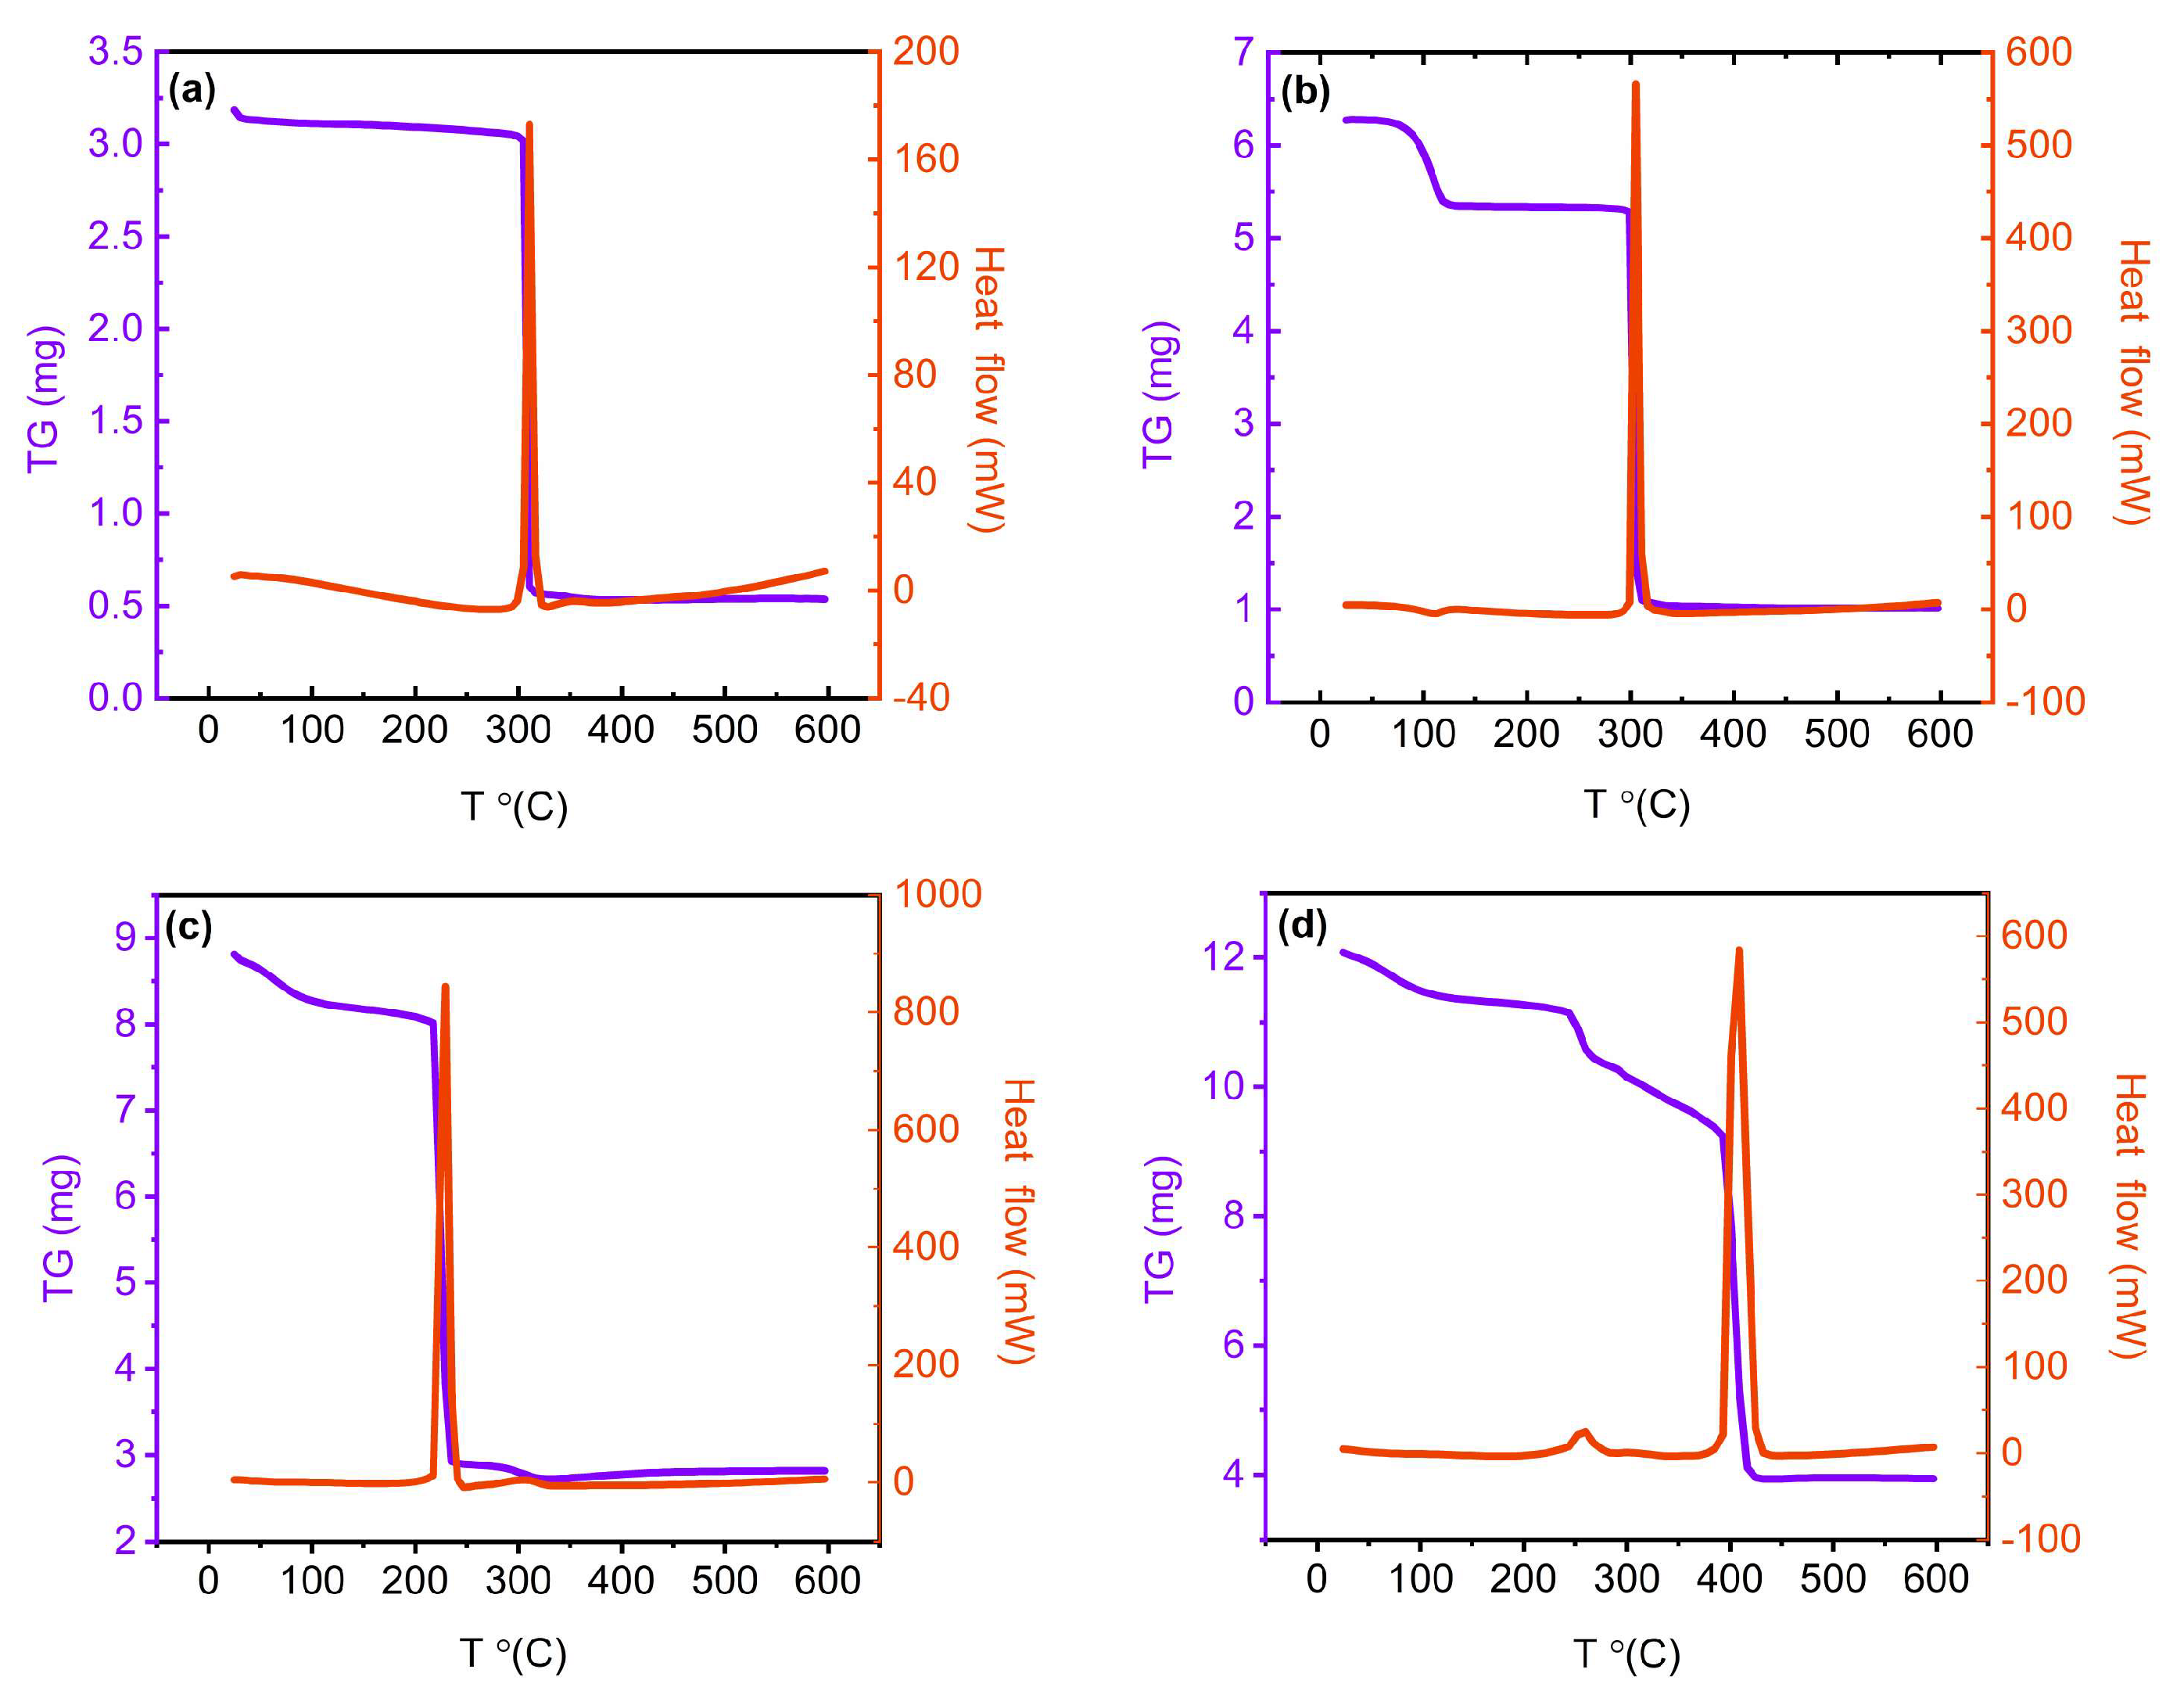
Thermogravimetric analysis (TG) of the complex obtained from H₂L₁ revealed a single-step decomposition in the range of 307–345 °C, indicating a stable thermal profile (Figure 1 (a) and (b)). In contrast, the complex derived from H₂L2 showed a two-step decomposition process, with an initial mass loss between 92–118 °C, likely corresponding to solvent removal, followed by a second decomposition phase between 324–344 °C. An interesting property observed from the TG/DSC curves is a decomposition of the studied Cu complex in a very narrow temperature range (approximately within 30 °C), being unusual for the coordination complex decomposition. The final residue was analysed as CuO due to the overlapping of the residue IR spectra and IR spectra of the commercially available CuO. Based on the IR and TG data, the synthesized complexes were identified as dinuclear copper complexes, analogous to previously published compounds. Specifically, the reaction between copper(II) acetate and ligands derived from salicylaldehyde and 4-hydroxybenzhydrazide is known to yield dinuclear complexes with the general formula [Cu₂(L)₂], [[26]]. In this study, the prepared complexes were assigned the structures [Cu₂(L1)₂] and [Cu₂(L2)₂]·3MeOH, Scheme 2. The presence of crystalline methanol in the latter was additionally confirmed via IR-ATR spectroscopy, which showed a distinct band at 1025 cm⁻¹ corresponding to MeOH. These findings provide a characterization of the ligands and their resulting copper complexes, aligning with established literature precedents.
Next two Cu complexes were obtained through the synthesis of [Cu(OAc)₂]·H₂O and H4L3or4. The IR spectra indicated the absence of the band characteristic for C=O and C=S and the existence of bands at 1600 and 1240 cm⁻¹ attributed to C=Nimine and C–Ophenol, respectively. TG analysis of both complexes, Figure 1 (c) and (d), indicated an almost immediate mass loss, for the complex prepared obtained from the ligand H4L3 in the temperature range 50-135 °C and for the complex obtained from the H4L4 in the range 50-120 °C. Further heating caused complex decomposition, 237-328 and 253-442 °C, respectively. Based on the results of TG analysis and IR data, it was assumed that both complexes have analogue formula [Cu2(L3or4)(H2O)2]. This is supported by the similar findings published in the literature [[27],[28],[29]], Scheme 2. When comparing the TG results of the dinuclear copper complexes, [Cu2(L1)2] and [Cu2(L2)2]∙3MeOH, a notable difference emerges between the complexes derived from the ligands H4L3 and H4L4. The complex obtained from ligand H4L3, which features a bridging ONO-NNO donor, exhibits decomposition within a relatively narrow temperature range. In contrast, the complex featuring ligand H4L4, characterized by its ONS-NNO donor configuration, undergoes decomposition across a significantly broader temperature range. This disparity in thermal stability suggests a difference in the robustness of the ligand-chelate interactions and the overall structural integrity of the complexes, potentially influencing their reactivity and applications in various chemical contexts.
Unfortunately, we could not obtain monocrystal samples no matter the preparative method used, or the crystallization technique applied, and all isolated samples were not goodly diffracting powders.
2.2. Optical properties
Copper complexes in solid-state [Cu2(L1)2], [Cu2(L2)2]∙3MeOH, [Cu2(L3)(H2O)2], and [Cu2(L4)(H2O)2] were analyzed using diffuse reflectance spectroscopy (DRS) at room temperature to examine possible optical transitions, Figure 2 In the UV region, absorption bands were observed between 280 and 300 nm, attributed to π → π* intra-ligand charge transfer [[30]]. A prominent band at 420 nm corresponds to ligand-to-metal charge transfer (LMCT) [[31]]. Additionally, a broad peak at 630 nm can be assigned to the 2Eg → 2T2g transition in the distorted octahedral geometry around Cu(II) ions [[32]]. The optical band gap was estimated for indirect transitions by locating the intersection of the photon energy axis with the extrapolated linear region of the Kubelka–Munk function plot against energy. The resulting values, ranging from 2.13 to 2.70 eV, are in good agreement with literature reports for copper(II) complexes [[33],[34]]. These results indicate the semiconductor nature of the synthesized complexes, which agrees with their measured electrical properties.
2.3. Electrical properties
This study offers a thorough evaluation of copper-based coordination complexes, specifically [Cu2(L1)2], [Cu2(L2)2]∙3MeOH, [Cu2(L3)(H2O)2], and [Cu2(L4)(H2O)2], with the aim of elucidating the factors influencing their behaviour. Key factors such as solvent loss during thermal treatment and the steric properties of the ligands are analysed to elucidate their contributions to the electrical conductivity of these materials.
Solid-state impedance spectroscopy (IS) [[35],[36],[37]] was used to study the electrical behaviour over a broad frequency and temperature range. IS measurements for each complex incorporated a thermal cycling process, given their demonstrated thermal stability and potential decomposition at higher temperatures. Moreover, in correlation to TGA results, the temperature range IS is tuned to cover possible structural transformations (from RT up to a maximal 230 °C, depending on each analysed complex. Based on the temperature-dependent conductivity profiles, it is observed that each complex exhibited semiconductor-like behaviour, with conductivity increasing as a function of temperature.
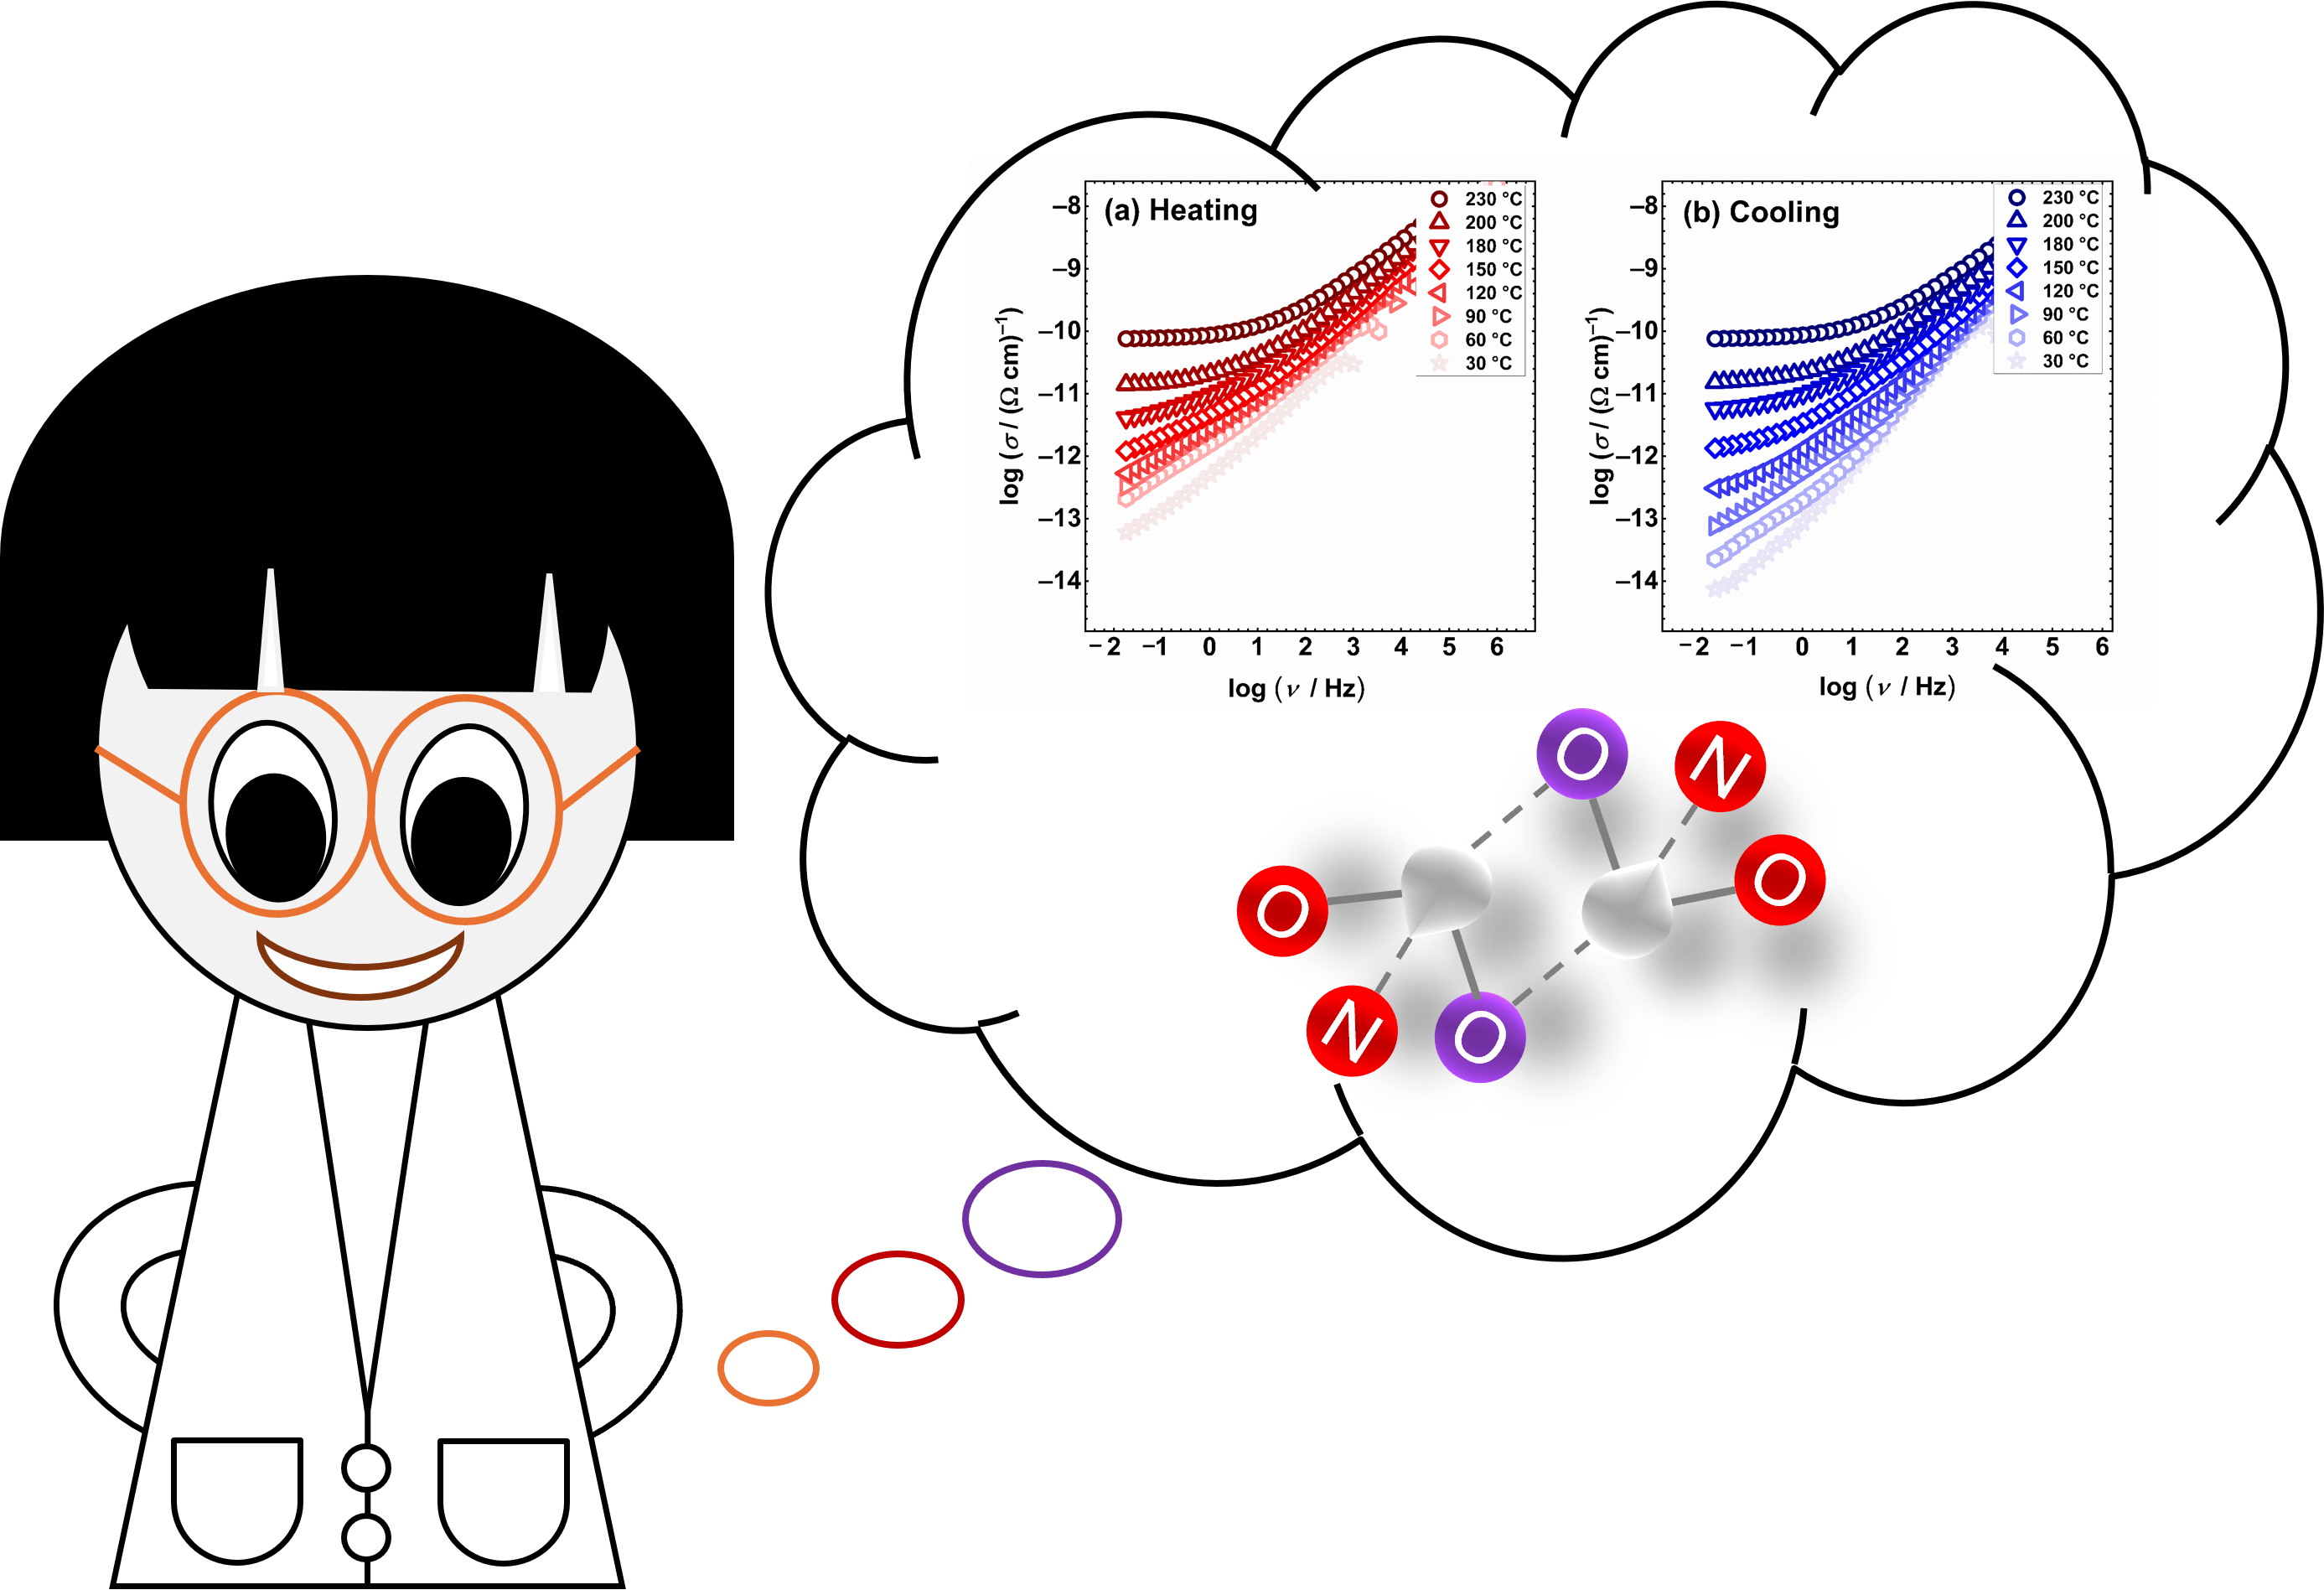
(a-b) present the conductivity spectra of dinuclear [Cu2(L1)2] complex during both, heating and cooling cycles as typical spectra for all studied Cu-complexes. As anticipated, the electrical conductivity increases with temperature which implies semiconductive behaviour with Arrhenius temperature dependence and characteristic activation energy, see Figure 3 (c). Frequency-independent region present in the spectra at elevated temperatures and lower frequencies is known as DC conductivity plateau. Its prominence and extent vary across the complexes, reflecting their distinct electrical properties. In the high-frequency region, conductivity changeovers to a frequency-dependent behaviour, referred as the dispersion region (σAC), while this transition moves to higher frequencies with a temperature increase (extent in DC plateau region), underlying dominant electronic transport. At lower temperatures, due to the limited conductivity of the complexes, the DC conductivity value cannot be directly extracted from conductivity spectra. Instead, in such cases value is determined by fitting experimental complex impedance spectra by applying an equivalent circuit (EC) modelling approach and complex nonlinear least squares (CNLLS) method.
The so-called Nyquist plot for dinuclear complex [Cu2(L1)2] (the imaginary part plotted as a function of the real part of impedance, Z′′ vs. Z′), Figure 3 (d), is analysed using an appropriate equivalent circuit model, based on a parallel R−CPE circuit, where R represents the sample resistance, while CPE is a constant phase element that approximates the sample capacitance. The CPE is used instead of a capacitor due to the depressed impedance semicircle which intersects the x-axis at point R. For example, at 200 °C R equals 3.1∙1010 Ω for [Cu2(L1)2], based on which according to the formula σDC =(d/S)∙(1/R), the conductivity can be calculated. Determined is being equal to 7.6∙10–11 (Ω cm)−1 that agrees well with the value determined directly from the conductivity spectra. This approach ensures accurate extraction of DC conductivity values, particularly where low-temperature conductivity falls below the detectable range of direct graphical analysis.
Moreover, as the conductivity of studied complexes is temperature dependent, it is possible to determine the activation energy (from the dependence of DC conductivity, σDC, on 1000/T and the slope of the line) according to the Arrhenius equation:
where σDC is DC conductivity, σ0 pre-exponential factor, EDC is the activation energy, kB is the Boltzmann constant and T is the temperature (K), Figure 3(c). Corresponding IS measurements were performed for all studied complexes. DC conductivity @200 °C and the activation energy values for all studied complexes are given in Table 1. The conductivity values, ranging from 1.7 × 10⁻¹⁴ to 3.6 × 10⁻⁹ (Ω cm)⁻¹, align well with our previous studies involving similar ligands, but different metal centers, such as molybdenum and vanadium [18-21]. Moreover, the activation energy (EDC) values fall between 68.5 and 84.2 kJ mol⁻¹ in the cooling run, which is in agreement with those observed in our earlier research [18-21], and additionally aligns well with range of values obtained in studies on various semiconductive materials [[38],[39],[40],[41],[42],[43],[44]] with dominant electronic conduction mechanism.
σDC = σ0exp(–EDC/kBT),
Conductivity spectra for dinuclear complex [Cu2(L2)2]∙3MeOH, involving both heating and cooling runs, along with Arrhenius trends are presented in Figure 4.
For the Cu- based complexes, [Cu2(L1)2] and [Cu2(L2)2]∙3MeOH, the differences between the heating and cooling cycles are minimal to nearly non-existent, indicating no significant structural changes within the studied temperature range. Although [Cu2(L2)2]∙3MeOH contains crystallization solvent MeOH molecules that are lost upon heating, the impact is negligible and not visible in the higher temperature range. Based on TGA data for these two complexes, [Cu2(L1)2] is stable up to 307 °C without any changes after which it decomposes, whereas in the case of [Cu2(L2)2]∙3MeOH one can observe its stability up to 324 °C. However, the signature on the solvent (MeOH) exit in the range from 92-118 °C is present in TGA, but in this case due to low conductivity almost temperature-independent below 120 °C, this effect is not visible in IS data.
Compounds [Cu2(L3)(H2O)2] and [Cu2(L4)(H2O)2] exhibit discrepancies during measuring cycles. Representative spectra of the heating vs. cooling run for these two compounds are presented in Figure 5 and Figure 6. Compound [Cu2(L3)(H2O)2] shows only slight differences between the heating and cooling cycles, although these are somewhat more pronounced compared to the previously mentioned complexes [Cu2(L1)2] and [Cu2(L2)2]∙3MeOH. On the other hand, [Cu2(L4)(H2O)2] exhibits more noticeable differences. In both cases, changes in the trend in DC conductivity are observed at temperatures above 120°C during the heating cycle, likely due to the loss of coordinated water molecules.
Before further comparing the studied complexes, it is important to highlight some key differences among them. The ligands H2L1 and H2L2, so-called ONO donor ligands, are very similar with the only difference being the position of the hydroxyl group. Next is the H4L3 ligand, also an ONO-NNO donor ligand, and finally a H4L4, ONS-NNO donor ligand with methoxy group on the aldehyde part. While all ligands contribute to the electrical conductivity of the Cu-based complexes similarly, the positions of the functional groups and chains play a central role in the observed properties of electrical transport. All studied complexes are stable across a broad temperature range, consistently maintaining their structure. Notably, complexes [Cu2(L3)(H2O)2] and [Cu2(L4)(H2O)2], with coordinated water molecules, retain their molecular structure. This is in contrast to our previous studies [18-21], where the loss of coordinated solvent caused structural change which resulted in transformation from a monomeric to a polymeric form. Based on the results from this study on Cu-based complexes, such an exit of solvent does not have a meaningful influence on the electrical transport except for [Cu2(L4)(H2O)2], probably due to the S donor atom in ligand.
Complex [Cu2(L1)2] with the H2L1 ligand exhibits much higher DC conductivity values compared to the sample with the H2L2 ligand, [Cu2(L2)2]∙3MeOH complex, 7.69×10⁻¹¹ vs. 1.72×10⁻¹⁴ (Ω cm)−1, respectively. The difference is likely due to the position of the OH group in the ligand and steric effects. In the H2L1 ligand, the OH group is in the ortho position which seems to have a positive effect on electron delocalization in the structure compared to when the OH group is in the para position, as in H2L2. Furthermore, in both cases, complex (1) and (2) remain dimers, and EDC values are almost the same, while presence/exit of MeOH does not play a visible role in electrical transport.
Due to the ONO donor similarity, next it is fair to discuss [Cu2(L3)(H2O)2] complex. The conductivity values are close to the [Cu2(L1)2] complex (10–10 vs. 10–11(Ω cm)–1, respectively), however, EDC values are notably lower (73.5 kJ mol–1 vs. 84.2 and 83.1 kJ mol–1 [Cu2(L1)2] and [Cu2(L2)2]∙3MeOH, respectively). The similarity in conductivity values may stem from the binding mode of the ligand to the metal centre, as well as the position of the OH group, again in the ortho position. Moreover, it is known that the presence of coordinated water significantly impacts electron transport through the structure, which could account for the lower activation energy observed for [Cu2(L3)(H2O)2] complex compared to the [Cu2(L1)2] complex [18-21].
Finally, compound [Cu2(L4)(H2O)2] with ONS-NNO donor ligand, obtains among all studied complexes, the highest DC conductivity value and lowest EDC values, see Table 1. There are several properties of sulphur in comparison to oxygen that could be the reason for better charge transfer through complex [Cu2(L4)(H2O)2]. Due to its lower electronegativity and larger atomic size, sulphur is more polarizable and correspondingly more effective electron donor than oxygen. This facilitates electron transfer and improves charge mobility, ultimately enhancing the conductivity of complexes, especially those involving sulphide or thiol groups, compared to oxygen-containing counterparts [[45]]. Furthermore, unlike other studied Cu-complexes, this one exhibits the largest disparity between heating and cooling cycles. Although smaller than in previous studies [18-21], lower conductivity during cooling is observed along with a corresponding increase in activation energy (60.3 vs. 68.5 kJ mol–1 in the cooling cycle).
Here, it is important to highlight the correlation between the electrical properties of the copper-based complexes in this study and those of the analogous molybdenum complexes with the same H2L1 and H2L2 ligands, as reported in Sarjanović et al. [18]. Firstly, in [18] three out of four molybdenum complexes were monomers with coordinated solvent molecules (MeOH or H2O), which leave the coordination sphere of molybdenum during the heating cycle, resulting in the formation of polymers: Activation energy values were approximately 20 kJ mol–¹ lower than those of the Cu analogues, but the conductivity values are within a similar range (1.82×10⁻⁹ vs. 7.6×10⁻¹¹, and 1.52×10⁻¹⁴ vs. 1.7×10⁻¹⁴ (Ω cm)⁻¹ for the H2L1 and H2L2 complexes, respectively). Additionally, similar structural changes from monomer to polymer, as well as comparable conductivity and EDC values, were observed in molybdenum complexes with a ligand closely related to H2L1or2 (lacking the OH group at the R position) reported by Pisk et al. [19]. This result and observation demonstrate that the same ligand, when coordinated to different metal centers and forming distinct initial complex structures, underlines the significance of structural (in)stability with temperature and its resulting impact on electrical properties.
3. Materials and Methods
3.1. Preparation
The starting compounds used commercially available aldehydes (2-hydroxy-5-nitrobenzaldehyde, 2-2ydroxybenzaldehyde, 2-hydroxy-4-methoxybenzaldehyde) and hydrazide (2-hydroxybenzhydrazide, 4-hydroxybenzhydrazide,carbohydrazide and thiocarbohydrazide), copper(II) acetate monohydrate (Aldrich, St. Louis, MO, USA), as well as the solvents MeOH (Fluka), without any purification. The ligands were prepared and characterized according to the published procedures [18,[46],[47],[48],[49]].
3.1.1. Preparation of the complexes
Synthesis of dinuclear complexes [Cu2(L1 )2] and [Cu2(L2)2]∙3MeOH
0.05 g of ligand H2L1or2 was dissolved in 40 mL of methanol and 0.0349 g of [Cu(OAc)2]∙H2O was added with reflux for three hours. The precipitate was formed during the reaction and was filtered.
Complex [Cu2(L1 )2]: green powder, yield (24.5%).
IR-ATR bands ν / cm−1: 1567 (−C=Nimine), 1236 (−C−Ophenol), 664 (Cu−O),
TG: wt (CuO, [Cu2(L1)2]) = 21.87 %, weksp. (CuO, [Cu2(L1)2]) = 19.25%.
The same complex can be obtained if methanol is substituted by acetonitrile.
Complex [Cu2(L2)2]∙3MeOH: intense green powder, yield (34%).
IR-ATR bands ν / cm−1: 1602 (−C=Nimine), 1271 (−C−Ophenol), 640 (Cu−O),
TG: wt (MeOH, [Cu2(L2)2]∙3MeOH)= 11.72%, weksp. (MeOH, [[Cu2(L2)2]∙3MeOH) = 12.87%, wt (CuO, [Cu2(L2)2]∙3MeOH) = 19.40%, weksp. (CuO, [Cu2(L2)2]∙3MeOH) = 18.30%
Synthesis of dinuclear complexes [Cu2(L3or4)(H2O)2]
0.095 g (0.25 mmol) of the H4L3 or 4 ligand was placed in 50 mL methanol. 0.102 g (0.50 mmol) of [Cu(OAc)2]∙H2O was added to the suspension. The green suspension was mixed on a stirrer and refluxed for 2.5 h. The resulting olive-green precipitate was filtered and air-dried to a constant mass.
Complex [Cu2(L3 )(H2O)2]: green powder, yield (63.1%).
IR-ATR bands ν / cm−1: 3308 (O−H); 2941, 1447 (C−H), 1601 (−C=Nimine); 1244 (−C−Ophenol), 752, 421(Cu−O)
TG: wt (H2O, [Cu2(L)(H2O)2]) = 7.89%, weksp (H2O, [Cu2(L)(H2O)2]) = 6.4%, wt (CuO, [Cu2(L)(H2O)2]) = 34.80% weksp(Cu, [Cu2(L)(H2O)2]) = 33.0%
Complex [Cu2(L4 )(H2O)2]: green powder, yield (69.2%).
IR-ATR bands ν / cm−1: 3308 (O−H); 2941, 1447 (C−H), 1597 (−C=Nimine); 1242 (−C−Ophenol), 730, 427(Cu−O)
TG: wt (H2O, [Cu2(L)(H2O)2]) = 6.76%, weksp (H2O, [Cu2(L)(H2O)2]) = 5.97%, wt (CuO, [Cu2(L4)(H2O)2]) = 29.90%, weksp(Cu, [Cu2(L4)(H2O)2]) = 31.5%
3.2. Impedance Spectroscopy Measurements
The electrical and dielectric properties of the compounds [Cu2(L1)2], [Cu2(L2)2]∙3MeOH, [Cu2(L3)(H2O)2], and [Cu2(L4)(H2O)2] were studied via impedance spectroscopy (IS). Complex impedance was measured over a wide range of frequencies (0.01 Hz to 1 MHz) and temperatures (30–230 °C) using an impedance analyzer (Novocontrol Alpha-AN Dielectric Spectrometer, Novocontrol Technologies GmbH & Co. KG, Hundsangen, Germany). The temperature was controlled to ±0.2 °C. The measurements were performed on polycrystalline powder samples pressed into cylindrical pellets with a diameter of 5 mm diameter and a thickness of ~1 mm under a uniform load using a hydraulic press. For the electrical contact, gold electrodes were sputtered onto both sides of the pellets using an SC7620 sputter coater from Quorum Technologies (Laughton, UK). The experimental data were analyzed by electrical equivalent circuit (EEC) modelling using the complex nonlinear least-squares (CNLLSQ) fitting procedure using WinFIT software [[50]].
3.3. Physical Methods
Elemental analyses were conducted by the Analytical Services Laboratory of the Ruđer Bošković Institute, Zagreb.
Thermogravimetric (TG) analyses were performed using a Mettler TGA/DSC3+ thermobalance in Al2O3 crucibles. All experiments were performed in an oxygen atmosphere with a flow rate of 200 cm3 min−1 and with heating rates of 10 K min−1 and analysed with Mettler STARe 9.01 software.
IR-ATR spectra were recorded on a Perkin Elmer Spectrum Two spectrometer in the spectral range between 4500–450 cm−1.
UV-Vis diffuse reflectance spectra were recorded at 293 K using a Shimadzu UV-Vis-NIR spectrometer (model UV-3600) equipped with an integrated sphere. Barium sulphate was used as a reference. The diffuse reflectance spectra were transformed using the Kubelka–Munk function. Tauc plots were used to calculate the optical band gap energy.
5. Conclusions
The presented research reports the preparation and characterization of novel Cu-based complexes, [Cu2(L1)2], [Cu2(L2)2]∙3MeOH, [Cu2(L3)(H2O)2], and [Cu2(L4)(H2O)2]. The ligands selected for this study, were strategically chosen to examine two critical factors: (1) the effect of hydroxyl group positioning on the aroyl ring of hydrazone (H2L1 vs. H2L2) and (2) the influence of carbonyl versus thiocarbonyl groups in hydrazide part of ligands, alongside variations in the substituents on the aldehyde moiety of hydrazone (H4L3 vs. H4L4). This approach provides a nuanced understanding of how these structural modifications impact the coordination behaviour and properties of the resulting copper complexes. Further, presented study underscores the pivotal role of the metal center in dictating the electrical properties of such materials. The coordination environment, encompassing the ligand type and coordinated solvent molecules, exerts a significant influence on conductivity and activation energy parameters. The results demonstrate a strong correlation between the structural characteristics of the ligands and the electrical behaviour of the complexes, with copper-based systems showing pronounced sensitivity to variations in ligand composition.
Author Contributions
Conceptualization, J.P., L.P.; methodology, J.P., L.P.; software, J.P., M.D., M.R., L.P.; validation, J.P., M.D., M.S., M.R., N.J. and L.P.; formal analysis, M.D., M.S., N.J. and M.R..; investigation, J.P., M.D., M.S., N.J., M.R. and L.P.; resources, J.P. and L.P.; data curation, M.S., M.D., and M.R.; writing—original draft preparation, J.P., M.D., N.J., M.R. and L.P.; writing—review and editing, J.P., M.D., N.J., M.R. and L.P.; visualization, J.P., M.D. and L.P.; supervision, J.P. and L.P..; project administration, J.P. and L.P..; funding acquisition, J.P. and L.P. All authors have read and agreed to the published version of the manuscript.
Data Availability Statement
The data presented in this study are available from the corresponding author upon request.
Acknowledgements
We acknowledge the support of project CIuK co-financed by the Croatian Government and the European Union through the European Regional Development Fund-Competitiveness and Cohesion Operational Programme (Grant KK.01.1.1.02.0016.).
Conflicts of Interest
The authors declare no conflicts of interest.
References
- Di Bernardo, P.; Zanonato, P.; Tamburini, S.; Tomasin, P.; Vigato, P. Complexation behaviour and stability of Schiff bases in aqueous solution. The case of an acyclic diimino (amino) diphenol and its reduced triamine derivative. Dalton Trans. 2006, 39, 4711–4721. [Google Scholar] [CrossRef] [PubMed]
- Yusuf, T.L.; Oladipo, S.D.; Olagboye, S.A.; Zamisa, S.J.; Tolufashe, G.F. Solvent-free synthesis of nitrobenzyl Schiff bases: Characterization, antibacterial studies, density functional theory and molecular docking studies. J. Mol. Struct. 2020, 1222, 128857. [Google Scholar] [CrossRef]
- da Silva, C.M.; da Silva, D.L.; Modolo, L.V.; Alves, R.B.; de Resende, M.A.; Martins, C.V.B.; de Fátima, Â. Schiff bases: A short review of their antimicrobial activities. J. Adv. Res. 2011, 2, 1–8. [Google Scholar] [CrossRef]
- Wesley Jeevadason, A.; Kalidasa Murugavel, K.; Neelakantan, M.A. Review on Schiff bases and their metal complexes as organic photovoltaic materials. Renewable Sustainable Energy Rev. 2014, 36, 220–227. [Google Scholar] [CrossRef]
- Jeewoth, T.; Li Kam Wah, H.; Bhowon, M.G.; Ghoorohoo, D.; Babooram, K. Synthesis and anti-bacterial/catalytic prop-erties of Schiff bases and Schiff base metal complexes derived from 2, 3-diaminopyridine. Synth. React. Inorg. Met.-Org. Chem. 2000, 30, 1023–1038. [Google Scholar] [CrossRef]
- Temel, H.; Ziyadanoğullari, B.; Aydin, I.; Aydin, F. Synthesis, spectroscopic and thermodynamic studies of new transi-tion metal complexes with N,N′-bis(2-hydroxynaphthalin-1-carbaldehydene)-1,2-bis(m-aminophenoxy)ethane and their determination by spectrophotometric methods. J. Coord. Chem. 2005, 58, 1177–1185. [Google Scholar] [CrossRef]
- Champouret, Y.D.; Fawcett, J.; Nodes, W.J.; Singh, K.; Solan, G.A. Spacially confined M2 centers (M = Fe, Co, Ni, Zn) on a sterically bulky binucleating support: Synthesis, structures and ethylene oligomerization studies. Inorg. Chem. 2006, 45, 9890–9900. [Google Scholar] [CrossRef]
- Liu, X.; Manzur, C.; Novoa, N.; Celedón, S.; Carrillo, D.; Hamon, J.-R. Multidentate unsymmetrically-substituted Schiff bases and their metal complexes: Synthesis, functional materials properties, and applications to catalysis. Coord. Chem. Rev. 2018, 357, 144–172. [Google Scholar] [CrossRef]
- Hamada, Y.; Sano, T.; Fujii, H.; Nishio, Y.; Takahashi, H.; Shibata, K. White-light-emitting material for organic electro-luminescent devices. Jpn. J. Appl. Phys. 1996, 35, L1339. [Google Scholar] [CrossRef]
- Kawamoto, T.; Nishiwaki, M.; Tsunekawa, Y.; Nozaki, K.; Konno, T. Synthesis and characterization of luminescent zinc (II) and cadmium (II) complexes with N, S-chelating Schiff base ligands. Inorg. Chem. 2008, 47, 3095–3104. [Google Scholar] [CrossRef]
- Al Zoubi, W.; Al-Hamdani, A.A.S.; Ahmed, S.D.; Ko, Y.G. Synthesis, characterization, and biological activity of Schiff bases metal complexes. J. Phys. Org. Chem. 2018, 31, e3752. [Google Scholar] [CrossRef]
- Iftikhar, B.; Javed, K.; Khan, M.S.U.; Akhter, Z.; Mirza, B.; McKee, V. Synthesis, characterization and biological assay of Salicylaldehyde Schiff base Cu(II) complexes and their precursors. J. Mol. Struct. 2018, 1155, 337–348. [Google Scholar] [CrossRef]
- Rigamonti, L.; Reginato, F.; Ferrari, E.; Pigani, L.; Gigli, L.; Demitri, N.; Kopel, P.; Tesarova, B.; Heger, Z. From solid state to in vitro anticancer activity of copper(ii) compounds with electronically-modulated NNO Schiff base ligands. Dalton Trans. 2020, 49, 14626–14639. [Google Scholar] [CrossRef]
- Wehbe, M.; Leung, A.W.; Abrams, M.J.; Orvig, C.; Bally, M.B. A Perspective–can copper complexes be developed as a novel class of therapeutics? Dalton Trans. 2017, 46, 10758–10773. [Google Scholar] [CrossRef]
- Onwudiwe, D.C. , Arfin, T., Strydom, C.A., Arfin, T., Strydom, C.A. Fe(II) and Fe(III) complexes of N-ethyl-N-phenyl dithiocarbamate: electrical conductivity studies and thermal properties, Electrochim. Acta 2014, 127, 283–289. [Google Scholar] [CrossRef]
- Ahmed, A.H. , Moustafa, M.G. Spectroscopic, morphology and electrical conductivity studies on Co(II), Ni(II), Cu(II) and Mn(II)-oxaloyldihydrazone complexes, J. Saudi Chem. Soc. 2020, 24, 381–392. [Google Scholar] [CrossRef]
- Ibrahim, E.M.M., Abdel-Rahman, L.H., Abu-Dief, A.M., Elshafaie, A., Hamdan, S.K., Ahmed, A.M. The electric and thermoelectric properties of Cu(II)-Schiff base nano-complexes. Phys. Scr. 2018, 93, 055801. [CrossRef]
- Sarjanović, J. , Stojić, M., Rubčić, M., Pavić, L., Pisk, J. Impedance Spectroscopy as a Powerful Tool for Researching Mo-lybdenum-Based Materials with Schiff Base Hydrazones. Materials 2023, 16, 1064. [Google Scholar] [CrossRef]
- Pisk, J.; Šušković, M.; Topić, E.; Agustin, D.; Judaš, N.; Pavić, L. Molybdenum Complexes Derived from 2-Hydroxy-5-nitrobenzaldehyde and Benzhydrazide as Potential Oxidation Catalysts and Semiconductors. Int. J. Mol. Sci. 2024, 25, 4859. [Google Scholar] [CrossRef]
- Sarjanović, J. , Topić, E., Rubčić, M., Androš Dubraja, L., Pavić, L., Pisk, J. Evaluation of vanadium coordination com-pounds derived from simple acetic acid hydrazide as non-conventional semiconductors. J. Mater. Chem. C 2024, 12, 4013–4025. [Google Scholar] [CrossRef]
- Sarjanović, J. , Cader, M., Topić, E., Razum, M., Agustin, D., Rubčić, M., Pavić, L., Pisk, J. Bifunctional molybdenum and vanadium materials: semiconductor properties for advanced electronics and catalytic efficiency in linalool oxidation. Mater. Adv. 2024, 5, 9391–9402. [Google Scholar] [CrossRef]
- Topić, E. , Pisk, J., Agustin, D., Jenderlin, M., Cvijanović, D., Vrdoljak, V., Rubčić, M. Discrete and polymeric ensembles based on dinuclear molybdenum(VI) building blocks with adaptive carbohydrazide ligands: from the design to catalytic epoxidation. New J. Chem. 2020, 44, 8085–8097. [Google Scholar] [CrossRef]
- Xu, H.-M. , Liu, S. Acta Cryst. 2006, E62, 3026–3027. [Google Scholar] [CrossRef]
- Rubčić, M. , Galić, N., Halasz, I., Jednačak, T., Judaš, N., Plavec, J., Sket, P., Novak, P. Multiple solid forms of 1, 5-bis (salicylidene) carbohydrazide: Polymorph-modulated thermal reactivity. Cryst. Growth Des. 2014, 14, 2900–2912. [Google Scholar] [CrossRef]
- Yanping, R. , Rongbin, D., Liufang, W., Jigui, W. Synthesis, In Vitro Profiling, and In Vivo Evaluation of Ben-zohomoadamantane-Based Ureas for Visceral Pain: A New Indication for Soluble Epoxide Hydrolase Inhibitors. Synth.Commun. 1999, 29, 613–617. [Google Scholar] [CrossRef]
- Vrdoljak, V. Pavlović, G., Maltar-Strmečki, N., Cindrić, M. Copper(ii) hydrazone complexes with different nuclearities and geometries: synthetic methods and ligand substituent effects. New J. Chem 2016, 40, 9263–9274. [Google Scholar] [CrossRef]
- Zhang, H.-Y. , Wang, W., Chen, H., Zhang, S.-H., Li, Y. Five novel dinuclear copper (II) complexes: Crystal structures, properties, Hirshfeld surface analysis and vitro antitumor activity study. Inorg.Chim.Acta 2016, 453, 507–515. [Google Scholar] [CrossRef]
- Dragancea, D. , Shova, S., Enyedy, É.A., Breza, M., Rapta, P., Carrella, L.M., Rentschler, E., Dobrov, A., Arion, V.B. Copper (II) complexes with 1, 5-bis (2-hydroxybenzaldehyde) carbohydrazone. Polyhedron 2014, 80, 180–192. [Google Scholar] [CrossRef]
- Dragancea, D. , Addison, A.W., Zeller, M., Thompson, L.K., Hoole, D., Revenco, M.D., Hunter, A.D. Dinuclear Copper (II) Complexes with Bis-thiocarbohydrazone Ligands. Eur.J.Inorg.Chem. 2008, 16, 2530–2536. [Google Scholar] [CrossRef]
- Dhrubajyoti, M.; Bouzid, G.; Arka, D.; Sourav, R.; Sahbi, A.; Suman, H.; Sudipta, D. Synthesis, characterization, crystal structure, and fabrication of photosensitive Schottky device of a binuclear Cu(II)-Salen complex: a DFT investigations. RSC Adv., 2024, 14, 14992–15007. [Google Scholar] [CrossRef]
- Fouad, R.; Shaaban, I.A.; Ali, T.E.; Assirib, M.A.; Shenouda, S.S. Co(II), Ni(II), Cu(II) and Cd(II)-thiocarbonohydrazone complexes: spectroscopic, DFT, thermal, and electrical conductivity studies. RSC Adv. 2021, 11, 3772–37743. [Google Scholar] [CrossRef]
- Mashaly, M.M.; Ismail, T.M.; El-Maraghy, S.H.; Habib, H.A. Heteronuclear complexes of oxorhenium(V) with Fe(III), Co(II), Ni(II), Cu(II), Cd(II) and UO2(VI) and their biological activities. J. Coord. Chem. 2004, 57, 1099–1123. [Google Scholar] [CrossRef]
- Sarkar, D. , Rao, P.C., Aiyappa, H.B., Kurungot, S., Mandal, S., Ramanujam, K., Mandal, S. Multifunctional copper dimer: structure, band gap energy, catalysis, magnetism, oxygen reduction reaction and proton conductivity. RSC Adv. 2016, 6, 37515–37521. [Google Scholar] [CrossRef]
- Chai, L.-Q.; Li, Y.-X.; Chen,L. -C.; Zhang, J.-Y.; Huang, J.-J. Synthesis, X-ray structure, spectroscopic, electrochemical properties and DFT calculation of a bridged dinuclear copper(II) complex. Inorg. Chim. Acta. 2016, 444, 193–201. [Google Scholar] [CrossRef]
- Macdonald, J.R.; Johnson, W.B. Fundamentals of Impedance Spectroscopy. In Impedance Spectroscopy: Theory, Experi-ment, and Applications, 3rd ed.; Eds. Dr. Evgenij Barsoukov, Dr. J. Ross Macdonald, Ed.; John Wiley & Sons: Hoboken, NJ, USA, 2018; pp. 1–20. [Google Scholar] [CrossRef]
- Bonanos, N.; Pissis, P.; Macdonald, J.R. Impedance Spectroscopy of Dielectrics and Electronic Conductors. In Mater. Charact. 2012, 1–14. [Google Scholar] [CrossRef]
- Macdonald, J.R. Impedance Spectroscopy. Ann. Biomed. Eng. 1992, 20, 289–305. [Google Scholar] [CrossRef]
- Kojić, V.; Bohač, M.; Bafti, A.; Pavić, L.; Salamon, K.; Čižmar, T.; Gracin, D.; Juraić, K.; Leskovac, M.; Capan, I.; Gajović, A. Formamidinium Lead Iodide Perovskite Films with Polyvinylpyrrolidone Additive for Active Layer in Perovskite Solar Cells, Enhanced Stability and Electrical Conductivity. Materials 2021, 14, 4594. [Google Scholar] [CrossRef]
- Razum, M.; Pavić, L.; Pajić, D.; Pisk, J.; Mošner, P.; Koudelka, L.; Šantić, A. Structure–Polaronic Conductivity Relation-ship in Vanadate–Phosphate Glasses. J. Am. Ceram. Soc. 2024, 107, 5866–5880. [Google Scholar] [CrossRef]
- Pavić, L.; Nikolić, J.; Graça, M.P.F.; Costa, B.F.O.; Valente, M.A.; Skoko, Ž.; Šantić, A.; Moguš-Milanković, A. Effect of Controlled Crystallization on Polaronic Transport in Phosphate-based Glass-ceramics. Int. J. Appl. Glass Sci. 2019, 11, 97–111. [Google Scholar] [CrossRef]
- Garbarczyk, J.E.; Jozwiak, P.; Wasiucionek, M.; Nowinski, J.L. Nanocrystallization as a Method of Improvement of Electrical Properties and Thermal Stability of V2O5-Rich Glasses. J. Power Sources 2007, 173, 743–747. [Google Scholar] [CrossRef]
- Murawski, L.; Chung, C.H.; Mackenzie, J.D. Electrical Properties of Semiconducting Oxide Glasses. J. Non-Cryst. Sol-ids 1979, 32, 91–104. [Google Scholar] [CrossRef]
- Pietrzak, T.K.; Pawliszak, Ł.; Michalski, P.P.; Wasiucionek, M.; Garbarczyk, J.E. Highly Conductive 90V2O5·10P2O5 Nanocrystalline Cathode Materials for Lithium-Ion Batteries. Procedia Eng. 2014, 98, 28–35. [Google Scholar] [CrossRef]
- Ali, M.; Murugavel, S. Mechanism of Polaronic Conduction in Olivine Phosphates: An Influence of Crystallite Size. J. Phys. Chem. C 2022, 127, 585–591. [Google Scholar] [CrossRef]
- Miessler, G.L.; Fischer, P.J.; Tarr, D.A. Inorganic Chemistry. Pearson, 2014.
- Topić, E. , Pisk, J., Agustin, D., Jenderlin, M., Cvijanović, D., Vrdoljak, V., Rubčić, M. Discrete and polymeric ensembles based on dinuclear molybdenum(VI) building blocks with adaptive carbohydrazide ligands: from the design to catalytic epoxidation. New J. Chem. 2020, 44, 8085–8097. [Google Scholar] [CrossRef]
- Xu, H.-M. , Liu, S. Acta Cryst. 2006, E62, 3026–3027. [Google Scholar] [CrossRef]
- Rubčić, M. , Galić, N., Halasz, I., Jednačak, T., Judaš, N., Plavec, J., Sket, P., Novak, P. Multiple solid forms of 1, 5-bis (salicylidene) carbohydrazide: Polymorph-modulated thermal reactivity. Cryst. Growth Des. 2014, 14, 2900–2912. [Google Scholar] [CrossRef]
- Yanping, R. , Rongbin, D., Liufang, W., Jigui, W. Synthesis, In Vitro Profiling, and In Vivo Evaluation of Ben-zohomoadamantane-Based Ureas for Visceral Pain: A New Indication for Soluble Epoxide Hydrolase Inhibitors. Synth.Commun. 1999, 29, 613–617. [Google Scholar] [CrossRef]
- WinFIT software, version 3.2, Novocontrol Technologies GmbH & Co. KG, Hundsangen, Germany.
Scheme 1.
Ligands used in the presented research.
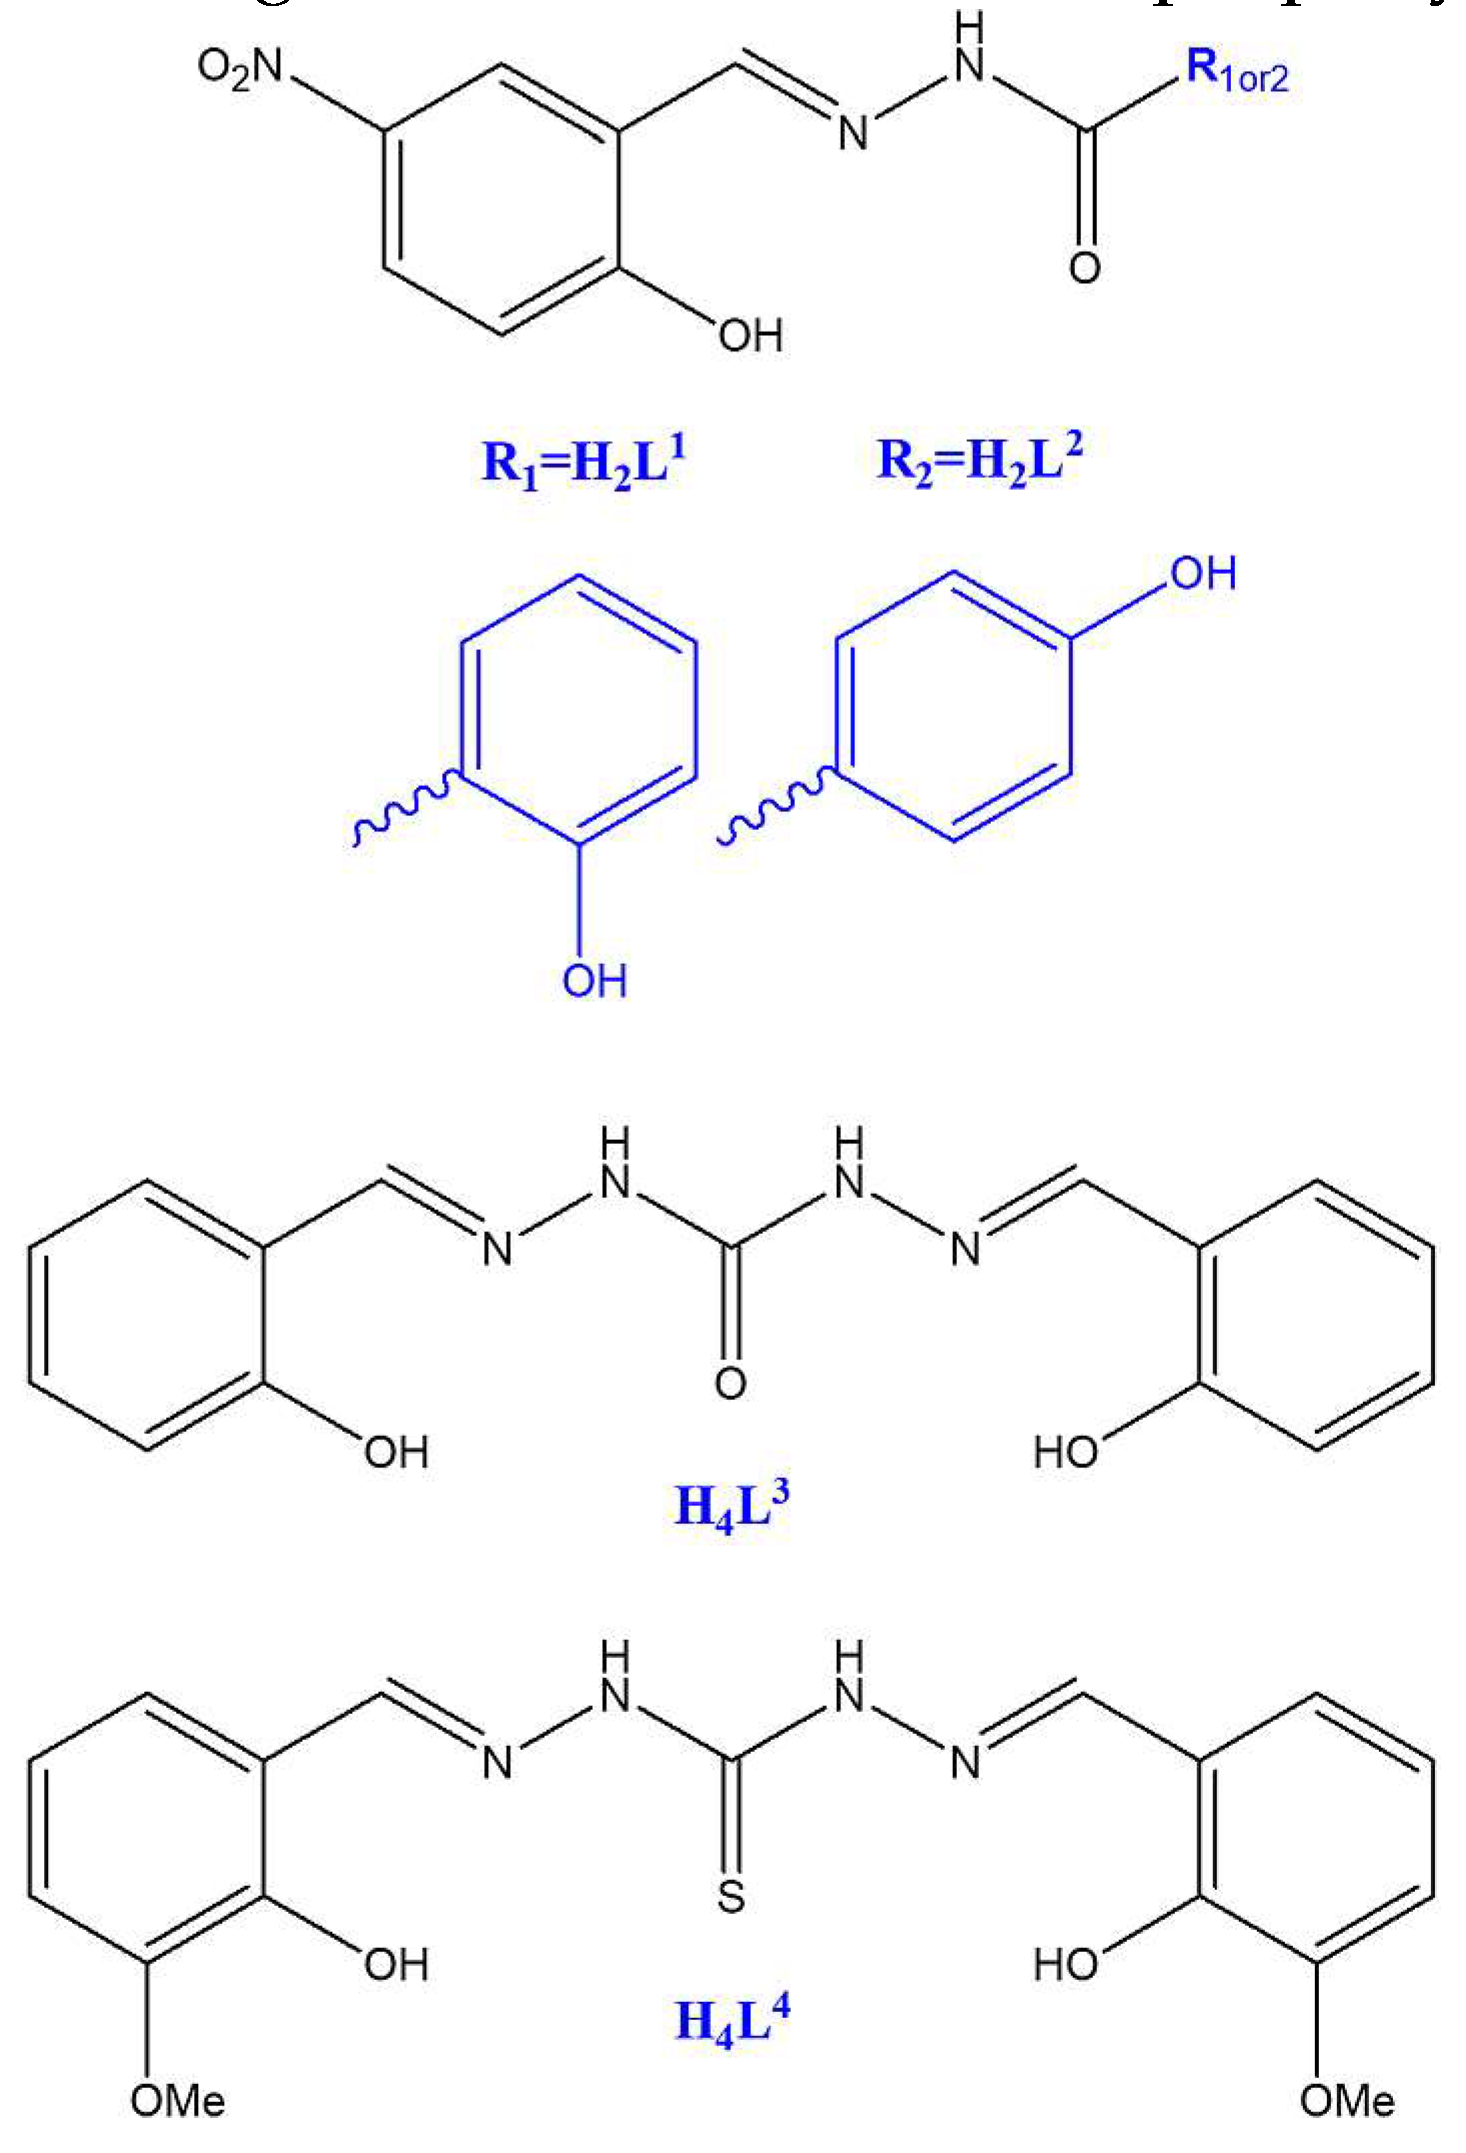
Figure 1.
TG/DSC curves for the complexes: (a)[Cu2(L1)2], (b) [Cu2(L2)2]∙3MeOH, (c) [Cu2(L3)(H2O)2], and (d) [Cu2(L4)(H2O)2].
Figure 1.
TG/DSC curves for the complexes: (a)[Cu2(L1)2], (b) [Cu2(L2)2]∙3MeOH, (c) [Cu2(L3)(H2O)2], and (d) [Cu2(L4)(H2O)2].
Scheme 2.
(above) Abstract presentation of supposed Cu structures. Grey teardrop presents Cu atom, purple O is the aldehyde part of the ligand, while red O, N and S are from the hydrazide part of the ligand. The blue sphere presents a water molecule. (below) Supposed structural and molecular formula.
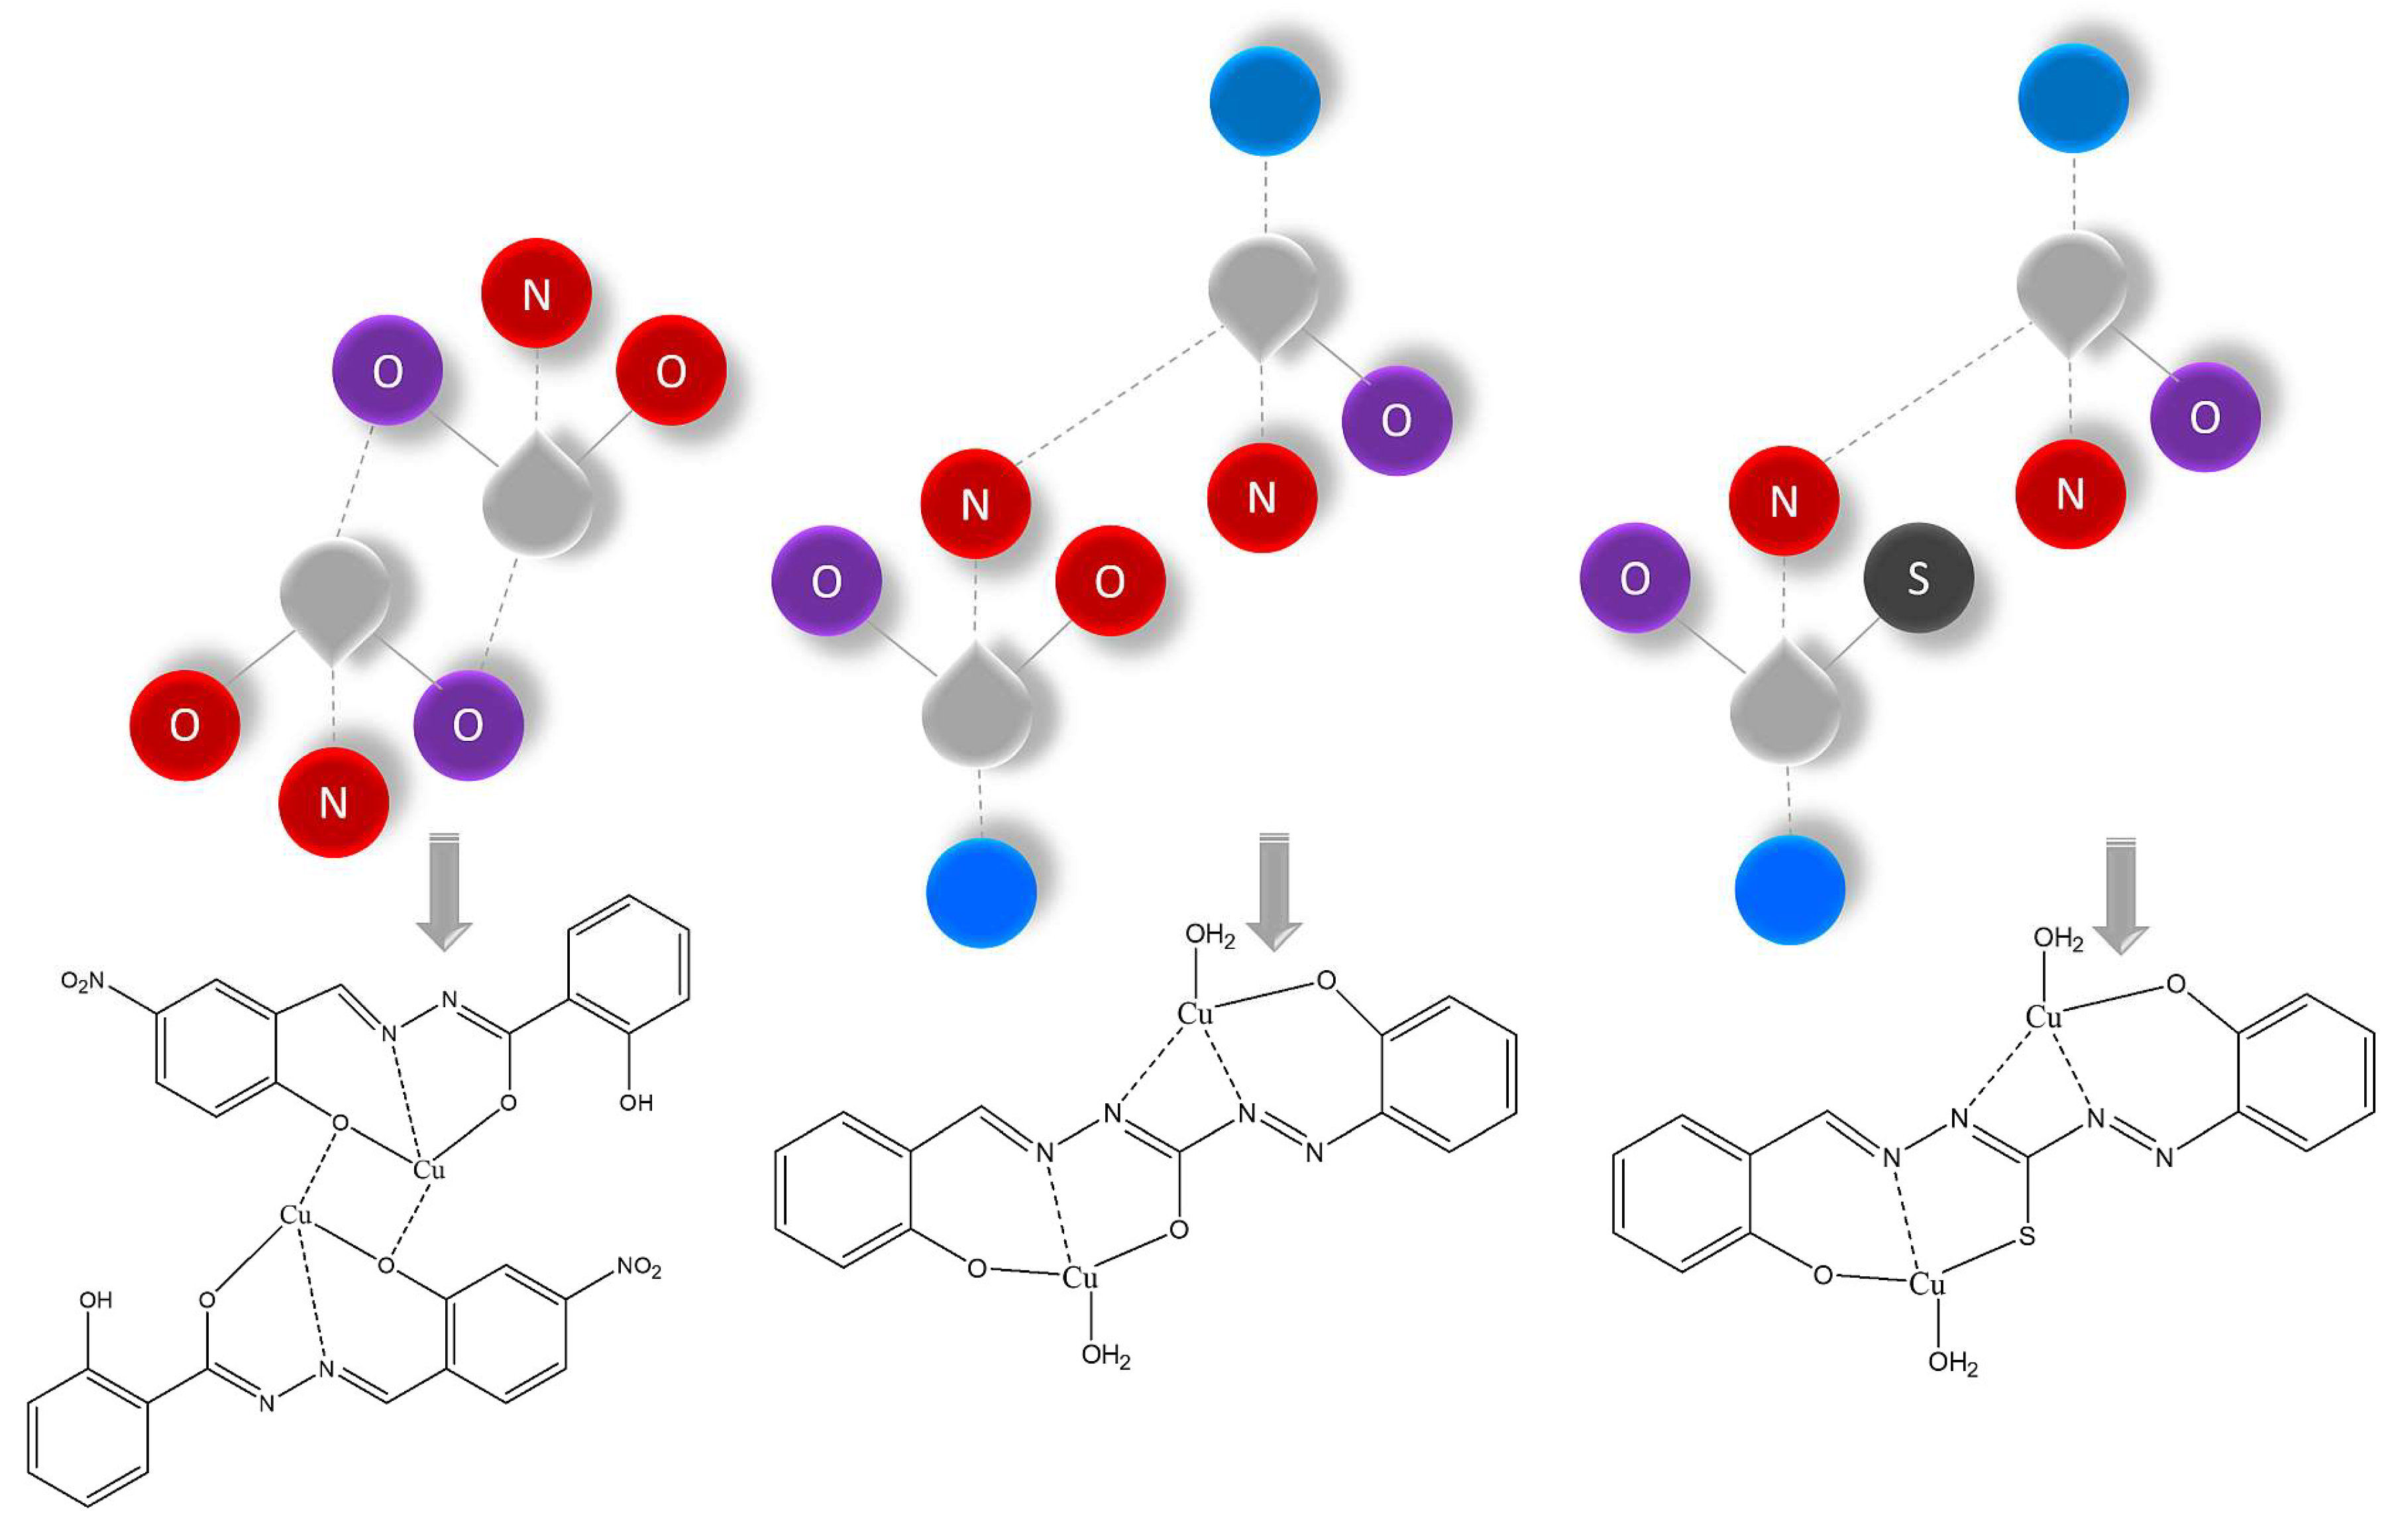
Figure 2.
(a) Kubelka–Munk diffuse reflectance absorption spectrum of compounds [Cu2(L1)2] (lemon green curve), [Cu2(L2)2]∙3MeOH (blue curve), [Cu2(L3)(H2O)2] (dark green curve), and [Cu2(L4)(H2O)2] (red curve); and (b) direct optical transitions. Extrapolated linear lines indicate the band gap energies Eg([Cu2(L1)2] ) =2.68 eV, Eg( [Cu2(L2)2]∙3MeOH) =2.51 eV, Eg([Cu2(L3)(H2O)2]) =2.70 eV, and Eg([Cu2(L4)(H2O)2]) =2.13 eV.
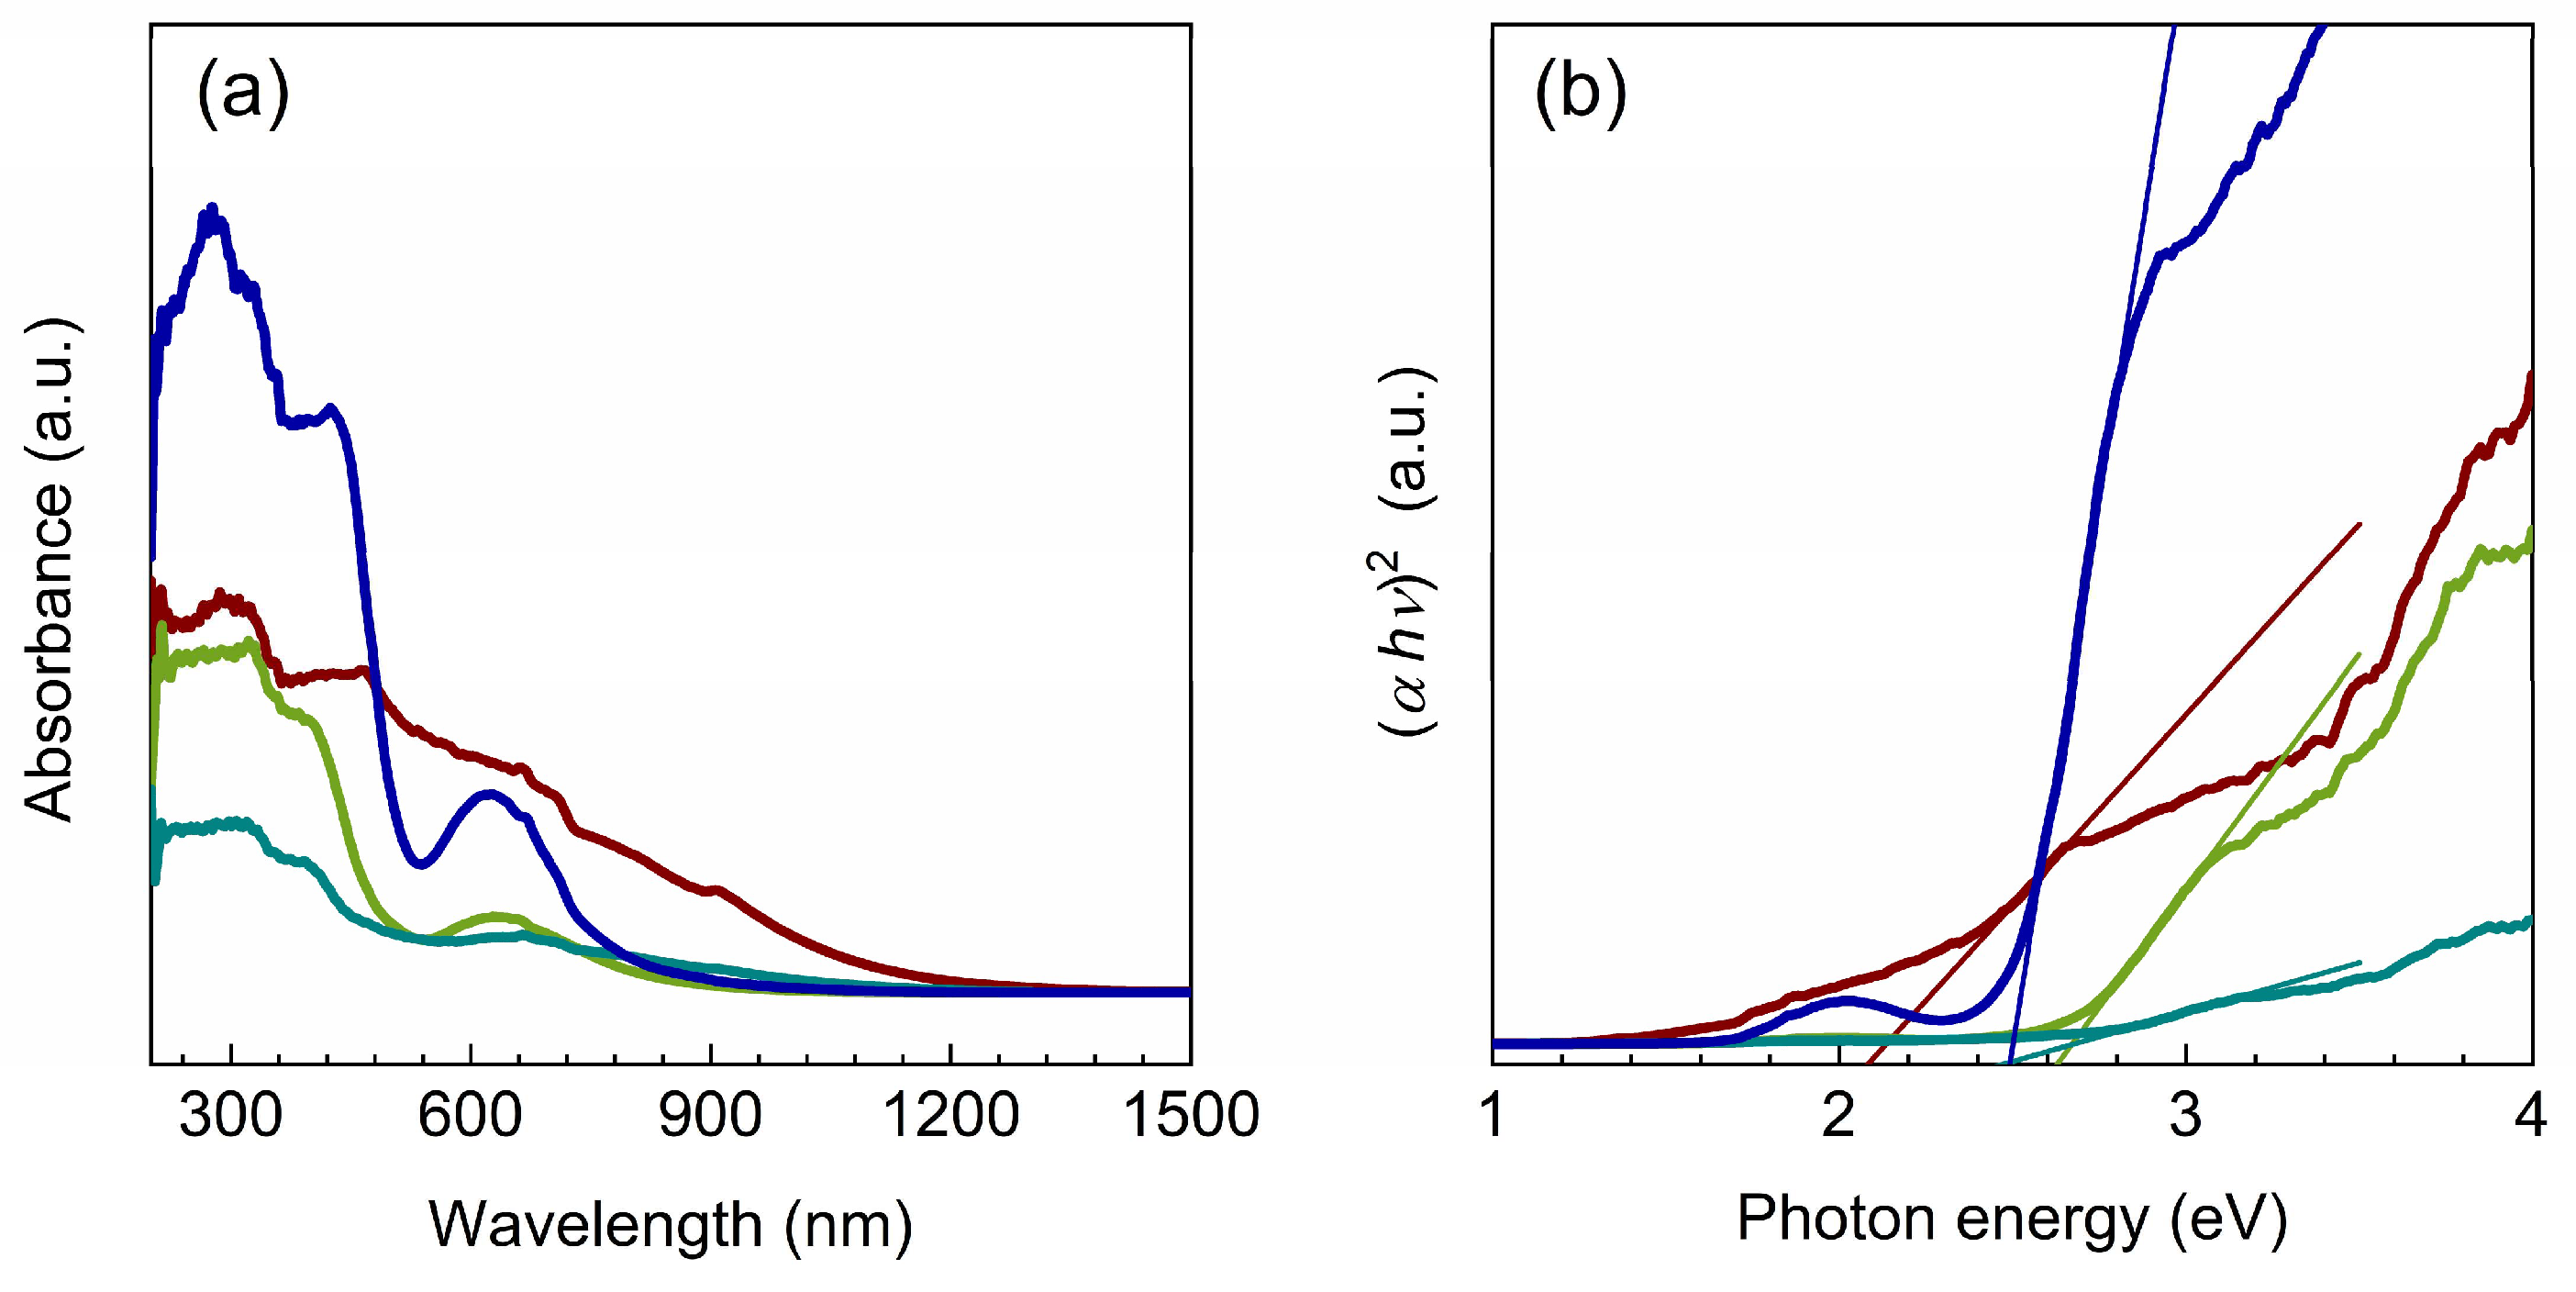
Figure 3.
Conductivity spectra for dinuclear [Cu2(L1)2] complex in heating (a) and cooling (b) cycle, (c) Arrhenius plot - temperature dependence of DC conductivity (log(σDC) vs. 1000/T) for both cycles (red circle—heating, blue circle—cooling), and (d) Nyquist plot at 200 °C. The corresponding equivalent circuit in (d) used for fitting the data is shown in the inset, open circles denote experimental values, while a solid red line corresponds to the best fit. Dashed lines in (c) represent the least-square linear fits to experimental data.
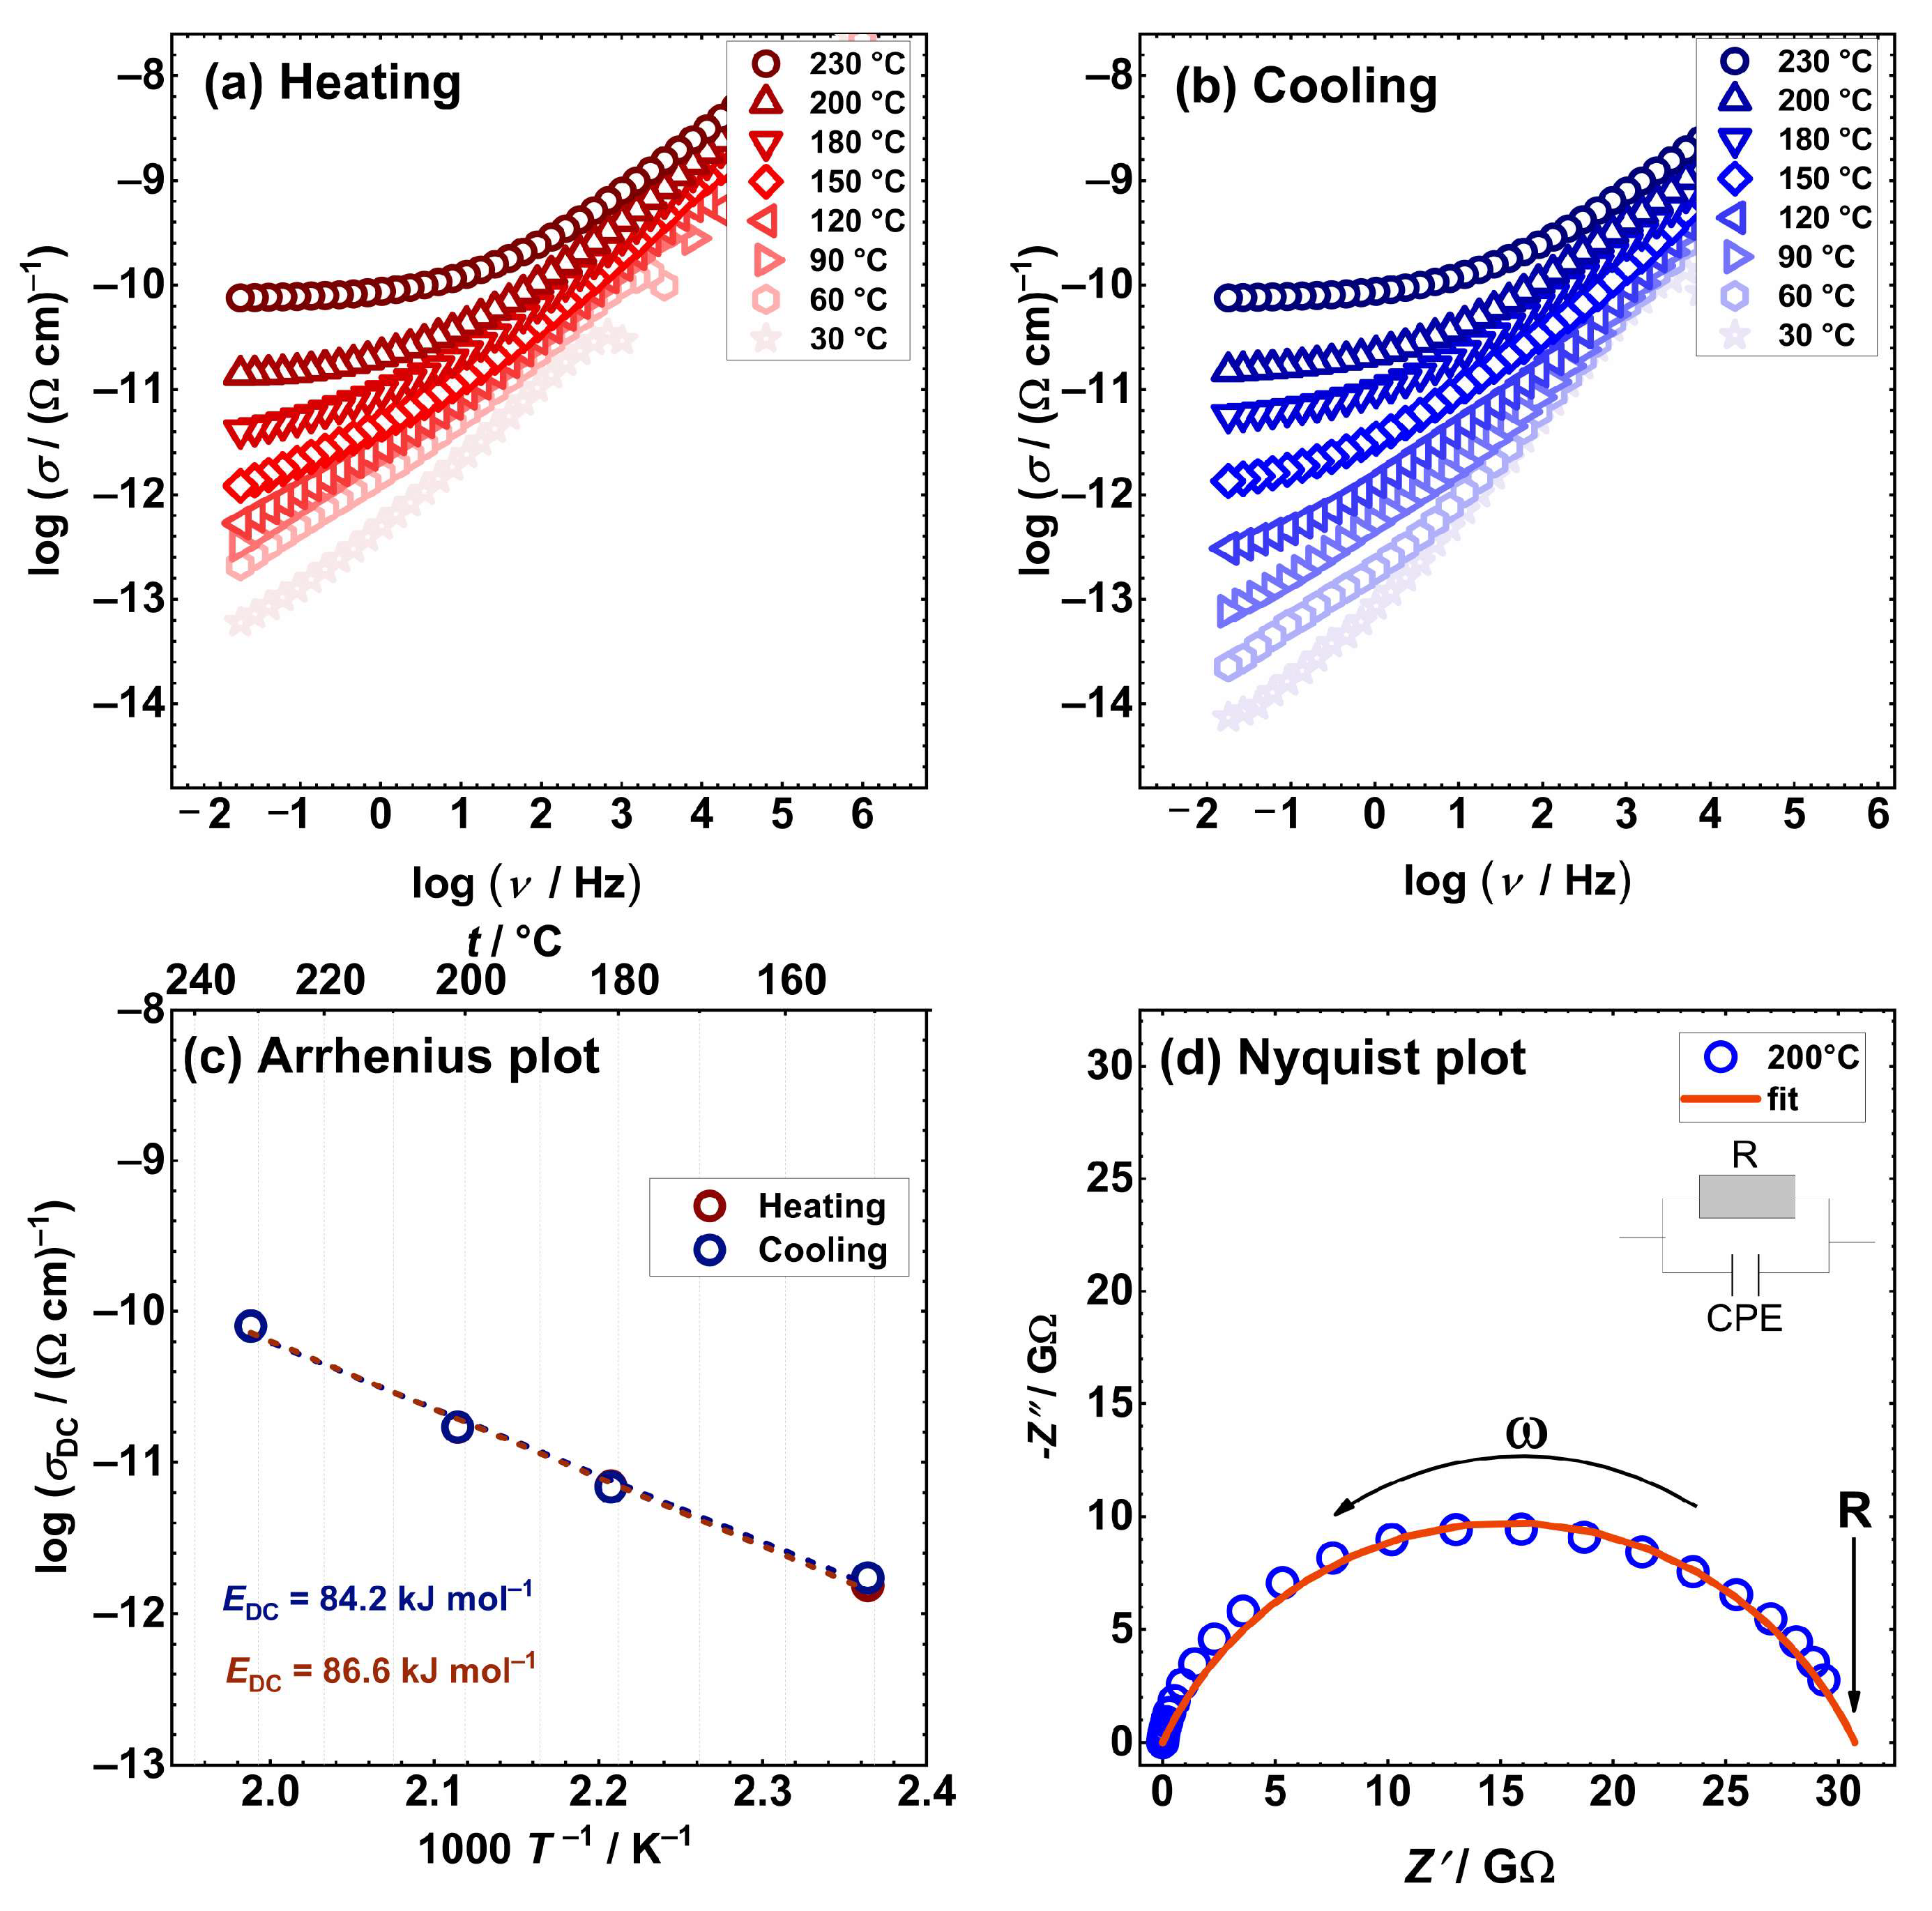
Figure 4.
Conductivity spectra for dinuclear [Cu2(L2)2]∙3MeOH complex in heating (a) and cooling (b) cycle, and (c) Arrhenius plot - temperature dependence of DC conductivity (log(σDC) vs. 1000/T) for both cycles (red circle - heating, blue circle - cooling). Dashed lines in (c) represent the least-square linear fits to experimental data.

Figure 5.
Conductivity spectra for [Cu2(L3)(H2O)2] complex in heating (a) and cooling (b) cycle, and (c) Arrhenius plot – temperature dependence of DC conductivity (log(σDC) vs. 1000/T) for both cycles (red circle – heating, blue circle – cooling). Dashed lines in (c) represent the least-square linear fits to experimental data.
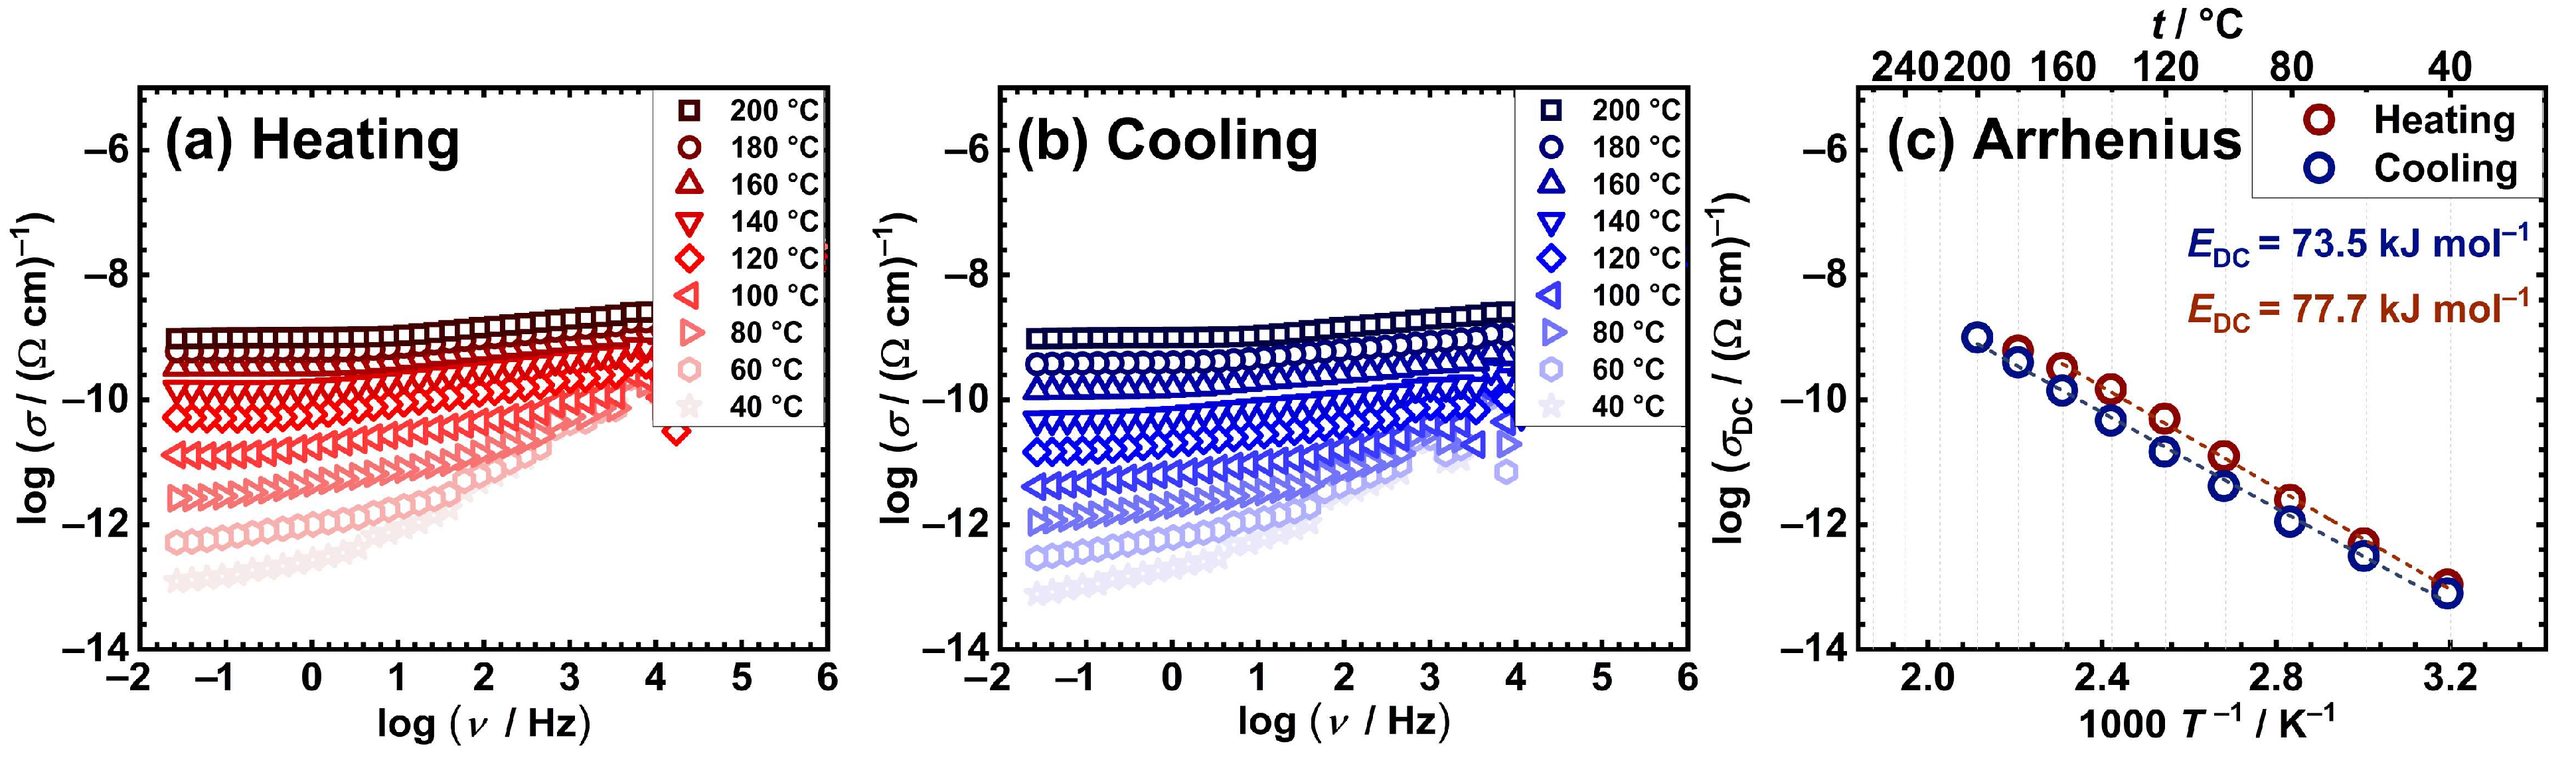
Figure 6.
Conductivity spectra for [Cu2(L4)(H2O)2] complex in heating (a) and cooling (b) cycle, and (c) Arrhenius plot – temperature dependence of DC conductivity (log(σDC) vs. 1000/T) for both cycles (red circle – heating, blue circle – cooling). Dashed lines in (c) represent the least-square linear fits to experimental data.
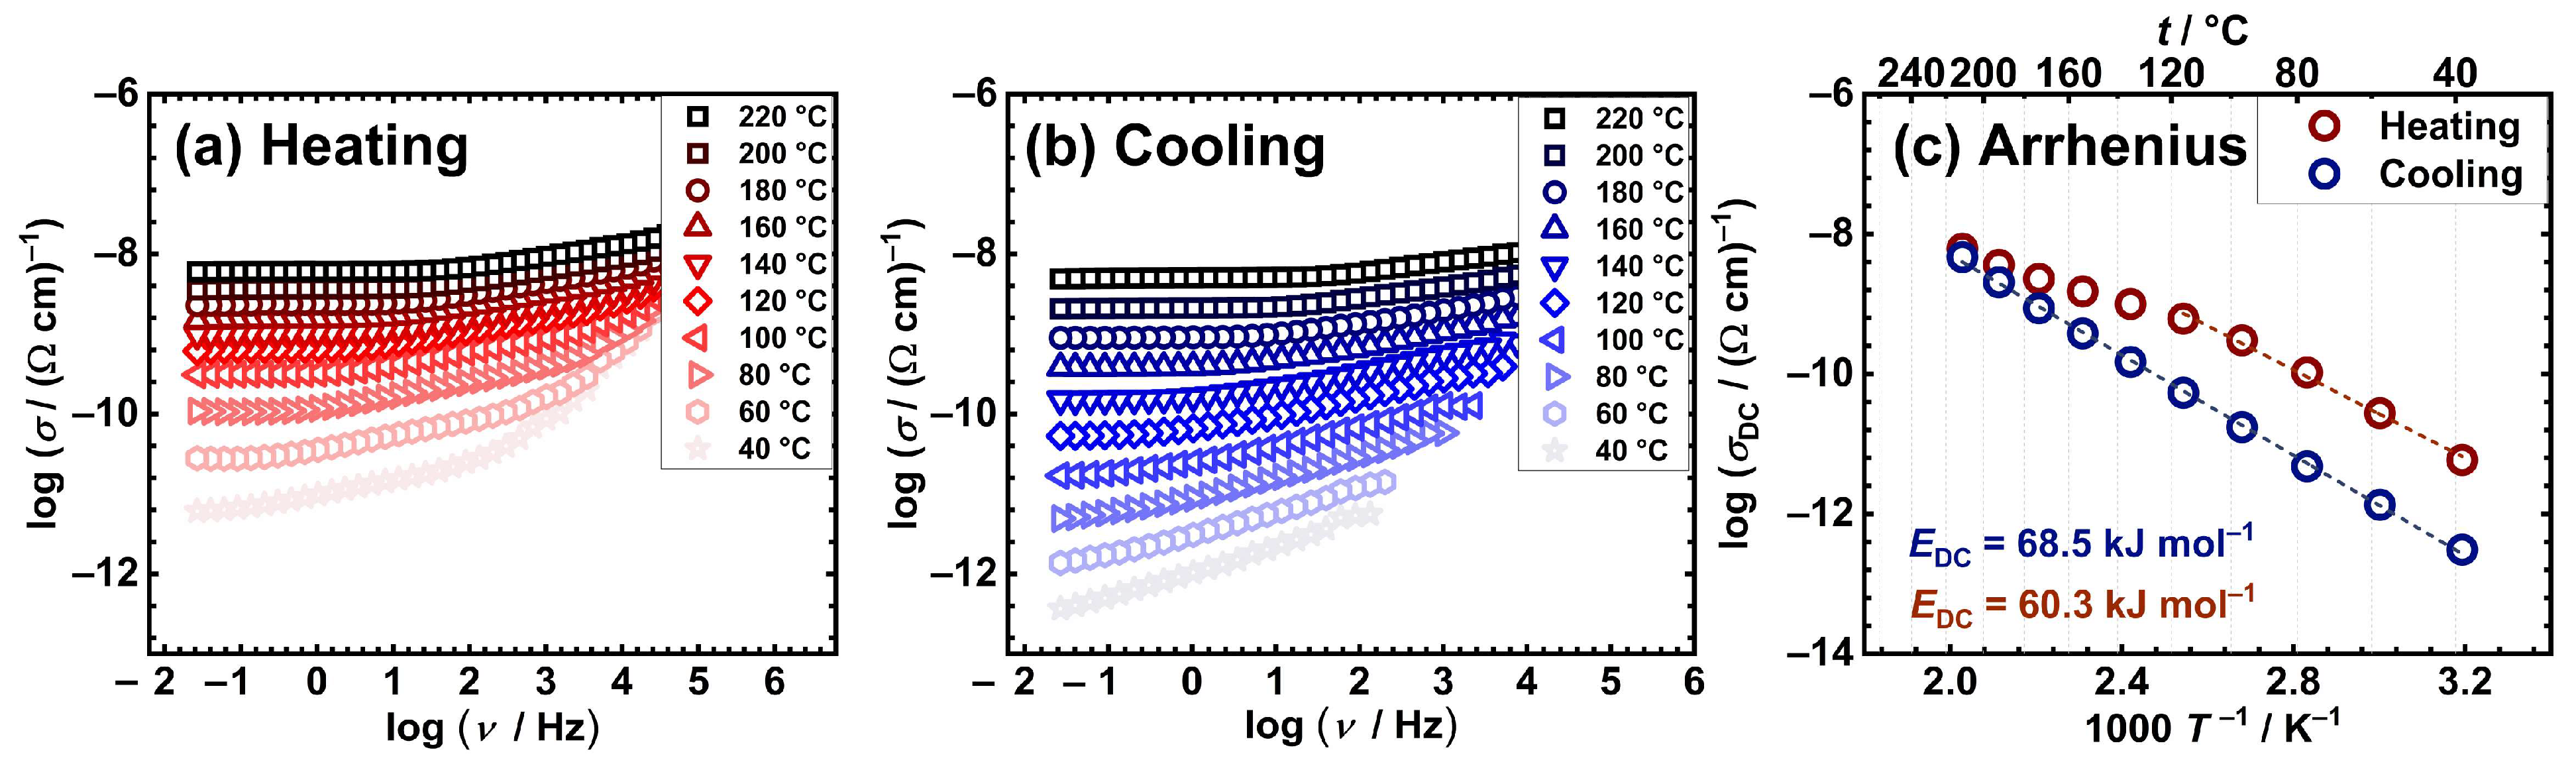

Table 1.
Electrical parameters of the obtained Cu-based complexes.
| Sample | aσDC / (Ω cm)–1 |
EDC / kJ mol‒1 (Heating run) |
EDC / kJ mol‒1 (Cooling run) |
|---|---|---|---|
| [Cu2(L1)2] | 7.6×10⁻¹¹ | 86.6 | 84.2 |
| [Cu2(L2)2]∙3MeOH | 1.7×10⁻¹⁴ | 81.0 | 83.1 |
| [Cu2(L3)(H2O)2] | 6.1×10⁻¹⁰ | 77.7 | 73.5 |
| [Cu2(L4)(H2O)2] | 3.6×10⁻⁹ | 60.3 | 68.5 |
ameasured @ 200 °C.
Disclaimer/Publisher’s Note: The statements, opinions and data contained in all publications are solely those of the individual author(s) and contributor(s) and not of MDPI and/or the editor(s). MDPI and/or the editor(s) disclaim responsibility for any injury to people or property resulting from any ideas, methods, instructions or products referred to in the content. |
© 2024 by the authors. Licensee MDPI, Basel, Switzerland. This article is an open access article distributed under the terms and conditions of the Creative Commons Attribution (CC BY) license (http://creativecommons.org/licenses/by/4.0/).
Copyright: This open access article is published under a Creative Commons CC BY 4.0 license, which permit the free download, distribution, and reuse, provided that the author and preprint are cited in any reuse.


