Submitted:
06 December 2024
Posted:
09 December 2024
Read the latest preprint version here
Abstract
Muscle fatigue affects player’s performance. The aim of the present study was to investigate changes in isokinetic torque and power of lower limbs, in young female soccer players, in training microcycle of competitive season. The sample consisted of 11 female soccer players U17 (age: 16.3±0.8 years, height: 166.4±6.4 cm, body weight: 64.7±11.7 kg) who competed in the 3rd national division championship. The participants were assessed isokinetically (concentric assessment of knee extensors/flexors muscles in three different angular speeds: 60°/s, 180°/s, 300°/s) and in counter movement jump, 72 hours before and 24, 48 and 72 hours after the match. Significant differences were revealed (F=5,681, p=0.038) in isokinetic assessment. Extensors significantly differed at 60°/s between initial measurements and 48 hours after the match (p=0.008), as well as 48 to 72 hours postmatch (p=0.017). Flexors significantly differed between the measurements at 24 to 48 hours at 300°/s (p=0.025). Analysis of the CMJ data showed that both CMJ with and without arm swing had no significant differences in performance between all four measurements. Knee muscles isokinetic assessment is an indicator of muscle fatigue, following a match. Planning of training microcycle should be designed according to the specific needs and characteristics of female soccer players.
Keywords:
isokinetic assessment
; knee extensors muscles
; knee flexors muscles
; CMJ
1. Introduction
The evaluation of muscular strength allows determining an athlete’s muscular profile, particularly to recognize the muscle imbalances and deficits which play an important role in athletic performance [1]. In recent decades isokinetic assessment has been widely used as a method for assessing muscular strength and muscle balance as the isokinetic dynamometer provides valid and reliable data [2]. Changes in isokinetic torque, work and power parameters are closely related to changes in the functional performance of the athlete [3]. Muscular assessment with an isokinetic dynamometer will be useful in the process of prevention, training and rehabilitation of athletes [4]. The isokinetic assessment is necessary in high-performance sports, as it allows training experts to determine and quantify the muscle performance and balance of athletes. Such an evaluation makes it possible to design specific and functional programs for the muscles of lower limbs [3].
In recent years according to FIFA, 40 million female players have been actively involved in soccer [5]. The increased occupation of women in soccer boosted the interest of researchers, regarding the physiological requirements of a female soccer match [6,7]. So far, the majority of studies have investigated the effect of fatigue, caused by the match, in the ratio of (H) eccentric: (Q) concentric in male soccer players [8,9,10]. Even intermittent protocols in treadmill, that replicate the soccer match, appear to cause significant reductions in the H/Q ratio, ranging from 9.3% to 29.8% in amateur and professional soccer players with 120°/s, 180°/s, 300°/s angular velocity [8,9]. More recent studies have used field protocols which better represent the match conditions [10]. The researchers showed significant decreases in the ratio (H) eccentric: (Q) eccentric ranging from 14.4% to 17.7% angular velocity between 60-180°/s [8,10]. Consequently, effective recovery is important especially when the time until the next match is short. So it is necessary to understand all the physiological changes that occur over time after a female soccer match in order to develop effective strategies that will accelerate the recovery process [6].
Counter Movement Jump (CMJ) is a practical monitoring tool for athletes used to assess lower limbs power and more specifically for the measurement of muscular strength, for the assessment of the efficiency of training programs and for the course of the muscular power recovery [11]. The performance of CMJ is determined by the interaction of many factors including the maximum muscular power produced and the neuromuscular coordination of the upper and lower limbs [12]. It is obvious that the results of CMJ measurements can provide insight into many variables related to the neuromuscular function. However, the most sensitive factors associated with neuromuscular fatigue remain unclear [13]. Most of CMJ analyses are limited to the values of height, maximum and average power which are related to the concentric phase of the jump [14,15]. Furthermore, the easy implementation and low cost of CMJ application allows for repeated measurements of many athletes in a short period of time.
Previous researchers have examined the CMJ reliability using data from just one jump in each assessment [14,16,17]. At the same time, other studies have shown that multiple jumps increase the reliability of CMJ measurement which can improve the evaluation of neuromuscular fatigue [18]. The usual CMJ analyses overlook the performance in the eccentric jump phase, although it is an important factor of stretch-shortening cycle and neuromuscular function [19]. Many studies have showed a significant decrease in jump performance after a simulated match play [20] while others noticed no change right after the game compared to the initial measurements [21]. These findings underline the complexity of assessing neuromuscular fatigue and suggest that a more thorough analysis of CMJ will provide a better illustration of fatigue and its recovery associated with neuromuscular changes.
The purpose of this study was to investigate the changes in isokinetic muscular strength and power of lower limbs in young female soccer players in training microcycle of competitive season. More specifically, the research intended to examine the course of recovery at 24, 48 and 72 hours after a match in young amateur female soccer players as studies are limited to male or professional soccer players.
The hypotheses which were examined was that the muscle torque of the anterior and posterior thigh muscles and the muscular power of lower limbs in young female soccer players will be reduced 24, 48, 72 hours after the match.
2. Materials and Methods
2.1. Experimental Design
The research was conducted in the last four matches of the competitive season when the female athletes still had high training and match load. The examinees abstained 48 hours from any training stimulus before coming for the initial measurements. Their physical activity was tested 72 hours before the match. Then, after 72 hours, an official match took place, followed by measurements at 24, 48 and 72 hours. After each match, female soccer players were selected except for goalkeeper, provided they have competed throughout the match. The examinees during the period of measurements did not participate in any sports activity of the team or school. The same procedure was followed for the next three games in order to complete the required number of female soccer players needed for the study.
2.2. Participants
The total sample consisted of 11 young healthy female soccer players U17 (age: 16.3±0.8 years, height: 166.4±6.4 cm, body weight: 64.7±11.7 kg, training experience: 5.5±1.8 years) who competed in the championship of the third national category. The selection criteria included: a) training experience ≥3 years, b) absence of musculoskeletal injuries in the last six months, c) abstinence from any ergogenic dietary supplement or medication ≥6 months, d) participation in ≥4 training sessions and 1 match per week, e) data were collected only from female soccer players who participated throughout a soccer match, f) female soccer players participated voluntarily in the study, informed consent from their parents was obtained after verbal and written explanation of the experimental design and potential risks of the study. The participants were aware that they could withdraw at any time from the study. The local Institutional Review Board approved the study (approval number 226/2024), in accordance with the principles of the Helsinki Declaration.
2.3. Description of the Instruments
For data collection were used: to record somatometric characteristics (height and weight), telescopic height rod with scale (Seca 220e; Gmbh & Co, Hamburg, Germany), Myotester (Myotest SA Switzerland) to evaluate CMJ without arm swing and CMJ with arm swing and Cybex NORM dynamometer (Cybex, division of Lumex, Inc., Ronkonkoma, New York, USA) for the isokinetic evaluation of lower limbs.
2.4. Description of the Tests
2.4.1. Counter Movement Jump (CMJ)
In the CMJ evaluation test: a belt was placed in the waist of the female athlete, on which the Myotester (Myotest SA, Switzerland) device was applied. The athlete after the sound stimulus made two jumps with preparatory movement without arm swing. The same process was repeated with arm swing too.
2.4.2. Isokinetic Evaluation
In the isokinetic evaluation test, the examinee was placed on the isokinetic dynamometer chair and stabilized with straps. The placement of the examinees was based on the instructions of the Humac Norm user’s manual for the assessment of knee flexion from a sitting position. A concentric protocol in three angular velocities of 60°, 180°, 300°/s was selected. The range of motion of knee joint and the anatomical zero, were determined and the the gravity correction for the lower limb was recorded. After these procedures the examinee carried out three knee flexion-extension attempts, twice for each angular velocity (60°, 180°, 300°/s) with an intermediate rest of 60” between each set and each angular velocity. With the same sequence, the procedure was performed on the other leg too.
2.5. Measurement Procedure
The measurement process took place from 3 to 5 p.m. in every evaluation session. The initial measurements that carried out assumed that the examinees were relaxed. Before the start of the measurements, the examinees performed a 10 ́ warm-up that included 5 ́on the cycle ergometer (Monark 839E, Monark Exercise AB, Sweden) and a 5 ́stretching. The first test that was carried out was the assessment of CMJ using Myotester. Each examinee performed two jumps without arm swing and two jumps with arm swing with a 2 ́ intermediate rest. The last test was the isokinetic assessment. After the examinee was placed on the dynamometer, the measurement protocol was implemented, which included three knee flexion-extension attempts, as described above. The tests as well as the measurement protocols were performed in the same sequence at 24, 48 and 72 hours after the match.
2.6. Statistical Analysis
For the statistical analysis was used the statistical package IBM SPSS Statistics for Windows, Version 25.0. Armonk, NY: IBM Corp. Descriptive statistics were performed to calculate the averages and standard deviations. Moreover, a test for normal distribution (Kolmogorov-Smirnov test) was applied (all variables were equally distributed). In addition, repeated measurements of variance analysis were performed (GLM Repeated Measures ANOVA). The level of statistical significance was set at p<0.05.
3. Results
The analysis of isokinetic assessment data showed an interaction between the velocity, the muscle group and the time. A statistical significant difference revealed between the variables (F=5.681, p=0.038). In terms of absolute values, there were statistically significant differences at different time points in the anterior thigh muscles at 60°/s. More specifically, the initial measurements compared to those 48 hours after the match (p=0.008), as well as the 48 with 72 hours (p=0.008, p=0.017). However, there were no statistically significant differences between the four time points at both 180°/s and 300°/s. Regarding the posterior thigh muscles, there were statistically significant differences between the measurements at 24 and 48 hours only at 300°/s (p=0.025) (Table 1 and Table 2, Figure 1 and Figure 2).
After analyzing the isokinetic assessment data relating to the body weight, an interaction occurred between the velocity, the muscle group and the time. A statistical significant difference revealed between the variables (F=6.041, p=0.034). Particularly, it appeared that at 60°/s the anterior thigh muscles had a statistically significant difference between the first measurement performed before the match compared to the measurement at 24 and 48 hours (p24=0.034, p48=0.005) (Table 3).
There was also a statistically significant difference in the anterior thigh muscles at 60°/s between 48 and 72 hours (p=0.018). However, in the posterior thigh muscles at 60°/s there were no statistically significant differences between the four time points. The results were similar at 180°/s and 300°/s where there were no statistically significant differences in both anterior and posterior thigh muscles for any time moment (Table 4, Figure 3 and Figure 4).
Analysis of the CMJ data showed that in CMJ without arm swing there were no differences in the performance between the four measurements (Table 5).
The results for the CMJ with arm swing were similar, where minor differences between the height of the four jumps may have also appeared, but the analysis showed that they were not statistically significant (Table 6).
4. Discussion
Our initial hypotheses confirmed partially. More specifically we observed a decrease in the concentric maximum strength of the anterior thigh muscles of female soccer players after a match in a slow angular velocity. As for the posterior thigh muscles, their strength decreased only at high angular velocities the next day of the match.
The analysis of the results regarding the absolute values of isokinetic torque showed significant differences between the different moments in anterior thigh muscles at 60°/s. In the initial measurements compared to 48 hours after the match, there was a decrease in the torque produced due to the delayed onset of fatigue after the match. Moreover, there was a noticeable difference in both absolute and relative values of isokinetic torque between 48 and 72 hours at 60°/s, indicating that the levels of strength have returned to their initial levels.
Similar results were found by Ascensão et al. (2008) [22], who assessed the isokinetic torque of knee flexors and extensors of the dominant leg at 90°/s in 16 male soccer players. The researchers found that the maximum torque of the anterior thigh muscles showed its greatest decrease at 48 hours. The above data came into conflict with the study of Silva et al. (2013) [23], where the participants performed maximum concentric isokinetic knee flexions and extensions at different time points at 90°/s. The researchers concluded that the changes in isokinetic strength at 24, 48 and 72 hours after the match were not statistically significant compared to the pre-game measurements. It was obvious that high-level soccer players, due to better training background, had a greater ability to manage the requirements of the match showing a smaller reduction in their performance [24]. On the other hand, in a study conducted on female soccer players were observed differences regarding the time point where the highest reduction of isokinetic torque occurred. More specifically, Andersson et al. (2008) [6] found that the maximum torque of knee extensors was significantly reduced at 5 and 21 hours and returned to the initial levels at 27 hours after the match. Although little data was available on female soccer and recovery of strength after the match, it was understood by previous research in male soccer players that the decrease of strength is derived from the inability of voluntarily contraction due to the muscle shortening [25].
After analyzing the data of isokinetic assessment regarding the maximum torque of anterior thigh muscles at 180°/s and 300°/s, there were no significant differences between the four time points. To date, there has been no relevant study conducted in the female population and examined the female soccer players at similar angular velocities. However, in a study performed in male soccer players that examined the transient changes in the isokinetic strength of knee extensors after a match, Draganidis et al. (2015) [26] found that the concentric maximum torque of knee extensors at 180°/s remained reduced in both legs up to 60 hours. This was probably due to the fact that the players who participated in the research trained the days after the match, resulting in a prolonged reduction in their performance. Furthermore, the fact that they were amateurs justifies the greatest football stress that resulted in the different recovery after the match [24]. As for the posterior thigh muscles, there were significant differences between the measurements at 24 compared to 48 hours only at 300°/s. The above data was confirmed by Andersson et al. (2008) [6], who evaluated female soccer players and concluded that the maximum torque in knee flexion was significantly reduced at 21 and 27 hours and returned to the initial levels at 51 hours.
After analyzing the data of the isokinetic assessment in relation to the body weight, an interaction emerged between the velocity, the muscle group and the time that resulted in the differentiation of the performance. In particular, it appeared that at 60°/s the anterior thigh muscles had a statistically significant difference between the first measurements taken before the match in relation to the measurements taken at 24 and 48 hours. However, there was no change for the anterior thigh muscles at 180°/s and 300°/s for any time point. It is worth noting that there is no data so far from other researchers so that a comparison can be made with the results of the present study. Regarding the posterior thigh muscles, there were no differences in the relative values for all four time points. However, contrary results were found by Delextrat et al. (2011) [24] who wanted to investigate whether a field test representing specific soccer movements caused fatigue in female soccer players. Particularly, it turned out that the relative values of maximum torque of the posterior thigh muscles were significantly reduced compared to the values before the LIST.
The analysis of CMJ data showed that there were no changes in the performance between measurements at any of the four time points, both without arm swing and with arm swing. The match did not seem to affect the power of lower limbs in young female soccer players, fact that contradicted the research of Thomas et al. (2017) [27] who studied the course of recovery after a match, through a series of CMJ measurements on male semi-professional soccer players. The researchers noted a decrease in CMJ performance compared to the initial measurements immediately after the match, after 24, 48 and 72 hours. Furthermore, the results of Nedelec et al. (2014) [28] were similar, who evaluated the CMJ after a soccer match and found a reduction in the performance.
However, there was little information available regarding to neuromuscular changes that occur after a match in female soccer. In a previously research conducted by Hoffman et al. (2003) [21], the results seemed to agree with similar studies in male soccer players and found, regardless of the competing level, a reduction in CMJ performance after a soccer match or a simulation test [27,28]. On the other hand, the data of the present study seemed to be confirmed by the analysis of the results of an earlier research which showed that the jumping ability was not affected after an entire soccer match [7]. It is probable that due to the interval nature of the soccer, the body had sufficient recovery time resulting in no reduction in CMJ. Even the young age of the female athletes who participated in the study could be a determining factor that contributes to the faster recovery of muscle power.
The fact that there was no reduction in CMJ performance despite the reduction in isokinetic torque was also confirmed by a previous study where the researchers concluded that isokinetic torque at low angular velocities does not relate to the performance of the vertical jump. In the vertical jump, the angular velocity at the knee joint was higher than the greater isokinetic angular velocity [29].
5. Conclusions
The study reflected the changes in muscle torque and power that followed a soccer match. In particular, the results of the present study showed that there was a decrease in the concentric maximum strength of the anterior thigh muscles of female soccer players after a match in a slow angular velocity. As for the posterior thigh muscles, their strength decreased only at high angular velocities the next day of the match. Consequently, isokinetic assessment is an appropriate method for identification of muscle fatigue following a match. As concerning the analyzed data of CMJ, it is concluded that the soccer match did not significantly affect the power of lower limbs in young female soccer players.
In conclusion, as it turns out the planning of the microcycle should be designed according to the needs and specific characteristics of female soccer players. Therefore, it is necessary to carry out further research to create more accurate and effective training models for female soccer players.
5.1. Practical Applications
This study provides data to determine the training loads within the training microcycle. Particularly, the results suggest that a training session of female soccer players aiming at maximum strength can take place 72 hours after the match. In addition, training sessions of female soccer players related to power improvement can be performed at any time as they did not appear to be affected after a match. However, previous studies to men soccer players showed that power performance can be affected by the match for ~48h and probably more research is needed in female soccer players and in bigger samples.
Author Contributions
Conceptualization, I.D., E.S., Y.M. and T.M.,; methodology, I.D., E.S., Y.M. and T.M.,; software, E.S., G.M. and N.K.; validation, E.S., G.M. and N.K.; formal analysis, E.S., G.M. and N.K.; investigation, I.D.; resources, I.D., E.S.; data curation, E.S., G.M. and N.K.; writing—original draft preparation, I.D.; writing—review and editing, I.D., E.S., Y.M., N.K. and T.M.; visualization, E.S., Y.M., A.Μ., N.K. and T.M.; supervision, E.S. Y.M., G.M. and T.M.. All authors have read and agreed to the published version of the manuscript.
Funding
This research received no external funding.
Institutional Review Board Statement
The study was conducted in accordance with the Declaration of Helsinki, and approved by the Institutional Ethics Committee of Department of Physical Education and Sport Science of the ARISTOTLE UNIVERSITY OF THESSALONIKI, (approval number 226/2024).
Informed Consent Statement
Informed consent was obtained from all subjects involved in the study.
Conflicts of Interest
The authors declare no conflicts of interest.
References
- Terreri, A.S.A.; Greve, J.; Amatuzzi, M.M. Avaliação isocinética no joelho do atleta. Revista brasileira de medicina do esporte 2001, 7, 62–66. [Google Scholar] [CrossRef]
- Petersen, J.; Hölmich, P. Evidence based prevention of hamstring injuries in sport. British journal of sports medicine 2005, 39, 319–323. [Google Scholar] [CrossRef]
- Zabka, F.F.; Valente, H.G.; Pacheco, A.M. Avaliação isocinética dos músculos extensores e flexores de joelho em jogadores de futebol profissional. Revista brasileira de medicina do esporte 2011, 17, 189–192. [Google Scholar] [CrossRef]
- Fonseca, S.T.D.; Ocarino, J.M.; da Silva, P.L.; Bricio, R.S.; Costa, C.A.; Wanner, L.L. Caracterização da performance muscular em atletas profissionais de futebol. Revista Brasileira de Medicina do Esporte 2007, 13, 143–147. [Google Scholar] [CrossRef]
- Fédération Internationale de Football Association. Women’s football member associations survey report. Zurich, Switzerland: Fédération Internationale de Football Association 2019. Available at: https://img.fifa.com/image/upload/nq3ensohyxpuxovcovj0.pdf.
- Andersson, H.M.; Raastad, T.; Nilsson, J.; Paulsen, G.; Garthe, I.N.A.; Kadi, F. Neuromuscular fatigue and recovery in elite female soccer: effects of active recovery. Medicine & Science in Sports & Exercise 2008, 40, 372–380. [Google Scholar]
- Krustrup, P.; Zebis, M.; Jensen, J.M.; Mohr, M. Game-induced fatigue patterns in elite female soccer. The Journal of Strength & Conditioning Research 2010, 24, 437–441. [Google Scholar]
- Greig, M. The influence of soccer-specific fatigue on peak isokinetic torque production of the knee flexors and extensors. The American journal of sports medicine 2008, 36, 1403–1409. [Google Scholar] [CrossRef] [PubMed]
- Rahnama, N.; Reilly, T.; Lees, A.; Graham-Smith, P. Muscle fatigue induced by exercise simulating the work rate of competitive soccer. Journal of Sports Science 2003, 21, 933–942. [Google Scholar] [CrossRef]
- Small, K.; McNaughton, L.; Greig, M.; Lovell, R. The effects of multidirectional soccer-specific fatigue on markers of hamstring injury risk. Journal of science and medicine in sport 2010, 13, 120–125. [Google Scholar] [CrossRef]
- Peterson, M.D.; Alvar, B.A.; Rhea, M.R. The contribution of maximal force production to explosive movement among young collegiate athletes. The Journal of Strength & Conditioning Research 2006, 20, 867–873. [Google Scholar]
- Hopkins, W.G. Measures of reliability in sports medicine and science. Sports medicine 2000, 30, 1–15. [Google Scholar] [CrossRef] [PubMed]
- Taylor, K.; Chapman, D.; Cronin, J.; Newton, M.J.; Gill, N. Fatigue monitoring in high performance sport: a survey of current trends. J Aust Strength Cond 2012, 20, 12–23. [Google Scholar]
- Cormack, S.J.; Newton, R.U.; McGuigan, M.R.; Doyle, T.L. Reliability of measures obtained during single and repeated countermovement jumps. International journal of sports physiology and performance 2008, 3, 131–144. [Google Scholar] [CrossRef]
- Cormie, P.; McBride, J.M.; McCaulley, G.O. Power-time, force-time, and velocity-time curve analysis of the countermovement jump: impact of training. The Journal of Strength & Conditioning Research 2009, 23, 177–186. [Google Scholar]
- McLellan, C.P.; Lovell, D.I.; Gass, G.C. The role of rate of force development on vertical jump performance. The Journal of Strength & Conditioning Research 2011, 25, 379–385. [Google Scholar]
- Sheppard, J.M.; Cormack, S.; Taylor, K.L.; McGuigan, M.R.; Newton, R.U. Assessing the force-velocity characteristics of the leg extensors in well-trained athletes: The incremental load power profile. The Journal of Strength & Conditioning Research 2008, 22, 1320–1326. [Google Scholar]
- Taylor, K.L.; Cronin, J.; Gill, N.D.; Chapman, D.W.; Sheppard, J. Sources of variability in iso-inertial jump assessments. International journal of sports physiology and performance 2010, 5, 546–558. [Google Scholar] [CrossRef]
- Nicol, C.; Avela, J.; Komi, P.V. The stretch-shortening cycle: a model to study naturally occurring neuromuscular fatigue. Sports medicine 2006, 36, 977–999. [Google Scholar] [CrossRef]
- Oliver, J.; Armstrong, N.; Williams, C. Changes in jump performance and muscle activity following soccer-specific exercise. Journal of sports sciences 2008, 26, 141–148. [Google Scholar] [CrossRef]
- Hoffman, J.R.; Nusse, V.; Kang, J. The effect of an intercollegiate soccer game on maximal power performance. Canadian journal of applied physiology 2003, 28, 807–817. [Google Scholar] [CrossRef] [PubMed]
- Ascensão, A.; Rebelo, A.; Oliveira, E.; Marques, F.; Pereira, L.; Magalhães, J. Biochemical impact of a soccer match—analysis of oxidative stress and muscle damage markers throughout recovery. Clinical biochemistry 2008, 41, 841–851. [Google Scholar] [CrossRef] [PubMed]
- Silva, J.R.; Ascensão, A.; Marques, F.; Seabra, A.; Rebelo, A.; Magalhães, J. Neuromuscular function, hormonal and redox status and muscle damage of professional soccer players after a high-level competitive match. European journal of applied physiology 2013, 113, 2193–2201. [Google Scholar] [CrossRef]
- Delextrat, A.; Baker, J.; Cohen, D.D.; Clarke, N. Effect of a simulated soccer match on the functional hamstrings-to-quadriceps ratio in amateur female players. Scandinavian journal of medicine & science in sports 2013, 23, 478–486. [Google Scholar]
- Rampinini, E.; Bosio, A.; Ferraresi, I.; Petruolo, A.; Morelli, A.; Sassi, A. Match-related fatigue in soccer players. Medicine & Science in Sports & Exercise 2011, 43, 2161–2170. [Google Scholar]
- Draganidis, D.; Chatzinikolaou, A.; Avloniti, A.; Barbero-Álvarez, J.C.; Mohr, M.; Malliou, P.; Gourgoulis, V.; Deli, C.K.; Douroudos, I.I.; Margonis, K.; Gioftsidou, A. Recovery kinetics of knee flexor and extensor strength after a football match. PloS one 2015, 10, e0128072. [Google Scholar]
- Thomas, K.; Dent, J.; Howatson, G.; Goodall, S. Etiology and recovery of neuromuscular fatigue following simulated soccer match-play. Med Sci Sports Exerc 2017, 49, 955–64. [Google Scholar] [CrossRef] [PubMed]
- Nedelec, M.; McCall, A.; Carling, C.; Legall, F.; Berthoin, S.; Dupont, G. The influence of soccer playing actions on the recovery kinetics after a soccer match. The Journal of Strength & Conditioning Research 2014, 28, 1517–1523. [Google Scholar]
- Iossifidou, A.; Baltzopoulos, V.; Giakas, G. Isokinetic knee extension and vertical jumping: are they related? Journal of sports sciences 2005, 23, 1121–1127. [Google Scholar] [CrossRef]
Figure 1.
Muscular torque of anterior thigh muscles at 60, 180, 300°/s, at the four different time points of measurement (means ± SD). *denotes a significant difference (p<0.05); **denotes a significant difference (p<0.01).
Figure 1.
Muscular torque of anterior thigh muscles at 60, 180, 300°/s, at the four different time points of measurement (means ± SD). *denotes a significant difference (p<0.05); **denotes a significant difference (p<0.01).
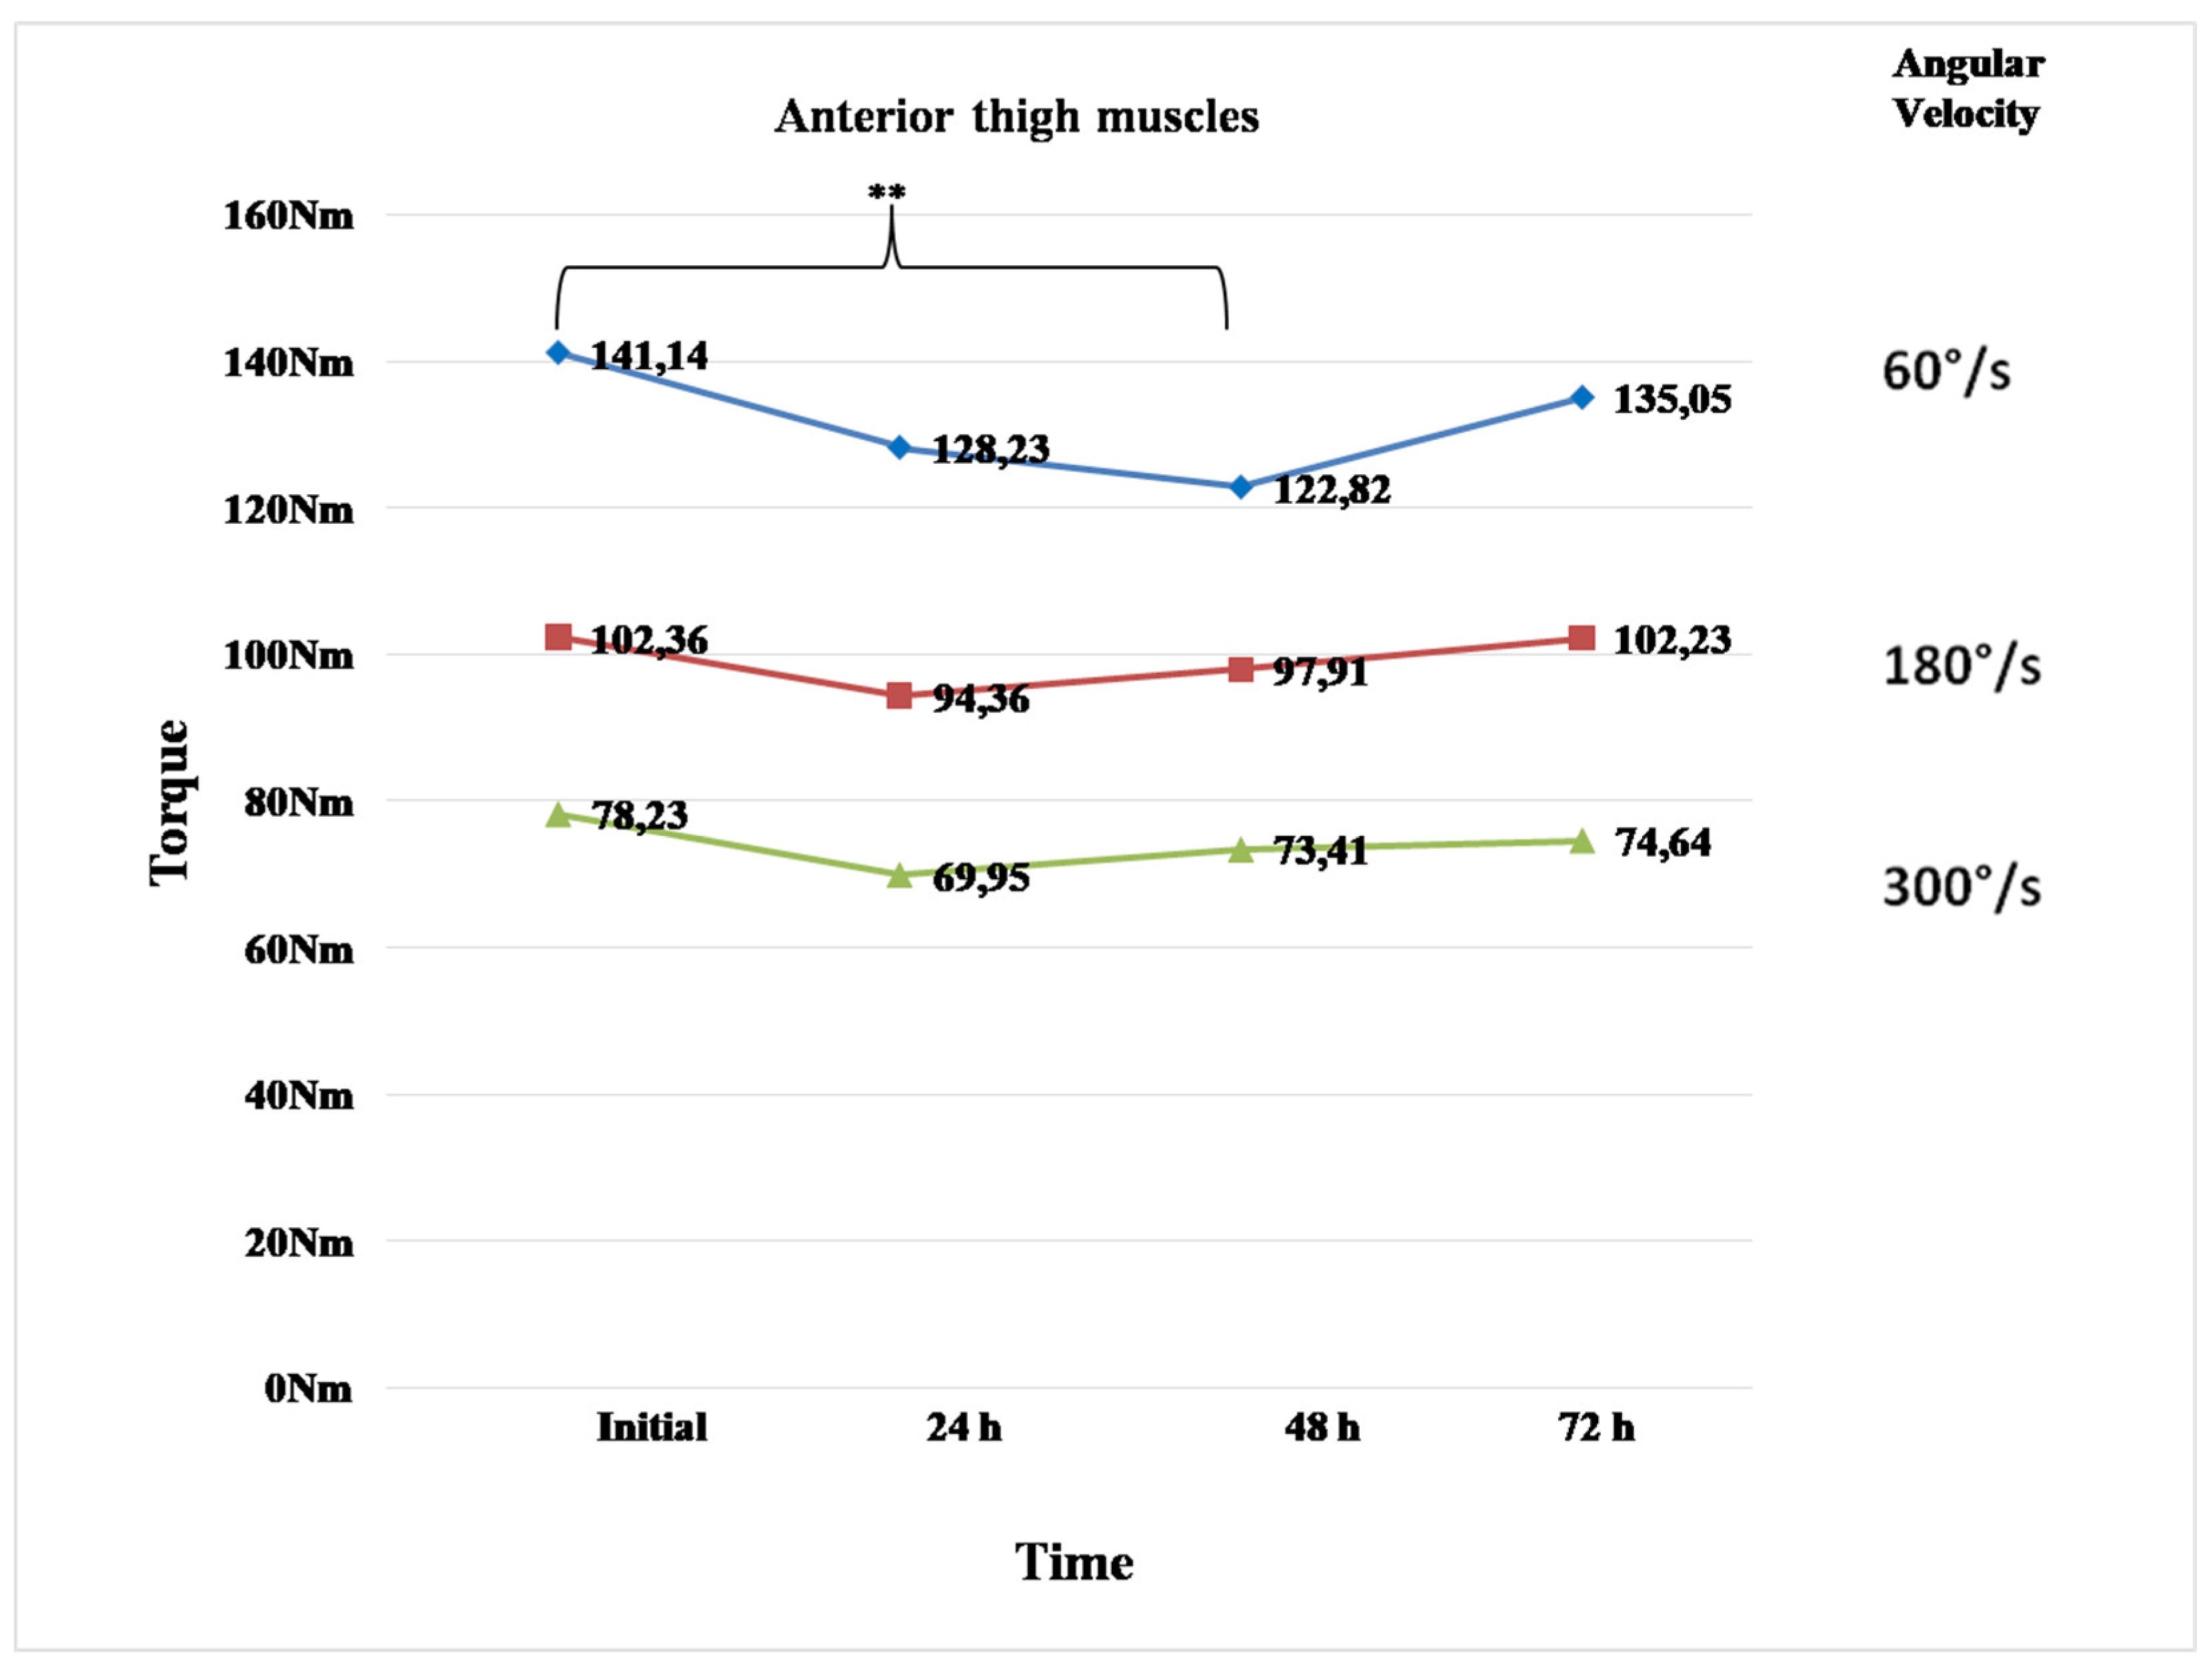
Figure 2.
Muscular torque of posterior thigh muscles at 60, 180, 300°/s, at the four different time points of measurement (means ± SD). *denotes a significant difference (p<0.05).
Figure 2.
Muscular torque of posterior thigh muscles at 60, 180, 300°/s, at the four different time points of measurement (means ± SD). *denotes a significant difference (p<0.05).
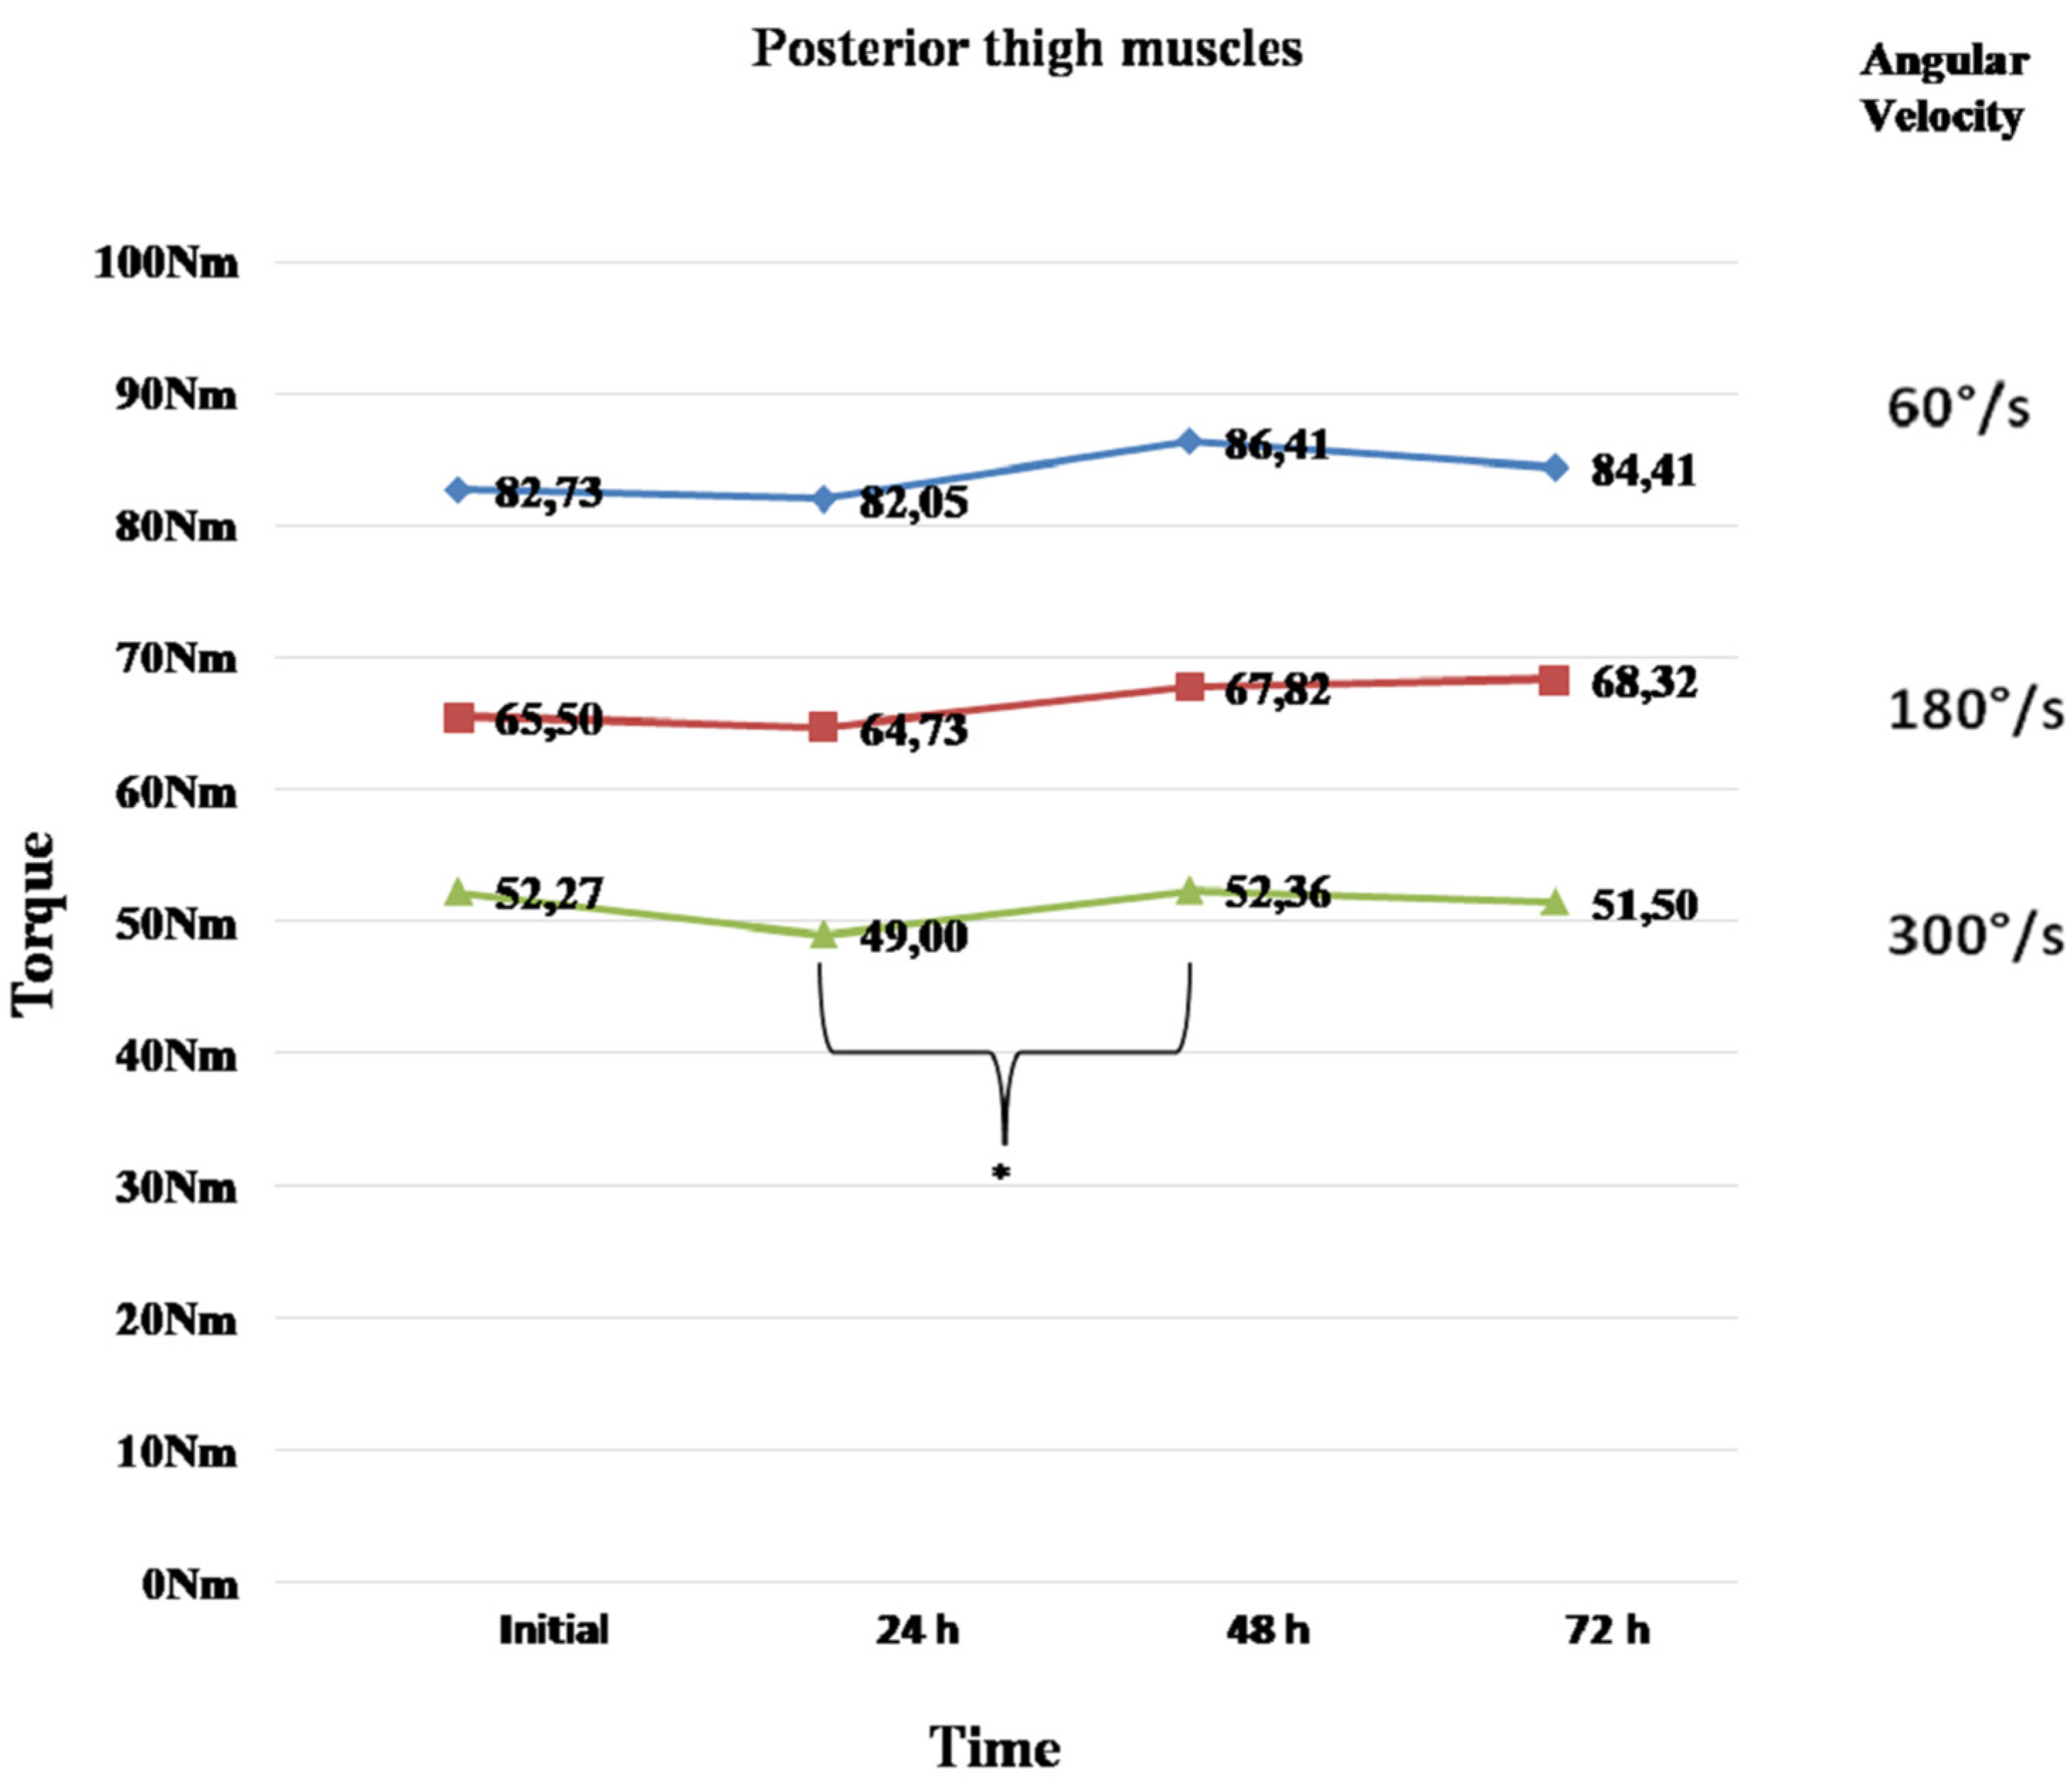
Figure 3.
Relative (Nm/kg) muscular torque of anterior thigh muscles at 60, 180, 300°/s, at the four different time points of measurement (means ± SD). *denotes a significant difference (p<0.05); **denotes a significant difference (p<0.01).
Figure 3.
Relative (Nm/kg) muscular torque of anterior thigh muscles at 60, 180, 300°/s, at the four different time points of measurement (means ± SD). *denotes a significant difference (p<0.05); **denotes a significant difference (p<0.01).
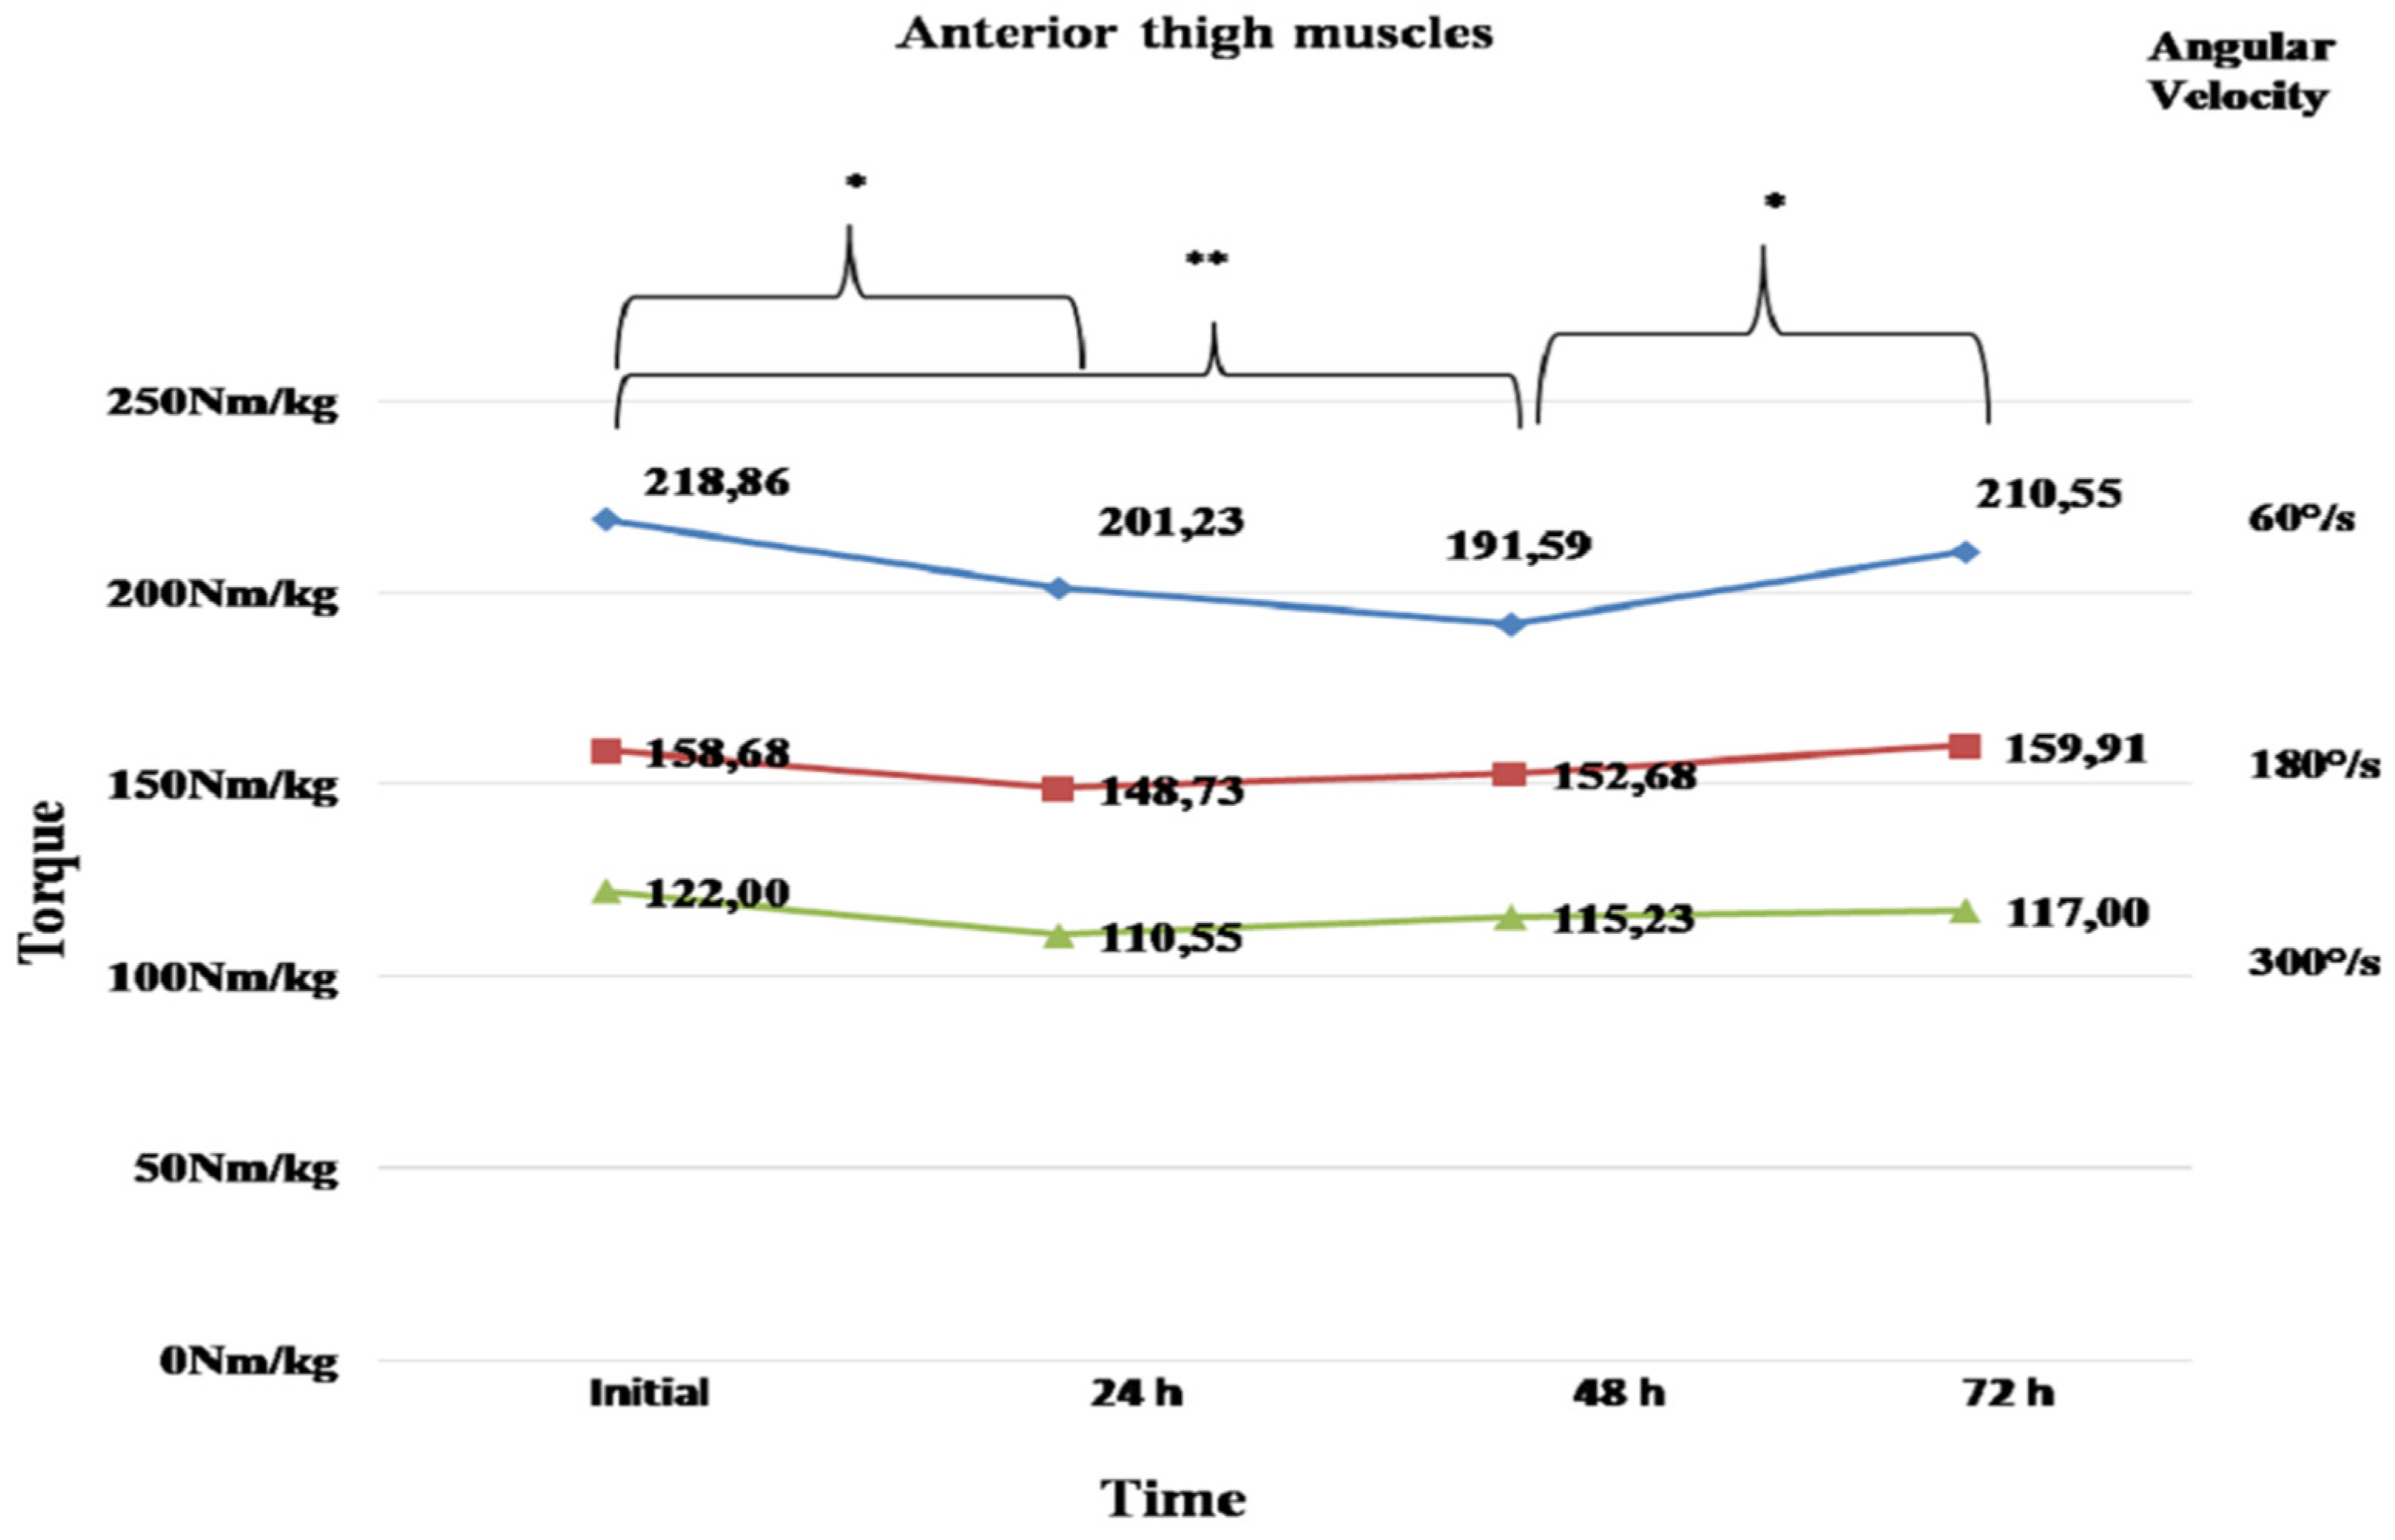
Figure 4.
Relative (Nm/kg) muscular torque of posterior thigh muscles at 60, 180, 300°/s, at the four different time points of measurement.
Figure 4.
Relative (Nm/kg) muscular torque of posterior thigh muscles at 60, 180, 300°/s, at the four different time points of measurement.
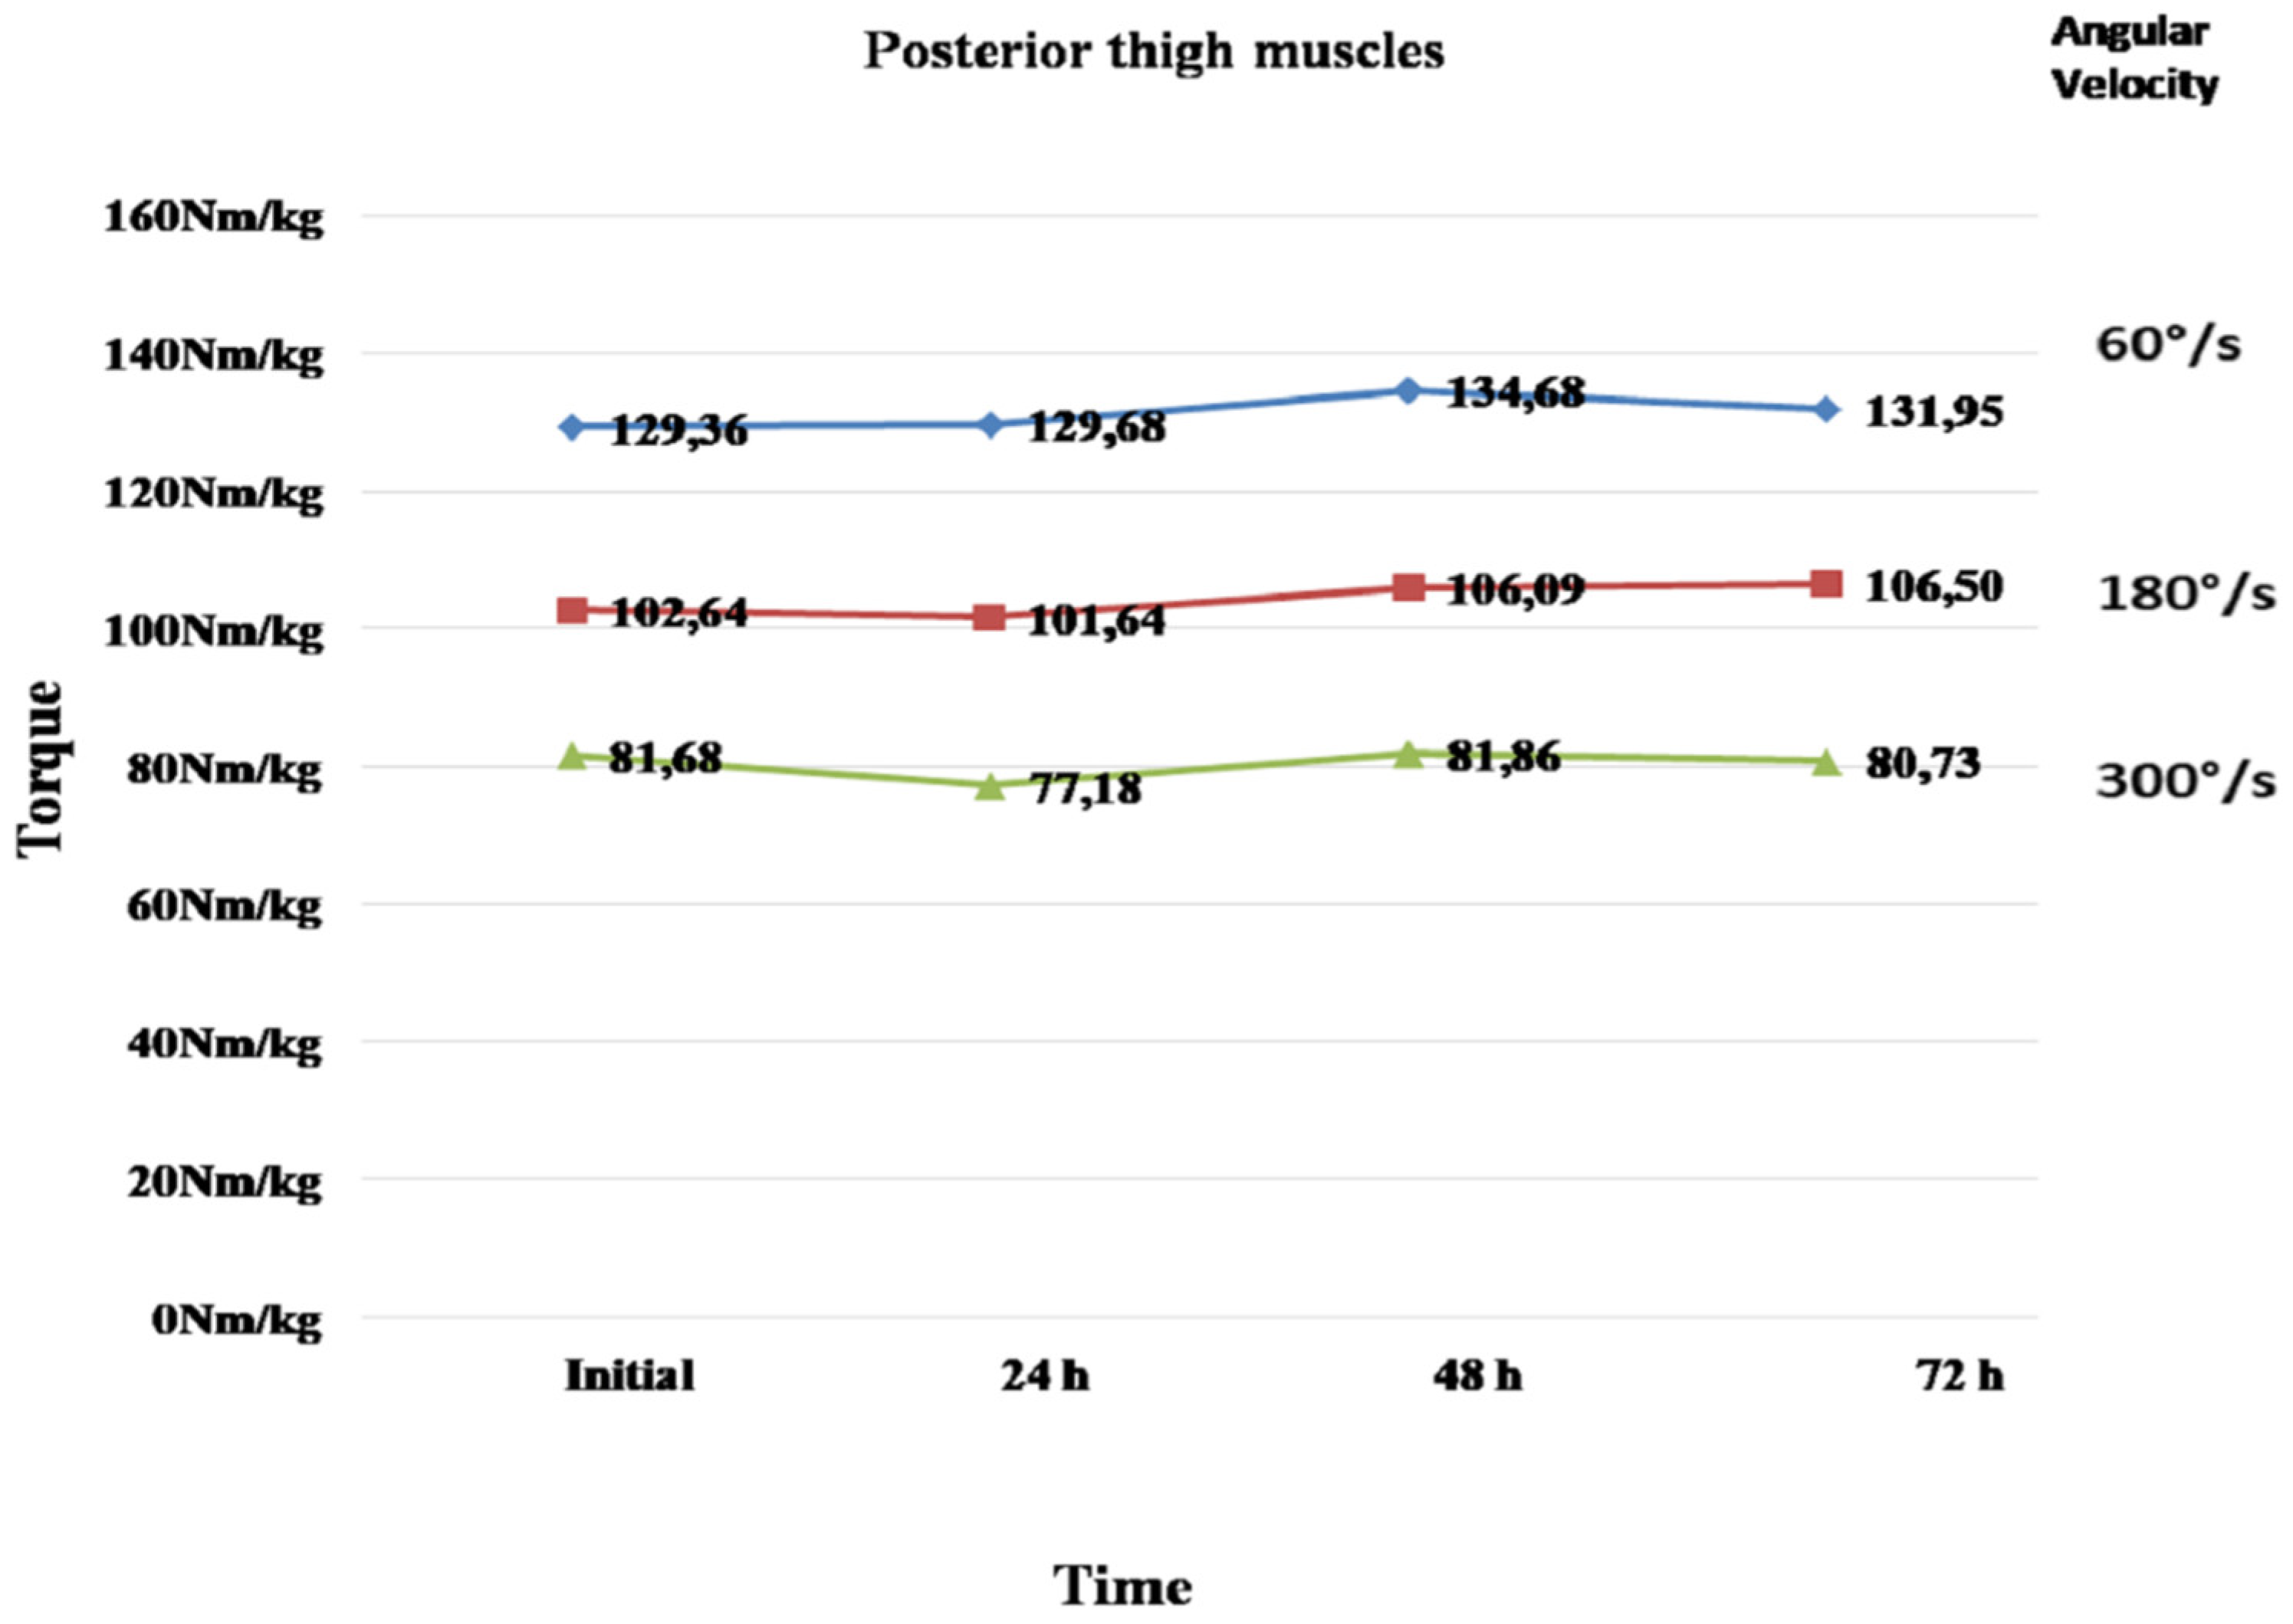

Table 1.
Generalized linear model between variables angular velocity, leg, muscle group and time.
| Multivariate Testsa | ||||||
| Effect | Value | F | Hypothesis df | Error df | Sig. | |
| Velocity * Muscle group * time | Pillai’s Trace | 0,872 | 5.681b | 6,000 | 5,000 | 0,038 |
| Wilks’ Lambda | 0,128 | 5.681b | 6,000 | 5,000 | 0,038 | |
| Hotelling’s Trace | 6,817 | 5.681b | 6,000 | 5,000 | 0,038 | |
| Roy’s Largest Root | 6,817 | 5.681b | 6,000 | 5,000 | 0,038 | |
| a. Design: Intercept b. Exact statistic | ||||||
Table 2.
Post Hoc Tests for variables angular velocity, leg, muscle group and time.
| Pairwise Comparisons | ||||||
| Measure: | ||||||
| Mean Difference (I-J) | Std. Error | Sig.b | ||||
| Muscle group |
Angular Velocity |
No Measurement | ||||
| Anterior thigh muscles | 60°/s | Initial | 24 h | 12,909 | 4,361 | 0,083 |
| 48 h | 18.318* | 4,201 | 0,008 | |||
| 72 h | 6,091 | 3,746 | 0,581 | |||
| 24 h | Initial | -12,909 | 4,361 | 0,083 | ||
| 48 h | 5,409 | 2,948 | 0,456 | |||
| 72 h | -6,818 | 3,379 | 0,358 | |||
| 48 h | Initial | -18.318* | 4,201 | 0,008 | ||
| 24 h | -5,409 | 2,948 | 0,456 | |||
| 72 h | -12.227* | 3,130 | 0,017 | |||
| 72 h | Initial | -6,091 | 3,746 | 0,581 | ||
| 24 h | 6,818 | 3,379 | 0,358 | |||
| 48 h | 12.227* | 3,130 | 0,017 | |||
| Posterior thigh muscles | 300°/s | Initial | 24 h | 3,273 | 1,852 | 0,495 |
| 48 h | -0,091 | 1,666 | 1,000 | |||
| 72 h | 0,773 | 1,950 | 0,999 | |||
| 24 h | Initial | -3,273 | 1,852 | 0,495 | ||
| 48 h | -3.364* | 0,915 | 0,025 | |||
| 72 h | -2,500 | 1,191 | 0,320 | |||
| 48 h | Initial | 0,091 | 1,666 | 1,000 | ||
| 24 h | 3.364* | 0,915 | 0,025 | |||
| 72 h | 0,864 | 0,560 | 0,634 | |||
| 72 h | Initial | -0,773 | 1,950 | 0,999 | ||
| 24 h | 2,500 | 1,191 | 0,320 | |||
| 48 h | -0,864 | 0,560 | 0,634 | |||
| Based on estimated marginal means; *. The mean difference is significant at the .05 level; b. Adjustment for multiple comparisons: Sidak | ||||||
Table 3.
Generalized linear model between variables angular velocity, leg, muscle group and time relating to body weight.
Table 3.
Generalized linear model between variables angular velocity, leg, muscle group and time relating to body weight.
| Multivariate Testsa | ||||||
| Effect | Value | F | Hypothesis df | Error df | Sig. | |
| Velocity* Muscle group * time | Pillai’s Trace | 0,879 | 6.041b | 6,000 | 5,000 | 0,034 |
| Wilks’ Lambda | 0,121 | 6.041b | 6,000 | 5,000 | 0,034 | |
| Hotelling’s Trace | 7,249 | 6.041b | 6,000 | 5,000 | 0,034 | |
| Roy’s Largest Root | 7,249 | 6.041b | 6,000 | 5,000 | 0,034 | |
| a. Design: Intercept; b. Exact statistic | ||||||
Table 4.
Post Hoc Tests for variables angular velocity, leg, muscle group and time relating to body weight.
Table 4.
Post Hoc Tests for variables angular velocity, leg, muscle group and time relating to body weight.
| Pairwise Comparisons | ||||||
| Measure: | ||||||
| Mean Difference (I-J) | Std. Error | Sig.b | ||||
| Velocity | Muscle group | No Measurement | ||||
| 60°/s | Anterior thigh muscles | Initial | 24 h | 17.636* | 5,052 | 0,034 |
| 48 h | 27.273* | 5,803 | 0,005 | |||
| 72 h | 8,318 | 6,013 | 0,731 | |||
| 24 h | Initial | -17.636* | 5,052 | 0,034 | ||
| 48 h | 9,636 | 4,526 | 0,306 | |||
| 72 h | -9,318 | 4,651 | 0,365 | |||
| 48 h | Initial | -27.273* | 5,803 | 0,005 | ||
| 24 h | -9,636 | 4,526 | 0,306 | |||
| 72 h | -18.955* | 4,866 | 0,018 | |||
| 72 h | Initial | -8,318 | 6,013 | 0,731 | ||
| 24 h | 9,318 | 4,651 | 0,365 | |||
| 48 h | 18.955* | 4,866 | 0,018 | |||
Table 5.
CMJ without arm swing.
| Multivariate Testsa | ||||||
| Effect | Value | F | Hypothesis df | Error df | Sig. | |
| CMJ without arm swing | Pillai’s Trace | 0,046 | .128b | 3,000 | 8,000 | 0,941 |
| Wilks’ Lambda | 0,954 | .128b | 3,000 | 8,000 | 0,941 | |
| Hotelling’s Trace | 0,048 | .128b | 3,000 | 8,000 | 0,941 | |
| Roy’s Largest Root | 0,048 | .128b | 3,000 | 8,000 | 0,941 | |
| a. Design: Intercept; Within Subjects Design: CMJ without arm swing; b. Exact statistic | ||||||
Table 6.
CMJ with arm swing.
| Multivariate Testsa | ||||||
| Effect | Value | F | Hypothesis df | Error df | Sig. | |
| CMJ with arm swing | Pillai’s Trace | 0,488 | 2.546b | 3,000 | 8,000 | 0,129 |
| Wilks’ Lambda | 0,512 | 2.546b | 3,000 | 8,000 | 0,129 | |
| Hotelling’s Trace | 0,955 | 2.546b | 3,000 | 8,000 | 0,129 | |
| Roy’s Largest Root | 0,955 | 2.546b | 3,000 | 8,000 | 0,129 | |
| a. Design: Intercept; Within Subjects Design: CMJ with arm swing; b. Exact statistic | ||||||
Disclaimer/Publisher’s Note: The statements, opinions and data contained in all publications are solely those of the individual author(s) and contributor(s) and not of MDPI and/or the editor(s). MDPI and/or the editor(s) disclaim responsibility for any injury to people or property resulting from any ideas, methods, instructions or products referred to in the content. |
© 2024 by the authors. Licensee MDPI, Basel, Switzerland. This article is an open access article distributed under the terms and conditions of the Creative Commons Attribution (CC BY) license (http://creativecommons.org/licenses/by/4.0/).
Copyright: This open access article is published under a Creative Commons CC BY 4.0 license, which permit the free download, distribution, and reuse, provided that the author and preprint are cited in any reuse.


