
Submitted:
06 December 2024
Posted:
06 December 2024
You are already at the latest version
Abstract
Artificial Intelligence (AI) has recently had unprecedented contributions in every walk of life, but it has not been able to work its way into diagnostic medicine and standard clinical practice yet. Although data scientists, researchers, and medical experts have been working in the direction of design and development of Computer Aided Diagnosis (CAD) tools to serve as assistants to doctors, their large-scale adaptation and integration in the healthcare system still seems far-fetched. Diagnostic Radiology is no exception. Imagining techniques like Magnetic Resonance Imaging (MRI), Computed Tomography (CT), and Positron Emission Tomography (PET) scans have been vastly and very effectively employed by radiologists and neurologists for the differential diagnoses of neurological disorders for decades, yet no AI powered systems, to analyze such scans, have been incorporated into the standard operating procedures in healthcare system. Why? It is absolutely understandable that in diagnostic medicine, precious human lives are on the line, and hence there is no room even for the tiniest of mistakes. Nevertheless, with the advent of Explainable Artificial Intelligence (XAI), the old school black boxes of Deep Learning (DL) systems have been unraveled. Would XAI be the turning point for medical experts to finally embrace AI in diagnostic radiology? This review is a humble endeavor to find the answers to these questions. In this review, we present the journey and contributions of AI in developing systems to recognize, preprocess, and analyze brain MRI scans for differential diagnoses of various neurological disorders, with special emphasis on CAD systems embedded with explainability. We also summarize the challenges up ahead that need to be addressed in order to fully exploit the tremendous potential of XAI in its application to medical diagnostics and serve humanity.
Keywords:
Brain MRI
; Neurological Disorders
; Computer Aided Diagnosis
; Explainable Artificial Intelligence
1. Introduction
1.1. Neurological Disorders – Morbidity and Mortality
According to World Health Organization (WHO), neurological disorders are among the top three killers in the world, even in developed countries with adequate healthcare infrastructure [1]. Neurodegenerative disorders like Alzheimer’s disease (AD) and Parkinson’s disease (PD) can drastically degrade the quality of life. Unlike other parts of the body, brain cells do not regenerate, and hence early diagnosis is of paramount significance to contain the progression of such diseases [2,3,4,5,6]. However at the early stage of such disorders, the diagnosis is challenging [2], due to very subtle changes in medical imaging data. In addition, some diseases in their infancy may present similar or overlapping findings, specially in case of neurodegenerative disorders, thereby rendering the differential diagnosis even more tedious [7,8,9]. This would require highly skilled and experienced medical professionals for accurate diagnoses to choose the right course of treatment and contain the prognoses. The unavailability of such experts and lack of infrastructure, specially in under-developed countries can produce catastrophic outcomes.
1.2. AI in CAD
AI has revolutionized every walk to life, and healthcare and medicine are no exceptions [6,10,11]. Over the past couple of decades, tremendous research has been observed for the design and development of CAD tools for multi-modal data to act as assistants to domain experts in reaching fast and concrete diagnoses. From old-school Computer Vision (CV) algorithms, to Machine Learning (ML), to the more recent DL architectures have been observed making their way in this field and producing outstanding results [6,10,12,13,14,15]. Radiological imagining has become an inseparable part of the diagnosis process with technologies like X-ray, ultrasound, MRI, CT, PET scans playing a vital role in assisting experts in accurate diagnoses. MRI, being a non-invasive and highly informative modality is found to be widely employed [13,16,17]. DL powered machines have the ability to look into the most intricate features even up to pixel levels, which the human-eye might overlook. In this domain, Convolutional Neural Networks (CNNs) have recently shown unprecedented promise [10,18,19,20] and have been employed in systems with multiple disease diagnosis capabilities [16]. Some researchers have even observed that the performance of such DL powered systems are comparable to human in real-world tasks, and in some cases might surpass human domain experts’ performance in terms of speed and accuracy [10,20,21]. But this increased performance and accuracy of DL powered systems comes at a price.
Before taking the discussion any further, we would like to take a moment here to introduce some standard terminologies pertaining to XAI.
- Interpretability: Interpretability refers to the ability to understand the decision-making process of an AI model. The operation of an interpretable model is transparent and provides details about the relationships between inputs and outputs.
- Explainability: Explainability refers to the ability of an AI model to provide clear and intuitive explanations of the decisions made to the end user. In other words, an explainable AI model provides justification of the decisions made.
- Transparency: Transparency refers to the ability of an AI model to provide a view into the inner workings of the system, from inputs to inferences.
- Black box: Block box model in AI is one whose operations are not visible to the user. Such models arrive at decisions without providing any explanation as to how they were reached. Such models lack transparency, and therefore are frowned upon, and not trusted in applications like diagnostic medicine, where precious human lives are on the line.
The journey with AI started with simpler rule-based algorithms in ML, like decision trees, which provided clear rules for end-users to understand the reasons of classifications. The features in ML powered systems were hand-crafted by developers [17] and hence such systems offered higher levels of transparency in their inferences and decisions. The accuracy of such systems was relatively low. In order to increase accuracy and performance, complex DL architectures were developed with many hidden layers and millions of trainable parameters. The features in such systems were extracted implicitly and hence the opacity increased drastically [22]. Although there were leaps in accuracy, the decision-making process got wrapped in a “Black Box” [6,10,11,15,21,23,24,25,26,27,28], resulting in the decrease in trust specially in highly sensitive fields like diagnostic medicine, where a single wrong decision can be a matter of life and death [6,20,28,29,30,31]. This trade-off between accuracy and explainability [6,14,15,32] in the evolution of AI is shown in Figure 1. This has been one of the leading factors that despite the tremendous performance peaks achieved by such DL powered CAD tools, they have not yet been able to find their way in the routine medical practices since both the doctors and the patients by all means demand their right to know the reasons of a particular diagnosis/ inference generated by such CAD tools [20,29]. This gave birth to a recent sub-domain of AI called XAI.
1.3. Unravelling the Mystery!
XAI is an attempt by engineers to demystify the otherwise secretive working of complex DL architectures popularly referred to as the “Black Boxes”, which is the leading cause of mistrust of people [29,33]. Figure 2 shows the end-to-end working of an XAI powered DL regimen (from training to deployment), along with the tentative expressions and comfort level of domain experts at various stages, in a block diagram.
Many theories, methods and frameworks have been devised to provide plausible explanations to the outcomes of such models.
1.4. XAI Methods and Frameworks
XAI methods have been classified into various categories and many respective frameworks have been developed over a brief period of time [29], but going in their details is beyond the purview of this work and hence we will state them succinctly.
The generated explanations can be textual, numerical, visual or example based. In the case of radiological imaging, most researchers have worked with visual explanations in the form of heatmaps highlighting the regions in the input images contributing towards a particular inference [26]. From the point of view of scope, the explainability of a model can either be local or global. A global explanation explains the behavior of an entire model on all the input dataset, whereas a local explanation might just use a couple of examples to help explain why certain decisions were made. From the point of view of the stage of implementation, XAI methods can be categorized as ante-hoc and post-hoc, depending on whether the explanations were generated during or after training. From the point of view of applicability of XAI methods, we have model-specific and model-agnostic approaches. Model-agnostic approaches are generally easy to implement, since their applicability is independent of the underlying AI model, and are also sometimes referred to as plug-and-play [17]. The remaining part of this section briefly introduces the most commonly employed XAI frameworks.
Local Interpretable Model-Agnostic Explanations (LIME) generates explanations by perturbing the input data to a model, and observing the changes in the output. It can thus highlight the significant features in input data responsible for a particular decision. SHapley Additive exPlanations (SHAP) assigns weights to all input features and observes the outcomes of all weighted input feature combinations. Gradient-weighted Class Activation Mapping (Grad-CAM) works with CNNs to identify important regions in an input image which are responsible for the inference. It is applied using gradient information of the output layer to produce a heatmap for the input image. Layer-wise Relevance Propagation (LRP) also generates similar heatmaps by assigning relevance scores to all neurons in the output layer of a CNN, and then backpropagates to the input layer, while computing scores for every neuron. Occlusion Sensitivity Analysis (OSA) and Saliency Maps (SM) are frequently used schemes to generate visual explanations for image input data. Their mode of operation is similar. In OSA, patches of images are occluded periodically and the corresponding effects on the outputs are observed. If the probability of a certain prediction drops drastically by occluding a certain input image patch, it would signify that patch to hold important information for that particular prediction. SM also generates heatmaps in a similar manner. The difference is that in case of SMs, each pixel from the input is removed iteratively and the corresponding drop in probability of inference defines its importance. Hence, the heatmap generated by SM contains all the significant pixels responsible for a certain prediction. In case of a CAD tool for neurological disorders, for example, all brain MRI regions responsible for the diagnosis of a certain disease would light up for experts to visualize the reason/ explanation of that particular diagnosis by the tool. In order to elaborate visual explanations of the XAI frameworks for clear understanding, a simple brain tumor dataset was downloaded from Kaggle [34], and a 2 class DL model was trained for classification of MRI images as ‘Tumor’ or ‘No tumors’. The visual explnations generated by different XAI techniques are shown in Figure 3.
1.5. Would XAI Be the Matchmaker~
The next important questions are:
“Would the integration of explainability to the otherwise opaque DL architectures (rejected by doctors and patients [35]) bridge the gap and develop the trust of domain experts in using CAD tools~”
“Would only visual explanations be enough for experts in diagnostic radiology~”
“What else should be done to pave the way for the large scale incorporation of AI in diagnostic medicine~”
With the help of literature and medical experts, we will be looking for answers to these and other such questions in this humble endeavor.
1.6. Study Selection
Google scholar was used to search and collect relevant studies. The search phrases used include “explainable AI in brain MRI based computer-aided diagnoses”. Research conducted was scanned collectively from 2017 to 2023, other than that for the year 2024, which was scanned individually using filters, and the titles of articles included in first 10 pages were examined and the most relevant were downloaded, only those with full-text access. After the removal of duplicates, these articles were later screened by abstracts. This was followed by thorough examination of full texts. The Preferred Reporting Items for Systematic Reviews and Meta-Analyses (PRISMA) guidelines were followed in the process, as shown in Figure 4. From the articles reviewed in this study, the following information was extracted and summarized:
- Year of study
- Diseases researched
- Modalities employed
- AI techniques used
- Accuracy of developed systems
- Algorithms used for Explainability
- Datasets used
The rest of this paper is organized in such a way that prior art pertaining to brain MRI based CAD of neurological disorders using both AI and XAI is given in section II. The challenges ahead are presented in section III, and the paper is concluded in section IV which presents the answers we seek.
2. AI and XAI in CAD of Neurological Disorders
Despite the next to negligible penetration of AI in current routine healthcare regimens (due to its multitude of limitations and unreliability), the recent massive research, progress and development in CAD from data science perspective is sincerely praiseworthy. This section highlights the marvels achieved by this technology in diagnostic medicine (radiology, to be specific) in its journey from black box AI to the more recent and transparent XAI, for CAD of neurological disorders.
Numerous systems have been developed ranging from recognizing MRI sequences and view planes [36], preprocessing [37], segmentation of brain regions or anomalies [38] like tumors [39], to diagnosing disorders from a given MRI in multiclass problems [40]. This has only been possible mainly due to a couple of factors. The most important among them is the availability of massive, open access, publicly available, labelled datasets for data scientists and engineers to develop and train complex frameworks, rendering them capable of producing accurate inferences from unseen data in real-time. In addition, the very recent boost in the storage and processing capabilities of our machines to perform rapid calculations with millions of trainable parameters in the deep and complex models has been a gamechanger for this technology [21,30]. Hats off to the drastic evolution of Graphics Processing Units (GPUs) that made this possible. DL is known to be data hungry [11]. That is, it can produce better results if trained on massive annotated/ labelled data [41]. In case of brain MRI, the annotations/ labels coming from experts (consultant radiologists/ neurologists) are considered to be the “Gold Standard”. However, this can become an extremely time-consuming and tedious job [42] given the magnitude of data available online [43]. Moreover, incorrectly labelled data can obviously lead to poor training which in turn results in poor accuracy of models. Some pathologies are better visualized in specific MRI sequences as compared to others. For example, demyelinating diseases like Multiple Sclerosis (MS) and Neuromyelitis Optica (NMO) produce plaques/ lesions on the brain which are prominent as hyper-intense regions on a FLAIR (Fluid attenuated inversion recovery) sequence [43,44]. So, a study on the CADD of MS and NMO should technically focus on FLAIR MRI. To assist such applications, various systems have been developed to automatically identify the sequence and view planes of MRI scans [45,46,47,48,49]. In addition, the extra-cranial tissues including the skull, eyes, neck, etc. can be a source of noise for an AI system being designed to assist in differential diagnosis from the brain. To help in such scenarios, various brain extraction tools (skull-strippers) have been developed with extraordinary (radiologist-like) capabilities to handle all MRI sequences and orientations. Such preprocessing techniques (Synthstrip [37], NeuroImaging Volumetric Extractor – NIVE [50]) have been found to increase the accuracies of CAD tools. Two main problems that AI is generally found to be working on are segmentation and classification. From the literature, AD and Brain Tumors were the most widely researched disorders in developing AI powered CAD tools using brain MRIs as inputs. DL architectures have been widely used to segment tumors and lesions from MRI scans. The analysis of texture and morphology of such tumors and lesions can further lead to accurate diagnoses. For example, the lesions appearing in MS and NMO on the brain can appear very similar [51]. A concrete differential diagnosis from this modality alone can hence be extremely challenging [52,53,54], resulting in delays incurred due to additional testing. AI can assist in reducing such overheads of cost and time. 2D/ 3D DL architectures, specially CNNs have been found to be vastly employed in multiple disease CAD systems [55]. Systems have been found claiming to classify even up to 35 diseases [56]. The major issue in such systems reported by literature is the generalizability. That is, although some of such systems have been reported to have an accuracy even up to 100% for classifying multiple diseases and their sub-types [57,58,59,60,61,62], these systems fail to be as accurate when tested on unseen data, from different sources, not used in training. In addition, the research discussed thus far has no embedded explainability, which means that the end-user (doctor) has no idea of what is going on within the DL model and what was the reason for a particular diagnosis. The opacity of such systems is also one of the leading reasons of mistrust between the healthcare professionals and the AI systems, and hence demands massive attention. From this point onwards, this section discusses XAI powered CAD tools which is an attempt by researchers and data scientists to bridge the gap between AI and healthcare, by making CAD systems transparent, thereby building the confidence of medical experts in these assistive tools.
XAI has very recently emerged as a sub-domain of AI to assist domain experts in diagnoses and prognoses. From statistical point of view of incorporation of explainability in CAD systems using medical imaging data, X-rays have been widely researched, closely followed by MRI [28]. Among MRI studies, structural/ anatomical MRI have been widely used followed by functional MRI [17]. Chest and brain are the top two researched anatomical locations [17], followed by eyes and breasts [28]. From the point of view of explanations, over a period from 2017 to 2020, visual explanations have been employed the most with a constantly increasing trend, followed by textual and example-based explanations [28]. In visual explanations domain, perturbation methods have been found dominating the XAI algorithms [10]. Among XAI techniques, CAM and Grad-CAM are found to be leading, followed by LRP, guided backpropagation, LIME and SHAP, among others [17]. In XAI powered CAD research, AD and brain tumors are widely researched, followed by PD and others.
The study in [3] employs CNN and LIME for the diagnosis of AD. The system has been trained using ADNI dataset and claims to have a classification accuracy of 94.96%. Many similar studies [4,5,19,63,64,65,66,67,68,69] were found using different DL and XAI architecture for the diagnosis of AD, some handling its sub-types as well. The common problem with these systems was relying on ADNI dataset only for training and testing their systems. Such systems in practical scenarios are bound to suffer from drastic accuracy reduction due to poor generalizability. Moreover, they fail to provide any concrete quantitative or qualitative analysis of the explanations generated by their systems. Additionally, no doctors (domain experts and the ultimate end-users) were found to be onboard for evaluation. Similar issues and limitations were found in brain tumor research [12,16,22,70,71,72,73,74,75]. Camacho et.al. in [2] present their work on explainable classification of PD. They use a large multi-center database of T1-weighted (T1w) MRIs to train their CNN model with saliency maps to identify the regions responsible for inferences. Employment of data from about 14 centers caters to the generalizability issue, but the other questions pertaining to explainability still remain unanswered.
Few studies propose the use of multimodal data for prediction and management of disorders. This offers extra diagnostic features which may support and enhance the accuracy of diagnoses. Jahan et.al. in [33] use clinical, physiological, and MRI data for five class classification of AD using OASIS dataset. They compare the performance of 9 popular ML models and employ SHAP for explainability. Their study finds Random Forest (RF) as the best suited classifier for this job with a 10-fold cross-validation accuracy of 98.81%. The research in [13] proposes concatenation of PET and MRI images for the diagnosis of AD using ResNet18. There explainable system claims to have an accuracy of 73.90% using ADNI dataset. Kamal et.al. in [76] present fusion of brain MRI with Gene Expression Data for AD classification into 4 categories. They use CNN and LIME to achieve an accuracy of 97.6%. Similarly in the study conducted in [77], integration of 11 modalities, including PET, MRI, cognitive scores, genetic data, demographic data, patient history, CSF, neuropsychological battery, lab tests, etc., for classification of AD can be observed. The use of multimodal data may certainly enhance the potential of accurate diagnoses by these CAD tools, yet no evaluation criteria of explanations generated in these systems have been found.
Some studies were found to focus on guidelines for evaluation of clinical XAI in medical image analysis. Jin et.al. in [27] propose guidelines for choosing an XAI technique based on understandability, clinical relevance, truthfulness, informative plausibility and computational efficiency. They implemented and evaluated 16 commonly used post-hoc heatmap XAI techniques including gradient-based and perturbation-based techniques. With focus on two tasks, (i) to classify gliomas as low-grade (LGG) and high-grade gliomas (HGG) using 3D CNN architecture and BraTs 2020 dataset, and (ii) knee lesion identification task, they conclude that all 16 XAI techniques were inadequate for clinical use due to their failure in truthfulness and informative plausibility. Another study in [31] propose the modality-specific feature importance (MSFI) metric to evaluate feature attribution maps on multi-modal medical images. They also highlight that literature review indicates 35% studies evaluated the explanations with computational metrics only, 8% involved medical experts to verify explanation plausibility either quantitatively or qualitatively, whereas only a meager 5% employed both modes of evaluation.
Very few articles were found from literature incorporating medical experts’ feedback to assess their proposed systems’ clinical utility. The system proposed in [24] employs hybrid vision transformers and CNNs for glioma segmentation in brain MRI scans. They also claim to provide surgeon-understandable heatmaps to make their system transparent. In addition, they conducted structured interviews with two medical experts from Neurosurgery department at Ulm university hospital to evaluate the practical utility of their developed system. Their discussions included evaluation of model performance with actual patient cases, and interpretability of the model’s decision-making process with respect to the clinical experience of the neurosurgeons. According to the authors, experts found Grad-CAM to be a valuable tool to introduce explainability/ transparency in the otherwise opaque DL regimens. Another study in [78] employs Subtractive Spatial Lightweight CNN to classify malignant tumors as Medulloblastomas, Ependymomas, Meningiomas, Lymphomas, and Anaplastic Astrocytomas. They included CAM for explainability. After achieving a reasonable classification accuracy of up to 93.33% in the first evaluation phase, they took 10 doctors onboard to judge the meaningfulness of the generated explanations in the second phase. Each doctor went through a total of 120 MRI images and colored the tumor regions manually. These colorings were then compared with the heatmaps generated by CAM. According to the authors, the overlap never went below 98%, with it being 100% in the majority of the cases. They also conducted a survey from the doctors towards the end of their study with 11 statements like “The system is trustworthy in terms of diagnosis of brain tumors”. I am able to understand well about the detection by looking at the heatmaps”. I am able to make decision faster thanks to XAI view of the system” and “I want to use this system for auto-decision-making in brain tumor diagnosis”, which were rated by doctors from a scale of 1 to 5; with 5 being the strongest agreement. The average rating from all 10 doctors who participated in this study is above 4.5, with 4.8 being the highest. We think that the input from medical domain experts on XAI powered CAD research is an absolute nessicity, but is severly lacking at the moment as evident from literature. The requirements of doctors specially from the point of view of mode of explanations (visual, textual, etc.), among others, must be identified in the first phase, and incorporated in such CAD tools in the subsequent phases followed by rigourous testing and validation from medical experts in clinical settings.
A summary of the recent XAI powered CAD systems is given in Table 1. This table summarizes information regarding the disease diagnosing capability, the modality used as input, the AI and XAI technologies employed, the datasets used for training, and the accuracy achieved by the CAD tools.
3. The Challenges Ahead
Besides explainability, XAI offers many other advantages including improved error analysis capabilities [6], verification of results and prospects of model refinement [21]. But despite all that, it does not seem to be typically designed for clinical purposes [31]. This section sheds light on the limitations and current challenges standing between the field of XAI (and the CAD tools powered by it) and routine healthcare.
3.1. Limited Training Datasets and Generalizability Issues
Limited labelled/ annotated datasets have been observed in most of the studies developing CAD tools for neurological disorders [14,29]. Most of the developed systems were found to be employing training and testing data from a single online source. This results in generalizability issues, i.e., such trained models are very highly likely to fail in case of data from unseen sources, not used in training. The open sharing of anonymized neuroimaging data should hence be encouraged and more public grand challenges should be introduced to trigger crowdsourcing [14] for the solutions of problems.
3.2. Current Focus Mostly on Optimizing Performance of CAD Tools
Currently XAI seems to be in its infancy and most of the energy and attention of researchers and data scientists is focused on accuracy enhancement and performance optimization of CAD tools [77]. This might be one of the reasons for the current immaturity of XAI in CAD.
3.3. Absence of Ground Truth Data for Explainability
At present, there is next to negligible annotated ground truth data for explainability, may that be visual, textual, or in any other form. For example, for AD, several neuroimaging and clinical biomarkers labelled datasets can be found, but none exists to validate the heatmaps for AD generated by XAI algorithms [29]. This makes performance evaluation challenging for XAI systems [17].
3.4. Focus on Single Modality
Most of the CAD research found in literature is single modality oriented. Very few multi-modal studies were found. The same was found to be true for XAI powered CAD tools. The correlations between interpretations of different modalities may contribute significantly in the differential diagnosis [29] and hence demands attention. The CAD of neurological disorders is a tedious task, particularly in case of Neurodegenerative disorders, like AD and PD, where no clearly evident findings are present on the brain MRI as opposed to tumors, which can be seen vividly as an abnormal growth. Another set of such diseases is MS and NMO, for which the differential diagnosis is extremely challenging even for medical experts, given the similarities in symptoms and lesion patterns on MRI scans [100]. MS and NMO are demyelinating diseases of the Central Nervous System (CNS) which produce lesions/ plaques on the brain, spinal cord, and optic nerve [101]. Since the treatment and management of both diseases is different [102], and the treatment of MS might have adverse effects on NMO patients [103], early and accurate diagnosis is of paramount significance [104,105]. 50-85% cases in these disorders show lesions on brain MRI [106], which appear as hyper-intense regions on T2w and FLAIR scans [107]. In case of no brain lesions, analysis of spinal lesions and orbits can help [108]. In such cases, a CAD tool trained for the differential diagnosis can perform significantly better if multi-modal patient data is used for training, before deployment in real-time clinical settings.
3.5. Only Visual Explanations Sufficient~
In this review, visual explanations were found to be the most dominant in recent research [26,30,31]. It is understandable since medical imaging is primarily associated with visual tasks. But are they enough~ Non-visual methods were observed to be hardly researched [26]. Some folks might not be contented with only visual explanations, and be more interested in explanations akin to a professor teaching his trainees. Textual XAI approaches might bring additional baggage of Natural Language Processing (NLP) with them, but that’s ok, as long as our end-users/ healthcare professionals are satisfied.
To explore the need for more doctors onboard, we requested input from Dr. Danesh Kella, Assistant Professor, Department of Medicine, Mayo Clinic Florida, USA. We believe that medical domain experts, being the ultimate end-users of such XAI powered CAD tools, would be the best sources to get this information from. The following comments of Dr. Kella have been presented here offering a sneak peek into the mind of medical domain experts and their expectations from XAI powered CAD tools:
“Yes, the explanation of the AI’s decision into AI models would likely increase confidence and comfort in using such systems. However, it would be even more helpful if the AI explains it in a manner akin to how a professor would explain to their trainees how a certain characteristic of the brain mass on MRI indicates the likelihood of a certain tumor. By providing human-like insights into how AI models arrive at their decisions, they offer transparency and clarity to users, including healthcare professionals.”
3.6. How to Judge XAI Performance~
Many researchers have proposed and developed XAI powered tools but very few have worked in the direction of their performance evaluation, either quantitative or qualitative [20,31]. The existing very scanty engineer-centered performance evaluation paradigm needs to shift, and more involvement of the medical experts (who are the ultimate users) needs to be ensured. There is an absolute need of uniform adoption of standard assessment criteria for explainability across the research community [6].
3.7. More Doctors Onboard, Please!
When it comes to XAI powered CAD research, from data annotation, to training, to providing ground truth explanations, to qualitatively analyzing the results of such tools, nothing is materializable without medical experts’ involvement and contribution. Being the end-users of such tools, their requirements need to be prioritized above all. The idea of human (doctor)-in-the-loop has been observed frequently in the literature [10], and has been termed as a prerequisite for design, development, and use of XAI based CAD applications [20].
3.8. User Awareness
It is important to thoroughly explain the capabilities, advantages, and limitations of XAI in CAD research to users (patients and doctors) [20].
3.9. Security, Safety, Legal, and Ethical Challenges
AI along with all the explainability and interpretability associated with it, specially in the field of medicine would face safety, legal, and ethical challenges [11]. Because of this field still being in its infancy [17], the regulations will also take time to mature.
Data security and privacy are pivotal in healthcare and diagnostic medicine as patients’ personal information and medical records are involved [109]. With the increasing adaptation of digital healthcare solutions, concerns about the security measures have also been increasing [110]. Various healthcare data security breaches have been reported in the literature. In 2020, an astounding 642 such cases were reported in the United States, with an unauthorized exposure of over 30 million healthcare records [111].
Digital health data commonly referred to as the Electronic Health Records (EHRs) play an important role in centralizing healthcare system. Using this data, medical experts can have access to the entire patient medical history, ailments, and treatment regimens followed in the past. This information is vital to fast, accurate, and safe diagnosis, prognosis, and treatment [112]. These records are, however, highly confidential since they contain the most private information about the patients [113]. Technologies such as cloud computing and remote access, make this data vulnerable to cyber-attacks [114]. In case of AI-based CAD regimens, the training data also comprises of such medical information, including imaging data, patient history, and blood work. Among the many forms of cyber attacks possible on AI powered CAD systems, ‘Data Poisoning’ is the most significant one [115]. Since an AI model makes decisions based on the data fed to it during training (at least in case of supervised learning), any change in that data can result in abnormal inferences. Optimistically thinking, this cannot cause physical harm to the patient, but in worst case scenario, serious damage can be caused in case of choosing a wrong treatment path due to inaccurate diagnosis. XAI can help curb such issues, where a doctor can identify the invalid explanations generated by the CAD tool, reject the diagnosis, and request a technical inspection and reevaluation of the underlying AI regimen. This would not be possible in old-school ‘black box’ AI, where an inference is supposed to be blindly trusted. On the other hand, in the case of smart medical devices, cyber attacks can result in catastrophic consequences, for example, imagine an insulin pump under such attack [115]. Given the increasing severity of such cyber threats with the advancements in technology [113], stern security measures including encryption protocols, patient data anonymization, access control protocols, and XAI are mandatory along with periodic security audits [116].
3.10. Let There Be Symbiosis!
It is important for doctors and data scientists to work together in this direction. The expertise of radiologists in identifying abnormalities from medical imaging data, and that of engineers in developing software are equally important to accomplish this task, and hence a symbiosis seems to be the only way forward. In addition, specialized trainings combining mathematics, data science, and medicine can be imparted to expedite the research in this direction [6]. Nevertheless, it seems pretty premature to comment on how long it would take to reduce the gap between medical and AI domains to zero.
4. Conclusions
Interpretability and explainability, although an absolute necessity for AI, specially in diagnostic medicine, still has a long way to go to achieve the mandatory levels of maturity for integration in regular medical practice. In addition to the lack of generalizability in AI powered CAD tools, scarcity of histopathologically proven and labelled datasets is also one of major shortcomings being faced by the currently available CAD tools. The key takeaways from this study can be summarized as follows:
- The integration of explainability in such CAD tools will surely increase the confidence of medical experts, but the current modes of explanations might not be enough. More thorough and human professor-like explanations are what the healthcare professionals are looking for.
- The quantitative and qualitative evaluation of such XAI schemes requires a lot of attention. The absence of ground truth data for explainability is also one of the major concerns at the moment which needs special attention, along with legal, ethical, safety, and security issues.
- Nothing of this can be materialized without getting both medical professionals and scientists onboard in an absolute symbiosis for working towards this cause.
It would be an ultimate waste of such tremendous advances in technology, computational resources and AI, that we have witnessed recently, if all this potential is not harnessed and channeled into healthcare to improve the quality of lives suffering from neurodegenerative disorders. It is extremely comforting to imagine a world with reduced mortality due to the fast, accurate, and reliable second opinions from XAI powered CAD tools embedded in healthcare system for doctors, to avoid delays and errors in differential diagnoses, resulting in saving precious lives.
Author Contributions
Conceptualization, K.M. and Y.H.; methodology, K.M., Y.H. and S.A.; formal analysis, Y.H., K.M., and M.Q.; investigation, Y.H., K.M., and S.E.; resources, K.M., Y.H., M.Q., and S.A.; writing—original draft preparation, K.M. and Y.H.; writing—review and editing, K.M. and Y.H.; visualization, Y.H., N.Y., and S.A; supervision, Y.H., K.M., and S.A.; project administration, Y.H.; funding acquisition, Y.H. and S.A. All authors have read and agreed to the published version of the manuscript.
Funding
We would like to acknowledge the support provided by the Deanship of Research Oversight and Coordination (DROC) at King Fahd University of Petroleum and Minerals (KFUPM) and partial support from the Interdisciplinary Research Centre for Smart Mobility for funding this work through project No. INML2403 and the University of Nottingham, Malaysia under the Pump Priming Funding grant number: F0013.54.04.
Institutional Review Board Statement
Not applicable.
Informed Consent Statement
Not applicable.
Data Availability Statement
No new data were created or analyzed in this study. Data sharing is not applicable to this article.
Acknowledgments
The authors would like to thank Dr. Danesh Kella, Assistant Professor, Department of Medicine, Mayo Clinic Florida, USA, for his valuable input in this endeavor.
Conflicts of Interest
The authors declare no conflicts of interest.
References
- World Health Organization. WHO - The top 10 causes of death. 24 Maggio, 2018. Available online: http://www.who.int/en/news-room/fact-sheets/detail/the-top-10-causes-of-death (accessed on 4 November 2023).
- M. Camacho et al.. Explainable classification of Parkinson’s disease using deep learning trained on a large multi-center database of T1-weighted MRI datasets. NeuroImage Clin. 2023, 38, 103405. [Google Scholar] [CrossRef] [PubMed]
- L. M. Duamwan and J. J. Bird. Explainable AI for Medical Image Processing: A Study on MRI in Alzheimer’s Disease. <i>ACM Int. Conf. Proceeding Ser.</i>, pp. L. M. Duamwan and J. J. Bird. Explainable AI for Medical Image Processing: A Study on MRI in Alzheimer’s Disease. ACM Int. Conf. Proceeding Ser. 2023. [Google Scholar] [CrossRef]
- Salih, I. B. Galazzo, F. Cruciani, L. Brusini, and P. Radeva. Investigating Explainable Artificial Intelligence for Mri-Based Classification of Dementia: a New Stability Criterion for Explainable Methods. Proc. - Int. Conf. Image Process. ICIP, pp. 4003– 4007, 2022. [Google Scholar] [CrossRef]
- M. Sidulova, N. M. Sidulova, N. Nehme, and C. H. Park. Towards Explainable Image Analysis for Alzheimer’s Disease and Mild Cognitive Impairment Diagnosis. Proc. - Appl. Imag. Pattern Recognit. Work. 2021; 6. [Google Scholar] [CrossRef]
- E. Tjoa and C. Guan. A Survey on Explainable Artificial Intelligence (XAI): Toward Medical XAI. IEEE Trans. Neural Networks Learn. Syst. 2021, 32, 4793–4813. [Google Scholar] [CrossRef] [PubMed]
- T. Tomson. Excess mortality in epilepsy in developing countries. Lancet Neurol. 2006, 5, 804–805. [Google Scholar] [CrossRef]
- B. Avants, C. L. Epstein, M. Grossman, and J. C. Gee. Symmetric diffeomorphic image registration with cross-correlation: Evaluating automated labeling of elderly and neurodegenerative brain. Med. Image Anal. 2008, 12, 26–41. [Google Scholar] [CrossRef]
- K. Nemoto et al.. Differentiating Dementia with Lewy Bodies and Alzheimer’s Disease by Deep Learning to Structural MRI. J. Neuroimaging 2021, 31, 579–587. [Google Scholar] [CrossRef]
- F. V. Farahani, K. Fiok, B. Lahijanian, W. Karwowski, and P. K. Douglas. Explainable AI: A review of applications to neuroimaging data. Front. Neurosci. 2022, 16. [Google Scholar] [CrossRef]
- G. Yang, Q. Ye, and J. Xia. Unbox the black-box for the medical explainable AI via multi-modal and multi-centre data fusion: A mini-review, two showcases and beyond. Inf. Fusion 2022, 77, 29–52. [Google Scholar] [CrossRef]
- R. A. Zeineldin et al.. Explainability of deep neural networks for MRI analysis of brain tumors. Int. J. Comput. Assist. Radiol. Surg. 2022, 17, 1673–1683. [Google Scholar] [CrossRef]
- M. Odusami, R. Maskeliūnas, R. Damaševičius, and S. Misra. Explainable Deep-Learning-Based Diagnosis of Alzheimer’s Disease Using Multimodal Input Fusion of PET and MRI Images. J. Med. Biol. Eng. 2023, 43, 291–302. [Google Scholar] [CrossRef]
- J. M. Fellous, G. Sapiro, A. Rossi, H. Mayberg, and M. Ferrante. Explainable Artificial Intelligence for Neuroscience: Behavioral Neurostimulation. Front. Neurosci. 2019, 13, 1–14. [Google Scholar] [CrossRef]
- P. Herent, S. Jegou, G. Wainrib, and T. Clozel. Brain age prediction of healthy subjects on anatomic MRI with deep learning : going beyond with an ‘explainable AI’ mindset. bioRxiv, p. 41 3302, 2018, [Online] Available: https://wwwbiorxivorg/content/101101/413302v1%0Ahttps://wwwbiorxivorg/content/101101/413302v1abstract. [Google Scholar]
- N. Bibi, J. N. Bibi, J. Courtney, and K. M. Curran. Explainable Deep Learning for Neuroimaging : A Generalizable Approach for Differential Diagnosis of Brain Diseases. pp. 1–12, 2024.
- J. Qian, H. Li, J. Wang, and L. He. Recent Advances in Explainable Artificial Intelligence for Magnetic Resonance Imaging. Diagnostics 2023, 13. [Google Scholar] [CrossRef]
- M. Nazari et al.. Explainable AI to improve acceptance of convolutional neural networks for automatic classification of dopamine transporter SPECT in the diagnosis of clinically uncertain parkinsonian syndromes. Eur. J. Nucl. Med. Mol. Imaging 2022, 49, 1176–1186. [Google Scholar] [CrossRef]
- S. Shojaei, M. Saniee Abadeh, and Z. Momeni. An evolutionary explainable deep learning approach for Alzheimer’s MRI classification. Expert Syst. Appl. 2023, 220, 119709. [Google Scholar] [CrossRef]
- S. Nazir, D. M. Dickson, and M. U. Akram. Survey of explainable artificial intelligence techniques for biomedical imaging with deep neural networks. Comput. Biol. Med. 2023, 156, 106668. [Google Scholar] [CrossRef]
- J. M. Górriz et al.. Computational approaches to Explainable Artificial Intelligence: Advances in theory, applications and trends. Inf. Fusion 2023, 100, 101945. [Google Scholar] [CrossRef]
- Taşcı. Attention Deep Feature Extraction from Brain MRIs in Explainable Mode: DGXAINet. Diagnostics 2023, 13. [Google Scholar] [CrossRef]
- Boscolo, Galazzo; et al. . Explainable Artificial Intelligence for Magnetic Resonance Imaging Aging Brainprints: Grounds and challenges. IEEE Signal Process. Mag. 2022, 39, 99–116. [Google Scholar] [CrossRef]
- R. A. Zeineldin et al.. Explainable hybrid vision transformers and convolutional network for multimodal glioma segmentation in brain MRI. Sci. Rep. 2024, 14, 1–14. [Google Scholar] [CrossRef]
- M. Champendal, H. Müller, J. O. Prior, and C. S. dos Reis. A scoping review of interpretability and explainability concerning artificial intelligence methods in medical imaging. Eur. J. Radiol. 2023, 169. [Google Scholar] [CrossRef]
- K. Borys et al.. Explainable AI in medical imaging: An overview for clinical practitioners – Beyond saliency-based XAI approaches. Eur. J. Radiol. 2023, 162. [Google Scholar] [CrossRef]
- W. Jin, X. Li, M. Fatehi, and G. Hamarneh. Guidelines and evaluation of clinical explainable AI in medical image analysis. Med. Image Anal. 2023, 84, 102684. [Google Scholar] [CrossRef]
- B. H. M. van der Velden, H. J. Kuijf, K. G. A. Gilhuijs, and M. A. Viergever. Explainable artificial intelligence (XAI) in deep learning-based medical image analysis. Med. Image Anal. 2022, 79, 102470. [Google Scholar] [CrossRef]
- V. Viswan, N. V. Viswan, N. Shaffi, M. Mahmud, K. Subramanian, and F. Hajamohideen, Explainable Artificial Intelligence in Alzheimer’s Disease Classification: A Systematic Review, vol. 16, no. 1. Springer US, 2024.
- K. Borys et al.. Explainable AI in medical imaging: An overview for clinical practitioners - Saliency-based XAI approaches. Eur. J. Radiol. 2023, 162, 110787. [Google Scholar] [CrossRef]
- W. Jin, X. Li, and G. Hamarneh. Evaluating Explainable AI on a Multi-Modal Medical Imaging Task: Can Existing Algorithms Fulfill Clinical Requirements~. Proc. 36th AAAI Conf. Artif. Intell. AAAI 2022 2022, 36, 11945–11953. [Google Scholar] [CrossRef]
- Holzinger, C. Biemann, C. S. Pattichis, and D. B. Kell. What do we need to build explainable AI systems for the medical domain~. no. Ml, pp. 1–28, 2017, [Online]. Available: http://arxiv.org/abs/1712. 0992. [Google Scholar]
- S. Jahan et al.. Explainable AI-based Alzheimer’s prediction and management using multimodal data. PLoS One 2023, 18, 1–26. [Google Scholar] [CrossRef]
- Navoneel Chakrabarty. Brain MRI Images for Brain Tumor Detection. 2018. https://www.kaggle.com/datasets/navoneel/brain-mri-images-for-brain-tumor-detection (accessed Nov. 17, 2024).
- M. Esmaeili, R. Vettukattil, H. Banitalebi, N. R. Krogh, and J. T. Geitung. Explainable artificial intelligence for human-machine interaction in brain tumor localization. J. Pers. Med. 2021, 11. [Google Scholar] [CrossRef]
- S. Liang et al.. Magnetic resonance imaging sequence identification using a metadata learning approach. Front. Neuroinform. 2021, 15, 622951. [Google Scholar]
- Hoopes, J. S. Mora, A. V Dalca, B. Fischl, and M. Hoffmann. SynthStrip: skull-stripping for any brain image. Neuroimage 2022, 260, 119474. [Google Scholar] [CrossRef]
- M. Hashemi, M. Akhbari, and C. Jutten. Delve into multiple sclerosis (MS) lesion exploration: a modified attention U-net for MS lesion segmentation in brain MRI. Comput. Biol. Med. 2022, 145, 105402. [Google Scholar]
- Z. Liu et al.. Deep learning based brain tumor segmentation: a survey. Complex Intell. Syst. 2023, 9, 1001–1026. [Google Scholar] [CrossRef]
- S. S. A. Ali, K. S. S. A. Ali, K. Memon, N. Yahya, K. A. Sattar, and S. El Ferik. Deep Learning Framework-Based Automated Multi-class Diagnosis for Neurological Disorders. in 2023 7th International Conference on Automation, Control and Robots (ICACR), 2023, pp. 87–91.
- L. Alzubaidi et al.. Review of deep learning: concepts, CNN architectures, challenges, applications, future directions. J. big Data 2021, 8, 1–74. [Google Scholar]
- R. ElSebely, B. Abdullah, A. A. Salem, and A. H. Yousef. Multiple Sclerosis Lesion Segmentation Using Ensemble Machine Learning. Saudi J Eng Technol 2020, 5, 134. [Google Scholar] [CrossRef]
- Y. S. Vang et al.. SynergyNet: a fusion framework for multiple sclerosis brain MRI segmentation with local refinement. in 2020 IEEE 17th international symposium on biomedical imaging (ISBI), 2020, pp. 131–135.
- Zeng, L. Gu, Z. Liu, and S. Zhao. Review of deep learning approaches for the segmentation of multiple sclerosis lesions on brain MRI. Front. Neuroinform. 2020, 14, 610967. [Google Scholar] [CrossRef]
- S. R. van der Voort, M. Smits, S. Klein, and A. D. N. Initiative. DeepDicomSort: an automatic sorting algorithm for brain magnetic resonance imaging data. Neuroinformatics 2021, 19, 159–184. [Google Scholar] [CrossRef]
- R. Pizarro et al.. Using Deep Learning Algorithms to Automatically Identify the Brain MRI Contrast: Implications for Managing Large Databases. Neuroinformatics 2019, 17, 115–130. [Google Scholar] [CrossRef]
- R. Gao, G. Luo, R. Ding, B. Yang, and H. Sun. A Lightweight Deep Learning Framework for Automatic MRI Data Sorting and Artifacts Detection. J. Med. Syst. 2023, 47, 124. [Google Scholar] [CrossRef]
- S. Ranjbar et al.. A Deep Convolutional Neural Network for Annotation of Magnetic Resonance Imaging Sequence Type. J. Digit. Imaging 2020, 33, 439–446. [Google Scholar] [CrossRef]
- J. P. V. de Mello et al.. Deep learning-based type identification of volumetric mri sequences. in 2020 25th International Conference on Pattern Recognition (ICPR), 2021, pp. 1–8.
- M. Khuhed. NIVE: NeuroImaging Volumetric Extractor, A High-performance Skull-stripping Tool. 2023. Available online: https://www.mathworks.com/matlabcentral/fileexchange/129574-nive (accessed on 17 January 2024).
- Bruscolini, *!!! REPLACE !!!*; et al. . Diagnosis and management of neuromyelitis optica spectrum disorders - An update. Autoimmun. Rev. 2018, 17, 195–200. [Google Scholar] [CrossRef]
- S. M. Baghbanian, N. Asgari, M. A. Sahraian, and A. N. Moghadasi. A comparison of pediatric and adult neuromyelitis optica spectrum disorders: A review of clinical manifestation, diagnosis, and treatment. J. Neurol. Sci. 2018, 388, 222–231. [Google Scholar] [CrossRef] [PubMed]
- Thouvenot. Multiple sclerosis biomarkers: helping the diagnosis~. Rev. Neurol. (Paris). 2018, 174, 364–371. [Google Scholar] [CrossRef] [PubMed]
- B. Xin, L. B. Xin, L. Zhang, J. Huang, J. Lu, and X. Wang. Multi-level Topological Analysis Framework for Multifocal Diseases. 16th IEEE Int. Conf. Control. Autom. Robot. Vision, ICARCV 2020, 2020. [Google Scholar] [CrossRef]
- D. R. Nayak, R. Dash, and B. Majhi. Automated diagnosis of multi-class brain abnormalities using MRI images: a deep convolutional neural network based method. Pattern Recognit. Lett. 2020, 138, 385–391. [Google Scholar] [CrossRef]
- J. D. Rudie et al.. Subspecialty-level deep gray matter differential diagnoses with deep learning and Bayesian networks on clinical brain MRI: a pilot study. Radiol. Artif. Intell. 2020, 2, e190146. [Google Scholar] [CrossRef]
- P. M. Krishnammal and S. S. Raja. Convolutional neural network based image classification and detection of abnormalities in mri brain images. in 2019 International Conference on Communication and Signal Processing (ICCSP), 2019, pp. 548–553.
- S. S. Raja. Deep learning based image classification and abnormalities analysis of MRI brain images. in 2019 TEQIP III Sponsored International Conference on Microwave Integrated Circuits, Photonics and Wireless Networks (IMICPW), 2019, pp. 427–431.
- Mangeat, *!!! REPLACE !!!*; et al. . Machine learning and multiparametric brain MRI to differentiate hereditary diffuse leukodystrophy with spheroids from multiple sclerosis. J. Neuroimaging 2020, 30, 674–682. [Google Scholar] [CrossRef]
- A. Khan, W. A. Khan, W. Jue, M. Mushtaq, and M. U. Mushtaq. Brain tumor classification in MRI image using convolutional neural network. Math. Biosci. Eng.
- Singh, M. Vadera, L. Samavedham, and E. C.-H. Lim. Machine learning-based framework for multi-class diagnosis of neurodegenerative diseases: a study on Parkinson’s disease. IFAC-PapersOnLine 2016, 49, 990–995. [Google Scholar] [CrossRef]
- Kalbkhani, M. G. Shayesteh, and B. Zali-Vargahan. Robust algorithm for brain magnetic resonance image (MRI) classification based on GARCH variances series. Biomed. Signal Process. Control 2013, 8, 909–919. [Google Scholar] [CrossRef]
- V. Bordin, D. V. Bordin, D. Coluzzi, M. W. Rivolta, and G. Baselli. Explainable AI Points to White Matter Hyperintensities for Alzheimer’s Disease Identification: a Preliminary Study. Proc. Annu. Int. Conf. IEEE Eng. Med. Biol. Soc. EMBS, 2022. [Google Scholar] [CrossRef]
- L. Yu, W. Xiang, J. Fang, Y. P. Phoebe Chen, and R. Zhu. A novel explainable neural network for Alzheimer’s disease diagnosis. Pattern Recognit. 2022, 131. [Google Scholar] [CrossRef]
- M. Sudar, P. M. Sudar, P. Nagaraj, S. Nithisaa, R. Aishwarya, M. Aakash, and S. I. Lakshmi. Alzheimer’s Disease Analysis using Explainable Artificial Intelligence (XAI). Int. Conf. Sustain. Comput. Data Commun. Syst. ICSCDS 2022 - Proc. 2022. [Google Scholar] [CrossRef]
- X. Zhang, L. Han, W. Zhu, L. Sun, and D. Zhang. An Explainable 3D Residual Self-Attention Deep Neural Network for Joint Atrophy Localization and Alzheimer’s Disease Diagnosis Using Structural MRI. IEEE J. Biomed. Heal. Informatics 2022, 26, 5289–5297. [Google Scholar] [CrossRef]
- G. Achilleos, S. Leandrou, N. Prentzas, P. A. Kyriacou, A. C. Kakas, and C. S. Pattichis. Extracting Explainable Assessments of Alzheimer’s disease via Machine Learning on brain MRI imaging data. Proc. - IEEE 20th Int. Conf. Bioinforma. Bioeng. BIBE 2020, pp. 1036– 1041, 2020. [Google Scholar] [CrossRef]
- E. Nigri, N. E. Nigri, N. Ziviani, F. Cappabianco, A. Antunes, and A. Veloso. Explainable Deep CNNs for MRI-Based Diagnosis of Alzheimer’s Disease. Proc. Int. Jt. Conf. Neural Networks. [CrossRef]
- Essemlali, E. St-Onge, M. Descoteaux, and P. M. Jodoin. Understanding Alzheimer disease’s structural connectivity through explainable AI. Proc. Mach. Learn. Res. 2020, 121, 217–229. [Google Scholar]
- F. Ahmed, M. Asif, M. Saleem, U. F. Mushtaq, and M. Imran. Identification and Prediction of Brain Tumor Using VGG-16 Empowered with Explainable Artificial Intelligence. Int. J. Comput. Innov. Sci. 2023, 2, 24–33. [Google Scholar]
- Gaur, M. Bhandari, T. Razdan, S. Mallik, and Z. Zhao. Explanation-Driven Deep Learning Model for Prediction of Brain Tumour Status Using MRI Image Data. Front. Genet. 2022, 13, 1–9. [Google Scholar] [CrossRef] [PubMed]
- Eder, E. Moser, A. Holzinger, C. Jean-Quartier, and F. Jeanquartier. Interpretable Machine Learning with Brain Image and Survival Data. BioMedInformatics 2022, 2, 492–510. [Google Scholar] [CrossRef]
- R. Haque, M. M. Hassan, A. K. Bairagi, and S. M. Shariful Islam. NeuroNet19: an explainable deep neural network model for the classification of brain tumors using magnetic resonance imaging data. Sci. Rep. 2024, 14, 1–22. [Google Scholar] [CrossRef]
- S. Hossain, A. S. Hossain, A. Chakrabarty, T. R. Gadekallu, M. Alazab, and M. J. Piran. Vision Transformers, Ensemble Model, and Transfer Learning Leveraging Explainable AI for Brain Tumor Detection and Classification. IEEE J. Biomed. Heal. Informatics, 14. [CrossRef]
- H. Benyamina, A. S. H. Benyamina, A. S. Mubarak, and F. Al-Turjman. Explainable Convolutional Neural Network for Brain Tumor Classification via MRI Images. Proc. - 2022 Int. Conf. Artif. Intell. Things Crowdsensing, AIoTCs 2022, 2022. [Google Scholar] [CrossRef]
- S. Kamal, A. Northcote, L. Chowdhury, N. Dey, R. G. Crespo, and E. Herrera-Viedma. Alzheimer’s Patient Analysis Using Image and Gene Expression Data and Explainable-AI to Present Associated Genes. IEEE Trans. Instrum. Meas. 2021, 70, 1–7. [Google Scholar] [CrossRef]
- S. El-Sappagh, J. M. Alonso, S. M. R. Islam, A. M. Sultan, and K. S. Kwak. A multilayer multimodal detection and prediction model based on explainable artificial intelligence for Alzheimer’s disease. Sci. Rep. 2021, 11, 1–26. [Google Scholar] [CrossRef]
- Kumar, R. Manikandan, U. Kose, D. Gupta, and S. C. Satapathy. Doctor’s dilemma: Evaluating an explainable subtractive spatial lightweight convolutional neural network for brain tumor diagnosis. ACM Trans. Multimed. Comput. Commun. Appl. 2021, 17. [Google Scholar] [CrossRef]
- .R. C. Poonia and H. A. Al-Alshaikh. Ensemble approach of transfer learning and vision transformer leveraging explainable AI for disease diagnosis: An advancement towards smart healthcare 5.0. Comput. Biol. Med. 2024, 179, 108874. [Google Scholar] [CrossRef]
- K. Veetil, D. E. Chowdary, P. N. Chowdary, V. Sowmya, and E. A. Gopalakrishnan. An analysis of data leakage and generalizability in MRI based classification of Parkinson’s Disease using explainable 2D Convolutional Neural Networks. Digit. Signal Process. A Rev. J. 2024, 147, 104407. [Google Scholar] [CrossRef]
- .G. Lozupone, A. .G. Lozupone, A. Bria, F. Fontanella, and C. De Stefano. AXIAL: Attention-based eXplainability for Interpretable Alzheimer’s Localized Diagnosis using 2D CNNs on 3D MRI brain scans. no. Dl, 2024, [Online]. Available: http://arxiv.org/abs/2407.02418.
- Deshmukh, N. Kallivalappil, K. D’Souza, and C. Kadam. AL-XAI-MERS: Unveiling Alzheimer’s Mysteries with Explainable AI. 2nd Int. Conf. Emerg. Trends Inf. Technol. Eng. ic-ETITE 2024, 2024; 7. [Google Scholar] [CrossRef]
- .S. Tehsin, I. M. Nasir, R. Damaševičius, and R. Maskeliūnas. DaSAM: Disease and Spatial Attention Module-Based Explainable Model for Brain Tumor Detection. Big Data Cogn. Comput. 2024, 8, 97. [Google Scholar] [CrossRef]
- S. T. Padmapriya and M. S. G. Devi. Computer-Aided Diagnostic System for Brain Tumor Classification using Explainable AI. 2024 IEEE Int. Conf. Interdiscip. Approaches Technol. Manag. Soc. Innov. IATMSI 2024, 2024; 6. [CrossRef]
- K. Thiruvenkadam, V. K. Thiruvenkadam, V. Ravindran, and A. Thiyagarajan. Deep Learning with XAI based Multi-Modal MRI Brain Tumor Image Analysis using Image Fusion Techniques. 2024 Int. Conf. Trends Quantum Comput. Emerg. Bus. Technol. 2024; 5. [Google Scholar] [CrossRef]
- T. Mahmud, K. Barua, S. U. Habiba, N. Sharmen, M. S. Hossain, and K. Andersson. An Explainable AI Paradigm for Alzheimer’s Diagnosis Using Deep Transfer Learning. Diagnostics 2024, 14, 1–24. [Google Scholar] [CrossRef]
- Palkar, C. C. Dias, K. Chadaga, and N. Sampathila. Empowering Glioma Prognosis With Transparent Machine Learning and Interpretative Insights Using Explainable AI. IEEE Access 2024, 12, 31697–31718. [Google Scholar] [CrossRef]
- .Narayankar and V., P. Baligar. Explainability of Brain Tumor Classification Based on Region. Int. Conf. Emerg. Technol. Comput. Sci. Interdiscip. Appl. ICETCS 2024, 2024; 6. [Google Scholar] [CrossRef]
- D. Mansouri, A. D. Mansouri, A. Echtioui, R. Khemakhem, and A. Ben Hamida. Explainable AI Framework for Alzheimer’s Diagnosis Using Convolutional Neural Networks. 7th IEEE Int. Conf. Adv. Technol. Signal Image Process. ATSIP 2024, 2024; 98. [Google Scholar] [CrossRef]
- W. Nhlapho, M. W. Nhlapho, M. Atemkeng, Y. Brima, and J. C. Ndogmo. Bridging the Gap: Exploring Interpretability in Deep Learning Models for Brain Tumor Detection and Diagnosis from MRI Images. Inf. 2024; 4. [Google Scholar] [CrossRef]
- M. M. M, M. T. R, V. K. V, and S. Guluwadi. Enhancing brain tumor detection in MRI images through explainable AI using Grad-CAM with Resnet 50. BMC Med. Imaging 2024, 24, 1–19. [Google Scholar] [CrossRef]
- V. Adarsh, G. R. Gangadharan, U. Fiore, and P. Zanetti. Multimodal classification of Alzheimer’s disease and mild cognitive impairment using custom MKSCDDL kernel over CNN with transparent decision-making for explainable diagnosis. Sci. Rep. 2024, 14, 1–16. [Google Scholar] [CrossRef]
- Amin, K. Hasan, and M. S. Hossain. XAI-Empowered MRI Analysis for Consumer Electronic Health. IEEE Trans. Consum. Electron. 2024; 1. [Google Scholar] [CrossRef]
- I. Korda et al.. Identification of texture MRI brain abnormalities on first-episode psychosis and clinical high-risk subjects using explainable artificial intelligence. Transl. Psychiatry, 2022; 1. [CrossRef]
- X. Zhang, L. X. Zhang, L. Han, W. Zhu, L. Sun, and D. Zhang. An Explainable 3D Residual Self-Attention Deep Neural Network For Joint Atrophy Localization and Alzheimer’s Disease Diagnosis using Structural MRI. IEEE J. Biomed. Heal. Informatics, 2021; 8. [Google Scholar] [CrossRef]
- M. Nazari et al.. Data-driven identification of diagnostically useful extrastriatal signal in dopamine transporter SPECT using explainable AI. Sci. Rep. 2021, 11, 1–13. [Google Scholar] [CrossRef]
- Lombardi, *!!! REPLACE !!!*; et al. . Explainable Deep Learning for Personalized Age Prediction With Brain Morphology. Front. Neurosci. 2021, 15, 1–17. [Google Scholar] [CrossRef]
- .M. S. Kamal, A. .M. S. Kamal, A. Northcote, L. Chowdhury, N. Dey, R. G. Crespo, and E. Herrera-Viedma. Alzheimer’s Patient Analysis Using Image and Gene Expression Data and Explainable-AI to Present Associated Genes. IEEE Trans. Instrum. Meas. 2021. [Google Scholar] [CrossRef]
- Salih, *!!! REPLACE !!!*; et al. . A new scheme for the assessment of the robustness of explainable methods applied to brain age estimation. Proc. - IEEE Symp. Comput. Med. Syst. 2021. [Google Scholar] [CrossRef]
- .H. Tatekawa et al.. Imaging differences between neuromyelitis optica spectrum disorders and multiple sclerosis: a multi-institutional study in Japan. Am. J. Neuroradiol. 2018, 39, 1239–1247. [Google Scholar] [CrossRef]
- Y. Miki. Magnetic resonance imaging diagnosis of demyelinating diseases: an update. Clin. Exp. Neuroimmunol. 2019, 10, 32–48. [Google Scholar] [CrossRef]
- Fiala, D. Rotstein, and M. D. Pasic. Pathobiology, diagnosis, and current biomarkers in neuromyelitis optica spectrum disorders. J. Appl. Lab. Med. 2022, 7, 305–310. [Google Scholar] [CrossRef]
- M. Etemadifar, M. M. Etemadifar, M. Norouzi, S.-A. Alaei, R. Karimi, and M. Salari. The diagnostic performance of AI-based algorithms to discriminate between NMOSD and MS using MRI features: A systematic review and meta-analysis. Mult. Scler. Relat. Disord. 5682. [Google Scholar]
- S. Tatli et al.. Transfer-transfer model with MSNet: An automated accurate multiple sclerosis and myelitis detection system. Expert Syst. Appl. 2024, 236, 121314. [Google Scholar] [CrossRef]
- J. Kuchling and F. Paul. Visualizing the central nervous system: imaging tools for multiple sclerosis and neuromyelitis optica spectrum disorders. Front. Neurol. 2020, 11, 450. [Google Scholar]
- Bruscolini, *!!! REPLACE !!!*; et al. . Diagnosis and management of neuromyelitis optica spectrum disorders-An update. Autoimmun. Rev. 2018, 17, 195–200. [Google Scholar] [CrossRef]
- M. T. Duong et al.. Convolutional neural network for automated FLAIR lesion segmentation on clinical brain MR imaging. Am. J. Neuroradiol. 2019, 40, 1282–1290. [Google Scholar] [CrossRef]
- S. -U. Lee, H.-J. Kim, J.-H. Choi, J.-Y. Choi, and J.-S. Kim. Comparison of ocular motor findings between neuromyelitis optica spectrum disorder and multiple sclerosis involving the brainstem and cerebellum. The Cerebellum 2019, 18, 511–518. [Google Scholar] [CrossRef]
- Majumder and C., B. Veilleux. Smart health and cybersecurity in the era of artificial intelligence. Comput. Commun.
- Chakraborty, S. M. Nagarajan, G. G. Devarajan, T. V Ramana, and R. Mohanty. Intelligent ai-based healthcare cyber security system using multi-source transfer learning method. ACM Trans. Sens. Networks.
- J. R. Saura, D. Ribeiro-Soriano, and D. Palacios-Marqués. Setting privacy ‘by default’ in social IoT: Theorizing the challenges and directions in Big Data Research. Big Data Res. 2021, 25, 100245. [Google Scholar] [CrossRef]
- Y. Chen et al.. Information Security and Artificial Intelligence-Assisted Diagnosis in an Internet of Medical Thing System (IoMTS). IEEE Access 2024, 12, 9757–9775. [Google Scholar] [CrossRef]
- M. Damar, A. Özen, and A. Yılmaz. Cybersecurity in The Health Sector in The Reality of Artificial Intelligence, And Information Security Conceptually. J. AI 2024, 8, 61–82. [Google Scholar] [CrossRef]
- J. Yanase and E. Triantaphyllou. The seven key challenges for the future of computer-aided diagnosis in medicine. Int. J. Med. Inform. 2019, 129, 413–422. [Google Scholar] [CrossRef]
- E. Biasin, E. E. Biasin, E. Kamenjašević, and K. R. Ludvigsen. Cybersecurity of AI medical devices: risks, legislation, and challenges. Res. Handb. Heal. AI Law, 2024; 74. [Google Scholar] [CrossRef]
- H. M. Rai, D. Tsoy, and Y. Daineko. MetaHospital: implementing robust data security measures for an AI-driven medical diagnosis system. Procedia Comput. Sci. 2024, 241, 476–481. [Google Scholar] [CrossRef]
Figure 1.
Accuracy – Interpretability trade-off.
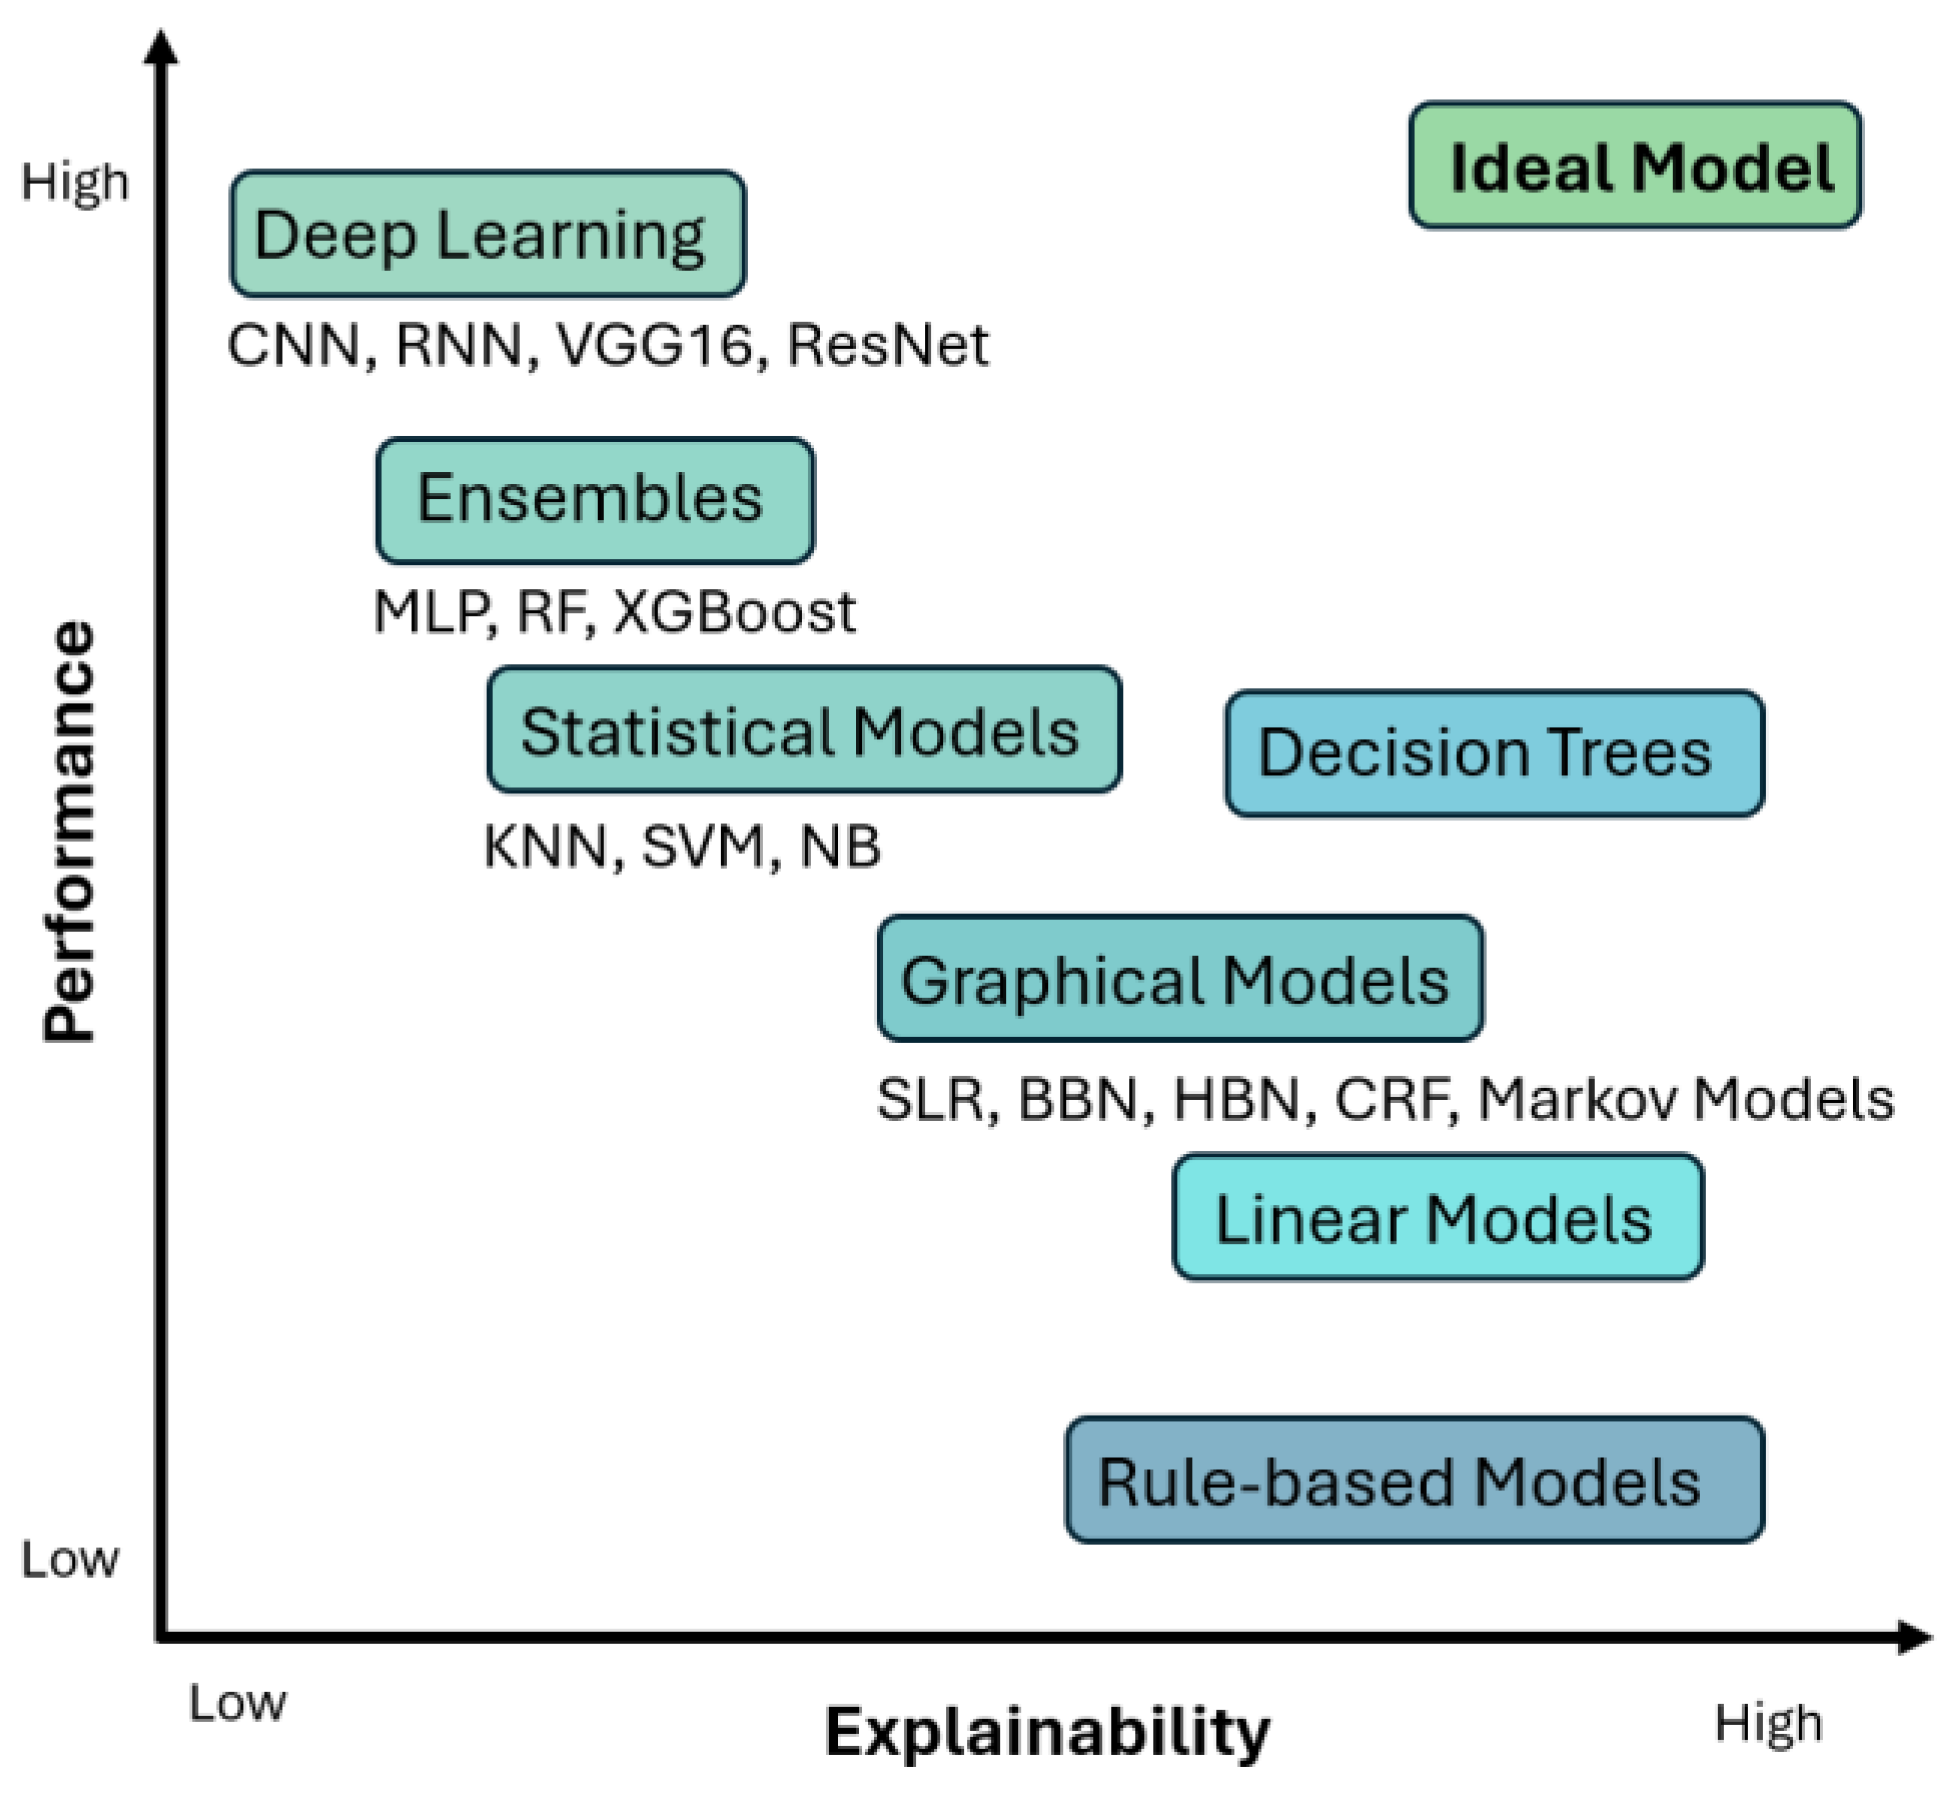
Figure 2.
Block diagram – the journey from the old-school black box models to XAI.
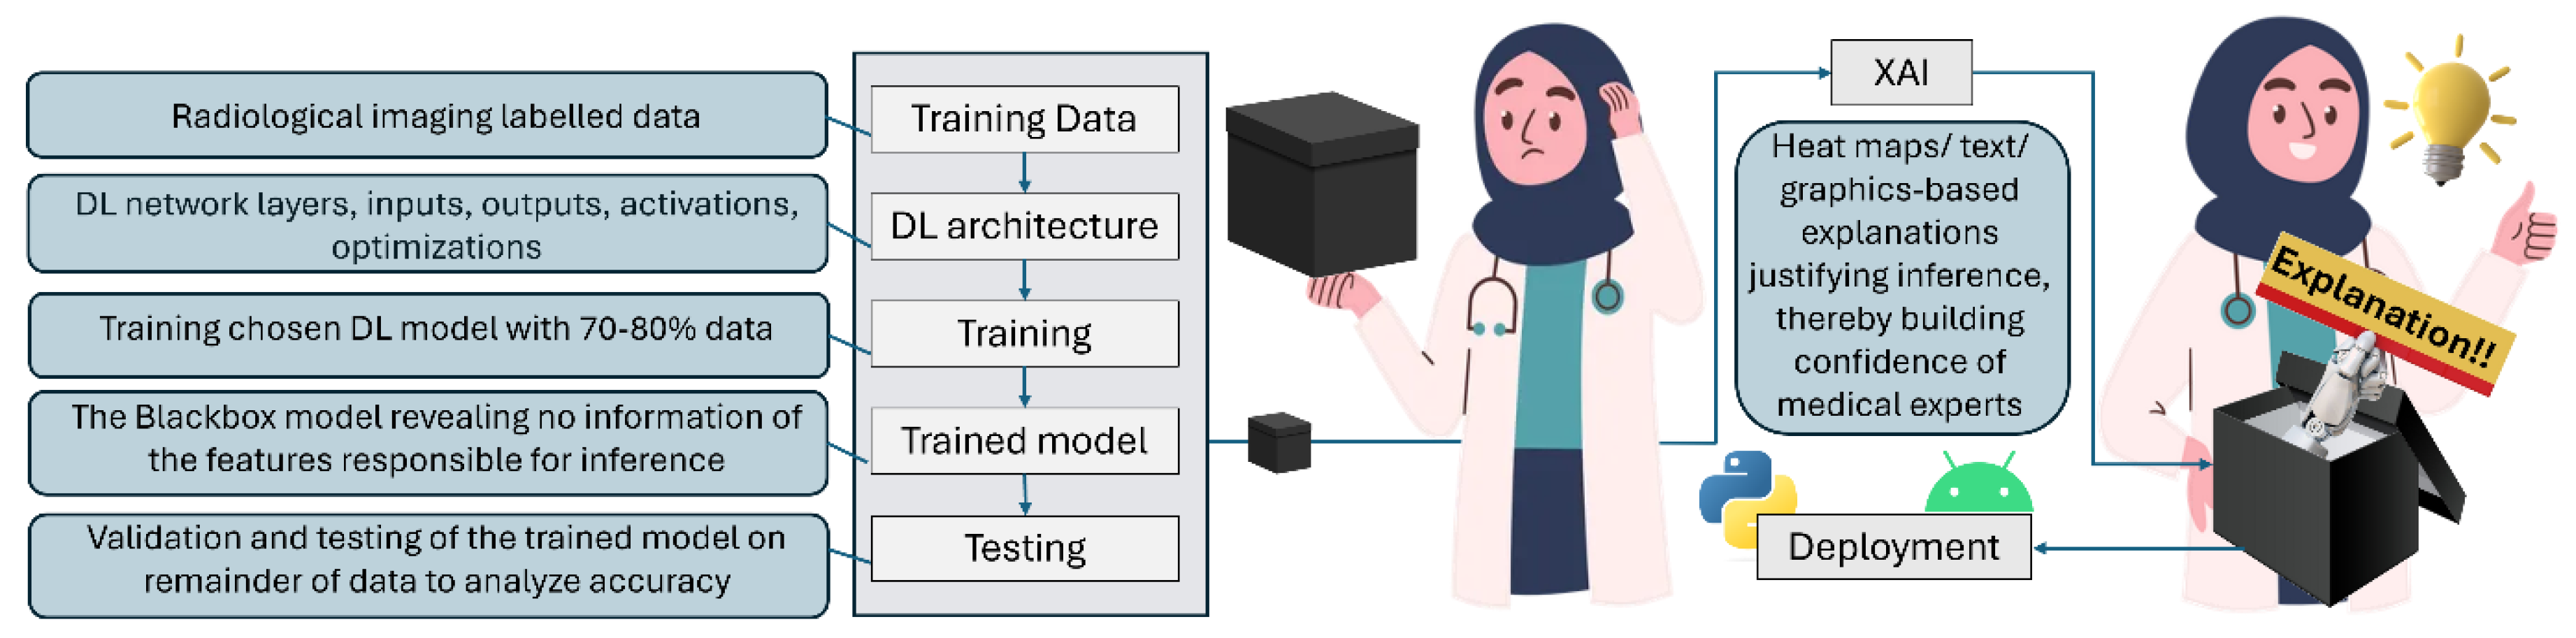
Figure 3.
Brain MRI with tumor taken from Kaggle dataset [34] correctly classified by MobileNetV2 trained with 154 images with tumor (class 1) and 97 images without tumor (class 2) for this demonstration. Figure shows (a) raw MRI, and heatmaps to highlight regions responsible for classification generated by (b) Grad-CAM, (c) LIME, and (d) OSA, using MATLAB R2022b. ‘Jet’ color scheme used to highlight the image based on the influence of different regions leading towards this inference (tumor) by the DL model. The ‘jet’ colormap has deep blue as the lowest value and deep red as the highest, as shown at the top of the figure. Notice the inaccuracies of the heatmaps in (b), (c), and (d), highlighting irrelevant regions as shown in (b), and missing critical tumorous regions as shown in (d). This is primarily due to the primitive nature of the dataset employed to train the DL regimen used here for demonstration purposes and can be improved further in practical scenarios. An ideal heatmap (generated manually) is shown in (e), where only the tumor region appears the most significant (red), and all other pixels appear least significant (blue) for this brain tumor classification example. .
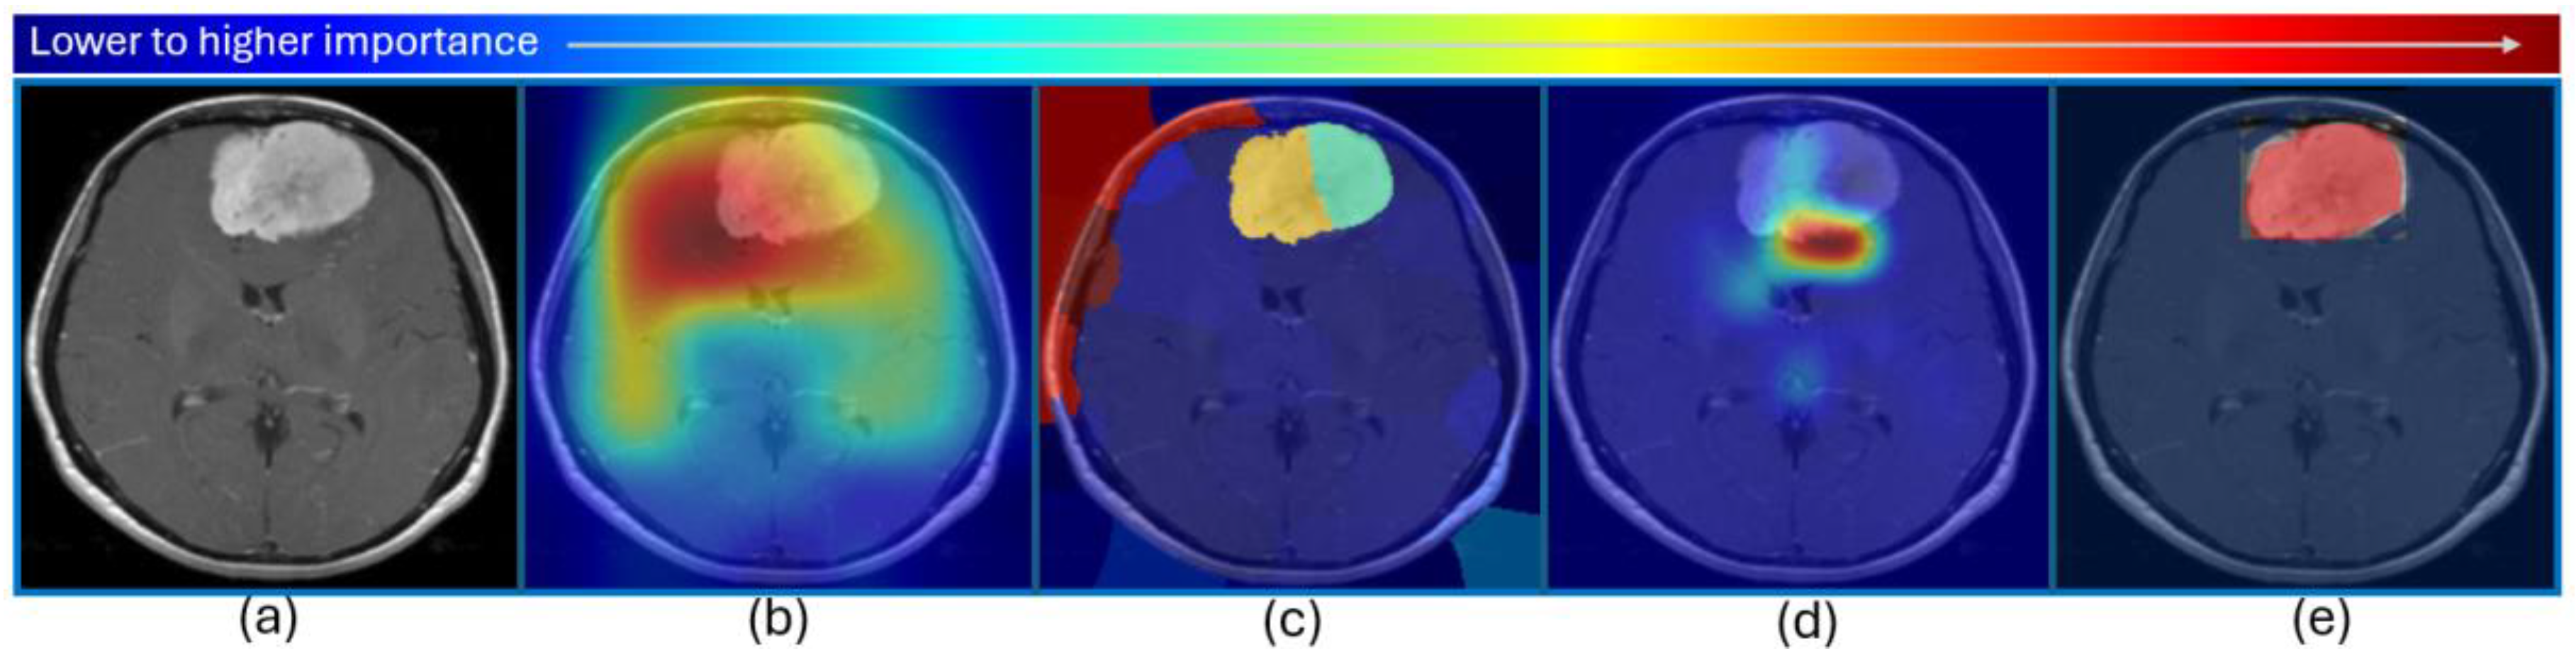
Figure 4.
PRISMA study selection diagram- out of 92 articles identified, 81 were included in the qualitative analysis.
Figure 4.
PRISMA study selection diagram- out of 92 articles identified, 81 were included in the qualitative analysis.
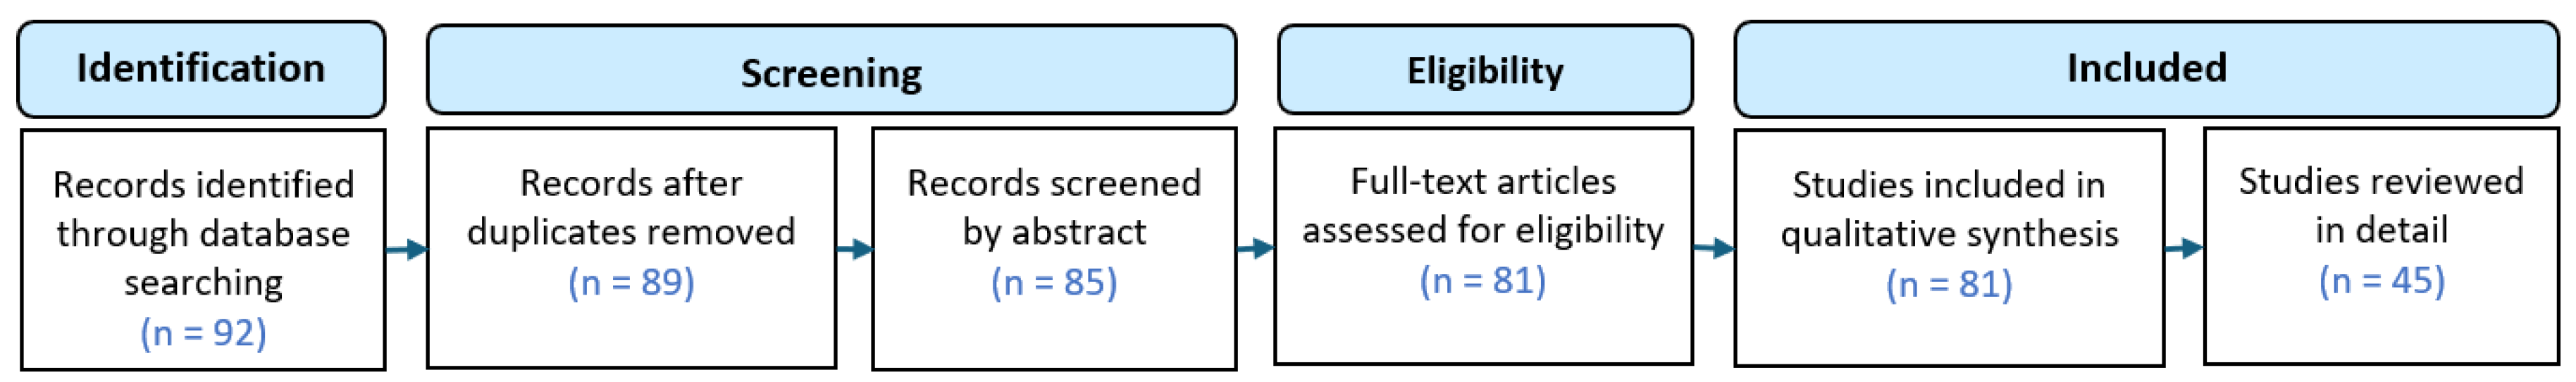

Table 1.
XAI CAD research for neurological disorders. The table contains the year of study, the pathology diagnosed, the modality used, the AI technology employed, the accuracy of the proposed system, the XAI technology embedded, and the dataset used for training the systems.
Table 1.
XAI CAD research for neurological disorders. The table contains the year of study, the pathology diagnosed, the modality used, the AI technology employed, the accuracy of the proposed system, the XAI technology embedded, and the dataset used for training the systems.
| Study | Pathology | Modality | Technology | Accuracy | XAI | Dataset |
| [79] 2024 | AD | MRI | Transfer Learning (TL), Vision Transformer (ViT) | TL 58%, TL ViT Ensemble 96% |
- | ADNI |
| [80] 2024 | PD | MRI T1w | 12 pre-trained CNN models | VGG19 best performance | Grad-CAM | PPMI (213 PD, 213 Normal Control (NC)), NEUROCRON (27 PD, 16 NC) and Tao Wu (18 PD, 18 NC) |
| [81] 2024 | AD, progressive Mild Cognitive Impairment (pMCI), stable MCI (sMCI) | MRI | 2D-CNN, TL | AD-CN 86.5%, sMCI-pMCI 72.5% |
3D attention map | ADNI (AD 191, pMCI 121, sMCI 110, NC 204 subjects) |
| [82] 2024 | Very mild dementia, moderate dementia, mild dementia, non demented | MRI | DenseNet121, MobileNetV2 | MobileNetV2 93%, DenseNet121 88% | LIME | OASIS |
| [83] 2024 | Brain tumor | MRI | Disease and Spatial Attention Model (DaSAM) | Up to 99% | - | Figshare and Kaggle datasets |
| [84] 2024 | Brain tumor | MRI | VGG16 | 99.4% | Grad-CAM | Kaggle and BraTS 2021 dataset |
| [85] 2024 | Brain tumor | MRI FLAIR, T1, T2w | CNN | 98.97% | - | 3300 images from BraTS dataset |
| [86] 2024 | AD | MRI | Ensemble-1 (VGG16 and VGG19) and Ensemble-2 (DenseNet169 and DenseNet201) | up to 96% | Saliency maps and Grad-CAM | Kaggle and OASIS-2 (896 MRIs for mild dementia, 64 moderate dementia, 3200 non-dementia, and 2240 very mild dementia) |
| [87] 2024 | Glioma | 23 Clinical and Molecular/ mutation factors | RF, decision trees (DT), logistic regression (LR), K-nearest neighbors (KNN), Adaboost, Support Vector Machine (SVM), Catboost, Light Gradient-Boosting Machine (LGBM) classifier, Xgboost, CNN | 88% for Xgboost | SHAP, Eli5, LIME, and QLattice | Glioma Grading Clinical and Mutation Features Dataset – 352 Glioblastoma Multiforme (GBM), 487 LGG patients |
| [88] 2024 | Glioma, Meningioma, Pituitary tumor | MRI | CNN | 80% | LIME, SHAP, Integrated Gradients (IG), and Grad-CAM | 7043 images from Figshare, SARTAJ, Br35H datasets |
| [89] 2024 | AD | MRI | CNN | Real MRI 88.98%, Real + Synthetic MRIs 97.50% | Grad-CAM | Kaggle - 896 MRIs for Mild Impairment, 64 Moderate Impairment, 3200 No Impairment, 2240 Very Mild Impairment. Synthetic images generated using Wasserstein Generative Adversarial Network with Gradient Penalty (WGAN-GP) |
| [90] 2024 | Brain tumor | MRI T1w | 10 TL frameworks | Up to 98% for EfficientNetB0 | Grad-CAM, Grad-CAM++, IG, and Saliency Mapping | Kaggle - 926 MRI images of glioma tumors, 500 with no tumors, 901 pituitary tumors, and 937 meningioma tumors |
| [91] 2024 | Brain tumor | MRI | ResNet50 | 98.52% | Grad-CAM | Kaggle |
| [92] 2024 | AD, MCI | MRI | CNNs with a Multi-feature Kernel Supervised within-class-similar Discriminative Dictionary Learning (MKSCDDL) | 98.27% |
Saliency maps, Grad-CAM, Score-CAM, Grad-CAM++ | ADNI |
| [93] 2024 | Brain tumor | MRI | Physics-informed deep learning (PIDL) | 96% | LIME, Grad-CAM | Kaggle - glioma 1621 images, meningioma 1645, pituitary tumors 1775, and non-tumorous scans 2000 images |
| [73] 2024 | Brain tumors four classes: glioma, meningioma, no tumor, and pituitary tumors | MRI |
VGG19 with Inverted Pyramid Pooling Module (iPPM) | 99.3% | LIME |
Kaggle - 7023 images |
| [24] 2024 | Gliomas segmentation | 3D pre-operative multimodal MRI scans including T1w, T1Gd, T2w, and FLAIR | Hybrid vision Transformers and CNNs | Dice up to 0.88 |
Grad-CAM - TransXAI, post-hoc surgeon understandable heatmaps | BraTS 2019 challenge dataset including 335 training and 125 validation subjects |
| [16] 2024 | Types of brain tumors, MS | MRI | DenseNet121 | 99% |
Grad-CAM | Glioma, Meningioma, Pituitary tumors, from Figshare, the SARTAJ dataset and Br35H: Brain Tumor Detection 2020 The MS dataset from study by the Ozal University Medical Faculty, 72 MS patients and 59 healthy controls (HC) |
| [2] 2023 | PD | MRI T1w | CNN |
79.3% |
Saliency maps | 1,024 PD patients and 1,017 age and sex matched HC from 13 different studies |
| [33] 2023 | AD, cognitively normal, non-Alzheimer’s dementia, uncertain dementia, and others | Clinical, Psychological, and MRI segmentation data | RF, LR, DT, MLP, KNN, GB, AdaB, SVM, and Naïve Bayes (NB) | 98.81% | SHAP | OASIS-3, ADRC clinical data, Number of NC, AD, Other dementia/ Non-AD, Uncertain, and Others are 4476, 1058, 142, 505, and 43, respectively |
| [13] 2023 | AD | PET and MRI | Modified Resnet18 | 73.90% | - | ADNI - 412 MRIs and 412 PETs |
| [70] 2023 | Brain tumor | MRI | VGG16 | 97.33% |
LRP | 1500 normal brain MRI images and 1500 tumor brain MRI images - Kaggle |
| [3] 2023 | Non-dementia, very mild, mild, and moderate | MRI | CNN | 94.96%. | LIME | ADNI |
| [69] 2023 | AD, MCI | DW-MRI | CNN | 78% for NC-MCI (45 test samples), 91% for NC-AD (45 test samples) and 81% MCI-AD (49 test samples) | Saliency map visualization | ADNI2 and ADNI-Go - 152 NC, 181 MCI and 147 AD |
| [22] 2023 | Brain tumor | MRI | DenseNet201, iterative neighborhood component (INCA) feature selector, SVM | 98.65% and 99.97%, for Datasets I and II | Grad-CAM |
Four-class Kaggle brain tumor dataset and the three-class Figshare brain tumor dataset |
| [19] 2023 | AD | MRI | 3D CNN | 87% | Genetic algorithm-based Occlusion Map method with a set of Backpropagation-based explainability methods | ADNI - 145 samples (74 AD and 71 HC) |
| [74] 2023 | Brain tumor | MRI | VGG16, InceptionV3, VGG19, ResNet50, InceptionResNetV2, Xception, and IVX16 | 95.11%, 93.88%, 94.19%, 93.88%, 93.58%, 94.5%, and 96.94% for VGG16, InceptionV3, VGG19, ResNet50, InceptionResNetV2, Xception, and IVX16, respectively | LIME | Kaggle - 3264 images |
| [12] 2022 | Brain tumor (classification and segmentation) | MRI | ResNet50 for classification, encoder–decoder neural network for segmentation | - | Vanilla gradient, guided backpropagation, integrated gradients, guided integrated gradients, SmoothGrad, Grad-CAM, and guided Grad-CAM visualizations | BraTS challenges 2019 (259 cases of HGG and 76 cases of LGG) and 2021 (1251 MRI images with ground truth annotations) |
| [4] 2022 | AD, EMCI, MCI, LMCI | MRI T1w | DT, LGBM, LR, RF and Support Vector Classifier (SVC) | - | SHAP | ADNI3 - 475 subjects, including 300 controls (HC, 254 Cognitively Normal and 46 Significant Memory Concern) and 175 patients with dementia (comprising 70 early MCI, 55 MCI, 34 Late MCI and 16 AD) |
| [71] 2022 | Brain tumors (meningioma, glioma, and pituitary) | MRI | CNN | 94.64% | LIME, SHAP | 2,870 images from Kaggle |
| [63] 2022 | Early-stage AD dementia | MRI | EfficientNet-B0 | AUC: 0.82 | Occlusion Sensitivity | 251 from OASIS-3 |
| [64] 2022 | AD | MRI T1w | MAXNet with Dual Attention Module (DAM) and Multi-resolution Fusion Module (MFM) | 95.4% | High-resolution Activation Mapping (HAM), and a Prediction-basis Creation and Retrieval (PCR) | ADNI - 826 cognitively normal individuals and 422 Alzheimer’s patients |
| [72] 2022 | Brain tumors (survival rate prediction) | MRI T1w, T1ce, T2w, FLAIR | CNN | 71% | SHAP | 235 patients from BraTS 2020 |
| [75] 2022 | Brain tumor | MRI | VGG16 | - | SHAP | Kaggle |
| [65] 2022 | AD: non-demented, very mild demented, mild demented and moderate demented | MRI | VGG16 | 78.12% |
LRP | 6400 images with 4 classes |
| [18] 2022 | PD | Dopamine transporter (DAT) SPECT | CNN | 95.8% | LRP | 1296 clinical DAT-SPECT as “normal” or “reduced” from the PACS of the Department of Nuclear Medicine of the University Medical Center Hamburg Eppendorf |
| [94] 2022 | Psychosis | MRI | Neural network-based classifier | Above 72% | LRP | 77 first-episode psychosis (FEP) patients, 58 clinical high-risk subjects with no later transition to psychosis (CHR_NT), 15 clinical high-risk subjects with later transition (CHR_T), and 44 HC from the early detection of psychosis project (FePsy) at the Department of Psychiatry, University of Basel, Switzerland |
| [95] 2021 | AD vs. NC and pMCI vs. sMCI | MRI | 3D Residual Attention Deep Neural Network (3D ResAttNet) | 91% AD vs NC, 82% pMCI vs sMCI |
Grad-CAM |
1407 subjects from ADNI-1, ADNI-2 and ADNI-3 datasets |
| [96] 2021 | PD | DAT SPECT | 3D CNN | 97.0% | LRP | 1306 123I-FP-CIT-SPECT, PACS of the Department of Nuclear Medicine of the University Medical Center Hamburg Eppendorf |
| [97] 2021 | Age Prediction | MRI T1w | DNN | - | SHAP and LIME | ABIDE I - 378 T1w MRI |
| [5] 2021 | AD, MCI | EEG | SVM, ANN, CNN | Up to 96% | LIME | 284 AD, 56 MCI, 100 HC |
| [98] 2021 | AD | MRI and Gene Expression data | CNN, KNN, SVC, Xboost | 97.6% | LIME | Kaggle - 6400 MRI images, gene from the dataset OASIS −3, NCBI database, which contains 104 gene expression data from patients |
| [99] 2021 | Age estimation | Structural MRI (sMRI), Susceptibility Weighted Imaging (SWI) and diffusion MRI (dMRI) | DNN | - | SHAP and LIME | 16394 subjects (7742 male and 8652 female) from UKB United Kingdom Biobank |
| [35] 2021 | Brain tumor lower-grade gliomas and the most aggressive malignancy, glioblastoma (WHO grade IV) |
MRI T2w |
DenseNet121, GoogLeNet, MobileNet | DenseNet-121, GoogLeNet, MobileNet achieved an accuracy of 92.1, 87.3, and 88.9 | Grad-CAM |
TCGA dataset from The Cancer Imaging Archive repositories - 354 subjects - 19,200 and 14,800 slices of brain images with and without tumor lesions |
| [77] 2021 | AD, MCI | 11 modalities – PET, MRI, Cognitive scores, Genetic, CSF, Lab tests data, etc. | RF | 93.95% for AD detection and 87.08% for progression prediction | SHAP - these explanations are represented in natural language form to help physicians understand the predictions | ADNI - 294 cognitively normal, 254 stable MCI, 232 progressive MCI, and 268 AD |
| [68] 2020 | AD | MRI T1w | Variants of AlexNet, VGG16 |
- | Swap Test / Occlusion Test | ADNI Australian Imaging, Biomarker & Lifestyle Flagship Study of Ageing3 (AIBL) - training, validation, and test sets, each of them containing respectively 1,779, 427, and 575 images |
| [67] 2020 | AD | T1w volumetric 3D sagittal magnetization prepared rapid gradient-echo (MPRAGE) scans | DT and RF | Average 91% | Argumentation-based reasoning frame- work | ADNI – NC 144 and AD 69 |
Disclaimer/Publisher’s Note: The statements, opinions and data contained in all publications are solely those of the individual author(s) and contributor(s) and not of MDPI and/or the editor(s). MDPI and/or the editor(s) disclaim responsibility for any injury to people or property resulting from any ideas, methods, instructions or products referred to in the content. |
© 2024 by the authors. Licensee MDPI, Basel, Switzerland. This article is an open access article distributed under the terms and conditions of the Creative Commons Attribution (CC BY) license (http://creativecommons.org/licenses/by/4.0/).
Copyright: This open access article is published under a Creative Commons CC BY 4.0 license, which permit the free download, distribution, and reuse, provided that the author and preprint are cited in any reuse.


