
Submitted:
05 December 2024
Posted:
06 December 2024
You are already at the latest version
Abstract
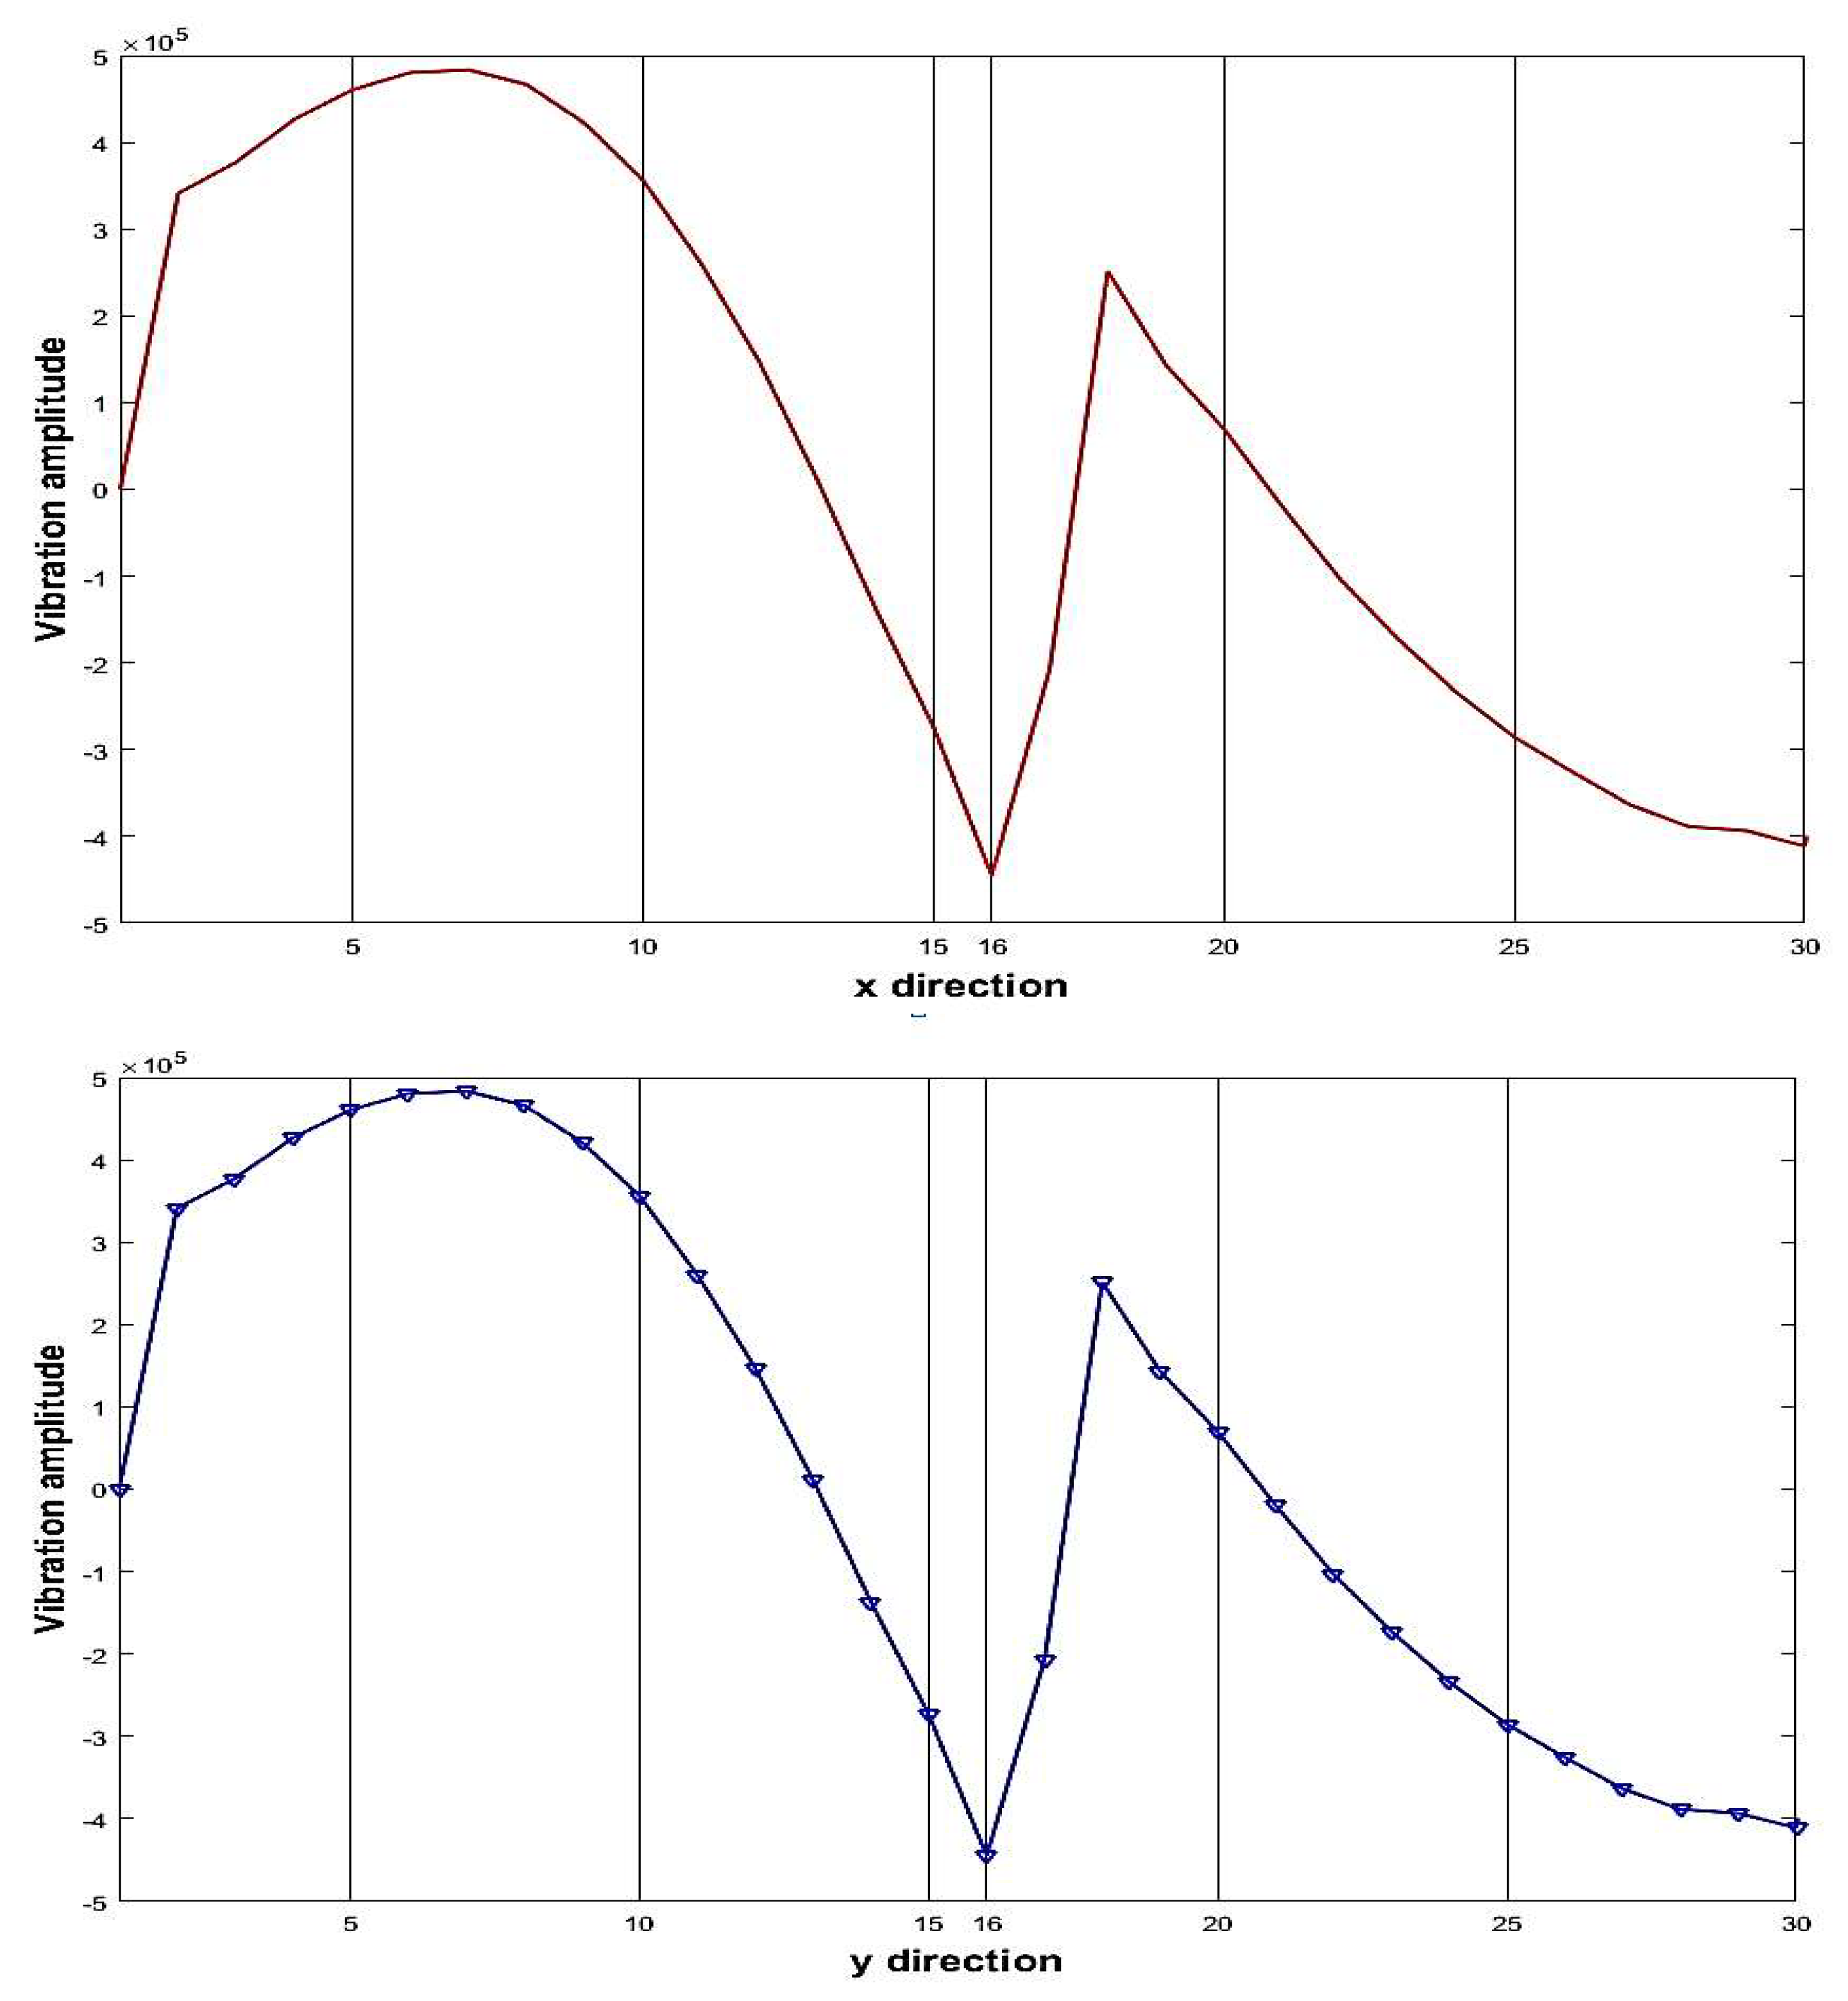
Currently, the wavelet technique has a weakness for detecting damage at the edge of two-dimensional signals. This weakness arises from the nature of the wavelet transform procedure, which shifts the signal by differencing the signal’s pair arrays in the neighborhood. This study introduces the mode shape projection method as an efficient technique for damage detection of two-dimensional signals in rectangular laminated composite plates to eliminate the weakness of damage detection by the wavelet method. In other words, this paper proposes creating two one-dimensional waves containing information about damages or faults in signals from vibration amplitude signals of composite plates to have an efficient damage detection method. Results show that the proposed method acts much better than wavelet transform and detects damages in numerical and experimental investigations with high performance for various damage scenarios.
Keywords:
1. Introduction
2. Wavelet Transform
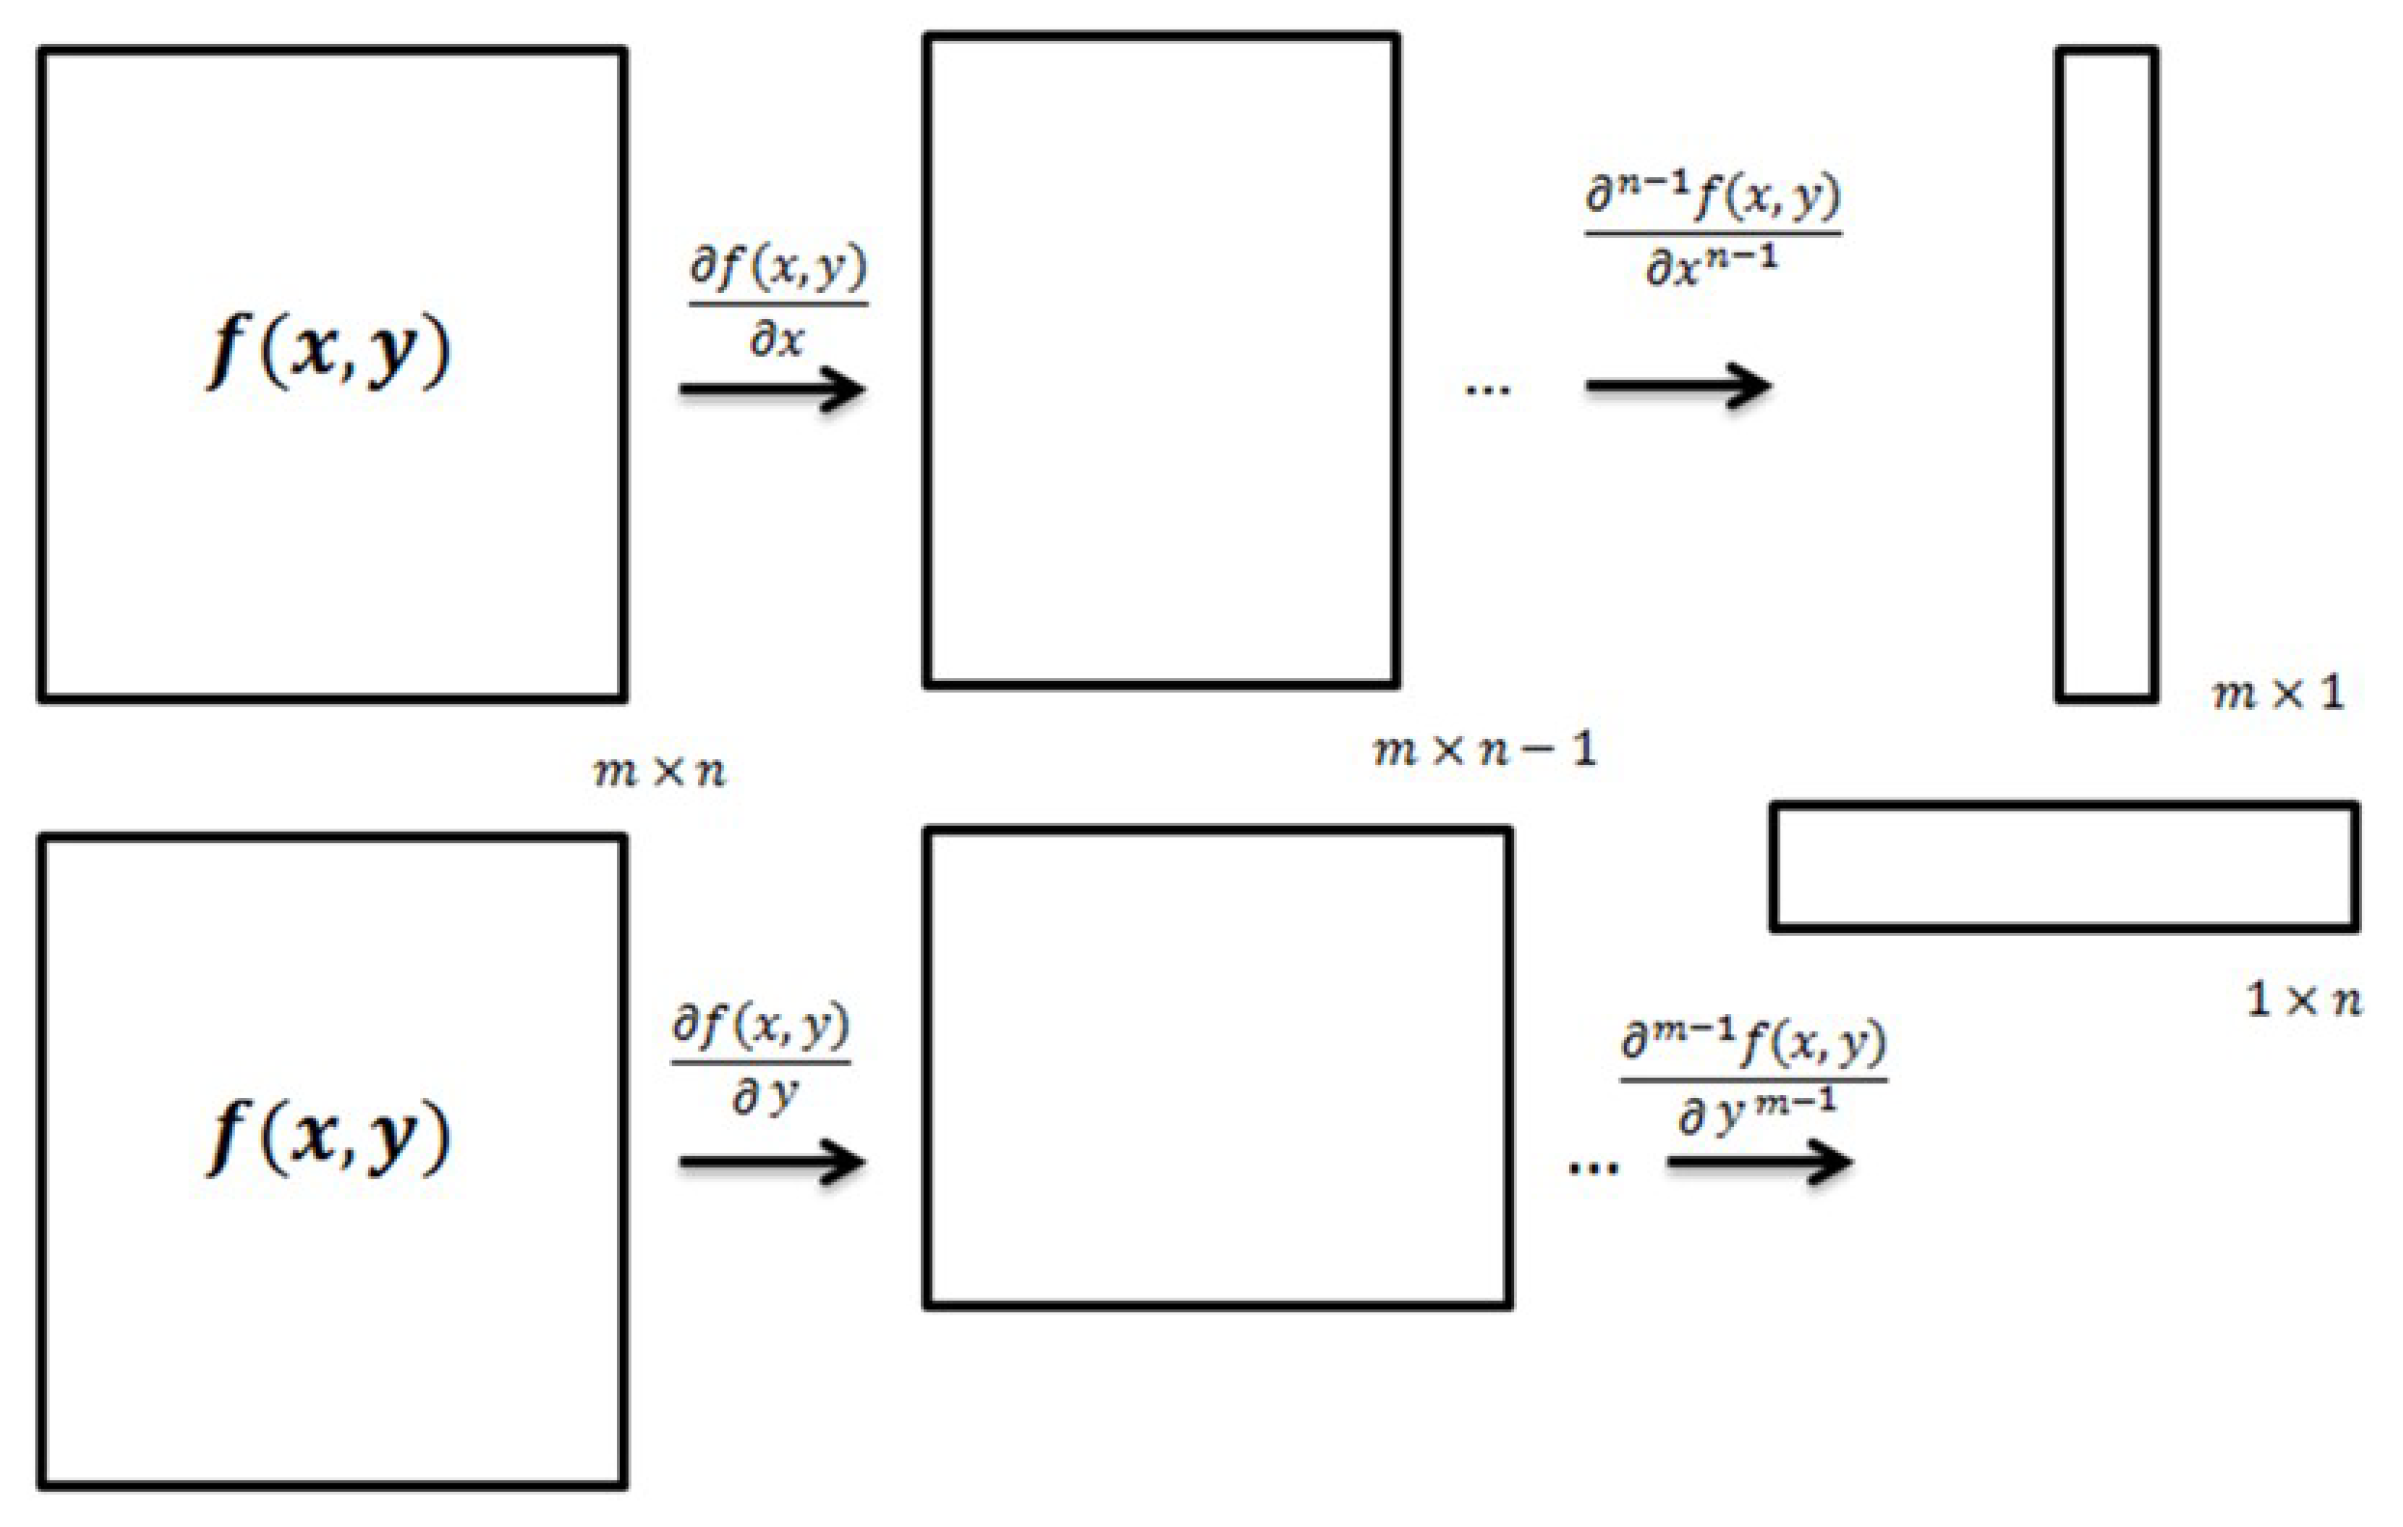
3. Mode Shape Projection Method
4. Results
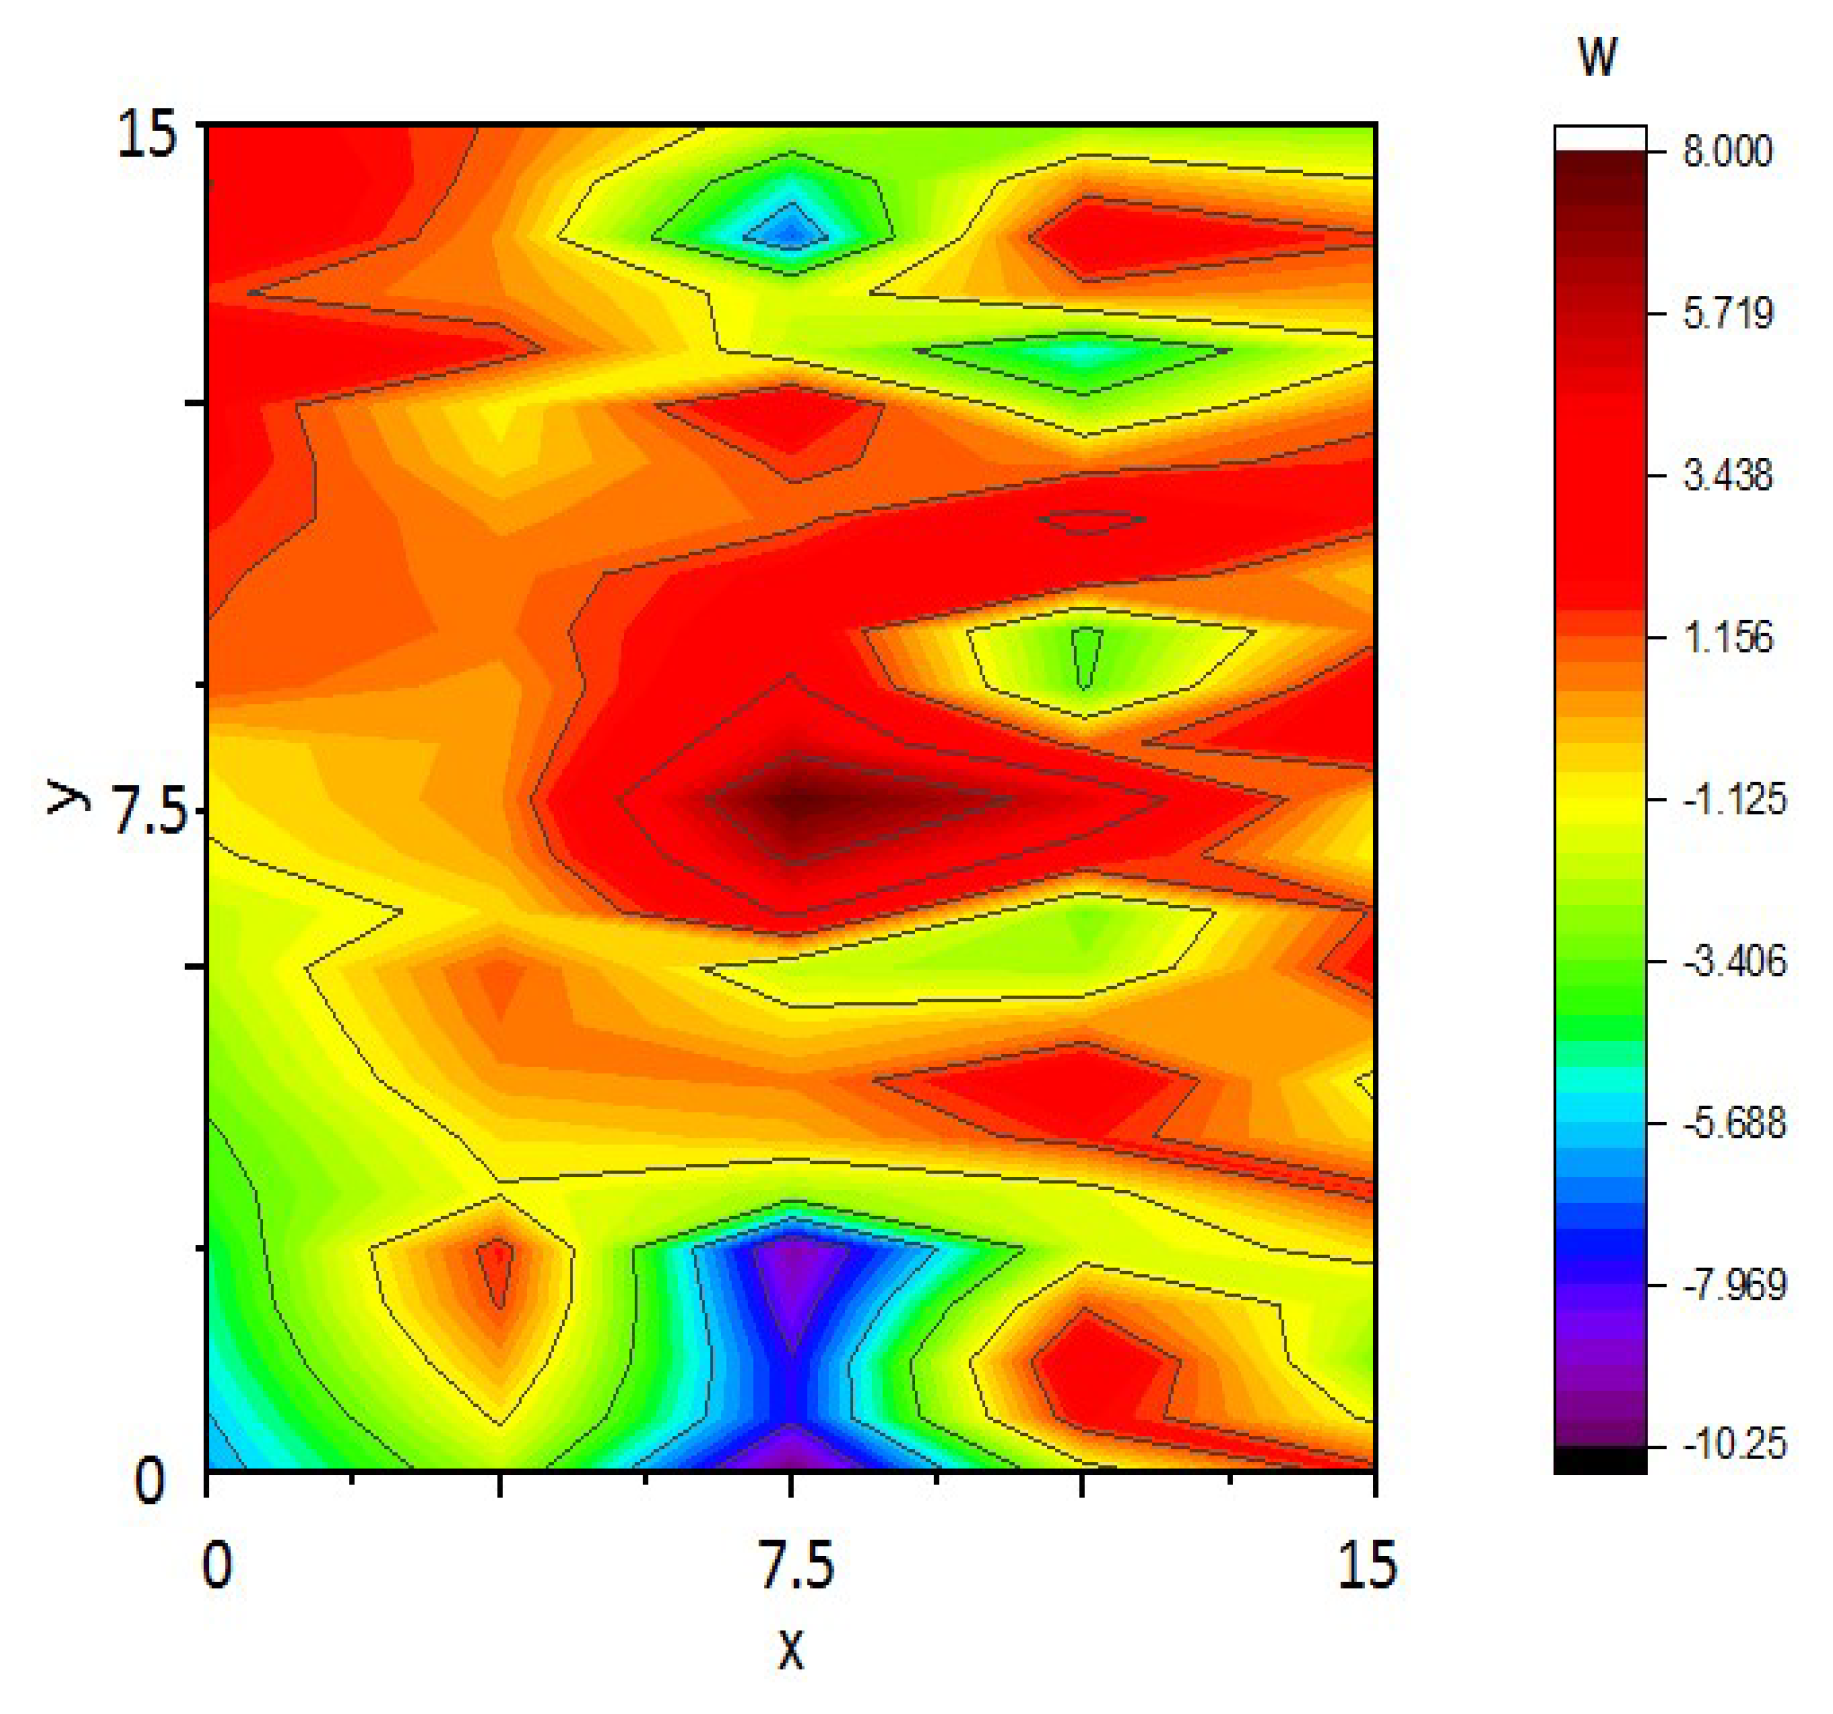
4.1. Numerical Results
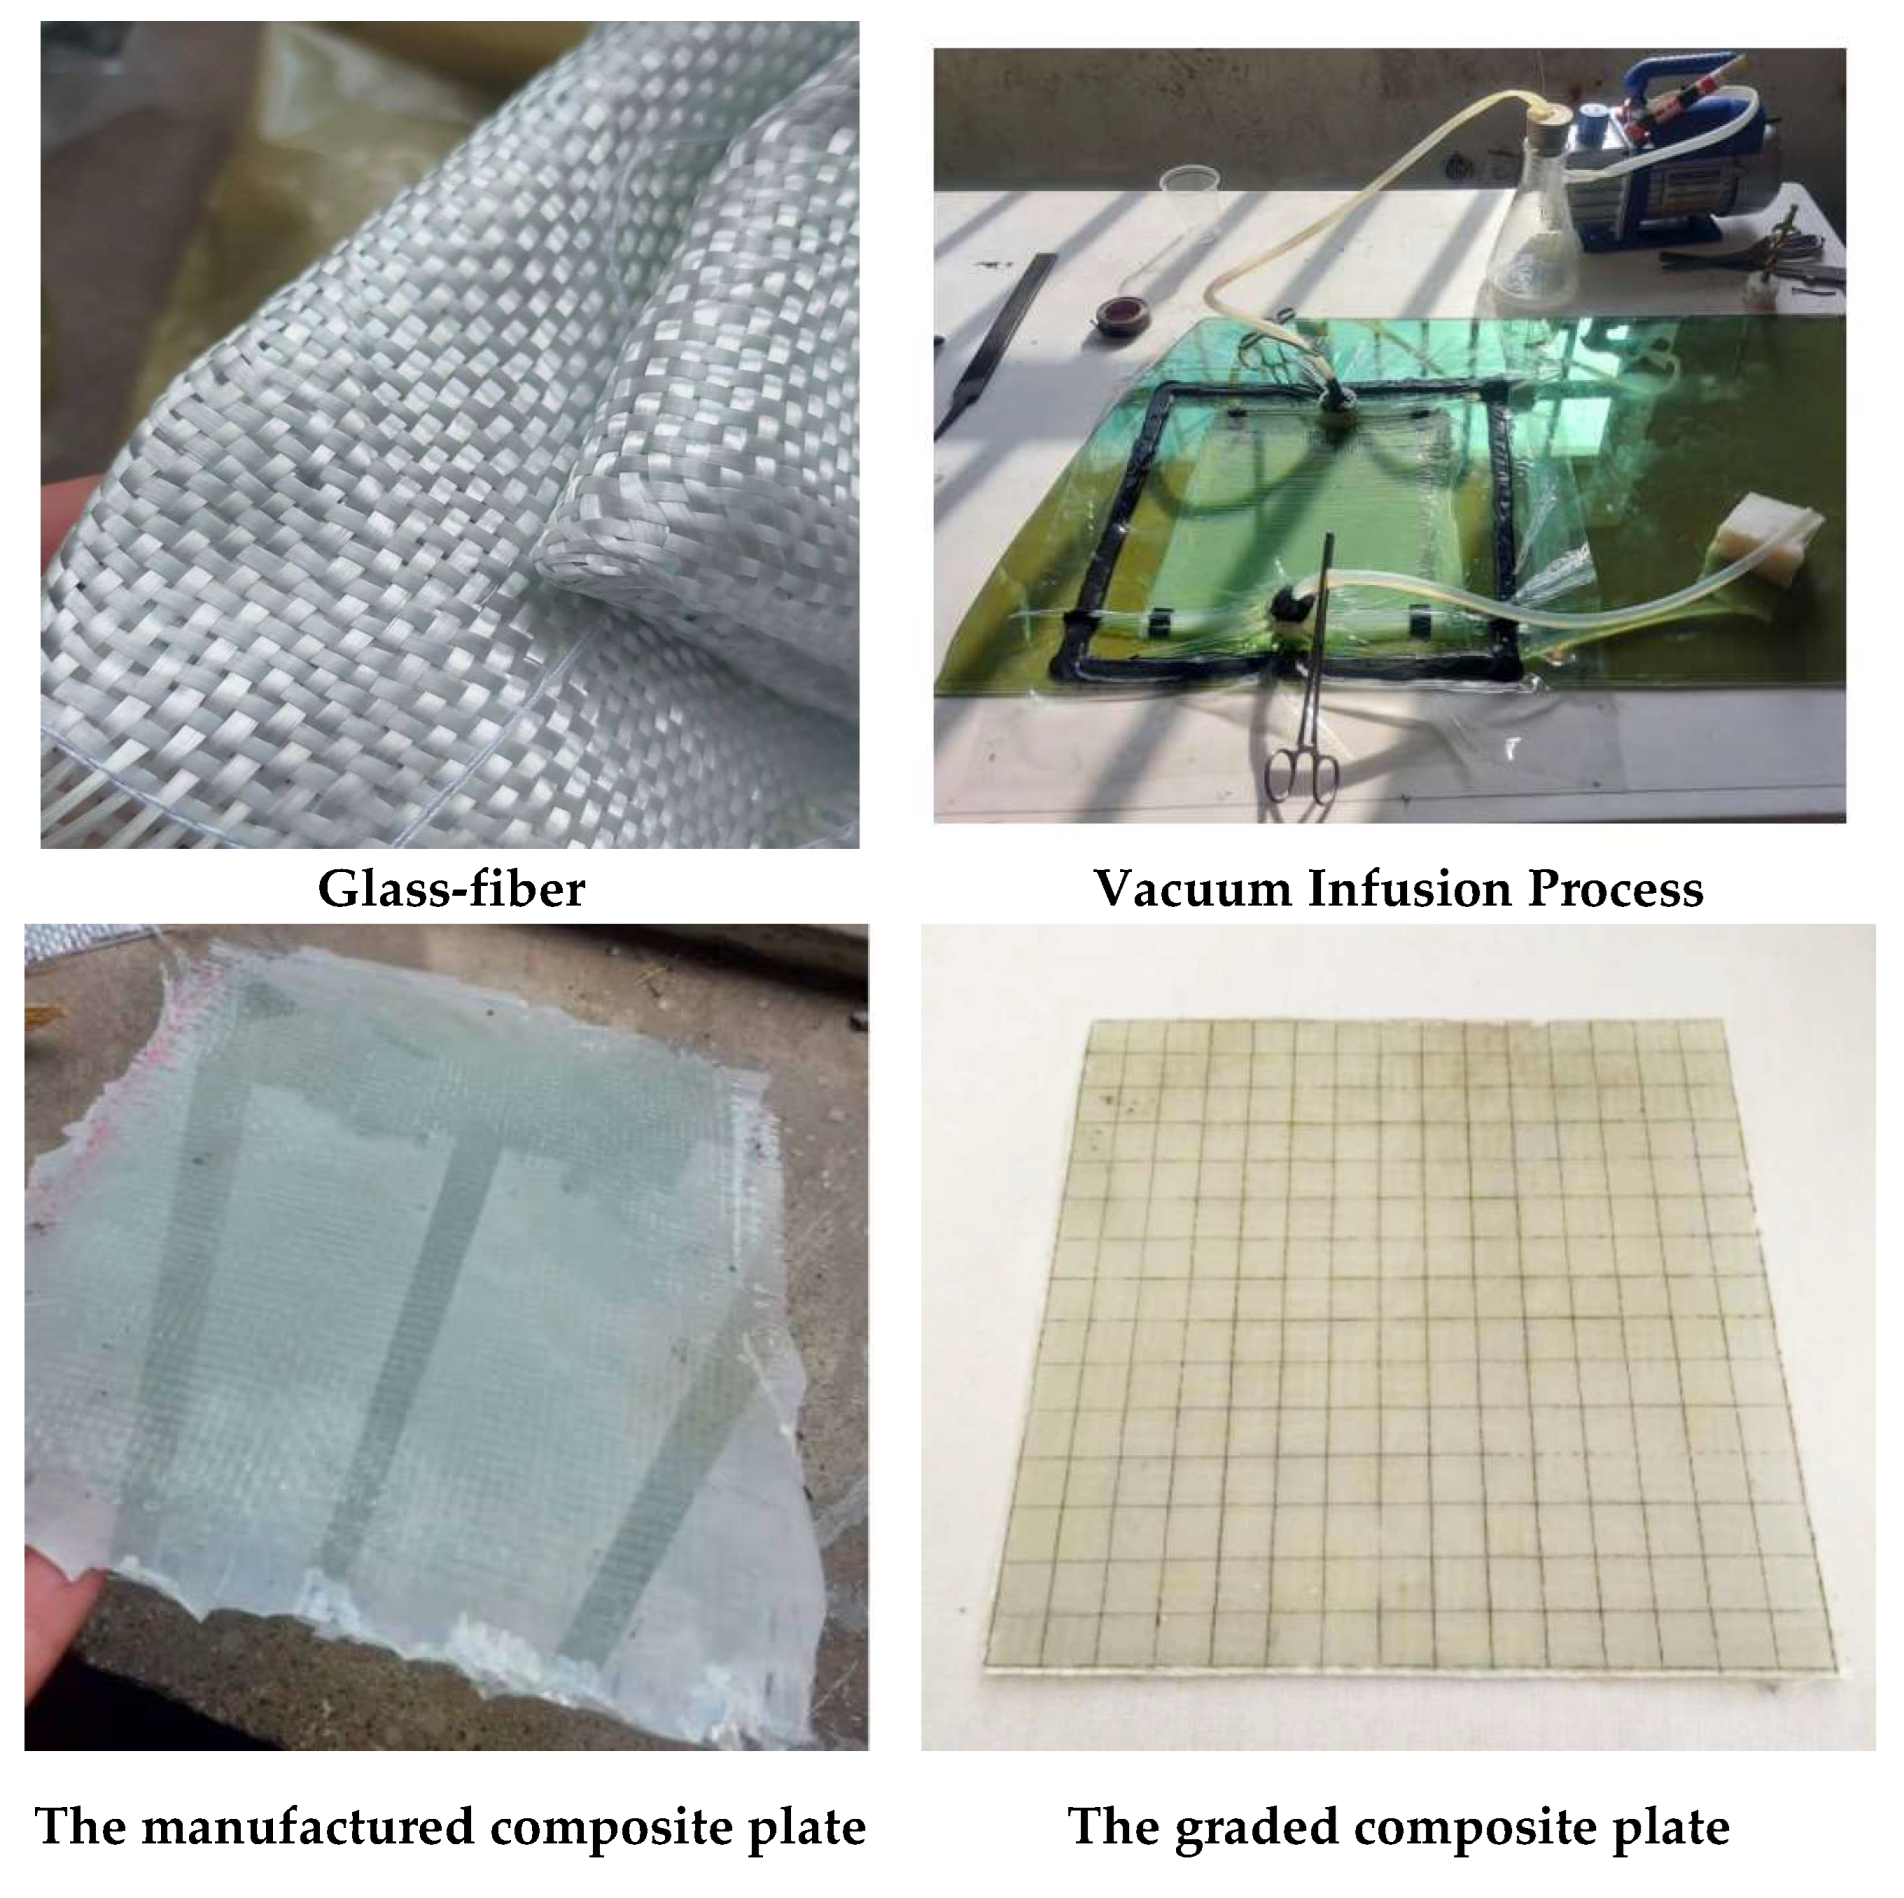
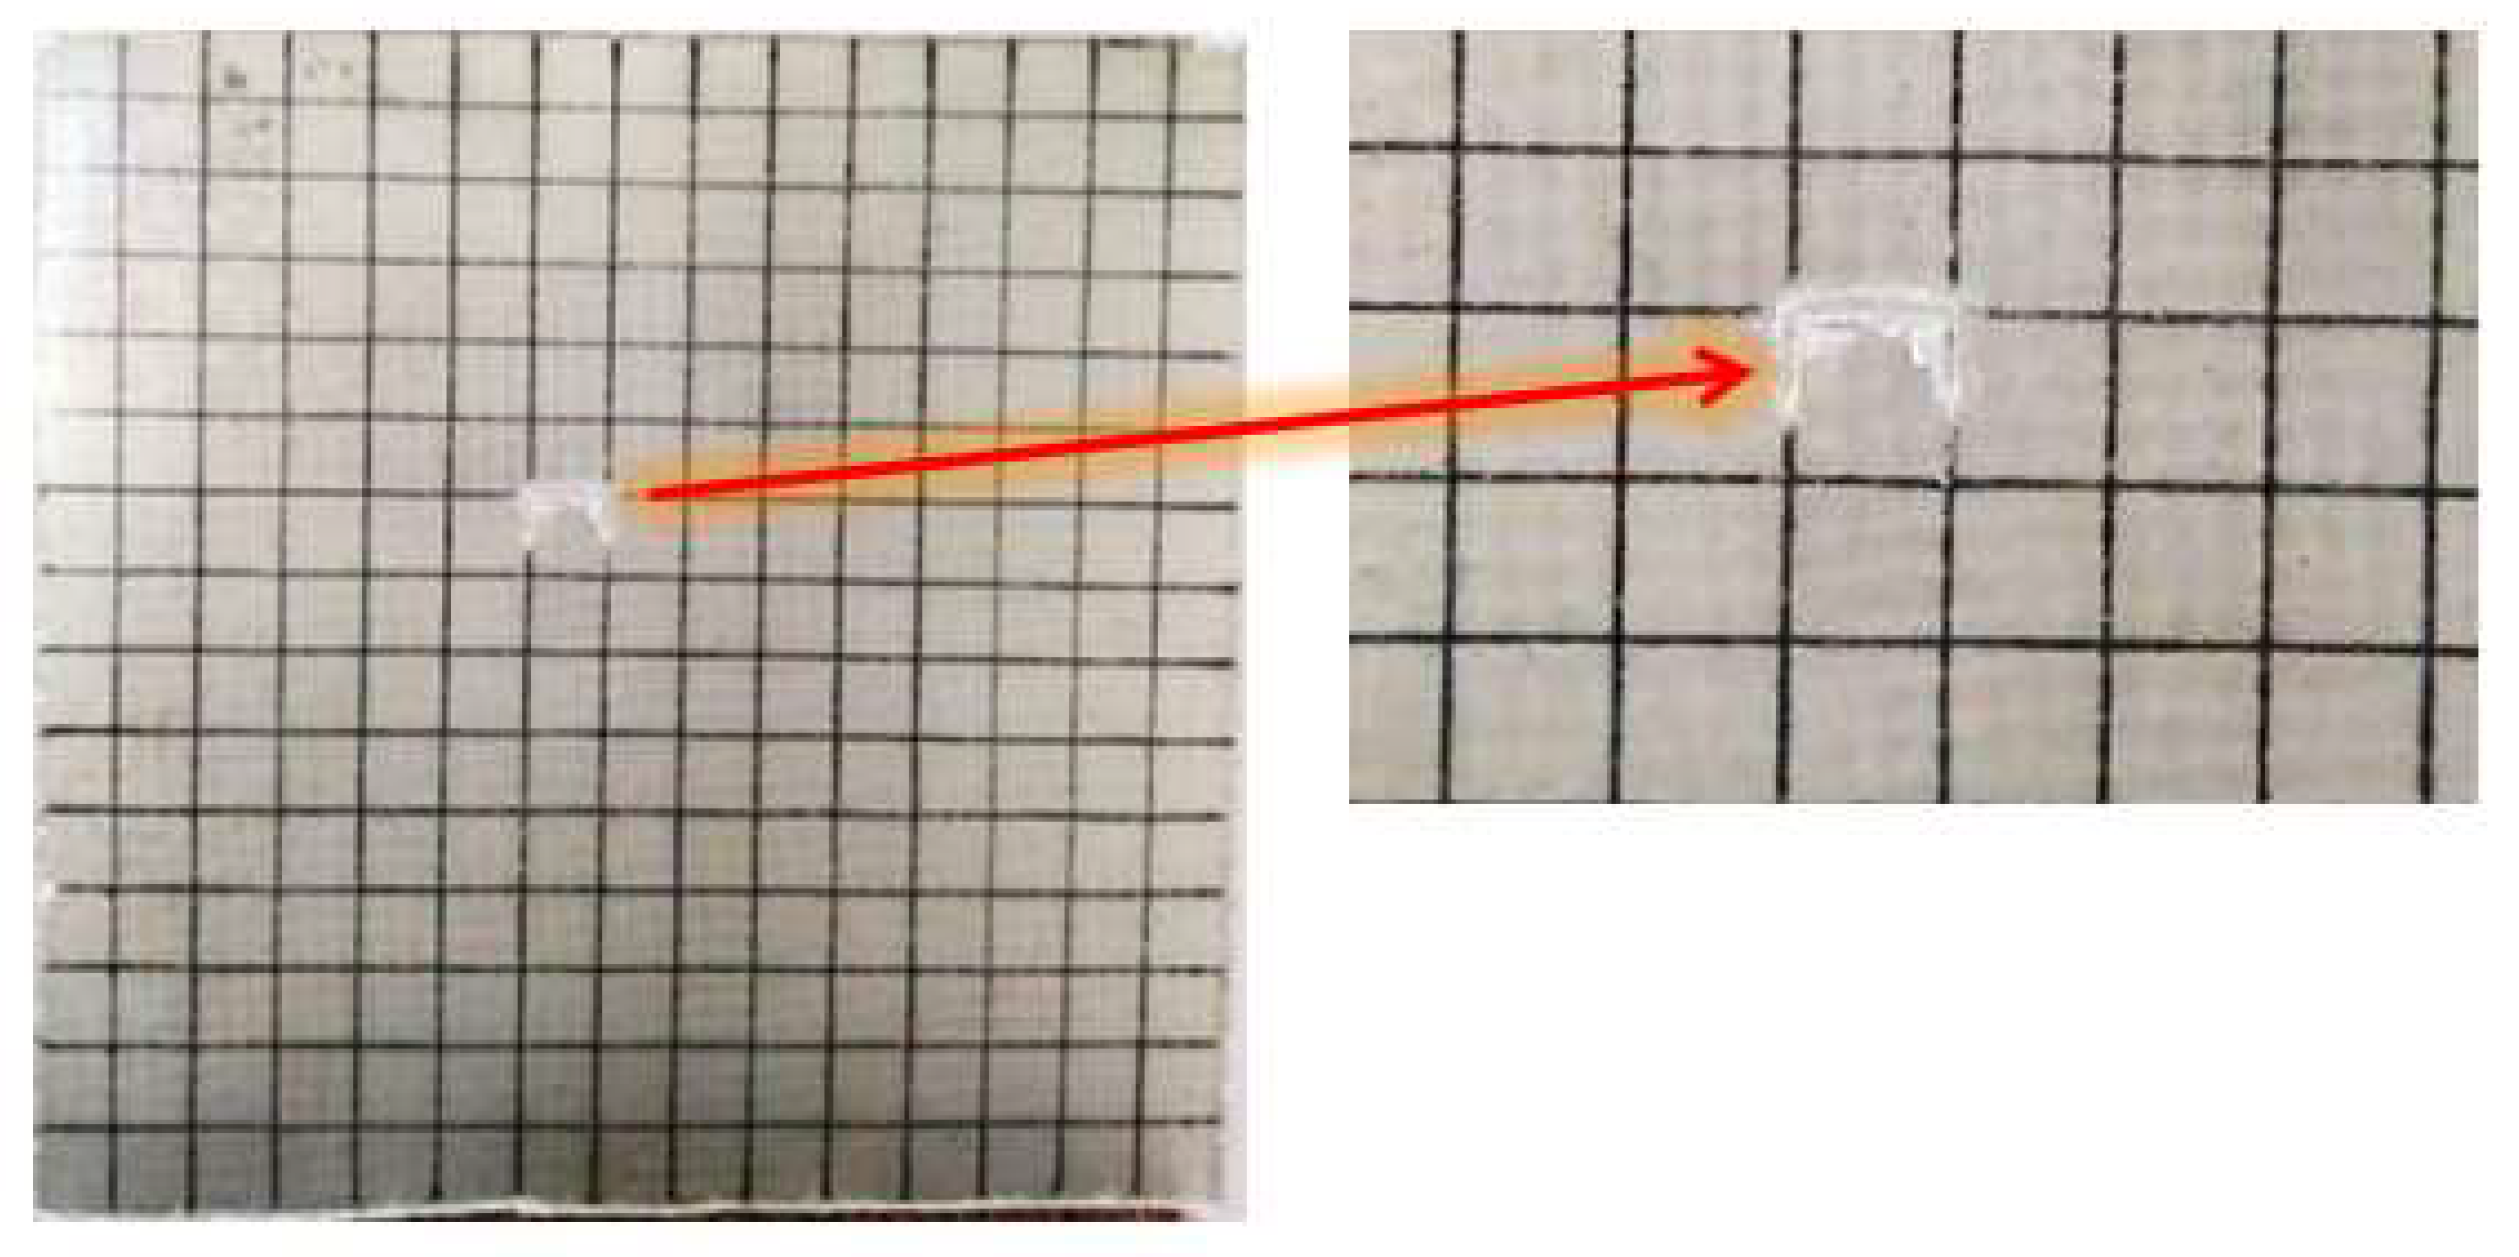
4.2. Experimental Results
5. Conclusions
References
- Heshmati, A., Jafari-Talookolaei, R. A., Valvo, P. S., & Saadatmorad, M. Free and forced vibration analysis of laminated composite beams with through-the-width delamination by considering the in-plane and out-of-plane deformations. Mech. Adv. Mater. Struct. 2024, 31(23), 5953-5972. [CrossRef]
- Hassani, S., Mousavi, M., & Gandomi, A. H. Damage detection of composite laminate structures using VMD of FRF contaminated by high percentage of noise. Compos. Struct. 2022, 286, 115243. [CrossRef]
- Xie, H., Fang, H., Li, X., Wan, L., Wu, P., & Yu, Y. Low-velocity impact damage detection and characterization in composite sandwich panels using infrared thermography. Compos. Struct. 2021, 269, 114008.
- Heshmati, A., Jafari-Talookolaei, R. A., Valvo, P. S., & Saadatmorad, M. A novel damage detection technique for laminated composite beams under the action of a moving load. Mech. Syst. Signal Process. 2023, 202, 110692. [CrossRef]
- Sadeghi, F., Yu, Y., Zhu, X., & Li, J. Damage identification of steel-concrete composite beams based on modal strain energy changes through general regression neural network. Eng. Struct. 2021, 244, 112824. [CrossRef]
- Saadatmorad, M., Shahavi, M. H., & Gholipour, A. Damage Detection in Laminated Composite Beams Reinforced with Nano-particles Using Covariance of Vibration Mode Shape and Wavelet Transform. J. Vib. Eng. Technol. 2024, 12(3), 2865-2875. [CrossRef]
- Abdushkour, H. A., Saadatmorad, M., Khatir, S., Benaissa, B., Al Thobiani, F., & Khawaja, A. U. Structural Damage Detection by Derivative-Based Wavelet Transforms. Arab. J. Sci. Eng. 2024, 1-9. [CrossRef]
- Ahmed, O., Wang, X., Tran, M. V., & Ismadi, M. Z. Advancements in fiber-reinforced polymer composite materials damage detection methods: towards achieving energy-efficient SHM systems. Compos. B: Eng. 2021, 223, 109136. [CrossRef]
- Saadatmorad, M., Khatir, S., Cuong-Le, T., Benaissa, B., & Mahmoudi, S. Detecting damages in metallic beam structures using a novel wavelet selection criterion. J. Sound Vib. 2024, 578, 118297. [CrossRef]
- Oliver, G. A., Pereira, J. L. J., Francisco, M. B., Ancelotti, A. C., & Gomes, G. F. Parameter tuning for wavelet transform-based damage index using mixture design. Eng. Comput. 2021, 1-22. [CrossRef]
- Douka, E., Loutridis, S., & Trochidis, A. Crack identification in beams using wavelet analysis. Int. J. Solids Struct. 2003, 40(13-14), 3557-3569. [CrossRef]
- Katunin, A., dos Santos, J. V. A., & Lopes, H. Damage identification by wavelet analysis of modal rotation differences. Struct. 2021 (Vol. 30, pp. 1–10). Elsevier. [CrossRef]
- Saadatmorad, M., Talookolaei, R. A. J., Pashaei, M. H., Khatir, S., & Wahab, M. A. Pearson Correlation and Discrete Wavelet Transform for Crack Identification in Steel Beams. Math 2022, 10(15), 2689. [CrossRef]
- Kumar, R., & Singh, S. K. Crack detection near the ends of a beam using wavelet transform and high resolution beam deflection measurement. Eur. J. Mech. A/Solids. 2021, 88, 104259. [CrossRef]
- Janeliukstis, R., Rucevskis, S., Wesolowski, M., Kovalovs, A., & Chate, A. Damage identification in polymer composite beams based on spatial continuous wavelet transform. In IOP Conference Series: Materials Science and Engineering 2016, (Vol. 111, No. 1, p. 012005). IOP Publishing.
- Rucka, M., & Wilde, K. (2006). Application of continuous wavelet transform in vibration based damage detection method for beams and plates. J. Sound Vib 2006, 297(3-5), 536-550. [CrossRef]
- Chang, C. C., & Chen, L. W. (2004). Damage detection of a rectangular plate by spatial wavelet based approach. Appl. Acoust. 2004, 65(8), 819-832. [CrossRef]
- Ashory, M. R., Ghasemi-Ghalebahman, A., & Kokabi, M. J. Damage detection in laminated composite plates via an optimal wavelet selection criterion. J. Reinf. Plast. Compos. 2016, 35(24), 1761-1775.
- Zhou, J., Li, Z., & Chen, J. Damage identification method based on continuous wavelet transform and mode shapes for composite laminates with cutouts. Compos. Struct. 2018, 191, 12–23. [CrossRef]
- Saadatmorad, M., Jafari-Talookolaei, R. A., Pashaei, M. H., & Khatir, S. (2022). Damage Detection in Rectangular Laminated Composite Plate Structures using a Combination of Wavelet Transforms and Artificial Neural Networks. J. Vib. Eng. Technol. 2022, 1-18. [CrossRef]
- Saadatmorad, M., Jafari-Talookolaei, R. A., Pashaei, M. H., & Khatir, S. Damage detection on rectangular laminated composite plates using wavelet based convolutional neural network technique. Compos. Struct. 2021, 278, 114656. [CrossRef]
- Rucka, M., & Wilde, K. Neuro-wavelet damage detection technique in beam, plate and shell structures with experimental validation. J. Theor. Appl. Mech. 2010, 48(3), 579-604.
- Gdeisat, M. A., Abid, A., Burton, D. R., Lalor, M. J., Lilley, F., Moore, C., & Qudeisat, M. Spatial and temporal carrier fringe pattern demodulation using the one-dimensional continuous wavelet transform: recent progress, challenges, and suggested developments. Opt. Lasers Eng. 2009, 47(12), 1348-1361.
- Burnes, S., Villa, J., Moreno, G., de la Rosa, I., González, E., & Alaniz, D. 3D shape measurement with temporal phase unwrapping and 1-D continuous wavelet transform. Photon. Ins. Eng. VIII 2021, (Vol. 11693, pp. 203–210). SPIE.
- Kathuria, L., Goel, S., & Khanna, N. (2021). Fourier–Boas-Like Wavelets and Their Vanishing Moments. J. Math. 2021. (1), 6619551. [CrossRef]
- Knitter-Piątkowska, A., Pozorski, Z., & Garstecki, A. (2006). Application of discrete wavelet transformation in damage detection. Part I: Static and dynamic experiments. Comput. Assist. Methods Eng. Sci. 2006, 13(1), 21-38.

| Parameter | Description or value |
| Number of layers | 2 |
| Layers configuration | [0, 45] |
| a | 0.2 m |
| b | 0.2 m |
| h | h=0.1a |
| Dividing elements | 3030 |
| Shear Factor | |
| Young’s modulus | |
| Shear modulus | , |
| Poisson’s ratios |
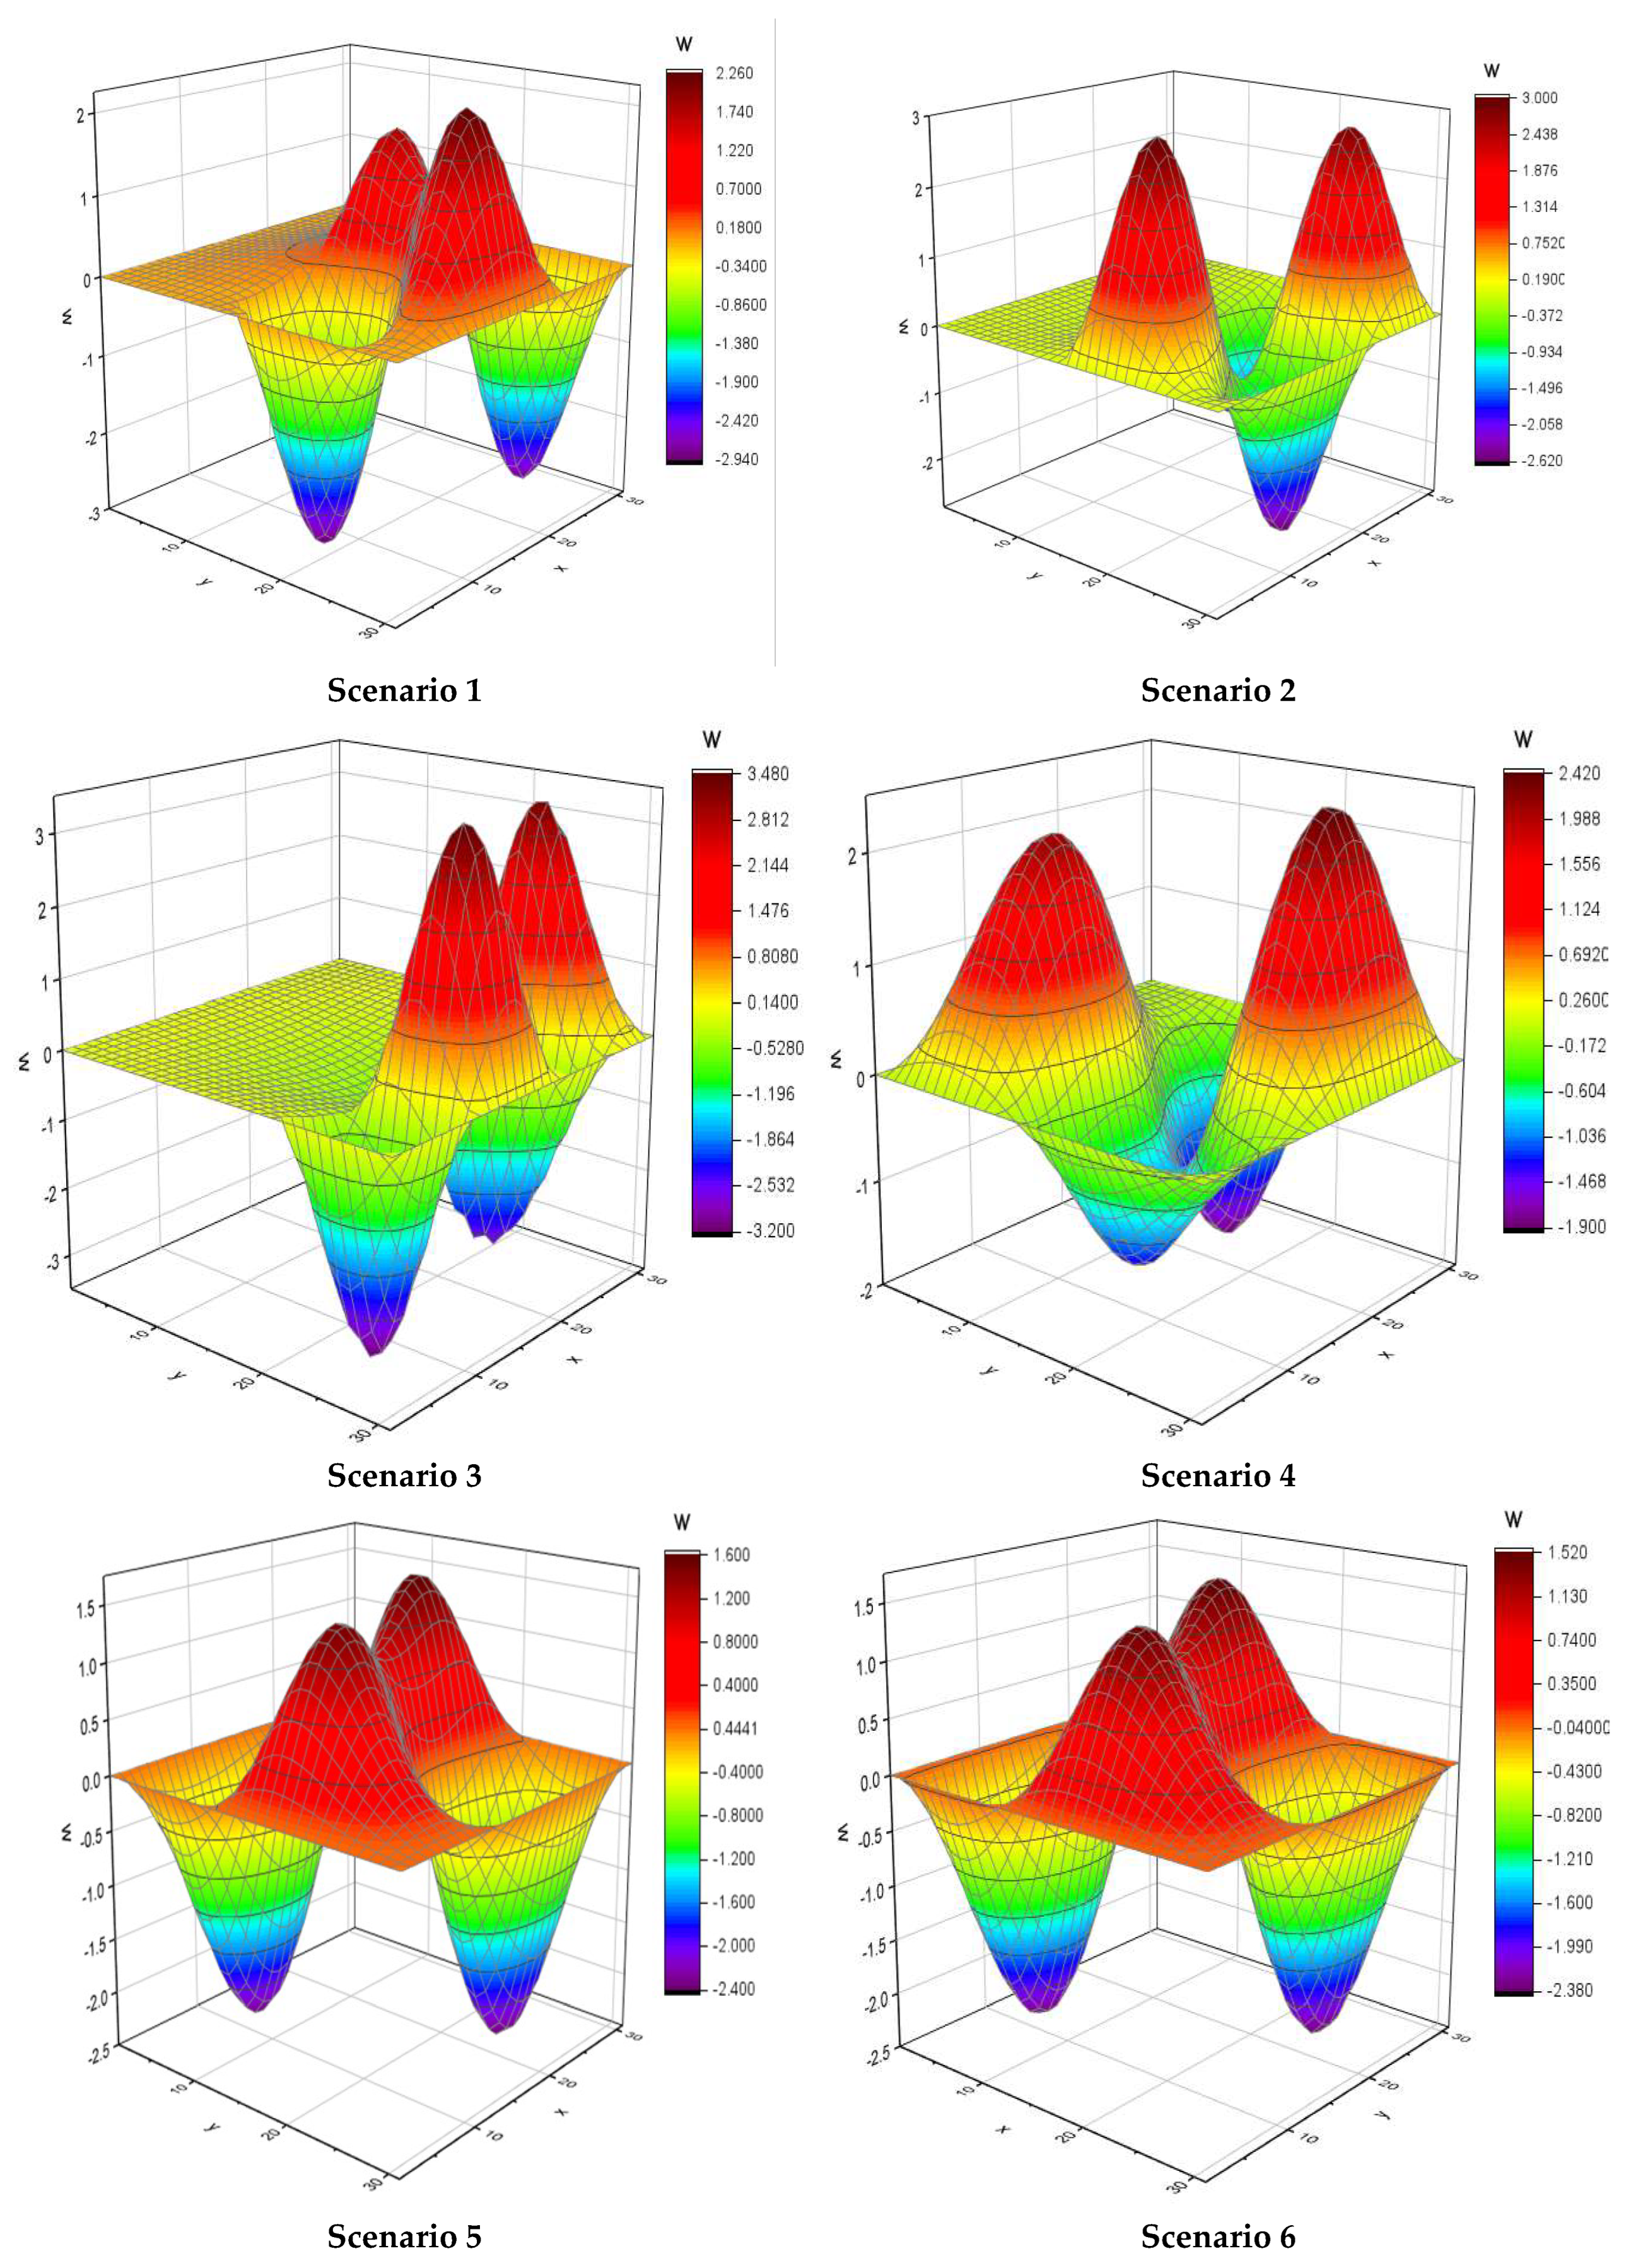
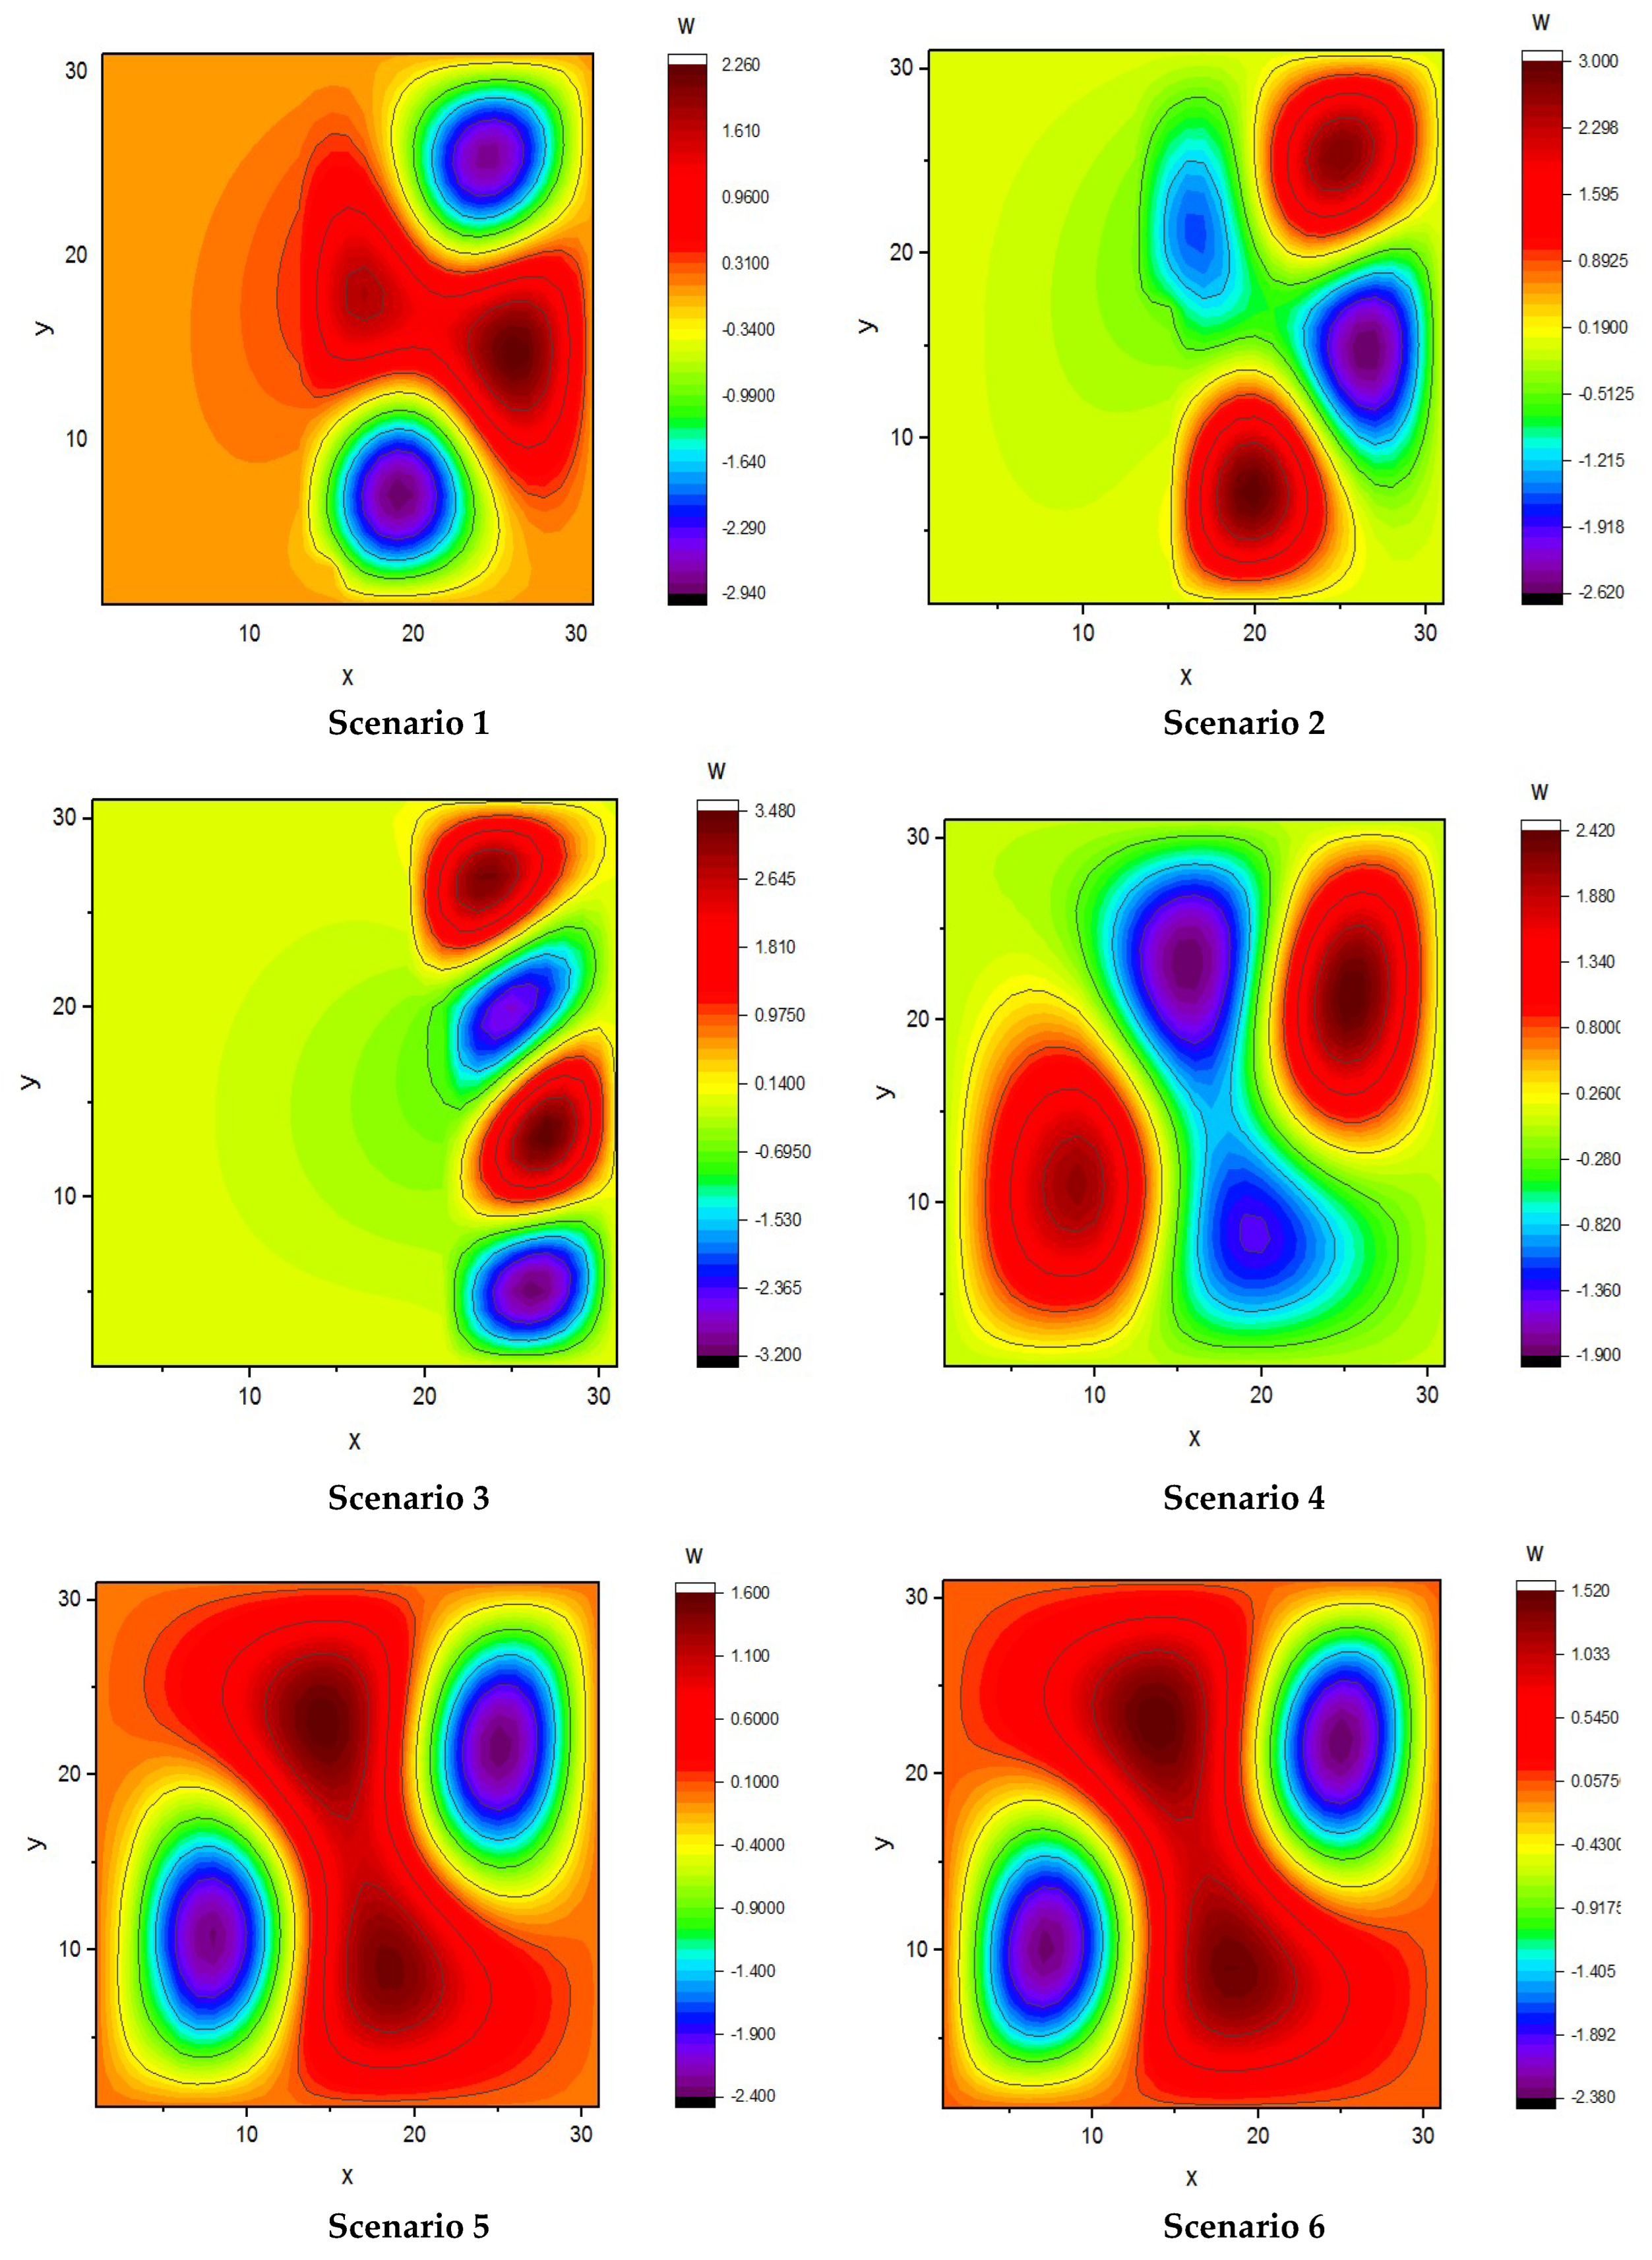
| Scenario No. | Location of damage | `Level of damage | |
| x | y | ||
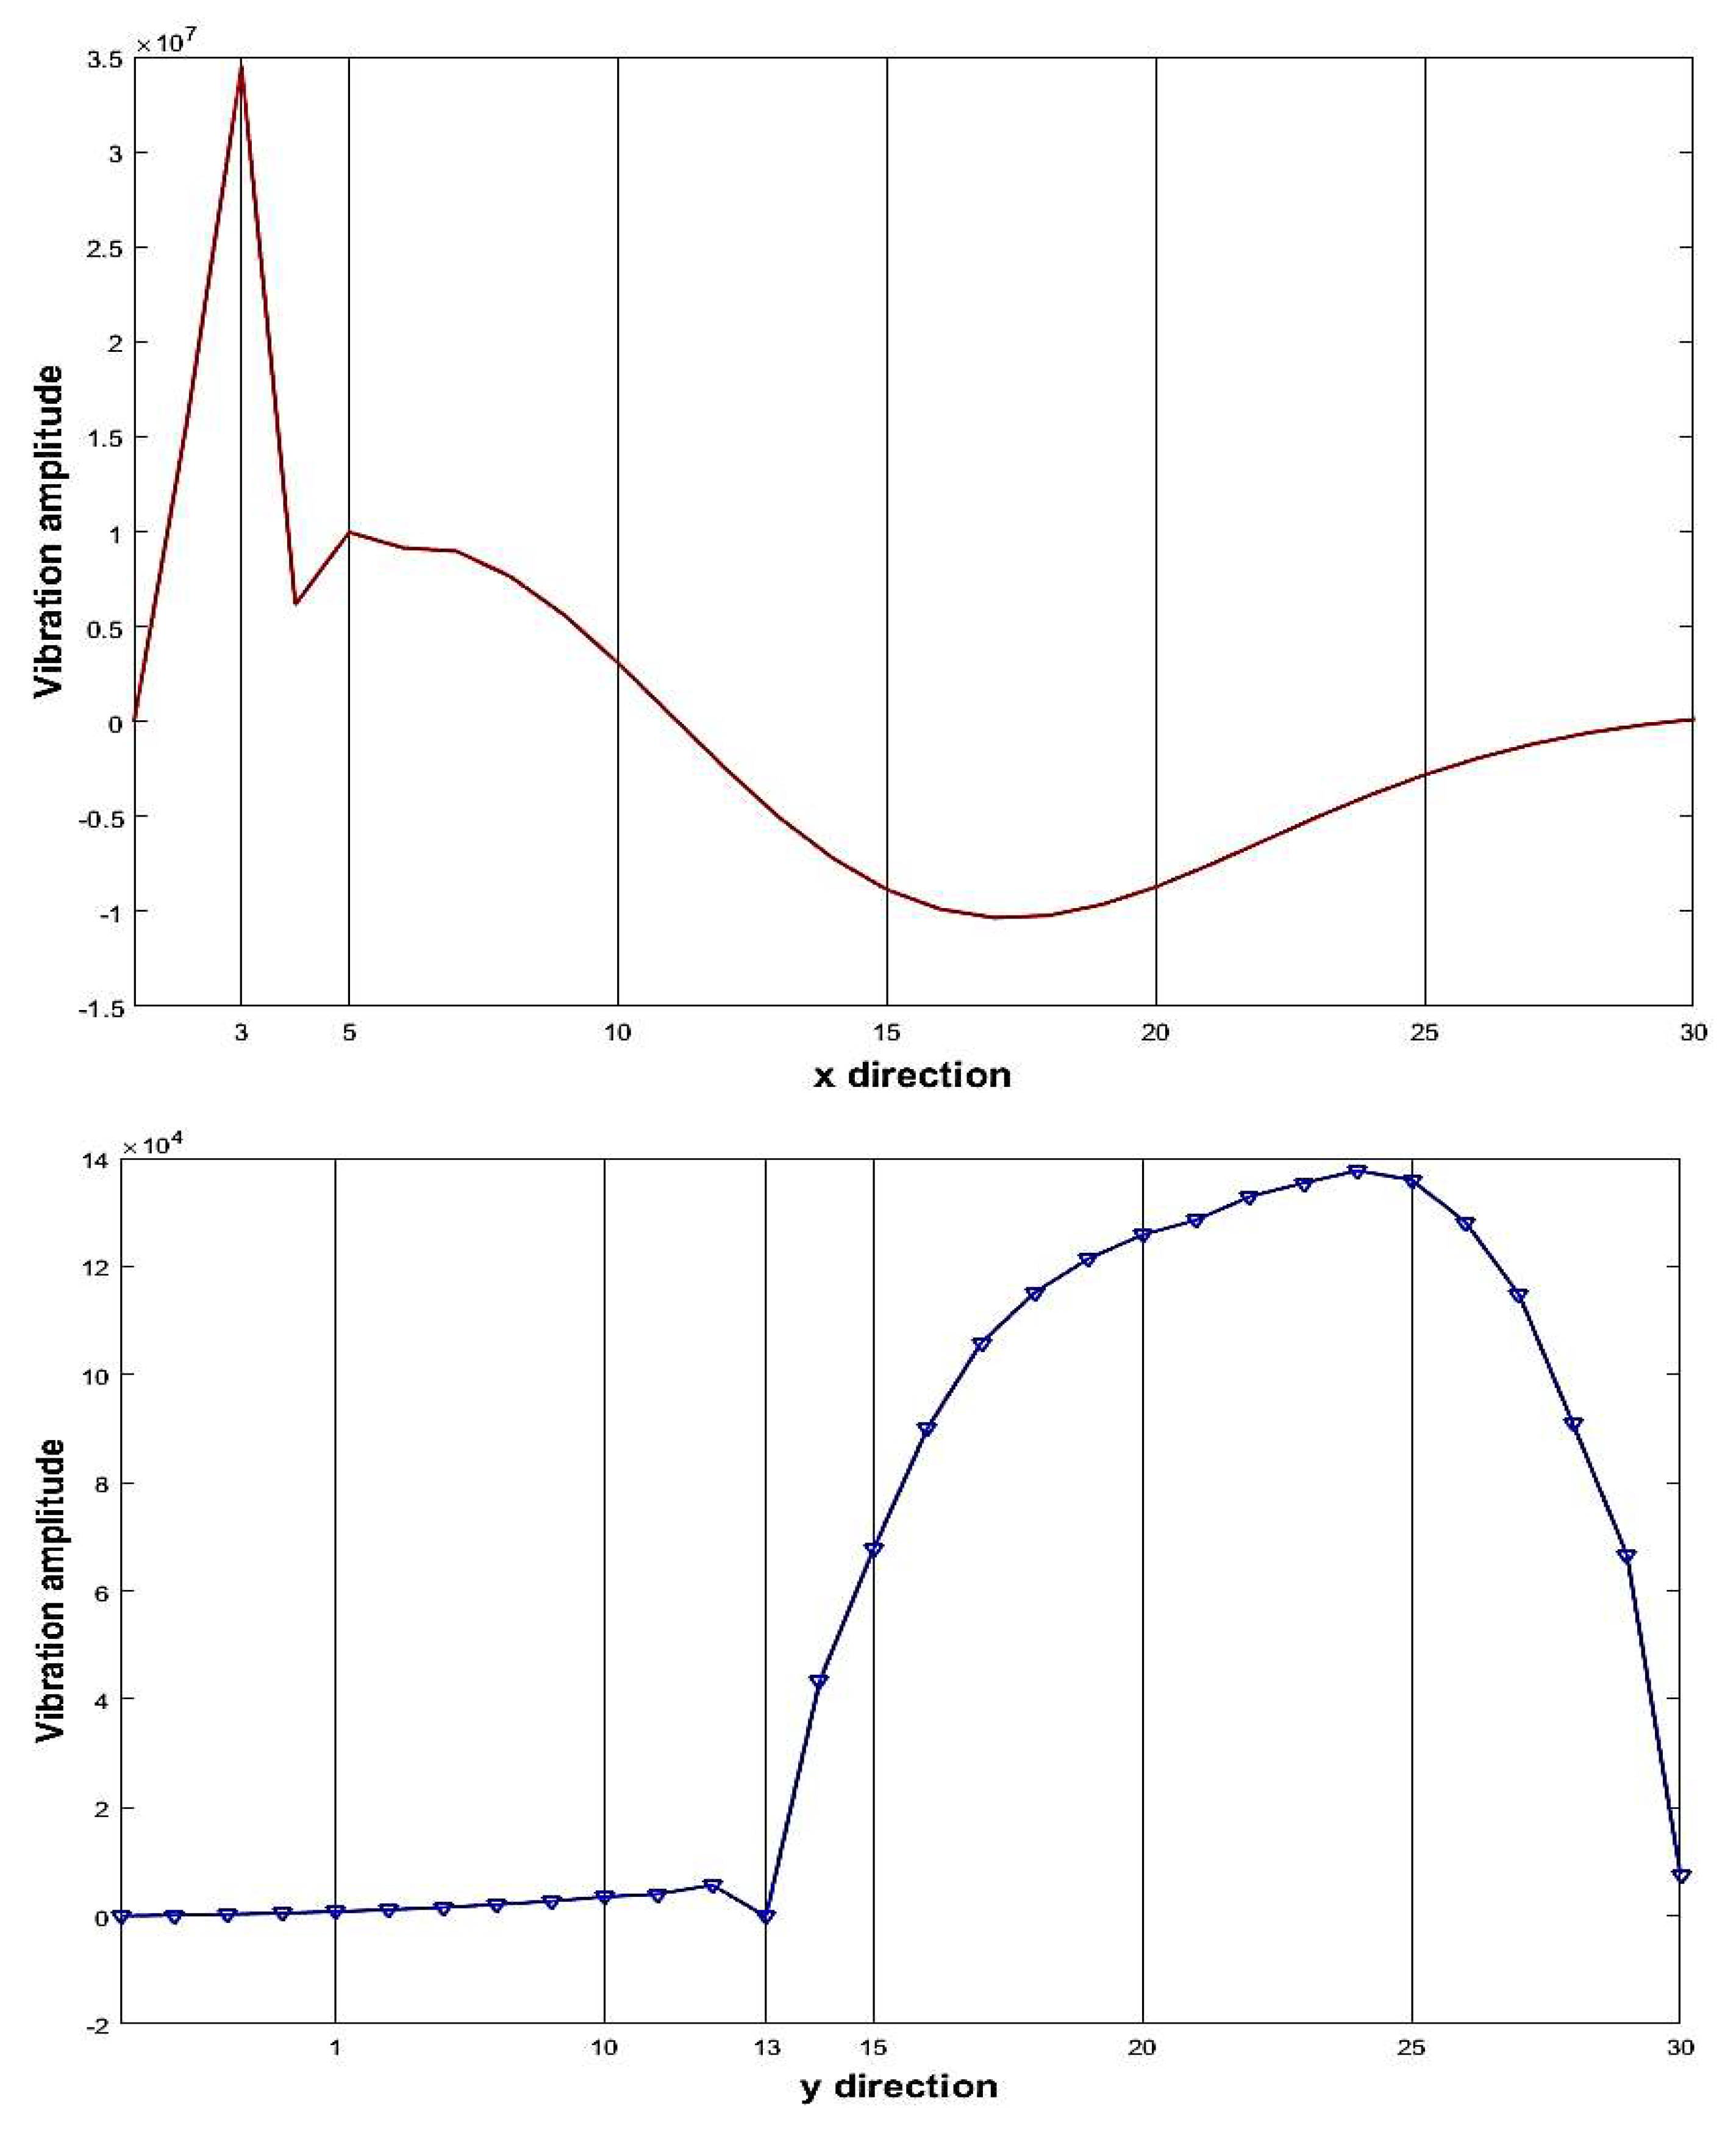
| 1 | 3 | 13 | 70% |
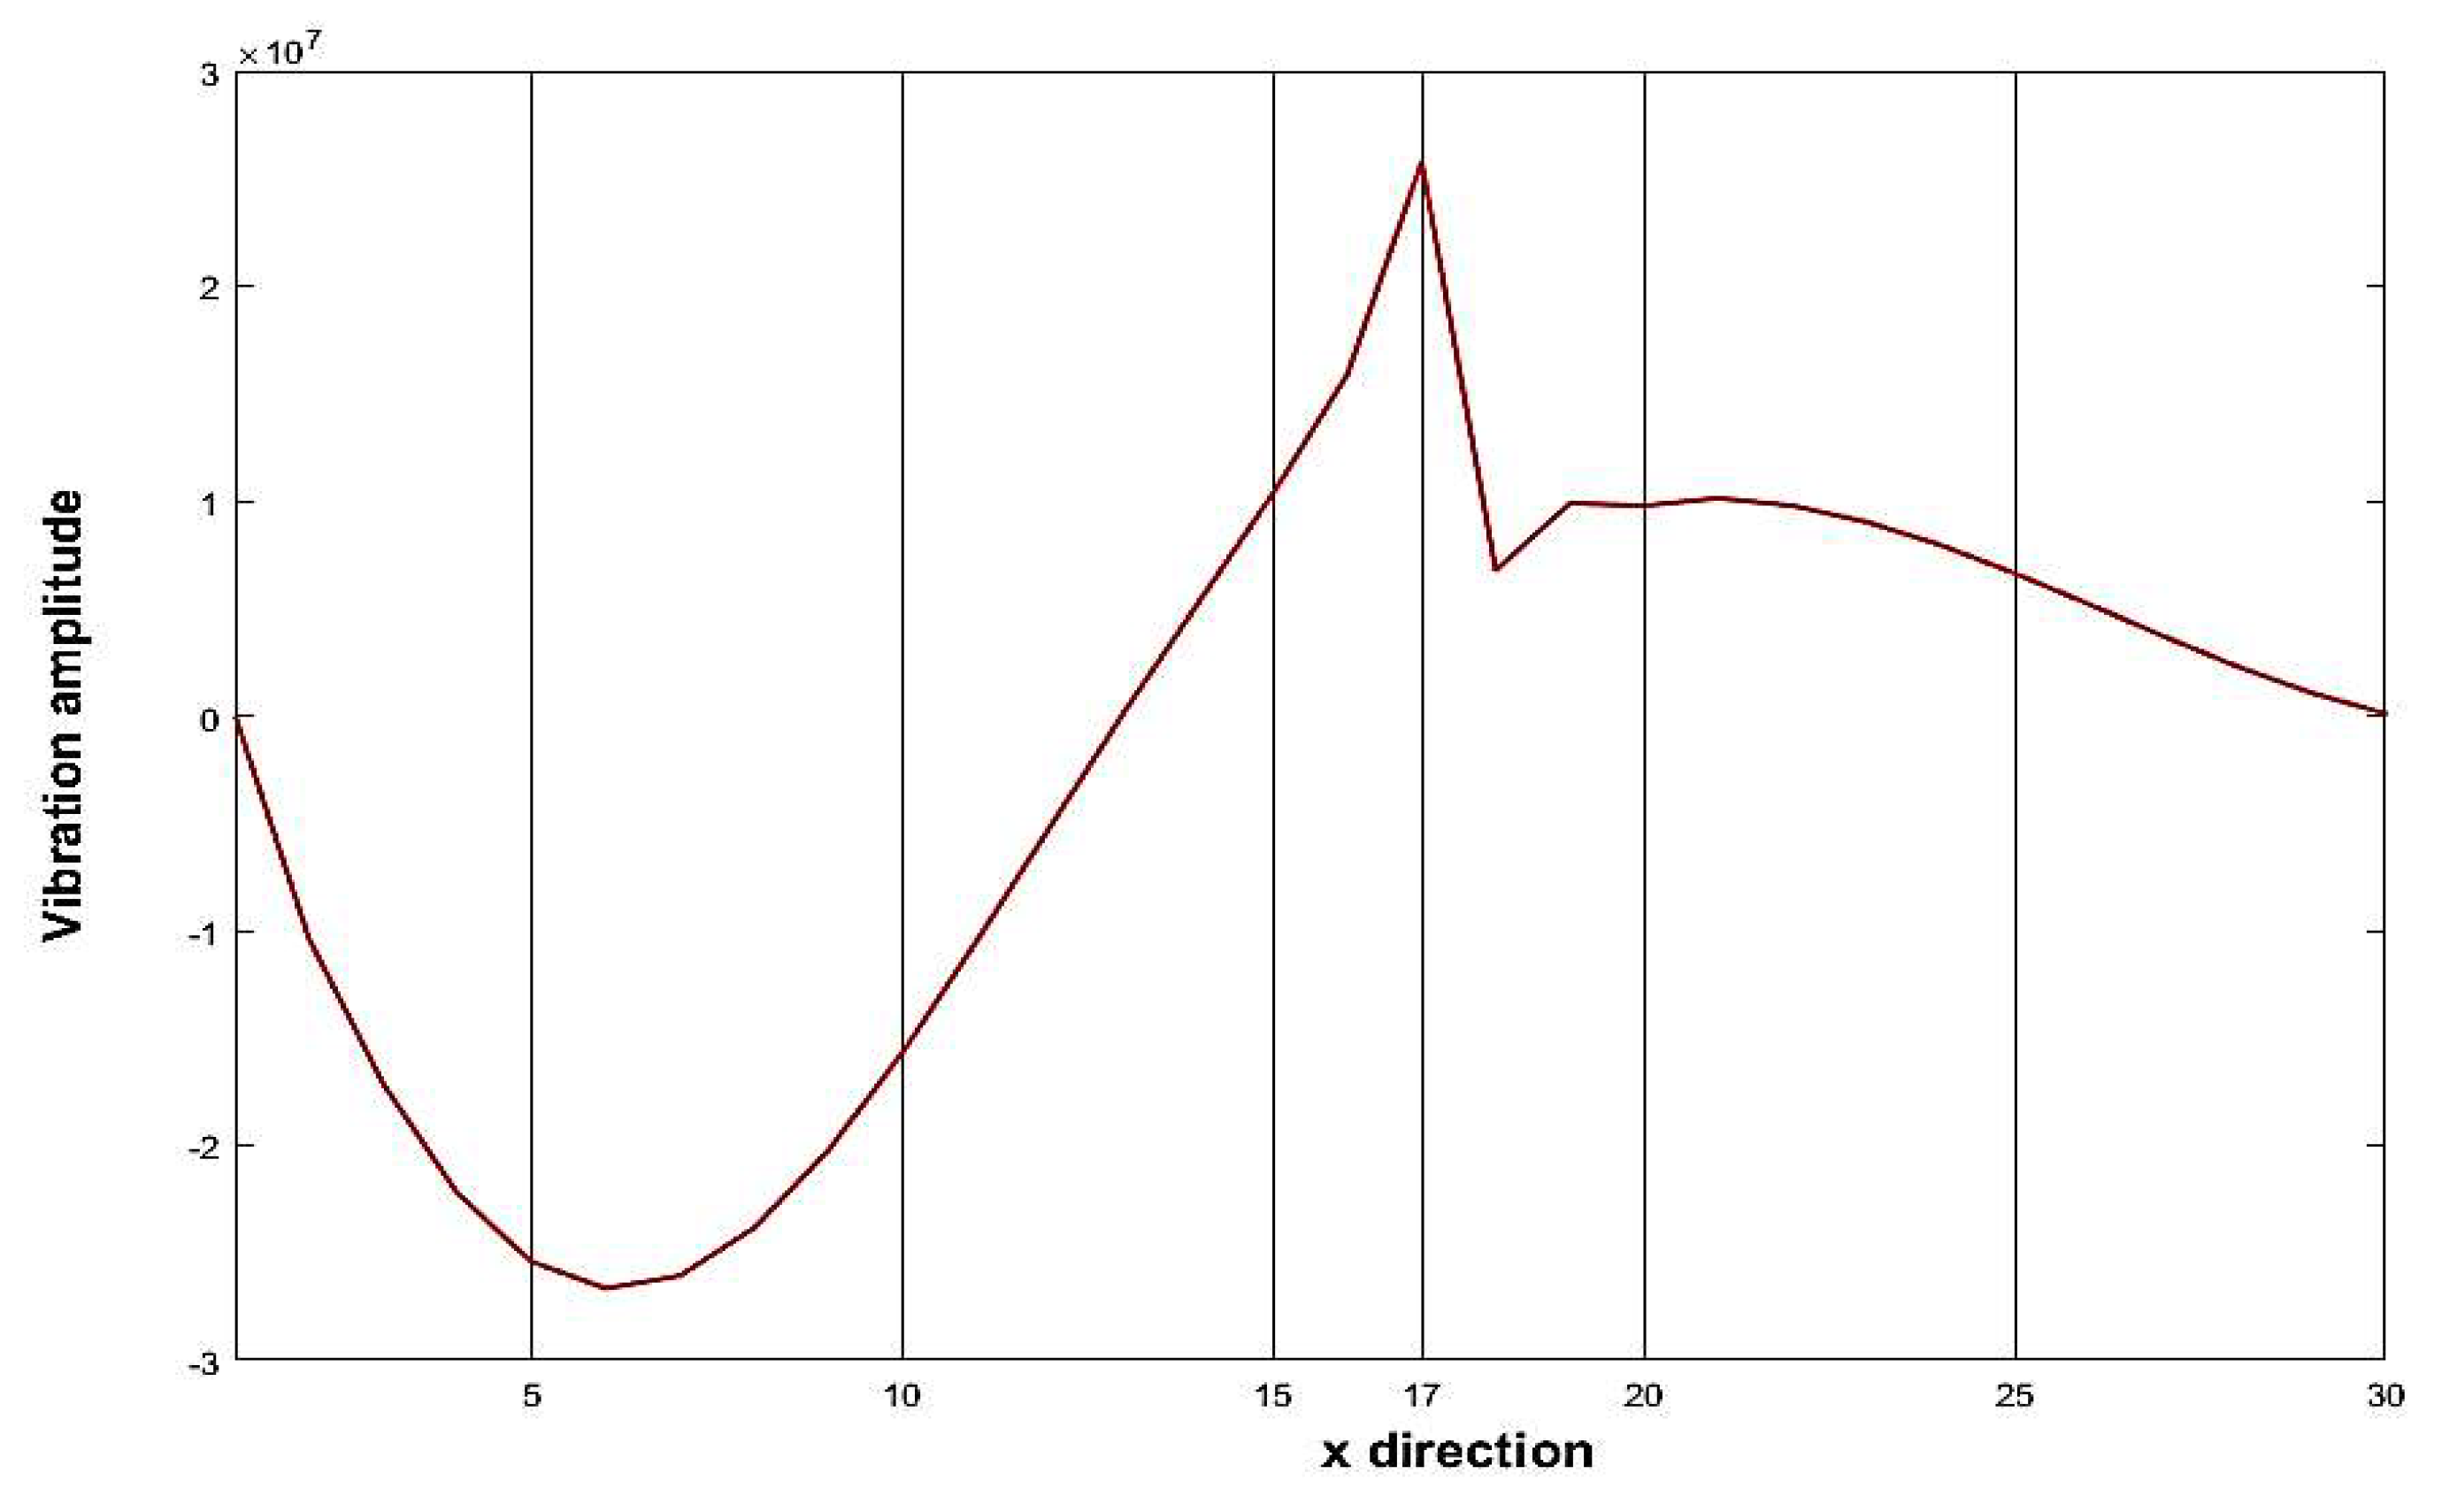
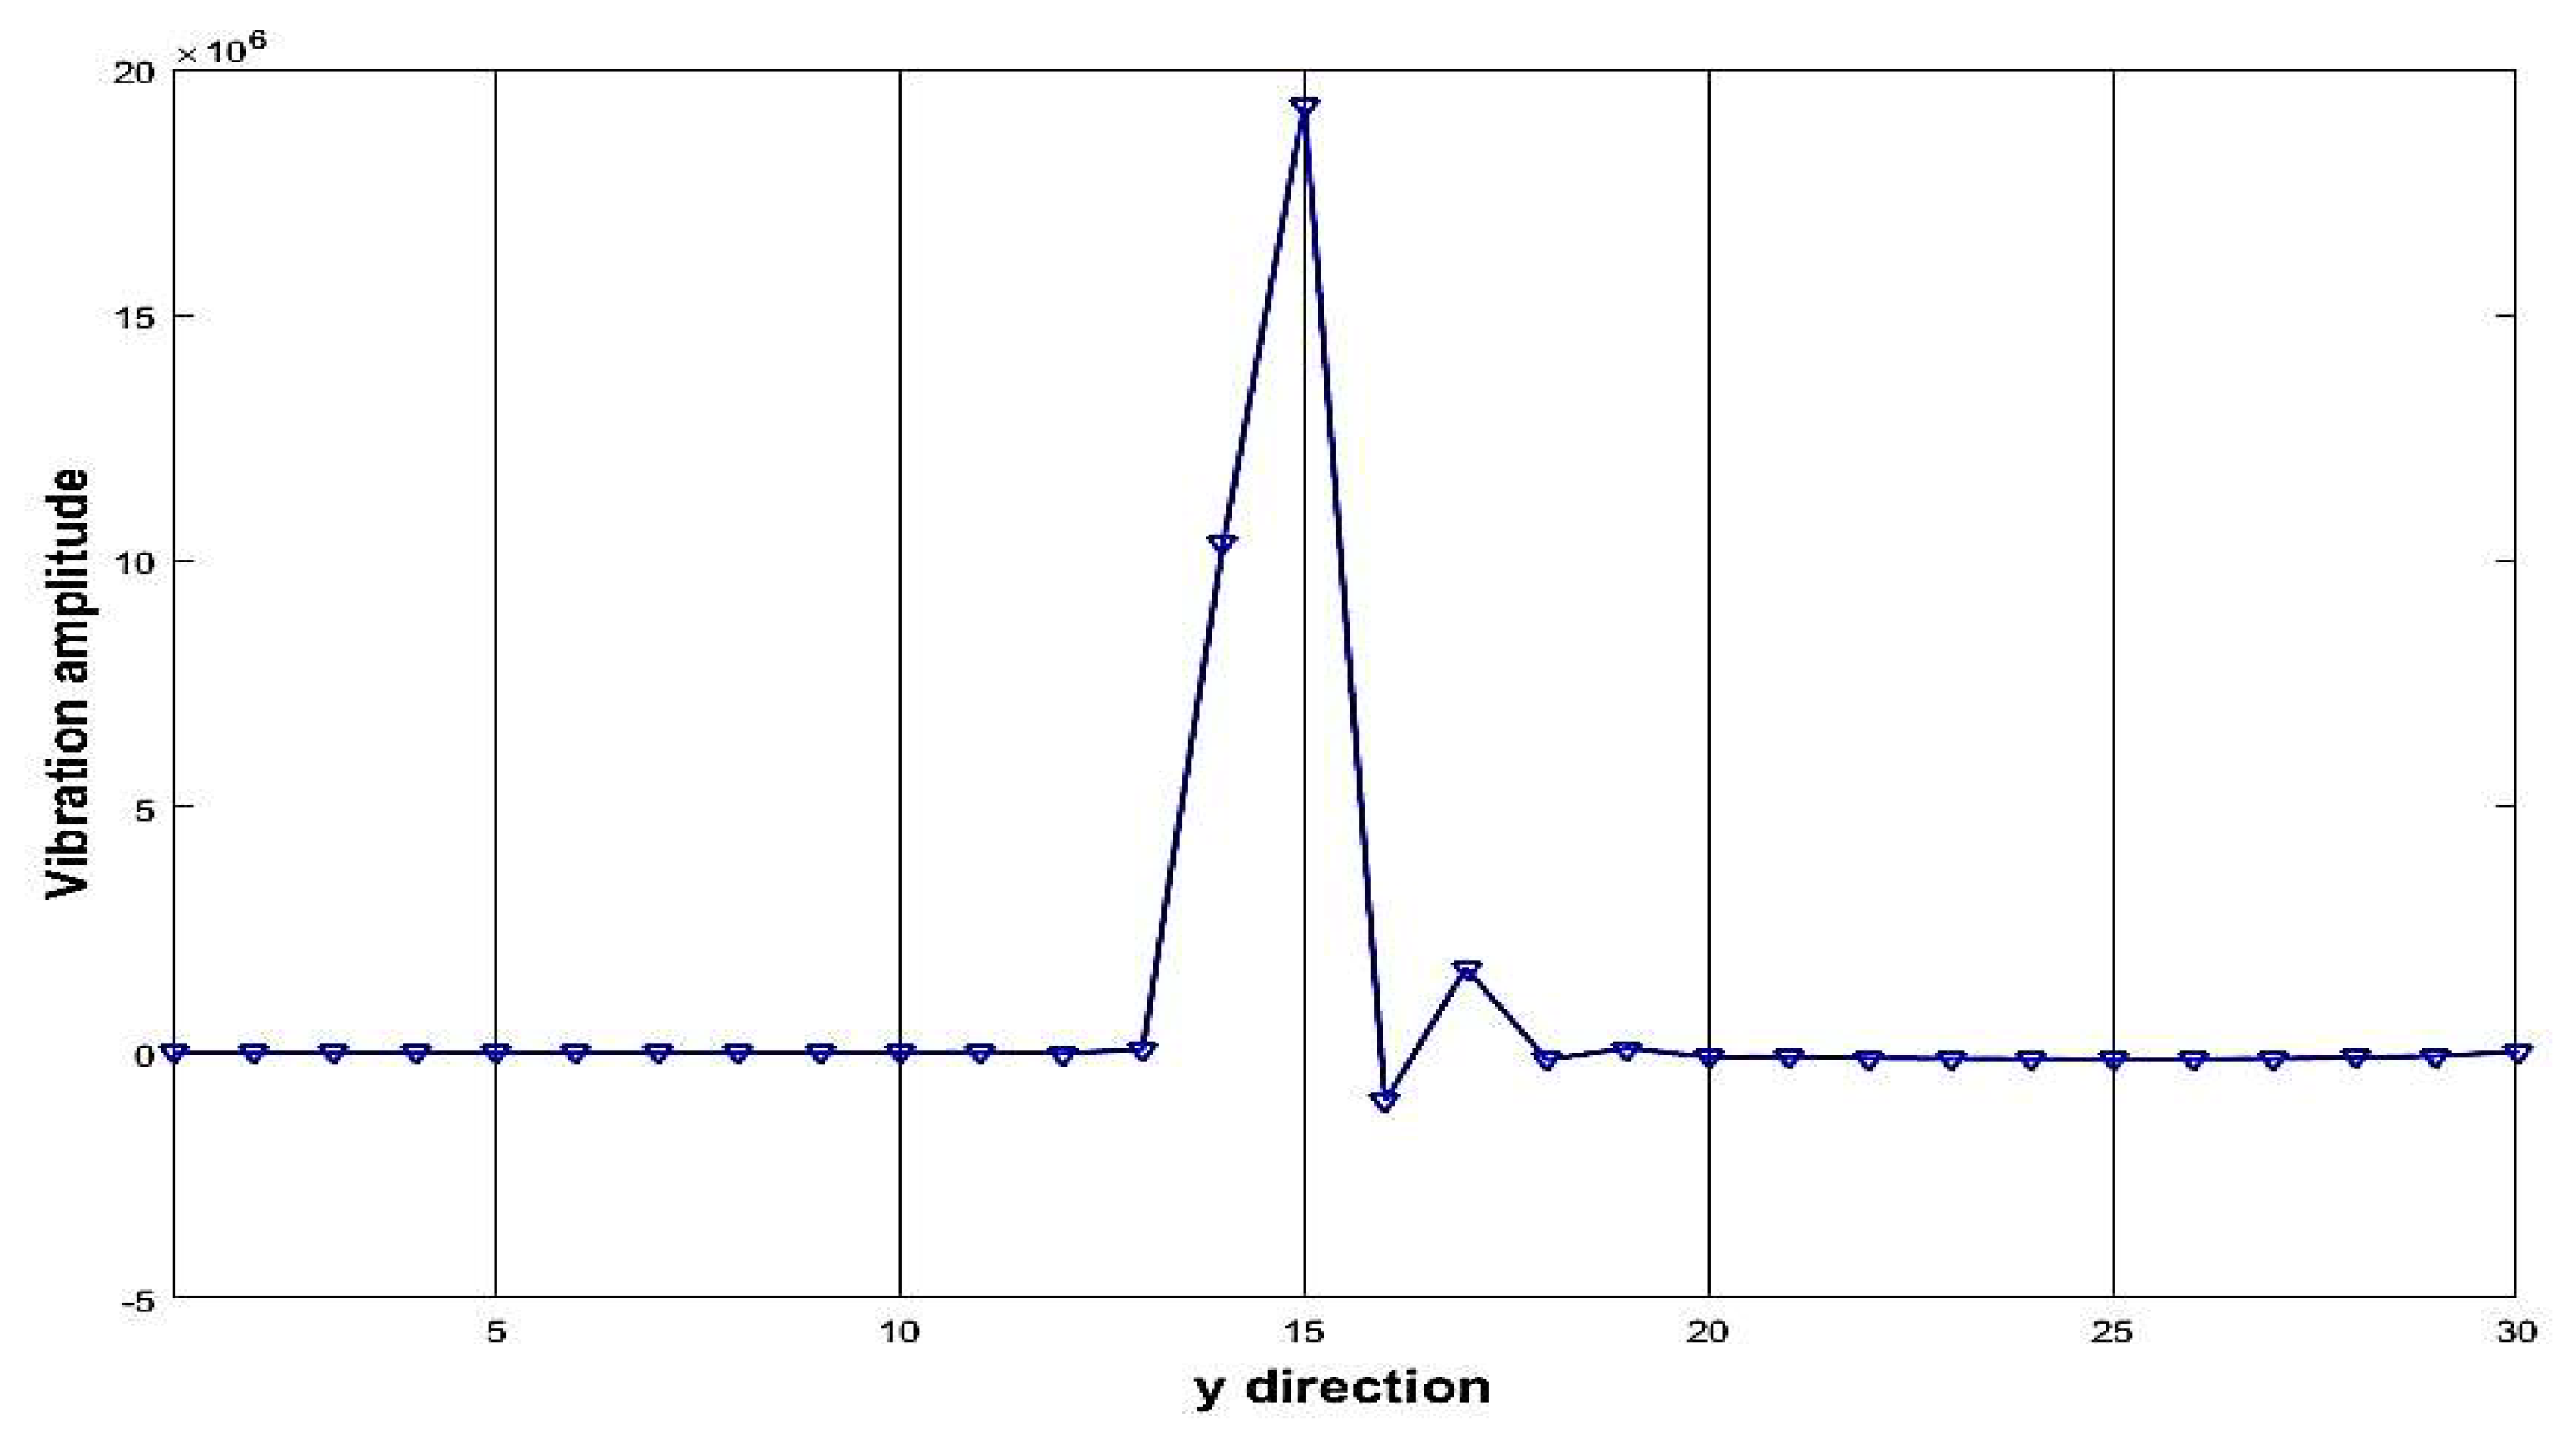
| 2 | 17 | 15 | 50% |
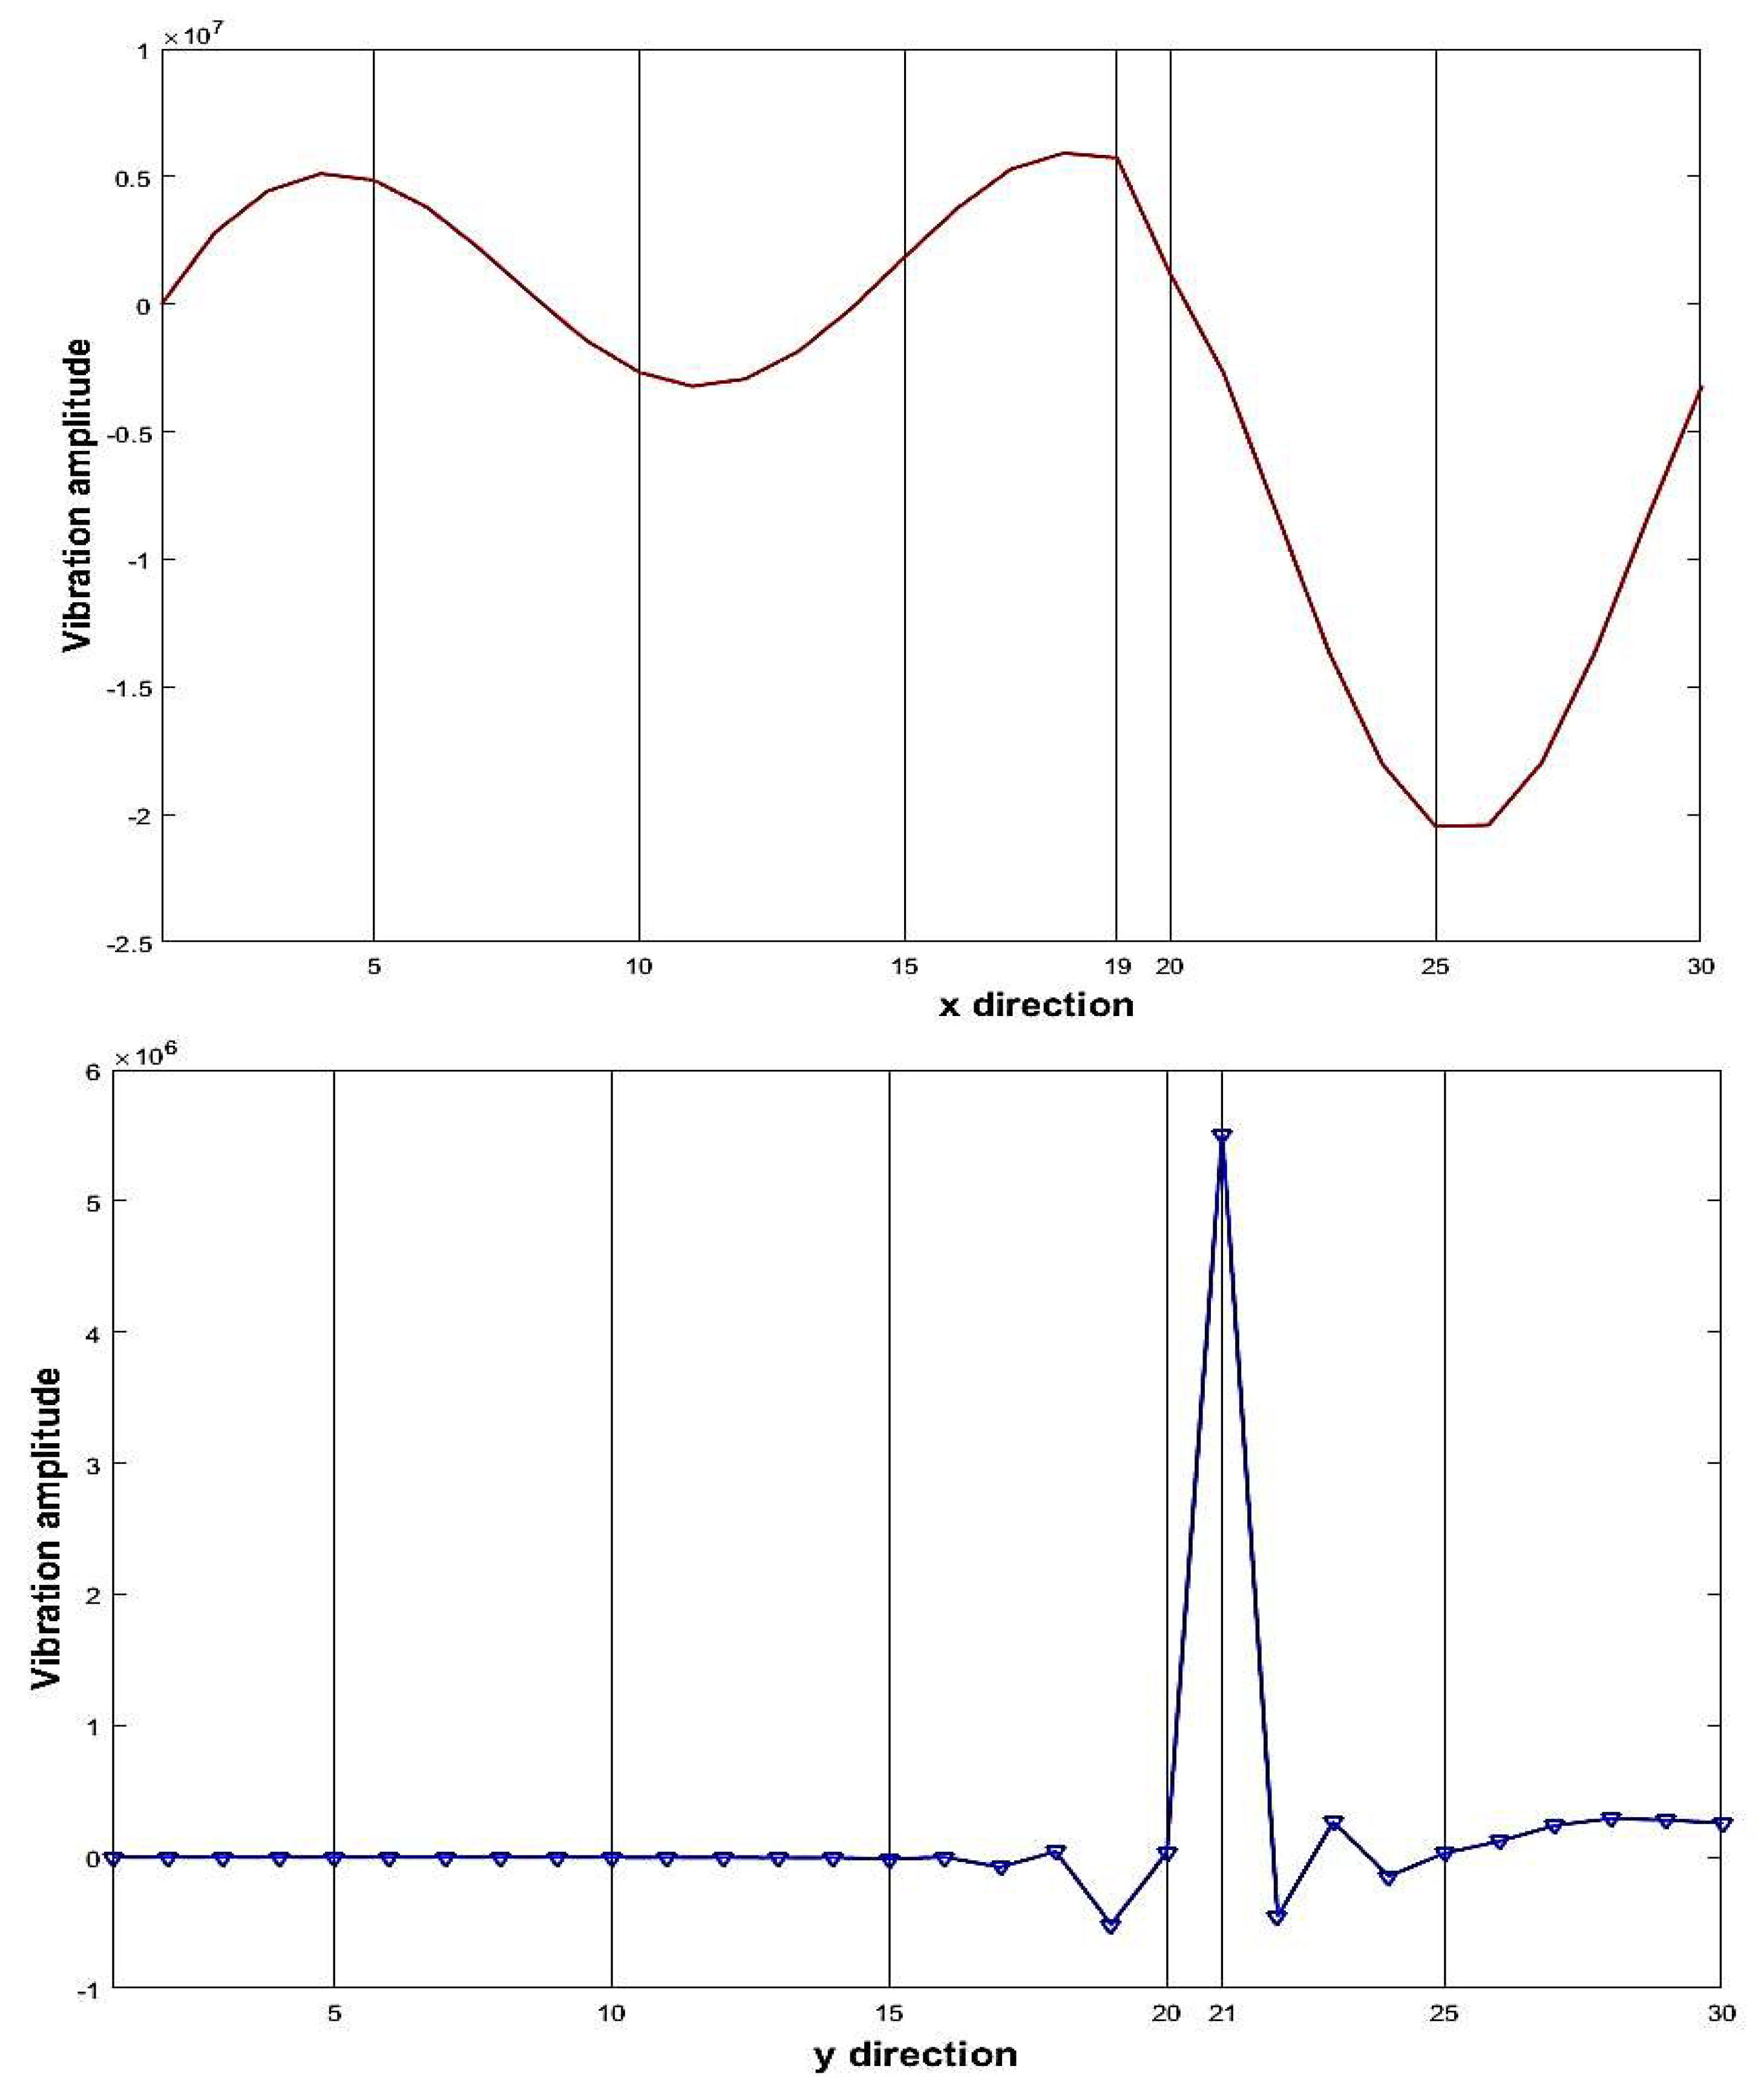
| 3 | 19 | 21 | 30% |
| 4 | 26 | 9 | 9% |
| 5 | 3 | 13 | 40% |
| 6 | 16 | 16 | 15% |
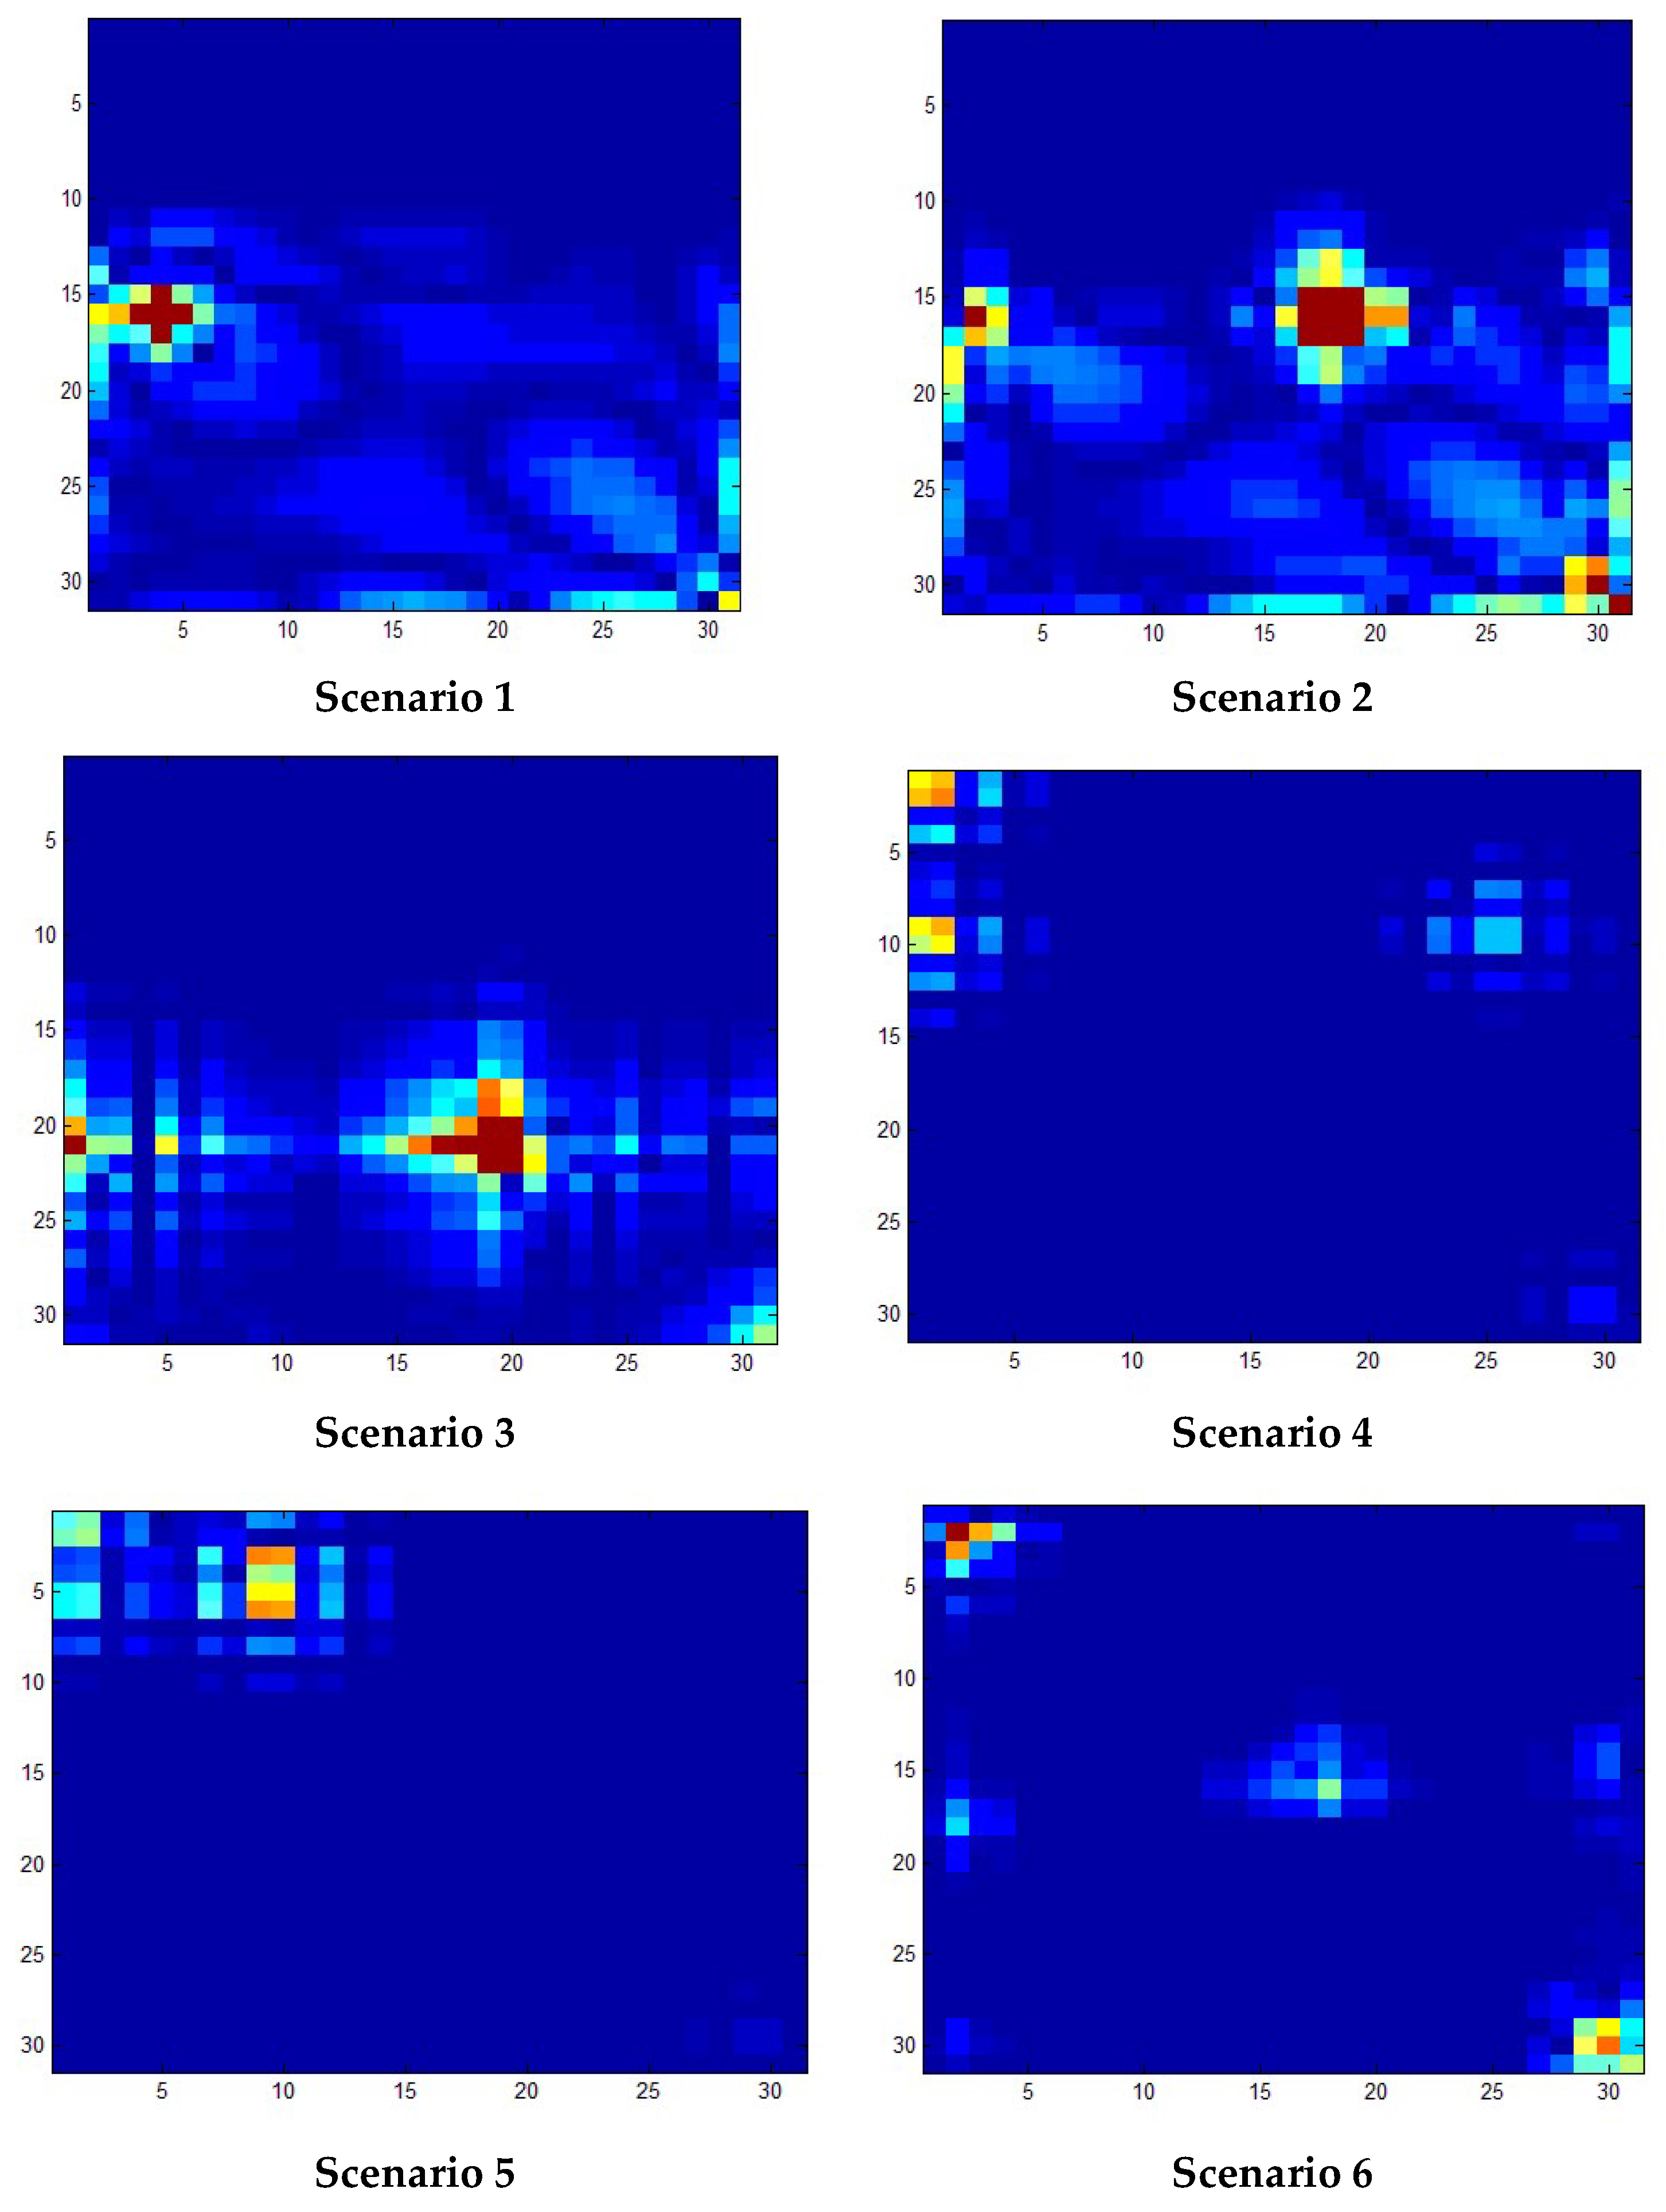
| Scenario No. | Actual location of damage | Location of damage detected by wavelet transform | ||
| x | y | x | y | |
| 1 | 3 | 13 | 1-5, 24-30 | 14-20, 24-27, 30 |
| 2 | 17 | 15 | 1-3, 15-22, 27-30 | 15-20, 25-30 |
| 3 | 19 | 21 | 1-3, 5, 16, 22, 25, 29-30 | 17-22, 29, 30 |
| 4 | 26 | 9 | 1-2, 4, 25-26 | 1, 2, 4, 9, 10 |
| 5 | 3 | 13 | 1, 2, 7,9,10,12 | 1-6 |
| 6 | 16 | 16 | 2-4, 18, 27-30 | 2-4, 18, 27-30 |
| Scenario No. | Actual location of damage | Location of damage detected by the proposed creation method | ||
| x | y | x | y | |
| 1 | 3 | 13 | 3 | 13 |
| 2 | 17 | 15 | 17 | 15 |
| 3 | 19 | 21 | 19 | 21 |
| 4 | 26 | 9 | 26 | 9 |
| 5 | 3 | 13 | 3 | 13 |
| 6 | 16 | 16 | 16 | 16 |
Disclaimer/Publisher’s Note: The statements, opinions and data contained in all publications are solely those of the individual author(s) and contributor(s) and not of MDPI and/or the editor(s). MDPI and/or the editor(s) disclaim responsibility for any injury to people or property resulting from any ideas, methods, instructions or products referred to in the content. |
© 2024 by the authors. Licensee MDPI, Basel, Switzerland. This article is an open access article distributed under the terms and conditions of the Creative Commons Attribution (CC BY) license (http://creativecommons.org/licenses/by/4.0/).


