Submitted:
05 December 2024
Posted:
06 December 2024
You are already at the latest version
Abstract
The objective of this study was to evaluate the impact of project/building characteristics on LEED-EB v4 gold-certified projects in the US. LEED project/building characteristics include project size and the number of buildings built before and after the 1973 energy crisis. LEED-EB-certified projects include a score for Location and Transportation credit (LTc1) and scores for Energy and Atmosphere credits (EAcs) (EAc6, “renewable energy and carbon offsets”, and EAc8, “optimize energy performance”). From 112 LEED projects, two groups of projects with specific achievements were selected. Group 1 (n1 = 13) includes high achievements in LTc1 and low achievements in EAc6 and EAc8. Group 2 (n2 = 13) includes high achievements in LTc1, EAc6, and EAc8. The exact Wilcoxon–Mann–Whitney or Fisher’s exact 2×2 test was used to estimate significant differences between two groups. As a result, Group 2 outperformed Group 1 in EAc6 and EAc8 (p <0.001, respectively). Group 1 outperformed Group 2 in project size and the number of buildings built before the “1973 energy crisis” (p = 0.017 and 0.005, respectively). Knowing the project size and the building's construction date can help LEED professionals choose the best certification strategy.
Keywords:
LEED-EB v4 gold-certified projects
; renewable energy and carbon offset credit
; optimize energy performance credit
; US
1. Introduction
1.1. General Point of View
In 1987, the Brundtland Report, “Our Common Future”, defined the principle of sustainable development as “…development that meets the needs of the present without compromising the ability of future generations to meet their own needs” [1]. In particular, this principle underlies reducing operational energy (used for heating, cooling, and lighting) in buildings.
It is well known that buildings are the main source of global greenhouse gas emissions, accounting for 30–40% of all operational energy used in the world [2]. However, the problem of reducing operational energy consumption in existing buildings built from 1915 to the present is not trivial.
There are at least two factors that can influence the reduction in operational energy consumption in an existing building: (1) its size and (2) year of construction.
According to [3], different Heating, Ventilation, and Air Conditioning (HVAC) systems are preferable for large and small buildings: central systems (cooling towers) and decentralized systems (packaged air conditioners), respectively. According to [4], different window-to-wall ratios (WWRs) are recommended for large and small buildings, about 50% and 30%, respectively. Therefore, different HVAC systems and WWRs can influence primary energy consumption [5].
Oldfield et al. [6] showed that in the United States, office buildings built before the “1973 energy crisis” consume significantly more operational energy than office buildings built after the 1973 energy crisis. This was achieved through architectural innovations, such as reducing the ratio of the envelope surface area to the volume, using double glazing instead of single glazing, and using natural and mixed ventilation instead of mechanical ventilation [6].
However, developing a systematic approach to solving this problem only began in the 1990s. One component of this systemic approach is the development of Green Building Rating Systems [7]. This study focused on the US Green Building Rating System (USGBC).
1.2. US Green Building Rating System
In 1993, the USGBC was founded with the specific purpose of creating a system of national standards to stimulate interest in building more sustainably [8]. In 2002, the USGBC launched the Leadership in Energy and Environmental Design of Existing Buildings (LEED-EB) system to reduce operational energy consumption in buildings through LEED certification procedures [9]. The LEED-EB system evolved from a pilot version in 2002 (1.0) to version 4 (v4) in 2013 via versions 2.0 in 2005 and 3.0 in 2009. It should be noted that LEED-EB-certified buildings must be recertified within 5 years to receive a new LEED certificate [10].
The LEED-EB v4 system contains four levels of certification: certified (40-49 points), silver (50-59 points), gold (60-79 points), and platinum (80-120 points). Increasing the certification level from certified through silver and gold to platinum in LEED-certified projects results in reduced environmental impacts from buildings [11].
The LEED-EB v4 system also contains six main categories and two additional categories. Each category consists of one or more credits and has a different number of maximum points (max pts).
The six main categories include energy and atmosphere (EA (38 max pts)), location and transportation (LT (15 max pts)), indoor environmental quality (EQ (17 max pts)), water efficiency (WE (12 max pts)), sustainable sites (SS (10 max pts)), and material and resources (MRs (8 max pts)), and the two additional categories include innovation (IN (6 max pts)) and regional priority (RP (4 max pts)). It should be noted that in determining the LEED-EB v4 certification strategy, EQ, WE, MR, and SS credits play a minor role, while LTc1, "alternative transportation" (15 max pts), EAc6, "renewable energy and carbon offsets" (5 max pts), and EAc8, "optimize energy performance" (20 max pts), credits play a major role [12]. In addition, if LEED-EB gold-certified projects are located in a prime urban location (for example, in New York, Chicago, or Washington, D.C.), the LEED “alternative commuting transportation” credit scores are approach or are equal to the maximum due to easy access to alternative transportation systems [13].
Thus, in assessing the two types of LEED certification strategies based on low/high operation energy performance in buildings, it can be helpful to sort LEED-EB v4 gold-certified office projects into two groups—Group 1, i.e., projects with low performance in EAc6 and EAc8, and Group 2, i.e., projects with high performance in EAc6 and EAc8, with LTc1 demonstrating high performance in both groups. Recently, a similar approach was applied to study LEED for commercial interior (LEED-CI) certification strategies in Manhattan, New York, USA, and Shanghai, China [14,15].
1.3. Limitation in LEED System
In 2007, Zimmerman and Kibert, [16] noted that the LEED system uses a “one-size-fits-all” approach for small and large buildings. However, in 2013, Talen [17] suggested that this claim may be incorrect. In 2015, Suzer [18] reviewed the LEED v3 and v4 approaches and noted a need to tailor each LEED-certified project to local conditions.
In 2017, Elzeyadi [19] compared predicted and actual performance in LEED-certified buildings and noted that the LEED certification strategy should not be perceived as a one-size-fits-all approach. In 2020, Ullah et al. [20] studied LEED-certified healthcare buildings in four regions of the United States: the Northeast, Midwest, South, and West. They found that the highest achievements in LEED-certified healthcare projects were made in the fastest-growing areas with good economic conditions in the South. Thus, socio-economic factors can significantly change the LEED certification strategy, which precludes the possibility of applying a one-size-fits-all approach to all LEED-certified projects.
In 2024, Pekdogan [21] reviewed 134 LEED v4 platinum-certified projects in Türkiye and concluded that achieving high project ratings is not a one-size-fits-all process but a multifaceted method that can be approached in different ways.
In 2020, Pushkar [22] compared China and the US in terms of LEED v3 and v4 silver- and gold-certified projects and showed that the differences between China and the US increased from two categories in v3 to four categories in v4. As a result, LEED v4 provides more flexibility than LEED v3 and allows for a focus on environmental priorities specific to certain countries, such as China and the United States. Based on this result, it can be assumed that at the country level, as the LEED system develops, the one-size-fits-all approach is being replaced by a more diverse one.
1.4. Unexplored Factors in LEED Certification Strategy
Despite considerable criticisms of the one-size-fits-all approach to using the LEED system, the following factors remain that can influence the choice of LEED certification strategy in the US: the size of the LEED project and the 1973 energy crisis. However, the impact of the LEED project size and year of construction (before or after the 1973 energy crisis) on the choice of LEED certification strategy for LEED-EB v4 office buildings has been poorly studied (regarding the LEED project size) or not studied at all (regarding the 1973 energy crisis).
Only three studies were identified that analyzed the relationship between low and high EAc6 and EAc8 scores in LEED-EB v4 gold-certified office projects. A critical analysis of these studies is presented below.
Two studies analyzed [23,12] LEED-EB-v4 gold-certified office building projects in Europe: 1) a comparison between Finland (Group 1, n = 14) and Spain (Group 2, n = 16) and 2) a comparison between LEED-certified projects with the highest EAc8 scores (Group 1, n = 15) and projects with the lowest EAc8 scores (Group 2, n = 15) in Spain. Both studies showed similar results: low EAc6 scores were associated with high EAc8 scores and vice versa. A limitation of these studies was that the size of the LEED project and the year of construction of the buildings were not considered important variables.
In 2021, the impact of project size on the choice of LEED-EB v4 gold certification strategy in the United States was examined for the first time [24]. At that time, there were only 26 LEED-EB v4 gold-certified projects in the USGBC database. The LEED data were divided into two groups based on LEED project size: small (median = 11,625 m2) and large (median = 49,861 m2). The small group contained 6 LEED-certified projects, and the large group contained 20 LEED-certified projects. It was shown that an increase in the size of a LEED project is associated with a decrease in EAc6 from 3.0 points (median) to 2.0 points (median) (p = 0.045) and in EAc8 from 19.5 points (median) to 16.5 points (median) (p = 0.076).
The first limitation of this study was the small overall sample size of LEED-EB v4 gold-certified office projects (n = 26). Therefore, the impact of LEED-EB v4 project size on LEED certification strategy has not been sufficiently studied. The second limitation of this study is that the LEED certification strategy has not been studied in the context of construction prior to or after the 1973 energy crisis.
Therefore, the objective of this study was to evaluate the impact of LEED project size and building construction year (i.e., before or after the 1973 energy crisis) on the choice of LEED certification strategy for LEED-EB v4 gold-certified office projects in the United States.
2. Materials and Methods
2.1. Study Design
LEED data were collected from one country (US), one LEED system (LEED-EB), one version (v4), one certification level (gold), and one space type (office). This design minimizes the influence of uncontrollable factors [25]. It has been previously shown that different countries, LEED systems, versions, certification levels, and space types use different LEED certification strategies e.g., [26,27,28,29].
The current study used an inversion problem-solving approach to identify the causal factors leading to different LEED certification strategies. The author of this study selected two small groups (n1 = n2 = 13) from one large group (n = 112). Group 1 includes LEED-certified projects with high LTc1 and low EAc6 and EAc8 scores, while Group 2 includes LEED-certified projects with high LTc1, EAc6, and EAc8 scores. The LEED project size and the year the LEED-certified building was built, i.e., before or after the 1973 energy crisis, were then compared between Group 1 and Group 2 to determine whether these two variables impact LTc1, EAc6, EAc8, and overall LEED achievement in LEED-certified projects.
2.2. Data Collection
Figure 1 displays a flowchart of the collection process and the sample sizes of LEED-EB v4-certified projects in the US.
The USGBC and Green Building Information Gateway (GBIG) databases were used to identify 216 LEED-EB v4-certified office space projects in the United States (on 13 July 2024) [30,31]. The USGBC database was used to collect LEED scores. The GBIG database was used to determine whether LEED-certified projects were office buildings. The GBIG database was also used to determine the year of construction of buildings in LEED-EB v4 gold-certified office projects using the Energy Star protocol.
The next step was to sort the LEED projects into four certification levels: platinum (n = 24), gold (n = 112), silver (n = 46), and certified (n = 34). The division into four certification levels is necessary because each certification level has its own unique set of LEED certification strategies. Combining the four certification groups into one group would result in a misleading description of the LEED certification strategy. Therefore, to achieve the objective of the study, the author focused only on LEED v4 gold-certified office projects since other certification levels contain a small number of projects.
2.3. LEED Gold-Certified Data Sorting
The author applied low-/moderate-/high-valued logic to the percentage of average score (PAS) results as the ratio of achieved points to maximum points [32] for LTc1, EAc6, and EAc8 to sort the three types of LEED certification strategies. Table 1 shows the boundaries of the three performance levels, low, moderate and high, for LTc1, EAc6 and EAc8.
Figure 2 shows that Groups 1 and 2 are fundamentally different from each other, while Groups 3 and 4 occupy an intermediate position between Groups 1 and 2.
Therefore, the author of this study focused only on a comparative analysis between Group 1 and Group 2.
Groups 1 and 2 each contain 13 LEED-EB v4 gold-certified office building projects with the following inputs: LEED project size, year of building construction, and scores for the three key LEED credits: LTc1, EAc6, and EAc8 (Appendix A, Table A1 and Table A2).
The exact Wilcoxon–Mann–Whitney (WMW) or Fisher’s exact 2×2 test was used to estimate significant difference between Group 1 and Group 2 in terms of LEED scores, LEED project sizes, and the construction years of LEED buildings. Details of the statistical analysis used are presented below.
2.4. Statistical Analysis
The results of the Shapiro–Wilk test showed that the normality assumption was not met for the LEED project sizes in Group 1 and Group 2 (p = 0.0117 and 0.0002, respectively). Therefore, nonparametric rather than parametric statistics should be used.
When the LEED scores and LEED project sizes were presented on ordinal or interval scales, the exact WMW rank test [33] and Cliff's δ nonparametric effect size analysis [34] were used to compare differences between the two groups. Although the LEED data contained tied observations, in their original study, Bergmann et al. [33] showed that if the sample size was n1 = n2 ≥ 12, then the exact WMW procedure was acceptable.
When building construction years were presented on a binary scale (before and after the 1973 energy crisis), Fisher's exact test using a 2 x 2 table with Lancaster's correction [35] and the natural logarithm of the odds ratio (lnθ) (i.e., the effect size test) [36] were used to compare differences between the two groups. Because buildings take several years to construct, buildings built only after 1980 were counted as "built after the 1973 energy crisis". According to [35], the minimum sample for Fisher’s exact test, using a 2 x 2 table with Lancaster’s correction, is n1 = n2 = 3.
2.5. Effect Size and p-Value Interprotations
In both δ and lnθ, (+) indicates that Group 1 outperformed Group 2, (–) indicates that Group 2 outperformed Group 1, and zero indicates no difference between the groups. Cliff’s δ effect size ranges between −1 and +1 [34], and lnθ ranges from minus infinity to plus infinity [36]. The Cliff’s effect size is considered (1) negligible if |δ| < 0.147, (2) small if 0.147≤ |δ| < 0.33, (3) medium if 0.33 ≤ |δ| < 0.474, and (4) large if |δ| ≥ 0.474 [37]. The lnθ effect size is considered (1) negligible if |δ| < .51, (2) small if 0.51 ≤ |δ| < 1.24, (3) medium if 1.24 ≤ |δ| < 1.90, and (4) large if |δ| ≥ 1.90 [38].
3. Results
3.1. Comparison of Two Sorted Groups
Table 2 shows a comparative analysis of Group 1 and Group 2 across the three key LEED credits.
LTc1, alternative transportation, requires the use of public transportation such as buses, subways, ridesharing, and green vehicles instead of conventional cars [41]. No significant difference was found between Group 1 and Group 2 in LTc1 (p = 0.199). Projects in both groups are being implemented in New York, Chicago, Washington D.C., Los Angeles, Denver, Boston, and San Jose (Appendix A, Table A1 and Table A2), cities with developed urban environments and considerable accessibility to public transportation. Therefore, it is not surprising that both groups had similar high LTc1 achievements.
EAc6, renewable energy and carbon offsets, requires that part of a building's operational energy be produced using renewable energy sources, such as solar panels and wind turbines, or through a green energy purchase contract [41]. EAc8, optimize energy performance, requires a building's energy consumption to be reduced by 26-45% compared to the national average [41]. As shown in Table 2, Group 2 outperformed Group 1 in EAc6 and EAc8 (p < 0.001, respectively). If a LEED-EB v4 gold-certified office project achieves low scores in EAc6 and EAc8 and high scores in LTc1, the overall LEED score meets the minimum requirements for gold certification (Group 1). If a LEED-EB v4 gold-certified office project achieves high scores in EAc6, EAc8, and LTc1, the overall LEED score exceeds the minimum score for gold certification by 11.7% and, therefore, can achieve the platinum level upon recertification (Group 2).
The factors (the size of LEED-EB v4 gold-certified projects and the construction year of LEED-certified buildings) that influenced the differences in the EAc6 and EAc8 scores between the two groups are analyzed below.
3.2. Factors Affecting the Difference in Energy Credits
3.2.1. LEED Project Sizes
Table 3 shows that Group 1 outperformed Group 2 in LEED project size (p = 0.017).
The size of the LEED project from Group 1 is almost three times the size of the LEED project from Group 2 (p = 0.017). Thus, it can be confirmed that decreasing the size of a LEED project results in differences between Group 1 (low EAc6 and EAc8 scores) and Group 2 (high EAc6 and EAc8 scores). In terms of EAc6, renewable energy and carbon offsetting, it can be assumed that this credit may be more effective in smaller buildings than in larger ones. This is because, for example, compared to larger buildings, smaller buildings have a higher roof-to-building size ratio. Therefore, solar panels are more suitable for small buildings than for large ones. In terms of EAc8, optimize energy performance, as explained earlier, larger buildings use central HVAC systems (boilers and chillers to heat and cool the air, respectively), while smaller buildings use decentralized HVAC systems (stand-alone packaged air conditioners) to heat and cool the air) [3]. Decentralized HVAC systems are more flexible in regulating energy consumption for different offices, while centralized systems do not have this ability and supply all offices with the same energy density. Thus, smaller buildings have more opportunities to optimize energy consumption than larger buildings [24]. This may be one explanation for why Group 2 LEED-EB-certified projects were more energy-efficient than Group 1 LEED-EB-certified projects, as shown in Table 2.
3.2.2. LEED Project Construction Years
As shown in Figure 3, the results of Fisher's exact test using 2 x 2 tables show a significant difference, with a large effect size for the buildings built before 1973/buildings built after 1980 ratio between Group 1 and Group 2 (p = 0.005; lnθ = 2.52).
Thus, for LEED-EB v4 gold-certified office projects, low EAc6 and EAc8 scores are associated with buildings built before the 1973 energy crisis, while high EAc6 and EAc8 scores are associated with buildings built after the 1973 energy crisis. In other words, in Group 1, buildings built before 1973 outnumber buildings built after 1980, and in Group 2, buildings built after 1980 outnumber buildings built before 1973.
The higher energy efficiency of Group 2 projects can be explained by taking into account the energy standard that emerged as a result of the 1973 energy crisis. In this respect, the U.S. Department of Energy was created in accordance with the recommendations of the Energy Policy and Conservation Act of 1975 [42,43] and the Energy Policy Act of 1992 [44,45]. At the federal level, the U.S. Department of Energy has developed the American Society of Heating, Refrigerating, and Air-Conditioning Engineers (ASHRAE) voluntary energy codes for commercial and residential buildings [46]. At the same time, many states have introduced their own rules and regulations regarding energy consumption in buildings. The first building energy efficiency standards were adopted in California in 1978. Energy regulations were then issued in other states including Arizona, Georgia, Illinois, Iowa, Massachusetts, and New York [47].
Energy savings depend largely on the following parameters: the orientation of the building, the ratio of windows to walls (the “transparency” of the facade), the type of glazing, and the thermal mass of the wall and its insulation [48]. In buildings constructed before the 1973 energy crisis, these parameters were often designed with architectural and aesthetic characteristics in mind rather than energy efficiency issues. The problem is that some parameters, such as the orientation of the building and the transparency of the facade, cannot be changed even when reconstructing an existing building [5]. It should be noted that the trade-off between building architecture and building operational energy reduction is a key issue in modern building design [49].
Thus, it may be supposed that due to the emerging standardization of energy consumption, offices built after the 1973 energy crisis are more energy-efficient than those built before the 1973 energy crisis. This may be another reason why the Group 2 projects were more energy-efficient than Group 1 projects (Table 4).
4. Conclusions
LEED professionals use two fundamentally different LEED certification strategies for LEED-EB v4 gold-certified office projects in the US.
The first type of LEED certification strategy involves a combination of high achievement in LTc1 (median = 15.0) and low achievement in EAc6 and EAc8 (median = 0.0 and 7.0, respectively), resulting in a number of total LEED points (median = 60.0) that is the minimum to achieve LEED gold certification. This strategy is associated with LEED-certified projects that (i) have a large LEED project size (median = 45,782 m2) and (ii) were built before the 1973 energy crisis.
The second type of LEED certification strategy involves a combination of high achievements in LTc1 (median = 14.0), EAc6, and EAc8 (median = 3.0 and 20.0, respectively), resulting in a number of total LEED points (median = 67.0) significantly higher than the minimum to achieve LEED gold certification. This strategy is associated with LEED-certified projects that (i) have a small LEED project size (median = 15,922 m2) and (ii) were built after the 1973 energy crisis.
Thus, there are at least two factors in parallel that influence the limitation of the energy savings potential in LEED-EB v4 gold-certified projects: (i) the increase in project size (median) from 15,922 m2 to 45,782 m2 and (ii) whether the building was constructed before or after the 1973 energy crisis.
Appendix A

Table A1.
Group 1: US-LEED-EB v4 gold-certified office projects with high LTc1 and low EAc6, and EAc8 performance with a Percentage Average Score (PAS).
Table A1.
Group 1: US-LEED-EB v4 gold-certified office projects with high LTc1 and low EAc6, and EAc8 performance with a Percentage Average Score (PAS).
| Address | Project name | Certification date | Year constructed | LTc1 (PAS) | EAc6 (PAS) | EAc8 (PAS) |
|---|---|---|---|---|---|---|
| 655 3rd Ave, New York, New York, 10017 | 655 Third Avenue | July 09, 2019 | 1958 1 | 15 (100) | 2 (40) | 7 (35) |
| 675 3rd Avenue, New York, New York, 10017 | 675 Third Avenue and 205 East 42nd Street | September 16, 2019 | 1966 | 15 (100) | 2 (40) | 4 (20) |
| 231 S. LaSalle Street, Chicago, Illinois, 60604 | 231 South LaSalle | July 31, 2023 | 1924 | 15 (100) | 0 (0) | 9 (45) |
| 485 Lexington Avenue, New York, New York, 10017 | 485 Lexington Avenue Recertification | January 14, 2019 | 1958 | 15 (100) | 0 (0) | 6 (30) |
| 114 West 47th Street, New York, New York, 10036 | 114 W47th St - Recert | June 23, 2022 | 1989 | 15 (100) | 0 (0) | 6 (30) |
| 1133 15th Street NW, Washington, District of Columbia, 20005 | 1133 15th Street Recertification | January 17, 2024 | 1969 | 15 (100) | 0 (0) | 0 (0) |
| 330 North Wabash Avenue, Chicago, Illinois, 60611 | 330 North Wabash Avenue | May 22, 2019 | 1971 | 15 (100) | 0 (0) | 9 (45) |
| 1133 Connecticut Ave NW, Washington, District of Columbia, 20036 | 1133 Connecticut Ave | June 06, 2022 | 1989 | 15 (100) | 0 (0) | 8 (40) |
| 617 W 7th Street, Los Angeles, California, 90017 | 617 W 7th St | December 19, 2023 | 1923 | 15 (100) | 0 (0) | 7 (35) |
| 523 West 6th Street, Los Angeles, California, 90014 | PacMutual Building Recertification | January 21, 2020 | 1921 | 13 (87) | 0 (0) | 9 (45) |
| 6350 Walker Lane, Alexandria, Virginia, 22310 | Metro Park 2 | September 07, 2021 | 2000 | 11 (73) | 0 (0) | 8 (40) |
| 1200 17th Street, Denver, Colorado, 80202 | Tabor Center | October 28, 2021 | 1985 | 11 (73) | 0 (0) | 7 (35) |
| 2550 South Clark Street, Arlington, Virginia, 22202 | Presidential Tower | January 12, 2021 | 1970 | 15 (100) | 0 (0) | 11 (55) |
Table A2.
Group 2: US-LEED-EB v4 gold-certified office projects with high LTc1, EAc6, and EAc8 performance scores and Percentage Average Scores (PASs).
Table A2.
Group 2: US-LEED-EB v4 gold-certified office projects with high LTc1, EAc6, and EAc8 performance scores and Percentage Average Scores (PASs).
| Address | Project name | Certification date | Year constructed | LTc1 (PAS) | EAc6 (PAS) | EAc8 (PAS) |
|---|---|---|---|---|---|---|
| University of California, Santa Barbara, California, 93106 | UCSB Student Resource Building | March 21, 2016 | 2007 2 | 15 (100) | 5 (100) | 18 (90) |
| 741 Technology Dr, San Jose, California, 95110 | Concourse V - 1741 Technology | September 08, 2022 | 1999 | 15 (100) | 4 (80) | 20 (100) |
| 197 Clarendon Street, Boston, Massachusetts, 02116 | Berkeley/Clarendon | July 17, 2018 | 1922 3 | 15 (100) | 4 (80) | 20 (100) |
| 535 Boylston Street, Boston, Massachusetts, 02116 | 535 Boylston v4 EB | October 03, 2018 | 1963 | 15 (100) | 4 (80) | 20 (100) |
| 121 Spear Street, San Francisco, California, 94105 | Rincon Center Recertification | March 30, 2022 | 1988 | 15 (100) | 3 (60) | 18 (90) |
| 114 W 47th St, New York, New York, 10036 | 114 W47th St | April 03, 2017 | 1989 | 15 (100) | 3 (60) | 18 (90) |
| 1220 Howell St., Seattle, Washington, 98101 | Met Park North | January 23, 2020 | 2000 | 14 (93) | 3 (60) | 20 (90) |
| 2033 Gateway Place, San Jose, California, 95110 | 2033 Gateway Place | January 03, 2020 | 1988 | 13 (86) | 3 (60) | 20 (100) |
| 4101 Reservoir Road, Washington, District of Columbia, 20007 | French embassy | March 10, 2018 | 1983 | 12 (80) | 3 (60) | 19 (95) |
| 2001 Gateway Place, San Jose, California, 95110 | 2001 Gateway Place | January 03, 2020 | 1981 | 12 (80) | 3 (60) | 20 (100) |
| 201 Redwood Shores Parkway, Redwood City, California, 94065 | Towers At Shore Center | October 14, 2019 | 2000 | 12 (80) | 3 (60) | 19 (95) |
| 2077 Gateway Place, San Jose, California, 95110 | 2077 Gateway Place | January 03, 2020 | 1984 | 11 (73) | 3 (60) | 20 (100) |
| 2099 Gateway Place, San Jose, California, 95110 | 2099 Gateway Place | January 03, 2020 | 1985 | 11 (73) | 3 (60) | 20 (100) |
References
- Brundtland, G.H. Our Common Future, Report of the World Commission on Environment and Development, Our Common Future (Brundtland Report); Oxford University Press: New York, NY, USA, 1987.
- UNEP, Buildings and Climate Change: Status, Challenges and Opportunities (Nairobi, United Nations Environmental Programme, 2007).
- Lechner, N. Heating, Cooling, Lighting: Sustainable Design Methods for Architects, 4th ed.; John Wiley & Sons: Hoboken, NJ, USA, 2014.
- Winiarski, D.; Halverson, M.; Jiang, W. PNNL’s CBECS Study. Analysis of Building Envelope Construction in 2003 CBECS Buildings; Pacific Northwest National Laboratory: Benton County, DC, USA, 2007.
- Goia, F. Search for the Optimal Window-to-Wall Ratio in Office Buildings in Different European Climates and the Implications on Total Energy Saving Potential. Sol. Energy 2016, 132, 467–492. [CrossRef]
- Oldfield, P.; Trabucco, D.; Wood, A. Five Energy Generations of Tall Buildings: A History Analysis of Energy Consumption in High Rise Buildings. J. Archit. 2009, 14, 591–613. [CrossRef]
- Aly, H.; Abdelaziz, O. Sustainable Design Trends in the Built-Environment Globally and in Egypt: A Literature Review. Sustainability 2024, 16, 4980. [CrossRef]
- Cidell, J. A political ecology of the built environment: LEED certification for green buildings. Local Environ. 2009, 14, 621–633. [CrossRef]
- Hodapp, R.T. LEED-EB: Leadership in Energy and Environmental Design for Existing Buildings. In Managing Human and Social Systems by Edited by Brian D. Fath, Sven Erik Jorgensen, 2nd Edition, CRC Press: Boca Raton, FL, USA, 2020, pp. 401–411.
- Gabe, J., McGrath, K., Robinson, S., and Sanderford, A. An Analysis of U.S. Multi-Family Housing, Eco-Certifications, & Walkability. J. Sustain. Real Estate, 2023, 15(1), 2162515.
- Ade, R.; Rehm, M. The unwritten history of green building rating tools: A personal view from some of the ‘founding fathers’. Build. Res. Inf. 2020, 48, 1–17. [CrossRef]
- Pushkar, S. Impact of “Optimize Energy Performance” Credit Achievement on the Compensation Strategy of Leadership in Energy and Environmental Design for Existing Buildings Gold-Certified Office Space Projects in Madrid and Barcelona, Spain. Buildings 2023, 13, 2656. [CrossRef]
- Braun, T.; Bienert, S. Is Green (still) a Matter of Prime? Stylized Facts about the Location of Commercial Green Buildings, J. Sustain. Real Estate, 2015, 7(1), 160–182.
- Pushkar, S. LEED-CI v4 Projects in Terms of Life Cycle Assessment in Manhattan, New York City: A Case Study. Sustainability 2023, 15, 2360. [CrossRef]
- Pushkar, S. Life-Cycle Assessment of LEED-CI v4 Projects in Shanghai, China: A Case Study. Sustainability 2023, 15, 5722. [CrossRef]
- Zimmerman, A.; Kibert C.J. Informing LEED’s next generation with The Natural Step. Build Res Inform 2007, 35, 681–689. [CrossRef]
- Talen, E.; Allen, E.; Bosse, A.; Ahmann, J.; Koschinsky, J.; Wentz, E.; Anselin, L. LEED-ND as an urban metric. Landsc Urban Plan 2013, 119, 20–34. [CrossRef]
- Suzer, O. A comparative review of environmental concern prioritization: LEED vs. other major certification systems. J. Environ. Manag. 2015, 154, 266–283. [CrossRef]
- Elzeyadi, I.M.K. A Comparative Analysis of Predictive and Actual Performance of High Performance LEED™ Buildings. In W. Prieser, U. Schramm & A. Hardy (eds.), Building Performance Evaluation: From Delivery Process to Life Cycle Phases (Second Edition). 2017, pp. 209-222. NY: Springer.
- Ullah, Z.; Thaheem, M. J.; Waheed, A.; Maqsoom, A. Are LEED-certified healthcare buildings in the USA truly impacting sustainability? Indoor Built Environ. 2020, 29(1), 7–23. [CrossRef]
- Pekdogan, T. Addressing challenges in LEED green building ratings in Türkiye. GRAĐEVINAR 2024, 76(7), 621-631.
- Pushkar, S. Evaluating LEED commercial interior (LEED-CI) projects under the LEED transition from v3 to v4: The differences between China and the US. Heliyon 2020, 6, e04701. [CrossRef]
- Pushkar, S. LEED-EB Gold Projects for Office Spaces in Large Buildings Transitioning from Version 3 (v3) to 4 (v4): Similarities and Differences between Finland and Spain. Appl. Sci. 2020, 10, 8737. [CrossRef]
- Pushkar, S. 2021. Impact of project size on LEED-EB V4 credit achievement in the United States. J. Archit. Eng. 2021, 27 (2), 04021012.
- Hurlbert, S.H. Pseudoreplication and the Design of Ecological Field Experiments. Ecol. Monogr. 1984, 54, 187–211. [CrossRef]
- Chi, B.; Lu,W.; Ye, M.; Bao, Z.; Zhang, X. Construction waste minimization in green building: A comparative analysis of LEED-NC 2009 certified projects in the US and China. J. Clean. Prod. 2020, 256, 120749. [CrossRef]
- Wu, P.; Mao, C.; Wang, J.; Song, Y.; Wang, X. A decade review of the credits obtained by LEED v2.2 certified green building projects. Build. Env. 2016, 102, 167–178. [CrossRef]
- Wu, P.; Song, Y.; Shou,W.; Chi, H.; Chong, H.Y.; Sutrisna, M. A comprehensive analysis of the credits obtained by LEED 2009 certified green buildings. Renew. Sustain. Energy Rev. 2017, 68 Pt 1, 370–379. [CrossRef]
- Wu, P.; Song, Y.; Wang, J.; Wang, X.; Zhao, X.; He, Q. Regional Variations of Credits Obtained by LEED 2009 Certified Green Buildings—A Country Level Analysis. Sustainability 2018, 10, 20. [CrossRef]
- USGBC Projects Site. Available online: https://www.usgbc.org/projects (accessed on 28 November 2024).
- GBIG Green Building Data. Available online: http://www.gbig.org (accessed on 28 November 2024).
- Pham, D.H.; Kim, B.; Lee, J.; Ahn, Y. An Investigation of the Selection of LEED Version 4 Credits for Sustainable Building Projects. Appl. Sci. 2020, 10, 7081. [CrossRef]
- Bergmann, R.; Ludbrook, J.; Spooren,W.P.J.M. Different outcomes of the Wilcoxon-Mann-Whitney test from different statistics packages. Am. Stat. 2000, 54, 72–77.
- Cliff, N. Dominance statistics: Ordinal analyses to answer ordinal questions. Psychol. Bull. 1993, 114, 494–509. [CrossRef]
- Routledge, R.D. Resolving the conflict over Fisher’s exact test. Can. J. Statist. 1992, 20, 201–209. Available online: https://www.jstor.org/stable/3315468 (accessed on 28 November 2024). [CrossRef]
- Bland, J.M.; Altman, D.G. The odds ratio. BMJ 2000, 320, 1468. [CrossRef]
- Romano, J.; Corragio, J.; Skowronek, J. Appropriate statistics for ordinal level data: Should we really be using t-test and Cohen’s d for evaluating group differences on the NSSE and other surveys? In Proceedings of the Annual Meeting of the Florida Association of Institutional Research, Cocoa Beach, FL, USA, 1–3 February 2006; Florida Association for Institutional Research: Cocoa Beach, FL, USA, 2006; pp. 1–33.
- Chen, H.; Cohen, P.; Chen, S. How Big is a Big Odds Ratio? How big is a big odds ratio? Interpreting the magnitudes of odds ratios in epidemiological studies. Commun. Stat. Simulat. Comput. 2010, 39, 860–864. [CrossRef]
- Hurlbert, S.H.; Lombardi, C.M. Final collapse of the Neyman-Pearson decision theoretic framework and rise of the neoFisherian. Ann. Zool. Fenn. 2009, 46, 311–349. [CrossRef]
- Hurlbert, S.H.; Lombardi, C.M. Lopsided reasoning on lopsided tests and multiple comparisons. Aust. N. Z. J. Stat. 2012, 54, 23–42. [CrossRef]
- LEED-EBv4 2019. Available online: https://www.usgbc.org/resources/leed-v4-building-operations-and-maintenance-current-version (accessed on 2 December 2024).
- The Energy Policy and Conservation Act (P.L. 94–163, 42 U.S.C. 6201), 1 Wm. & Mary Envtl L. & Pol'y Rev. 2 (1976), https://scholarship.law.wm.edu/wmelpr/vol1/iss2/3.
- Jiang, Y.; Liu, X. A Bibliometric Analysis and Disruptive Innovation Evaluation for the Field of Energy Security. Sustainability 2023, 15, 969. [CrossRef]
- The Energy Policy Act of 1992. Public law 102–486–Oct, 24, 1992.
- Mock, J.E., 1993. Energy policy act of 1992 opens doors for independent geothermal power producers. Trans. Geoth. Resour. Counc. 1993, 17, 489–494.
- Liu, LP.; Bartone, B.; Habib, Z.; Makhija, K.; Nawaz, K. Impact and Value of ASHRAE's Standards and Technology. ASHRAE Trans. 2022, 128 PT2, 671–693.
- Sun, X.; Brown,M.A.; Cox,M.; Jackson, R.Mandating better buildings: A global review of building codes and prospects for improvement in the United States. Wiley Interdiscip. Rev. Energy Environ. 2016, 5, 188–215.
- Raji, B.; Tenpierik, M.J.; van den Dobbelsteen, A. A comparative study: Design strategies for energy-efficiency of high-rise office buildings. J. Green Build. 2016, 11, 134–158. [CrossRef]
- Shi, X.; Yang, W. Performance-driven architectural design and optimization technique from a perspective of architects. Autom. Constr. 2013, 32, 125–135. [CrossRef]
Figure 1.
Flowchart of collection and sample sizes of LEED-EB v4-certified projects in the US.
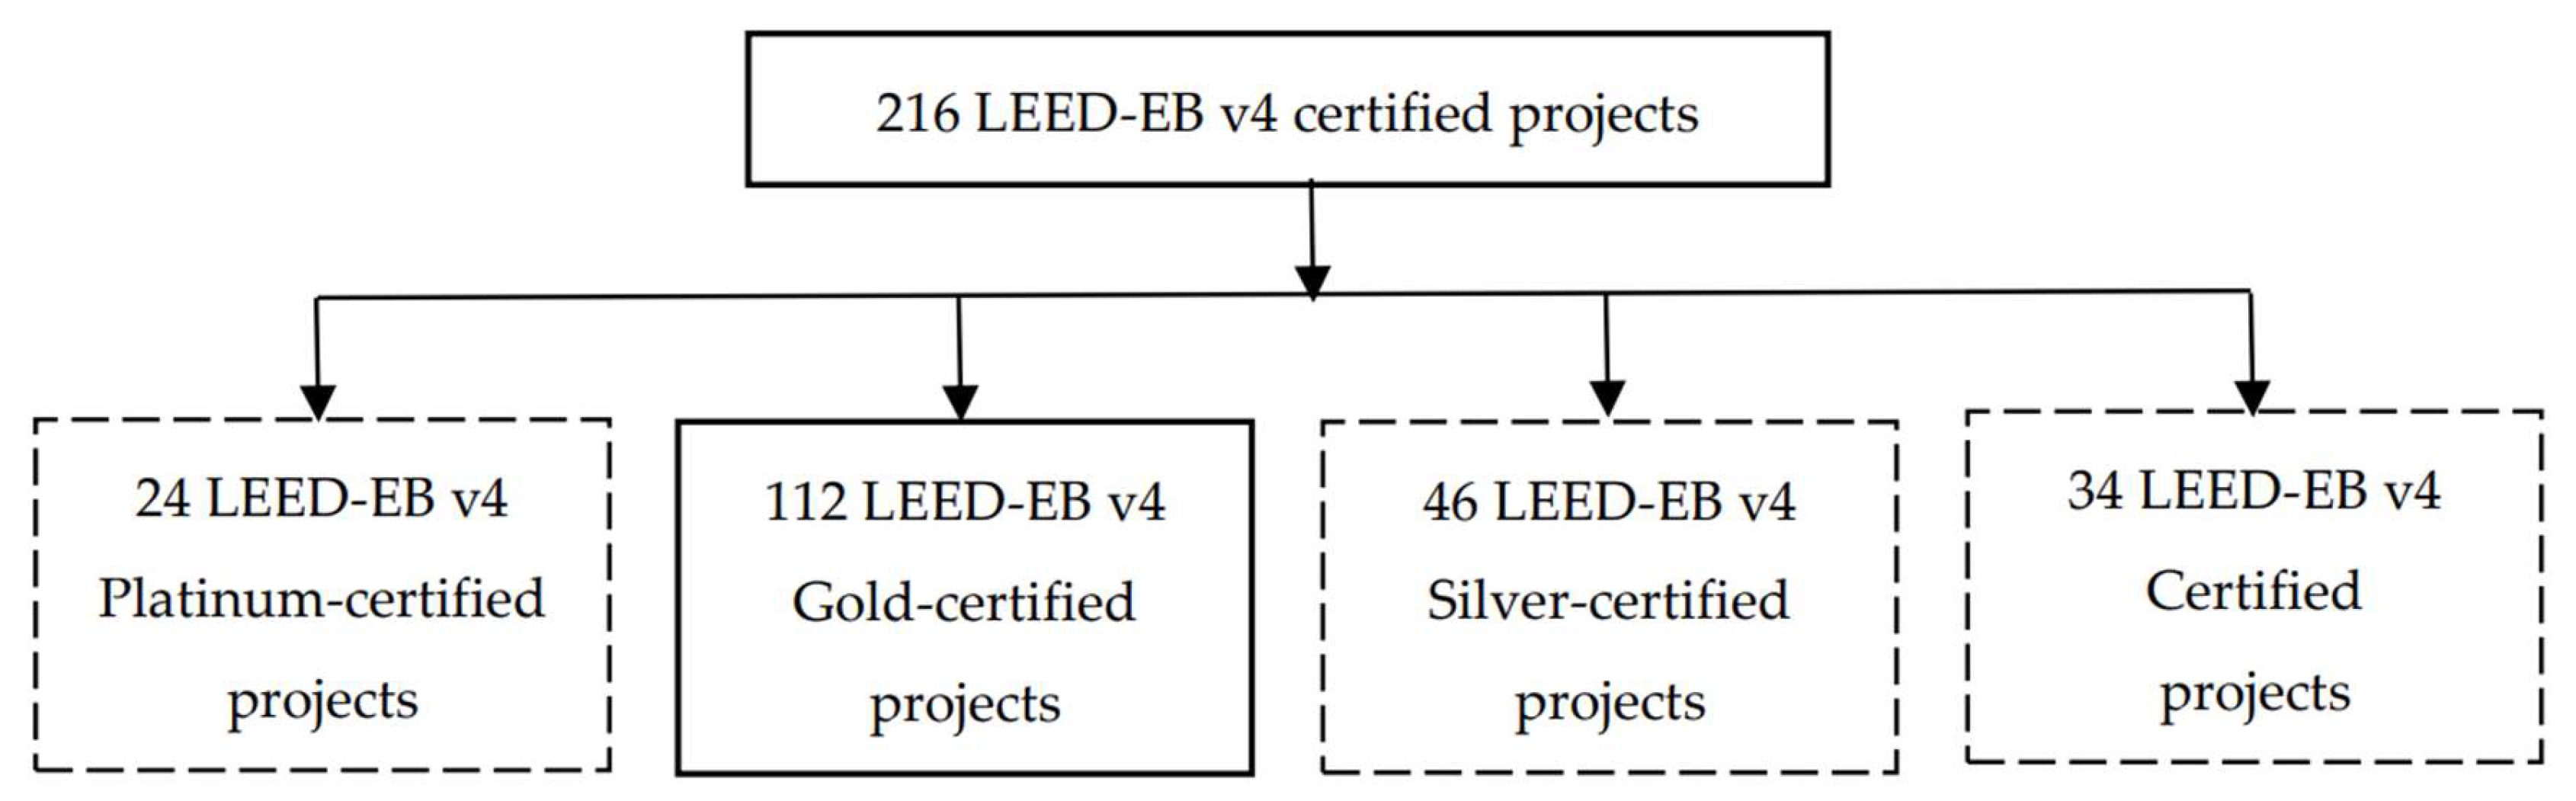
Figure 2.
Flowchart of sorting LEED-EB v4-certified projects into four groups according to LTc1, EAc6 and EAc8 using low-/moderate-/high-valued logic.
Figure 2.
Flowchart of sorting LEED-EB v4-certified projects into four groups according to LTc1, EAc6 and EAc8 using low-/moderate-/high-valued logic.
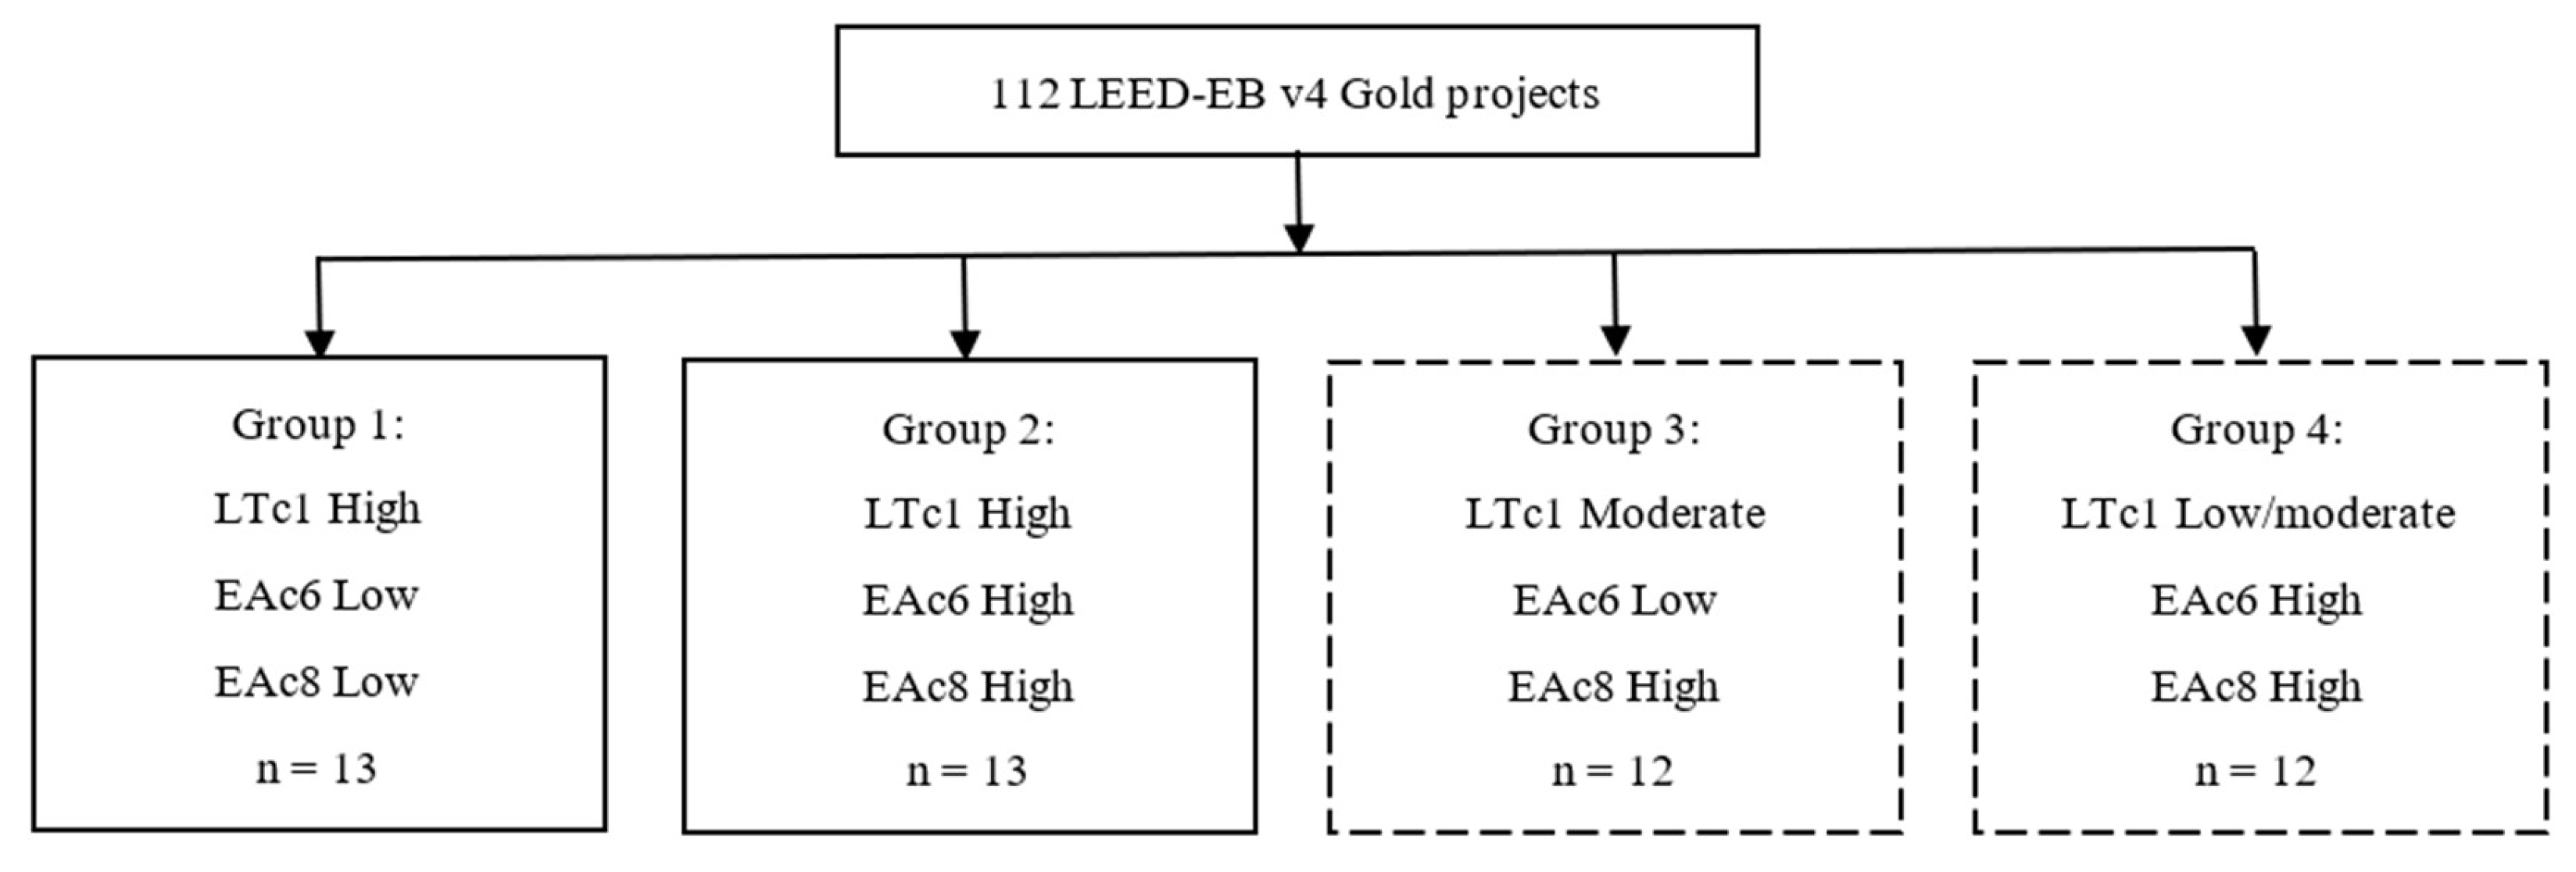
Figure 3.
The relationship between two LEED energy efficiency strategies (i.e., Groups 1 and 2) in existing office buildings and buildings constructed before and after the 1973 energy crisis in the United States.
Figure 3.
The relationship between two LEED energy efficiency strategies (i.e., Groups 1 and 2) in existing office buildings and buildings constructed before and after the 1973 energy crisis in the United States.
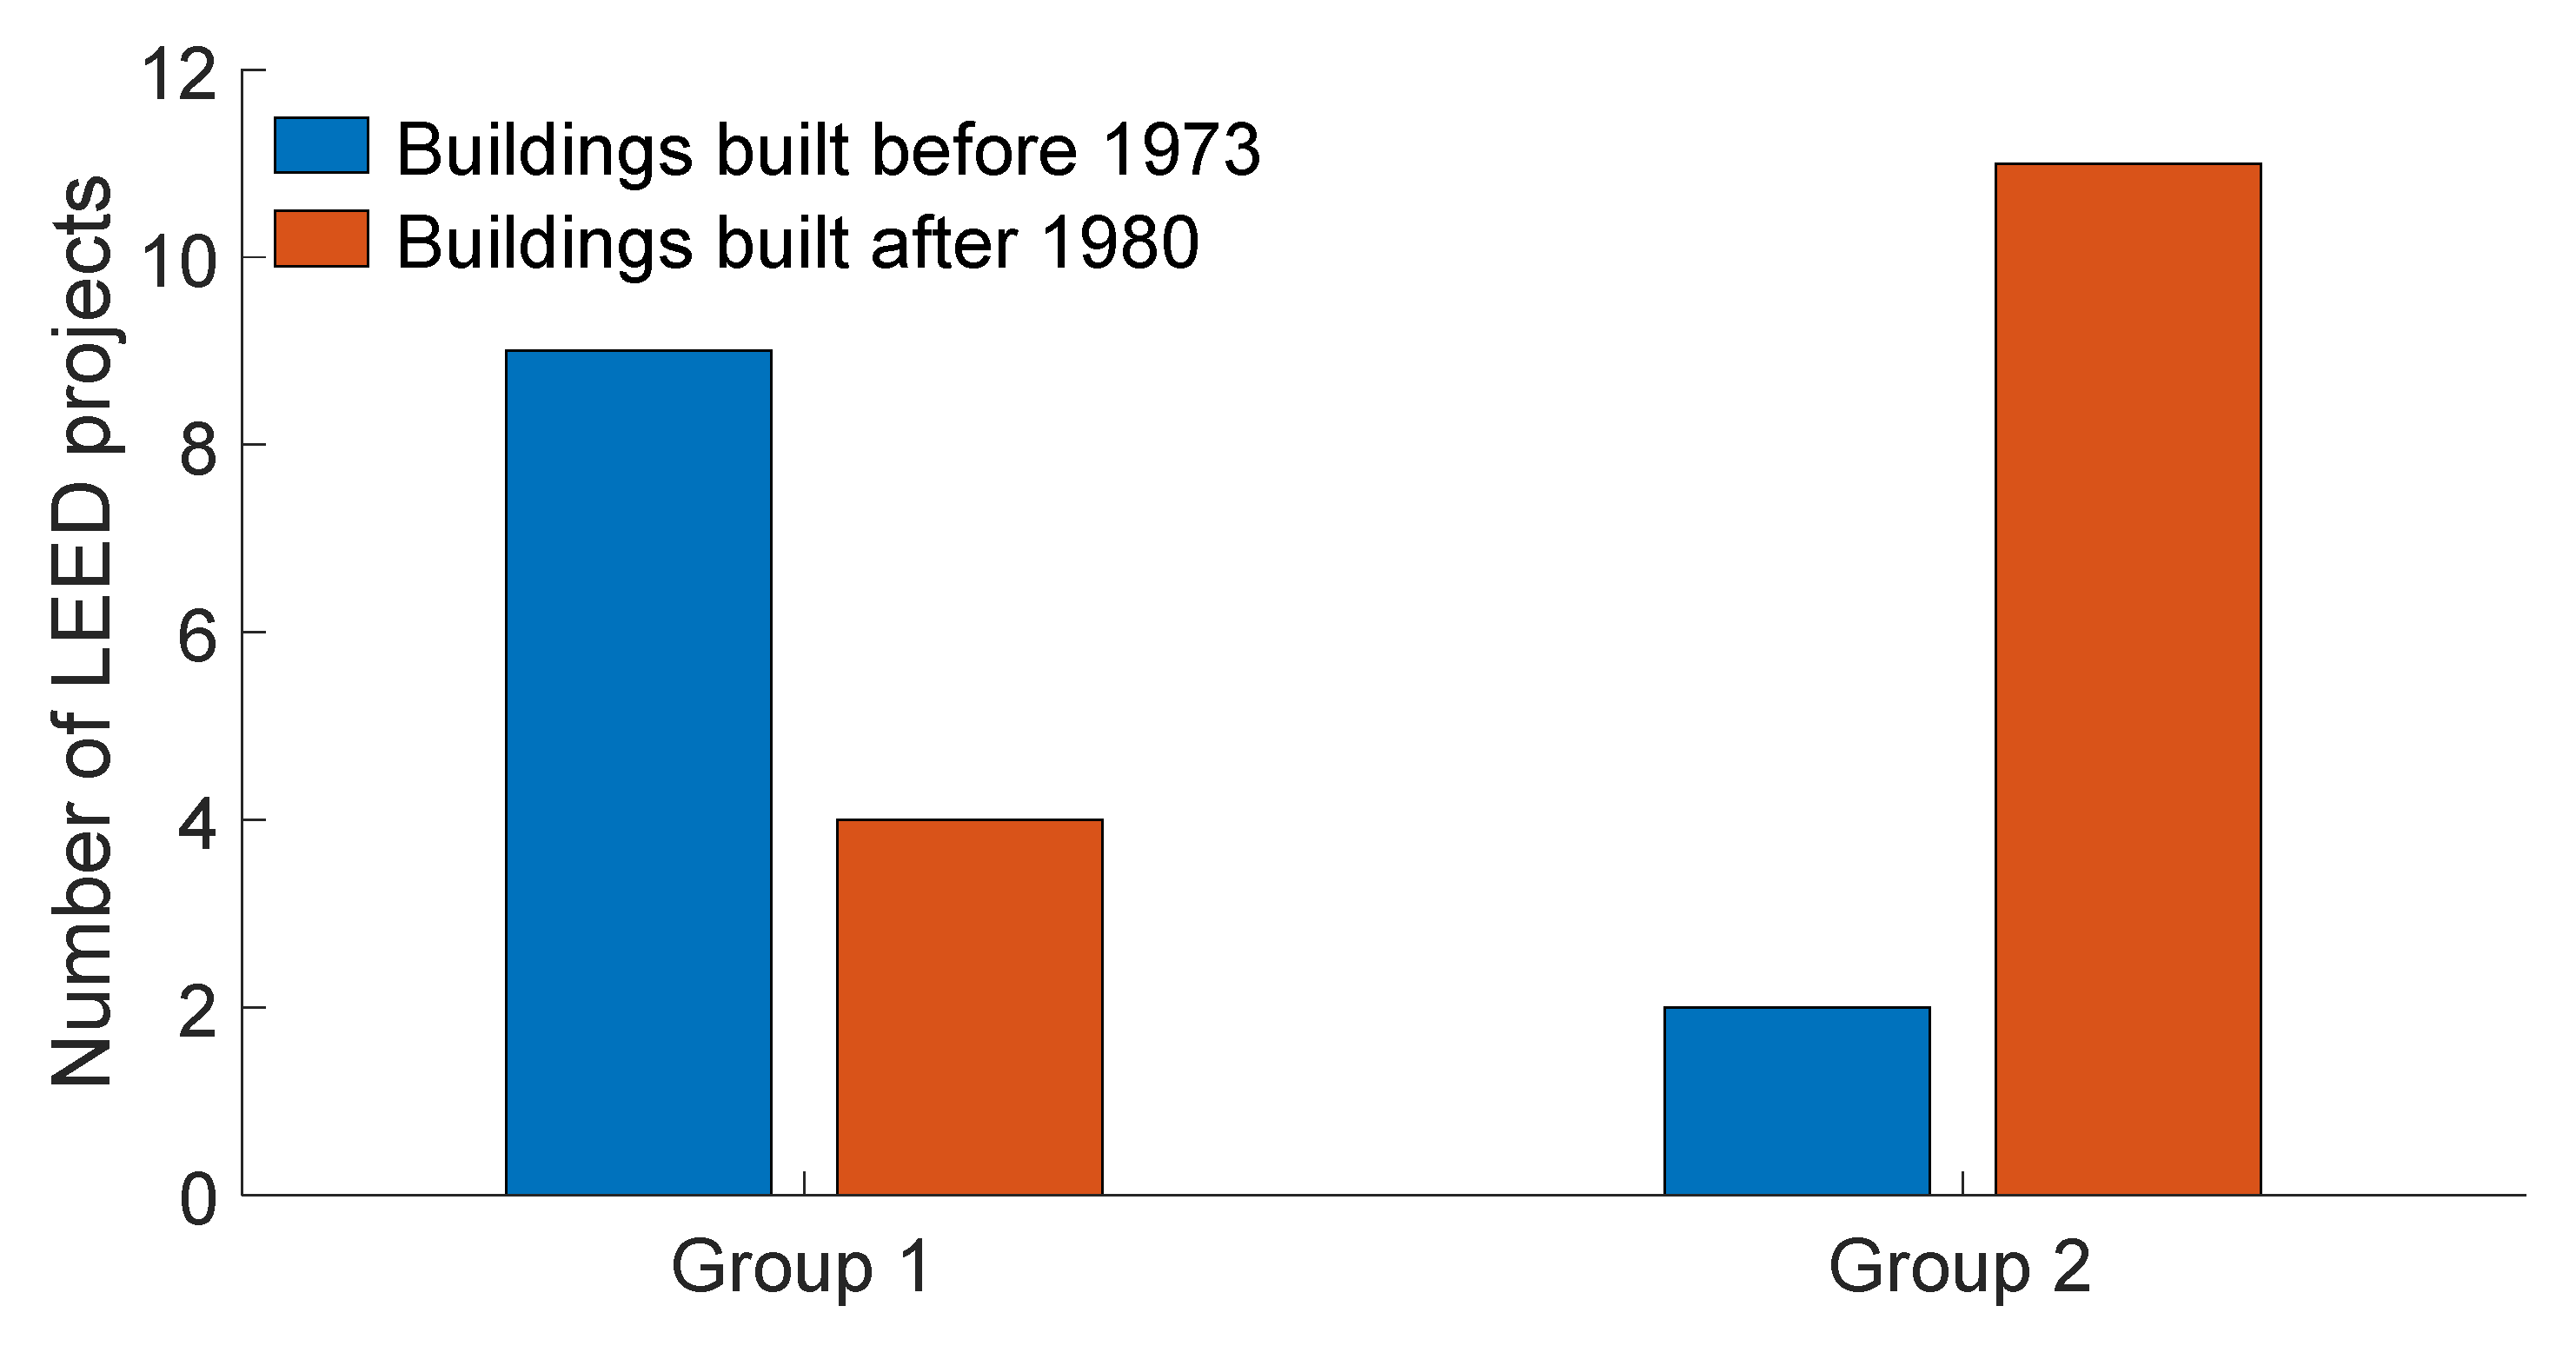
Table 1.
The percentage of average score (PAS) for LTc1, EAc6, and EAc8 using low-/moderate-/high-valued logic.
Table 1.
The percentage of average score (PAS) for LTc1, EAc6, and EAc8 using low-/moderate-/high-valued logic.
| LEED-EB v4 credit | Max points | Low | Moderate | High |
|---|---|---|---|---|
| LTc1: alternative transportation | 15 | 0–39 | 40–67 | 68–100 |
| EAc6: renewable energy and carbon offsets | 5 | 0–40 | 41–59 | 60–100 |
| EAc8: optimize energy performance | 20 | 0–55 | 56–89 | 90–100 |
Table 2.
Three key LEED credits in LEED-EB v4 gold-certified office projects in the United States.
| LEED-EB v4 credit (Max Points) | Median, 25–75th Percentiles | p-Value (Cliff's δ) | |
|---|---|---|---|
| Group 1 (n1 = 13) | Group 2 (n2 = 13) | ||
| LTc1: alternative transportation (15) | 15.0, 14.5–15.0 | 14.0, 12.0–15.0 | 0.199 (0.27) |
| EAc6: renewable energy and carbon offsets (5) | 0.0, 0.0–0.0 | 3.0, 3.0–4.0 | <0.001 (-1.00) |
| EAc8: optimize energy performance (20) | 7.0, 6.0–9.0 | 20.0, 18.8–20.0 | <0.001 (-1.00) |
| LEED total 1 | 60.0, 60.0–61.0 | 67.0, 62.0–68.3 | <0.001 (-0.88) |
Note: 1 the minimum score to achieve LEED Gold certification for a project is 60.
Table 3.
Size of LEED-EB v4 gold-certified office projects in the United States.
| Variable | Median, 25–75th Percentiles | p-Value (Cliff's δ) | |
|---|---|---|---|
| Group 1 (n1 = 13) | Group 2 (n2 = 13) | ||
| Project size (m2) | 45,782, 21,225–73,644 | 15,922, 11,153–36,719 | 0.017 (0.54) |
Disclaimer/Publisher’s Note: The statements, opinions and data contained in all publications are solely those of the individual author(s) and contributor(s) and not of MDPI and/or the editor(s). MDPI and/or the editor(s) disclaim responsibility for any injury to people or property resulting from any ideas, methods, instructions or products referred to in the content. |
© 2024 by the authors. Licensee MDPI, Basel, Switzerland. This article is an open access article distributed under the terms and conditions of the Creative Commons Attribution (CC BY) license (http://creativecommons.org/licenses/by/4.0/).
Copyright: This open access article is published under a Creative Commons CC BY 4.0 license, which permit the free download, distribution, and reuse, provided that the author and preprint are cited in any reuse.


