
Submitted:
04 December 2024
Posted:
05 December 2024
You are already at the latest version
Abstract
Background: Given the poor prognosis of metastatic pancreatic adenocarcinoma (mPDAC), closer disease monitoring through liquid biopsy, most frequently based on serial measurements of cell-free mutated KRAS (KRASmut cfDNA), has become a highly active research focus, aiming to improve patients´ long-term outcome. However, most of the available data show only a limited predictive and prognostic value of single-parameter based methods. We hypothesized that a combined longitudinal analysis of KRASmut cfDNA and novel protein biomarkers could improve risk stratification and molecular monitoring of patients with mPDAC. Methods: We prospectively collected 160 plasma samples from 47 patients with mPDAC at our institution. Highly sensitive single-target ddPCR assays were employed to detect and quantify KRASmut cfDNA. Additionally, analysis of ten protein biomarkers was performed through Enzyme-linked Immunosorbent Assay (ELISA), and CA 19-9 dynamics were registered. Results: KRASmut cfDNA was detectable in 37/47 (78.7%) patients through course of study, and CA 19-9 levels were elevated in 40 out of 47 (85.1%) patients. KRASmut cfDNA increase at time of first follow-up could predict inferior PFS (Hazard ratio (HR) = 3.40, P = 0.0003) and OS (HR = 4.91, P < 0.0001). In contrast to CA 19-9 kinetics, not predictive of outcome, integrated analysis of KRASmut cfDNA combined with six evaluated circulating protein biomarkers, allowed basal risk stratification at time of first follow-up (HR = 10.2, P = 0.0014). Conclusion: A combined longitudinal analysis of KRASmut cfDNA with selected protein biomarkers offers significantly improved prognostic value for patients with mPDAC compared to single-parameter methods. This innovative approach is a step forward in the molecular monitoring of mPDAC and should be validated in further prospective studies.
Keywords:
liquid biopsy
; circulating tumor DNA
; cell-free DNA (cfDNA)
; metastatic pancreatic adenocarcinoma (mPDAC)
; digital droplet PCR (ddPCR)
; protein biomarkers
; KRAS
; precision medicine
1. Introduction
Clinical management of patients diagnosed with pancreatic adenocarcinoma (PDAC) still remains very challenging due to limited therapeutic options and a lack of biomarkers to better guide systemic treatment and to predict clinical course of disease. Even today, most patients present with stage IV disease and succumb to it within one year of diagnosis [1,2]. Although the disease is perceived as uniformly aggressive, there is a great heterogeneity among patients in terms of response to treatment. While genomic studies have shown that pancreatic cancer is predominantly characterized by mutations in the four genes KRAS, CDKN2A, TP53 and SMAD4, it remains unclear how clinical heterogeneity arises when most tumors are caused by the same mutation pathway [3,4,5]. Lack of predictive and prognostic biomarkers and impossibility of detecting intrinsic resistance of the disease to molecularly targeted therapy make it difficult to develop personalized treatment strategies.
Even though classical protein-based tumor markers (CA 19-9, CEA) have been used for years to monitor clinical course of disease in patients with known cancers, they are not suitable for screening purposes due to their sometimes low sensitivity or specificity [6,7,8,9,10]. A promising novel tool that has become the focus of the biomarker field in recent years is the detection of circulating nucleic acid fragments, in particular circulating tumor DNA (ctDNA), in the bloodstream of cancer patients [11,12,13,14]. This non-invasive blood-based technology can not only reflect tumor changes under therapy in real time [15], but also allows statements to be made regarding therapy response through longitudinal monitoring during the course of disease [15,16,17,18,19,20,21,22,23,24]. Hereby, highly sensitive detection methods such as digital droplet PCR allow sensitivities of 0.01 to 0.001% [25,26].
An alternative concept is the establishment of protein expression patterns from serum or plasma that may have the potential to map tumor-specific signatures from a few milliliters of blood [27,28]. A general observation, however, is that each individual method, whether protein-, DNA- or RNA-based, has its specific advantages and limitations, and possibly only the combination and integration of different methodological approaches can meet all clinical requirements. The biomarker field is thus moving towards a combination of complementary approaches [27,29]. Therefore, the aim of this exploratory biomarker study was to investigate the potential of integrated biomarker analysis for clinical application in PDAC through the combined highly sensitive detection of cell-free mutated KRAS (KRASmut cfDNA) and a protein biomarker signature that we have already been able to establish in a systems biology approach [30].
2. Materials and Methods
2.1. Human Samples and Patient Cohort
Blood samples were collected from patients with clinically and histologically confirmed metastatic PDAC at time of diagnosis and during routine clinical follow-up, in addition to clinic-pathologic, treatment and outcome data. Diagnosis of metastatic disease was based on a radiological and cyto-/histological confirmation. A total of 47 patients undergoing first-line systemic treatment or best supportive care following diagnosis of metastatic PDAC were recruited at the University Medical Center in Freiburg. All patients gave written informed consent to collection and analysis of blood samples. Local institutional review board (IRB) approved all relevant procedures and analyses (EK-Freiburg project number 46/18). Treatment was performed as per standard of care and blinded to KRASmut cfDNA results. Follow up included 3-monthly clinical and radiological examination using computed tomography and/or magnetic resonance imaging. Progressive disease (PD) was determined based on routine evaluation of radiological imaging.
2.2. Extraction of Cell-Free DNA from Plasma Samples
Venous blood samples from mPDAC patients were collected using commercially available EDTA tubes. Plasma was extracted through two subsequent centrifugation steps at 3000 rpm and 14.000 rpm for each 10 min at 4°C within one hour of collection, as previously described [31], and frozen at -80°C without further treatment until extraction of cell-free DNA. CfDNA was extracted from each 4ml plasma sample following the SEP/SBS protocol of the PME-free circulating DNA extraction kit (Analytik Jena, cat. no. 845-IR-0003050) according to manufacturer’s instructions. Two subsequent elution steps with each 30 µl Elution Buffer were performed. DNA was stored at -20°C until ctDNA quantification. CfDNA was evaluated with fragment analyzer and quantified using Qubit 2.0 fluorometer. DNA yield from 4ml of plasma typically ranged from 1-20 ng/µl up to 80 ng/µl for metastatic pancreatic cancer patients.
2.3. Enzyme-linked Immunosorbent Assay (ELISA)
ELISA antibodies and preparation kits for SFN and TFF1 were manufactured by Wuhan USCN Business (USCN, Co. Ltd., Wuhan China; cat. no. #SEH179Hu, #SEB049Hu) and for CEMIP, COL10A1, HGF, LAMB3, POSTN, SERPINB5, SPP1 and TMPRSS4 by LifeSpan Biosciences (LSBio, Seattle, USA; cat. no. #LS-F7390, # LS-F13131, #LS-F2441, #LS-F11919, #LS-F3645, #LS-F13455, #LS-F13367, #LS-F7623). Plasma was frozen at -80°C before preparation according to manufacturers’ instructions. The colorimetric reactions were analyzed on a Tecan Infinite M200 Pro.
2.4. Droplet Digital PCR (ddPCR)
Locked nucleic acid (LNA)-based probes and associated primer pairs for detecting KRAS mutations in plasma cfDNA were developed using Beacon Designer v.8.20 soft-ware (Premier Biosoft, Palo Alto, CA, USA). These primers and probes were custom-synthesized by Integrated DNA Technologies (IDT, Inc., Coralville, IA, USA). Comprehensive details regarding the design process, including sequences, have been previously published [31]. The reaction mixture for droplet digital PCR (ddPCR) was prepared by combining ddPCR Supermix for Probes (Bio-Rad, catalog #186-3024) with primers, probes, 2 µl of template DNA per well, and nuclease-free water (Ambion). Droplets were created us-ing the QX100/200™ Droplet Generator (Bio-Rad, catalog #1863002) following the manufacturer’s protocol. Each sample was analyzed in four replicates. After generating the droplets, the mixture was transferred to a 96-well PCR plate (Bio-Rad, catalog #12001925) and PCR was run on a C1000 Touch™ Thermal Cycler (Bio-Rad, catalog #1851197). The amplified droplets were subsequently analyzed using the QX100/200™ Droplet Reader (Bio-Rad, catalog #1863003) with the QuantaSoft software v1.7.4.0917 (Bio-Rad, catalog #1864011). Details of the PCR protocols, assay controls, and data analysis methods for the KRAS assays have been previously published [31]. The number of copies per milliliter of plasma was determined using the following calculation:
copies/ml plasma = x 20 µL x 7,5 [31]
2.5. Statistical Analysis
The primary outcome measured was PFS based on routine evaluation of radiological imaging. PFS was defined from start of first-line therapy to the verified first radiologic progression based on standard restaging imaging or death due to any cause. For this purpose, patients were divided into two groups based on their radiological response: patients with complete or partial remission and patients with stable disease were assigned to the "non-PD" group and compared to patients with "PD". OS was the secondary end point and defined as time from the date of diagnosis till death. Kaplan–Meier survival analysis was performed to estimate progression-free and survival time. Univariate analyses were carried out using the log-rank test. Backward stepwise Cox regression modeling to estimate hazard ratio (HR) with 95% confidence interval (CI) was used to explore independent prognostic factors for PFS and OS. Fisher’s exact test and the Wilcoxon-Mann–Whitney test were carried out to compare independent variables. All statistical analyses were performed using GraphPad Prism Version 9.4.0 (GraphPad Software, Inc., La Jolla, California, USA) and SPSS 26 software Version 26.0.0.0 (IBM Corporation, New York, United States). P values < 0.05 were considered significant.
2.6. Risk Stratification and Classification
The protein levels were determined for CEMIP, COL10A1, HGF, LAMB3, POSTN, SERPINB5, SFN, SPP1, TFF1 and TMPRSS4. In order to illustrate the concentration level of each of the markers, the level of the markers were scaled, independently. In the case of COL10A1, TMPRSS4, CEMIP and KRASmut cfDNA, six levels with drastically higher values in comparison to the other outliers, were excluded to make the general trend of the biomarkers observable. To consider the effect of the therapy in respect to OS and the kinetics of protein levels, a binary variable was provided for each protein as follows: The binary variable represents whether the level of that protein increases or decreases after therapy start for the corresponding patient. For increasing protein level “1” is used and “-1” for decreasing one. For the patients with more than one follow up sample, we decided for the increasing or decreasing trend that most of the samples showed. In case of ties, the first follow up’s binary value was used. We performed the same procedure on the KRASmut cfDNA levels. Each univariate model stratified the patients based on the binary values, independently and was evaluated using log-rank test.
In order to identify a unified signature of the markers using a multivariate CoxPH model [32], the R package GLMnet was used using LASSO and 3-fold cross-validation based on the combination of the binary variables [33,34]. Risk labels were computed using the estimated model. The prognostic potential of the gained model was evaluated using log-rank test.
Using the labels of low and high risk of the patients of the PT-and-UT group provided by the multivariate CoxPH model, a Risk Classifier was trained to classify the patients to the corresponding risk groups. The learning process used the protein levels of the selected biomarkers of the prior to treatment condition as the feature space and the risk labels of the PT-and-UT patients as the labels. Binomial Logistic Regression [33] was applied for learning the classifier with alpha = 0.6 for the setting of the elastic net and 4-fold cross validation. Higher absolute values of the coefficients increases the impact of the corresponding variable on the Risk Classifier.
The Risk Classifier predicted then the risk label of each of PT-and-UT and PT-only patients. Three patients in the PT-and-UT group were misclassified (error rate 16%). In the case of PT-only group, the predicted risk labels were used to provide a Kaplan Meier plot, where the stratification significance was evaluated using log-rank tests.
3. Results
3.1. Patient Characteristics
47 patients with clinically and histologically confirmed mPDAC were included in the study. Clinico-pathological parameters of these stage IV PDAC patients have been published earlier [31]. Additional basic clinical characteristics of the study cohort are summarized in Supplemental Table 1 and 2. 42/47 patients (89.4%) received first-line chemotherapy, 5/47 (10.6%) underwent best supportive care (BSC). Median follow-up time among surviving patients was 9.5 months (95% CI 3.0 – 20.0 months). Median progression-free survival (PFS) was 3.0 months (95% CI 2.0 – 6.0 months), median overall survival (OS) was 9.0 months (5.0 – 13.0 months). At the time of final analysis 41/47 of the patients (87.2%) had died.
3.2. Analysis of Plasma KRASmut cfDNA
A total of 160 blood samples from 47 patients with mPDAC were analyzed in this study using ddPCR. First samples were taken at a median of 7.5 days (95% CI 4-11) prior to start of first-line treatment. Median number of samples collected was three samples per patient (95% CI 2-4). Median time interval between start of therapy and first follow-up was 55 days (95% CI 50 – 62). Mutant KRAS detection rate at baseline was 70.21% (33/47). Thereby, a correlation between KRASmut cfDNA positivity and the presence of liver metastases was shown (P = 0.0015, Supplemental Table 3). PDAC patients with liver metastases also presented significantly higher KRASmut cfDNA copies/ml plasma than patients with metastases located elsewhere (P = 0.0003; Supplemental Figure 1A). For the tumor marker CA 19-9 this difference was less pronounced (P = 0.0178; Supplemental Figure 1C). Regarding tumor grading, there was no difference between well and poorly differentiated tumors and the amount of KRASmut cfDNA or CA 19-9 levels (Supplemental Figures 1B, D). Although KRASmut cfDNA positive patients had higher levels of the tumor marker CA 19-9 (P = 0.0054; Supplemental Figure 1E), there was generally no correlation between the CA 19-9 level and the amount of KRASmut cfDNA in plasma (Supplemental Figure 1F).
3.3. Univariate and Multivariate Analyses of PFS and OS in mPDAC Patients
For the univariate analysis of OS in our cohort of mPDAC patients, 11 independent demographic and clinic-pathologic features were examined, which are presented in Table 1. Four independent variables – namely, tumor differentiation, the number of metastatic sites, administration of systemic treatment and change in levels of KRASmut cfDNA during chemotherapy were identified as prognostic factors. The multivariate Cox proportional hazards regression model showed that KRASmut cfDNA increase at time of the first follow-up (Hazard ratio (HR) = 10.9, 95% CI: 2.589-46.17, P = 0.001) and tumor differentiation (HR = 3.17, 95% CI: 1.175-8.535, P = 0.023) were the only significant factors for survival in our cohort of mPDAC patients (Table 1). Corresponding analyses were also performed for PFS and are presented in Supplemental Table 4. Again, the multivariate Cox proportional hazards regression model showed that KRASmut cfDNA increase at time of the first follow-up (HR = 10.9, 95% CI: 2.575-46.444, P = 0.001) was a significant factor for PFS. Furthermore, the number of metastatic sites (HR = 7.20, 95% CI: 1.149-45.080, P = 0.035), higher Age (HR = 4.39, 95% CI: 1.250-15.42, P = 0.021), tumor location (HR = 0.20, 95% CI: 0.053-0.721, P = 0.014) and CA 19-9 positivity in plasma before the start of systemic treatment (HR = 4.38, 95% CI: 1.180-16.285, P = 0.027) were also shown to be significant variables for PFS.
3.4. Predictive and Prognostic Value of KRASmut cfDNA and CA 19-9
To evaluate the predictive and prognostic relevance of KRASmut cfDNA and CA 19-9 levels, baseline values of these biomarkers before start of palliative first-line treatment were correlated with PFS and OS. Thereby, high KRASmut cfDNA levels (> 25 copies/mL) before start of systemic chemotherapy were inversely associated with PFS (HR = 2.07, 95% CI: 1.011-4.229, P = 0.0057; Figure 1A) and showed also a trend towards inferior OS (HR = 1.72, 95% CI: 0.850-3.489, P = 0.0775; Figure 1B). In addition, detection of a high amount of total cfDNA in plasma was associated with shorter PFS in our study cohort (HR 2.56, 95% CI: 1.217-5.367, P = 0.0002; P < 0.0001; Supplemental Figure 2A), but had no prognostic value (Supplemental Figure 2B). CtDNA positivity before palliative first-line chemotherapy was not associated with inferior PFS and OS in our study cohort (Supplemental Figure 2C, D). Analysis of the tumor marker CA 19-9 prior to therapy also had no predictive or prognostic value in our cohort (Figure 1C, D). A threshold value of 100 U/ml was chosen because previous data showed that this value is not found in healthy individuals without a clinical history of cancer disease [27,35].
3.5. Association of KRASmut cfDNA and CA 19-9 Dynamics with Survival
Protein tumor markers and KRASmut cfDNA are highly dynamic biomarkers. Therefore, in a next step, a second blood sample was analyzed at time of the first follow-up (median after 55 days) and biomarker changes in this time interval were correlated with PFS and OS. For 25/47 (53.2%) patients a sufficient number of follow-up samples was available for subsequent analysis. Increase of KRASmut cfDNA hereby was associated with significantly reduced PFS and OS (Figure 2A, B), while increase of the total amount of cell-free DNA did not correlate with PFS or OS (Supplemental Figure 2E, F). Increase of the tumor marker CA 19-9 was associated with a non-significant trend towards inferior OS but not PFS (Figure 2C, D). Furthermore, the radiological imaging based division into progressive disease (PD) and non-PD at time of first restaging did not show any difference regarding OS (Figure 2G). Interestingly, patients with PD at time of first follow-up already showed elevated KRASmut cfDNA levels in plasma prior to first-line therapy (Figure 1E). Also at time of first follow-up, they showed significantly higher KRASmut cfDNA levels in plasma (Figure 2E). On the contrary, no difference was found for the tumor marker CA 19-9 (Figure 1F, 2F). Corresponding to this, 22/23 patients (95.65 %) who presented with PD at time of first follow-up were positive for KRASmut cfDNA before the start of first-line therapy, whereas 7/11 patients (63.64 %) with stable disease were KRASmut cfDNA negative (Figure 1G). For the tumor marker CA 19-9, no correlation was found (Figure 1H).
3.6. Clinical Response Prediction by Kinetics of KRASmut cfDNA and CA 19-9
Figures 3A and 3B illustrate the correlation between KRASmut cfDNA and CA 19-9 dynamics during first-line therapy and radiologic response to treatment at time of first follow-up. 13/25 patients (52 %) showed PD at the first restaging. Increase of KRASmut cfDNA was hereby significantly associated with PD and outperformed CA 19-9 as dynamic marker (Figure 3C). Overall, kinetics of KRASmut cfDNA analyses nicely reflected individual patients’ course of disease, as illustrated in 6/6 exemplary shown cases (Supplemental Figure 3). Individual patient analyses showed that KRASmut cfDNA is a highly dynamic biomarker, which can be clinically especially relevant for patients with non-elevated CA 19-9 levels. However, prospective studies and larger cohorts are needed to better unravel the temporal relationship between biomarker dynamics and clinical disease course and to investigate the impact on therapeutic strategy.
3.7. Risk Stratification Based on the Kinetics of KRASmut cfDNA and Biomarker Proteins
Out of the total 47 patients in this study, only 19 cases had enough plasma left for ELISA measurements prior to and under therapy (PT-and-UT group). For a set of 17 patients plasma samples prior to therapy were available (PT-only group) and therefore used as the validation set. In order to improve the prognostic impact of KRASmut cfDNA in mPDAC, the role of ten proteins in plasma (CEMIP, COL10A1, HGF, LAMB3, POSTN, SERPINB5, SFN, SPP1, TFF1 and TMPRSS4) was investigated by considering the effect of the first-line therapy. The related genes were previously described as a subset of relevant biomarkers in distinguishing PDAC tissue from normal tissue by RNA sequencing and showed significantly elevated levels in plasma samples of PDAC patients [30]. To examine the prognostic role of these proteins in mPDAC, we referred to the protein levels measured via Enzyme-linked Immunosorbent Assay (ELISA) of two subgroups of patients (scaled values in Supplemental Figure 4D).
As a first step of our analysis, we examined the single biomarker impact on the OS of the prior to and under treatment mPDAC patients (PT-and-UT group) using univariate HR model. Most of the single biomarkers were not able to stratify patients significantly (Supplemental Table 5). However, the prognostic impact of the single proteins of LAMB3 and SERPINB5 was significant, although the corresponding significance was not high (P = 0.044; P = 0.037, labelled with a star, Supplemental Table 5, Supplemental Figure 4A and 4B). The prognostic impact of KRASmut cfDNA is the highest among all of the evaluated markers (P = 0.0042, Supplemental Figure 4C).
Based on the above results, we used a multivariate Cox Proportional Hazard model (CoxPH) model to identify the prognostic biomarkers together with KRASmut cfDNA based on the PT-and-UT group [32,33]. Similar to the previous univariate models, we use the binary variables to consider the kinetics of each protein and the effect of the therapy. However, the binary variables are used together to identify a unified signature of the biomarker proteins and KRASmut cfDNA (Figure 4A). Figure 4B shows the result of the multivariate CoxPH to stratify patients to high or low risk groups (HR = 10.2, 95% CI: 2.03-51.7, P = 0.0014). The significance of the multivariate CoxPH model was improved in comparison to each of the univariant ones. The selected set of prognostic biomarkers identified using LASSO together with related impacts were given in Supplemental Table 6. In detail, the selected set of biomarkers by CoxPH includes KRASmut cfDNA and six other proteins including CEMIP, TFF1, LAMB3, HGF, TMPRSS4 and SERPINB5. CEMIP was the only significant biomarker and the impact was higher as for KRASmut cfDNA.
To predict the therapy response in respect to OS, we used the selected set of markers to classify eligible patients. Patients predicted in the low risk group benefit more likely of further therapy. Based on the selected markers and by using the prior to therapy samples of the PT-and-UT group together with the identified label of low or high risk given by the multivariate CoxPH, a Risk Classifier was provided to predict the label of risk (Supplemental Table 7). The accuracy of the Risk Classifier for the PT-and-UT group is 84%. The actual risk label of each PT-and-UT patient and the predicted one by the Risk Classifier is given in the Supplemental Table 8.
The Risk Classifier was applied to recognize the risk label of the PT-only group to predict the therapy response in respect to OS. The OS Kaplan Meier plot of Fig 4C based on the predicted risk labels by the Risk Classifier presents an acceptable separation within the PT-only group, although not significant (P = 0.17). We believe that a higher number of patients especially with under therapy samples are necessary to validate the Risk Classifier. However, the Risk Classifier showed a significant prognostic performance for all available patients’ data of prior to therapy samples (P = 0.043, Figure 4D).
4. Discussion
Within this single-center exploratory study, we followed a cohort of 47 mPDAC patients undergoing palliative first-line treatment or BSC at our institution. We analyzed KRASmut cfDNA using previously established highly sensitive single-target and discriminatory multi-target ddPCR assays [31]. Results were integrated with CA19-9 levels and ten protein biomarkers markers (CEMIP, TFF1, LAMB3, HGF, TMPRSS4, SERPINB5, SPP1, POSTN, TFF1, COL10A1) for association with progression-free and overall survival endpoints. Over the past decades numerous studies have demonstrated the predictive and prognostic significance of ctDNA for closer disease monitoring in pancreatic cancer [19,20,21,23,24,36,37,38,39,40]. To our best knowledge, even today there are only limited data on the serial analysis of ctDNA in advanced or mPDAC available [20,21,22,24]. What takes our study apart is the combined longitudinal analysis of KRASmut cfDNA and novel protein biomarkers overcoming limitations of single-parameter based methods, enabling risk stratification, and molecular monitoring of patients with mPDAC. Our study highlights the importance of KRASmut cfDNA serial monitoring as a sensitive and highly specific biomarker for therapy response and disease progression. The use of discriminatory multi-target ddPCR assays herby allows for direct KRAS SNV detection without prior tumor NGS making it possible to assess tumor dynamics in a time relevant co-clinical setting analogous to CA19-9 levels [31,41]. Increase of KRASmut cfDNA during first-line palliative treatment in our study cohort was significantly associated with shorter progression-free and overall survival and outperformed CA 19-9 kinetics and standard imaging. In particular, for patients not expressing CA 19-9 or lacking dynamic changes of the tumor marker during systemic treatment analysis of ctDNA in plasma might provide additional diagnostic benefit. However, each individual method has its specific advantages and limitations and possibly only the combination and integration of different methodological approaches can meet all clinical requirements. For our cohort integrated analysis of KRASmut cfDNA combined with six evaluated circulating protein biomarkers, allowed basal risk stratification at time of first follow-up. Yet, routine clinical assessment of dynamic ctDNA changes and protein expression patterns during systemic treatment of mPDAC using a standardized approach is lacking.
Still today systemic treatment options for pancreatic cancer are limited to a small number of combination chemotherapy regimens [42,43] and new attempts in personalized treatment based on molecular profiling [44,45]. Given the fact that according to the current literature only approximately 50% of PDAC patients receive further line treatment, early switch of chemotherapy in case of lack of response is crucial [42,46]. Thus, we advocate serial ctDNA analysis to assess response dynamics within a time-relevant framework. KRASmut cfDNA guided therapy monitoring in pancreatic cancer appears feasible, but still requires extensive validation in prospective clinical trials to investigate whether treatment decisions based on serial ctDNA assessment results in improved outcome of PDAC patients.
Nevertheless, there are also some limitations of our study. Subgroup analyses of the present study were performed with a relatively small number of metastasized PDAC patients and survival outcomes were correlated retrospectively. Thus, results are of an exploratory nature and only hypothesis generating. In contrast to previously published data [22,24,47,48,49], KRASmut cfDNA positivity prior to palliative first-line therapy was not associated with shorter PFS and OS in our cohort. However, high KRASmut cfDNA levels (> 25 copies/mL) before start of systemic chemotherapy were associated with significantly reduced PFS and showed a trend towards inferior OS, highlighting the importance of identifying clinically validated cut-offs for ctDNA analysis [18,50,51]. Interestingly, Del Re et al. [20] also found no association between KRASmut cfDNA positivity prior to palliative first-line therapy and survival endpoints. Also in this study highly sensitive ddPCR was used to detect ctDNA in plasma and KRASmut cfDNA detection rate of 70.4% at baseline was identical to the detection rate in our study, whereas in previously published studies detectability ranged from 0% to 62.2% [48,49,52]. The significantly higher positivity rate could be another possible explanation for the lack of association with survival endpoints.
In summary, our pilot study proposed a clinically feasible way to assay KRASmut cfDNA in plasma together with novel protein biomarkers in mPDAC patients and outperformed CA 19-9. Through combination of those markers, patients could be better stratified in terms of treatment response and overall prognosis.
Author Contributions
Conceptualization, S.H., M.B. and R.F.; methodology, S.H., E.H. and M.H.; validation, S.H. and M.H.; formal analysis, S.H., M.H., M.B. and R.F.; writing—original draft preparation, S.H. and R.F.; writing—review and editing, all authors; visualization, , S.H., M.H., M.B. and R.F.; supervision, R.F. and M.B.; project administration, J.D., U.W., R.F. and M.B.; All authors have read and agreed to the published version of the manuscript.
Funding
This work was supported by Foerdergesellschaft Stiftung Tumorbiologie, Freiburg, Germany, and a Comprehensive Cancer Center Freiburg (CCCF) Research Grant, by the Deutsche Forschungsgemeinschaft (DFG CRC-850 subprojects C9 to R.F. and M.B. and Z1 to M. B. and by the German Federal Ministry of Education and Research (BMBF) within the framework of the e:Med research and funding concept CoNfirm (FKZ 01ZX1708F to M. B.).
Institutional Review Board Statement
All patients gave written informed consent to collection and analysis of blood samples. Local institutional review board (IRB) approved all relevant procedures and analyses (EK-Freiburg project number 46/18).
Informed Consent Statement
Informed consent was obtained from all subjects involved in the study.
Data Availability Statement
The datasets used and/or analyzed during the current study are available from the corresponding author on reasonable request.
Acknowledgments
S.H. was recipient of a DGHO-GMIHO thesis fellowship and later of a KRAK Physician Scientist Fellowship provided by the Science Foundation for Oncology (SFO) and of a «Filling the Gap» 2024-2025 – Siegenthaler Fellowship.
Conflicts of Interest
The authors declare that they have no competing interests.
References
- Ryan, D.P.; Hong, T.S.; Bardeesy, N. Pancreatic Adenocarcinoma. 2014, 371, 1039-1049. [CrossRef]
- Rawla, P.; Sunkara, T.; Gaduputi, V. Epidemiology of Pancreatic Cancer: Global Trends, Etiology and Risk Factors. World journal of oncology 2019, 10, 10–27. [Google Scholar] [CrossRef] [PubMed]
- Jones, S.; Zhang, X.; Parsons, D.W.; Lin, J.C.-H.; Leary, R.J.; Angenendt, P.; Mankoo, P.; Carter, H.; Kamiyama, H.; Jimeno, A.; et al. Core signaling pathways in human pancreatic cancers revealed by global genomic analyses. Science 2008, 321, 1801–1806. [Google Scholar] [CrossRef] [PubMed]
- Witkiewicz, A.K.; McMillan, E.A.; Balaji, U.; Baek, G.; Lin, W.-C.; Mansour, J.; Mollaee, M.; Wagner, K.-U.; Koduru, P.; Yopp, A.; et al. Whole-exome sequencing of pancreatic cancer defines genetic diversity and therapeutic targets. Nat Commun 2015, 6, 6744–6744. [Google Scholar] [CrossRef] [PubMed]
- Waddell, N.; Pajic, M.; Patch, A.-M.; Chang, D.K.; Kassahn, K.S.; Bailey, P.; Johns, A.L.; Miller, D.; Nones, K.; Quek, K.; et al. Whole genomes redefine the mutational landscape of pancreatic cancer. Nature 2015, 518, 495–501. [Google Scholar] [CrossRef]
- Locker, G.Y.; Hamilton, S.; Harris, J.; Jessup, J.M.; Kemeny, N.; Macdonald, J.S.; Somerfield, M.R.; Hayes, D.F.; Bast, R.C., Jr. ASCO 2006 update of recommendations for the use of tumor markers in gastrointestinal cancer. Journal of clinical oncology : official journal of the American Society of Clinical Oncology 2006, 24, 5313–5327. [Google Scholar] [CrossRef]
- Lennon, A.M.; Goggins, M. Diagnostic and Therapeutic Response Markers. In Pancreatic Cancer; Springer New York: New York, NY, 2010; pp. 675–701. [Google Scholar]
- Poruk, K.E.; Gay, D.Z.; Brown, K.; Mulvihill, J.D.; Boucher, K.M.; Scaife, C.L.; Firpo, M.A.; Mulvihill, S.J. The clinical utility of CA 19-9 in pancreatic adenocarcinoma: diagnostic and prognostic updates. Curr Mol Med 2013, 13, 340–351. [Google Scholar] [CrossRef]
- Ballehaninna, U.K.; Chamberlain, R.S. The clinical utility of serum CA 19-9 in the diagnosis, prognosis and management of pancreatic adenocarcinoma: An evidence based appraisal. J Gastrointest Oncol 2012, 3, 105–119. [Google Scholar] [CrossRef]
- Goggins, M. Molecular Markers of Early Pancreatic Cancer. Journal of Clinical Oncology 2005, 23, 4524–4531. [Google Scholar] [CrossRef]
- Alix-Panabières, C.; Pantel, K. Clinical Applications of Circulating Tumor Cells and Circulating Tumor DNA as Liquid Biopsy. Cancer discovery 2016, 6, 479–491. [Google Scholar] [CrossRef]
- Bettegowda, C.; Sausen, M.; Leary, R.J.; Kinde, I.; Wang, Y.; Agrawal, N.; Bartlett, B.R.; Wang, H.; Luber, B.; Alani, R.M.; et al. Detection of circulating tumor DNA in early- and late-stage human malignancies. Science translational medicine 2014, 6, 224ra224. [Google Scholar] [CrossRef]
- Diaz, L.A., Jr.; Bardelli, A. Liquid biopsies: genotyping circulating tumor DNA. Journal of clinical oncology : official journal of the American Society of Clinical Oncology 2014, 32, 579–586. [Google Scholar] [CrossRef] [PubMed]
- Macías, M.; Alegre, E.; Díaz-Lagares, A.; Patiño, A.; Pérez-Gracia, J.L.; Sanmamed, M.; López-López, R.; Varo, N.; González, A. Liquid Biopsy: From Basic Research to Clinical Practice. Advances in clinical chemistry 2018, 83, 73–119. [Google Scholar] [CrossRef] [PubMed]
- Diehl, F.; Schmidt, K.; Choti, M.A.; Romans, K.; Goodman, S.; Li, M.; Thornton, K.; Agrawal, N.; Sokoll, L.; Szabo, S.A.; et al. Circulating mutant DNA to assess tumor dynamics. Nat Med 2008, 14, 985–990. [Google Scholar] [CrossRef] [PubMed]
- Diaz, L.A., Jr.; Williams, R.T.; Wu, J.; Kinde, I.; Hecht, J.R.; Berlin, J.; Allen, B.; Bozic, I.; Reiter, J.G.; Nowak, M.A.; et al. The molecular evolution of acquired resistance to targeted EGFR blockade in colorectal cancers. Nature 2012, 486, 537–540. [Google Scholar] [CrossRef] [PubMed]
- Misale, S.; Yaeger, R.; Hobor, S.; Scala, E.; Janakiraman, M.; Liska, D.; Valtorta, E.; Schiavo, R.; Buscarino, M.; Siravegna, G.; et al. Emergence of KRAS mutations and acquired resistance to anti-EGFR therapy in colorectal cancer. Nature 2012, 486, 532–536. [Google Scholar] [CrossRef]
- Crowley, E.; Di Nicolantonio, F.; Loupakis, F.; Bardelli, A. Liquid biopsy: monitoring cancer-genetics in the blood. Nature Reviews Clinical Oncology 2013, 10, 472–484. [Google Scholar] [CrossRef]
- Watanabe, F.; Suzuki, K.; Tamaki, S.; Abe, I.; Endo, Y.; Takayama, Y.; Ishikawa, H.; Kakizawa, N.; Saito, M.; Futsuhara, K.; et al. Longitudinal monitoring of KRAS-mutated circulating tumor DNA enables the prediction of prognosis and therapeutic responses in patients with pancreatic cancer. PLoS One 2019, 14, e0227366–e0227366. [Google Scholar] [CrossRef]
- Del Re, M.; Vivaldi, C.; Rofi, E.; Vasile, E.; Miccoli, M.; Caparello, C.; d’Arienzo, P.D.; Fornaro, L.; Falcone, A.; Danesi, R. Early changes in plasma DNA levels of mutant KRAS as a sensitive marker of response to chemotherapy in pancreatic cancer. Sci Rep 2017, 7, 7931. [Google Scholar] [CrossRef]
- Kruger, S.; Heinemann, V.; Ross, C.; Diehl, F.; Nagel, D.; Ormanns, S.; Liebmann, S.; Prinz-Bravin, I.; Westphalen, C.B.; Haas, M.; et al. Repeated mutKRAS ctDNA measurements represent a novel and promising tool for early response prediction and therapy monitoring in advanced pancreatic cancer. Annals of Oncology 2018, 29, 2348–2355. [Google Scholar] [CrossRef]
- Perets, R.; Greenberg, O.; Shentzer, T.; Semenisty, V.; Epelbaum, R.; Bick, T.; Sarji, S.; Ben-Izhak, O.; Sabo, E.; Hershkovitz, D. Mutant KRAS Circulating Tumor DNA Is an Accurate Tool for Pancreatic Cancer Monitoring. Oncologist 2018, 23, 566–572. [Google Scholar] [CrossRef]
- Pietrasz, D.; Pécuchet, N.; Garlan, F.; Didelot, A.; Dubreuil, O.; Doat, S.; Imbert-Bismut, F.; Karoui, M.; Vaillant, J.C.; Taly, V.; et al. Plasma Circulating Tumor DNA in Pancreatic Cancer Patients Is a Prognostic Marker. Clinical cancer research : an official journal of the American Association for Cancer Research 2017, 23, 116–123. [Google Scholar] [CrossRef] [PubMed]
- Schlick, K.; Markus, S.; Huemer, F.; Ratzinger, L.; Zaborsky, N.; Clemens, H.; Neureiter, D.; Neumayer, B.; Beate, A.-S.; Florian, S.; et al. Evaluation of circulating cell-free KRAS mutational status as a molecular monitoring tool in patients with pancreatic cancer. Pancreatology 2021, 21, 1466–1471. [Google Scholar] [CrossRef] [PubMed]
- Hindson, B.J.; Ness, K.D.; Masquelier, D.A.; Belgrader, P.; Heredia, N.J.; Makarewicz, A.J.; Bright, I.J.; Lucero, M.Y.; Hiddessen, A.L.; Legler, T.C.; et al. High-throughput droplet digital PCR system for absolute quantitation of DNA copy number. Anal Chem 2011, 83, 8604–8610. [Google Scholar] [CrossRef] [PubMed]
- Hindson, C.M.; Chevillet, J.R.; Briggs, H.A.; Gallichotte, E.N.; Ruf, I.K.; Hindson, B.J.; Vessella, R.L.; Tewari, M. Absolute quantification by droplet digital PCR versus analog real-time PCR. Nature Methods 2013, 10, 1003–1005. [Google Scholar] [CrossRef]
- Cohen, J.D.; Javed, A.A.; Thoburn, C.; Wong, F.; Tie, J.; Gibbs, P.; Schmidt, C.M.; Yip-Schneider, M.T.; Allen, P.J.; Schattner, M.; et al. Combined circulating tumor DNA and protein biomarker-based liquid biopsy for the earlier detection of pancreatic cancers. 2017, 114, 10202-10207. J Proceedings of the National Academy of Sciences. [CrossRef]
- Honda, K.; Kobayashi, M.; Okusaka, T.; Rinaudo, J.A.; Huang, Y.; Marsh, T.; Sanada, M.; Sasajima, Y.; Nakamori, S.; Shimahara, M.; et al. Plasma biomarker for detection of early stage pancreatic cancer and risk factors for pancreatic malignancy using antibodies for apolipoprotein-AII isoforms. Sci Rep 2015, 5, 15921–15921. [Google Scholar] [CrossRef]
- Borrebaeck, C.A.K. Precision diagnostics: moving towards protein biomarker signatures of clinical utility in cancer. Nature Reviews Cancer 2017, 17, 199–204. [Google Scholar] [CrossRef]
- Klett, H.; Fuellgraf, H.; Levit-Zerdoun, E.; Hussung, S.; Kowar, S.; Küsters, S.; Bronsert, P.; Werner, M.; Wittel, U.; Fritsch, R.; et al. Identification and Validation of a Diagnostic and Prognostic Multi-Gene Biomarker Panel for Pancreatic Ductal Adenocarcinoma. Frontiers in genetics 2018, 9, 108–108. [Google Scholar] [CrossRef]
- Hussung, S.; Follo, M.; Klar, R.F.U.; Michalczyk, S.; Fritsch, K.; Nollmann, F.; Hipp, J.; Duyster, J.; Scherer, F.; von Bubnoff, N.; et al. Development and Clinical Validation of Discriminatory Multitarget Digital Droplet PCR Assays for the Detection of Hot Spot KRAS and NRAS Mutations in Cell-Free DNA. The Journal of Molecular Diagnostics 2020, 22, 943–956. [Google Scholar] [CrossRef]
- Cox, D.R. Regression Models and Life-Tables. Journal of the Royal Statistical Society. Series B (Methodological) 1972, 34, 187–220. [Google Scholar] [CrossRef]
- Friedman, J.; Hastie, T.; Tibshirani, R. Regularization Paths for Generalized Linear Models via Coordinate Descent. J Stat Softw 2010, 33, 1–22. [Google Scholar] [CrossRef]
- 2018), R.C.T. R: A Language and Environment for Statistical Computing. R Foundation for Statistical Computing, Vienna. Available online: https://www.R-project.org (accessed on.
- Kim, J.E.; Lee, K.T.; Lee, J.K.; Paik, S.W.; Rhee, J.C.; Choi, K.W. Clinical usefulness of carbohydrate antigen 19-9 as a screening test for pancreatic cancer in an asymptomatic population. Journal of gastroenterology and hepatology 2004, 19, 182–186. [Google Scholar] [CrossRef] [PubMed]
- Bernard, V.; Kim, D.U.; San Lucas, F.A.; Castillo, J.; Allenson, K.; Mulu, F.C.; Stephens, B.M.; Huang, J.; Semaan, A.; Guerrero, P.A.; et al. Circulating Nucleic Acids Are Associated With Outcomes of Patients With Pancreatic Cancer. Gastroenterology 2019, 156, 108–118.e104. [Google Scholar] [CrossRef] [PubMed]
- Sausen, M.; Phallen, J.; Adleff, V.; Jones, S.; Leary, R.J.; Barrett, M.T.; Anagnostou, V.; Parpart-Li, S.; Murphy, D.; Kay Li, Q.; et al. Clinical implications of genomic alterations in the tumour and circulation of pancreatic cancer patients. Nat Commun 2015, 6, 7686–7686. [Google Scholar] [CrossRef] [PubMed]
- Cheng, H.; Liu, C.; Jiang, J.; Luo, G.; Lu, Y.; Jin, K.; Guo, M.; Zhang, Z.; Xu, J.; Liu, L.; et al. Analysis of ctDNA to predict prognosis and monitor treatment responses in metastatic pancreatic cancer patients. International journal of cancer 2017, 140, 2344–2350. [Google Scholar] [CrossRef]
- Patel, H.; Okamura, R.; Fanta, P.; Patel, C.; Lanman, R.B.; Raymond, V.M.; Kato, S.; Kurzrock, R. Clinical correlates of blood-derived circulating tumor DNA in pancreatic cancer. J Hematol Oncol 2019, 12, 130–130. [Google Scholar] [CrossRef]
- Gall, T.M.H.; Belete, S.; Khanderia, E.; Frampton, A.E.; Jiao, L.R. Circulating Tumor Cells and Cell-Free DNA in Pancreatic Ductal Adenocarcinoma. The American journal of pathology 2019, 189, 71–81. [Google Scholar] [CrossRef]
- Hussung, S.; Akhoundova, D.; Hipp, J.; Follo, M.; Klar, R.F.U.; Philipp, U.; Scherer, F.; von Bubnoff, N.; Duyster, J.; Boerries, M.; et al. Longitudinal analysis of cell-free mutated KRAS and CA 19–9 predicts survival following curative resection of pancreatic cancer. BMC Cancer 2021, 21, 49. [Google Scholar] [CrossRef]
- Conroy, T.; Hammel, P.; Hebbar, M.; Ben Abdelghani, M.; Wei, A.C.; Raoul, J.L.; Choné, L.; Francois, E.; Artru, P.; Biagi, J.J.; et al. FOLFIRINOX or Gemcitabine as Adjuvant Therapy for Pancreatic Cancer. N Engl J Med 2018, 379, 2395–2406. [Google Scholar] [CrossRef]
- Von Hoff, D.D.; Ervin, T.; Arena, F.P.; Chiorean, E.G.; Infante, J.; Moore, M.; Seay, T.; Tjulandin, S.A.; Ma, W.W.; Saleh, M.N.; et al. Increased Survival in Pancreatic Cancer with nab-Paclitaxel plus Gemcitabine. New England Journal of Medicine 2013, 369, 1691–1703. [Google Scholar] [CrossRef]
- Golan, T.; Hammel, P.; Reni, M.; Van Cutsem, E.; Macarulla, T.; Hall, M.J.; Park, J.-O.; Hochhauser, D.; Arnold, D.; Oh, D.-Y.; et al. Maintenance Olaparib for Germline BRCA-Mutated Metastatic Pancreatic Cancer. New England Journal of Medicine 2019, 381, 317–327. [Google Scholar] [CrossRef]
- Reiss, K.A.; Mick, R.; O'Hara, M.H.; Teitelbaum, U.; Karasic, T.B.; Schneider, C.; Cowden, S.; Southwell, T.; Romeo, J.; Izgur, N.; et al. Phase II Study of Maintenance Rucaparib in Patients With Platinum-Sensitive Advanced Pancreatic Cancer and a Pathogenic Germline or Somatic Variant in BRCA1, BRCA2, or PALB2. Journal of clinical oncology : official journal of the American Society of Clinical Oncology 2021, 39, 2497–2505. [Google Scholar] [CrossRef] [PubMed]
- Hegewisch-Becker, S.; Aldaoud, A.; Wolf, T.; Krammer-Steiner, B.; Linde, H.; Scheiner-Sparna, R.; Hamm, D.; Jänicke, M.; Marschner, N. Results from the prospective German TPK clinical cohort study: Treatment algorithms and survival of 1,174 patients with locally advanced, inoperable, or metastatic pancreatic ductal adenocarcinoma. International journal of cancer 2019, 144, 981–990. [Google Scholar] [CrossRef] [PubMed]
- Kinugasa, H.; Nouso, K.; Miyahara, K.; Morimoto, Y.; Dohi, C.; Tsutsumi, K.; Kato, H.; Matsubara, T.; Okada, H.; Yamamoto, K. Detection of K-ras gene mutation by liquid biopsy in patients with pancreatic cancer. Cancer 2015, 121, 2271–2280. [Google Scholar] [CrossRef] [PubMed]
- Castells, A.; Puig, P.; Móra, J.; Boadas, J.; Boix, L.; Urgell, E.; Solé, M.; Capellà, G.; Lluís, F.; Fernández-Cruz, L.; et al. K-ras mutations in DNA extracted from the plasma of patients with pancreatic carcinoma: diagnostic utility and prognostic significance. Journal of clinical oncology : official journal of the American Society of Clinical Oncology 1999, 17, 578–584. [Google Scholar] [CrossRef]
- Chen, H.; Tu, H.; Meng, Z.Q.; Chen, Z.; Wang, P.; Liu, L.M. K-ras mutational status predicts poor prognosis in unresectable pancreatic cancer. Eur J Surg Oncol 2010, 36, 657–662. [Google Scholar] [CrossRef]
- Fleischhacker, M.; Schmidt, B. Circulating nucleic acids (CNAs) and cancer--a survey. Biochimica et biophysica acta 2007, 1775, 181–232. [Google Scholar] [CrossRef]
- Bronkhorst, A.J.; Ungerer, V.; Holdenrieder, S. The emerging role of cell-free DNA as a molecular marker for cancer management. Biomol Detect Quantif 2019, 17, 100087–100087. [Google Scholar] [CrossRef]
- Marchese, R.; Muleti, A.; Pasqualetti, P.; Bucci, B.; Stigliano, A.; Brunetti, E.; De Angelis, M.; Mazzoni, G.; Tocchi, A.; Brozzetti, S. Low correspondence between K-ras mutations in pancreatic cancer tissue and detection of K-ras mutations in circulating DNA. Pancreas 2006, 32, 171–177. [Google Scholar] [CrossRef]
Figure 1.
Association of KRASmut cfDNA and CA 19-9 detection with survival endpoints. (A, B) Kaplan-Meier estimates of PFS (A) and OS (B) for metastatic PDAC patients with versus without high KRASmut cfDNA levels (> 25 copies/mL) before the start of first-line systemic treatment. (C, D) Kaplan-Meier estimates of PFS (C) and OS (D) for metastatic PDAC patients with versus without elevated CA 19-9 levels before start of first-line systemic treatment. (E, F) Association of KRASmut cfDNA (E) and CA 19-9 (F) levels prior to start of systemic treatment with radiologic response at first restaging (non-progressive vs. progressive disease). (G, H) Association of KRASmut cfDNA (G) and CA 19-9 (H) positivity prior to start of systemic treatment with radiologic response at first restaging (non-progressive vs. progressive disease). MR, mixed response; OS, overall survival; PD, progressive disease; PDAC, pancreatic adenocarcinoma; PFS, progression-free survival; PR, partial response; SD, stable disease. *P < 0,05, **P < 0,01 und ***P < 0,001.
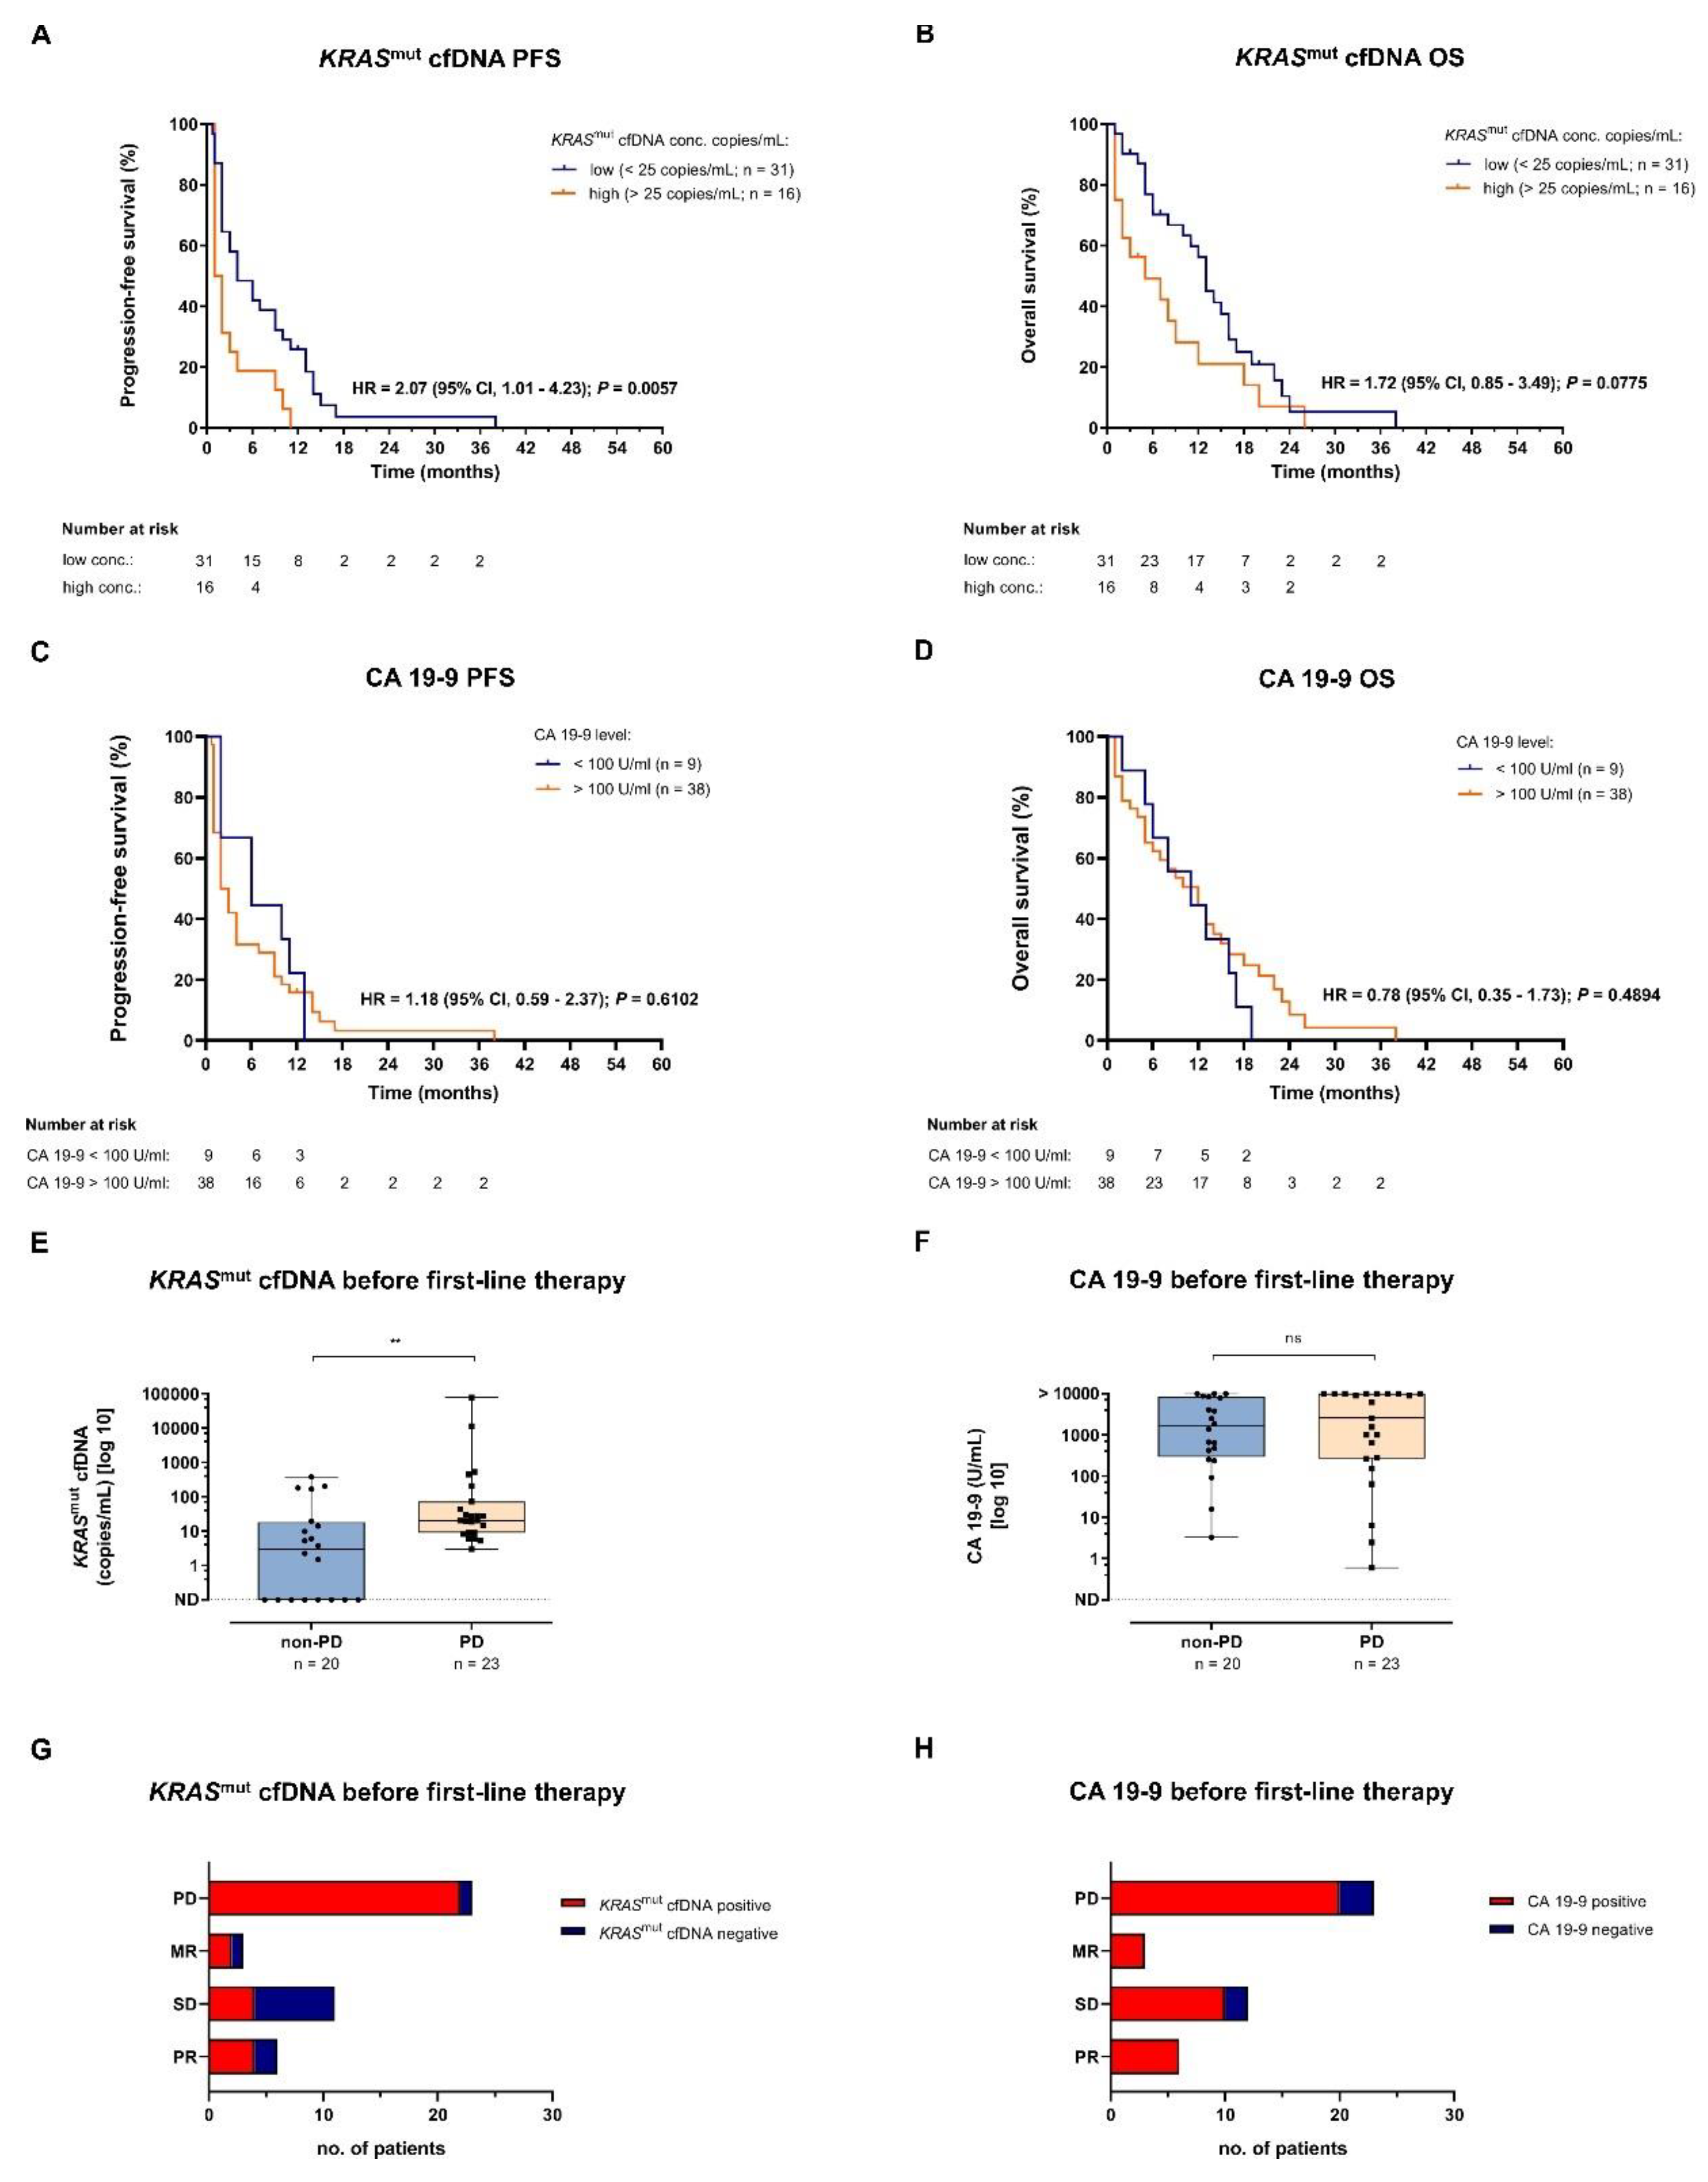
Figure 2.
Progression-free survival (PFS) and overall survival (OS) analyses for metastasized PDAC patients undergoing first-line systemic treatment. (A, B) Kaplan-Meier estimates of PFS (A) and OS (B) for metastasized PDAC patients stratified by change in KRASmut cfDNA levels at time of first restaging: KRASmut cfDNA decrease/stable versus increase. (C, D) Kaplan-Meier estimates of PFS (C) and OS (D) for metastatic PDAC patients stratified by change in CA 19-9 levels at time of first follow-up: CA 19-9 decrease/stable versus increase. (E, F) Association of KRASmut cfDNA (E) and CA 19-9 (F) levels and radiologic response to first-line therapy at first follow-up. (G) Kaplan-Meier estimate of OS for metastasized PDAC patients stratified by radiological response at time of first restaging: non-PD versus PD. PD, progressive disease; PDAC, pancreatic ductal adenocarcinoma. *P < 0,05, **P < 0,01 und ***P < 0,001.
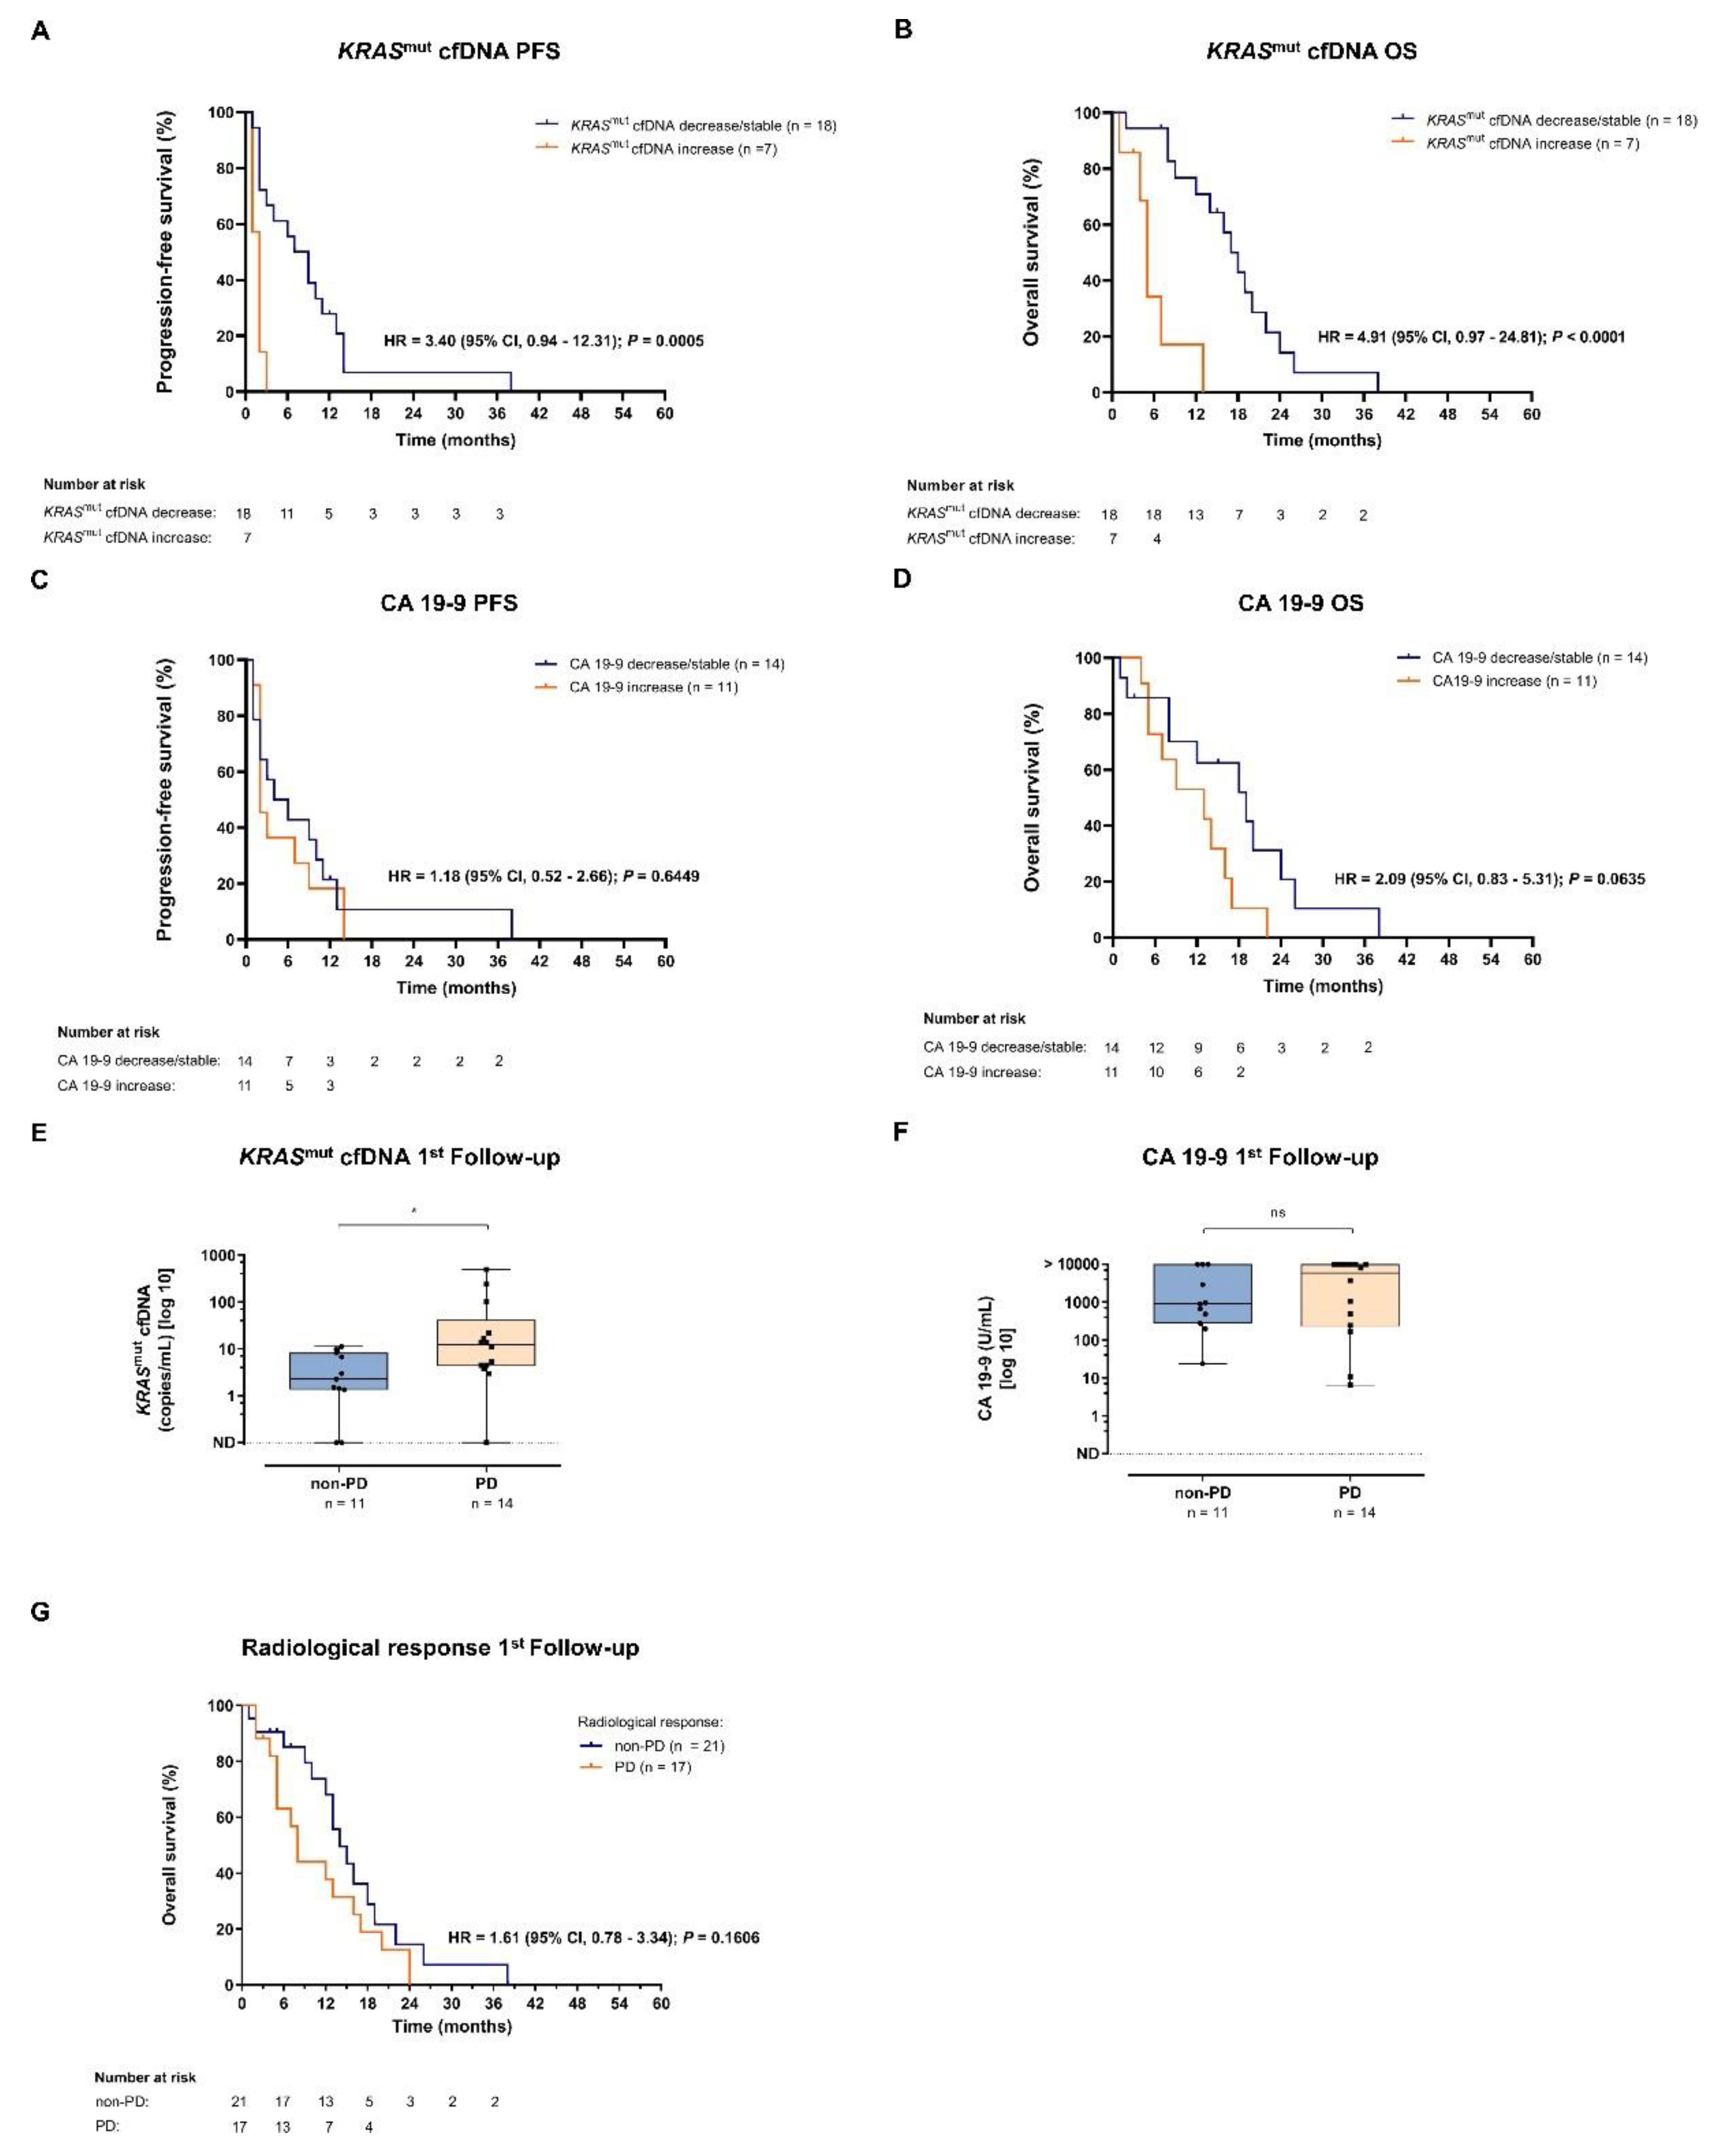
Figure 3.
Clinical response prediction by kinetics of KRASmut cfDNA and CA 19-9. (A, B) According to their radiological response to first-line therapy metastatic PDAC patients were divided into two groups: patients with non-PD vs. with PD. Absolut levels of KRASmut cfDNA (A) and CA 19-9 (B) were normalized to the respective pre-treatment levels for each individual patient. (C) PD vs. non-PD patients with increase in KRASmut cfDNA or CA 19-9 level during observation period. Fisher’s exact test was used to interrogate for statistical significance between the two groups. P values < 0.05 were considered significant.
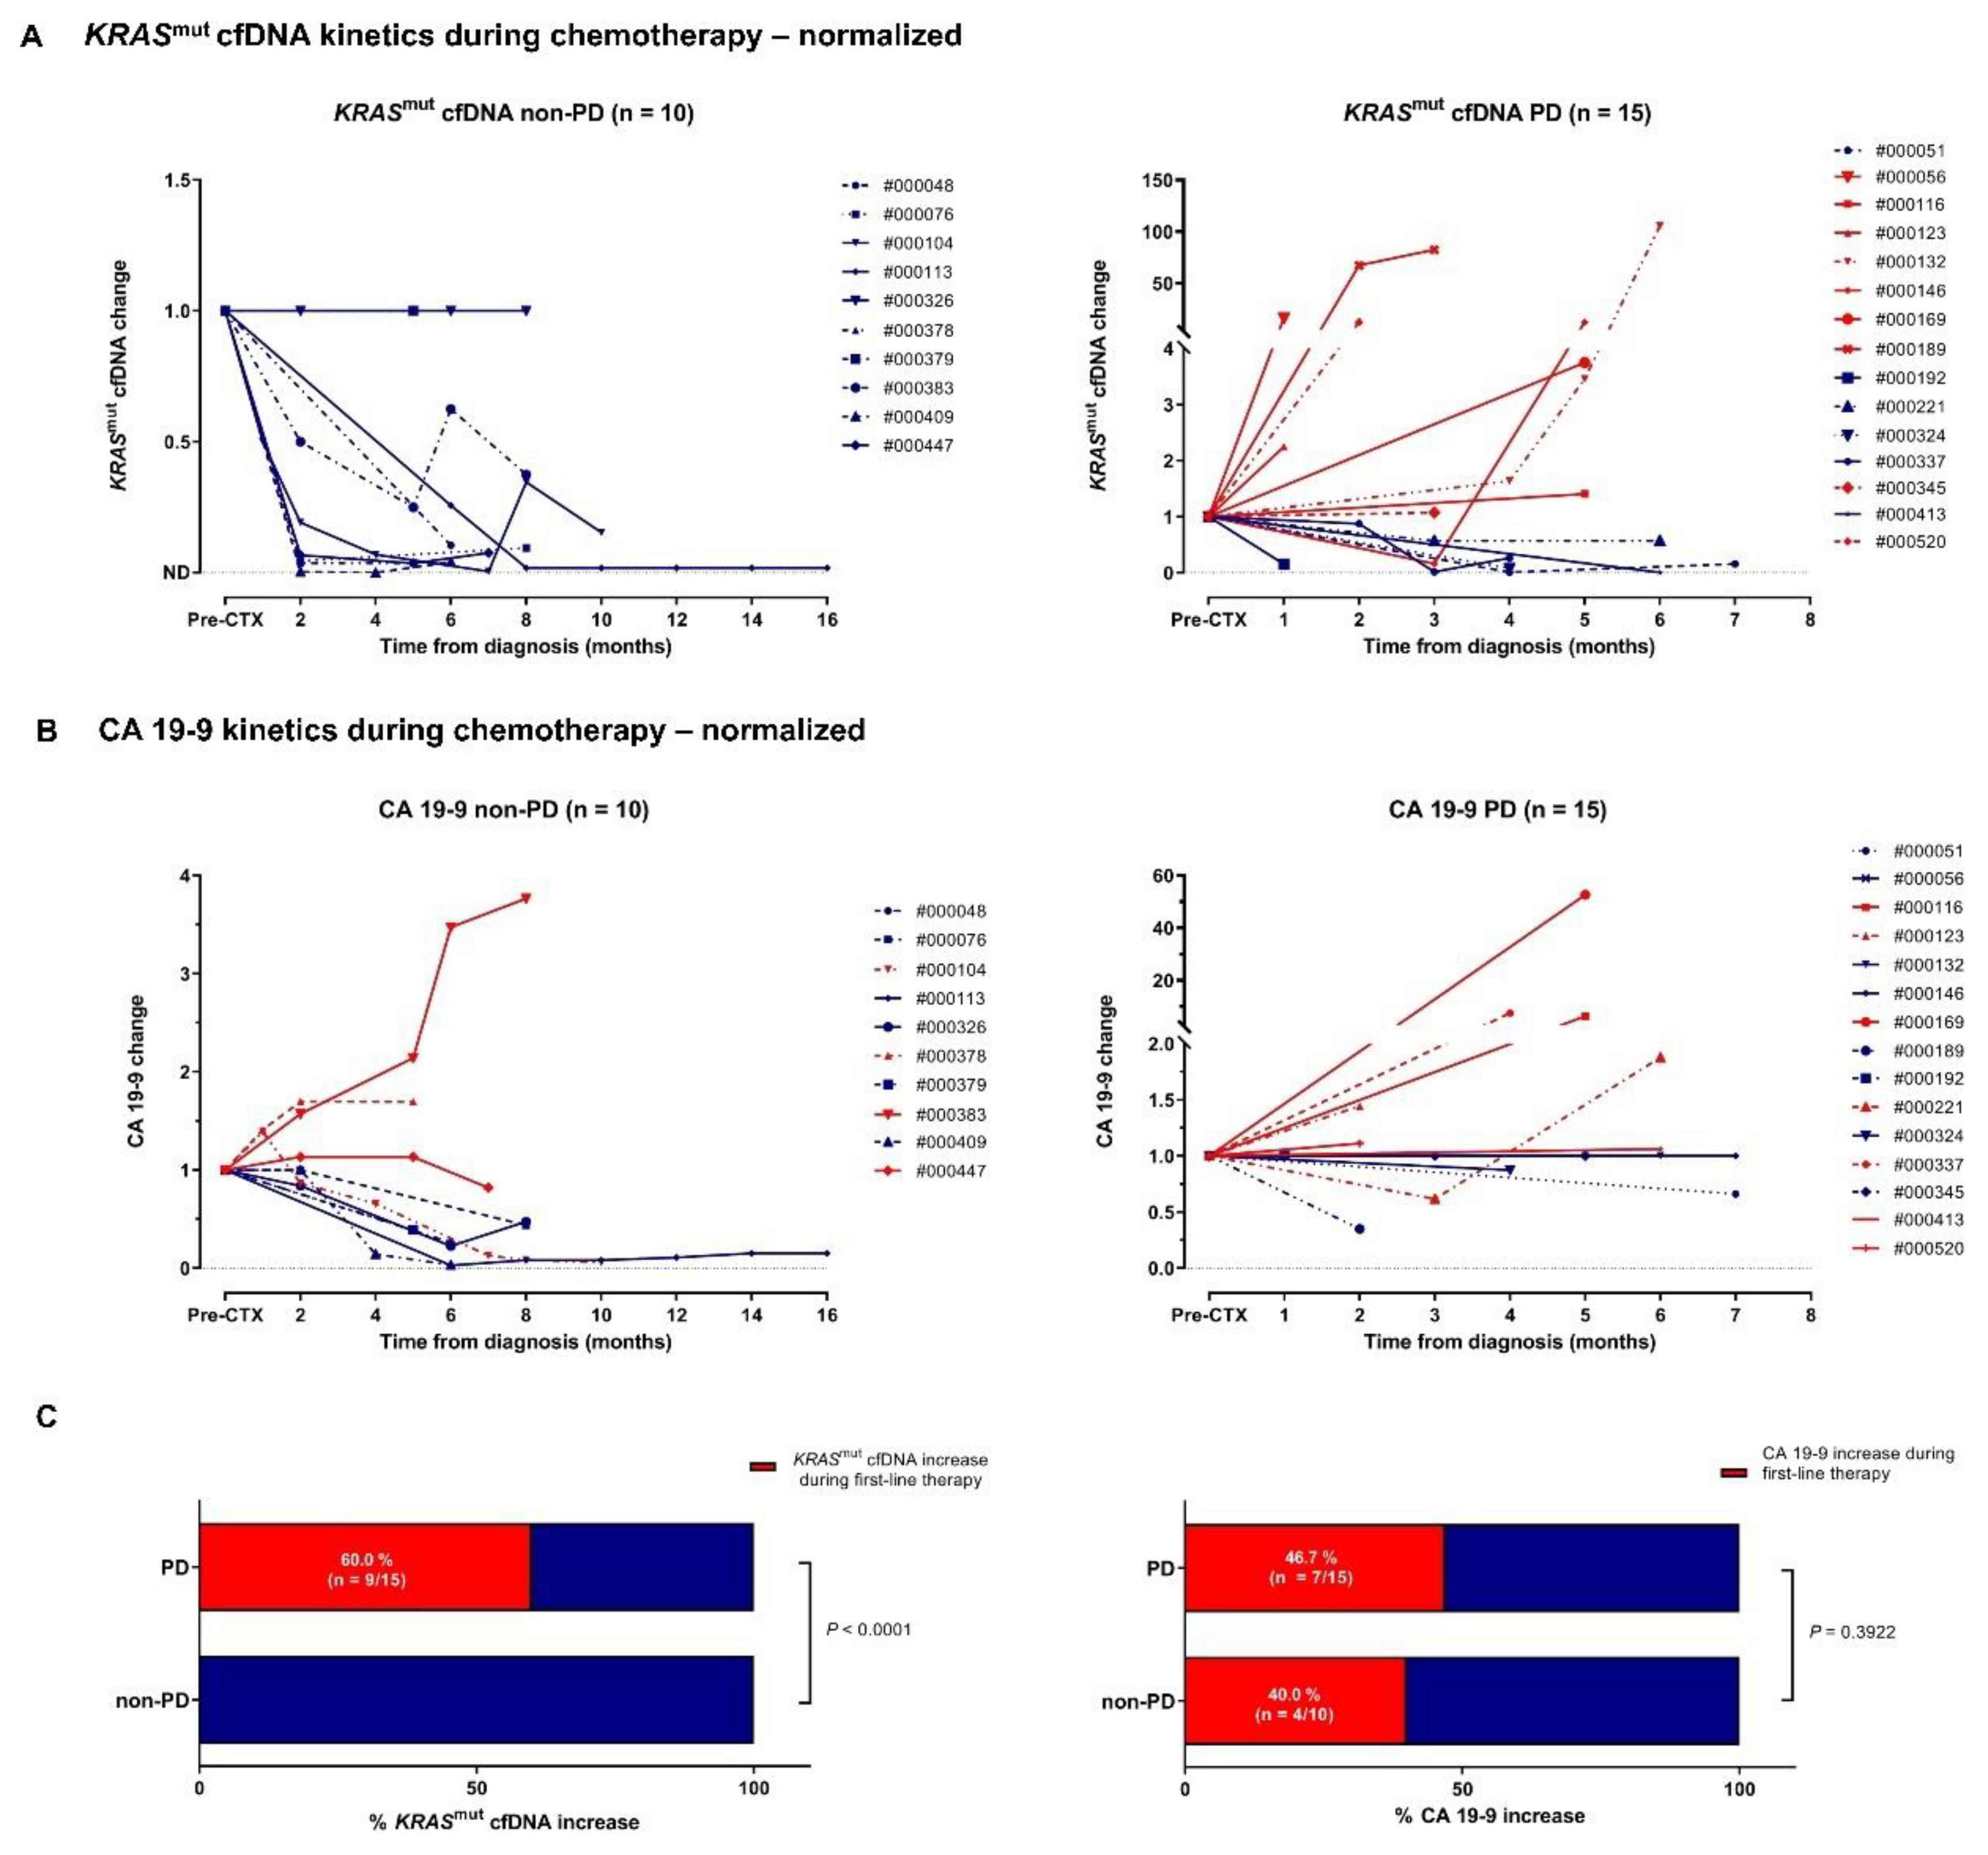
Figure 4.
Risk stratification based on the kinetics of biomarkers. (A) Scheme of the risk stratification. Patients’ plasma samples were used for determination of cfDNA and biomarker protein levels. Samples were divided into PT-and-UT and PT-only group. Binarized PT-and-UT group values were used for multivariate CoxPH model regularized using LASSO to identify biomarkers and to categorize patient to high and low risk groups. The provided labels by CoxPH together with the prior to therapy protein levels were further used to train the Risk Classifier. Protein levels of the PT-only group were used as the test dataset of the Risk Classifier. The feature selection of the test and training data was accomplished based on the biomarkers identified by the CoxPH (LASSO). (B) By applying the multivariate CoxPH model and based on the impact of the therapy on the kinetics of six proteins and the KRASmut cfDNA, PT-and-UT group patients were stratified in low (blue) and high risk (yellow) groups. This Figure presents the details of the brown box of the Fig 4.A. (C) Kaplan-Meier plot of PT-only group, in which the risk label of the patients were estimated using the Risk Classifier. (D) Kaplan Meier plot of all available patients including training and test sets, in which the related risk labels were estimated by the Risk Classifier. Log-rank test was used to provide the statistical significance of the stratification of the two groups in the plots of B-D.
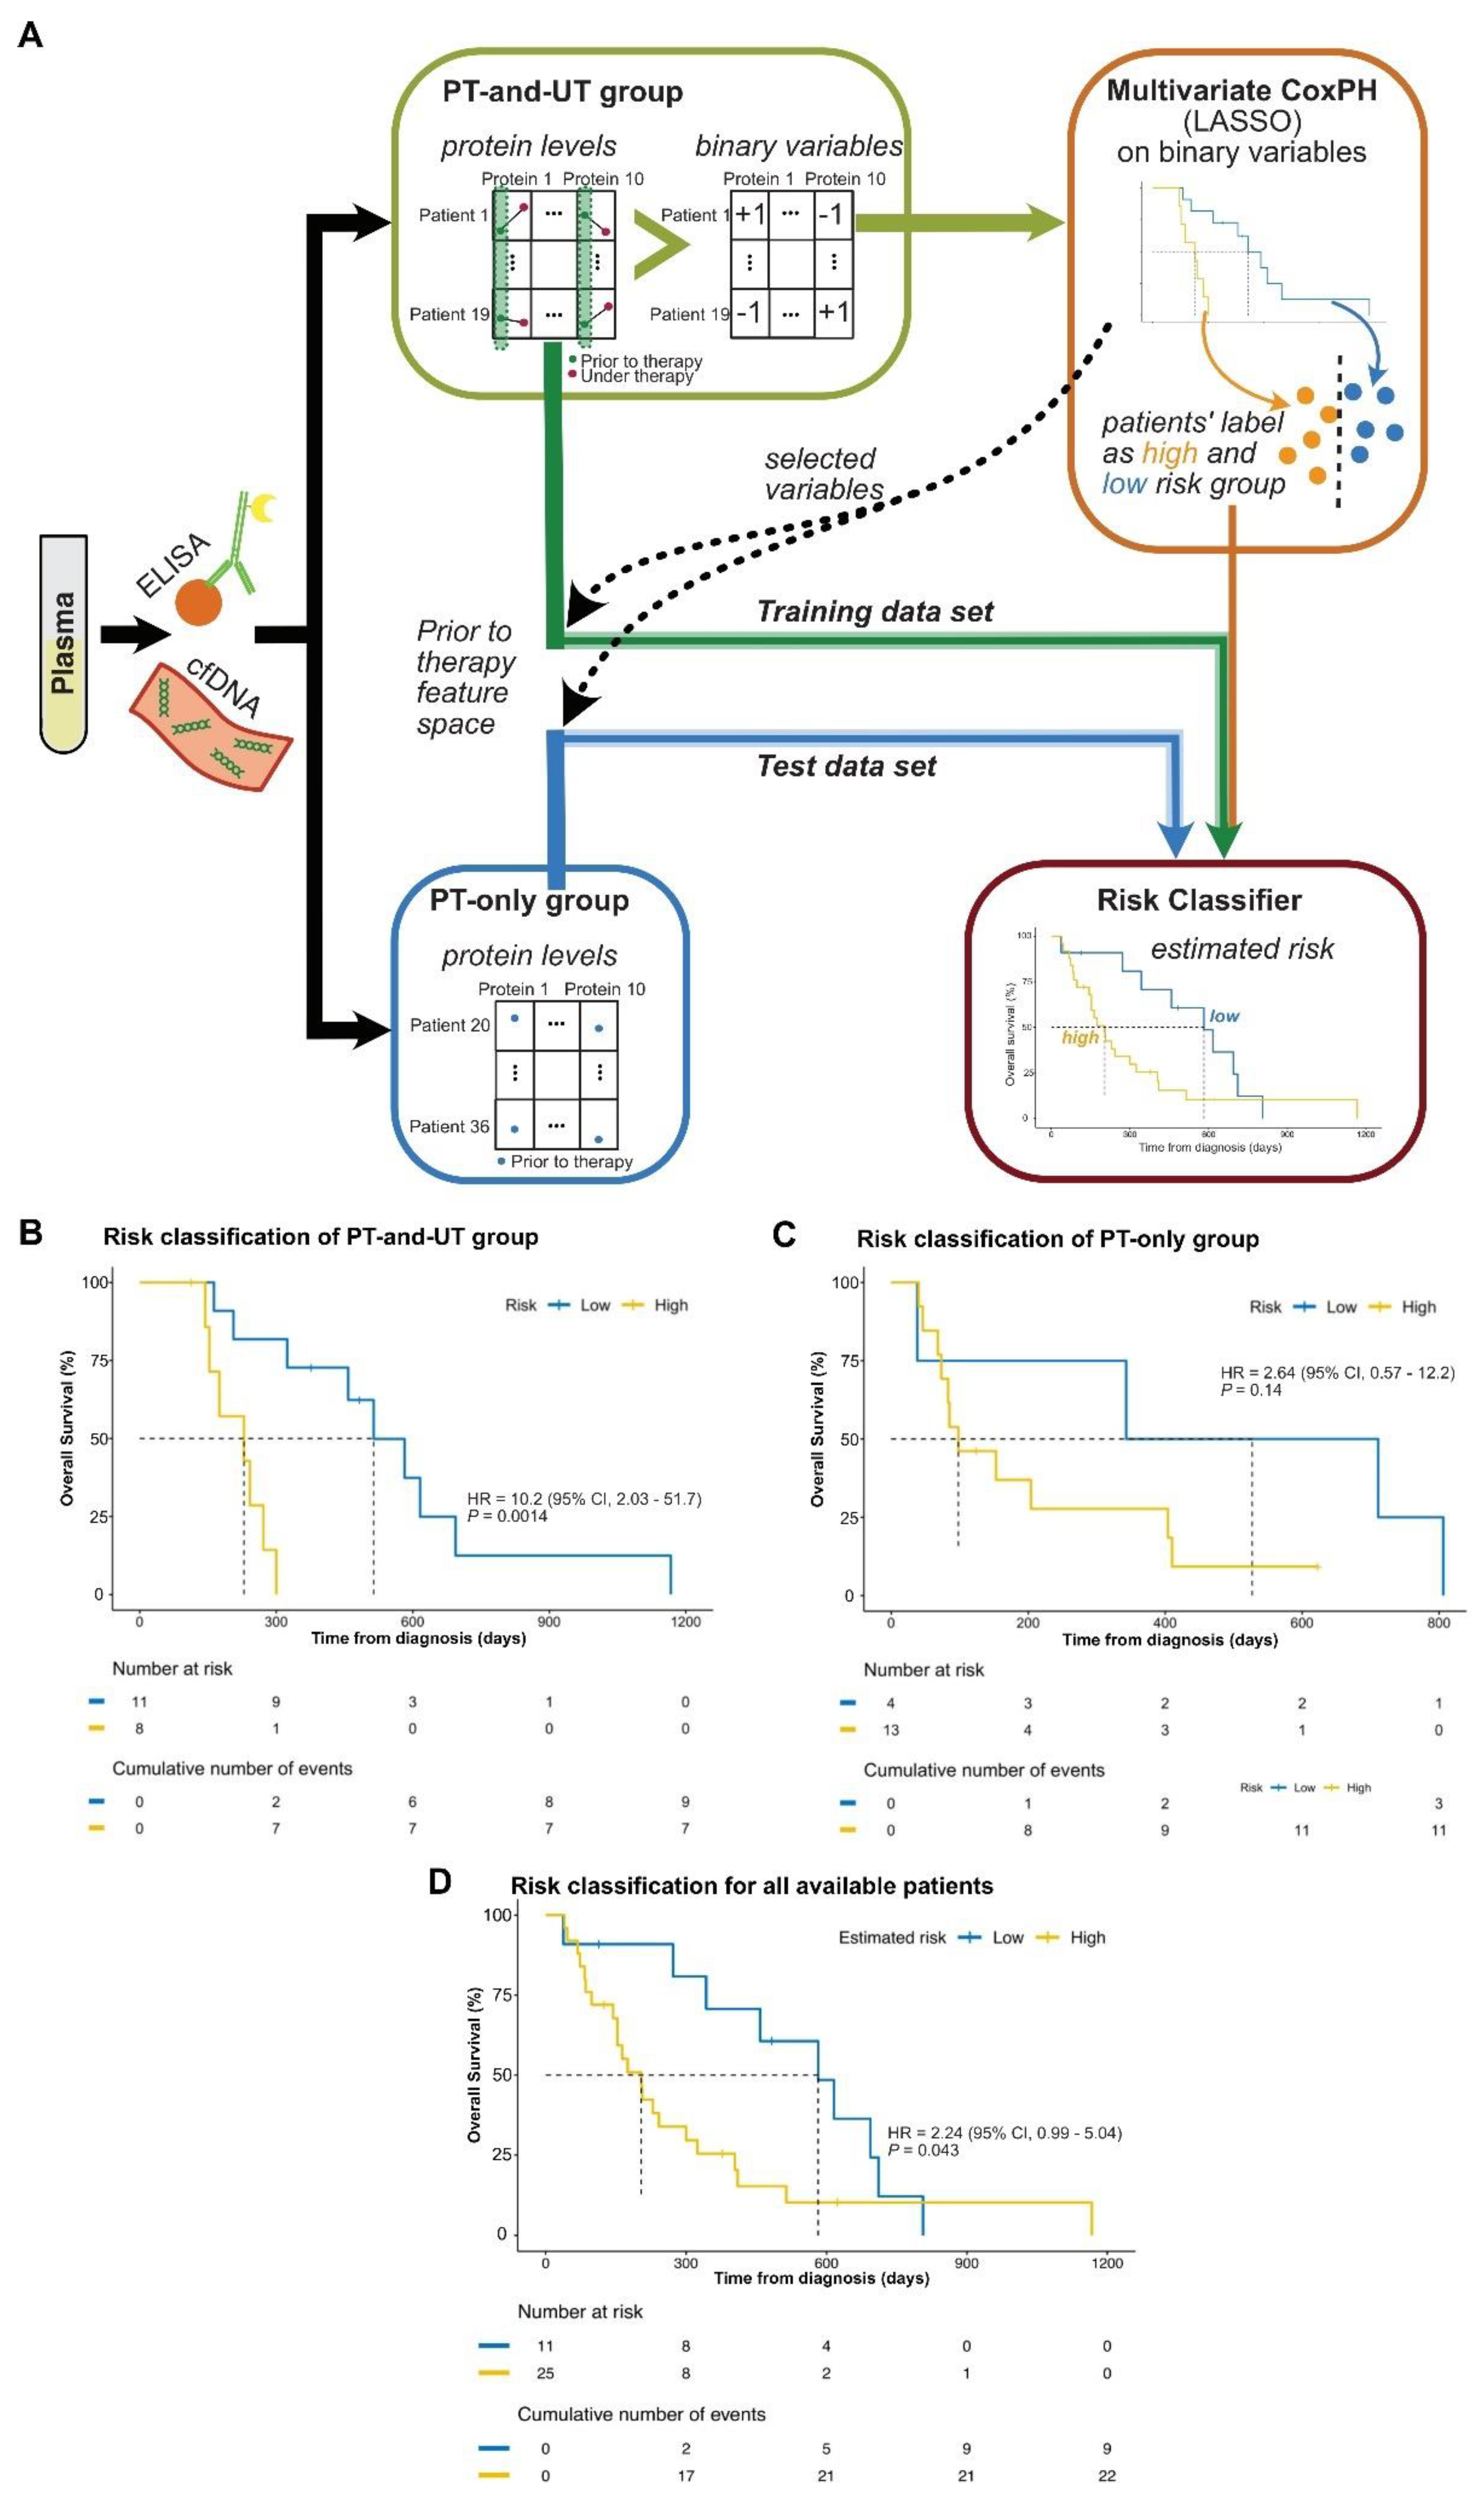

Table 1.
Overall survival analysis by clinico-pathologic variables and KRASmut cfDNA status.
| Variable | Univariate analysis | Multivariate analysis | ||||
|---|---|---|---|---|---|---|
| HR | 95% CI§ | P | HR | 95% CI | P | |
| Age ≥ median vs < median |
1.27 |
0.686-2.334 |
0.4452 |
|||
| Gender male vs female |
1.26 |
0.679-2.339 |
0.4318 |
|||
| Tumor location pancreas body & tail vs head |
0.67 |
0.346-1.311 |
0.2122 |
|||
| Tumor differentiation poor vs well/medium |
2.11 |
0.990-4.483 |
0.0212 |
3.17 |
1.175-8.535 |
0.023 |
| Liver metastasis present vs absent |
1.67 |
0.889-3.139 |
0.1289 |
|||
| No. of metastatic site ≥2 vs 1 |
1.86 |
0.866-4.005 |
0.0499 |
|||
| systemic treatment yes vs no |
0.32 |
0.071-1.462 |
0.0111 |
|||
| CA 19-9 status > 37 vs ≤ 37 U/mL |
0.60 |
0.211-1.725 |
0.2382 |
|||
|
KRASmut cfDNA status positive vs negative |
1.06 |
0.553-2.034 |
0.8533 |
|||
| CA 19-9 during follow-up increase vs decrease |
2.23 |
0.827-6.032 |
0.0549 |
|||
|
KRASmut during follow-up increase vs decrease |
5.03 |
0.978-25.83 |
<0.0001 |
10.9 |
2.589-46.17 |
0.001 |
§ CI, confidence interval.
Disclaimer/Publisher’s Note: The statements, opinions and data contained in all publications are solely those of the individual author(s) and contributor(s) and not of MDPI and/or the editor(s). MDPI and/or the editor(s) disclaim responsibility for any injury to people or property resulting from any ideas, methods, instructions or products referred to in the content. |
© 2024 by the authors. Licensee MDPI, Basel, Switzerland. This article is an open access article distributed under the terms and conditions of the Creative Commons Attribution (CC BY) license (http://creativecommons.org/licenses/by/4.0/).
Copyright: This open access article is published under a Creative Commons CC BY 4.0 license, which permit the free download, distribution, and reuse, provided that the author and preprint are cited in any reuse.


