
Submitted:
03 December 2024
Posted:
05 December 2024
You are already at the latest version
Abstract
Wearable motion capture gloves enable precise analysis of hand and finger movements for a variety of uses, including robotic surgery, rehabilitation, and most commonly, virtual augmentation. However, many motion capture gloves restrict natural hand movement with a closed-palm design including fabric over the palm and fingers. In order to alleviate slippage, improve comfort, reduce sizing issues, and eliminate movement restrictions, this paper presents a new low-cost data glove with an innovative open-palm and finger-free design. The new design improves usability and overall functionality by addressing the limitations of traditional closed-palm designs. It is be especially beneficial in capturing movements in fields such as physical therapy and robotic surgery. The new glove incorporates resistive flex sensors (RFSs) at each finger and an inertial measurement unit (IMU) at the wrist joint to measure wrist flexion, extension, ulnar and radial deviation, and rotation. Initially the sensors were tested individually for drift, synchronisation delays, and linearity. Results show a drift of 6.60/h in the IMU and no drift in the RFSs. There was a 0.06 s delay in the data captured by the IMU compared to the RFSs. The glove’s performance was tested with a novel angle testing setup mounted on a collaborative robot. In static conditions, it was found that the IMU had a worst case error across three trials of 7.01 and a mean absolute error (MAE) averaged over three trials of 4.85, while RFSs had a worst case error of 3.77 and a MAE of 1.25 averaged over all five RFSs used. There was no clear correlation between measurement error and speed. Overall, the new glove design proved to accurately measure joint angles.
Keywords:
Data glove
; inertial measurement unit (IMU)
; open-palm design
; resistive flex sensor (RFS)
; wearable technology
1. Introduction
Modern technology has made great strides in the area of precise upper-limb motion tracking, especially for the delicate motions of the fingers and wrists. Finger and wrist motion tracking is used in numerous fields, including surgical ergonomics and tool design, animation, augmented reality, animation, and rehabilitation. For finger and wrist tracking, a device should be compact and lightweight so the hand can undergo full movement without restrictions.
Hand movements can be monitored through various techniques, including electromyography (EMG) wearables, optical tracking, and smart gloves. EMG sensors can be positioned around the wrist to monitor hand movements. This method permits the hand to move freely without constraints. Optical tracking utilises skin markers [1] or marker-less motion capture [2] for the wrist and fingers. Marker-less capture offers the advantages of unrestricted movement, as it does not obstruct the hands, enhancing user-friendliness. However, it frequently encounters challenges with occlusion, where objects or body parts block the line of sight between the cameras and the markers, leading to gaps or inaccuracies in the captured data. Other issues include intricate camera placements and long calibration processes [3]. Smart gloves can be classified into two categories: data gloves, which collect data and analyse movement only, and sensory gloves, which collect data but have been extended to also provide tactile or haptic feedback. Gloves facilitate direct and accurate measurement of the fingers and wrist; however, they frequently restrict natural hand movements or induce discomfort.
Various sensor types such as resistive flex sensors (RFSs), inertial motion units (IMUs) that combine accelerometers, gyroscopes and magnetometers, Hall-effect sensors, capacitive stretch sensors (CSSs), and optical sensors, are employed in smart gloves [4]. Several gloves incorporate IMUs to track motion, each encountering comparable limitations and outcomes. Moreira et al. developed an IMU glove that exhibits minimal inaccuracies and features a straightforward calibration process ensuring that IMU gloves can provide accurate data [5]. Other IMU gloves have been developed to monitor hand functions for hand rehabilitation [6]. IMUs are typically used in parallel with other sensors such as CSSs and RFSs to provide a wider range of data [7]. CSSs are capable of measuring the elongation of a material by changing its capacitance when stretched. They are often used in wearable motion tracking technology due to their small size and ability to be attached directly onto the skin [8]. While they offer consistent performance, CSSs tend to require a larger input to produce noticable output, making them slightly less sensitive than RFSs. RFSs have been utilised in numerous motion tracking gloves in the past. They are commonly employed alongside IMUs to collect more data on acceleration and wrist orientation as well as the flexion and extension of the joints [9,10,11,12]. Gloves combining RFSs and IMUs are commonly used in sign language translations [13].
The physical design of a smart glove can alter its characteristics and user-friendliness. Designs can be categorised into traditional gloves, a thimble attached to the fingertips, and exoskeletons with articulated structures over the hands. Traditional gloves can be closed-palm or fingerless, usually with a soft fabric design [4]. The more prevalent smart gloves are traditional closed-palm gloves that provide complete coverage for the hand and fingers [14]. A closed-palm glove presents numerous limitations, particularly in terms of movement restrictions. These constraints could be mitigated by employing an open-palm glove, which facilitates unimpeded hand movement and tactile feedback.
This paper validates a cost-effective, novel open-palm glove design utilising IMUs and RFSs. This open-palm glove design addresses the limitations of traditional motion capture gloves and enhances comfort and flexibility making it well-suited for tasks requiring precise control and tactile feedback.
The reduced amount of fabric in the glove has several benefits for the fingers: less issues owing to hand shape, size variation, the cost of manufacturing, and more comfort as there is no fabric around the joints [15]. Unlike traditional gloves, which often make it difficult for users to insert their fingers into controllers or gadgets, this glove’s finger-free design allows for normal interaction with controllers. Many users can wear an open-palmed finger-free glove without the need for different sizes or variations for hands with various shapes and finger lengths. Many closed palm gloves have sizing issues and can show data errors due to the glove’s fit [16]. Open-palm finger-free gloves provide users with greater control as the palm is free to feel the surface and detect the amount of surface friction and slipperiness. Friction-sensing ability is crucial to dexterity during tasks requiring precision gripping, such as when employing a two or three fingered grips [17]. These grips are commonly employed when using hand controllers, writing, using a computer, and performing many other everyday tasks. With friction-sensing, the user experiences less slippage, enabling the motion capture of tasks that demand a high level of precision, such as those in robotic surgery.
2. Materials
2.1. Glove Design
The glove is fabricated from an elastic Lycra to allow for stretching during natural hand movements. Each finger of the glove has a 2.2-inch RFS sewn in, spanning from the proximal interphalangeal joint to the metacarpal phalangeal (MCP) joint, and extending towards the central metacarpal region of the hand. The sensors are sold by SparkFun electronics, Australia. As shown in Figure 1a, the glove has no fabric or wires covering the palmar surface of the hand or the finger tops. Each glove includes one IMU sensor, sewn onto the centre of the back of the hand with the y-axis aligned with the fingers, as seen in Figure 1b. There are no sensors devoted to abduction and adduction of the fingers, as sensors between the fingers causes discomfort. To limit weight on the hand, the control box is attached to the elbow using Velcro. Whilst flat on the hand, the newly designed glove may still interfere with movements, however, placing sensors on the wrist only does not provide data on the finer finger and hand postures [18]. The overall cost for one glove is 135.25 AUD the breakdown of costs shown in Table 1.
2.1.1. Inertial Measurement Units
Each glove incorporates one IMU to monitor the wrist flexion and extension. IMUs measure force through accelerometers, velocity through a combination of accelerometers and gyroscopes, and angular orientation through gyroscopes, and occasionally, magnetometers. Each sensor in the IMU has three degrees of freedom (DOFs) for the x, y and z-axis. In most IMUs there are six DOFs, three from the accelerometer measuring linear acceleration and three from the gyroscope measuring angular velocity. The addition of the magnetometer increases the total to nine DOFs and angular orientation data [19]. IMUs provide low-latency, high-frequency readings; however, because gyroscopes measure angular velocity and accelerometers measure linear acceleration, calculating orientation and angles requires integrating these measurements over time. This integration leads to drift due to the accumulation of tiny errors, making periodic calibration necessary. With the addition of the magnetometer, IMUs can measure absolute angles, offering a direct reading of orientation and hence not accumulating drift [20]. An IMU data glove must be calibrated to correct for stationary bias offset, which occurs when the accelerometer and gyroscope detect small, non-zero values for linear acceleration and angular velocity while the glove is at rest. This offset, which results from sensor bias, can build up over time and affect the accuracy of angle measurements [21]. In order to accommodate a wider range of applications, such as fine motion tracking, IMUs are designed to be compact in size [22]. When used for the purpose of joint tracking, IMUs must be placed tightly on the skin to prevent shifting during physical activity [23].
2.1.2. Resistive Flex Sensors
The used RFSs measure flexion by altering their resistance, with values ranging between 1 k to 20 k depending on changes in the angle of deflection. RFSs are often made of special carbon ink and are flat, allowing them to conform to body joints [24]. RFSs can be used independently in gloves; however, the resistance must first be mapped to angles, as there is a slight non-linearity over a large range of angles [25,26]. The resolution of an RFS is roughly 1° to 2° but vary dependent on the specific sensor and the voltage divider circuit used. The sensors provide discrete values of resistance for small changes in flexion and extension movements.
Using hybrid data from both IMUs and RFSs, the new glove determines joint angles of the MCP joints and the wrist allowing for accurate data collection.
2.2. Data Aquisition
A block diagram of the system electronics is shown in Figure 2. Each sensor is powered by a Raspberry Pi Pico wH microcontroller. The RFSs are connected in a voltage divider circuit, using a 380 resistor for each sensor. As the microcontroller is small and only includes four ADC channels, an MCP30008 converter is used for the five RFSs. The MCP30008 is an analog to digital converter that can connect directly to the microcontroller. The IMU, on the other hand, contains 16-bit analog-to-digital conversion for each channel, allowing it to output digital data directly to the 3.3 V pin on the microcontroller without the need for an external converter. Each sensor was sampled at a sampling rate of 20 Hz. A program written in Thonny, an integrated development environment for Python development, was used to collect data. This data was later processed in MATLAB (MathWorks, Natick, MA) to convert raw flex sensor resistance and IMU acceleration and gyroscope values into angles using linear mapping and calibration.
2.3. Glove Evaluation Setup
The evaluation setup is shown in Figure 3. Autodesk’s Fusion 360 (Autodesk, San Rafael, CA) was used to design a platform for the hand to rest on, the resulting design was 3D printed. The hand testing robot interface was designed from an online model of the UR5e robot [27]. The 3D printed design was made so that rotation of the wrist only involves movement of the fourth axis of the UR5e robot. This rotation axis is shown by the red line in Figure 4.
3. Methods
3.1. Sensor Testing
Prior to testing the glove, each sensor type was individually evaluated for drift, and the synchronisation between the two sensor types was assessed. To test the linearity of the resistive flex sensors (RFSs), the resistance was mapped to the angle of deflection for each sensor. Then, the results were compared to see if there were any variations between the sensors.
3.1.1. Drift and Delay
The drift for each type of sensor was calculated by activating the sensor and allowing it to execute for one hour. This was repeated three times. In order to minimise errors, the sensors were not handled during this time. A synchronisation test was performed to determine any differences in delays between IMU and RFS values. In this test, both the RFSs and the IMU received a stimulus (rapid onset movement) at the same time. Both sensors can operate simultaneously as they are connected to the same microcontroller. The data and timestamps were collected and analysed using MATLAB. The real-time delay for each sensor was less than one sample (0.05 s).
3.1.2. Linear Mapping of the RFSs
The RFS were set up on top of a goniometer. As seen in Figure 5, the sensor was fastened to the goniometer with tape at each end but no tape in the middle to allow for bending. Initial resistance measurements were collected with the sensor in an unbent position. The goniometer was rotated until the resistance changed, then held for 5 s to record both the angle and resistance. This was repeated for the entire range of -90° to 90°. This process was performed for all five RFSs used in the glove.
3.2. Glove Testing
The individual was seated in a chair, with their elbow resting on the edge of a table and their forearm placed flat on the table. The chair was adjusted to a height that positioned the elbow at the most optimal and comfortable angle for the individual, as seen in Figure 3b. After the test subject donned the glove it was ensured that the sensors were properly aligned with each knuckle. This experiment focused on the right hand. Prior to each test, the glove underwent calibration by being held in two easily attainable positions for 5 s each: flat and in a fist. In the flat position the RFS’s were at 0° flexion and the IMU at 0° and at the fist position the RFS’s on the fingers were at 90° flexion however the thumb was placed at 45° of flexion. The calibration angles are shown in Figure 6.
3.2.1. Static Measurements
Initially, a static analysis was conducted. The hand was positioned on the 3D printed platform connected to the robot. A Velcro strap was used to fasten the hand, guaranteeing continuous contact with the robot throughout the recording. A visual check was conducted to ensure the hand remained flat on the 3D printed platform, preventing any cupping that could alter the wrist angle.
When measuring the wrist angles, the hand was positioned with the fingers extended straight (0 flexion), and the thumb was positioned at a 30° angle to ensure comfort [28]. Fingers were measured in pairs with the remaining fingers lifted from the platform; index and middle were measured together as well as ring and little fingers. The angle was maintained for a duration of 10 s, with the central 6 s being documented using both the gloves and the robot. The angle was incrementally adjusted by 15° in both flexion and extension, with a maximum angle of 60° for both movements. The duration of each full test was 90 s, and the subject was provided with a 2-minute break before repeating the test. To ensure user comfort, the thumb was only tested from -45° to 30°.
3.2.2. Dynamic Measurements
After conducting the static testing, the glove’s dynamic capabilities were assessed. The robot spanned the angles from the maximum to minimal flexion of the wrist and each of the fingers, adopting the same setup as the static measurements. The robot employed different velocities to ensure that the glove could gather data over a spectrum of real-world motions. In dynamic testing, the angles of the fingers were only tested from -60° to 45° for user comfort and to mimic natural movements where an extension above 45° are rare and painful. Three instrument velocities were evaluated: Slow (20°/s), Medium (25°/s), Fast (30°/s).
3.2.3. Data Analysis
The analysis began with data calibration to ensure accuracy and consistency across all measurements. Calibration involved adjusting the raw sensor outputs based on pre-determined calibration factors as explained above. For each trial, the worst-case error was calculated to quantify the maximum deviation observed, while the standard deviation (SD) was computed to measure the variability or spread of the data points around the mean for each measurement point. This process was conducted separately for IMU and RFS. The data from the trials were averaged to obtain a single representative dataset for both IMU and RFSs. The next step involved evaluating the relationship between the sensor data and the real values (ground truth measurements). For this purpose, the coefficient of determination () was calculated for each sensor type. The value provides an indication of how well the sensor data fit the real values, with values closer to 1 indicating a better fit. The mean absolute error (MAE) was computed for each sensor. The MAE quantified the average magnitude of the errors between the sensor measurements and the real values, thus providing a measure of the overall accuracy of the sensors. An analysis of variance (ANOVA) was conducted to compare accuracy over the three angular velocities.
4. Results and Discussion
The primary aim of this study was to assess the measurement accuracy of angle measurements using a newly designed glove incorporating RFSs and IMUs, evaluated under static conditions at varying angular velocities.
Individual sensor drift tests were conducted for both the IMU and RFSs. The IMU had a drift of 6.60°/h which is typical for low-cost sensors although slightly lower than average drift for an MPU6050 [29]. As the drift was tested over a one hour period, a drift could emerge over a longer period of time, though the glove is not designed for extended use without calibration and requires calibration every 15 minutes. A 15-minute calibration interval was selected because the glove drifts approximately 1.65° within this time, which keeps the error within acceptable limits for accurate measurements while balancing practicality for users. Following the drift testing, a synchronisation test was undertaken. This showed that on average between all five RFSs and the IMU there is only a 0.06 s delay, corresponding to one sample. While the study includes a range of angular velocities, even the fastest is not significantly affected by this minor delay, which is therefore disregarded in subsequent calculations.
The RFSs were calibrated by mapping resistance () to angle of deflection (°) as shown in Figure 7. Each RFS displayed similar mapping of resistance to angle, but with different initial values, resulting in lines on the graph that appear almost parallel. The different initial values are as expected as RFSs have different baseline resistances due to manufacturing. A line of best fit was found as well as the value and is shown in Table. Table 2. The RFSs performed similar to other RFSs described in the literature [30]. The sensor behaves linearly around 0° flexion, but as the flexion increases, the response becomes nonlinear, with the resistance changing less predictably at larger angles. Sensor variability is expected, particularly in low-cost sensors, which is why mapping each sensor separately is necessary. While the linear line of best fit is presented to assess how closely the data aligns with a linear trend, for glove calibration, the data was linearly extrapolated to achieve greater accuracy than what is provided by the line of best fit.
The evaluation of static angle measurements began with comparing the performance of both RFS and IMU sensors across the three trials. The worst case error for the RFSs was 3.76°. The SD found of the RFS measurements was 2.14°, indicating the variability of the data for each trial. For the IMU, the worst case error was 7.01°, with a SD of 2.16°. These similar errors and SD indicate that both sensors provide consistent measurements, though IMUs exhibited more variability. The variability in the IMU are due to the drift mentioned above. As all three trials were conducted within one calibration the results drifted by roughly 1° over the 8-minute period. Worst case error variability can be attributed to its continuous data acquisition over the angles from -60° to 60° in comparison to the discrete nature of the RFSs. Subsequent analysis was based on average values across all trials.
For the static data set, Figure 8 illustrates the IMU sensor results for the actual angles compared to the measured angles. The MAE and for IMU and RFSs is shown in Table 3. The IMUs demonstrated a high coefficient of determination for this data. This confirms a high level of linearity across the common range of motion (-60° to 60°). The MAE for the IMU sensors was low showing a high accuracy in wrist angle measurements. The IMU sensors had a higher MAE than the RFS sensors; however, the error for the IMU has also been seen in other papers and matches other IMU based data gloves error [31,32].
Figure 9 and Figure 10 depict the static angle data for the fingers and thumb, respectively. For each data set, both the value and MAE were calculated to evaluate the sensor performance as shown in Table 3. The values for the five digits was averaged to 0.99, showing a high level of linearity across the range of -60° to 60° for the fingers and -45° to 30° for the thumb. The MAE for static finger conditions for the 4 fingers were generally lower than other RFS based gloves, however, the thumb data was consistent with other literature such as Gentner [33] and Simone [34].
Overall, the static measurements were highly accurate, with an average MAE of 1.22° across all MCP joints and the wrist. These results demonstrate the glove’s potential for precise angle measurement during static tasks.
To assess the glove’s performance in dynamic situations, the sensors were evaluated at three different angular velocities to simulate various motion scenarios. For each trial the robot began at -60° and accelerated to the target velocities from -60° to -55°. Following this, the robot travelled at a constant speed from -55° to 55° before coming to a stop at 60°. Figure 11 exemplifies this motion over time for the IMU. For this experiment the data was only collected from -55° to 55° as a constant speed is required to quantify the error between known and measured angles.
At each angular velocity, the MAE was computed as well as the values when plotted measured angle against time for both RFS and IMU sensors. These results are shown in Table 4.
To compare the differences between the performance at each angular velocity, a one-way ANOVA was conducted. The null hypothesis for this analysis is that there are no differences in the performance over the three angular velocities. The ANOVA test revealed that there were no statistical differences between the three velocities, F(2,9) = 0.08, p = 0.9219. In this case we fail to reject the null hypothesis, suggesting there is no statistically significant difference in performance over different angular velocities. This suggests that the angular velocities provide similar results indicating that the sensors will provide accurate angle measurements over any natural movement across many valocities.
The IMU performed the best results under dynamic conditions. The results maintained a high linearity and showed a low MAE for each velocity. There was minimal variation across the three different velocities. The RFSs also exhibited minimal variation across velocity, performing similarly at each. In contrary to static testing, the RFSs on average had a higher MAE than the IMUs. The MAE averaged for the glove (all sensors) was low: 4.98° (Slow), 4.85° (Medium), 4.34° (Fast). These findings are similar to other RFS and IMU gloves in literature with IMU having a slightly better accuracy and reliability in dynamic movements when compared to RFSs [35].
Overall, the dynamic data, whilst not as accurate as the static data, showed results similar to other literature over different velocities [21,25]. It is important to note that the inconsistencies in RFS accuracy are likely due to sensor placement rather than angular velocity, underscoring the importance of proper glove alignment.
5. Conclusion
Traditional closed-hand motion-capture gloves restrict tactile feedback by covering the entire hand. This study proposes and examines a new type of low-cost data glove that encompasses an open palm design that allows for a high range of movement and friction sensing. The sensors were initially tested individually, followed by an evaluation of the glove’s performance over static and dynamic conditions for both RFS and IMU.
For static conditions, the glove demonstrated a high repeatability, the IMU had a worst case error across three trials of 7.01° and a mean absolute error (MAE) averaged over three trials of 4.85°, while RFSs had a worst case error of 3.77° and a MAE of 1.25° averaged over all five RFSs used. The average MAE of 1.85° across all MCP joints and the wrist indicates high performance of the glove. The IMU sensors in static measurements had more error than the RFSs; however, both MAEs were low and similar to other IMU and RFS data gloves. Dynamic conditions showed a marginally lower accuracy, but still provided sufficient detail to capture hand movements at three different angular velocites. There was little variation between the three velocities. Importantly, the ANOVA results confirmed no statistically significant differences between the angular velocities, further validating the glove’s consistency across varied motion rates. Whilst the average MAE across the angular velocities were higher than static conditions, the results still remained low: 4.98° (Slow), 4.85° (Medium), 4.34° (Fast). Overall the glove performed well and can accurately measure angles of the wrist and fingers over natural movement ranges across static and dynamic scenarios.
Future studies should ensure the glove has optimal placement on the hand as results show that sensor displacement can affect performance. Additionally, exploring more natural hand movements rather than forced full-range motions would better reflect real-world use cases. The gloves have many possible applications that involve motion tracking while maintaining tactile feedback, such as in robotic surgery, sports, and other fields.
Author Contributions
Conceptualisation, O.H., M.I., J.M., O.T., and C.H. ; methodology, O.H., and M.I.; software, O.H.; validation, O.H. and M.I.; formal analysis, O.H. and M.I; investigation, O.H.; resources, O.H. and M.I.; data curation, O.H.; writing—original draft preparation, O.H. and M.I.; writing—review and editing, O.H., M.I., J.M., O.T., and C.H.; visualization, O.H. and M.I.; supervision, O.H., M.I., J.M., O.T., and C.H.; project administration, O.H. and M.I.; funding acquisition, O.H. and M.I. All authors have read and agreed to the published version of the manuscript.
Funding
This research received no external funding
Institutional Review Board Statement
The study was approved by the Institutional Review Board of Swinburne University of Technology (Project ID 8258, approved 29/11/2024).
Informed Consent Statement
Informed consent was obtained from all subjects involved in the study.
Data Availability Statement
The data analyzed during the current study are available upon reasonable request from the corresponding author
References
- Schröder, M.; Maycock, J.; Botsch, M. Reduced marker layouts for optical motion capture of hands. Proceedings of the 8th ACM SIGGRAPH Conference on Motion in Games; Association for Computing Machinery: New York, NY, USA, 2015; MIG ’15; pp. 7–16, event-place: Paris, France. [Google Scholar] [CrossRef]
- Casile, A.; Fregna, G.; Boarini, V.; Paoluzzi, C.; Manfredini, F.; Lamberti, N.; Baroni, A.; Straudi, S. Quantitative Comparison of Hand Kinematics Measured with a Markerless Commercial Head-Mounted Display and a Marker-Based Motion Capture System in Stroke Survivors. Sensors 2023, 23, 7906, Number: 18 Publisher: Multidisciplinary Digital Publishing Institute. [Google Scholar] [CrossRef]
- Bank, P.J.; Marinus, J.; Meskers, C.G.; de Groot, J.H.; van Hilten, J.J. Optical Hand Tracking: A Novel Technique for the Assessment of Bradykinesia in Parkinson’s Disease. Movement Disorders Clinical Practice 2017, 4, 875–883, _eprint: https://onlinelibrary.wiley.com/doi/pdf/10.1002/mdc3.12536. [Google Scholar] [CrossRef]
- Caeiro-Rodríguez, M.; Otero-González, I.; Mikic-Fonte, F.A.; Llamas-Nistal, M. A Systematic Review of Commercial Smart Gloves: Current Status and Applications. Sensors 2021, 21, 2667, Number: 8 Publisher: Multidisciplinary Digital Publishing Institute. [Google Scholar] [CrossRef]
- Moreira, A.H.; Queirós, S.; Fonseca, J.; Rodrigues, P.L.; Rodrigues, N.F.; Vilaca, J.L. Real-time hand tracking for rehabilitation and character animation. 2014 IEEE 3nd International Conference on Serious Games and Applications for Health (SeGAH), 2014, pp. 1–8. [CrossRef]
- Mohan, A.; Tharion, G.; Kumar, R.K.; Devasahayam, S.R. An instrumented glove for monitoring hand function. The Review of Scientific Instruments 2018, 89, 105001. [Google Scholar] [CrossRef]
- Weber, P.; Rueckert, E.; Calandra, R.; Peters, J.; Beckerle, P. A low-cost sensor glove with vibrotactile feedback and multiple finger joint and hand motion sensing for human-robot interaction. 2016 25th IEEE International Symposium on Robot and Human Interactive Communication (RO-MAN), 2016, pp. 99–104. ISSN 1944-9437. [CrossRef]
- Chander, H.; Burch, R.F.; Talegaonkar, P.; Saucier, D.; Luczak, T.; Ball, J.E.; Turner, A.; Kodithuwakku Arachchige, S.N.K.; Carroll, W.; Smith, B.K.; Knight, A.; Prabhu, R.K. Wearable Stretch Sensors for Human Movement Monitoring and Fall Detection in Ergonomics. International Journal of Environmental Research and Public Health 2020, 17, 3554, Number: 10 Publisher: Multidisciplinary Digital Publishing Institute. [Google Scholar] [CrossRef]
- Saggio, G.; Orengo, G.; Pallotti, A.; Errico, V.; Ricci, M. Evaluation of an integrated sensory glove at decreasing joint flexion degree. 2018 IEEE International Symposium on Medical Measurements and Applications (MeMeA), 2018, pp. 1–5. [CrossRef]
- Calado, A.; Lin, B.S.; Lee, I.J.; Saggio, G. Quasi-Static Measurement Performances of Flex-Sensor-Based and Inertial- Measurement -Unit-Based Sensory Gloves. IEEE Sensors Journal 2024, 24, 2162–2171, Conference Name: IEEE Sensors Journal. [Google Scholar] [CrossRef]
- Surangsrirat, D.; Bualuangngam, T.; Sri-iesaranusorn, P.; Chaiyaroj, A.; Buekban, C.; Thanawattano, C.; Poopitaya, S. Comparison of the Wrist Range of Motion Measurement between Inertial Measurement Unit Glove, Smartphone Device and Standard Goniometer. Applied Sciences 2022, 12. [Google Scholar] [CrossRef]
- Dipietro, L.; Sabatini, A.M.; Dario, P. Evaluation of an instrumented glove for hand-movement acquisition. Journal of Rehabilitation Research and Development 2003, 40, 179–189. [Google Scholar] [CrossRef]
- Cavallo, P.; Saggio, G. Conversion of Sign Language to Spoken Sentences by Means of a Sensory Glove. Journal of Software 2014, 9, 2002–2009. [Google Scholar] [CrossRef]
- Perret, J.; Vander Poorten, E. Touching Virtual Reality: A Review of Haptic Gloves. ACTUATOR 2018; 16th International Conference on New Actuators, 2018, pp. 1–5.
- Sim, D.; Baek, Y.; Cho, M.; Park, S.; Sagar, A.S.M.S.; Kim, H.S. Low-Latency Haptic Open Glove for Immersive Virtual Reality Interaction. Sensors 2021, 21, 3682, Number: 11 Publisher: Multidisciplinary Digital Publishing Institute. [Google Scholar] [CrossRef]
- Connolly, J.; Condell, J.; Curran, K.; Gardiner, P. Improving Data Glove Accuracy and Usability Using a Neural Network When Measuring Finger Joint Range of Motion. Sensors 2022, 22, 2228, Number: 6 Publisher: Multidisciplinary Digital Publishing Institute. [Google Scholar] [CrossRef]
- Khamis, H.; Xia, B.; Redmond, S.J. Real-time Friction Estimation for Grip Force Control. 2021 IEEE International Conference on Robotics and Automation (ICRA), 2021, pp. 1608–1614. ISSN 2577-087X. [CrossRef]
- Siddiqui, N.; Chan, R.H.M. Multimodal hand gesture recognition using single IMU and acoustic measurements at wrist. PLoS ONE 2020, 15, e0227039. [Google Scholar] [CrossRef]
- He, C.; Kazanzides, P.; Sen, H.; Kim, S.; Liu, Y. An Inertial and Optical Sensor Fusion Approach for Six Degree-of-Freedom Pose Estimation. Sensors 2015, 15, 16448–16465. [Google Scholar] [CrossRef]
- Hu, C.; Meng, M.Q.H.; Mandal, M. A Linear Algorithm for Tracing Magnet Position and Orientation by Using Three-Axis Magnetic Sensors. IEEE Transactions on Magnetics 2007, 42, 4096–4101. [Google Scholar]
- Lv, J.; Ravankar, A.A.; Kobayashi, Y.; Emaru, T. A method of low-cost IMU calibration and alignment. 2016 IEEE/SICE International Symposium on System Integration (SII), 2016, pp. 373–378. ISSN 2474-2325. [CrossRef]
- Ahmad, N.; Ghazilla, R.A.R.; Khairi, N.M.; Kasi, V. Reviews on various inertial measurement unit (IMU) sensor applications. International Journal of Signal Processing Systems 2013, 1, 256–262. [Google Scholar] [CrossRef]
- Shi, J.; Chang, Q.; Zheng, Y.P. Feasibility of controlling prosthetic hand using sonomyography signal in real time: preliminary study. J Rehabil Res Dev 2010, 47, 87–98. [Google Scholar] [CrossRef]
- Sbcrnini, L.; Pallotti, A.; Saggio, G. Evaluation of a Stretch Sensor for its Inedited Application in Tracking Hand Finger Movements. 2016 IEEE INTERNATIONAL SYMPOSIUM ON MEDICAL MEASUREMENTS AND APPLICATIONS (MEMEA); Num Pages: 6 Series Title: IEEE International Symposium on Medical Measurements and Applications Proceedings-MeMeA Web of Science ID: WOS:000390300400106.; IEEE: New York, 2016; pp. 626–631, Num Pages: 6 Series Title: IEEE International Symposium on Medical Measurements and Applications Proceedings-MeMeA Web of Science ID: WOS:000390300400106. [Google Scholar]
- Orengo, G.; Lagati, A.; Saggio, G. Modeling Wearable Bend Sensor Behavior for Human Motion Capture. IEEE Sensors Journal 2014, 14, 2307–2316, Conference Name: IEEE Sensors Journal. [Google Scholar] [CrossRef]
- Saggio, G.; Bisegna, P.; Latessa, G.; Bocchetti, S. Mechanical modeling of bend sensors exploited to measure human joint movements. 2009 IEEE International Symposium on a World of Wireless, Mobile and Multimedia Networks & Workshops, 2009, pp. 1–4. [CrossRef]
- Universal Robots - Robot Step file - UR5e - e-Series.
- Lee, K.S.; Jung, M.C. Flexion and Extension Angles of Resting Fingers and Wrist. International Journal of Occupational Safety and Ergonomics 2014, 20, 91–101, Publisher: Taylor & Francis. [Google Scholar] [CrossRef]
- Ompusunggu, A.P.; Bey-Temsamani, A. 2-Level error (drift) compensation for low-cost MEMS-based inertial measurement unit (IMU). Microsystem Technologies 2016, 22, 1601–1612. [Google Scholar] [CrossRef]
- Saggio, G.; Orengo, G. Flex sensor characterization against shape and curvature changes. Sensors and Actuators A: Physical 2018, 273, 221–231. [Google Scholar] [CrossRef]
- Hazman, M.A.W.; Nordin, I.N.A.M.; Noh, F.H.M.; Khamis, N.; Razif, M.R.M.; Faudzi, A.A.; Hanif, A.S.M. IMU sensor-based data glove for finger joint measurement. Indonesian Journal of Electrical Engineering and Computer Science 2020, 20, 82–88, Number: 1. [Google Scholar] [CrossRef]
- Connolly, J.; Condell, J.; O’Flynn, B.; Sanchez, J.T.; Gardiner, P. IMU Sensor-Based Electronic Goniometric Glove for Clinical Finger Movement Analysis. IEEE Sensors Journal 2018, 18, 1273–1281, Conference Name: IEEE Sensors Journal. [Google Scholar] [CrossRef]
- Gentner, R.; Classen, J. Development and evaluation of a low-cost sensor glove for assessment of human finger movements in neurophysiological settings. Journal of Neuroscience Methods 2009, 178, 138–147. [Google Scholar] [CrossRef] [PubMed]
- Simone, L.K.; Sundarrajan, N.; Luo, X.; Jia, Y.; Kamper, D.G. A low cost instrumented glove for extended monitoring and functional hand assessment. Journal of Neuroscience Methods 2007, 160, 335–348. [Google Scholar] [CrossRef]
- Saggio, G.; Calado, A.; Errico, V.; Lin, B.S.; Lee, I.J. Dynamic Measurement Assessments of Sensory Gloves Based on Resistive Flex Sensors and Inertial Measurement Units. IEEE Transactions on Instrumentation and Measurement 2023, 72, 1–10, Conference Name: IEEE Transactions on Instrumentation and Measurement. [Google Scholar] [CrossRef]
Figure 1.
Images of the glove
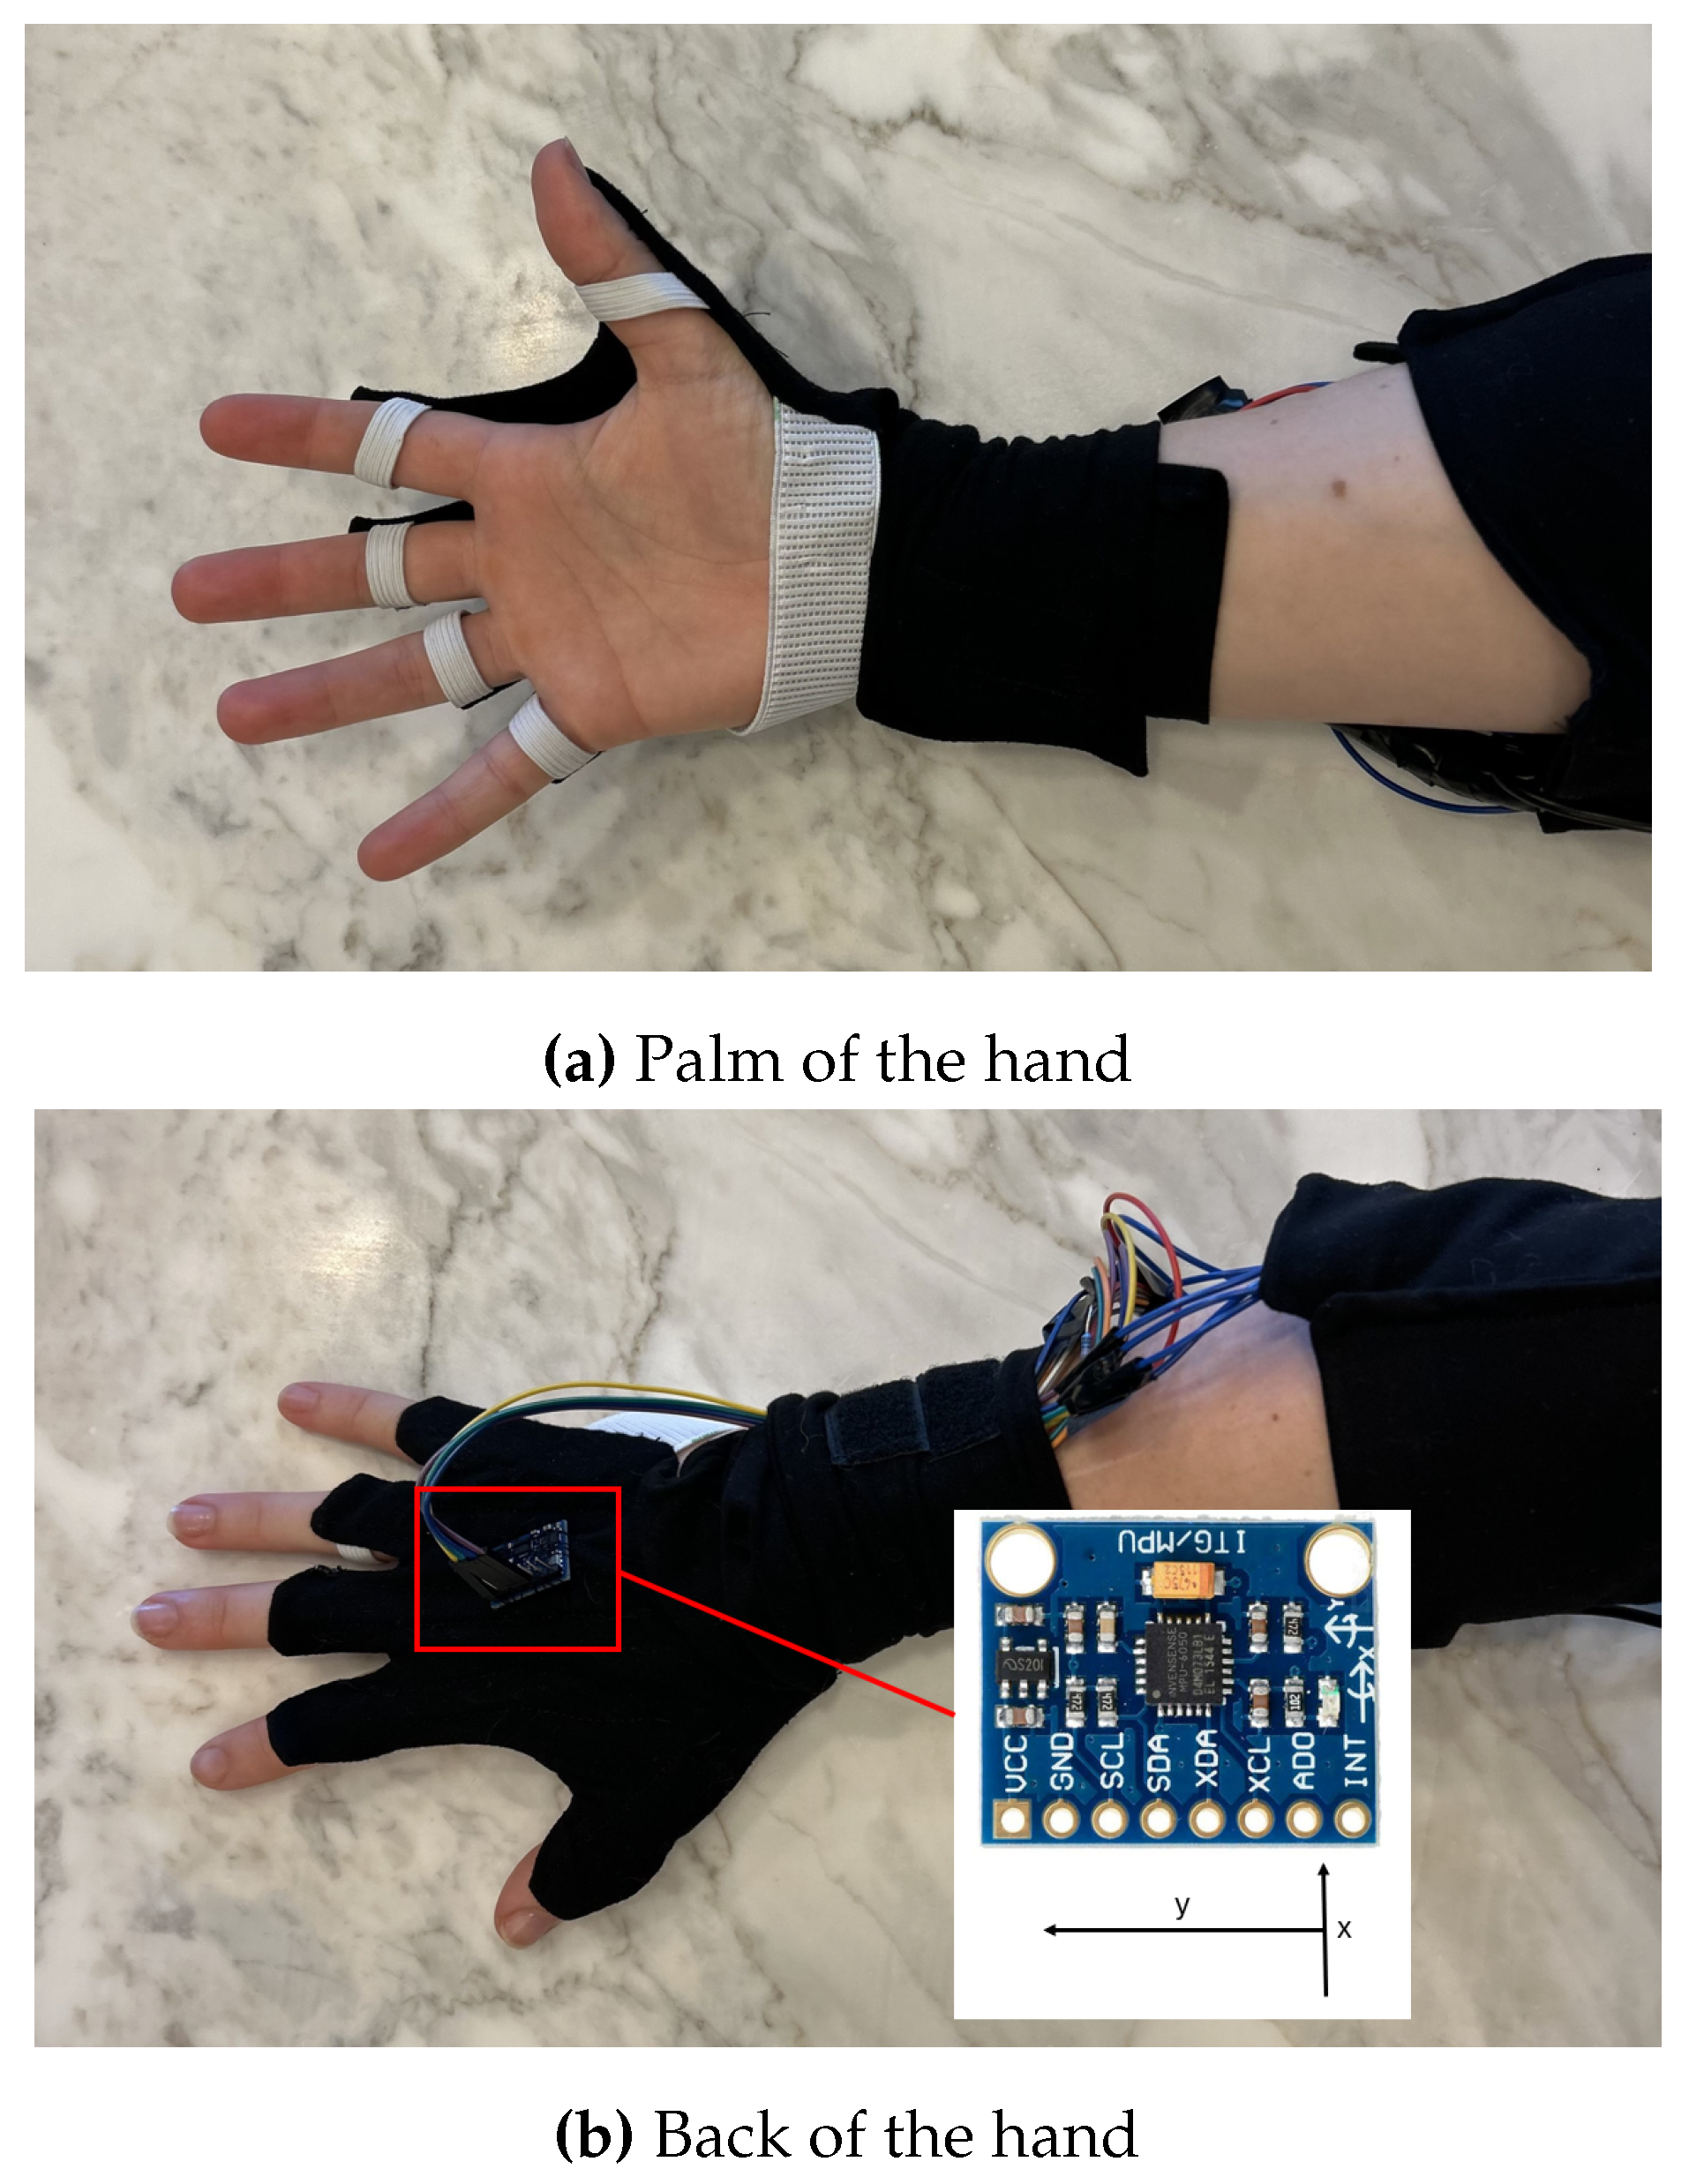
Figure 2.
Block diagram of the system electronics.
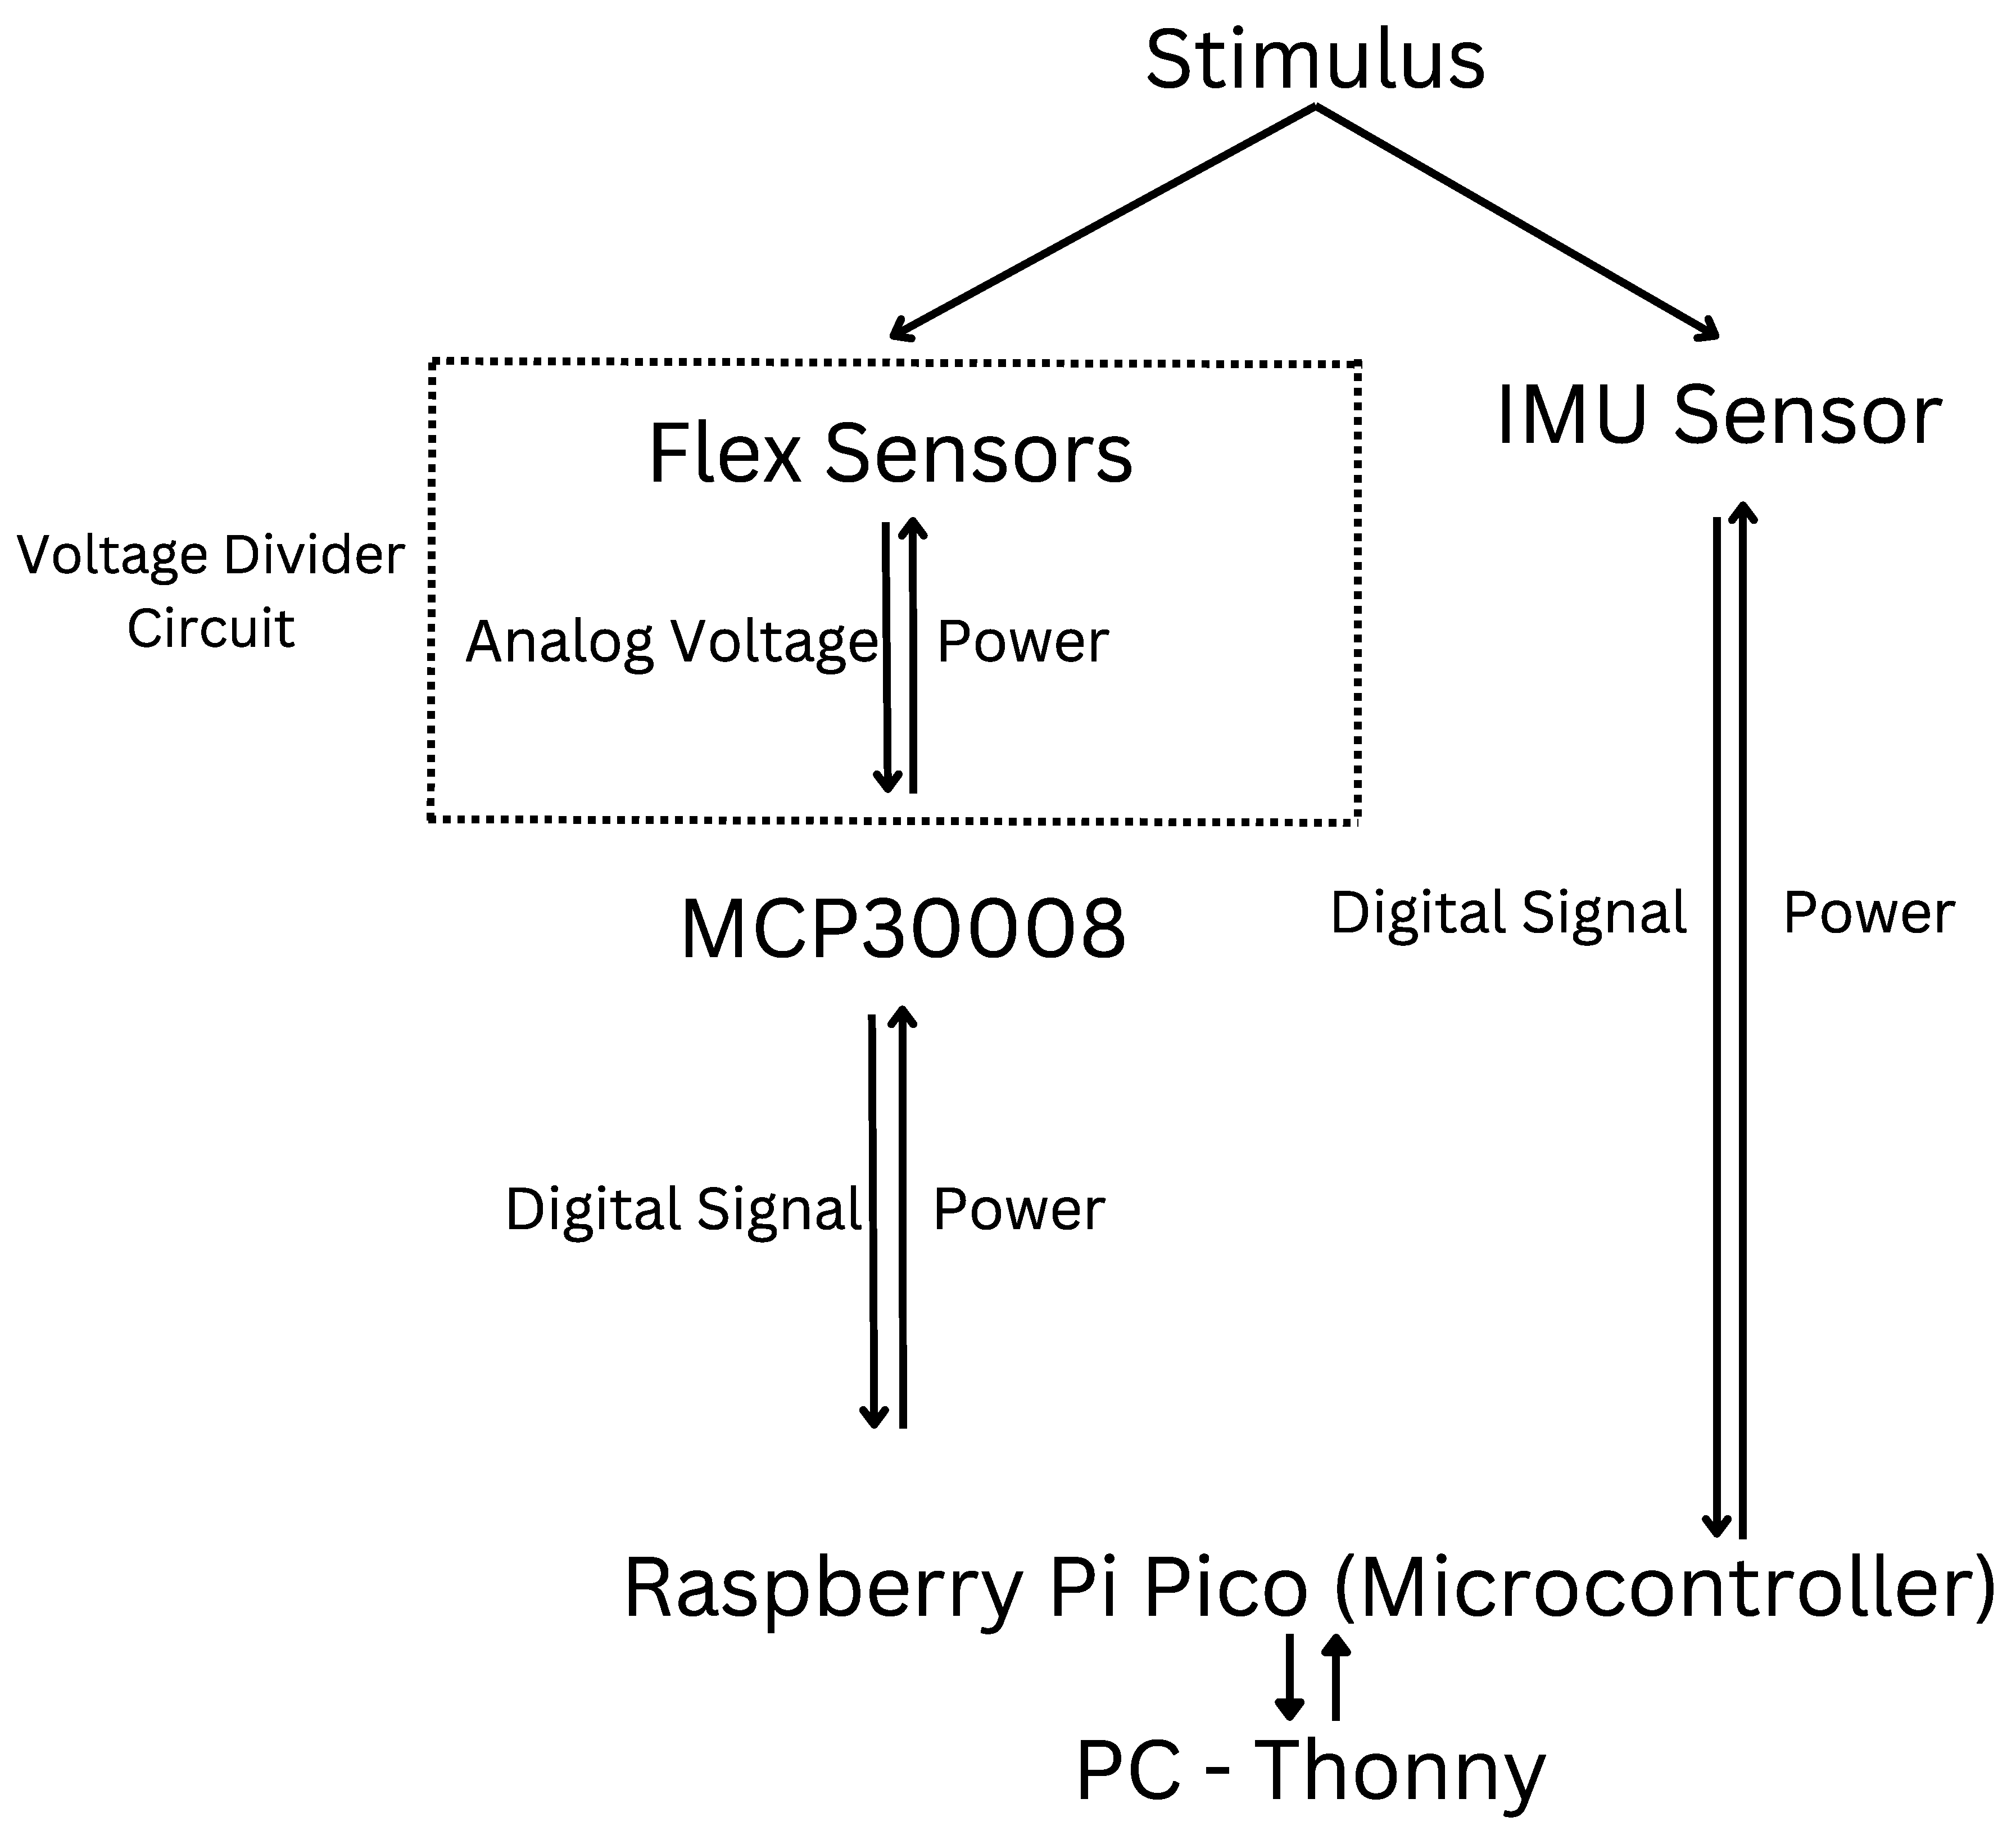
Figure 3.
Robotic testing set up
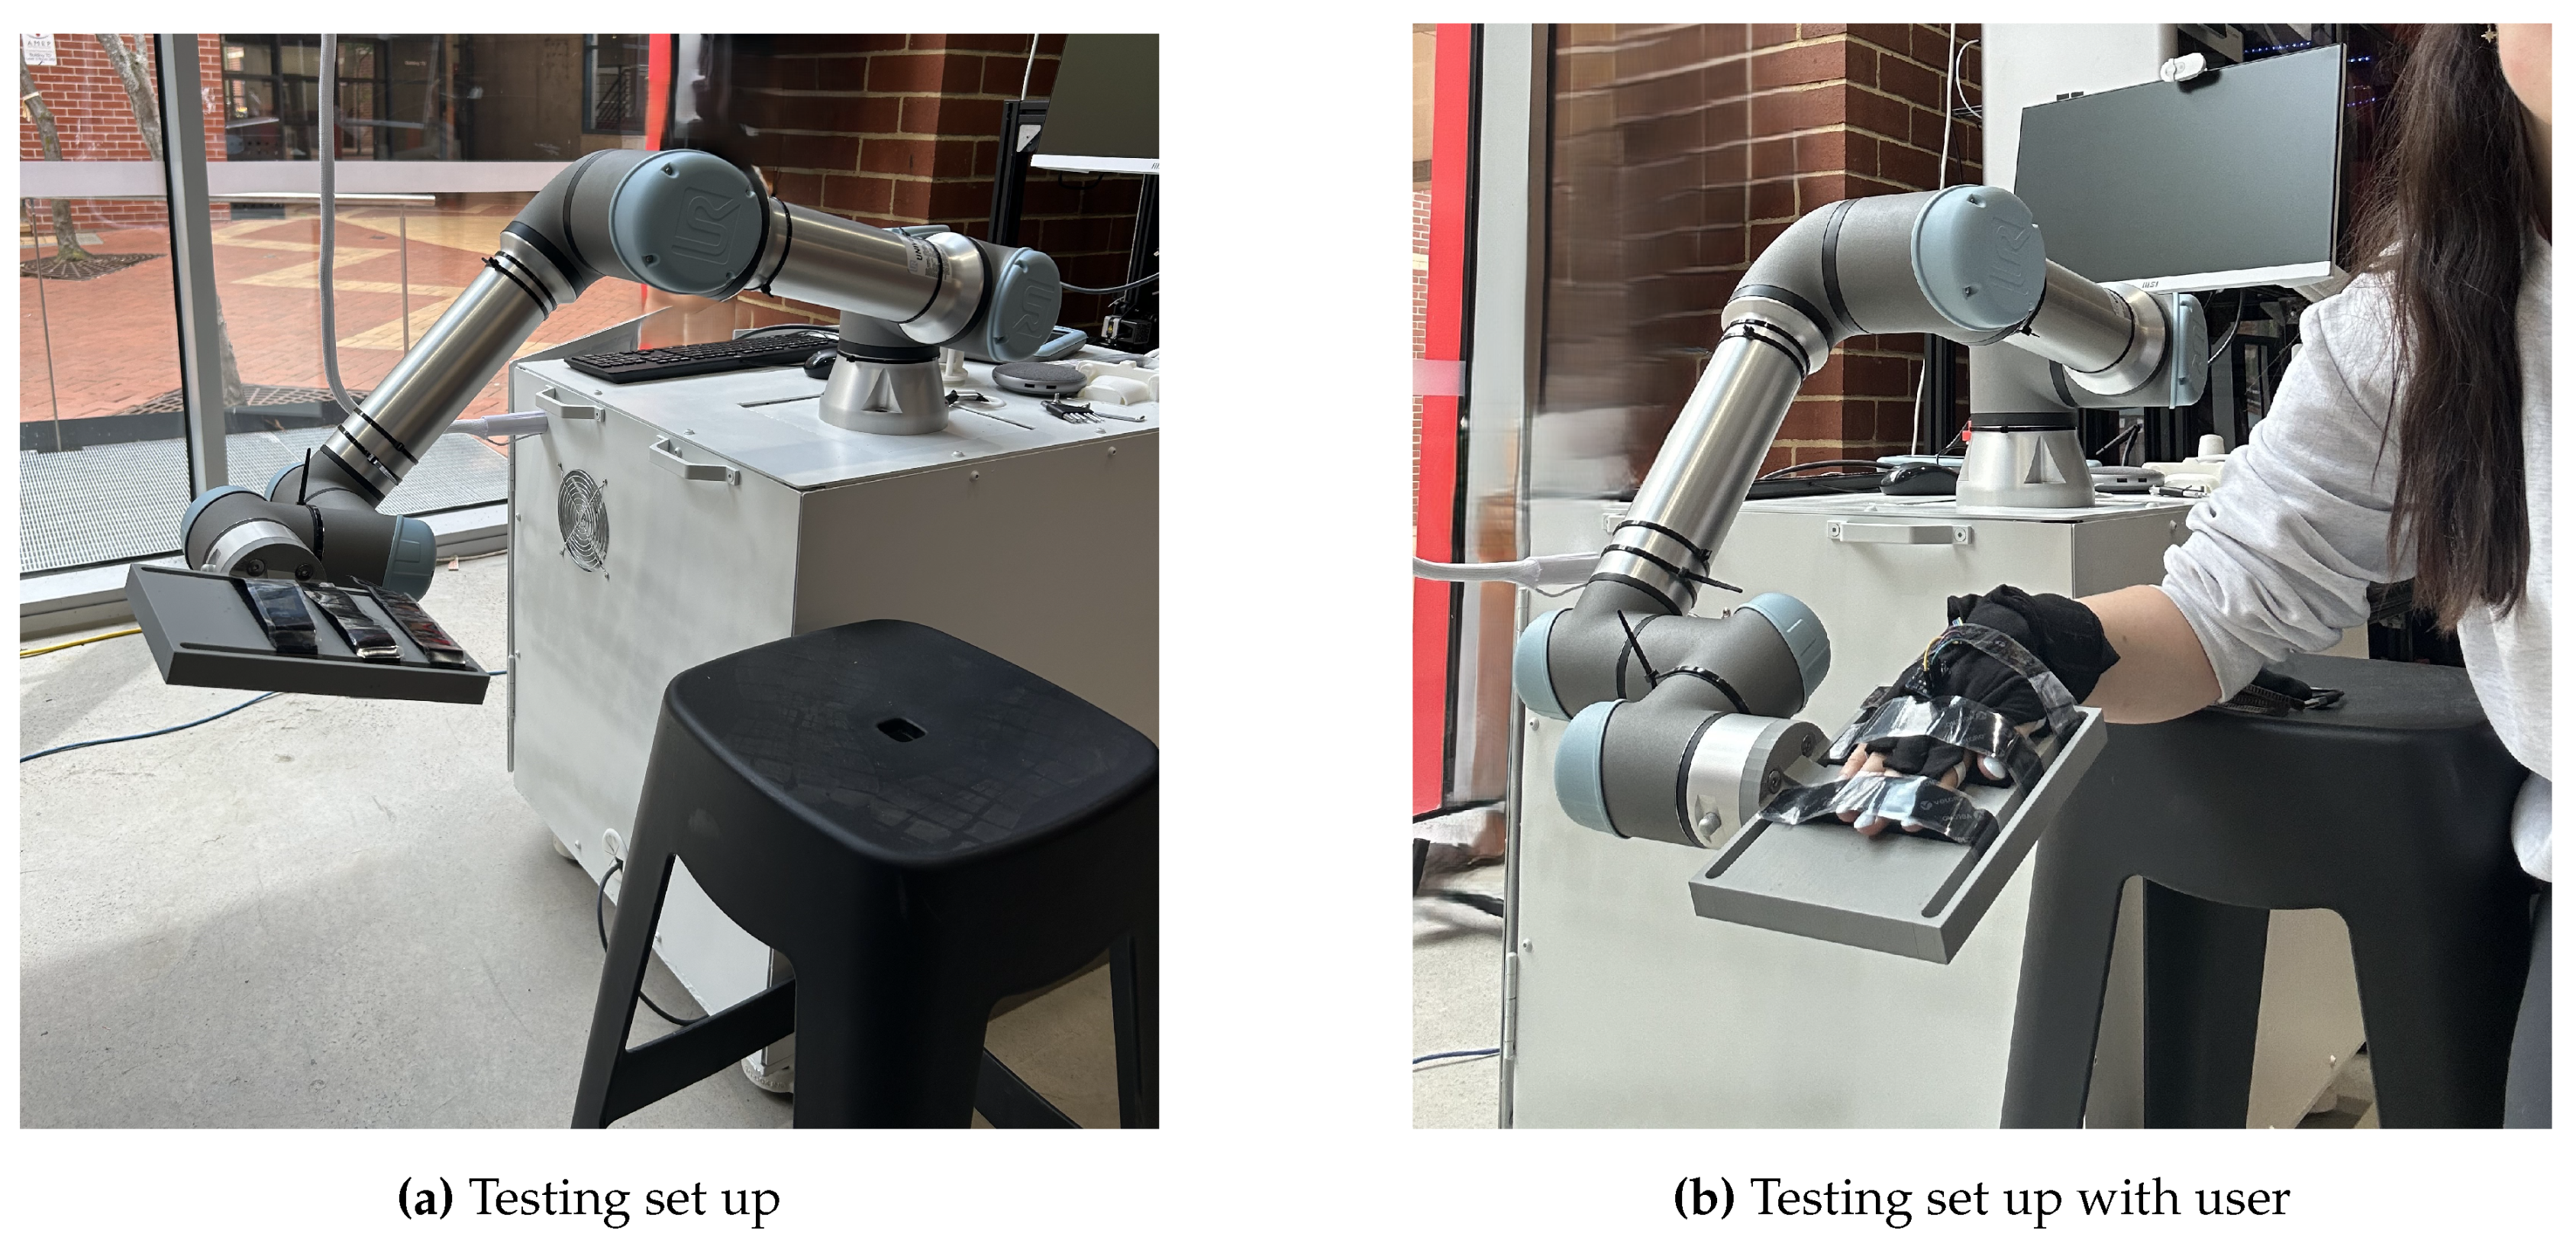
Figure 4.
Hand in testing setup showing the glove placement. The red line shows the alignment of the fourth robot axis with the wrist joint.
Figure 4.
Hand in testing setup showing the glove placement. The red line shows the alignment of the fourth robot axis with the wrist joint.
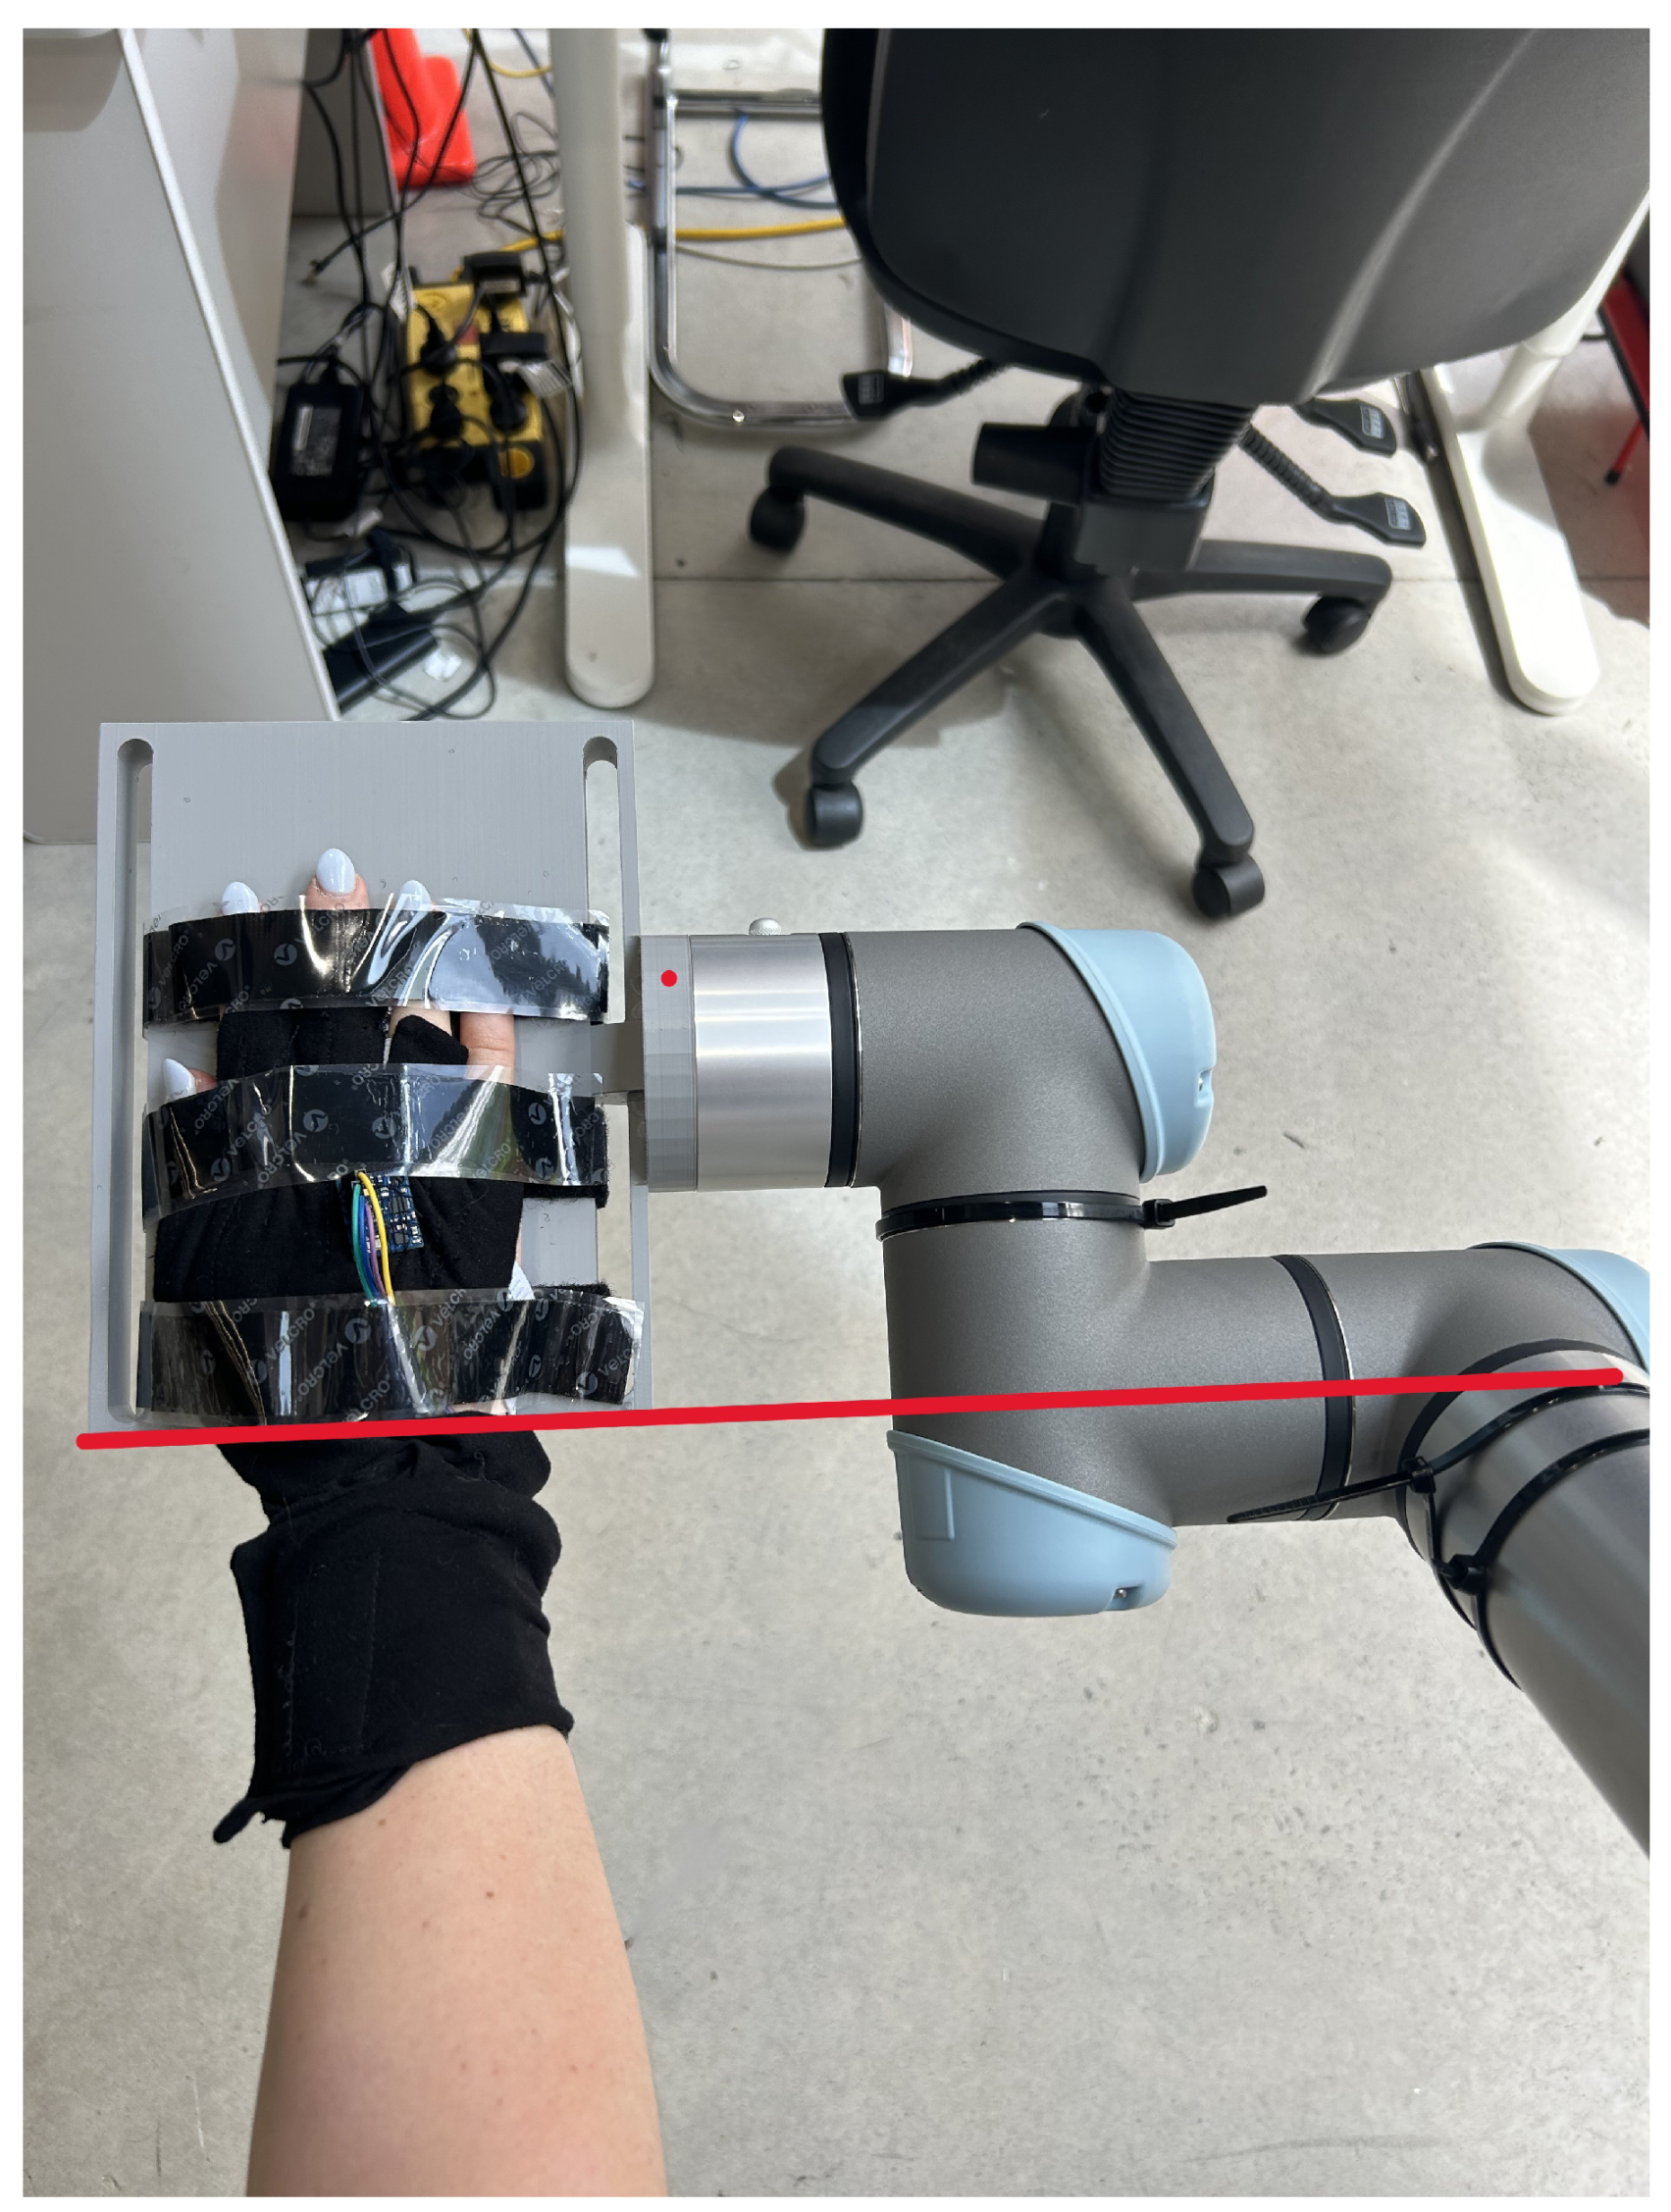
Figure 5.
Start and end angles of linear mapping of RFSs
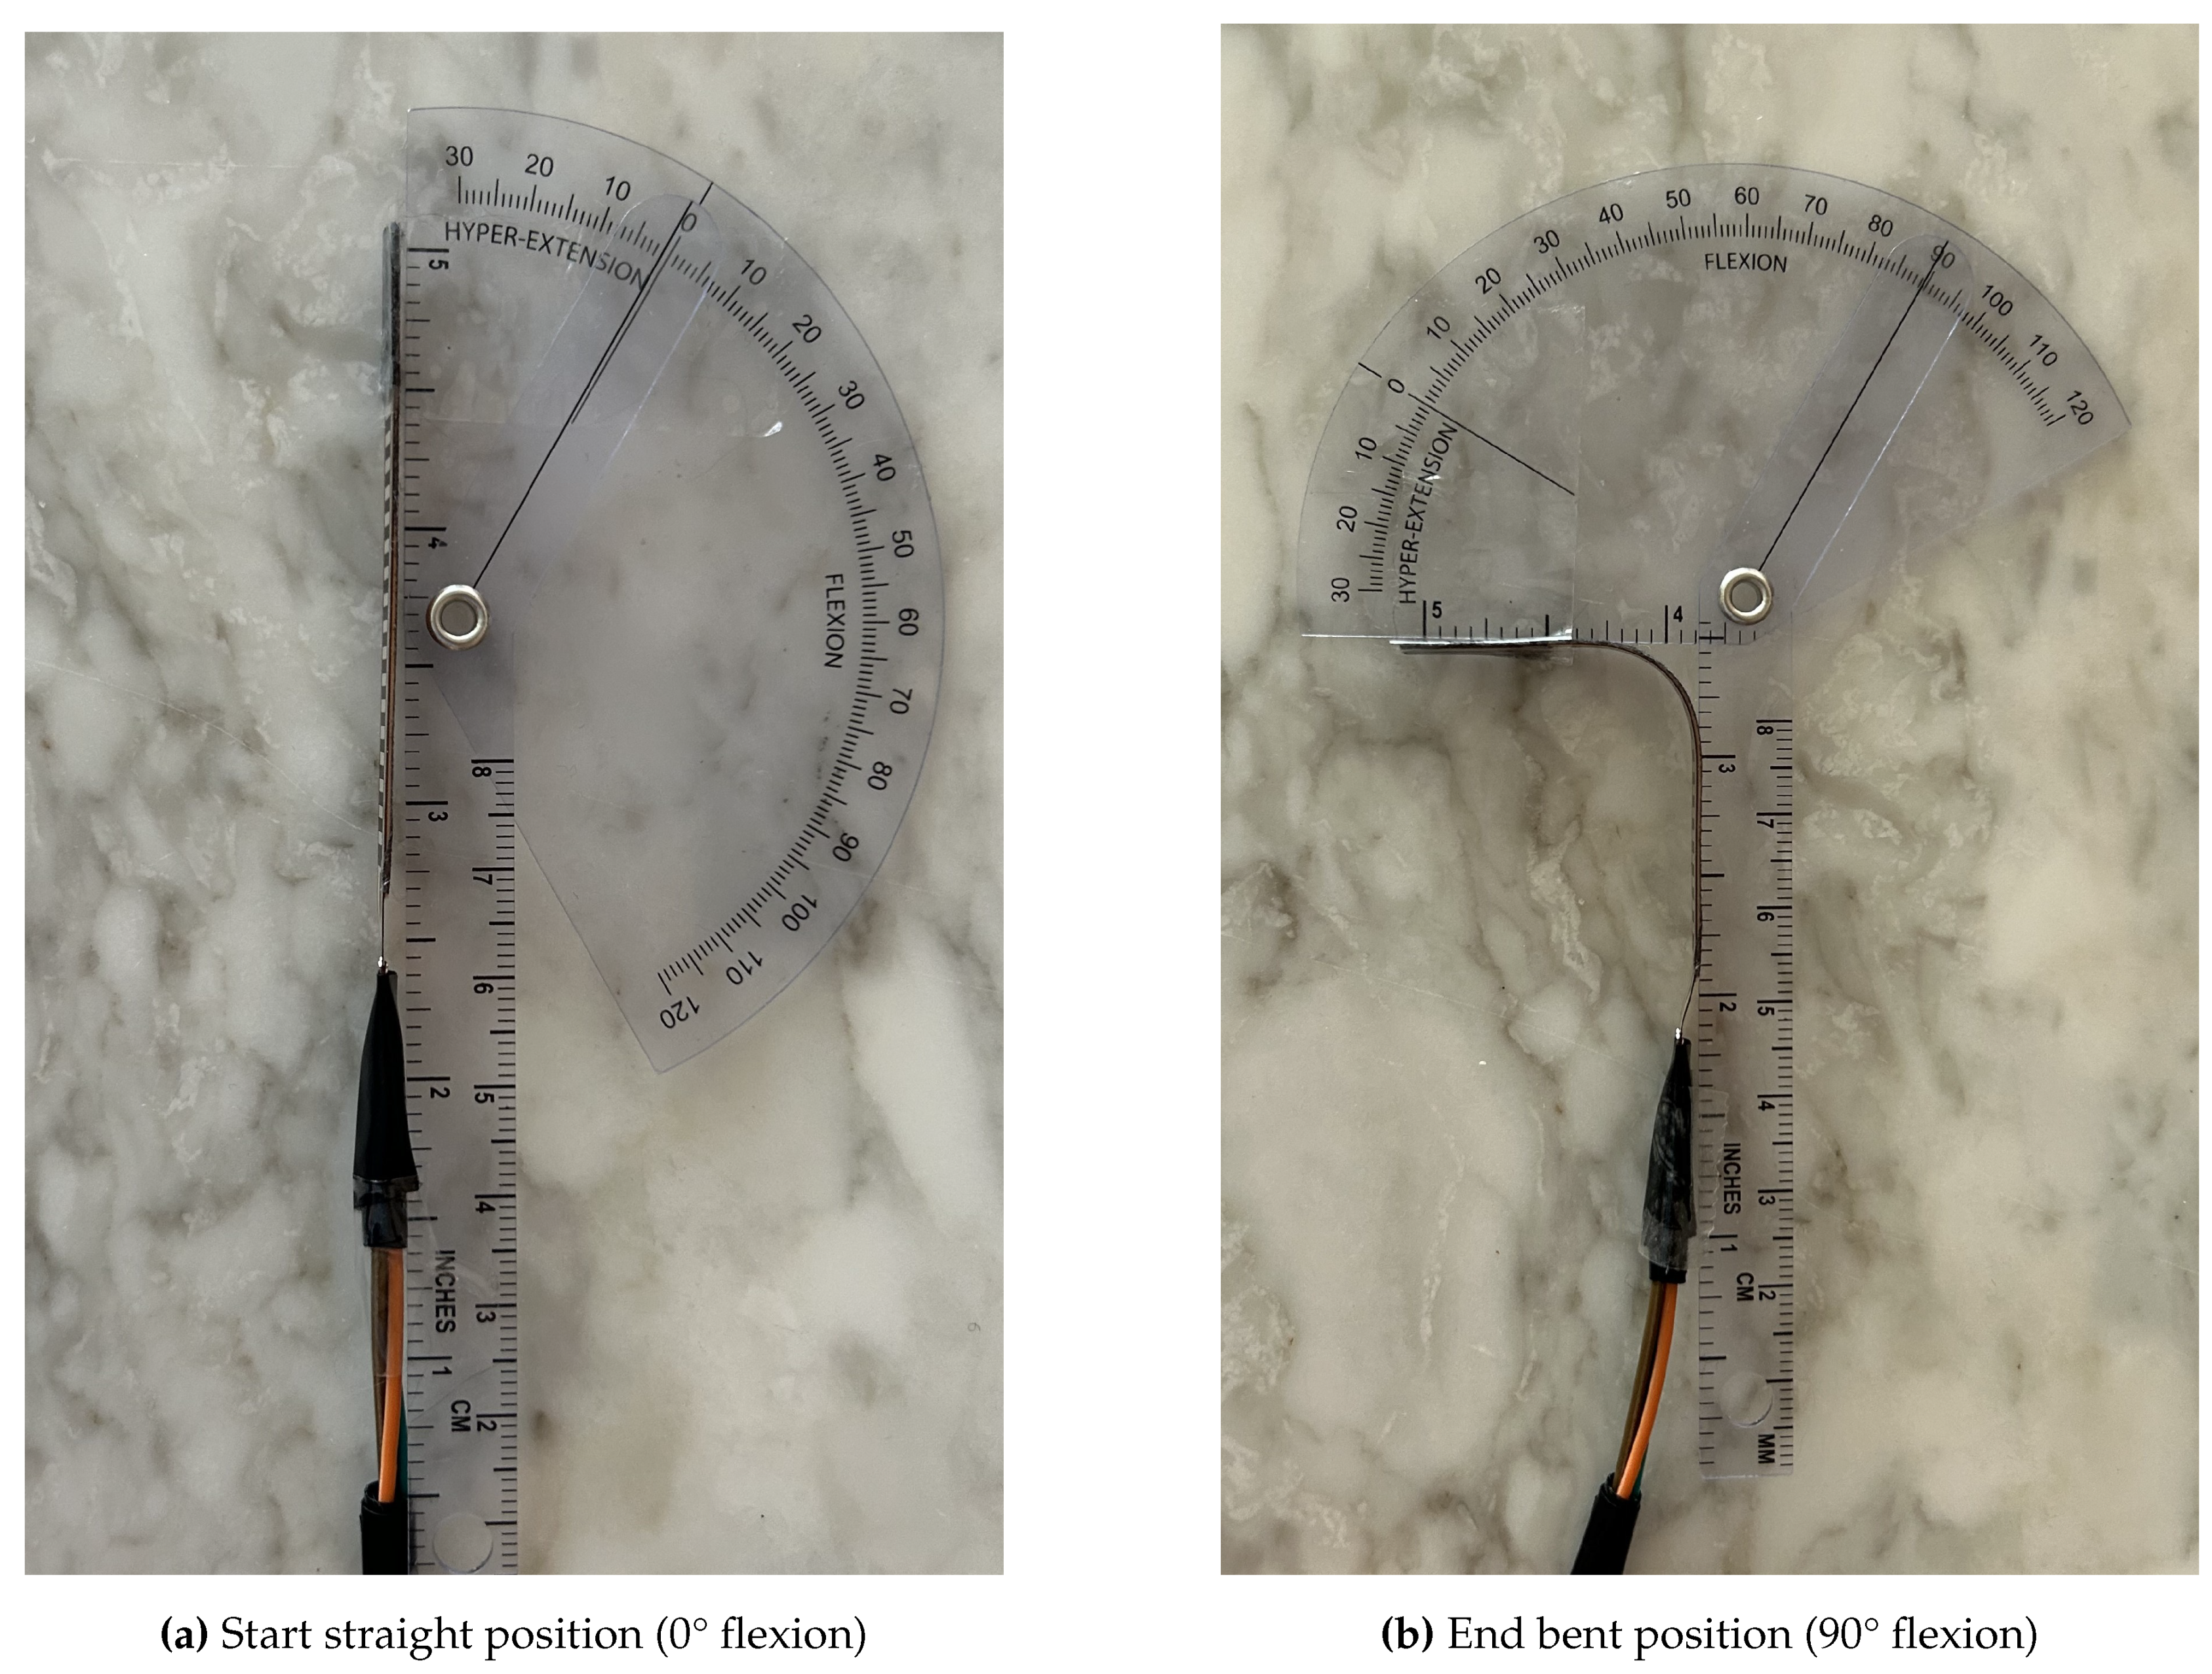
Figure 6.
Calibration positions of hand
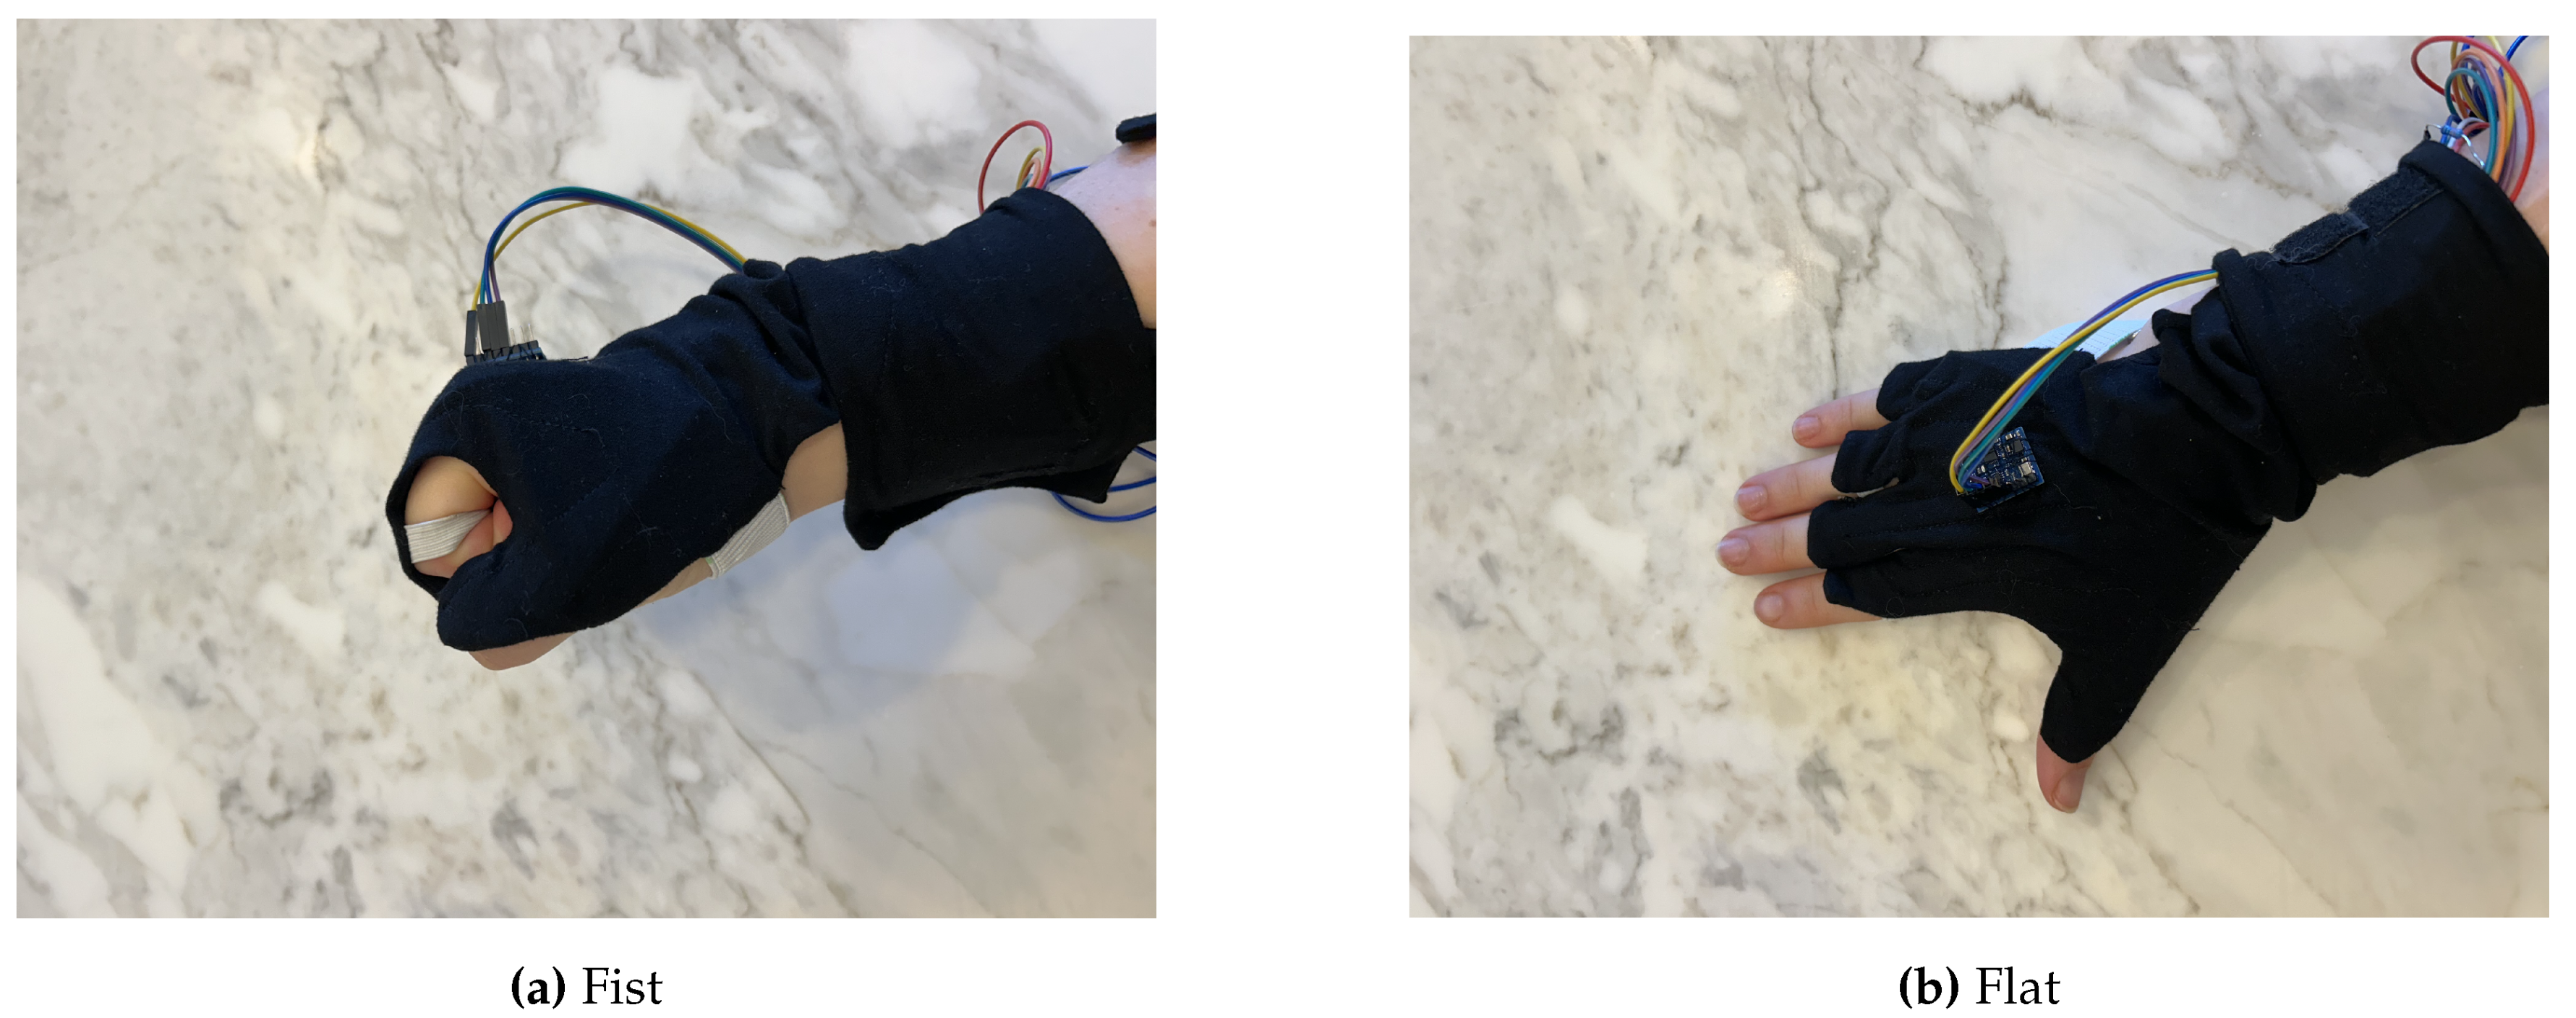
Figure 7.
Mapping of the resistance (k) to the angle of deflection (°). Each curve represents a different RFS used in the glove: dotted for thumb, solid for index, dashed for middle, dash-dotted for ring and solid with stars for little finger.
Figure 7.
Mapping of the resistance (k) to the angle of deflection (°). Each curve represents a different RFS used in the glove: dotted for thumb, solid for index, dashed for middle, dash-dotted for ring and solid with stars for little finger.
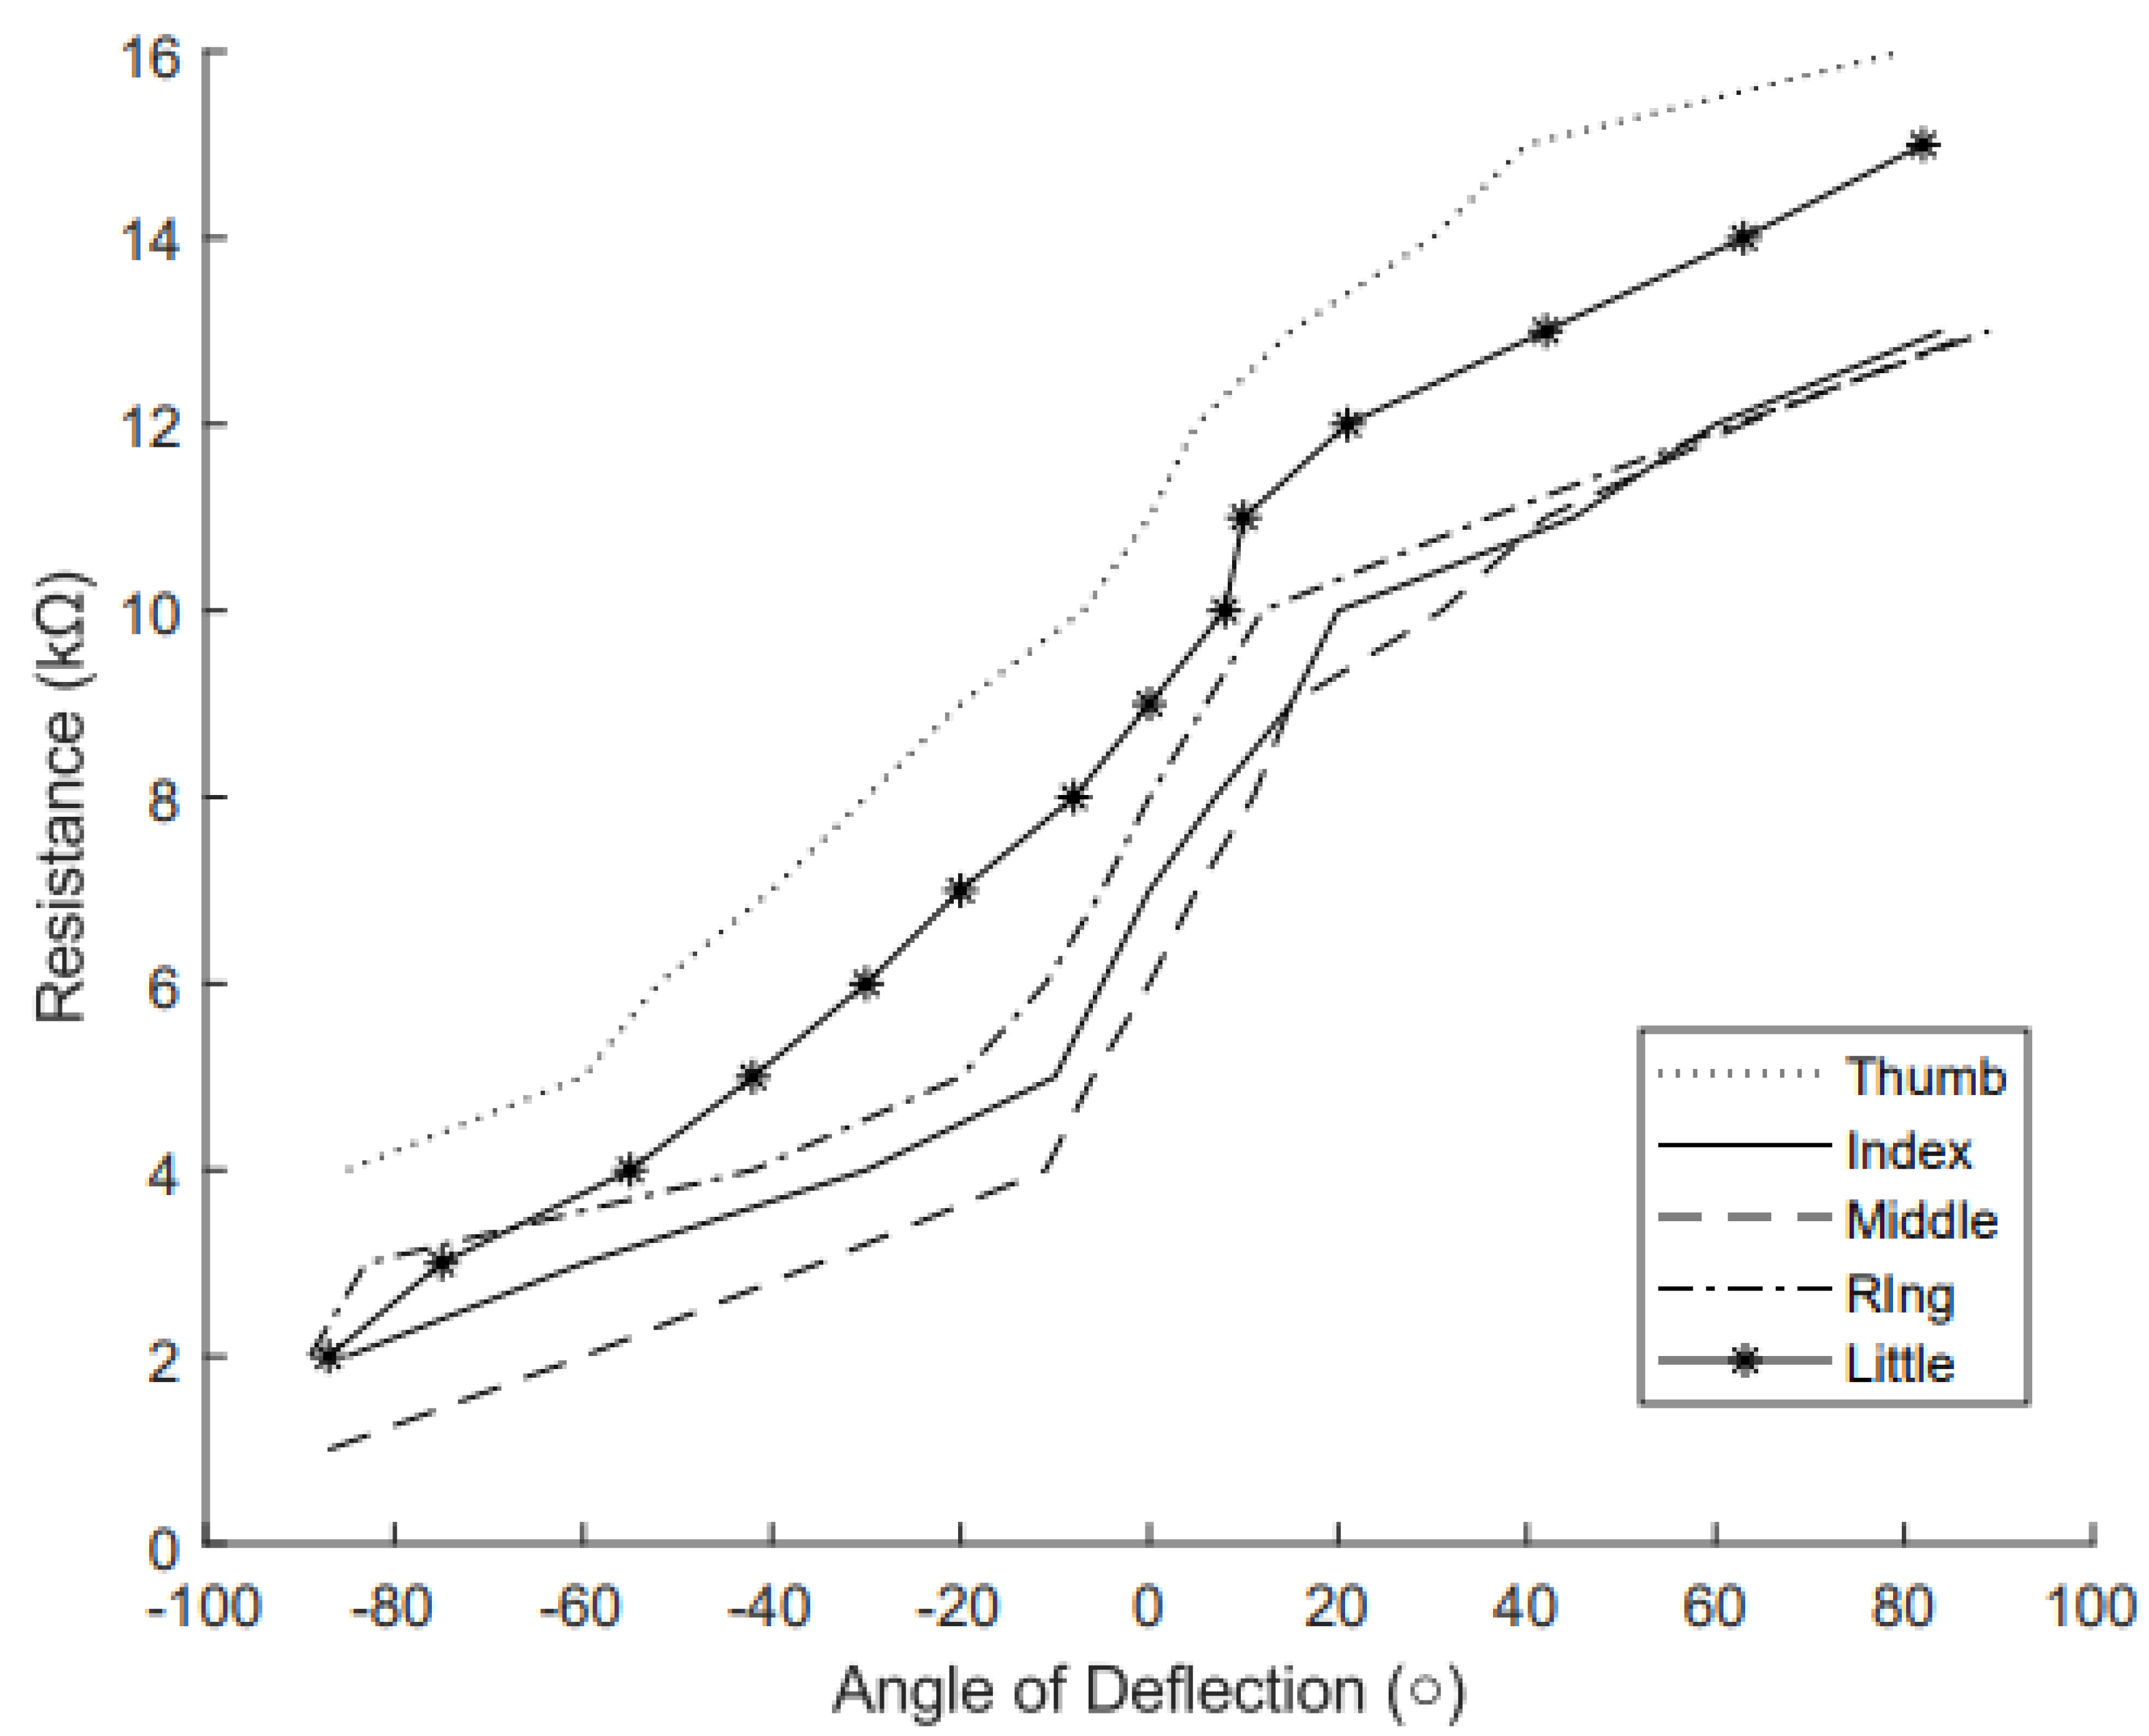
Figure 8.
Comparison of measured wrist angle and real wrist angle as measured by IMU. Data points (o) represent the average value at each angle, with standard deviations across each trial shown by error bars. The dotted trendline shows the linearity of the relationship between measured and real angles.
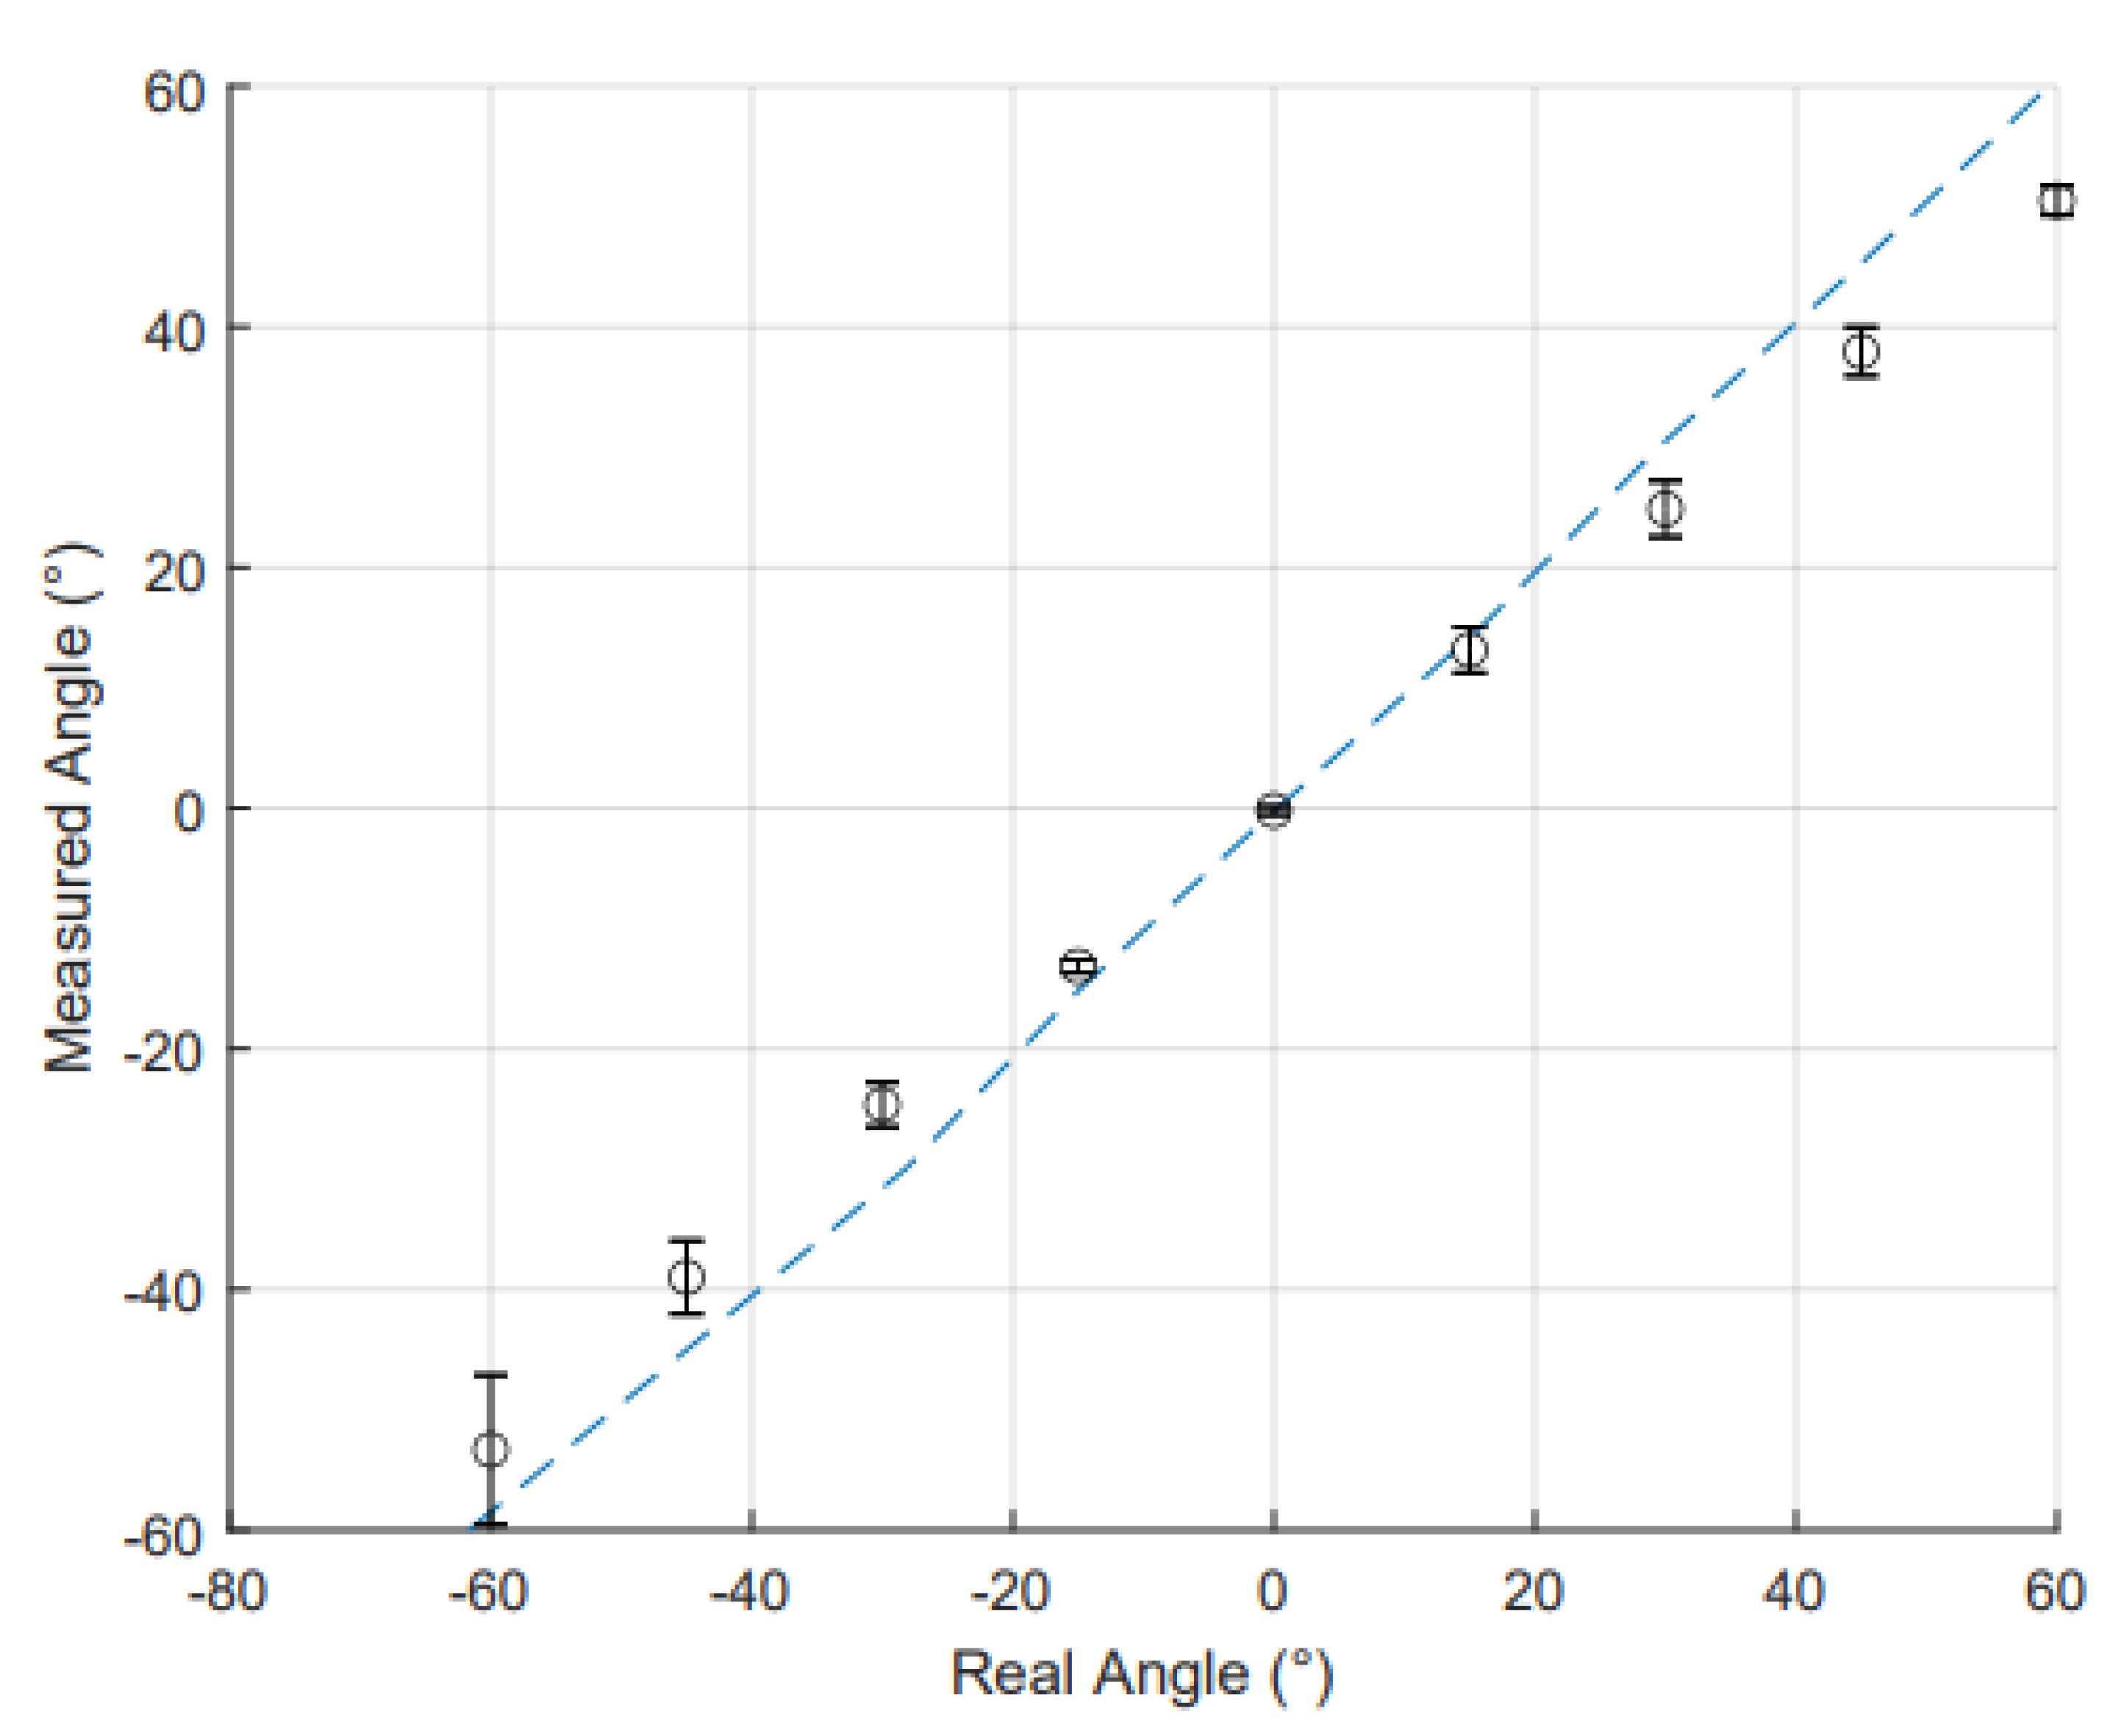
Figure 9.
Comparison of measured finger angle and real finger angle as measured by RFS. Data points (o) represent the average value at each angle, with standard deviations across each trial shown by error bars. The coloured dotted trendline shows the linearity of the relationship between measured and real angles for all the fingers: blue for index, yellow for middle, green for ring and red for little finger.
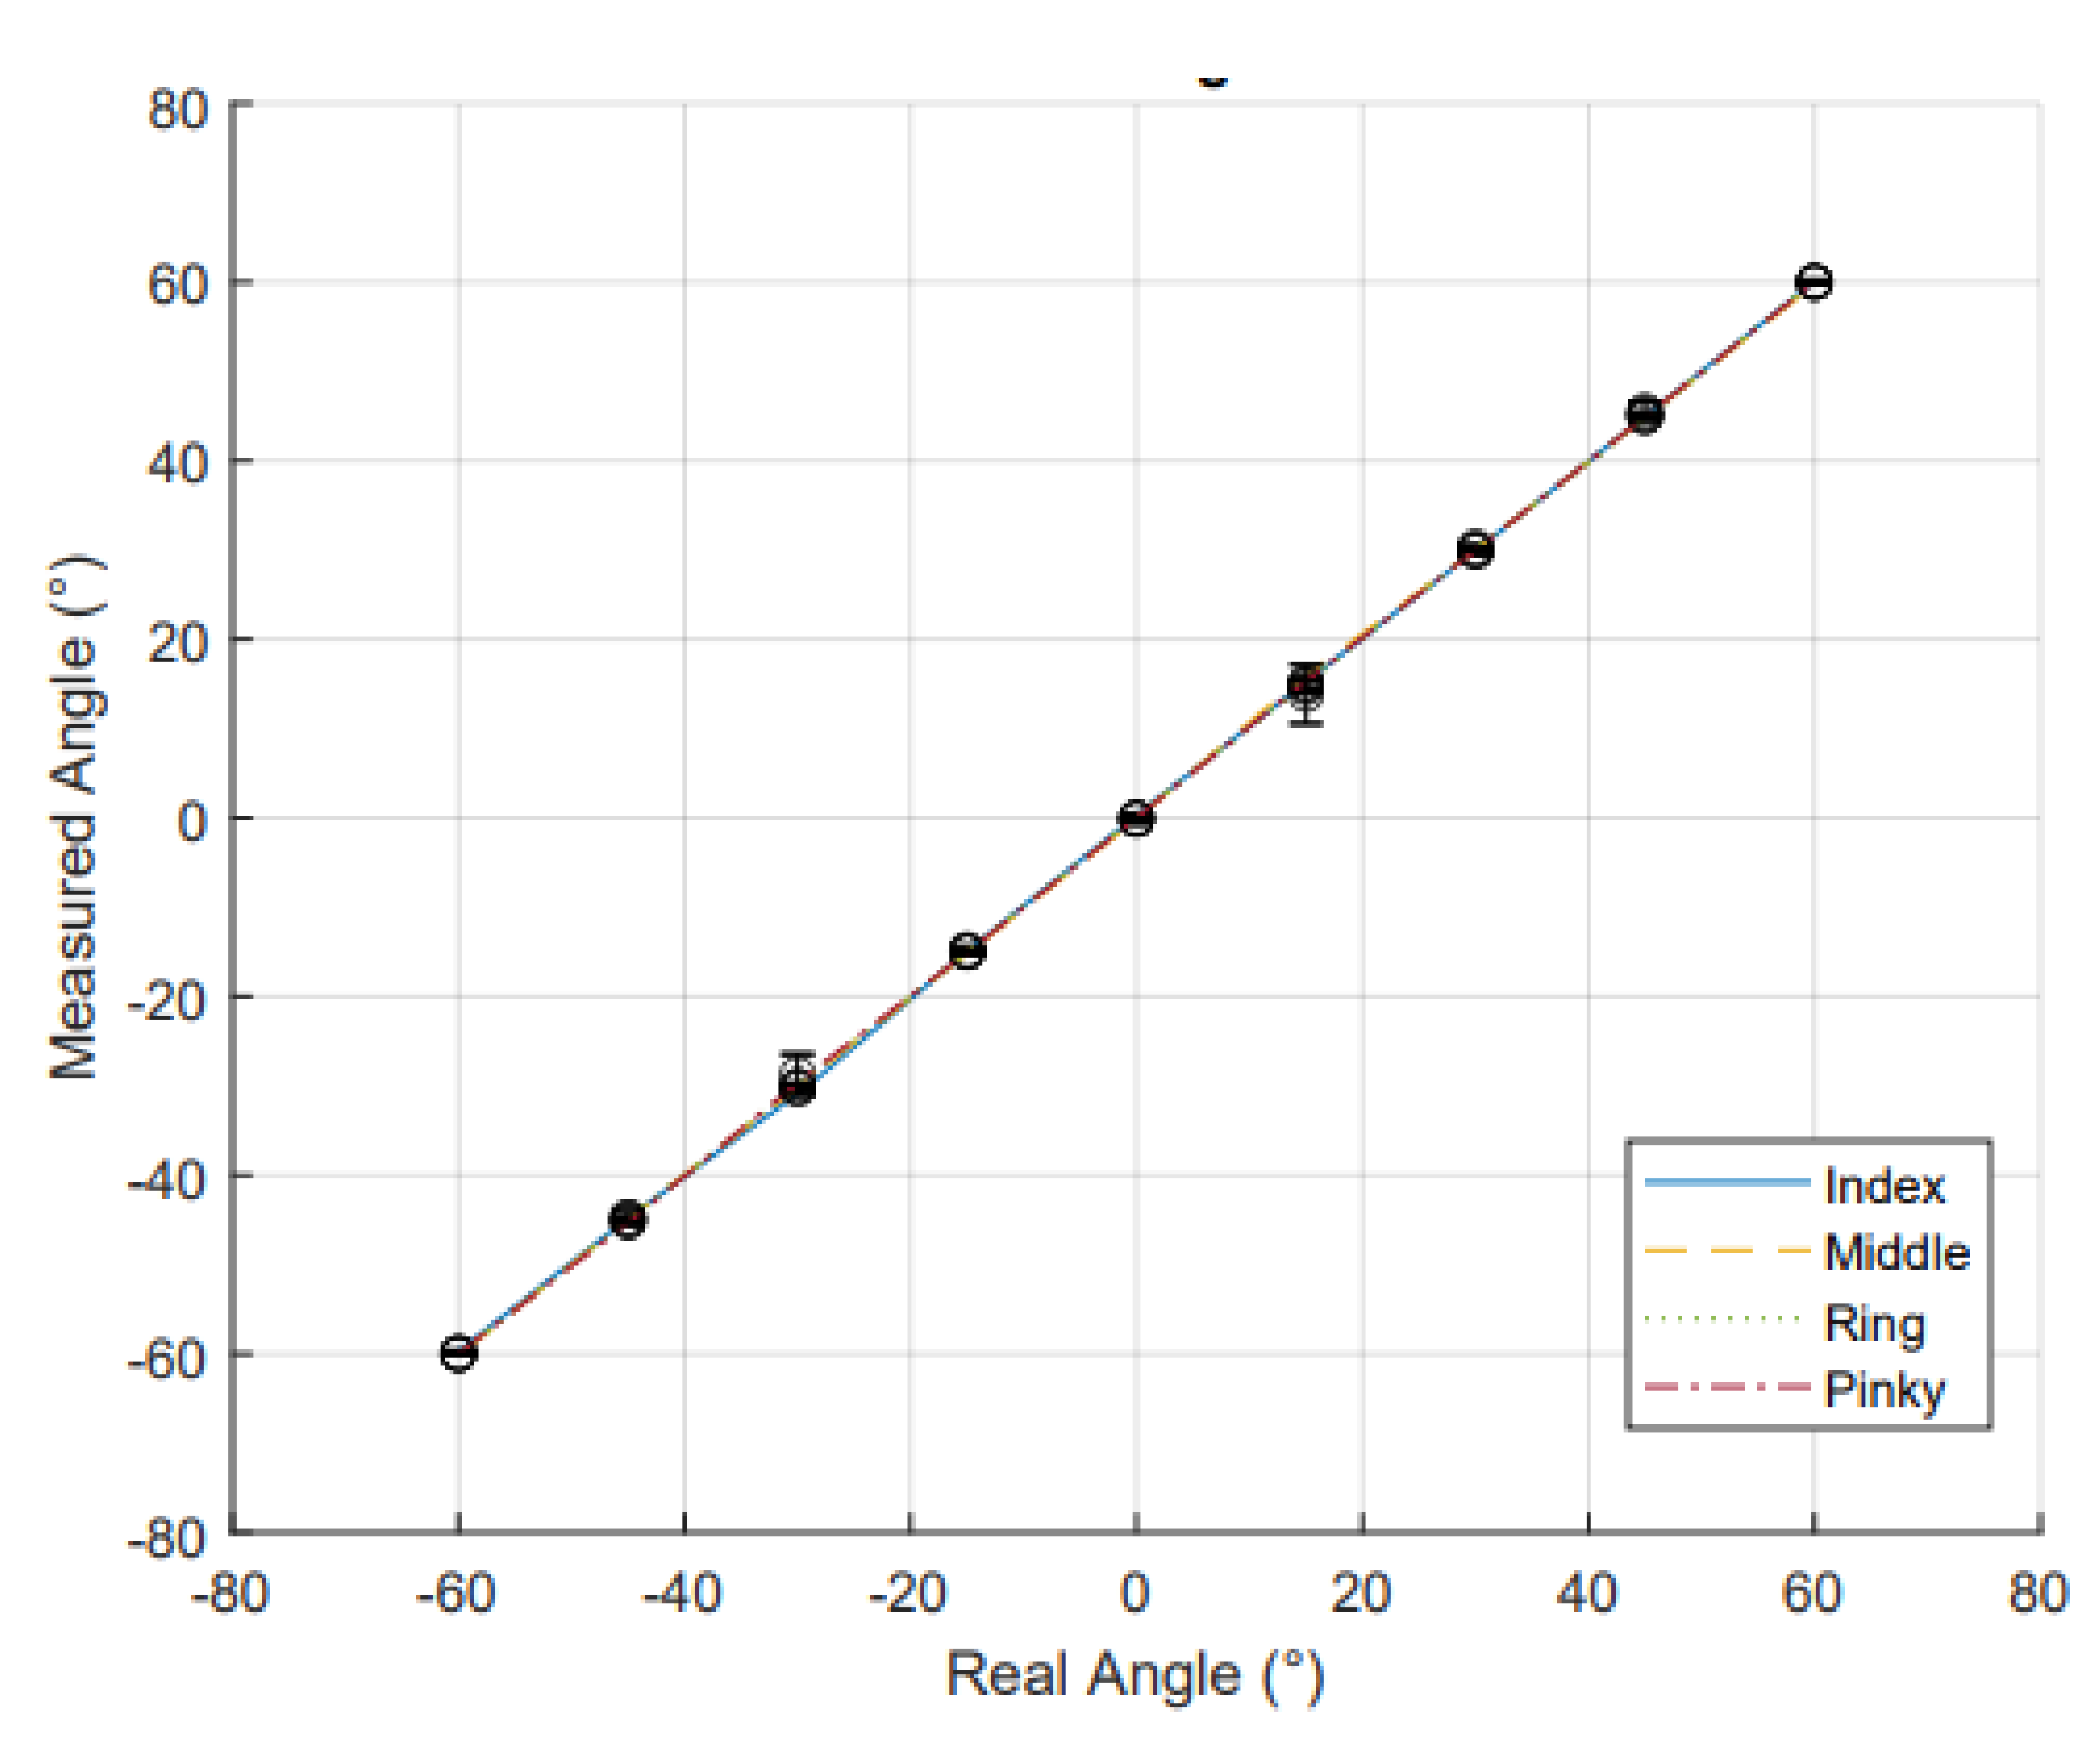
Figure 10.
Comparison of measured thumb angle and real thumb angle as measured by RFS. Data points (o) represent the average value at each angle, with standard deviations across each trial shown by error bars. The dotted trendline shows the linearity of the relationship between measured and real angles.
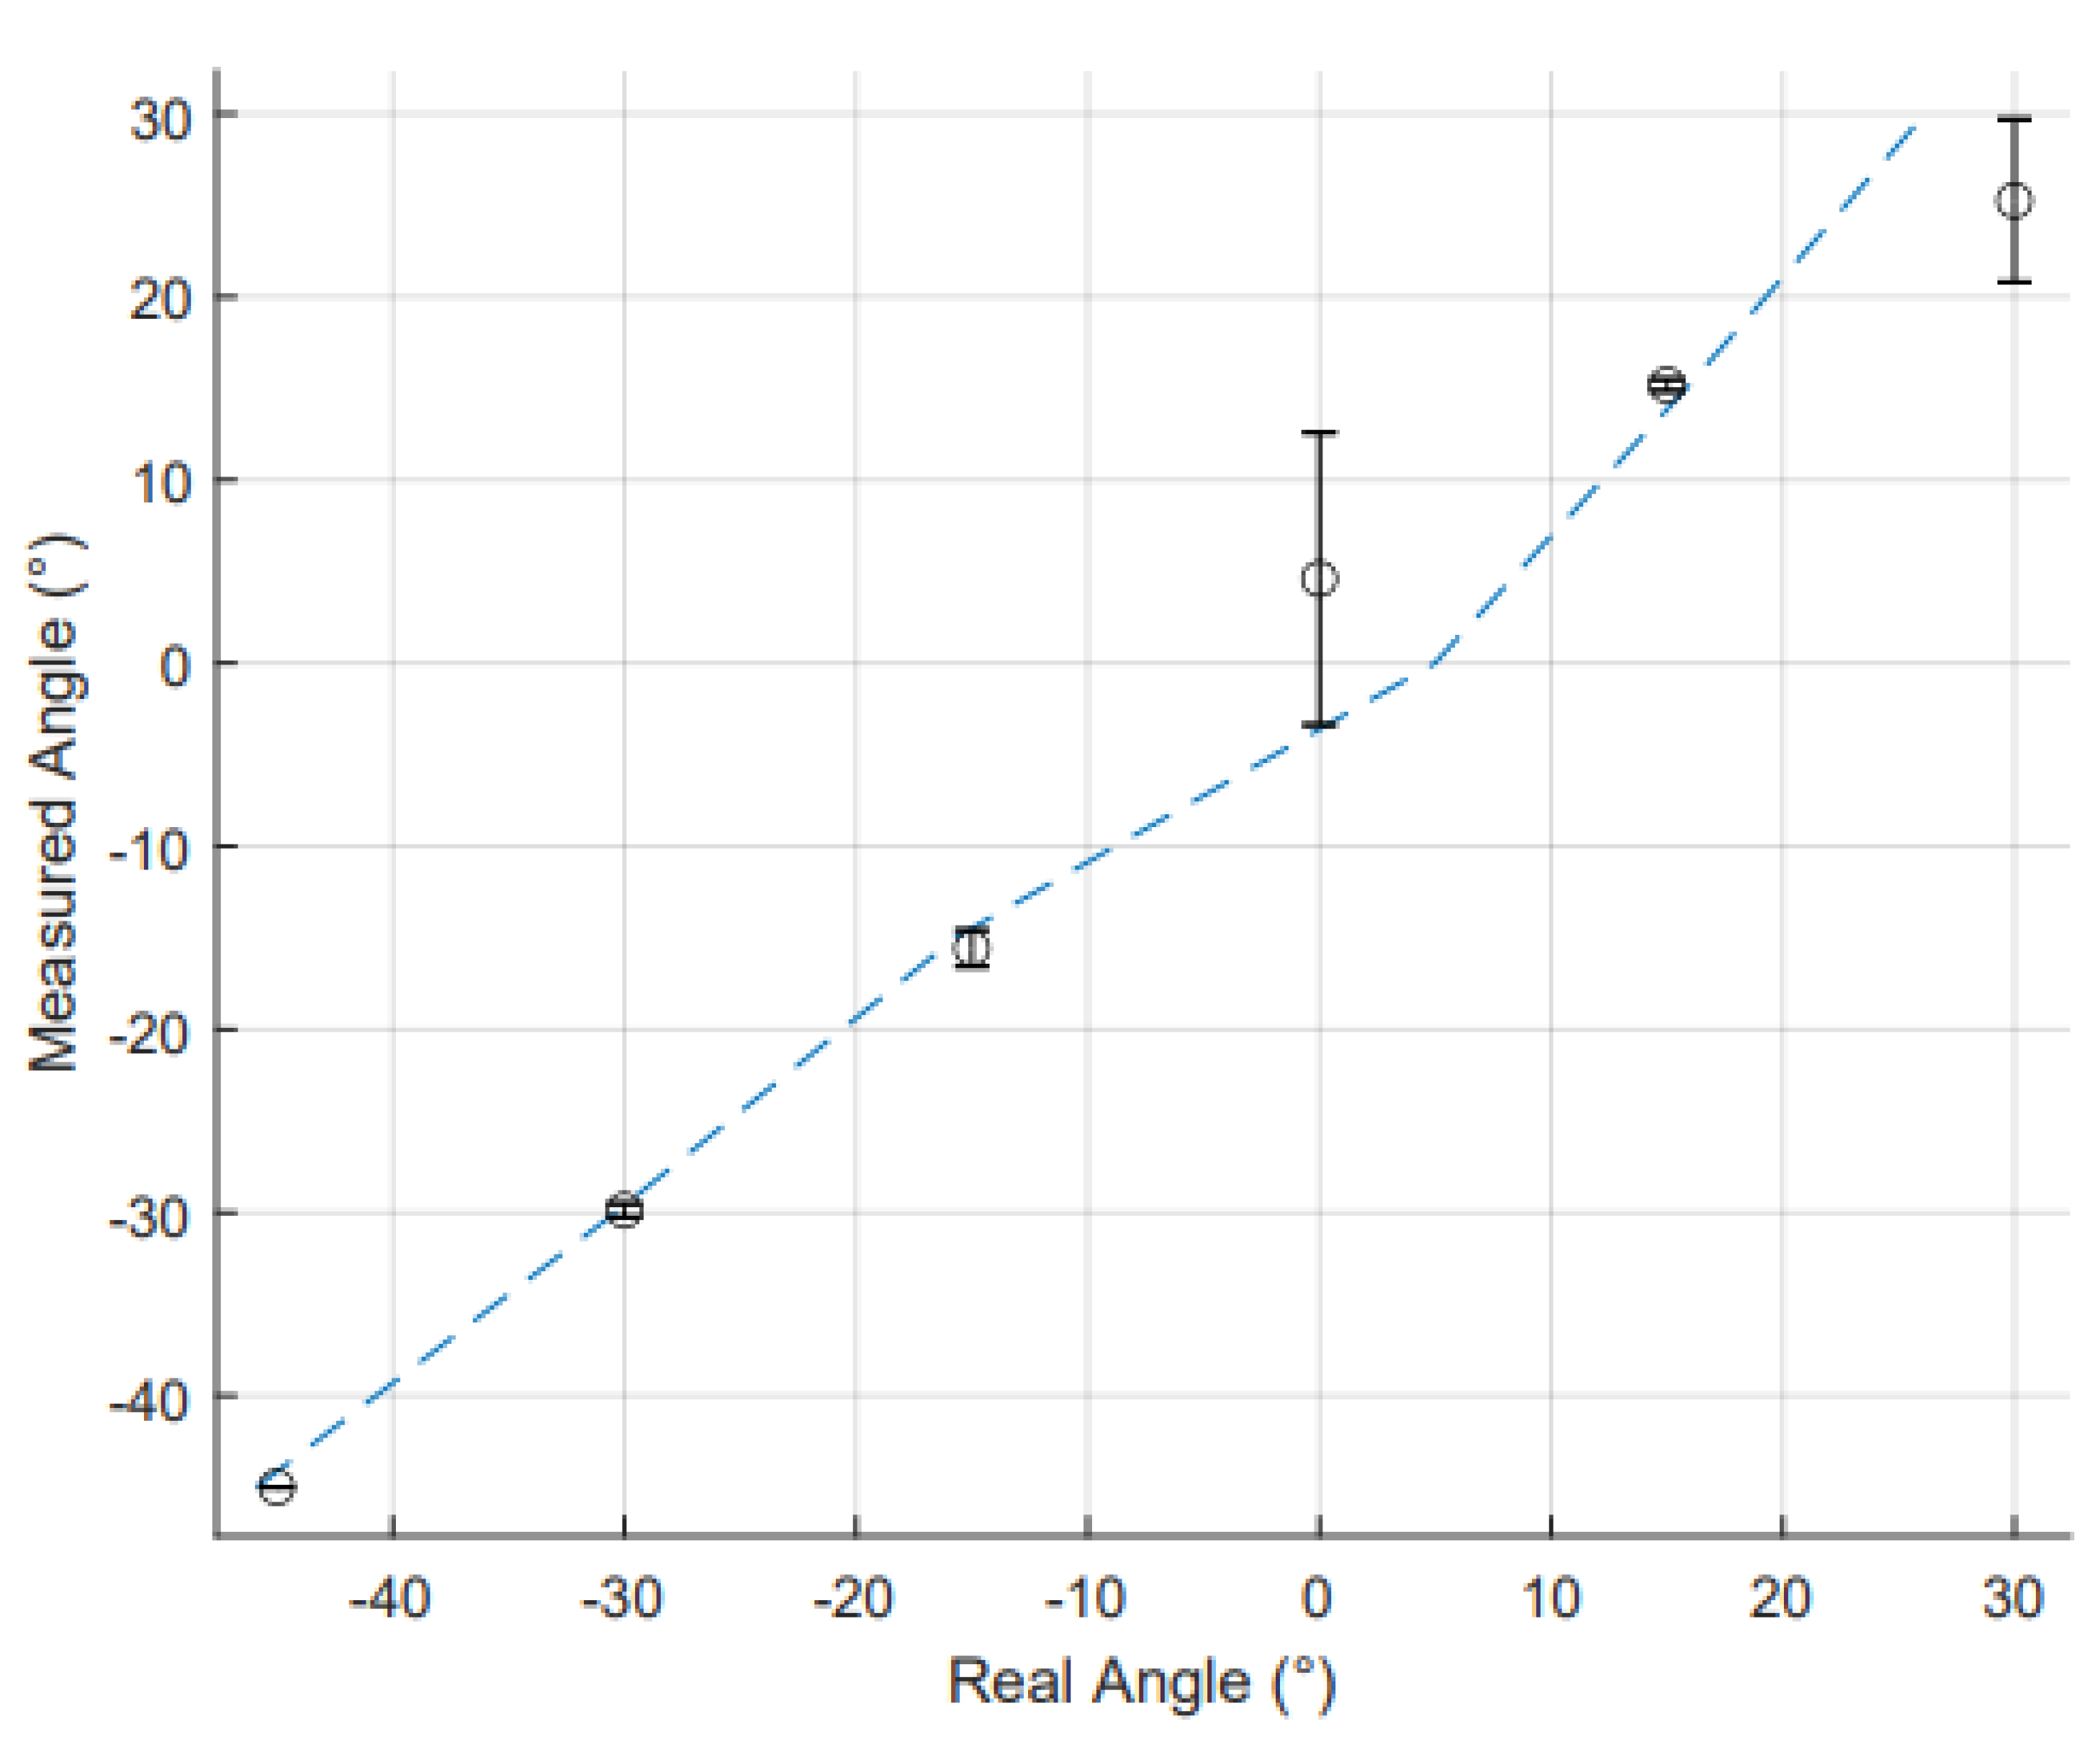
Figure 11.
IMU angle verses time data showing progression of angle change over a 6 s period.
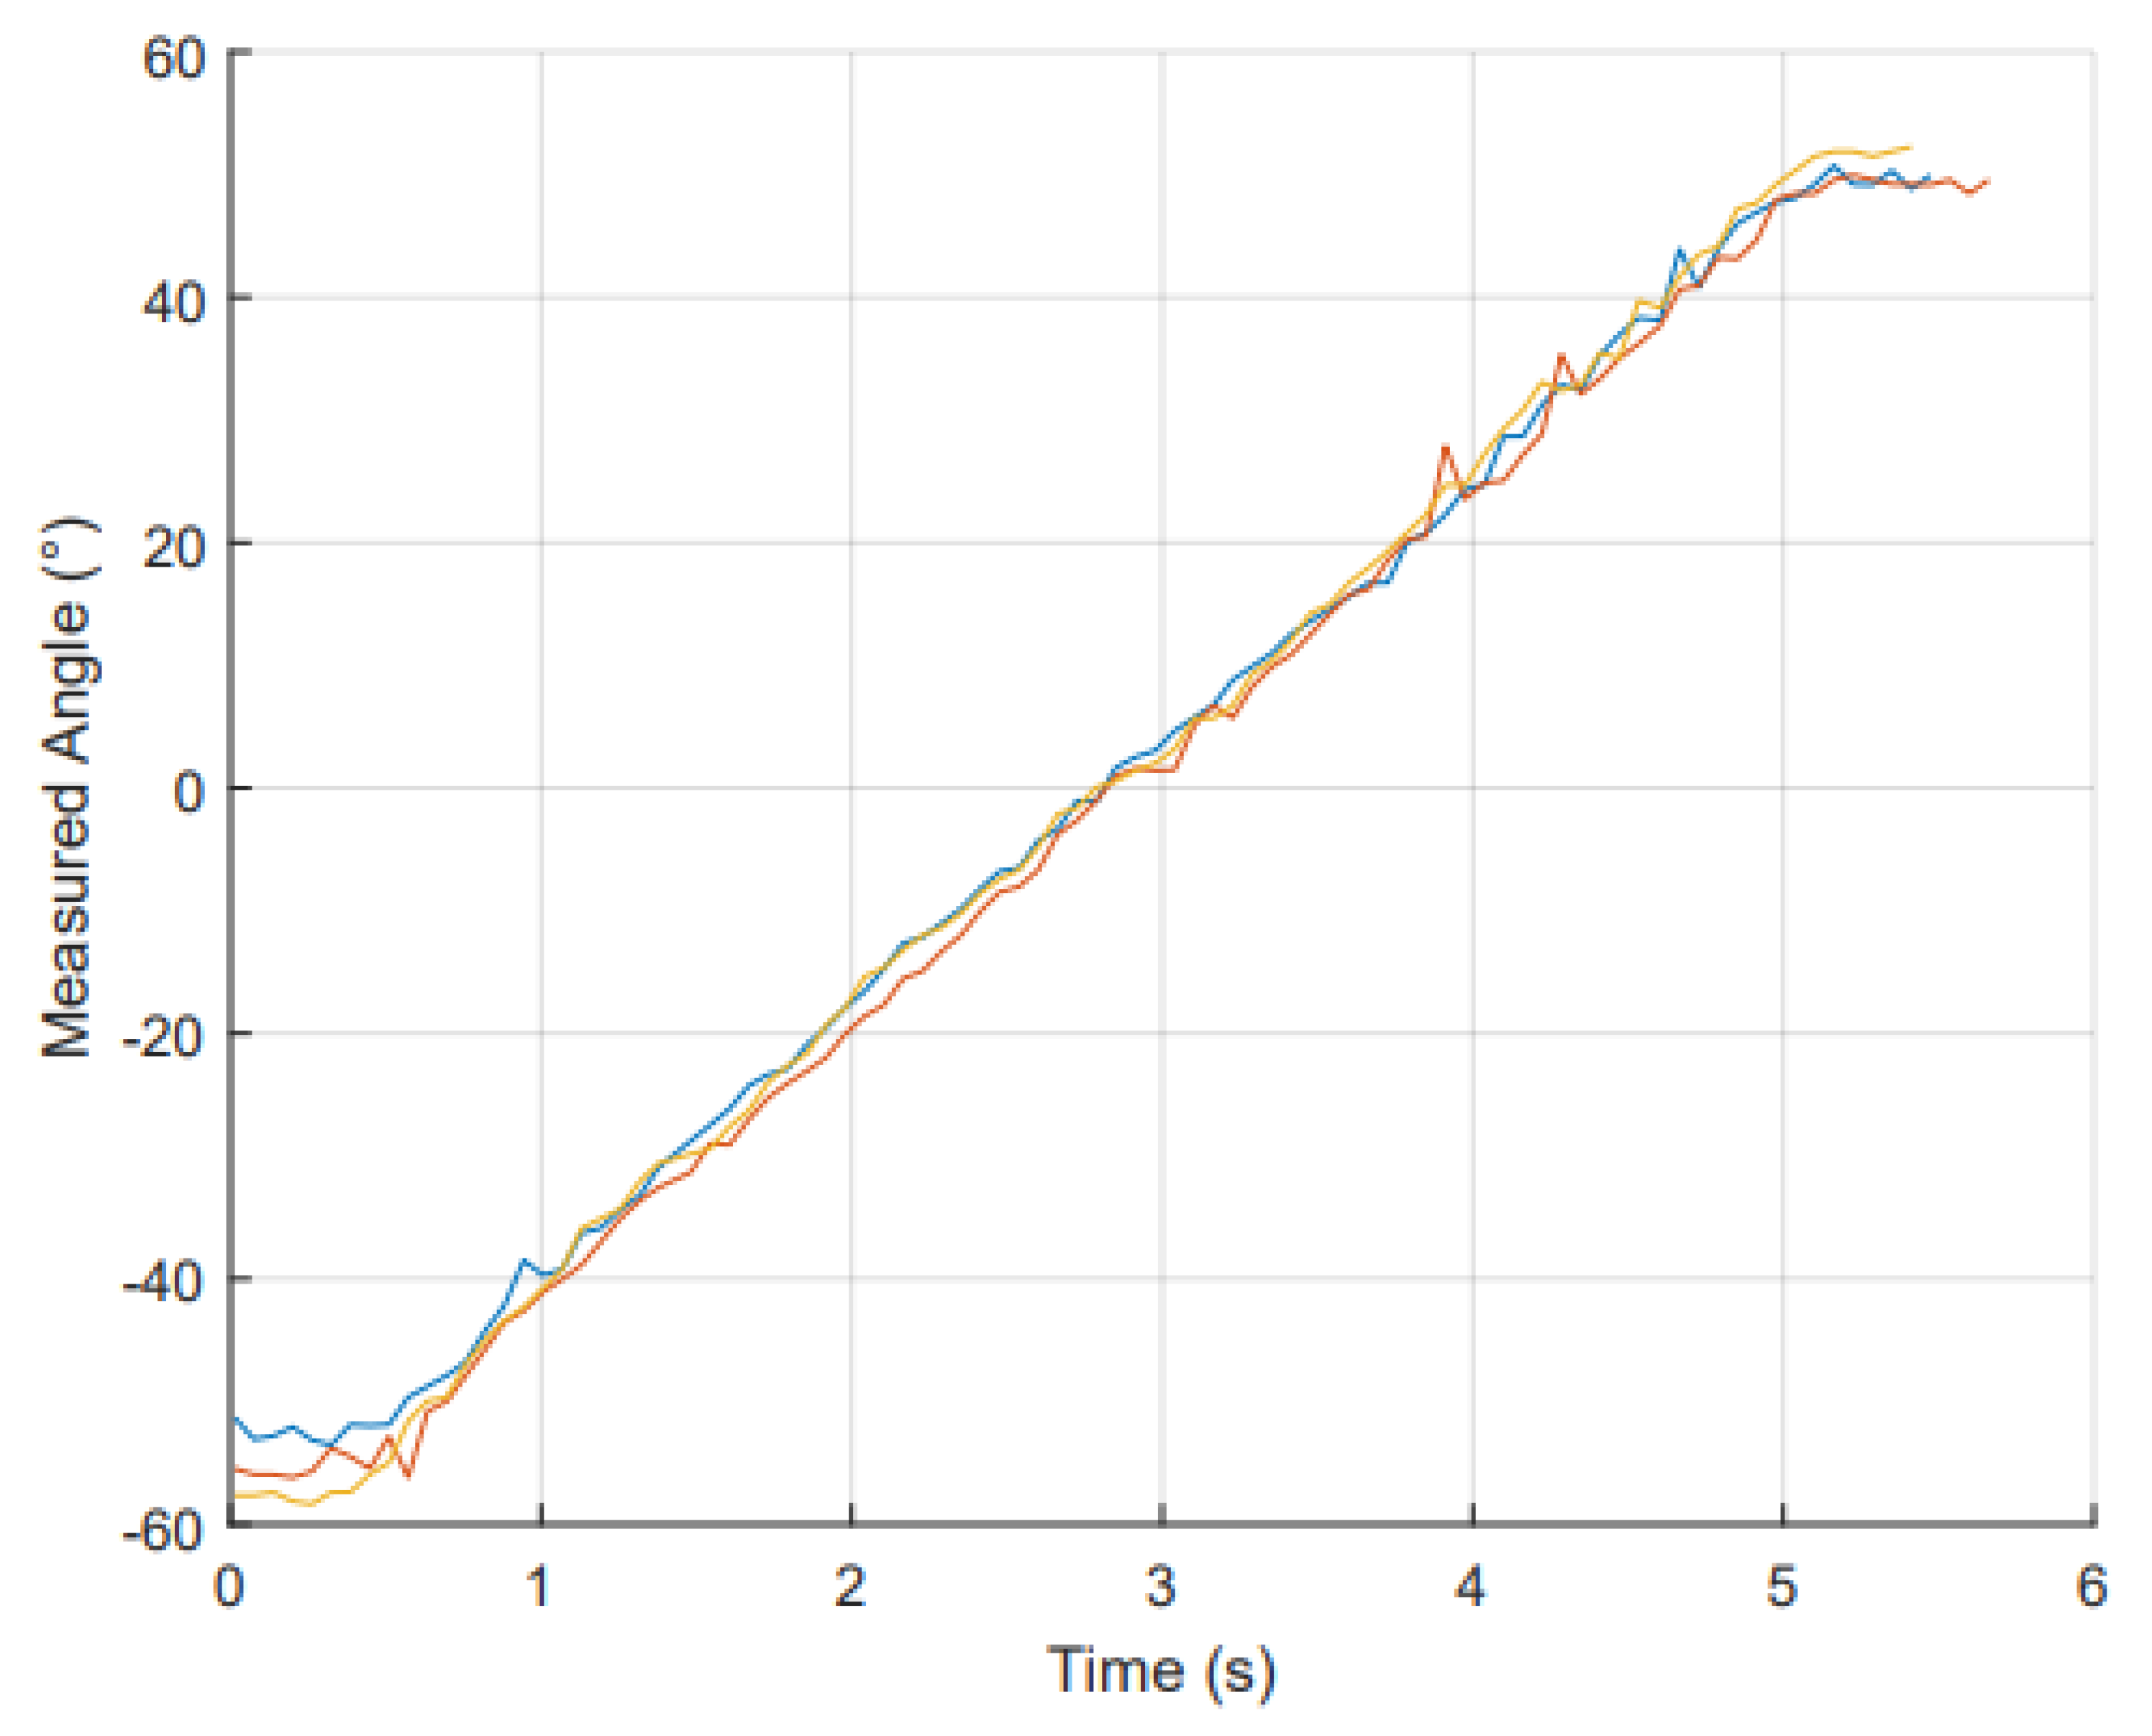

Table 1.
Table of costs for one glove (AUD)
| Component | Unit Cost | Quantity Needed | Total Cost |
|---|---|---|---|
| Fabric | $8 per metre | 250 mm x 250 mm | $2 |
| Elastic | $6 per metre | 100 mm strip | $0.6 |
| Velcro | $12 per metre | 100 mm strip | $1.2 |
| RFSs | $19 each | 5 | $95 |
| IMU | $3.75 each | 1 | $3.75 |
| Raspberry Pi Pico WH | $11.5 each | 1 | $11.5 |
| MCP30008 | $8.7 each | 1 | $8.7 |
| 380 resistor | $0.1 each | 5 | $0.5 |
| Breadboard with wire | $6 each | 2 | $12 |
| Total | $135.25 |
Table 2.
Linear regression equations modelling the relationship between resistanced and angle. The ’Linear fit’ column shows equations of the form where y is ther predicted angle, x is the resistance measured, m is the slope, and b is the intercept. The value indicates the goodness of fit for each equation reflecting the accuracy of the model for each finger.
| RFS placement | Linear fit | of the fit |
|---|---|---|
| thumb | 12.87 x - 93.11 | 0.95 |
| index | 14.07 x - 109.30 | 0.94 |
| middle | 11.70 x - 105.90 | 0.98 |
| ring | 11.39 x - 123.4 | 0.97 |
| little | 11.82 x - 78.46 | 0.94 |
Table 3.
Comparison of and MAE values for each joint and sensor type in static conditions.
| Sensor Type | Joint | MAE [95% CI] (°) | |
|---|---|---|---|
| IMU | Wrist | 4.85 [4.78, 4.91] | 0.99 |
| RFS | Index | 0.28 [0.27, 0.29] | 0.98 |
| RFS | Middle | 0.19 [0.19, 0.20] | 0.97 |
| RFS | Ring | 0.13 [0.13, 0.14] | 0.99 |
| RFS | Little | 0.14 [0.14, 0.15] | 0.97 |
| RFS | Thumb | 1.71 [1.64, 1.77] | 0.90 |
Table 4.
Comparison of and MAE values for each joint and sensor type over three angular velocities: Slow, Medium, and Fast.
Table 4.
Comparison of and MAE values for each joint and sensor type over three angular velocities: Slow, Medium, and Fast.
| Values | ||||
|---|---|---|---|---|
| Sensor Type | Joint | Slow Speed | Medium Speed | Fast Speed |
| IMU | Wrist | 0.999 | 0.999 | 0.999 |
| RFS | Index | 0.978 | 0.979 | 0.982 |
| RFS | Middle | 0.959 | 0.966 | 0.972 |
| RFS | Ring | 0.980 | 0.989 | 0.964 |
| RFS | Little | 0.978 | 0.967 | 0.981 |
| RFS | Thumb | 0.959 | 0.903 | 0.972 |
| Mean Absolute Error Averages ° | ||||
| Sensor Type | Joint | Slow Speed | Medium Speed | Fast Speed |
| IMU | Wrist | 3.933 | 4.052 | 3.668 |
| RFS | Index | 5.273 | 4.134 | 4.787 |
| RFS | Middle | 5.006 | 4.450 | 4.143 |
| RFS | Ring | 4.632 | 3.762 | 4.862 |
| RFS | Little | 5.603 | 5.468 | 4.632 |
| RFS | Thumb | 5.409 | 5.955 | 4.067 |
Disclaimer/Publisher’s Note: The statements, opinions and data contained in all publications are solely those of the individual author(s) and contributor(s) and not of MDPI and/or the editor(s). MDPI and/or the editor(s) disclaim responsibility for any injury to people or property resulting from any ideas, methods, instructions or products referred to in the content. |
© 2024 by the authors. Licensee MDPI, Basel, Switzerland. This article is an open access article distributed under the terms and conditions of the Creative Commons Attribution (CC BY) license (https://creativecommons.org/licenses/by/4.0/).
Copyright: This open access article is published under a Creative Commons CC BY 4.0 license, which permit the free download, distribution, and reuse, provided that the author and preprint are cited in any reuse.


