
Submitted:
03 December 2024
Posted:
04 December 2024
You are already at the latest version
Abstract
Background: Pancreatic Ductal Adeno-Carcinoma (PDAC) is a highly aggressive cancer, with lim-ited treatment options. Disruption of the circadian clock, which regulates key cellular processes, has been implicated in PDAC initiation and progression. Hence, targeting circadian clock components may offer new therapeutic opportunities for the disease. This study investigates the cytopathic ef-fects of TH301, a novel CRY2 stabilizer, on PDAC cells, aiming to evaluate its potential as a novel therapeutic agent. Methods: PDAC cell lines (AsPC-1, BxPC-3 and PANC-1) were treated with TH301, and cell viability, cell cycle progression, apoptosis, autophagy, circadian gene and protein expression profiles were analyzed, using MTT assay, flow cytometry, Western blotting and RT-qPCR technologies. Results: TH301 proved to significantly decrease cell viability and to induce cell cycle arrest at the G1-phase across all PDAC cell lines, and especially the AsPC-1 and BxPC-3 ones, herein examined. It caused dose-dependent apoptosis and autophagy, and it synergized with Chloroquine and Oxaliplatin to enhance anti-oncogenicity. The remarkable induction of p21 by TH301 was shown to follow clock- and p53-independent patterns, thereby indicating the critical engagement of alternative mechanisms. Conclusions: TH301 demonstrates significant anti-cancer activities in PDAC cells, thus serving as a promising, new therapeutic agent, which can also syn-ergize with approved treatment schemes, by targeting pathways beyond circadian clock regulation. Altogether, TH301 likely opens new therapeutic windows for the successful management of pan-creatic cancer, in the clinical practice.
Keywords:
Apoptosis
; Autophagy
; BMAL1
; Cancer
; CDKN1A
; Cell Cycle
; Chemoresistance
; Circadian Clock
; CRY2
; Oxaliplatin
; Pancreatic Ductal Adeno-Carcinoma (PDAC)
; p21CIP1/WAF1
; p53
; TH301
1. Introduction
Pancreatic Ductal Adeno-Carcinoma (PDAC) is one of the most aggressive forms of cancer, being characterized by a high mortality rate and poor prognosis. Globally, PDAC is the 12th most common malignancy and the 6th leading cause of cancer mortality [1]. Despite advances in cancer research and treatment, PDAC remains challenging to diagnose early and treat effectively.
Current treatment modalities for PDAC include chemotherapy, radiation and surgery. Radiotherapy and common chemotherapy treatments used in the management of PDAC, including Gemcitabine and combination regimens, pose significant challenges and have limitations. In addition to treatment exhibiting high toxicity and serious side effects, the major difficulties in managing PDAC stem from inherent or acquired resistance mechanisms, such as activation of compensatory pathways, and aberrations in drug transport and metabolism processes. Development of resistance to chemotherapy and radiotherapy seems to be significantly influenced by genetic lesions in specific genes, such as the KRAS, CDKN2A, TP53 and SMAD4 ones, along with the simultaneous activation of downstream signaling pathways [2,3]. Recent efforts focusing on functional inhibition of the mutated KRAS protein in PDAC have shown promising pre-clinical and clinical results [4]. However, cancer cells often develop compensatory escape mechanisms to counteract the efficacy of KRAS inhibitors [5]. Most importantly, tumor's complex microenvironment and presence of cancer stem cells (CSCs) further complicate, and frequently compromise, treatment efforts (6,7).
These challenges necessitate the prompt development of alternative therapeutic strategies. One emerging area of interest is the pharmacological modulation of cell’s circadian clock [8]. The circadian clock is an intrinsic time-keeping system that regulates gene expression and various biological functions across all kingdoms of life [9]. At the molecular level, it consists of transcription-translation feedback loops that maintain rhythmic expression of genes involved in critical cellular processes, like metabolism, redox regulation, autophagy, DNA repair and cell cycle control [10,11,12,13]. The “positive arm” of this feedback loop includes BMAL1 (Brain and Muscle ARNT-Like 1) and CLOCK (Circadian Locomotor Output Cycles Kaput) proteins, which form a complex that activates E-box-mediated transcription of target genes, including Period (PER1, 2 and 3) and Cryptochrome (CRY1 and 2), which in turn constitute the “negative arm”. PER and CRY proteins accumulate in the cytoplasm, form heterodimers and translocate into the nucleus to inhibit the BMAL1 complex, thereby repressing their own transcription [14]. This feedback inhibition creates a roughly 24 h cycle of gene expression. Additional feedback loops involving nuclear receptors, like REV-ERBs and RORs, further stabilize the clock, by regulating BMAL1 transcription via its promoter ROR elements [15,16]. Cell cycle key genes, essentially controlling the G1/S and G2/M transitions, are also transcriptionally activated by the BMAL1 complex, since their respective promoters contain E-boxes [17]. Likewise, Gréchez-Cassiau and collaborators have previously reported in hepatocytes that clock genes can control the G1/S progression through regulation of the CDKN1A gene, which encodes for the p21CIP1/WAF1 (p21) protein, a major Cyclin/CDK inhibitor, with alterations of the circadian clock leading to changes in p21 expression and aberrations in cell proliferation [18].
Deregulation of circadian clock plays crucial roles in tumorigenesis, by promoting rapid proliferation, increased metabolic demand and resistance to apoptosis [19,20]. In PDAC, disruption of circadian clock can be evidenced by bioinformatics and gene expression studies [21], revealing altered activities of core clock genes, as compared to normal pancreatic tissue-derived ones, while it is associated with faster tumor growth, reduced survival rate and increased chemotherapy resistance [22]. Importantly, small molecules that modulate circadian clock components have shown promise in pre-clinical studies, by disrupting cancer cell proliferation and enhancing existing treatment efficacies [8]. CRY stabilizers, such as the KL001 compound and its derivatives, have been shown to extend survival in glioblastoma models, by downregulating stemness genes and inducing apoptosis [23,24]. On the other hand, CRY inhibitors, like KS15, have demonstrated effectiveness in breast cancer cells, by disrupting CRY-mediated transcriptional repression, leading to cell cycle arrest, apoptosis and increased sensitivity to chemotherapy [25,26]. Other clock modulators, including REV-ERB and ROR agonists, have also presented promising anti-cancer activities, further supporting the potential of targeting circadian clock components as a novel therapeutic strategy (27–31).
Taken together, PDAC remains a major challenge in medical and molecular oncology, immediately requiring innovative treatment approaches. The cardinal circadian clock’s role in cell cycle regulation, and cancer initiation and progression renders clock a promising therapeutic target. Hence, employment of circadian clock modulators are expected to improve current therapies or offer new options able to clinically benefit PDAC-affected patients. Towards this direction, we have, herein, focused on the pivotal clock component CRY2, which is critically implicated in DNA repair, cell cycle regulation and chemoresistance modulation, thereby rendering CRY2 a novel and important (druggable) target for pancreatic cancer therapy [27,28,29,30]. Given that the synthetic chemical compound TH301 acts as a bona fide -novel- CRY2 stabilizer [31], by mechanistically investigating the TH301-induced sub-routines that can cause severe PDAC pathologies, we, herein, aim to introduce new strategies, with strong promise for more effective treatments and better outcomes for the disease.
2. Results
2.1. TH301-Induced Reduction of Cell Viability And Growth Of Pancreatic Cancer Cells In A Mutational Signature-Dependent Fashion
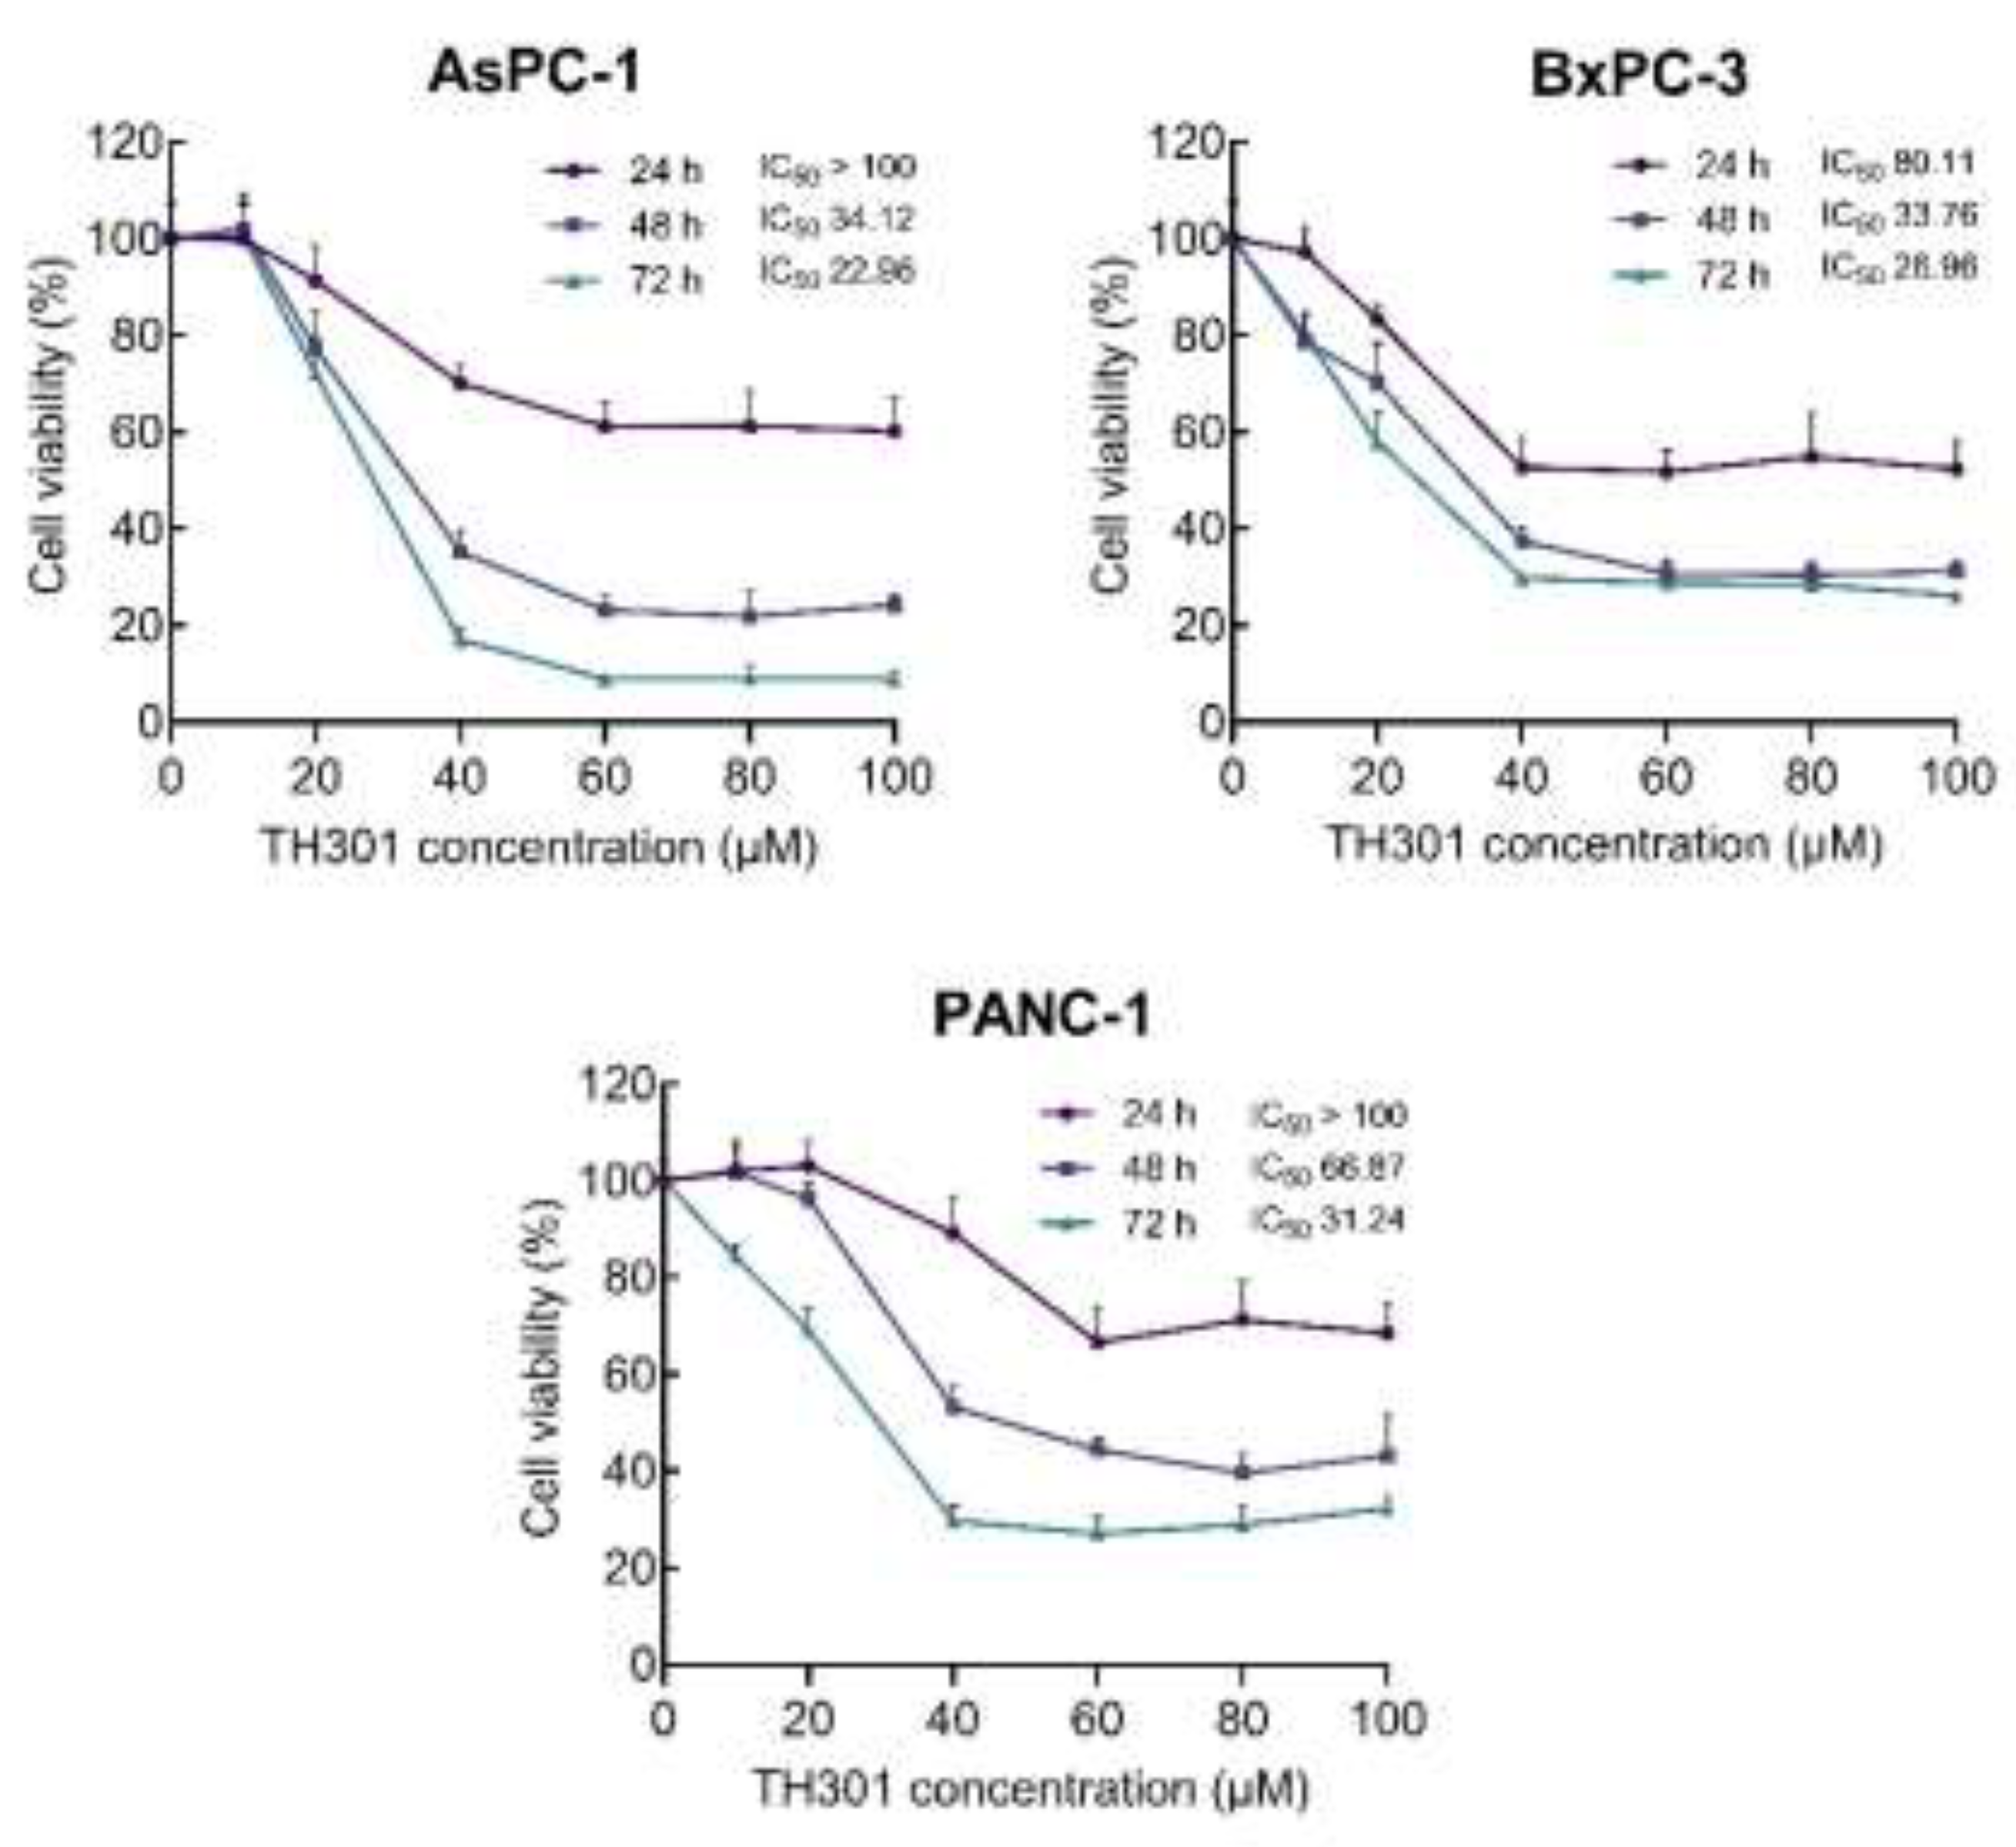
To demonstrate that circadian clock proteins can be, indeed, modulated in PDAC, we, first, analyzed the mutational frequencies of core circadian clock genes compared to key PDAC mutations in a cohort of 185 PDAC patients (Suppl. Figure S1). This analysis highlighted the low probability of mutations in core clock genes, thus indicating that circadian clock functionality can be effectively targeted with specific modulators in PDAC settings. Hence, to explore the effects of TH301, a bona fide CRY2 stabilizer, on PDAC “modelled” pathology, we, herein, examined the human pancreatic cancer cell lines AsPC-1, BxPC-3 and PANC-1, with each one of them being characterized by a distinct mutational signature detailed in Table S2 (https://depmap.org). To determine the pathogenic responses of TH301 regarding cell viability and growth, the 3 PDAC cell lines were treated with increasing concentrations (0 - 100 μΜ) of TH301, for 24, 48, and 72 h. Cell survival was assessed and quantified by MTT assays. As shown in Figure 1, TH301 administration resulted in a dose- and time-dependent significant decrease in the viability of all 3 cell lines, herein, examined. Both AsPC-1 and BxPC-3 cell lines presented a notable reduction in cell viability after 48 h of treatment with 40 μM TH301. In contrast, PANC-1 cells showed comparatively lower sensitivity, requiring 72 h, or 60 μM, to achieve a similar decrease rate of cell viability (~60% reduction). Most importantly, AsPC-1 cells were presented with severe pathologies after their exposure to TH301 for 72 h, having the observed viabilities almost eliminated at the 60, 80 and 100 μM of TH301 concentration (Figure 1).
These results prove that TH301 can cause strong cytotoxic effects in human pancreatic cancer cells, following dose-, time- and cell type-dependent patterns. To the same direction, we, next, performed MTT assays to evaluate and quantify the pathogenic effects of KL001, a CRY1/2 stabilizer [23,24], and KS15, a CRY1/2 inhibitor [25,26], on AsPC-1, BxPC-3 and PANC-1 cell viabilities. Treatment with KL001 was less effective than TH301 in reducing cell viability, whereas KS15 showed absence of significant reduction in cell viabilities (Suppl. Figure S2). However, AsPC-1 cells were characterized by a prominent decline in their viability and growth at the highest dose (e.g., 100 μM) and longest time (e.g., 72 h) of each agent (e.g., KL001, or KS15) administration. Taken together, the CRY stabilizer, TH301, demonstrates a superior efficacy in reducing (human) pancreatic cancer cell viability and growth, compared to other CRY modulators, herein, tested (KL001 and KS15).
Figure 1.
TH301 reduces (human) pancreatic cancer cell viability in a dose- and time-dependent manner. Cell viability (%) graphs of AsPC-1, BxPC-3 and PANC-1 cells after treatment with increasing concentrations (0, 20, 40, 60, 80 and 100 μM) of TH301, for 24, 48 and 72 h (post-administration). Data from 6 replicates are presented as Mean ± SD values. IC50 values were measured through employment of a non-linear regression model.
2.2. TH301 Causes Cell Cycle Arrest at the G1-Phase and Alters Protein Expression Profiles Of Critical Regulators In Pancreatic Cancer Cells: Mutational Load-Dependent Responses
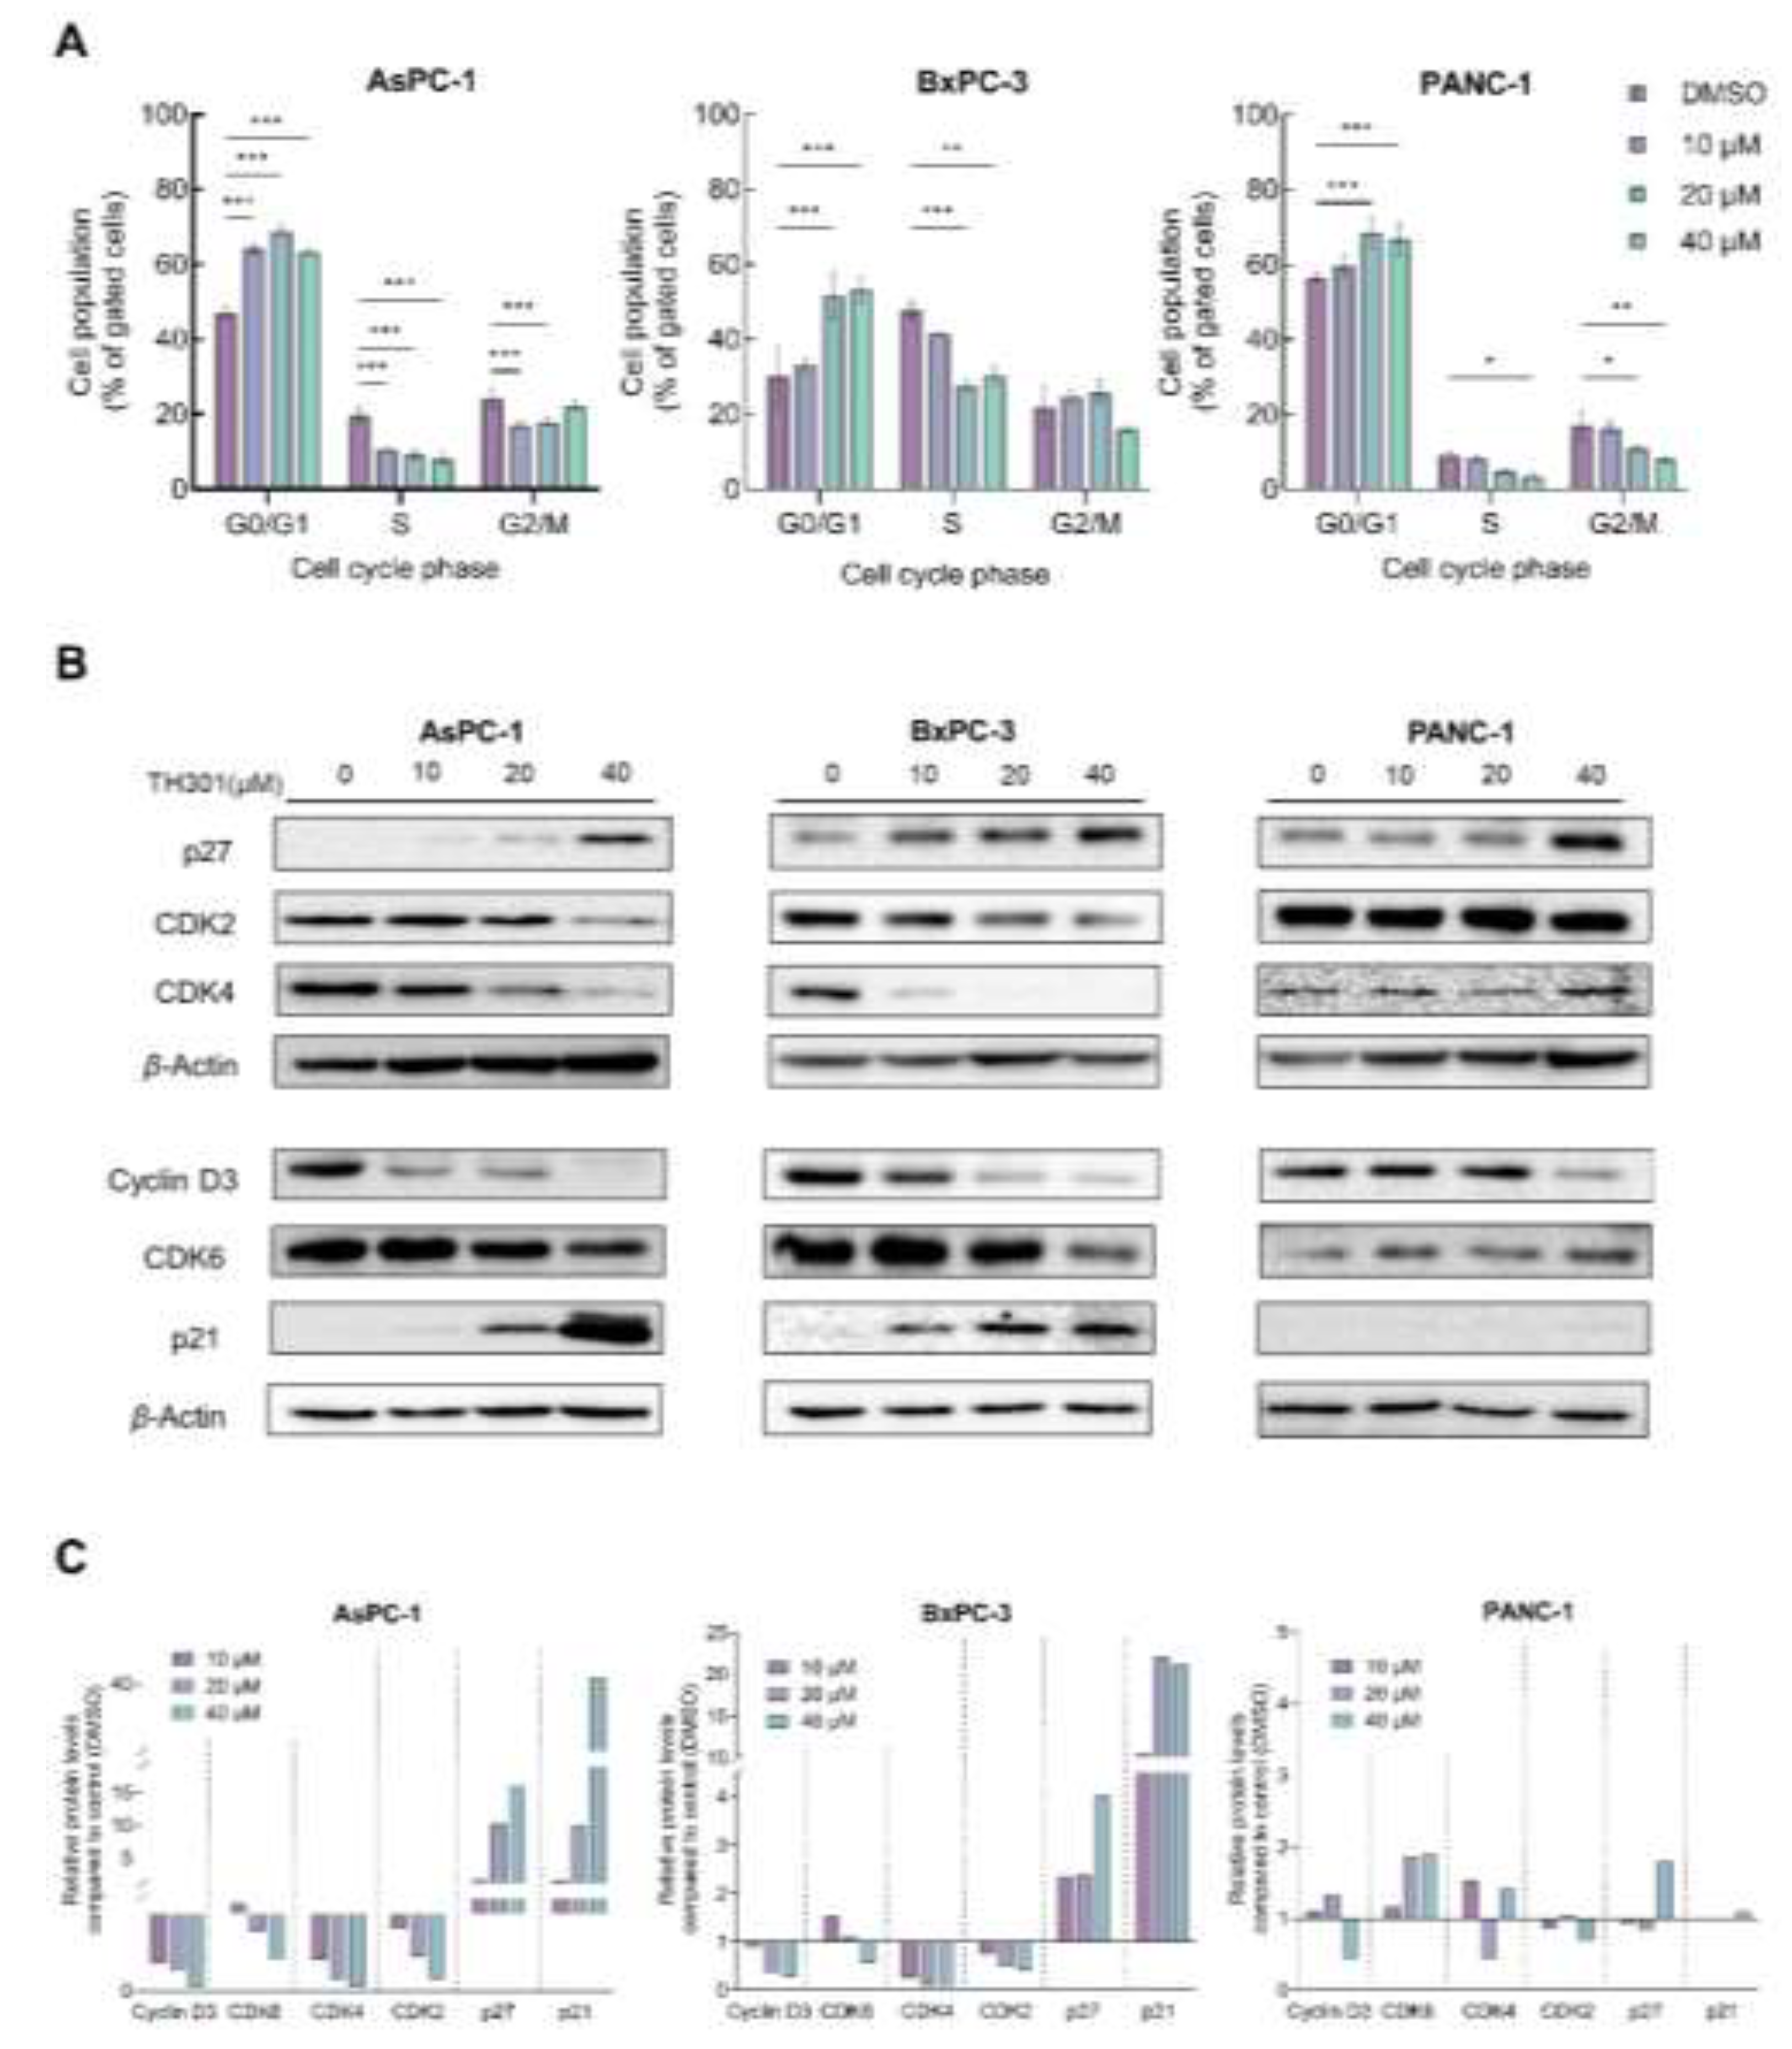
To investigate the underlying mechanism(s) of TH301-induced cell growth inhibition and survival compromise of PDAC cells, we, first, analyzed cell cycle phases after incubation of the cells with low to moderate TH301 doses (0 - 40 μΜ), for 24 h. As presented in Figure 2A, TH301 caused a dose-dependent arrest of cells at the G1-phase of the cell cycle. The increase in proportion of cells at the G1-phase was accompanied by a corresponding decrease in the proportion of cells at the S-phase. To independently validate the results obtained from Flow Cytometry (FACS) analysis, we, next, examined the expression levels of proteins that critically control cell cycle progression, with major determinants being the Cyclin D3, CDK6 (kinase), CDK4 (kinase), CDK2 (kinase), and the CDK inhibitors p21WAF1/CIP1 (p21) and p27KIP1 (p27). After 24 h incubation with TH301, protein levels of cell cycle activators (e.g., Cyclin D3, CDK2, CDK4 and CDK6) decreased, whereas expression levels of CDK inhibitors (p21 and p27) increased significantly, in a dose-dependent manner for all 3 cell lines, with the exception of p21 protein in PANC-1 cells, which remained undetected (Figs. 2B and 2C). These findings strongly suggest that TH301 can induce G1-arrest by severely altering the expression patterns of cell cycle regulatory proteins (e.g., p21 induction in AsPC-1 cells {40 μM TH301}; Figs. 2B and 2C) in all 3 pancreatic cancer cell lines, howbeit following mutational signature-specific profiles. In addition to cell cycle regulators, we also investigated the expression of genes coding for the major stemness factors SOX2, NANOG and OCT4. Expression of stemness genes, particularly NANOG, was significantly reduced after pancreatic cancer cell exposure to TH301 (40 μM; 24 h) (Suppl. Figure S3). Altogether, in a pancreatic cancer cell environment, TH301 is able to induce cell cycle arrest at the G1-phase, and, simultaneously, attenuate stemness network activity, via its transcription factor-program downregulation, thus highlighting TH301 potential and promise to act as an anti-proliferative and anti-survival, novel, agent, for pancreatic cancer management and therapy.
Figure 2.
TH301 induces cell cycle arrest at the G1-phase and causes major expression alterations in cell cycle control proteins. A. Flow Cytometry (FACS) analysis of PI-stained PDAC cells, after treatment with increasing concentrations (0, 10, 20 and 40 μM) of TH301, for 24 h (post-administration). Data from 3 replicates (N = 3) are presented as Mean ± SD values. Statistical significance was defined with One-way ANOVA, and comparisons were being made in between control (0.1% DMSO) and (TH301) treated cells (% of control). Asterisks indicate comparisons in between control and treated cells, at significance levels of 0.05 and below (*: < 0.05; **: < 0.01; ***: < 0.001). B. Western blotting-mediated expression profiling of main G1-phase-specific cell cycle regulators (Cyclin D3, CDK6, CDK4, CDK2, p21 and p27), after treatment of PDAC cells with increasing concentrations (0, 10, 20 and 40 μM) of TH301, for 24 h (post-administration). β-Actin was used as loading control (reference) protein. C. Quantification of protein expression, as it is being normalized to β-Actin (protein of reference), of G1-specific, cell cycle-phase proteins (Cyclin D3, CDK6, CDK4, CDK2, p21 and p27), of (human) pancreatic cancer cells, as compared to control cells (control cell values were set to “1").
2.3. TH301 Causes a Strong p53-Independent Induction of the CDKN1A/p21 Cell Cycle Inhibitor, in Pancreatic Cancer Cell Environments, Following Mutational Load-Specific Patterns
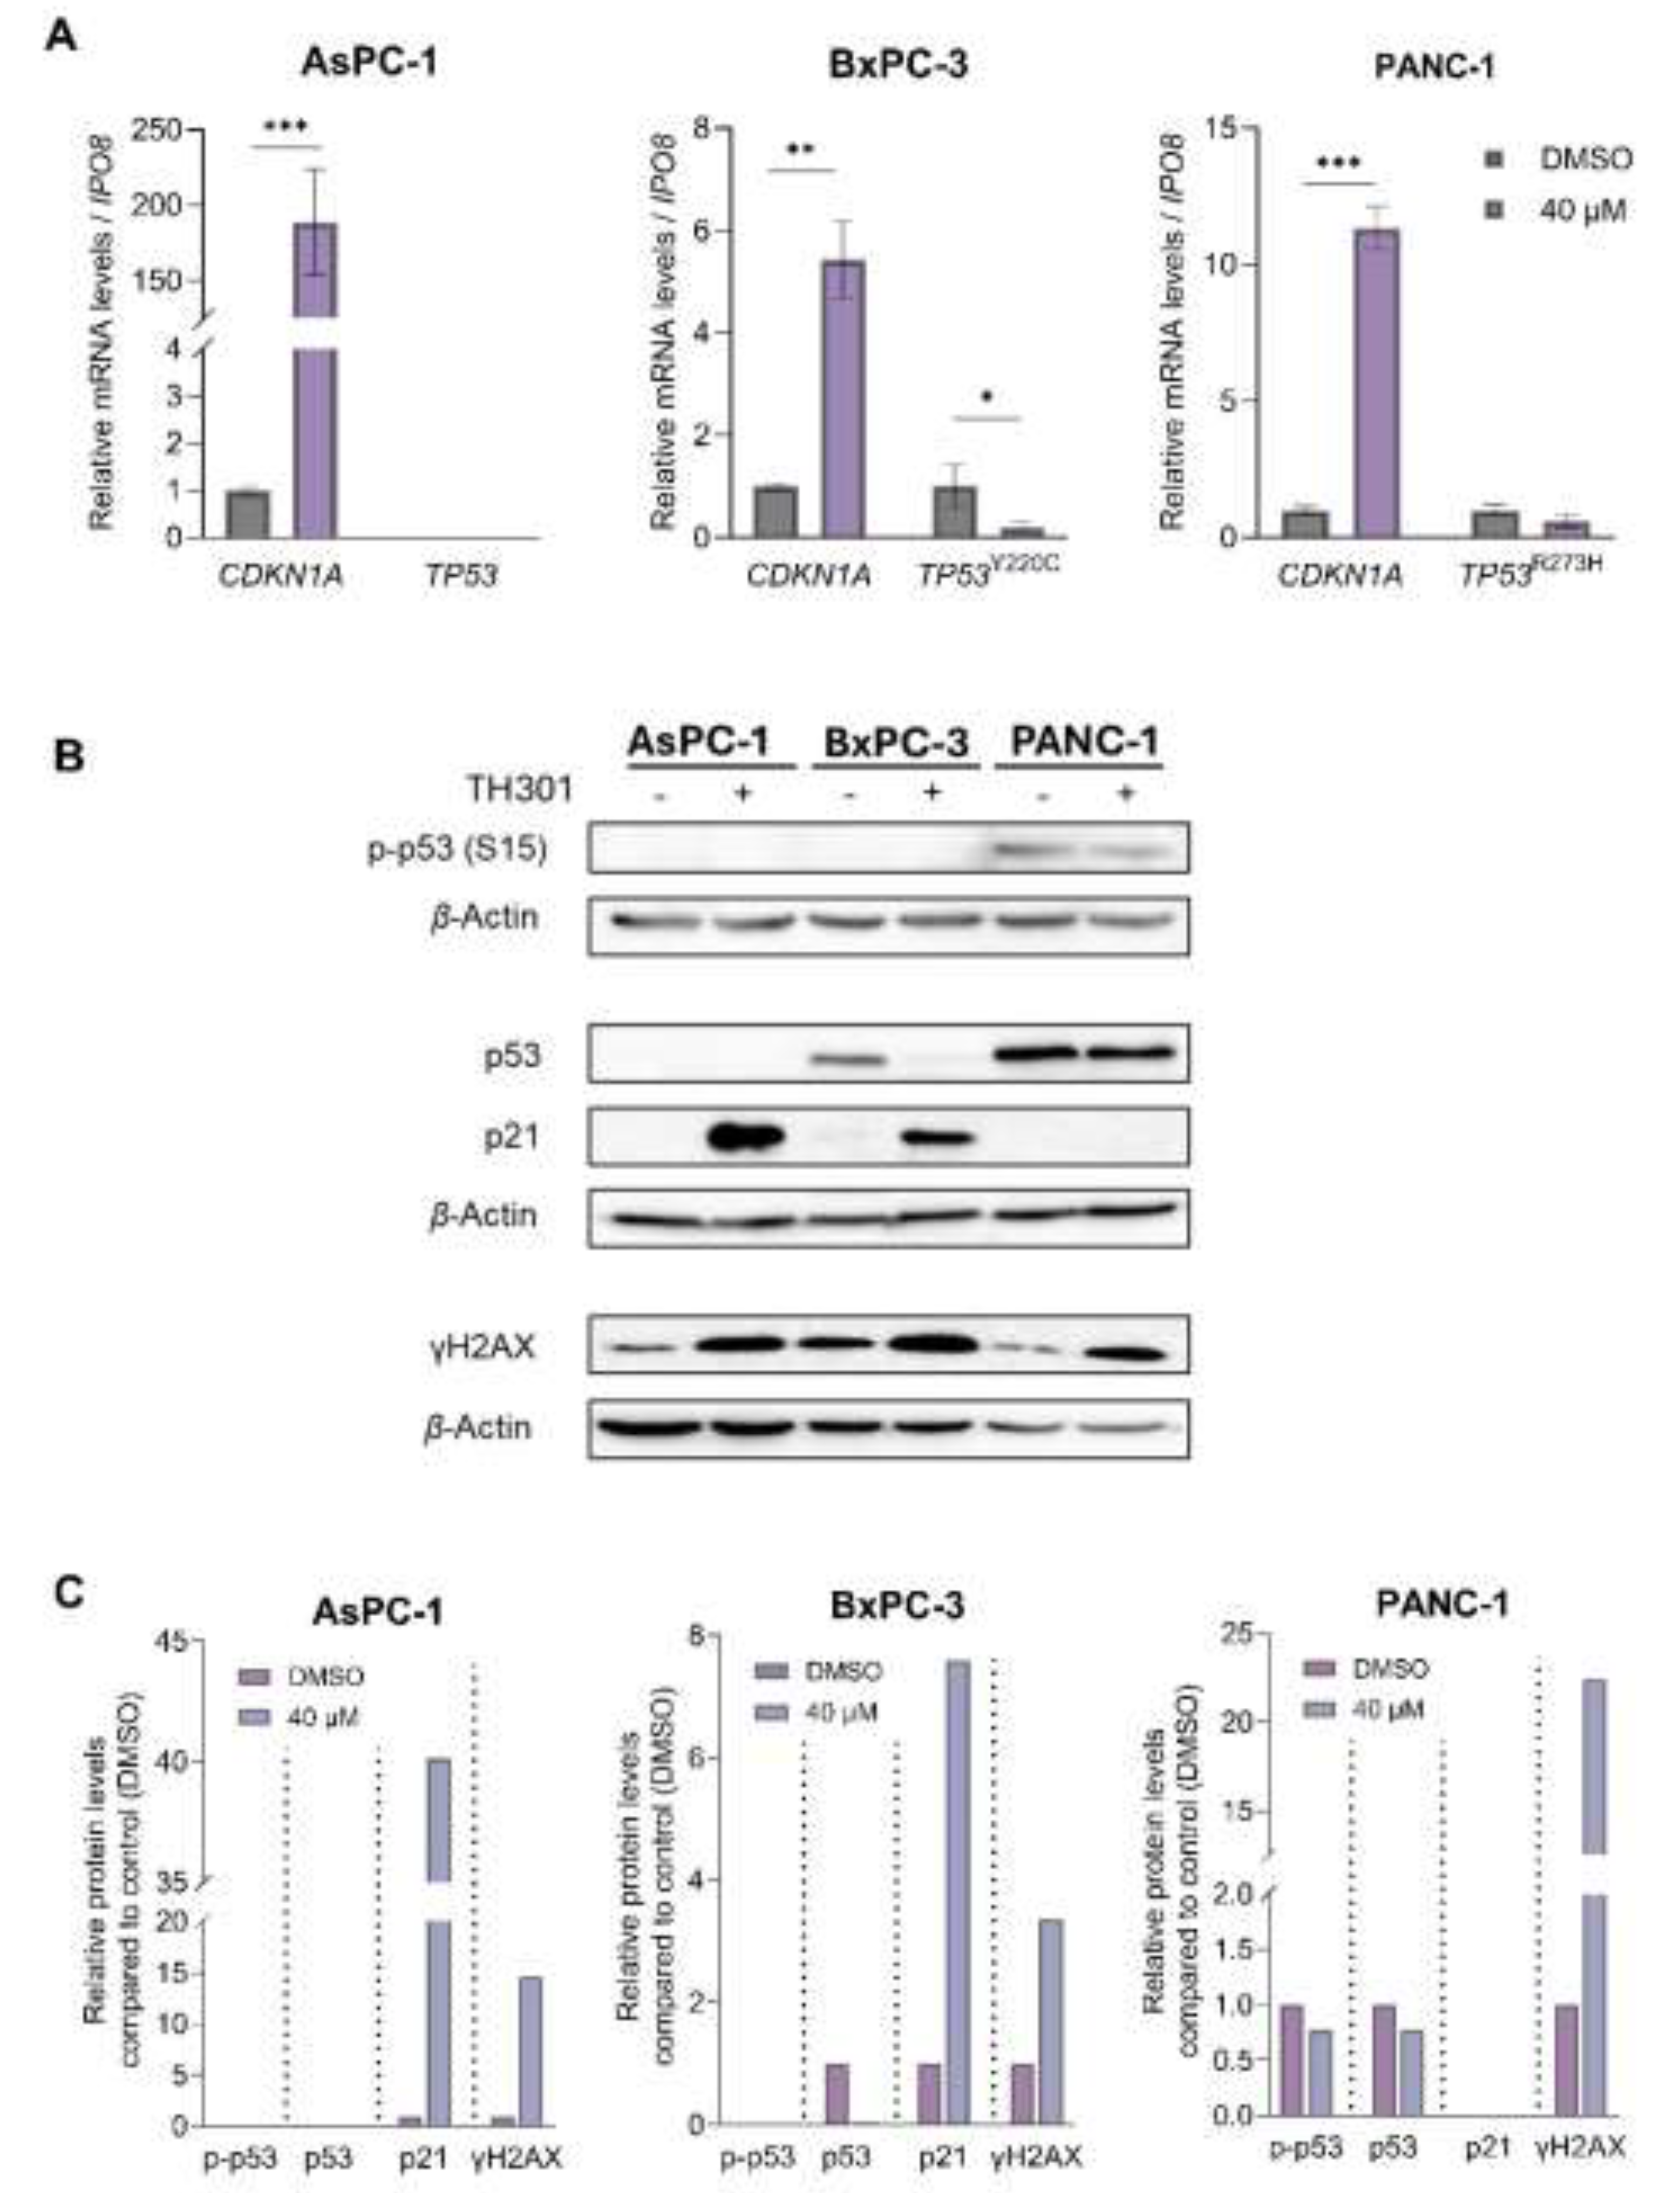
Given that p53 induces CDKN1A gene transcription [32], we, next, reasoned to explore whether TH301 impacts the expression of TP53/p53 levels in BxPC-3 and PANC-1 cells, considering that the BxPC-3 and PANC-1 cell lines carry point mutations in the TP53 locus (Table S2), whereas the AsPC-1 cells completely lack both p53 protein expression and TP53 gene activity (Figure 3). As depicted in Figure 3A, PDAC cell exposure to TH301, for 24 h, significantly increased CDKN1A levels (> 150x) and reduced mutant TP53 (TP53Y220C) contents in BxPC-3 cells, without, however, affecting mutant TP53 (TP53R273H) levels in the PANC-1 cellular setting. Importantly, we also examined p53 protein levels and its phosphorylation status at the critical amino-acid residue of Serine 15 (Ser15), alongside with the induction of p21 protein, following a 24 h of TH301 treatment (40 μM). As shown in Figures 3B and 3C, the remarkable induction of p21 protein, in response to TH301 administration, proved to operate independently of both total and phosphorylated (p-Ser15) p53 protein forms in BxPC-3. PANC-1 cells showed transcriptional-level induction only (Figure 3A). Furthermore, in AsPC-1 cells, p53 (both total and p-Ser15) forms are missing, despite the strong transcriptional increase in CDKN1A gene activity, after TH301 treatment, thereby indicating the p53-independent proficiency of TH301 to strikingly upregulate CDKN1A/p21 levels in PDAC environments of diverse mutational loads.
Our findings strongly suggest that TH301 significantly induces CDKN1A gene expression, with p21 induction occurring independently of the p53 phosphorylation/activation status, in (human) pancreatic cancer cells. We, next, evaluated the potential genotoxic effects of TH301, by investigating the phosphorylation levels of Histone H2AX, a well-established marker of DNA damage [33,34,35]. As shown in Figures 3B and 3C, a notable increase in gamma-H2AX (γH2AX) levels was observed across all 3 cell lines, following a 24 h exposure to TH301, thereby indicating its (TH301) capacity to exert genotoxic effects in pancreatic cancer cells, in p53-independent manners.
Figure 3.
TH301-induced upregulation of CDKN1A/p21 follows p53-independent patterns. A. The mRNA levels of CDKN1A gene in AsPC-1, BxPC-3 and PANC-1 cells, and of mutant TP53 gene in BxPC-3 and PANC-1 cells, following treatment with 40 μΜ TH301, for 24 h, were examined by RT-qPCR protocols. mRNA values were normalized to IPO8 gene of reference and control (0.1% DMSO) was set to value “1”. Data (Ν = 3) are presented as Mean ± SD values. Statistical significance was assessed with Welch’s t-test. Asterisks indicate comparisons in between control (0.1% DMSO) and TH301-treated cells, at statistical significance levels of 0.05 and below (*: < 0.05; **: < 0.01; ***: < 0.001). B. γH2AX (p-H2AX-Ser139), p21, total p53 and p-p53-Ser15 (p53 phosphorylated form at Ser15) protein levels in PDAC cells, following treatment with 40 μΜ TH301, for 24 h, being examined by Western blotting. C. Relative protein level quantification (γH2AX {p-H2AX-Ser139}, p21, p53 and p-p53-Ser15), after normalizing densitometry values to β-Actin protein of reference, in all 3 PDAC cell lines.
2.4. TH301 Induces Caspase Repertoire-Mediated Apoptosis In Pancreatic Cancer Cell Settings: Mutational Signature-Dependent Responses
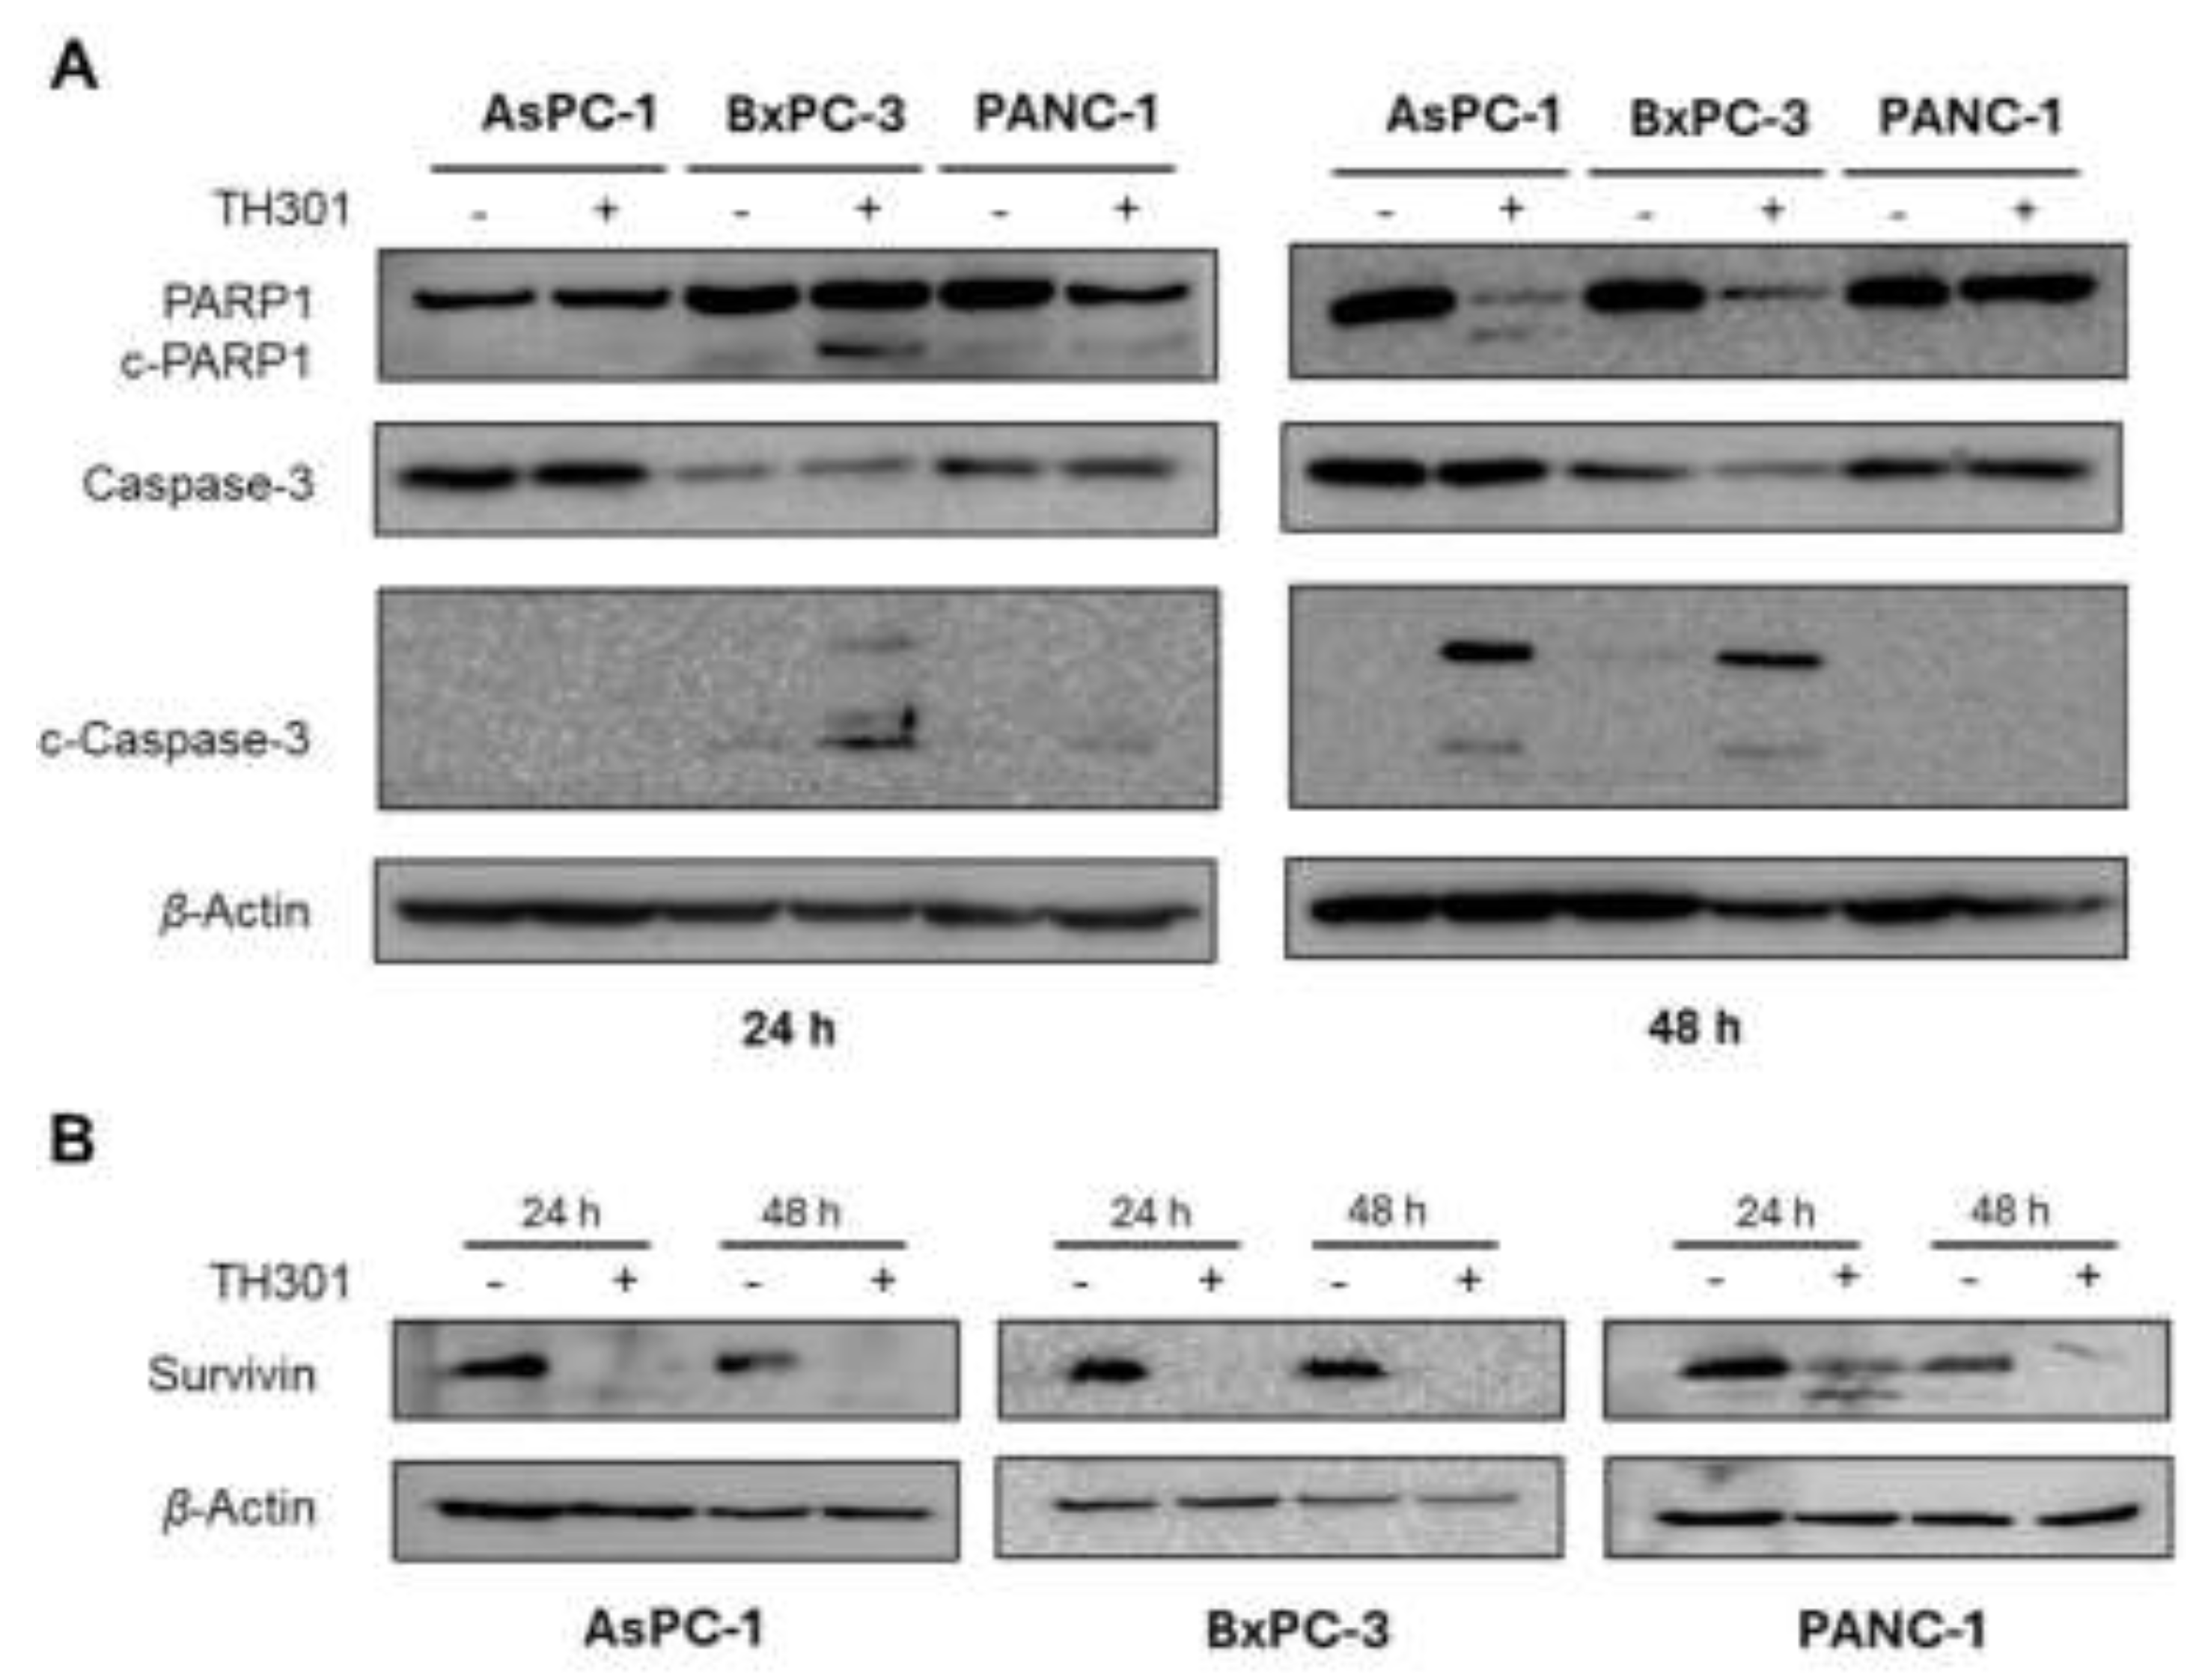
In addition to cell cycle arrest, the significant decrease in cell viability after exposure of AsPC-1, BxPC-3 and PANC-1 cells to TH301 (Figure 1) could be also associated with activation of apoptosis (Figure 4), a Programmed Cell Death (PCD) major sub-routine. Hence, we examined total protein levels and cleavage patterns of the fundamental apoptosis mediators PARP1 and Caspase-3, after treatment of the 3 pancreatic cancer cell lines with the TH301 circadian clock modulator, for 24 and 48 h (Figure 4A). Twenty-four hours post-administration, apoptosis activation was readily observed only in BxPC-3 cells, as clearly indicated by the cleaved (“c”) PARP1 (c-PARP1) and Caspase-3 (c-Caspase-3) generated profiles, with the apoptotic program being intensified at 48 h of (TH301) treatment. Interestingly, PANC-1 cells were presented rather tolerant to apoptosis, with only a small sub-population of sensitive cells (c-Caspase-3+) undergoing apoptosis after 24 h of TH301 exposure, thus dictating its (TH301) capacity to predominantly exert growth-inhibitory, but not apoptotic, effects on PANC-1 cells (see, Figure 1). In contrast, AsPC-1 cells, in response to their 48 h treatment with TH301, were subjected to Caspase-3-dependent apoptosis (c-Caspase-3+/cPARP1+), thus providing TH301 with dual properties of both inducing cell cycle arrest and triggering apoptotic death, in specific PDAC mutational settings. Taken together, it seems that TH301 can activate the Caspase-3/PARP1 apoptotic axis in pancreatic cancer cell environments, following a mutational signature-dependent manner. Likewise, TH301 proved able to markedly downregulate the expression levels of Survivin, a key anti-apoptotic protein [36,37], in all 3 examined cells lines (Figure 4B), after 24 and 48 h of drug (TH301) treatment, with a novel cleaved fragment being easily detected in the 24 h-exposed PANC-1 cells. Its ability to drastically reduce Survivin protein contents, in a mutational load-independent fashion, enhances TH301 potential to cause PDAC apoptosis and supports its usefulness in novel, promising and powerful regimens, for pancreatic cancer chemotherapy.
Figure 4.
TH301 treatment induces activation of Caspase repertoire-mediated apoptosis and triggers reduction of Survivin expression in (human) pancreatic cancer cell lines. Western blotting profiles of total and cleaved PARP1 (c-PARP1) and Caspase-3 (c-Caspase-3) (pro-)apoptotic proteins (A), and of Survivin anti-apoptotic protein (B), as well, in the presence (+) or absence (-) of 40 μΜ TH301, for 24 and 48 h (post-administration), using β-Actin as protein of reference (control). “c”: Cleaved.
2.5. TH301 Upregulates LC3B-II-Depenent Autophagy in Pancreatic Cancer Cells, Following a Mutational Signature-Independent Pattern
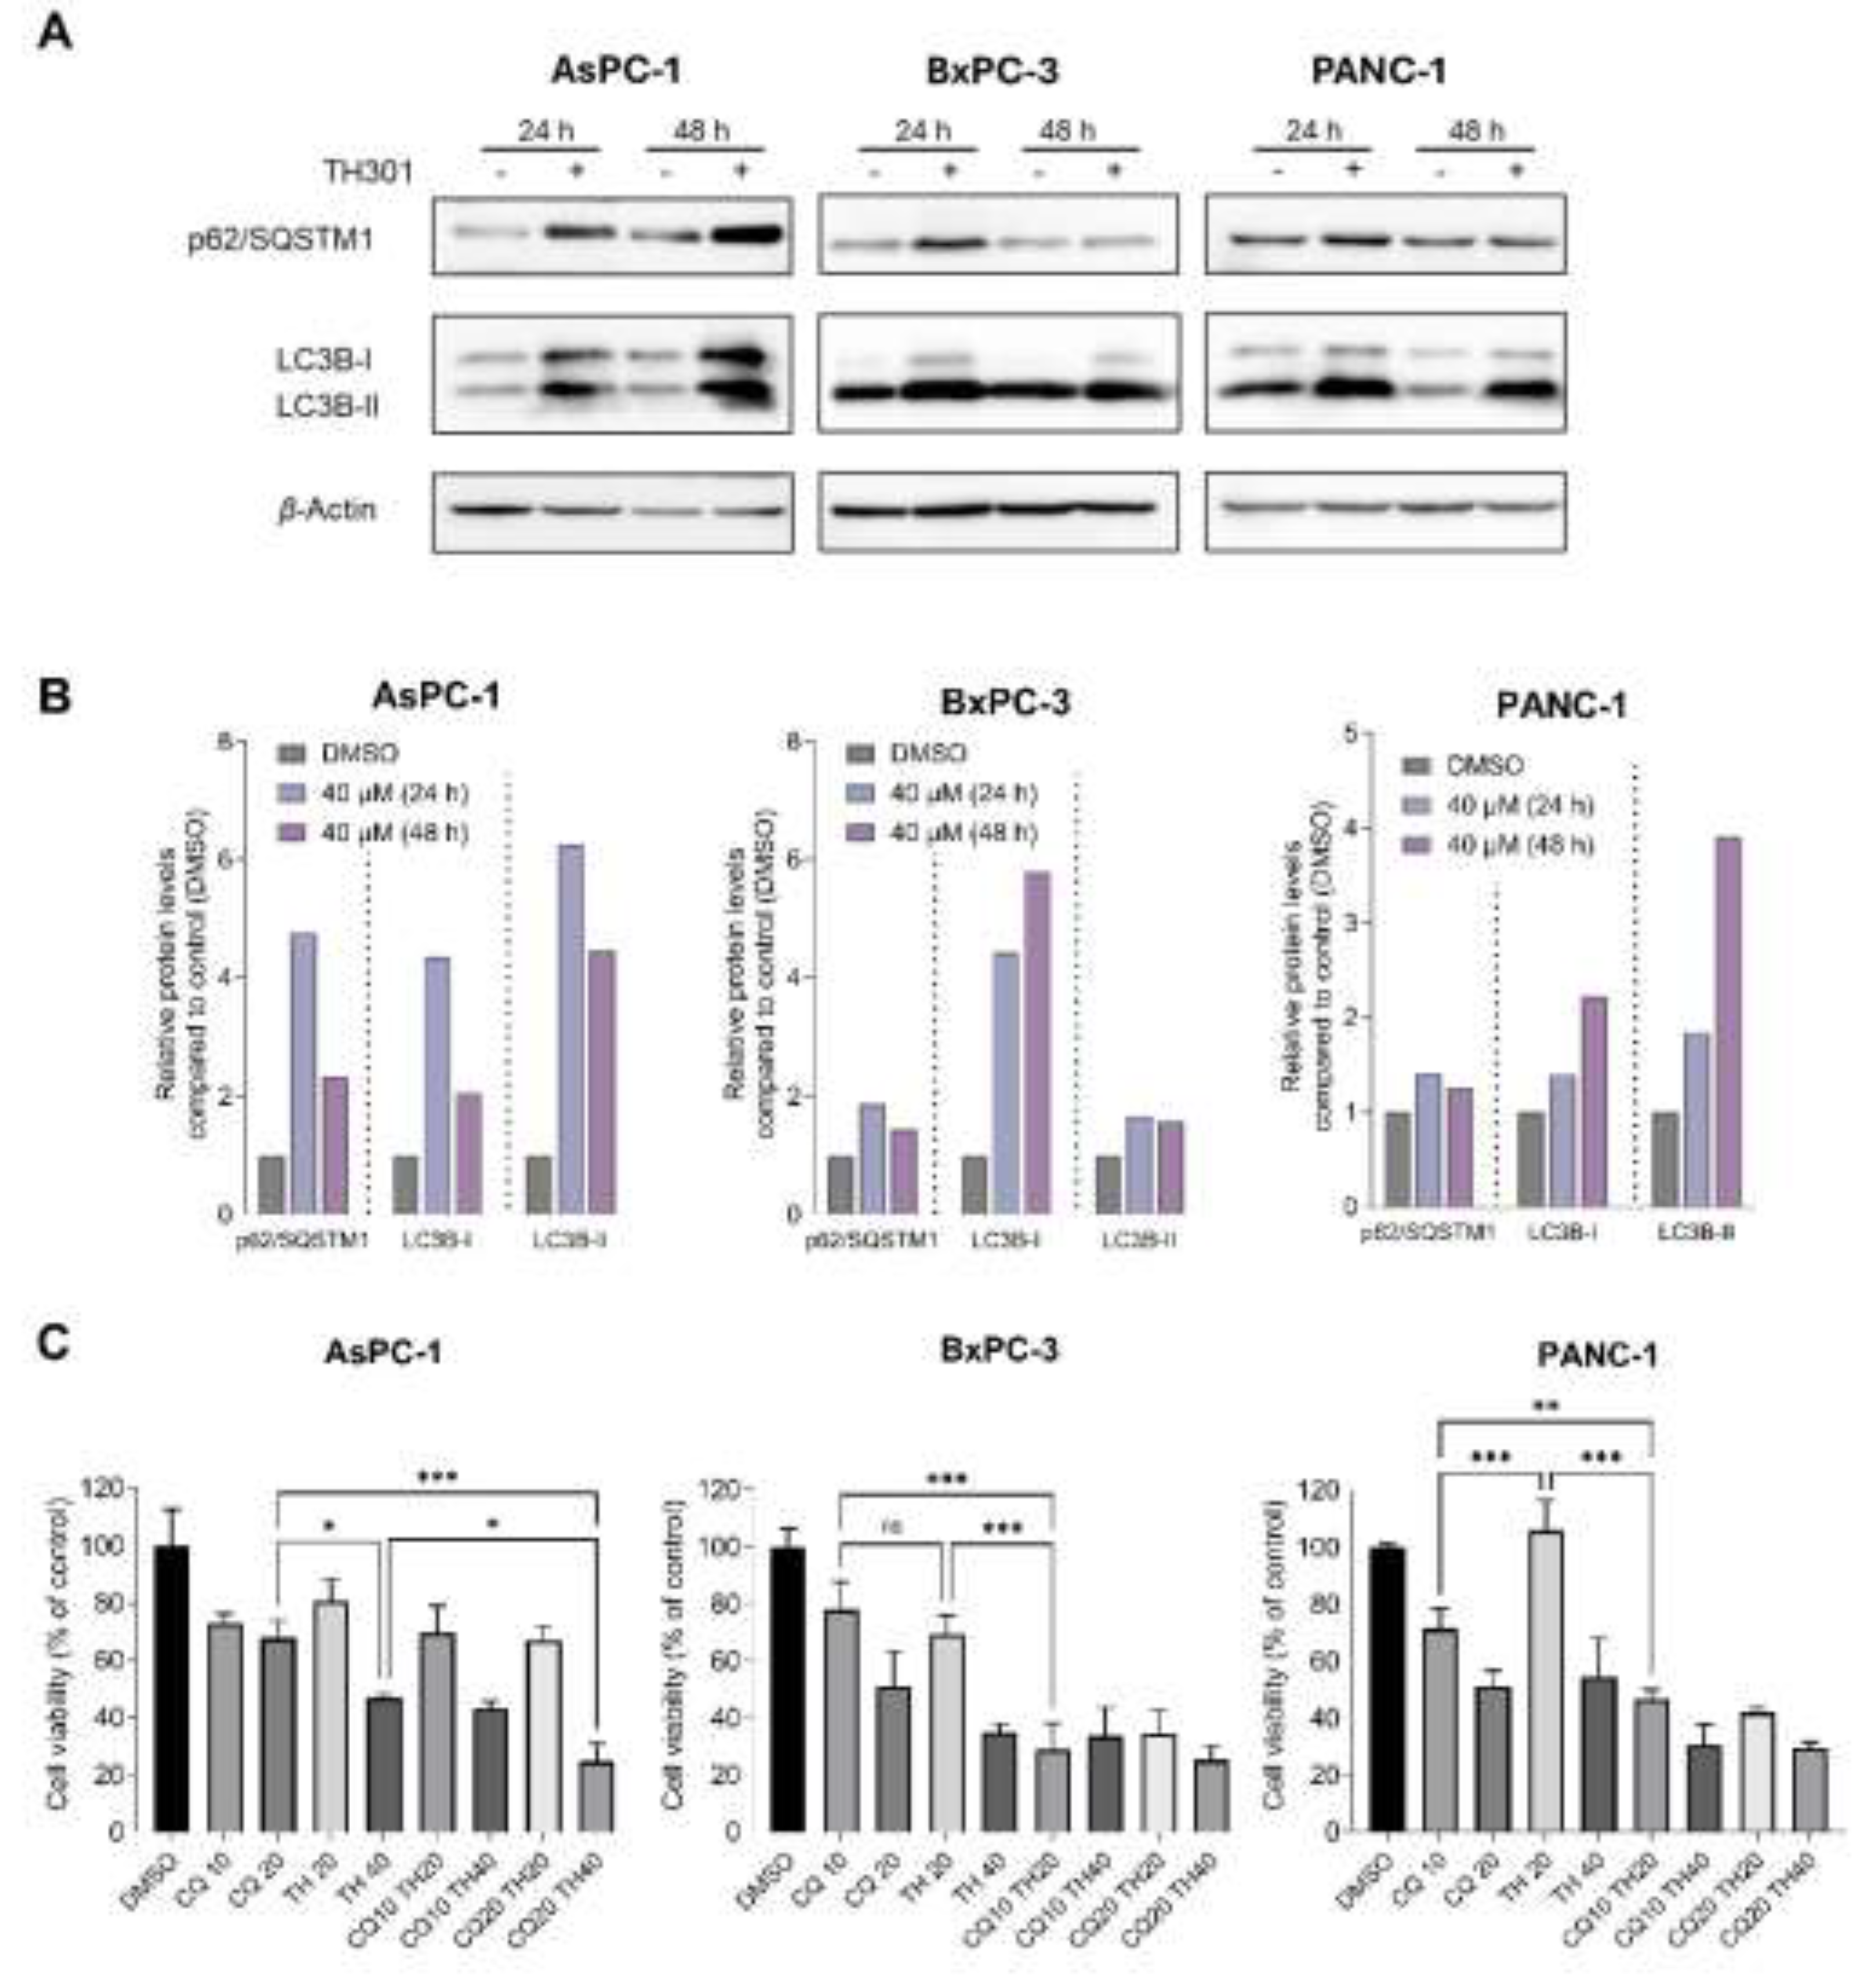
Autophagy serves as a double-sword process that can play essential roles either in the survival or in the elimination of cancer cells [38,39,40]. To investigate the effects of TH301 on autophagy in pancreatic cancer cell contexts, we treated the AsPC-1, BxPC-3 and PANC-1 cell lines with 40 μΜ TH301, for 24 and 48 h, and we, next, analyzed the protein expression levels of the key autophagy markers p62/SQSTM1 and LC3B-II. As described in Figure 5A, in the presence of TH301, there is a significant induction of the LC3B-II protein isoform (and the LC3B-I), in all the 3 pancreatic cancer cell lines, herein, examined, with a simultaneous elevation of p62/SQSTM1 protein contents being also detected, albeit in a time- and cell type-dependent manners (Figs. 5A and 5B), which may indicate either induction of autophagy or impairment of autophagic flux. To, further, clarify whether the obtained findings reflect an activation of autophagy response, we, next, co-treated cells with TH301 and Chloroquine (CQ), a known autophagy inhibitor [41,42], and examined cell viability. Of note, the pathogenic effect of CQ alone was evaluated via treatment of cells with CQ increasing concentrations, for 48 h, resulting in an IC50 range of ~46 - 18 μM, for the 3 cell lines, herein, tested (Suppl. Figure S4). Strikingly, our results unveil that TH301 can synergize productively with CQ, in BxPC-3 and PANC-1 cells, when non-toxic concentrations of both agents are administered together, whereas, in AsPC-1 cells, only the 40 μΜ dose of the TH301 clock modulator proves able to synergize with CQ in an effective manner (Figure 5C). Altogether, our results indicate that TH301 can activate an LC3B-II-dependent autophagic program in PDAC cells of diverse mutational loads, and its (TH301) combination with CQ can enhance pancreatic cancer cell pathology, and elimination efficiency, in a dose-dependent manner. It seems that a novel therapeutic scheme of CQ-sensitizing pancreatic cancer cells to TH301-driven death opens a new window for the simultaneous modulation of autophagy and circadian clock functionalities in the clinical management of the disease.
Figure 5.
TH301 upregulates autophagy in (human) pancreatic cancer cells of diverse mutational loads. A. Western blotting profiles of the major autophagic markers p62/SQSTM1 and LC3B-II, in the presence (+) or absence (-) of 40 μΜ TH301, for 24 and 48 h (post-administration). B. Quantification of “A” conducted via measurements of densitometry values that were being normalized to β-Actin. Normalized values derived from non-treated cells were set to “1”. Presentation of relative expression of each examined protein, compared to control (0.1% DMSO, showed once), after normalizing densitometry values to β-Actin. C. Cell viability profiles (bar-charts) of PDAC cell lines after treatment with CQ (only), TH301 (only), or CQ and TH301 (together), for 48 h (post-administration). Data (N = 3) are presented as Mean ± SD values. Statistical significance was assessed with One-way ANOVA and Tuckey's multiple comparison correction.
2.6. TH301 Potentiates the Cytopathic Effects of Oxaliplatin, by Reducing Pancreatic Cancer Cell Viability
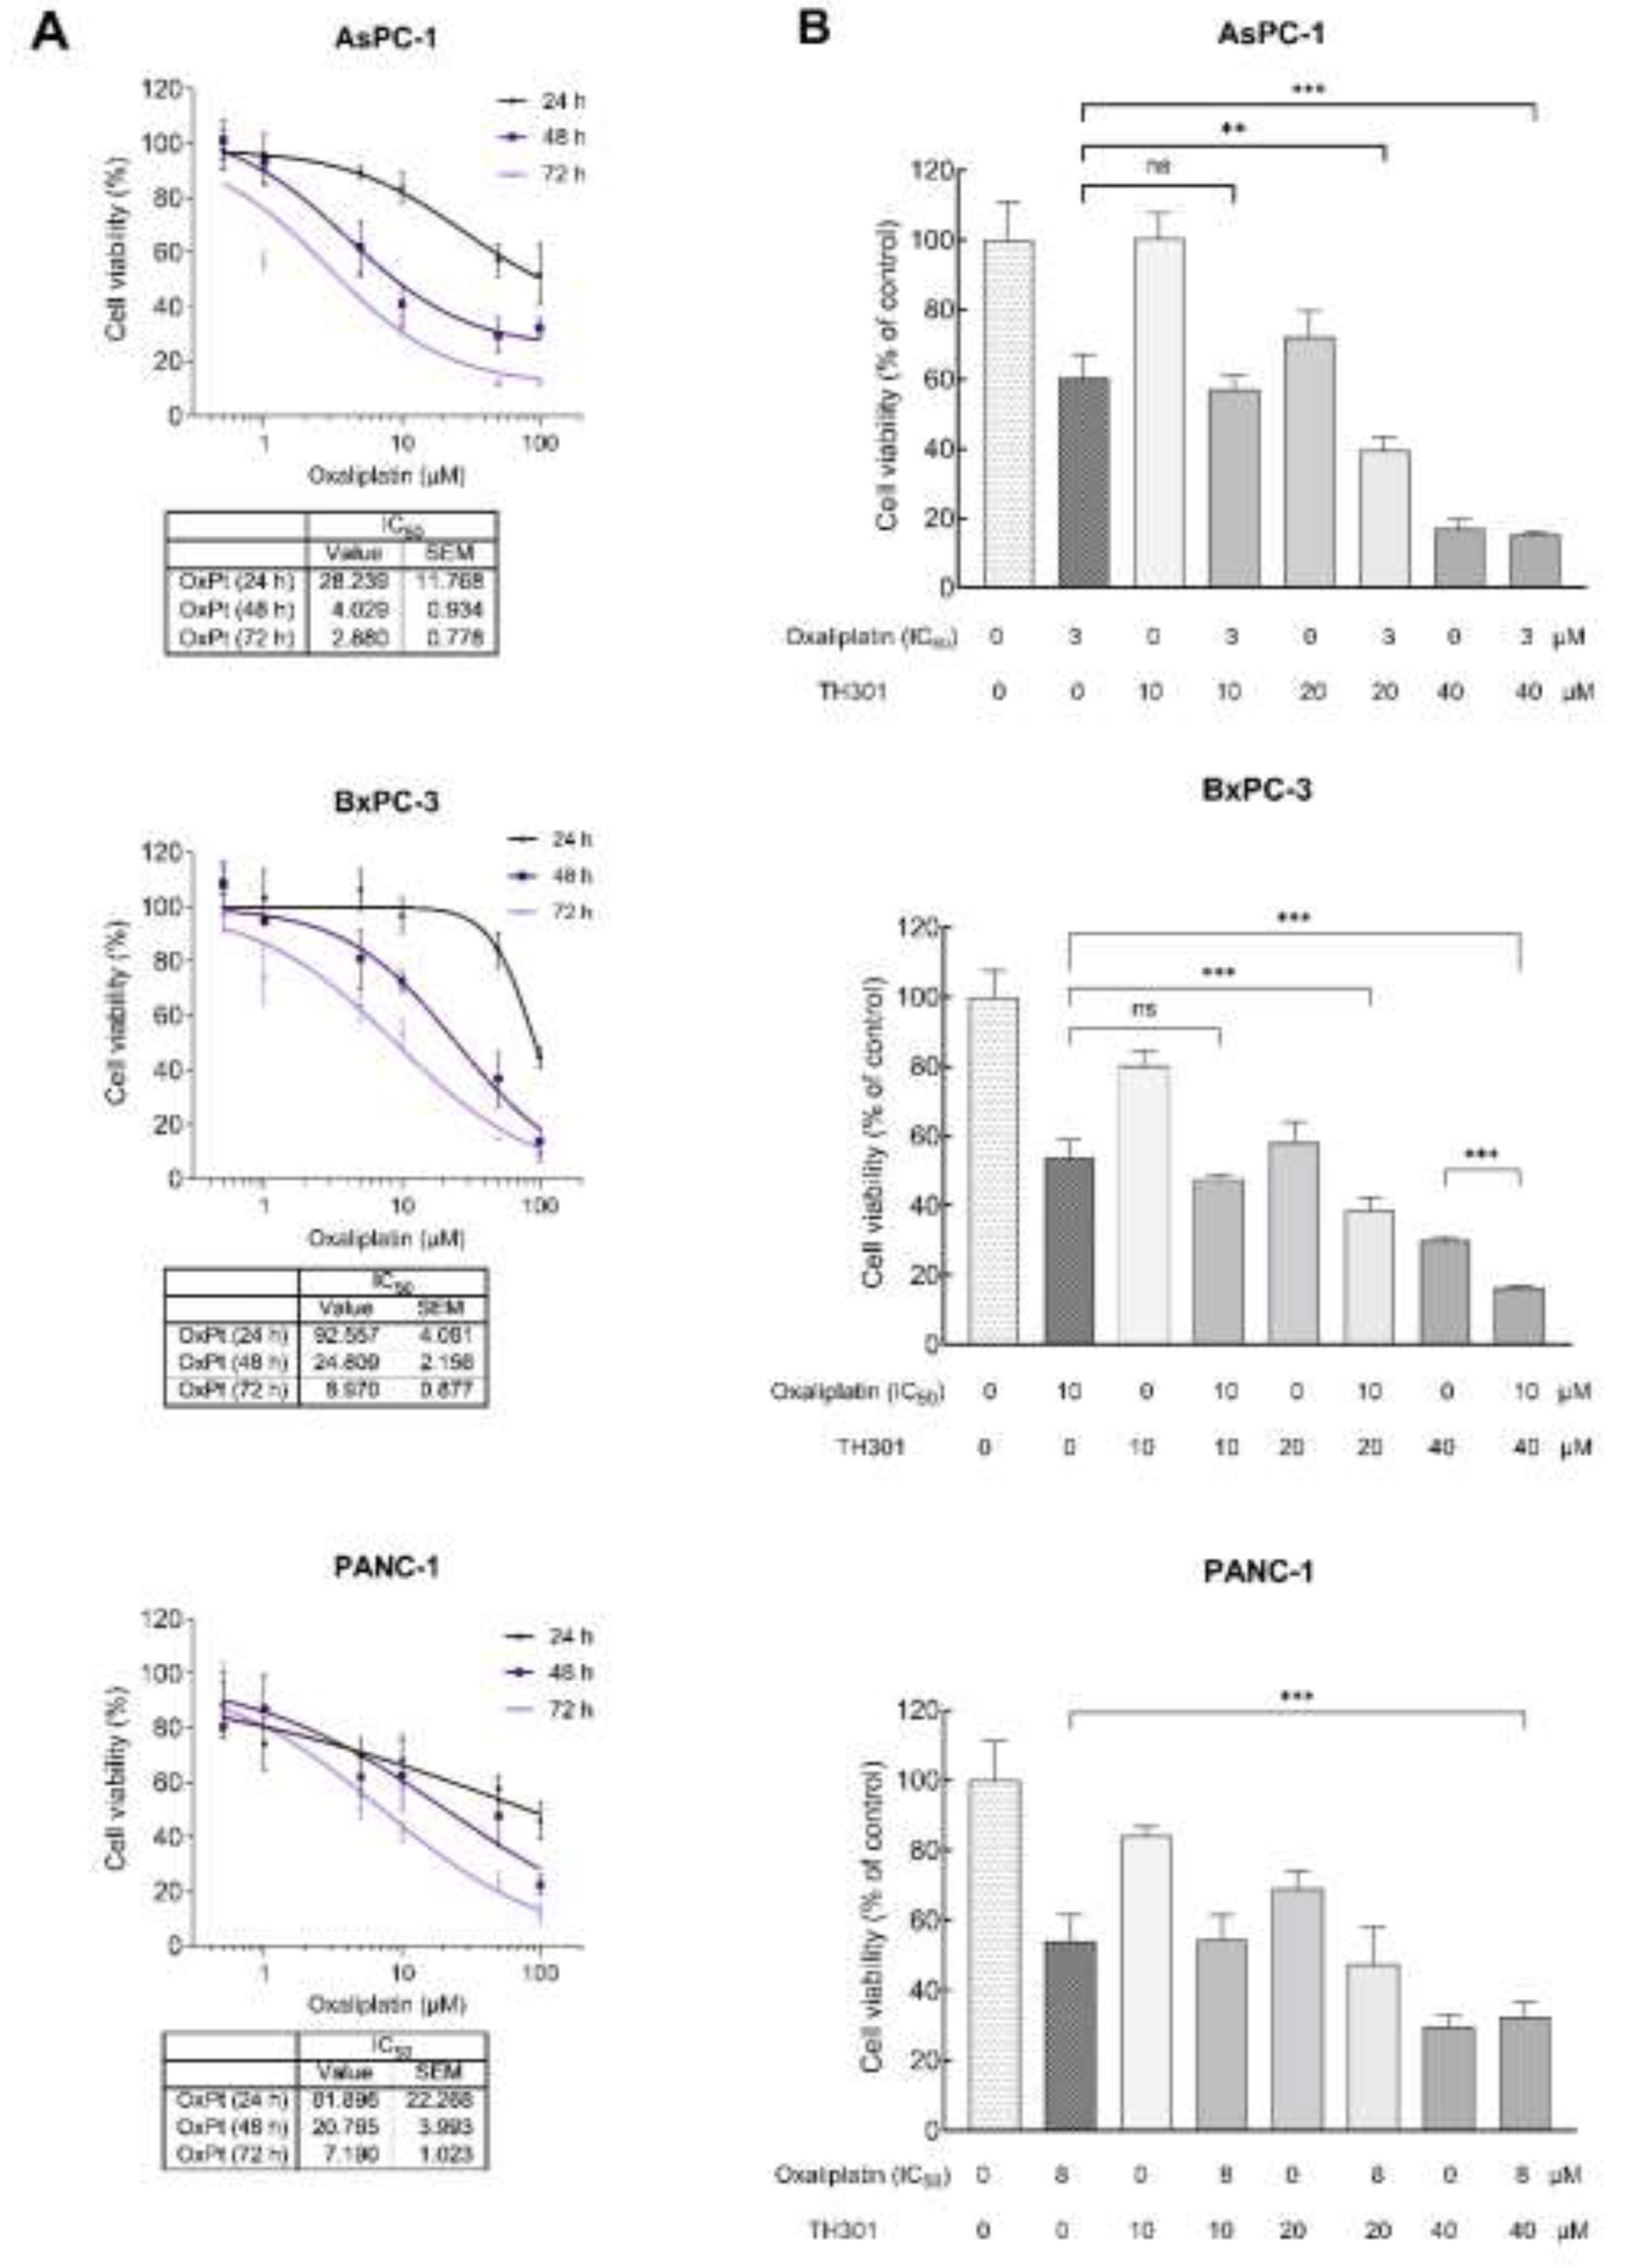
Oxaliplatin is utilized in the treatment of PDAC, as critical component of combination chemotherapy regimens, such as the FolFIrinOx (Folinic Acid, Fluorouracil, Irinotecan and Oxaliplatin) drug cocktail. Given that Oxaliplatin inhibits cell proliferation, growth and survival, by inducing DNA damage, we, herein, aimed to investigate whether TH301 could synergize with Oxaliplatin to further reduce cell viability of PDAC cells. After identifying the IC50 value, for each one of the 3 cell lines (Figure 6A), we, respectively, combined this Oxaliplatin concentration with 10, 20 and 40 μM of TH301, to treat PDAC cells, for 72 h (post-administration), and cell viability was, next, quantified though MTT assay engagement. As illustrated in Figure 6B, co-treatment with TH301 and Oxaliplatin led to their significant synergism, in reducing cell viability, particularly for the AsPC-1 and BxPC-3 cell lines. However, the synergistic effect was missing from PANC-1 cells, likely due to their -specific- mutational content that can render them comparatively “semi-tolerant” to the TH301 - Oxaliplatin cocktail scheme, herein, applied. Altogether, a novel regimen, containing non-toxic doses of the TH301 and Oxaliplatin agents, seems to hold strong therapeutic promise for pancreatic cancer, in the clinic.
Figure 6.
Synergistic cytopathic effects of TH301 and Oxaliplatin agents on (human) pancreatic cancer cell survival and growth. A. Cell viability curves, after exposure of PDAC (AsPC-1, BxPC-3 and PANC-1) cells to increasing concentrations of Oxaliplatin (OxPt) (0, 1, 10 and 100 μM), for 24, 48 and 72 h, with the obtained IC50 values being, respectively, indicated. Data (N = 4) are presented as Mean ± SEM values. IC50 values were calculated with a non-linear model platform. B. Cell viability quantification was performed through MTT assay engagement, after treatment of PDAC (AsPC-1, BxPC-3 and PANC-1) cells with increasing concentrations of TH301 (0, 10, 20 and 40 μΜ), in the presence (+) or absence (-) of OxPt (IC50 concentration), for 72 h. Data (N = 4) are presented as Mean ± SEM values. Statistical significance was assessed with One-way ANOVA and Tuckey’s multiple comparison correction. Asterisks indicate statistical significance (ns: non-significant; ** < 0.01; *** < 0.001).
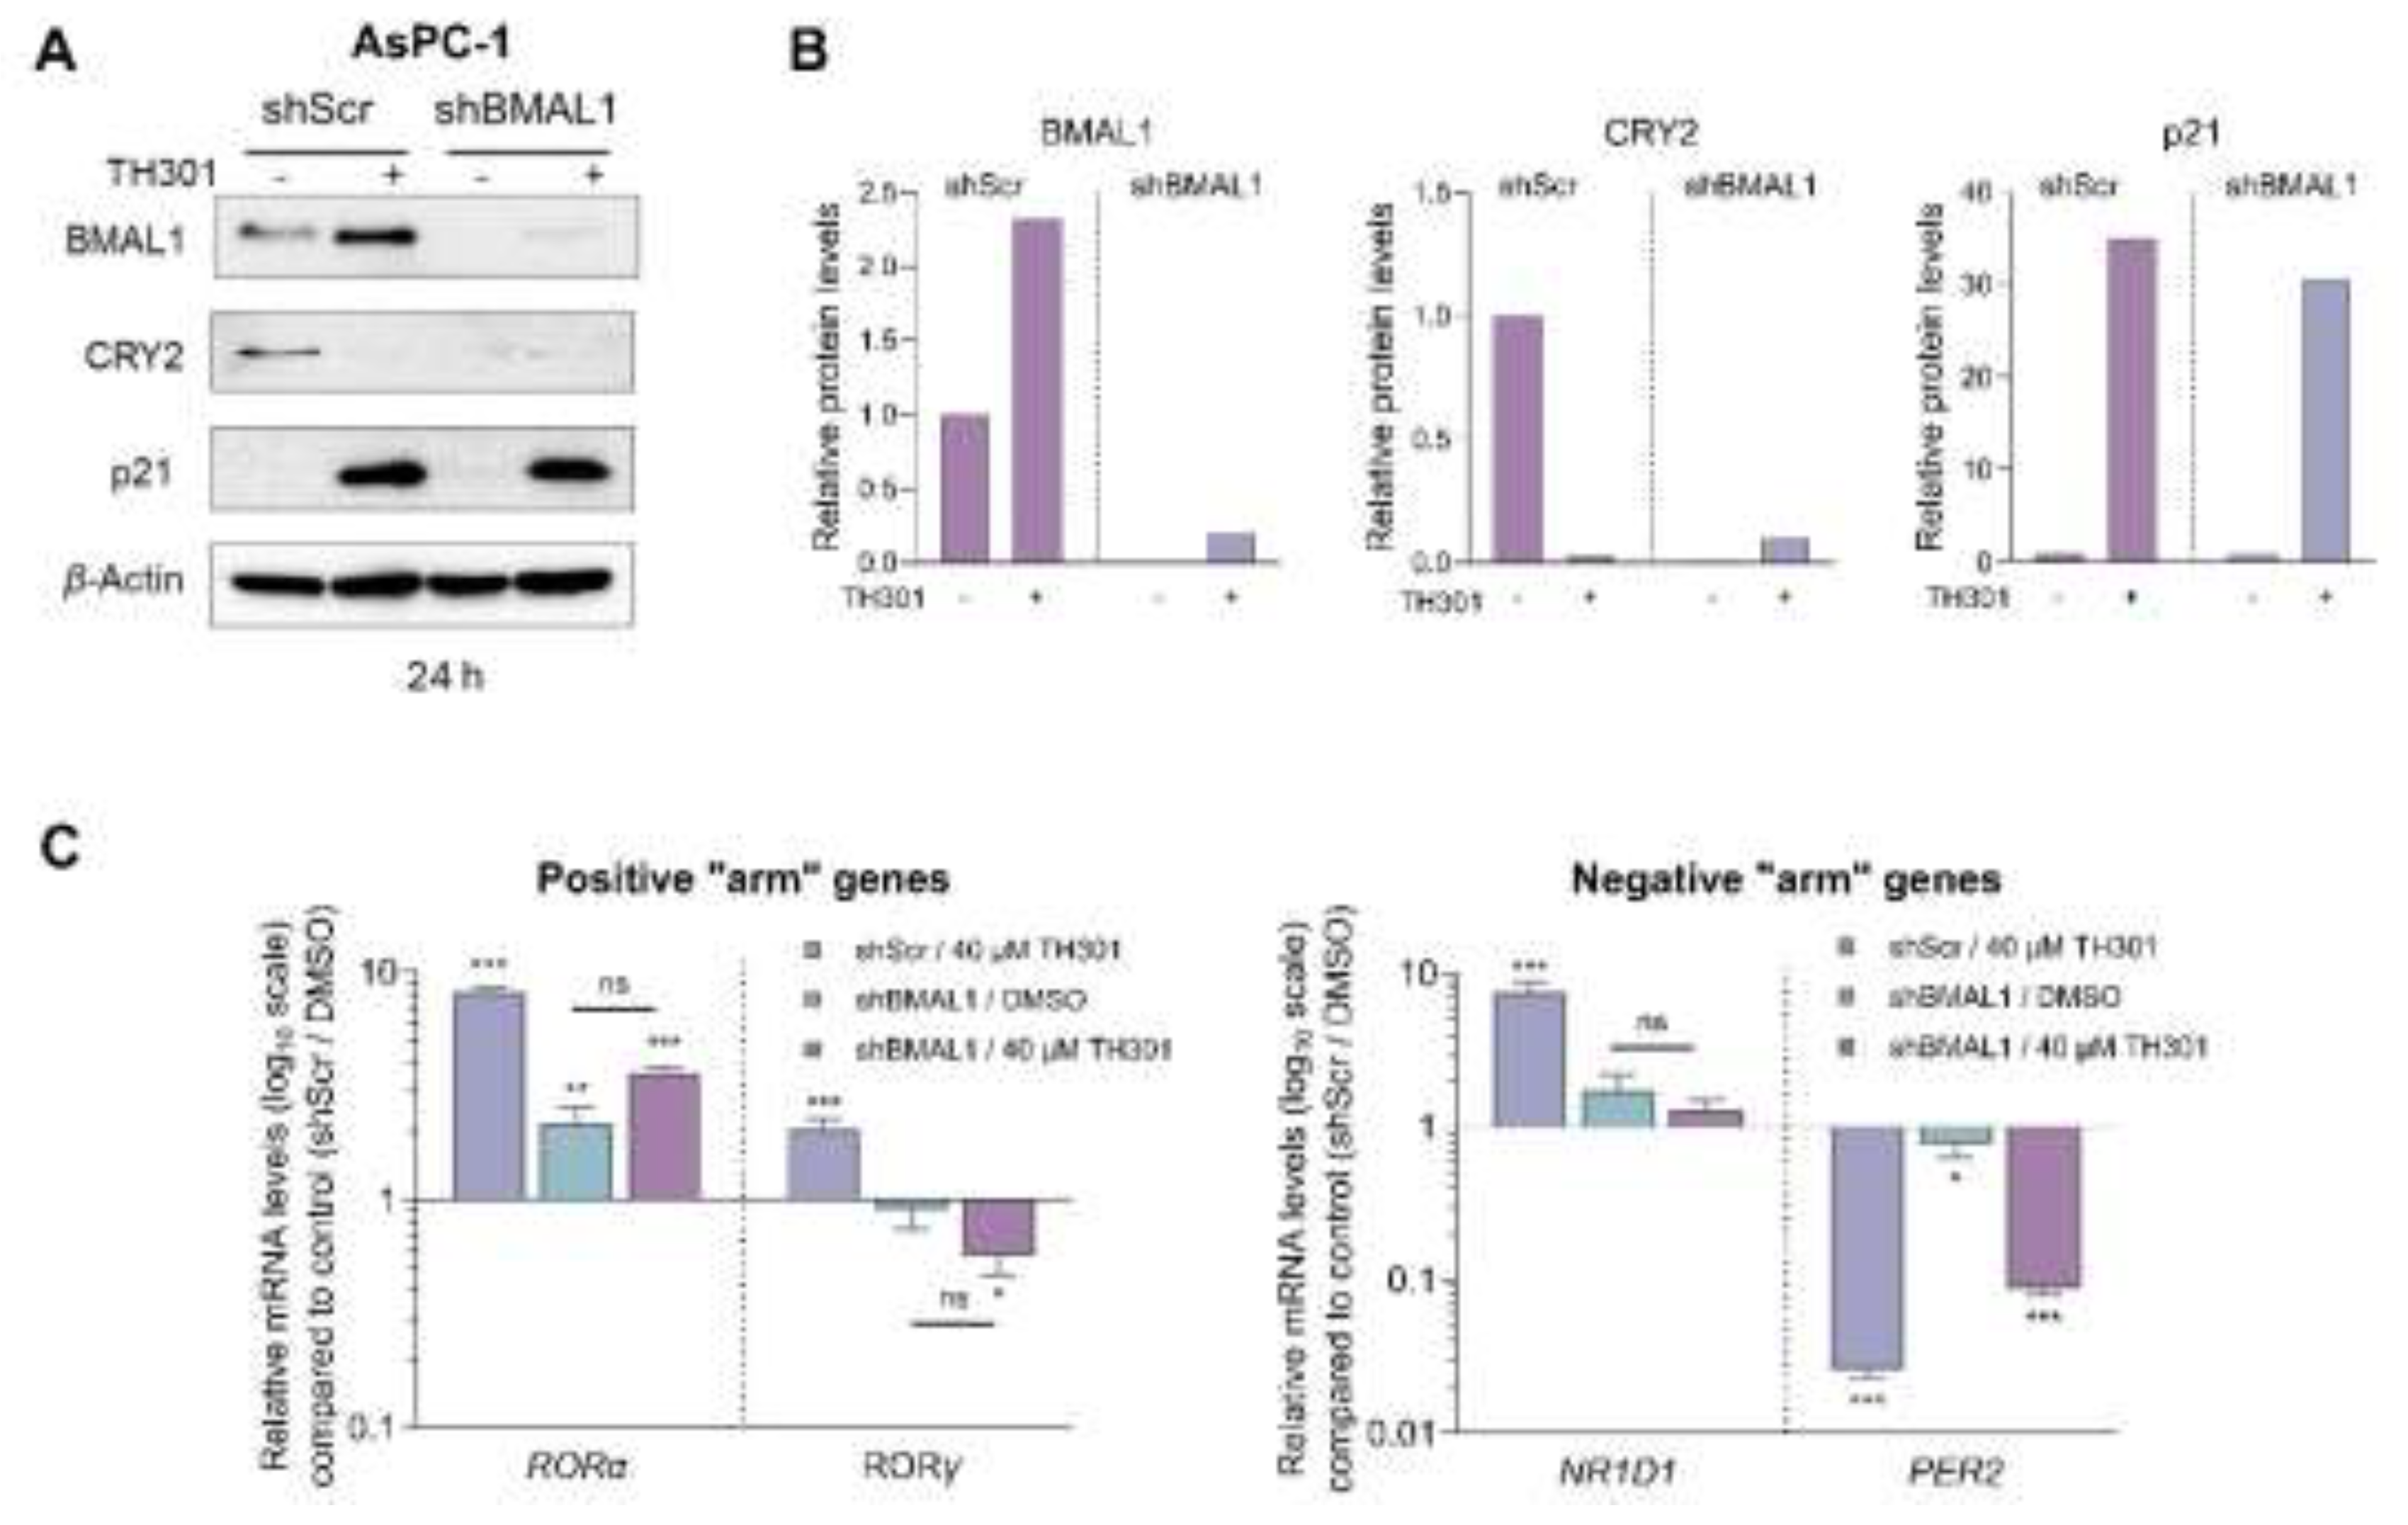
2.7. CRY2 and BMAL1 Are Not Required for the TH301-Driven Induction of p21 Cell Cycle Inhibitor in Pancreatic Cancer cells
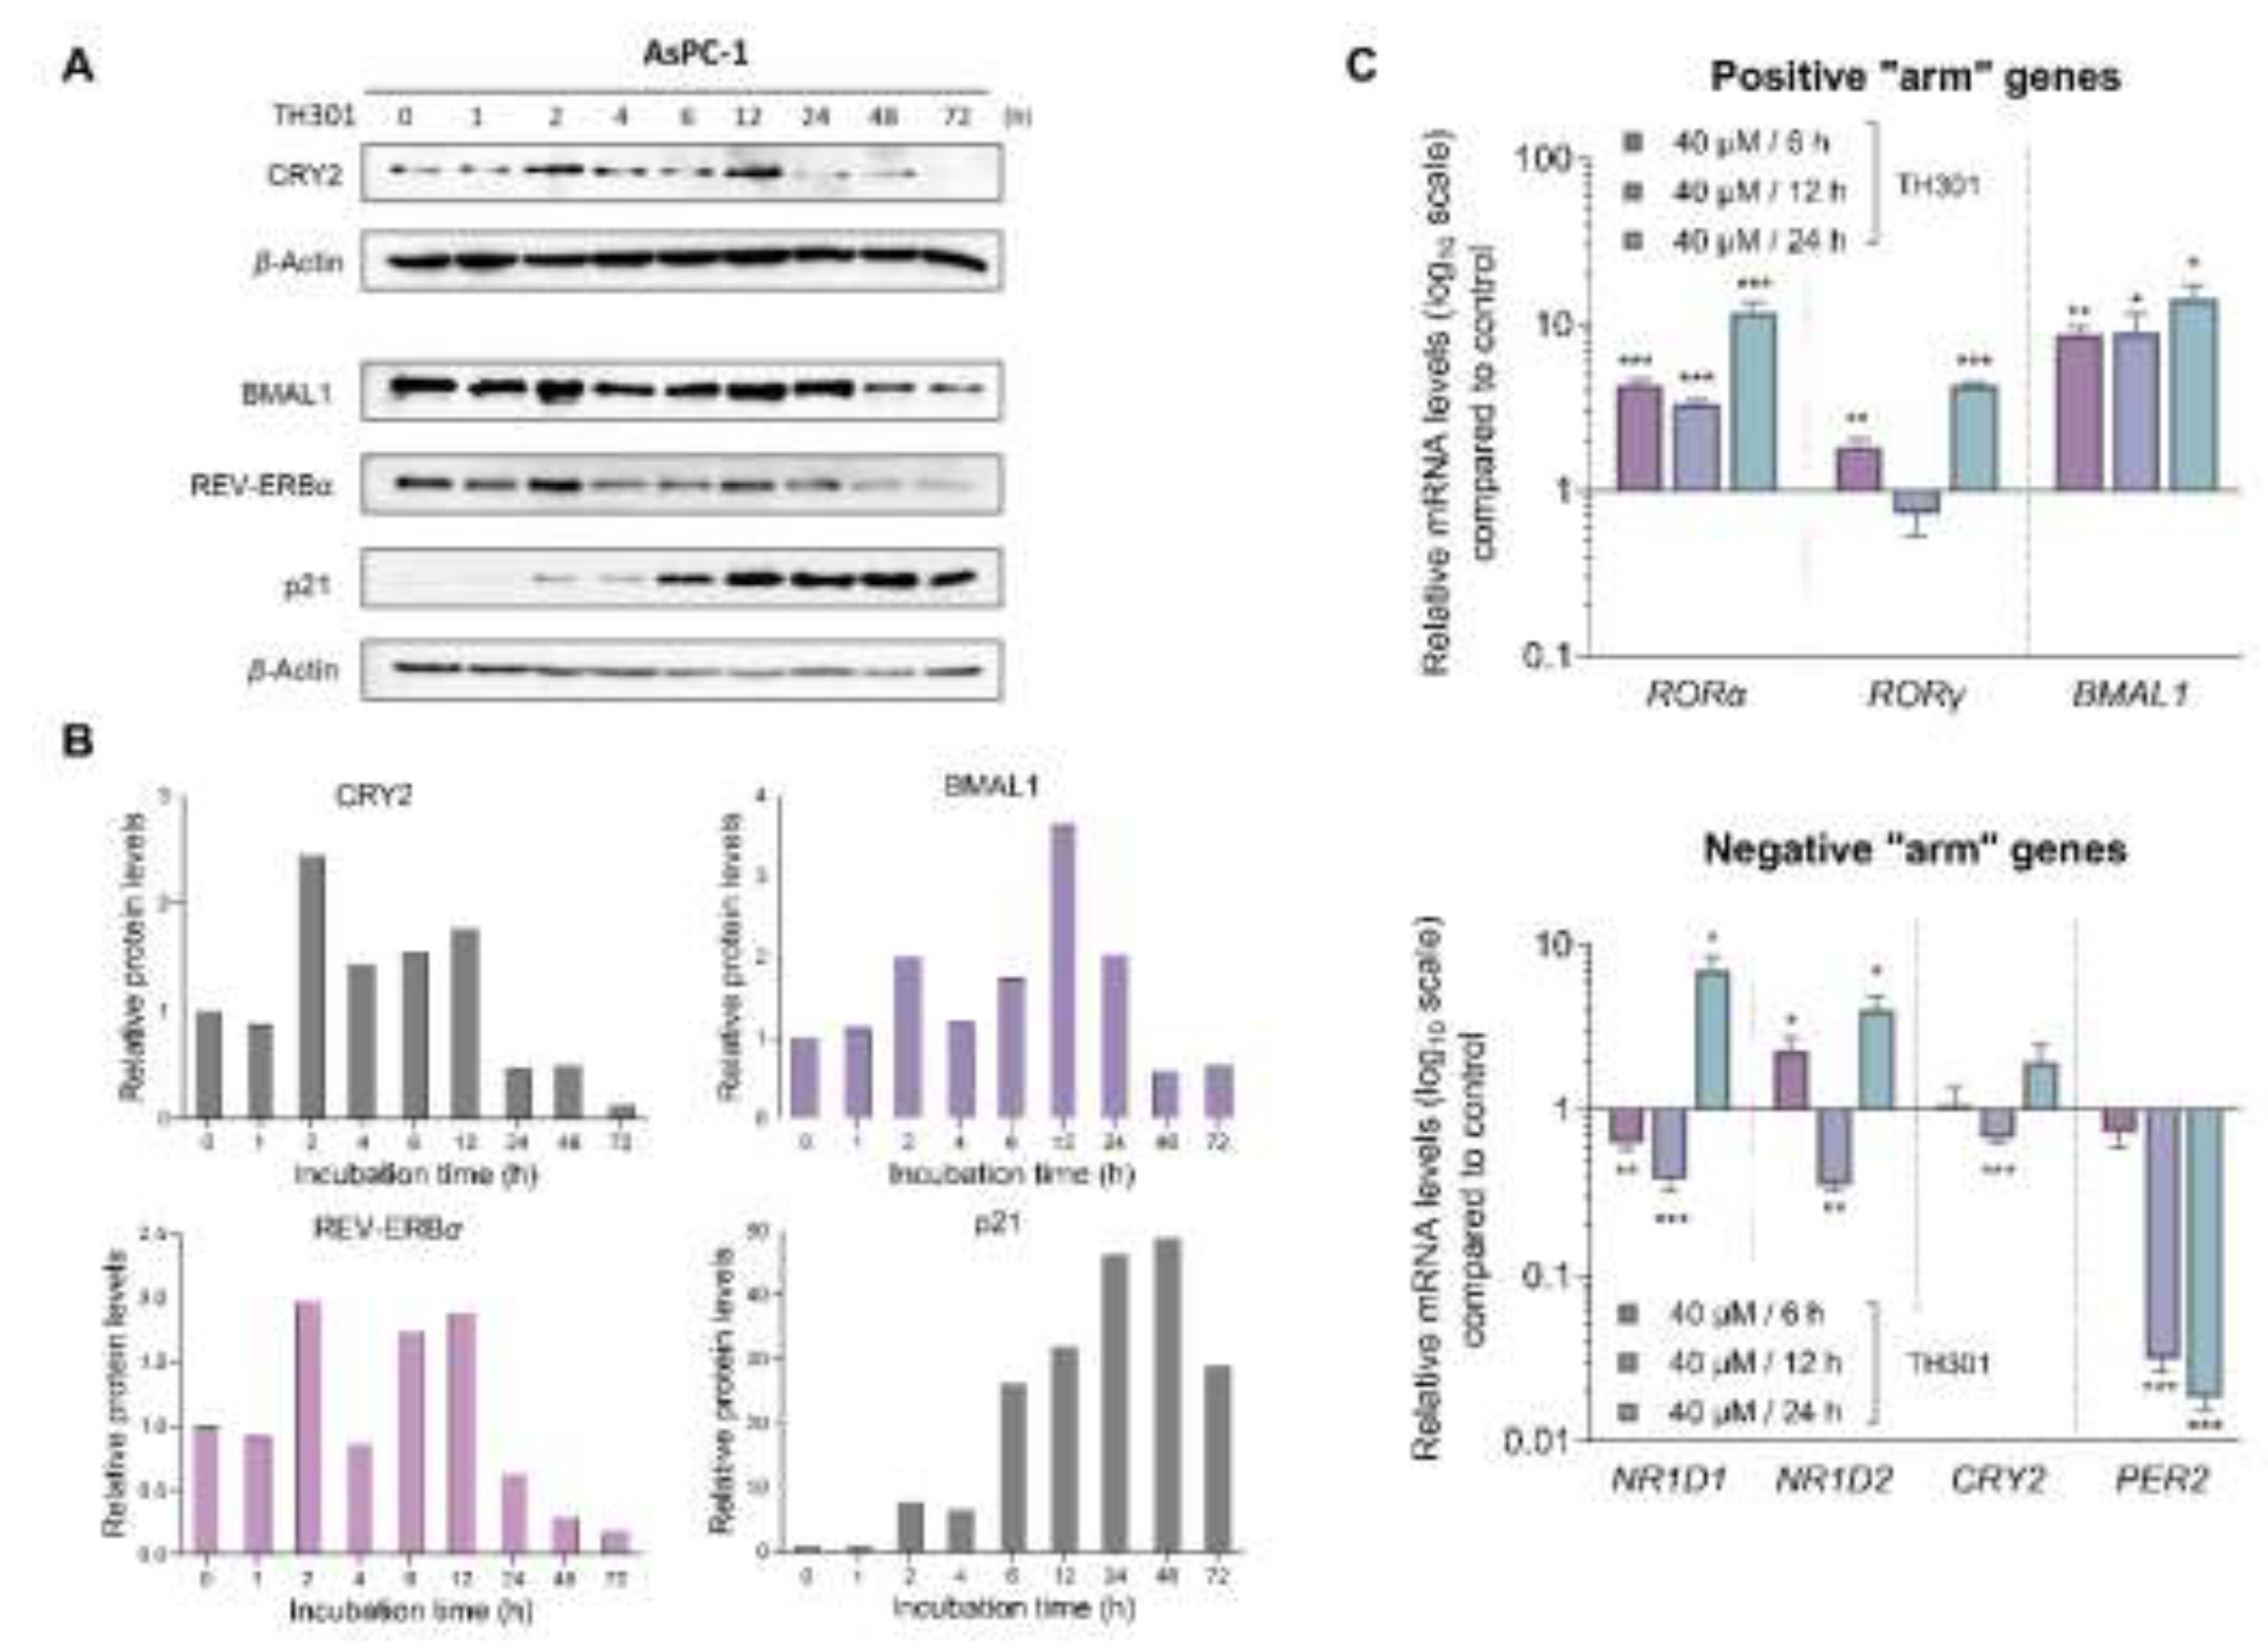
Since TH301 is known to stabilize CRY2, we, next, sought to investigate its (TH301) effects on the expression of circadian-clock key components, which are integral determinants to both the “positive” and the “negative” arm of the circadian-clock feedback loop (Figure 7). Hence, we utilized AsPC-1 cells, since they presented the most pronounced cytopathic responses to TH301 treatment, as compared to the other 2 cell lines, herein, analyzed (see Figs. 1 and 2). Most importantly, AsPC-1 cells completely lack TP53/p53 expression and activity (see Figure 3), allowing us to minimize confounding factors, such as p53, which have been previously reported to influence, and be influenced, by the circadian clock components [43,44]. We, first, examined the expression levels of RORα, RORγ, BMAL1 (positive “arm”), NR1D1, NR1D2, CRY2 and PER2 (negative “arm”) genes, with RORα and BMAL1 of the positive “arm” being presented with a notable upregulation, in response to TH301 administration (Figure 7C; top bar-chart). To the contrary, the PER2 gene that belongs to the negative “arm” of the clock exhibited drastic reduction in its transcriptional activity, following a time-dependent pattern, in the presence of TH301 (Figure 7C; bottom bar-chart). Likewise, PER2 was subjected to a strong transcriptional downregulation, after TH301 administration, in BxPC-3 and PANC-1 cells (Suppl. Figure S5), thus indicating their (PER2 and TH301) mutational load-independent association in PDAC settings. Furthermore, to explore the potential correlation of TH301-mediated modulation of the circadian clock with the induction of p21 cell cycle inhibitor, we analyzed and quantified the expression levels of CRY2, BMAL1, REV-ERBα and p21 proteins, after treating AsPC-1 cells with 40 μM TH301, for various time-periods (0 - 72 h). Figures 7A and 7B describe the ability of TH301 to cause detectable elevations of CRY2, BMAL1 and REV-ERBα protein contents, albeit at different time-points of the treatment period. Although the levels of circadian clock proteins are significantly decreased after 48 and 72 h of treatment, the p21 protein expression was presented with a striking increase, in response to TH301, at the same time-points and, even, earlier (12 - 72 h), thus dictating the mechanistic uncoupling of CRY2 and BMAL1 activities from p21 protein induction. Altogether, our findings prove the TH301 proficiency (a) to perturb circadian clock integrity (e.g., via PER2 transcriptional suppression) and (b) to induce cell cycle arrest, via a striking increase in p21 protein (and gene) levels, in (human) pancreatic cancer cells of specific mutational signatures.
Given that TH301 can cause time-dependent alterations in CRY2 and BMAL1 expression, together with concurrent p21 induction, we, next, sought to further investigate the potential relationship between the modulation in protein levels of CRY2 or BMAL1 clock components, and the increase of p21 contents, in the presence of TH301. To explore this, we, herein, attempted to knock-out CRY2 or knock-down BMAL1 in AsPC-1 cells. Following these gene-targeting protocols, we treated cells with TH301 and analyzed p21 protein levels, for all experimental conditions applied in AsPC-1 cells (e.g., CRY2WT and CRY2CRISP, in the absence and presence of TH301). For the -partial- loss of CRY2, we employed a dual gRNA - CRISPR/Cas9 Lentiviral system, which resulted in a ~3.4 Kb deletion, encompassing Exons 3-5 of the CRY2 gene locus (Suppl. Figure S6). Of note, we were unable to isolate homozygous clones for the deletion, likely due to the essential role(s) of CRY protein in pancreatic cancer cell survival and growth, and, thus, we proceeded with the heterozygous AsPC-1 cells, for further analysis. As described in Figure 8A, -partial- loss of CRY2 (CRY2CRISP) could not affect the TH301-driven induction of p21 protein, as compared to control (CRY2WT) cells. Likewise, CRY2CRISP (AsPC-1) cells were not presented with major perturbations in the expression profiles of BMAL1 and REV-ERBα proteins, and of the circadian clock genes RORα, RORγ, NR1D1 and PER2 (Figs. 8A and 8C). Our findings strongly suggest that the, TH301-induced, modulation of the circadian clock components and the induction of p21 protein are two independent phenomena.
Figure 7.
TH301 modulates core clock proteins, while it induces p21 expression in PDAC cell settings. A. Western blotting profiles of the major circadian clock proteins CRY2, BMAL1 and REV-ERBα, and the cardinal cell cycle regulator p21, after treatment of AsPC-1 cells with 40 μΜ TH301, for 0 - 72 h. B. Quantification of relative protein levels, after normalizing densitometry values to β-Actin. Normalized treated-cell values, for the time-point t = 0 h, were set to value “1”. C. mRNA levels of the clock genes RORα, RORγ, BMAL1 (top bar-chart), NR1D1, NR1D2, CRY2 and PER2 (bottom bar-chart) in AsPC-1 cells, following treatment with 40 μΜ TH301, for 6, 12 and 24 h, being detected and quantified by RT-qPCR protocols. mRNA values were normalized to the IPO8 respective one, while control (0.1% DMSO) was set to value “1”. Data (Ν = 3) are presented as Mean ± SD values. Statistical significance was assessed with Welch’s t-test, as each time-point was considered an independent experiment. Asterisks indicate comparisons in between control (0.1% DMSO, not shown) and (TH301) treated cells, at significance levels of 0.05 and below (*: < 0.05; **: < 0.01; ***: < 0.001).
Next, we questioned whether the -partial- loss of CRY2 could affect the TH301-induced activation of autophagy components and reduction of Survivin contents. It seems that, in contrast to Survivin’s profile (decreased levels, in response to TH301) that remained unaffected, for both control (CRY2WT) and targeted (CRY2CRISP) cells, the two key markers of autophagy, p62/SQSTM1 and LC3B-II (and LC3B-I), were shown with similarly increased protein contents both in CRY2CRISP and in CRY2WT (AsPC-1) cells, after their exposure (24 and 48 h) to the TH301 agent (Figs. 8A and 8Β). Interestingly, treatment of CRY2WT and CRY2CRISP (AsPC-1) cells with TH301, for 4 consecutive days, resulted in significantly reduced cell growth rates, for both cell types (Figure 8D), although (TH301) untreated CRY2CRISP cells showed a slightly increased growth rate compared to their CRY2WT counterparts.
Figure 8.
CRISPR/Cas9-mediated targeting of CRY2 does not affect p21 induction by TH301, in pancreatic cancer cells. A. Western blotting of (a) the clock proteins BMAL1 and REV-ERBα, (b) the autophagy markers p62/SQSTM1 and LC3B-II (and LC3B-I), (c) the cell cycle regulator p21 and (d) the apoptosis inhibitor Survivin, after treating wild-type (CRY2WT) and targeted -heterozygous- (CRY2CRISP) AsPC-1 cells with 40 μΜ TH301, for 24 and 48 h. B. Relative protein levels, after normalization of densitometry values to β-Actin. Normalized CRY2WT values, for 24 and 48 h, were set to value “1”. C. Quantification of mRNA transcript levels of the clock genes RORα and RORγ (positive “arm”), and NR1D1 and PER2 (negative “arm”), in CRY2WT and CRY2CRISP AsPC-1 cells, following treatment with 40 μΜ TH301, for 24 h, being conducted by RT-qPCR protocol. GAPDH served as gene of reference, and the CRY2WT control (0.1% DMSO) was set to value “1”. Data (Ν = 3) are presented as Mean ± SD values. Statistical significance was assessed via One-Way ANOVA, with Dunnet’s multiple comparison correction. Asterisks indicate comparisons of control (CRY2WT, 0.1% DMSO; not shown) to treated CRY2WT, non-treated and treated -heterozygous- CRY2CRISP, AsPC-1, cells, at significance levels of “0.05” and below values (*: < 0.05; **: < 0.01; ***: < 0.001). D. Relative cell growth rates of CRY2WT and CRY2CRISP AsPC-1 cells, in the absence or presence of 40 μΜ TH301, for 0 - 4 days. Data (N = 4) are presented as Mean ± SD values. Statistical significance was assessed with One-way ANOVA, via Tuckey’s multiple comparison correction. Asterisks indicate comparisons in between paired groups, after 0 - 4 days of TH301 exposure (*: < 0.05; **: < 0.01; ***: < 0.001).
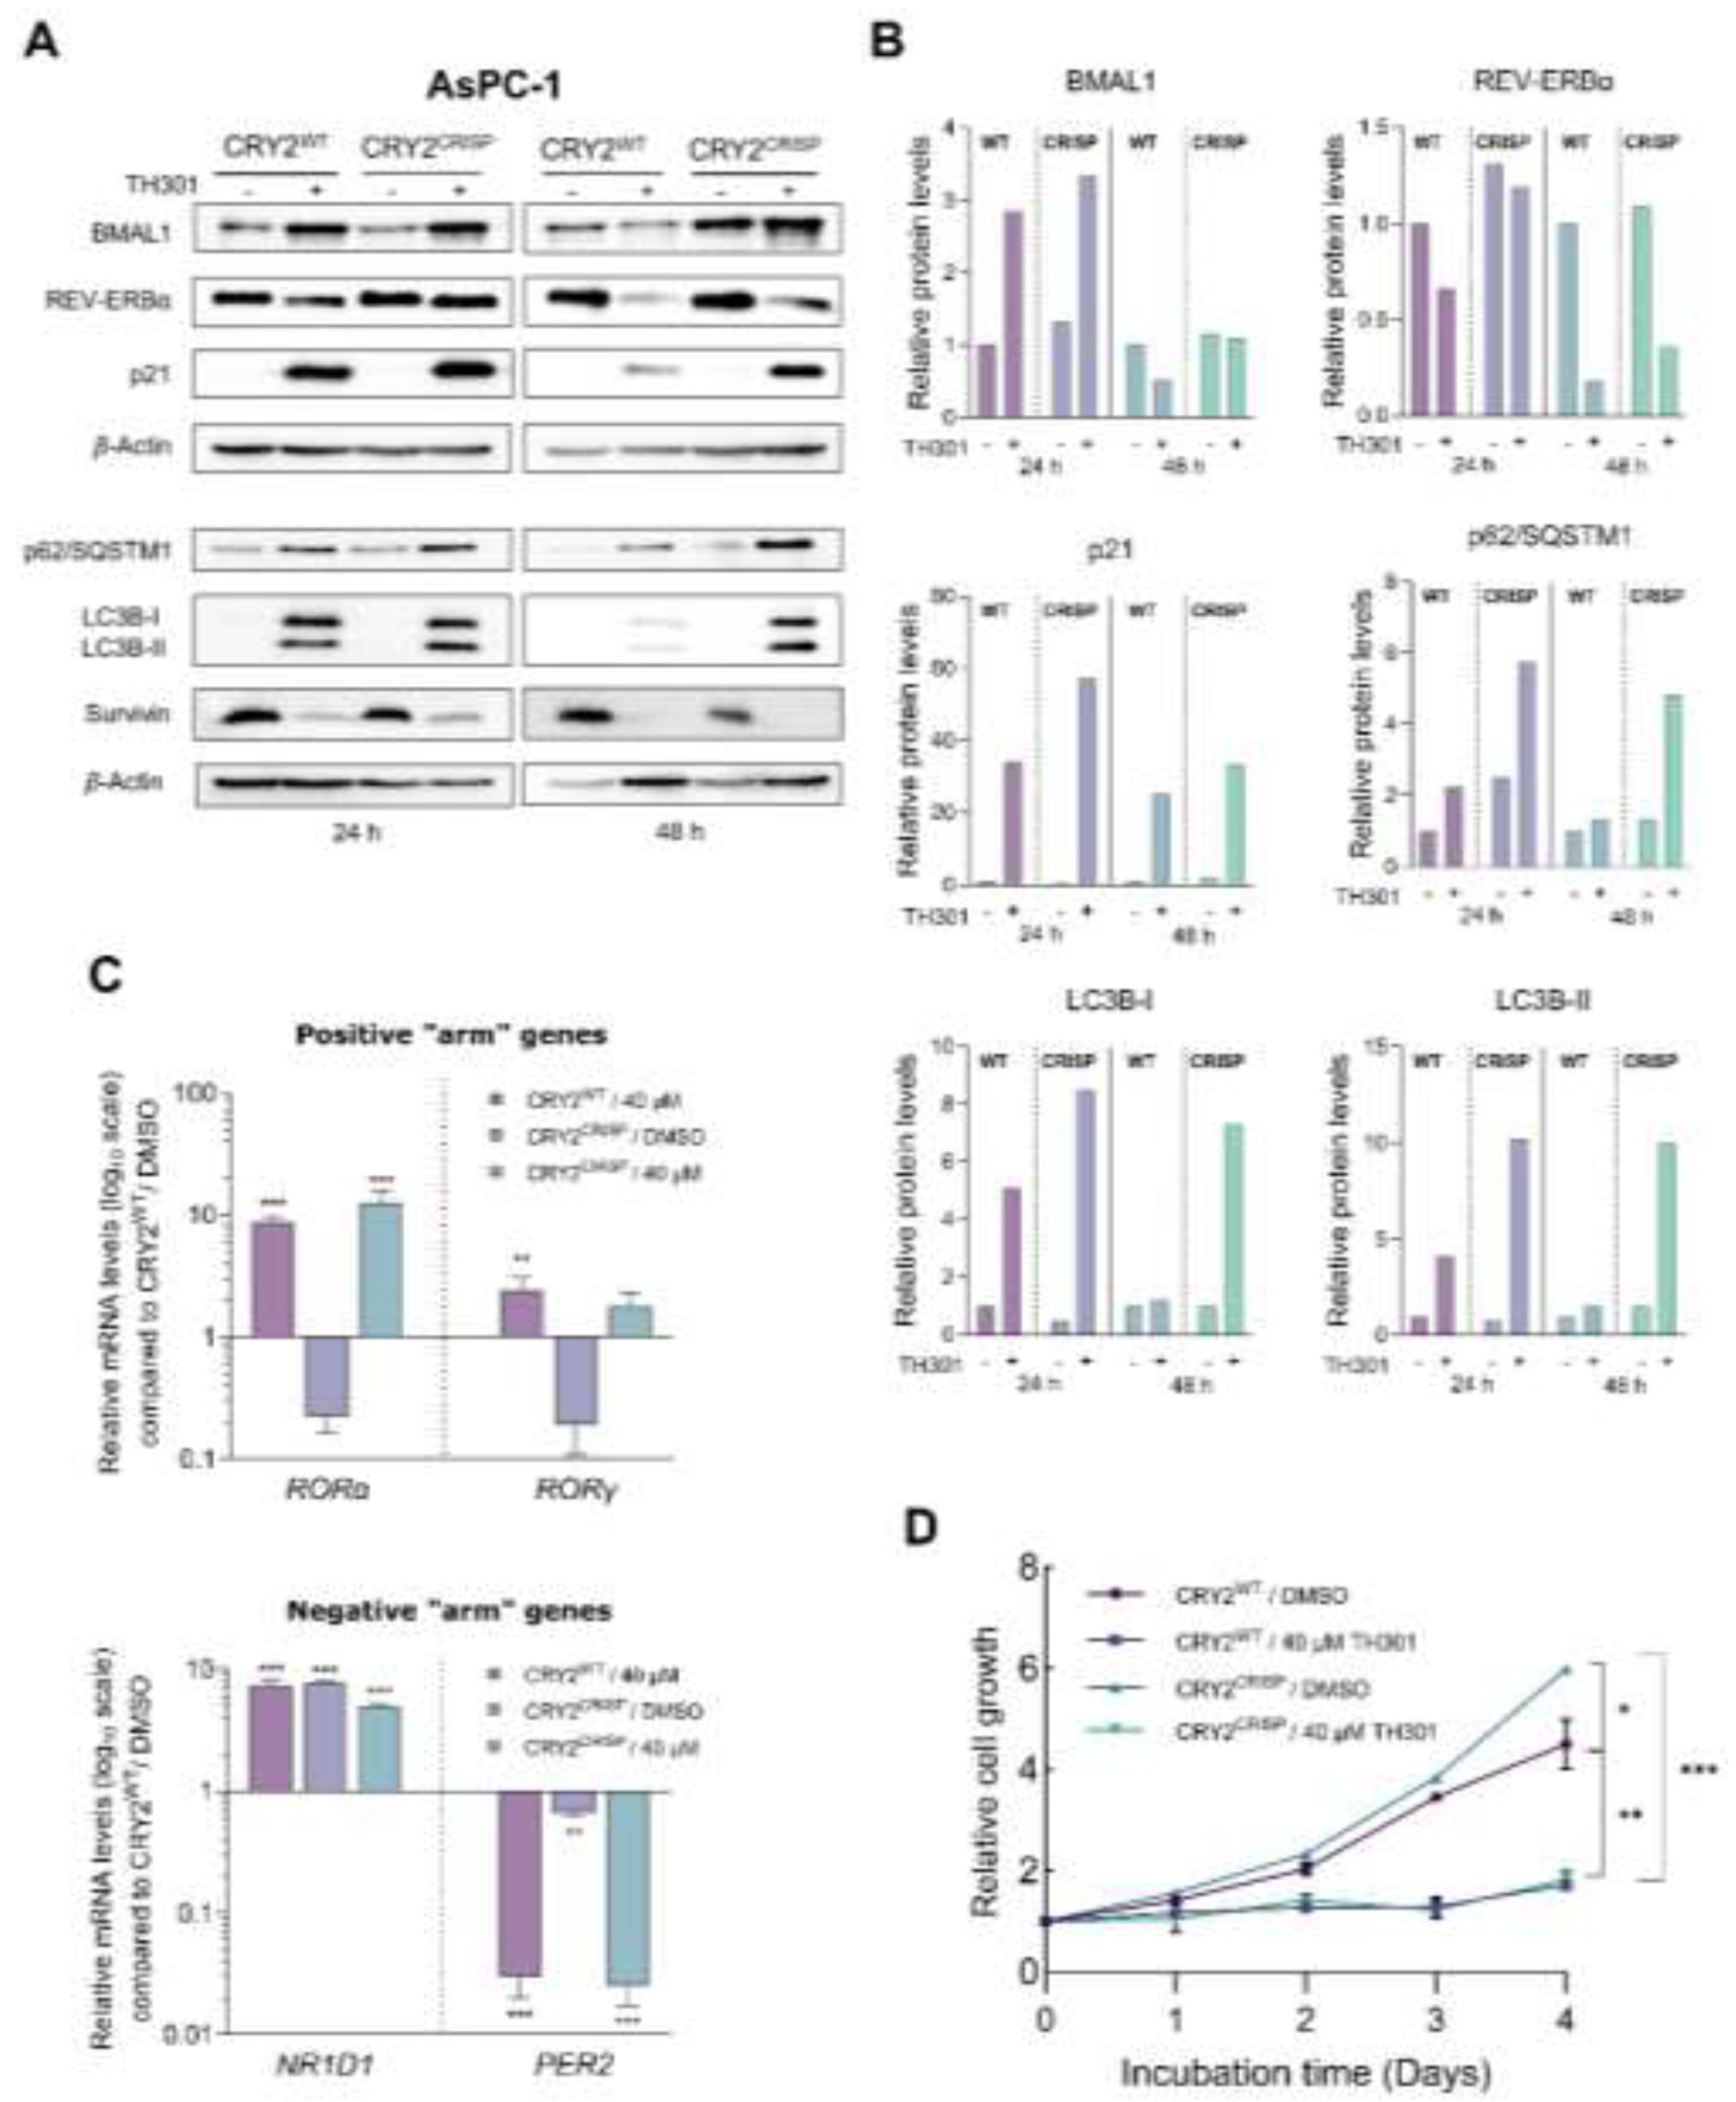
Taken together, our results strongly suggest that TH301 exerts opposite actions on p21 (remarkable induction) and Survivin (notable reduction) protein expression patterns that occur independently of CRY2 modulation in (human) pancreatic cancer cell settings. Nevertheless, a “gene dose-specific effect”, with the CRY2-gene knock-out homozygosity, but not heterozygosity, being likely indispensable for presumable development of severe impairments in gene transcription activities, upon PDAC cell exposure to TH301, cannot be excluded, and, thus, requires further exploration.
Since we observed a notable, TH301-induced, increase of its protein contents, 24 h post-administration, BMAL1 was, next, examined for a presumable functional association with the p21 cell cycle inhibitor (Figure 9). Hence, we specifically knocked-down BMAL1 in AsPC-1 cells, through employment of the shRNA-based technology (Suppl. Figure S7), and, subsequently, determined p21 protein levels. As shown in Figures 9A and 9B, knock-down of BMAL1 (shBMAL1) proved unable to affect the TH301-mediated induction of p21 protein contents. Interestingly, CRY2 levels were significantly reduced in untreated BMAL1 knock-down (shBMAL1) cells, and did not increase after (TH301) treatment, thereby suggesting the lack of any mechanistic correlation in between BMAL1 or CRY2 with p21 induction, in response to TH301 clock modulator. Of note, transcriptional activities of other critical clock genes, herein, examined, such as the RORα, RORγ, NR1D1 and PER2 ones, in BMAL1 knock-down (shBMAL1) cells, were not significantly affected by TH301 administration, compared to Scramble (control) (shScr) cells. Taken together, our findings reveal, for the first time, the BMAL1-independent induction of p21 protein, in response to TH301, and demonstrate that modulation of the circadian clock components cannot influence p21 upregulation by TH301, in human pancreatic cancer cell environments.
Figure 9.
shRNA-mediated BMAL1 knock-down does not affect p21 induction by TH301, in pancreatic cancer cells. A. Western blotting of (a) the clock proteins BMAL1 and CRY2, and (b) the cell cycle regulator p21, after treating control (shScr) and BMAL1 knock-down (shBMAL1), AsPC-1, cells, with 40 μΜ TH301, for 24 h. B. Relative protein levels, after normalizing densitometry values to β-Actin. Normalized shScr values were set to value “1”. C. Quantification of mRNA transcript levels of the clock genes RORα, RORγ, NR1D1, and PER2, in shScr and shBMAL1 AsPC-1 cells, following treatment with 40 μΜ TH301, for 24 h, being performed by RT-qPCR protocols. mRNA values were normalized to GAPDH, while control (shScr, 0.1% DMSO) was set to value “1”. Data (Ν = 3) are presented as Mean ± SD values. Statistical significance was assessed via One-Way ANOVA, with Dunnet’s multiple comparison correction. Asterisks indicate paired comparisons between control shScr (0.1% DMSO; not shown), (TH301) treated shScr, non-treated and (TH301) treated shBMAL1, AsPC-1, cells, at significance levels of “0.05” and below values (ns: non-significant; *: < 0.05; **: < 0.01; ***: < 0.001).
3. Discussion
Modulating cell viability and cell cycle progression is a valuable target for treating malignancies, as sustained proliferation and cell cycle regulation abnormalities are hallmarks of cancer [45,46]. In this work, we have evaluated the circadian clock modulator TH301, for its anti-cancer properties, in the 3 human PDAC cell lines AsPC-1, BxPC-3 and PANC-1. Our results show that TH301 exerts anti-proliferative effects, selectively induces apoptosis, and synergizes with Chloroquine or Oxaliplatin to further reduce PDAC cell viability. Notably, the remarkable increase of p21 expression is, herein, presented as a CRY2- and BMAL1-independent response that is being induced by TH301, thereby suggesting that TH301 can affect essential cellular pathways beyond the circadian clock.
Our MTT cytotoxicity assays performed with the TH301 pharmacological concentration of IC50 at 40 μM revealed a significant decrease of (human) pancreatic cancer cell survival, in a dose- and time-dependent manner, with AsPC-1 and BxPC-3 cells exhibiting higher sensitivities compared to the PANC-1 respective one. Importantly, the mechanism underlying this cell viability reduction seems to be linked to the induction of a G1-phase cell cycle arrest, as documented by the significant accumulation of cells at the G1-phase after TH301 treatment, coupled with a decrease in the S-phase population, thus indicating the inhibition of DNA synthesis and, subsequent, cell cycle progression. In accordance, the marked decrease of Cyclin D3 protein levels and increase of p27 protein contents that are being detected in all 3 cell lines strongly suggest for a common mechanism of TH301 action in pancreatic cancer cells of diverse mutational composition. Likewise, p21 also serves as a major inducible biomarker of TH301 anti-cancer activity, specifically in the AsPC-1 and BxPC-3 (PDAC) cell lines. Previous research has highlighted the critical role of p21 in mediating G1-arrest by inhibiting the cell cycle-promoting activity of CDK-Cyclin complexes, thus preventing the phosphorylation of Retinoblastoma protein (Rb) and blocking the, subsequent, cell cycle progression [47,48]. Intriguingly, PANC-1 cells were presented with lack of p21 induction, despite the increase of its (CDKN1A) mRNA, in response to TH301, which could be associated with post-translational modifications directly compromising protein’s stability [49]. Hence, in the PANC-1 cellular setting, G1-arrest may occur via a p27 upregulation, but in a p21-independent fashion, as previously reported for other systems [50]. Cell cycle typically relies on Cyclins and Cyclin-dependent Kinases (CDKs), as well as on their functional control by CDK Inhibitors (CDKIs: KIP/CIP and INK4 protein families), to drive the progression through its phases; molecular processes that are usually disrupted in cancer [45,46]. Targeting these deregulated cell cycle proteins has emerged as a promising strategy for inhibiting tumor growth. Development of clinically successful CDK4/6 inhibitors (CDK4/6i), like Palbociclib (PD 0332991), which can cause G1-phase arrest by targeting the Cyclin D-CDK4/6 complexes, has been a significant breakthrough in cancer treatment [51]. Similarly, our results demonstrate a comparable anti-proliferative effect of TH301 on all 3 PDAC cell lines examined, by inducing G1-phase cell cycle arrest, and modulating the expression of key cell cycle regulators, including Cyclin D3, CDK4, CDK6, CDK2, p21 and p27, in dose- and cell type-dependent manners. Of note, the significant reduction in the expression of stemness genes, particularly NANOG, across all 3 cell lines, along with the SOX2 and OCT4 downregulation in the BxPC-3 and PANC-1 cell types, unveil the capacity of TH301 to not only inhibiting proliferation but to also reducing stemness (or stem-like properties) of PDAC cells, with the stemness phenotype being frequently associated with resistance to conventional therapies [52]. These molecular changes underscore the striking ability of TH301 to interfere with both cell cycle and stemness machineries, thereby inhibiting cancer cell proliferation and overcoming cancer stemness-mediated resistance.
The -striking- induction of CDKN1A/p21 by TH301, independently of the TP53/p53 status, in diverse PDAC cellular environments, represents another novel and important finding of our study. TP53-gene mutations in PDAC are often associated with “Gain-Of-Function” (GOF) activities that promote cancer cell proliferation and survival [53,54,55,56,57]. CDKN1A/p21 can be induced independently of p53, via activation of distinct transcription factors, such as the STAT (Signal Transducer and Activator of Transcription) family members, Sp1, and others, in response to different stimuli [58,59]. Our results prove that the TH301-induced p21 upregulation can bypass the canonical p53 pathway, thereby providing an effective strategy to counteract the proliferation of PDAC cells harboring GOF p53-mutant forms. Interestingly, the ability of TH301 to increase the γH2AX protein levels strongly suggests that TH301 treatment can promote genotoxic stress, in a p53-independent manner. Whether there is a novel crosstalk in between GOF p53-mutant activity and PDAC genotoxicity, in the presence of TH301, remains still elusive, and needs to be further investigated in the future.
Induction of apoptosis, as evidenced by the -proteolytic- cleavage of PARP1 (inactivation) and Caspase-3 (activation) in the BxPC-3 cells, and, to a lower extent, in the AsPC-1 (magnified at 48 h) and PANC-1 (hardly detectable) cell lines, along with the severe reduction in Survivin protein contents, in response to TH301 exposure, in all 3 (PDAC) cell lines, herein, examined, supports the (pro-)apoptotic capacity of TH301 in (human) pancreatic cancer cells of diverse mutational background. Survivin, a member of the Inhibitor of APoptosis (IAP) family, is known to play a crucial role in inhibiting apoptosis and promoting proliferation of cancer cells, including PDAC [36,37]. Downregulation of Survivin by TH301 indicates compound’s power to effectively counteract major survival mechanisms being employed by human PDAC cells of diverse mutational signatures.
Another key survival mechanism in PDAC is the elevated autophagic activity, which serves, among others, to control ROS (Reactive Oxygen Species) production and, ultimately, DNA damage, thus allowing for continued tumor growth [40]. The significant increase in LC3B-II (and LC3B-I) protein levels and the notable accumulation of p62/SQSTM1 protein, after TH301 administration, unveil the proficiency of TH301 to enhance basal autophagy in PDAC cells of different oncogenic potential. Combination of TH301 with Chloroquine (CQ), an autophagy inhibitor, further augmented cytotoxicity, thus suggesting that the TH301-induced autophagy likely serves as a protective mechanism of pancreatic cancer cells undergoing TH301-driven apoptotic death. Chloroquine treatment alone (single-drug scheme), or in combination with chemotherapy agents (cocktail-drug schemes), have already been shown to attenuate PDAC cell growth [42]. In our study, Chloroquine sensitized PDAC cells to TH301, thereby resulting in increased cell death. This synergistic effect highlights the potential of combining TH301 with autophagy inhibitors as a novel and promising therapeutic strategy to overcome PDAC resistance and improve treatment efficacy. Our findings suggest that TH301 could be successfully evaluated in vivo, as a new and targeted anti-cancer agent, for efficiently disrupting PDAC proliferation and substantially strengthening existing therapeutic regimens, in the clinic.
Previous studies have reported the anti-tumorigenic and chemotherapeutic effects of circadian clock-modulating agents alone, or in combination with known anti-cancer drugs. In this context, the majority of analyzed compounds were agonists of REV-ERBα, REV-ERBβ and RORα proteins [60,61,62,63,64]. Regarding the CRY family members, most of the existing synthetic stabilizers can act either specifically for CRY1 [31,65], or are unable to selectively target either isoform, which remains a major drawback for new generation treatments, as each CRY isoform has been shown to carry distinct functions in the clock and beyond [27,28,29,30,66,67]. Concerning CRY2, to our knowledge, there are, hitherto, no reports describing any anti-cancer activity of the only existing CRY2-specific stabilizer, TH301. Recently, Miller and colleagues demonstrated that TH301 binds to the FAD-binding pocket of CRY2, thereby inhibiting FBXL3-mediated degradation and selectively stabilizing the CRY2 isoform. Using BMAL1:dluc and PER2:dluc reporters in synchronized cells, they also showed that TH301 dampens circadian clock's oscillatory strength/amplitude, particularly after 24 h of continuous TH301 treatment [31]. Although our experiments involved non-synchronized cell cultures and comparatively higher concentrations of TH301, our findings are consistent with their results, as we observe marked modulation of core clock proteins that is being typified by notable decrease in their expression, after longer than 24 h-exposure time to the TH301 agent (e.g., 24 - 72 h).
Surprisingly, our discoveries extend these data, by demonstrating that TH301-derived effects on (p53-independent) p21 induction, (LC3B-II-dependent) autophagy upregulation and Survivin protein reduction constitute complex processes, and likely involve additional critical pathways beyond CRY2 modulation. BMAL1 has also been suggested to play a tumor-suppressor role in PDAC, as its overexpression can cause cell cycle arrest and apoptosis, most probably through a p53-dependent pathway [68]. In contrast, our results show that the TH301-mediated BMAL1 upregulation, or its genetic silencing, cannot affect the TH301-induced increase in p21 protein levels. The uncoupling of p21 induction from BMAL1- and CRY2-gene functions strongly suggests that TH301 can activate and upregulate p21 cell cycle inhibitor through a different, yet unidentified, mechanism that is not directly linked to the core clock machinery. This independence could be attributed to the lack of wild-type p53, since it has been shown to serve as one of the critical components that couples the circadian clock to the cell cycle oscillator [69]. Interestingly, Ozturk and colleagues demonstrated that loss of CRYs offers a protective effect against cancer in mutant-p53 mice, following genotoxic stress, thus indicating a presumable connection and crosstalk in between CRYs and p53 functionalities [70]. We unveil that TH301 causes severe reduction in CRY2 expression levels, most likely sensitizing the mutant-p53 PDAC cell types, herein, examined, to the administered compound TH301. Nevertheless, the partial loss of CRY2 alone could affect only the circadian clock-machinery activities, without significantly altering the phenotypic responses of AsPC-1 cells to the TH301 agent. Taken together, it seems that pharmacological targeting with TH301 deregulates pathways that function independently and beyond the circadian clock, and are critically implicated in cell cycle arrest and apoptosis activation.
The examination and evaluation of the circadian clock modulator TH301 as an anti-cancer agent, which are thoroughly described in the present work, have uncovered several promising avenues for the treatment of Pancreatic Ductal Adeno-Carcinoma (PDAC) that, despite the strenuous efforts, still remains one of the most lethal malignancies [1]. The p53-independent induction of p21 cell cycle inhibitor, to really remarkable levels, clearly discloses the potential therapeutic impact of TH301 on PDAC cells that harbor p53 protein mutations, or even TP53-gene locus deletions. Of note, the capacity of TH301 to compromise stemness and to, also, induce apoptosis, particularly in AsPC-1 and BxPC-3 cells, further enhances its chemotherapeutic power, in PDAC environments. Moreover, its ability to severely diminish Survivin protein expression, and to strongly induce autophagy program, indicates that TH301 can critically impact multiple survival pathways in PDAC cellular settings, thereby rendering TH301 a multifaceted and versatile agent, with novel anti-proliferative, anti-survival and anti-oncogenic properties against human PDACs of diverse mutational signatures.
4. Materials and Methods
4.1. Cell lines and Culture Conditions
The human pancreatic cancer cell lines BxPC-3 and PANC-1 were kindly and generously obtained from Professor Karamouzis (Faculty of Medicine, National and Kapodistrian University of Athens, Athens, Greece), while the human pancreatic cancer cell line AsPC-1 was kindly provided by Professor Dimas (Faculty of Medicine, University of Thessaly, Greece). HEK-293T cells were purchased from the American Type Culture Collection (ATCC, Manassas, Virginia, USA). All cell lines were cultured according to each provider’s recommendations. More specifically, AsPC-1 and BxPC-3 cell lines were cultured in Roswell Park Memorial Institute 1640 (1x RPMI-1640, ATCC modification; Gibco - Thermo Fisher Scientific, Waltham, Massachusetts, USA) medium. PANC-1 and HEK-293T cell lines were cultured in Dulbecco’s Modified Eagle Medium (1x DMEM, supplemented with High Glucose, Stable Glutamine and Sodium Pyruvate; Biosera, Cholet, France). Both media were supplemented with 10% Fetal Bovine Serum (FBS; Gibco - Thermo Fisher Scientific, Waltham, Massachusetts, USA), 2.5% Sodium Bicarbonate (Biowest, Nuaillé, France), 1% Non-essential Amino-acids (Biowest, Nuaillé, France), 100 U/mL Penicillin - Streptomycin (Biowest, Nuaillé, France) and 2.5 μg/mL Amphotericin B (Biowest, Nuaillé, France). All cells were maintained at +37 oC, in a humidified air-atmosphere (> 95% humidity) and 5% CO2 environment.
4.2. Inhibitors
KS15 (Aobious Inc., Gloucester, Massachusetts, USA), KL001 (Cayman Chemical Company, Ann Arbor, Michigan, USA), TH301 (Focus Biomolecules, Plymouth Meeting, Pennsylvania, USA), and Chloroquine (TargetMol Chemicals Inc., Boston, Massachusetts, USA) chemical compounds (inhibitors) were dissolved in 100% Di-Methyl-Sulf-Oxide (DMSO; Sigma - Aldrich, St. Louis, Missouri, USA), at a stock concentration of 0.1 M for KL001 and TH301, 0.05 M for KS15, and 10 mM for Chloroquine. Stock solutions were stored at -20 oC, in single-use aliquots. For cell treatment, each reagent was diluted in the appropriate culture medium to a final DMSO concentration of 0.1%. Oxaliplatin (Intas Pharmaceuticals Ltd., Ahmedabad, Gujarat, India) was diluted in Water for injection, at a final concentration of 0.01 M and used immediately. All solutions were thoroughly mixed before being added to the cells.
4.3. MTT Assay
Inhibitor-induced cytotoxicity and cell growth arrest were quantified by the MTT assay. Briefly, cells were plated in 96-well flat-bottomed micro-plates, containing 100 μL culture medium, at a density of approximately 5,000 cells/well, for cytotoxicity and 1,500 cells/well, for cell growth arrest measurements. Seeded cells were incubated over-night, at +37 oC, in a humidified atmosphere (> 95%) and 5% CO2 environment. After incubation, old medium was replaced with fresh medium, containing appropriate concentrations of reagents/inhibitors. At specific time-points of treatment, medium from each well was replaced with Thiazolyl-Blue-Tetrazolium-Bromide (MTT; Abcam, Cambridge, United Kingdom), being dissolved at a final concentration of 1 mg/mL, in Serum-free and Phenol-Red-free DMEM medium (PAN Biotech, Aidenbach, Germany), and being remained for another 4 h. Then, the MTT - Formazan product was solubilized in Isopropanol, and the optical density was measured with the Spark Multimode Micro-plate Reader (TECAN Group Ltd., Männedorf, Switzerland), at a wavelength of 550 nm and a reference wavelength of 690 nm.
4.4. Cell Cycle Analysis
1 x 10⁶ cells were seeded in 6 cm cell culture dishes and incubated over-night, at +37 oC and 5% CO2, in a humidified atmosphere (> 95% humidity). Following treatment, cells were mildly collected with cell scraper, centrifuged at 300 x g, for 5 min and washed in Phosphate-Buffered Saline (PBS; 1x). Next, cells were fixed in 70% ice-cold Ethanol, for at least 30 min, at +4 oC, washed with 1x PBS, and re-suspended in DNA staining solution, containing 50 mg/mL Propidium Iodide (PI; Sigma - Aldrich, St. Louis, Missouri, USA), 10 μg/mL RNAse A (in 1x PBS), 5 mM MgCl2 (1 M Stock) and 10 mM Tris-HCl (pH 7.5; 1 M Stock), and incubated, for 30 min, in the dark, at room temperature (RT). Cells were analyzed by the Flow Cytometer Cytomics FC 500 (Beckman - Coulter, Brea, California, USA), using the advanced CXP software (Beckman - Coulter, Brea, California, USA).
4.5. RNA Extraction
Cells were plated in 6 cm culture dishes, and incubated at +37 oC and 5% CO2 (> 95% humidity), until they reached ~90% confluency. At specific time-points following inhibitor administration, or/and transfection/transduction, cells were collected by mild scraping, and, next, centrifuged at 1,500 x g, for 5 min, with the obtained cell pellets being washed twice, in 1x PBS. Total RNA was isolated with the FastGene RNA Premium Kit (Nippon Genetics, Tokyo, Japan), following manufacturer’s instructions. Final RNA concentration was measured using the high-accuracy Spectrophotometer NanoDrop ND-1000 UV-Vis (Thermo Scientific, Waltham, Massachusetts, USA) and RNA was stored at -80 oC, for further use.
4.6. RT-qPCR
For RT-qPCR (Real Time - quantitative Polymerase Chain Reaction) analysis, the extracted RNA was reverse transcribed into cDNA, by using Random Hexamers (Eurofins MWG Operon, Ebersberg, Germany) and the MMLV (Moloney Murine Leukemia Virus) Reverse Transcriptase (Takara Bio Inc., Shiga, Japan). RT-qPCR was performed via employment of the qPCRBIO SyGreen Lo-ROX mix (PCR Biosystems, London, England, United Kingdom), in 8-tube strips and the MX300P Quantitative PCR System (Agilent-Stratagene, Santa Clara, California, USA). For detection of gene expression, gene-specific primers were custom-designed (Table S1). Gene expression levels were normalized by the Importin 8 (IPO8) or Glyceraldehyde-3-Phosphate Dehydrogenase (GAPDH) mRNA respective ones. Relative gene expression was calculated, using the 2-ΔΔCt method [71]. Mean and Standard Deviation (SD) values were calculated, including 3 technical replicates, while biological experiments were performed at least 2 times.
4.7. Western Blotting
For protein expression analysis, cells were plated in 6 cm culture dishes, and incubated at +37 oC, and 5% CO2 (> 95% humidity), until they reached ~90% confluency. At specific time-points following treatment, or/and transfection/transduction, cells were collected by mild scraping, centrifuged at 2,500 x g, for 5 min, and the obtained cell pellets were washed 3 times in 1x PBS. Following a second round of centrifugation at 2,500 x g, for 5 min, cell pellets were resuspended in cold RIPA (Radio-Immuno-Precipitation Assay) Lysis Buffer (PierceTM RIPA buffer; Thermo Scientific, Waltham, Massachusetts, USA), containing Protease Inhibitors (HaltTM Protease Inhibitor Cocktail; Thermo Scientific, Waltham, Massachusetts, USA) and 1 mM PMSF (Phenyl-Methyl-Sulfonyl-Fluoride) (Sigma - Aldrich, St. Louis, Missouri, USA), for 5 min, and, next, centrifuged at 14,000 x g, for 15 min, at +4 oC. Protein concentration was measured with the BCA (Bi-Cinchoninic Acid, or Smith) Assay (BCA Assay Protein Kit; Cell Signaling Technology, Danvers, Massachusetts, USA). Cell lysates containing 6% SDS (Sodium-Dodecyl-Sulfate)-sample buffer were boiled, for 10 min, and 25 μg of total protein from each cell lysate were subjected to SDS – Poly-Acrylamide Gel Electrophoresis (SDS - PAGE), and, subsequently, transferred onto PVDF (Poly-Vinyli-Dene-Fluoride) Membrane(s) (Immobilon-P SQ Membrane, PVDF, 0.2 µm; Merck-Millipore, Burlington, Massachusetts, USA), using a Mini Trans-Blot Cell Transfer System (Bio-Rad, Hercules, California, USA). Membranes were probed with the following Primary Antibodies: p21WAF1/CIP1 (1:500; Cell Signaling Technology, Danvers, Massachusetts, USA; #2947), p27KIP1 (1:500; Cell Signaling Technology, Danvers, Massachusetts, USA; #9932), CDK2 (1:500; Cell Signaling Technology, Danvers, Massachusetts, USA; #2546), CDK4 (1:500; Cell Signaling Technology, Danvers, Massachusetts, USA; #12790), CDK6 (1:500; Cell Signaling Technology, Danvers, Massachusetts, USA; #3136), Cyclin D3 (1:500; Cell Signaling Technology, Danvers, Massachusetts, USA; #2936), p53 (1:500; Cell Signaling Technology, Danvers, Massachusetts, USA; #9282), Phospho-p53 (Ser15) (1:500; Cell Signaling Technology, Danvers, Massachusetts, USA; #9284), Caspase-3 (1:500; Cell Signaling Technology, Danvers, Massachusetts, USA; #9662) Cleaved/Activated Caspase-3 (1:500; Cell Signaling Technology, Danvers, Massachusetts, USA; #9664), Survivin (1:500; Cell Signaling Technology, Danvers, Massachusetts, USA; #2808), LC3B(I/II) (1:500; Cell Signaling Technology, Danvers, Massachusetts, USA; #43566), p62/SQSTM1 (1:500; Cell Signaling Technology, Danvers, Massachusetts, USA; #5114), PARP1 (1:500; Cell Signaling Technology, Danvers, Massachusetts, USA; #9532), BMAL1 (1:500; Cell Signaling Technology, Danvers, Massachusetts, USA; #14020), REV-ERBα (1:500; Cell Signaling Technology, Danvers, Massachusetts, USA; #13418), CRY2 (1:200; Origene Technologies, Rockville, Maryland, USA; #TA502905S), Phospho-Histone H2A.X (γH2AX) (1:500; Cell Signaling Technology, Danvers, Massachusetts, USA; #9718) and beta-Actin (β-Actin) (1:2,000/1:500; Cell Signaling Technology, Danvers, Massachusetts, USA; #14020; Origene Technologies, Rockville, Maryland, USA; #TA310155). After incubation with the respective HRP-conjugated Secondary Antibody (1:2,000; Anti-rabbit IgG, #7074; 1:2,000, Anti-mouse IgG, #7076; Cell Signaling Technology, Danvers, Massachusetts, USA), signals were detected using the Immobilon Classico Western HRP Substrate (Merck-Millipore, Burlington, Massachusetts, USA) and obtained images were acquired by the Fujifilm LAS-4000 Imaging System (Fujifilm Corporation, Tokyo, Japan). Data were analyzed by the Bio-Rad Image Lab Software, Version 6.1 (Bio-Rad, Hercules, California, USA).
4.8. Plasmids
The EGFP-expressing shRNA constructs, targeting BMAL1 (TL314656A, TL314656B, TL314656C and TL314656D), and the Scramble control Vector (TR30021), were obtained from Origene Technologies (Rockville, Maryland, USA). Scramble gRNA Lentiviral control Vector pLV[CRISPR]-hCas9/Puro-U6>Scramble_gRNA1 and Dual gRNA mammalian CRISPR Lentiviral Vector pLV[2CRISPR]-hCas9:T2A:Puro-U6>{hCRY2[gRNA#1]}-U6>{hCRY2[gRNA#2]}, targeting CRY2, were constructed and packaged by VectorBuilder (Chicago, Illinois, USA). The Vector ID, for Scramble, is VB010000-9355sqw, and, for the Dual gRNA CRISPR/hCas9 Vector, is VB240129-1545dxv (can be used to retrieve detailed information from “vectorbuilder.com”). The Lentivirus Packaging Plasmid psPAX2 (Addgene, Watertown, Massachusetts, USA; Plasmid #12260) and the Envelope Plasmid pMD2.G (Addgene, Watertown, Massachusetts, USA; Plasmid #12259) were kindly and generously provided by Professor Didier Trono (School of Life Sciences, École Polytechnique Fédérale de Lausanne, Lausanne, Switzerland). All Plasmids were verified with Restriction-site Digestion and agarose-gel Electrophoresis.
4.9. Lentivirus production
For the knock-down of BMAL1, shRNA Plasmids (Scramble and 4 different knock-down Plasmids) were used to transfect ~50% confluent HEK-293T cells, having been seeded in 10 cm culture dishes, engaging the Calcium Phosphate (Sigma - Aldrich, St. Louis, Missouri, USA) method [72]. Transfection efficiency was quantified by GFP intensity, at 24 and 48 h, post-transfection, using Fluorescence Microscopy. The construct with the -comparatively- highest knock-down efficiency was determined by Western blotting, and further used, for Lentivirus production to subsequent knock-down experiments. For Lentivirus production, HEK-293T cells were seeded in a 10 cm culture dish until ~80% confluency. Two hours post-transfection, old medium was replaced with fresh complete medium lacking antibiotics. Cells were co-transfected with 4.2 μg psPAX2, 2.5 μg pMD2.G and 5.8 μg BMAL1 knock-down Plasmid (or Scramble control Plasmid), or 7.2 μg psPAX2, 4.0 μg pMD2.G and 11.5 μg CRY2 knock-out CRISPR/hCas9 Plasmid (or Scramble control Plasmid), using Calcium Phosphate protocols [72]. Conditioned supernatant, containing Lentivirus particles, was harvested, at 24 and 48 h post-transfection, and, next, centrifuged at 4,000 x g, for 15 min, to remove cell debris. Pooled supernatants were filtered (0.45 μm Syringe Filter, Millex-HP; Merck - Millipore, Burlington, Massachusetts, USA) and used for Lentiviral transduction. Viral RNAs were extracted through employment of the NucleoSpin RNA Virus Kit (Macherey-Nagel, Düren, Germany) and titrated via engagement of the Lenti-X™ RT-qPCR Titration Kit (Takara Bio Inc., Shiga, Japan).
4.10. Lentivirus transduction
AsPC-1 cells were transduced with 8 mL virus filtrate, including 8 μg/mL Polybrene (Santa Cruz Biotechnology, Dallas, Texas, USA), in a 10 cm culture dish. Supernatant was replaced after 6 to 8 h with fresh complete medium (supplemented with 20% FBS). For BMAL1 knock-down, transduction efficiency was quantified by GFP intensity, through Fluorescence Microscopy and polyclonal cell populations, expressing GFP, were further used for downstream experiments. For CRY2 knock-out, stably transduced cells were clonally selected, using 2.5 μg/mL Puromycin Di-Hydro-Chloride (BioChemica, PanReac - Applichem, Darmstadt, Germany), for 1 week, and 5 μg/mL, for another 3 weeks.
4.11. Genomic DNA extraction and PCR amplification
For the validation and genotyping of CRISPR/hCas9-mediated knock-out cells, genomic DNA (gDNA) was extracted, using the Monarch Genomic DNA Purification Kit (New England Biolabs, Ipswich, Massachusetts, USA), according to manufacturer’s instructions. Genomic PCR amplification of the expected ~4.8 Kb gDNA fragment, encompassing the target sequence, was performed, using custom-designed primers (Table S1), and the Q5 High-Fidelity DNA Polymerase (New England Biolabs, Ipswich, Massachusetts, USA). Produced Amplicons were separated in (1%) agarose-gel electrophoresis.
4.12. Statistical analysis
Experiments were performed at least 2 times, with at least 3 technical replicates, each. IC50 values were calculated with the non-linear, fit dose-response, model. Data are provided as Mean ± SD (Standard Deviation) or SEM (Standard Error of the Mean) values. p-value < 0.05 was considered as statistically significant. Significance was analyzed by unpaired Welch’s t-test, One-way or Two-way ANOVA, with Tuckey’s multiple comparisons test, unless otherwise stated, using the Prism Software, Version 10.3 (GraphPad Software, San Diego, California, USA).
5. Conclusions
Altogether, this study demonstrates the potential and promise of TH301, a novel CRY2 molecular stabilizer, to act as a new therapeutic agent for Pancreatic Ductal Adeno-Carcinoma (PDAC). TH301 effectively inhibits PDAC cell proliferation, induces cell cycle arrest at the G1-phase, promotes apoptosis and activates autophagy, via engagement of molecular mechanisms that function independently of the canonical p53 pathway. Interestingly, TH301 enhances the cytotoxic effects of Chloroquine and the conventional chemotherapeutic drug Oxaliplatin, thereby suggesting the need of its (TH301) prompt employment in combination therapy schemes, to overcome drug resistance often being developed in PDAC and other aggressive malignancies. Most importantly, the p21 induction, herein, observed, in response to TH301 treatment, seems to occur independently of both CRY2 and BMAL1 modulation, thus indicating the involvement of alternative pathways, successfully operating in pancreatic cancer cell environments of diverse mutational loads.
Our findings place TH301 in a unique position as a novel, powerful and promising agent, for further development of new regimens being dedicated to treatment of PDAC, and presumably other baneful cancers, whereat circadian clock disruption serves as a contributing factor to disease initiation, progression, metastasis and/or chemoresistance. Future research must focus on elucidating the precise molecular mechanisms by which TH301 exerts its anti-cancer effects, and on, also, exploring its chemotherapeutic efficacies in vivo.
Supplementary Materials
The following supporting information can be downloaded at the website of this paper posted on Preprints.org, Figure S1: title; Table S1: title; Video S1: title.
Author Contributions
Conceptualization, D.F., D.J.S. and A.P.; Methodology, D.F., D.J.S. and A.P.; Software, D.F.; Validation, D.F., D.J.S. and A.P.; Formal Analysis, D.F., D.J.S. and A.P.; Investigation, D.F., D.J.S. and A.P.; Resources, D.J.S. and A.P.; Data Curation, D.F., D.J.S. and A.P.; Writing—Original Draft Preparation, D.F. and A.P.; Writing—Review and Editing, D.J.S.; Visualization, D.F., D.J.S. and A.P.; Supervision, D.J.S. and A.P.; Project Administration, D.J.S. and A.P. All authors have read and agreed to the Published Version of the Manuscript.
Funding
This research has received no external funding.
Institutional Review Board Statement
Not applicable.
Informed Consent Statement
Not applicable.
Data Availability Statement
All data are available in the Main Text or Supplementary Materials.
Acknowledgements
We thank Dr. Panagiotis Sarantis (Faculty of Medicine, National and Kapodistrian University of Athens {NKUA}, Athens, Greece), for kindly and generously providing the Oxaliplatin drug used in this study. We also thank Dr. Faye Soukou (Institute of Biosciences and Applications {IBA}, National Centre for Scientific Research {NCSR} “Demokritos”) for her invaluable technical support with FACS.
Conflicts of Interest
The authors declare no conflicts of interest.
References
- Bray, F.; Laversanne, M.; Sung, H.; Ferlay, J.; Siegel, R.L.; Soerjomataram, I.; Jemal, A. Global Cancer Statistics 2022: GLOBOCAN Estimates of Incidence and Mortality Worldwide for 36 Cancers in 185 Countries. CA Cancer J Clin 2024, 74, 229–263. [CrossRef]
- Korhan, P.; Verkerk, R.; R Critchley, W. Scientific Rationale for Integrative and Personalised Strategies for Pancreatic Ductal Adenocarcinoma Management. Integr Mol Med 2017, 4. [CrossRef]
- Giovannetti, E.; van der Borden, C.L.; Frampton, A.E.; Ali, A.; Firuzi, O.; Peters, G.J. Never Let It Go: Stopping Key Mechanisms Underlying Metastasis to Fight Pancreatic Cancer. Semin Cancer Biol 2017, 44, 43–59.
- Huang, L.; Guo, Z.; Wang, F.; Fu, L. KRAS Mutation: From Undruggable to Druggable in Cancer. Signal Transduct Target Ther 2021, 6.
- Gurreri, E.; Genovese, G.; Perelli, L.; Agostini, A.; Piro, G.; Carbone, C.; Tortora, G. KRAS-Dependency in Pancreatic Ductal Adenocarcinoma: Mechanisms of Escaping in Resistance to KRAS Inhibitors and Perspectives of Therapy. Int J Mol Sci 2023, 24.
- Erkan, M.; Hausmann, S.; Michalski, C.W.; Fingerle, A.A.; Dobritz, M.; Kleeff, J.; Friess, H. The Role of Stroma in Pancreatic Cancer: Diagnostic and Therapeutic Implications. Nat Rev Gastroenterol Hepatol 2012, 9, 454–467.
- Lee, C.J.; Li, C.; Simeone, D.M. Human Pancreatic Cancer Stem Cells: Implications for How We Treat Pancreatic Cancer. Transl Oncol 2008, 1, 14–18. [CrossRef]
- Battaglin, F.; Chan, P.; Pan, Y.; Soni, S.; Qu, M.; Spiller, E.R.; Castanon, S.; Roussos Torres, E.T.; Mumenthaler, S.M.; Kay, S.A.; et al. Clocking Cancer: The Circadian Clock as a Target in Cancer Therapy. Oncogene 2021, 40, 3187–3200.
- Roenneberg, T.; Merrow, M. Circadian Clocks - The Fall and Rise of Physiology. Nat Rev Mol Cell Biol 2005, 6, 965–971.
- Matsuo, T.; Yamaguchi, S.; Mitsui, S.; Emi, A.; Shimoda, F.; Okamura, H. Control Mechanism of the Circadian Clock for Timing of Cell Division in Vivo. Science (1979) 2003, 302, 255–259. [CrossRef]
- Ma, D.; Li, S.; Molusky, M.M.; Lin, J.D. Circadian Autophagy Rhythm: A Link between Clock and Metabolism? Trends in Endocrinology and Metabolism 2012, 23, 319–325.
- Wende, A.R.; Young, M.E.; Chatham, J.; Zhang, J.; Rajasekaran, N.S.; Darley-Usmar, V.M. Redox Biology and the Interface between Bioenergetics, Autophagy and Circadian Control of Metabolism. Free Radic Biol Med 2016, 100, 94–107.
- Sancar, A.; Lindsey-Boltz, L.A.; Kang, T.H.; Reardon, J.T.; Lee, J.H.; Ozturk, N. Circadian Clock Control of the Cellular Response to DNA Damage. FEBS Lett 2010, 584, 2618–2625.
- Cao, X.; Yang, Y.; Selby, C.P.; Liu, Z.; Sancar, A. Molecular Mechanism of the Repressive Phase of the Mammalian Circadian Clock. PNAS 2020, 118. [CrossRef]
- Takahashi, J.S. Transcriptional Architecture of the Mammalian Circadian Clock. Nat Rev Genet 2017, 18, 164–179.
- Roenneberg, T.; Merrow, M. The Network of Time: Understanding the Molecular Circadian System. Curr Biol 2003, 13, R198–R207. [CrossRef]
- Hunt, T.; Sassone-Corsi, P. Riding Tandem: Circadian Clocks and the Cell Cycle. Cell 2007, 129, 461–464.
- Gréchez-Cassiau, A.; Rayet, B.; Guillaumond, F.; Teboul, M.; Delaunay, F. The Circadian Clock Component BMAL1 Is a Critical Regulator of P21 WAF1/CIP1 Expression and Hepatocyte Proliferation. Journal of Biological Chemistry 2008, 283, 4535–4542. [CrossRef]
- Zhu, X.; Maier, G.; Panda, S. Learning from Circadian Rhythm to Transform Cancer Prevention, Prognosis, and Survivorship Care. Trends Cancer 2024, 10, 196–207.
- Patel, S.A.; Kondratov, R. V Clock at the Core of Cancer Development. 2021. [CrossRef]
- Schwartz, P.B.; Nukaya, M.; Berres, M.E.; Rubinstein, C.D.; Wu, G.; Hogenesch, J.B.; Bradfield, C.A.; Ronnekleiv-Kelly, S.M. The Circadian Clock Is Disrupted in Pancreatic Cancer. PLoS Genet 2023, 19. [CrossRef]
- Sharma, D.; Adnan, D.; Abdel-Reheem, M.K.; Anafi, R.C.; Leary, D.D.; Bishehsari, F. Circadian Transcriptome of Pancreatic Adenocarcinoma Unravels Chronotherapeutic Targets. 2024. [CrossRef]
- Hirota, T.; Lee, J.W.; St. John, P.C.; Sawa, M.; Iwaisako, K.; Noguchi, T.; Pongsawakul, P.Y.; Sonntag, T.; Welsh, D.K.; Brenner, D.A.; et al. Identification of Small Molecule Activators of Cryptochrome. Science (1979) 2012, 337, 1094–1097. [CrossRef]
- Dong, Z.; Zhang, G.; Qu, M.; Gimple, R.C.; Wu, Q.; Qiu, Z.; Prager, B.C.; Wang, X.; Kim, L.J.Y.; Morton, A.R.; et al. Targeting Glioblastoma Stem Cells through Disruption of the Circadian Clock. Cancer Discov 2019, 9, 1556–1573. [CrossRef]
- Chun, S.K.; Jang, J.; Chung, S.; Yun, H.; Kim, N.J.; Jung, J.W.; Son, G.H.; Suh, Y.G.; Kim, K. Identification and Validation of Cryptochrome Inhibitors That Modulate the Molecular Circadian Clock. ACS Chem Biol 2014, 9, 703–710. [CrossRef]
- Chun, S.K.; Chung, S.; Kim, H.D.; Lee, J.H.; Jang, J.; Kim, J.; Kim, D.; Son, G.H.; Oh, Y.J.; Suh, Y.G.; et al. A Synthetic Cryptochrome Inhibitor Induces Anti-Proliferative Effects and Increases Chemosensitivity in Human Breast Cancer Cells. Biochem Biophys Res Commun 2015, 467, 441–446. [CrossRef]
- Xia, K.; Li, S.; Yang, Y.; Shi, X.; Zhao, B.; Lv, L.; Xin, Z.; Kang, J.; Ren, P.; Wu, H. Cryptochrome 2 Acetylation Attenuates Its Antiproliferative Effect in Breast Cancer. Cell Death Dis 2023, 14. [CrossRef]
- Huber, A.L.; Papp, S.J.; Chan, A.B.; Henriksson, E.; Jordan, S.D.; Kriebs, A.; Nguyen, M.; Wallace, M.; Li, Z.; Metallo, C.M.; et al. CRY2 and FBXL3 Cooperatively Degrade C-MYC. Mol Cell 2016, 64, 774–789. [CrossRef]
- Fang, L.; Yang, Z.; Zhou, J.; Tung, J.Y.; Hsiao, C.D.; Wang, L.; Deng, Y.; Wang, P.; Wang, J.; Lee, M.H. Circadian Clock Gene CRY2 Degradation Is Involved in Chemoresistance of Colorectal Cancer. Mol Cancer Ther 2015, 14, 1476–1487. [CrossRef]
- Hoffman, A.E.; Zheng, T.; Ba, Y.; Stevens, R.G.; Yi, C.-H.; Leaderer, D.; Zhu, Y. Phenotypic Effects of the Circadian Gene Cryptochrome 2 on Cancer-Related Pathways. BMC Cancer 2010, 10, 110. [CrossRef]
- Miller, S.; Son, Y.L.; Aikawa, Y.; Makino, E.; Nagai, Y.; Srivastava, A.; Oshima, T.; Sugiyama, A.; Hara, A.; Abe, K.; et al. Isoform-Selective Regulation of Mammalian Cryptochromes. Nat Chem Biol 2020, 16, 676–685. [CrossRef]
- El-Deiry, W.S.; Tokino, T.; Velculescu, V.E.; Levy, D.B.; Parsons, R.; Trent, J.M.; Lin, D.; Edward Mercer, W.; Kinzler, K.W.; Vogelstein, B. WAF1, a Potential Mediator of P53 Tumor Suppression. Cell 1993, 75, 817–825.
- Rogakou, E.P.; Boon, C.; Redon, C.; Bonner, W.M. Megabase Chromatin Domains Involved in DNA Double-Strand Breaks In Vivo. J Cell Biol 1999, 146, 905–915.
- Rogakou, E.P.; Pilch, D.R.; Orr, A.H.; Ivanova, V.S.; Bonner, W.M. DNA Double-Stranded Breaks Induce Histone H2AX Phosphorylation on Serine 139. Journal of Biological Chemistry 1998, 273, 5858–5868. [CrossRef]
- Fernandez-Capetillo, O.; Lee, A.; Nussenzweig, M.; Nussenzweig, A. H2AX: The Histone Guardian of the Genome. DNA Repair (Amst) 2004, 3, 959–967. [CrossRef]
- Dong, H.; Qian, D.; Wang, Y.; Meng, L.; Chen, D.; Ji, X.; Feng, W. Survivin Expression and Serum Levels in Pancreatic Cancer. World J Surg Oncol 2015, 13. [CrossRef]
- Brown, M.; Zhang, W.; Yan, D.; Kenath, R.; Le, L.; Wang, H.; Delitto, D.; Ostrov, D.; Robertson, K.; Liu, C.; et al. The Role of Survivin in the Progression of Pancreatic Ductal Adenocarcinoma (PDAC) and a Novel Survivin-Targeted Therapeutic for PDAC. PLoS One 2020, 15. [CrossRef]
- Mizushima, N.; Levine, B.; Cuervo, A.M.; Klionsky, D.J. Autophagy Fights Disease through Cellular Self-Digestion. Nature 2008, 451, 1069–1075. [CrossRef]
- Mazure, N.M.; Pouysségur, J. Hypoxia-Induced Autophagy: Cell Death or Cell Survival? Curr Opin Cell Biol 2010, 22, 177–180. [CrossRef]
- Yang, S.; Wang, X.; Contino, G.; Liesa, M.; Sahin, E.; Ying, H.; Bause, A.; Li, Y.; Stomme, J.M.; Dell’Antonio, G.; et al. Pancreatic Cancers Require Autophagy for Tumor Growth. Genes Dev 2011, 25, 717–729. [CrossRef]
- Ye, H.; Chen, M.; Cao, F.; Huang, H.; Zhan, R.; Zheng, X. Chloroquine, an Autophagy Inhibitor, Potentiates the Radiosensitivity of Glioma Initiating Cells by Inhibiting Autophagy and Activating Apoptosis. BMC Neurol 2016, 16. [CrossRef]
- Fu, Z.; Cheng, X.; Kuang, J.; Feng, H.; Chen, L.; Liang, J.; Shen, X.; Yuen, S.; Peng, C.; Shen, B.; et al. CQ Sensitizes Human Pancreatic Cancer Cells to Gemcitabine through the Lysosomal Apoptotic Pathway via Reactive Oxygen Species. Mol Oncol 2018, 12, 529–544. [CrossRef]
- Miki, T.; Matsumoto, T.; Zhao, Z.; Lee, C.C. P53 Regulates Period2 Expression and the Circadian Clock. Nat Commun 2013, 4. [CrossRef]
- Gotoh, T.; Vila-Caballer, M.; Liu, J.; Schiffhauer, S.; Finkielstein, C. V. Association of the Circadian Factor Period 2 to P53 Influences P53’s Function in DNA-Damage Signaling. Mol Biol Cell 2015, 26, 359–372. [CrossRef]
- Molinari, M. Cell Cycle Checkpoints and Their Inactivation in Human Cancer. Cell Prolif 2000, 33, 261–274.
- Liu, J.; Peng, Y.; Wei, W. Cell Cycle on the Crossroad of Tumorigenesis and Cancer Therapy. Trends Cell Biol 2022, 32, 30–44.
- Harper, J.W.; Adami, G.R.; Wei, N.; Keyomarsi, K.; Elledge’, S.J. The P21 Cdk-Interacting Protein Cipl Is a Potent Inhibitor of Gl Cyclin-Dependent Kinases. Cell 1993, 75, 805–816.
- Sherr, C.J.; Roberts, J.M. CDK Inhibitors: Positive and Negative Regulators of G 1-Phase Progression. Genes Dev 1999, 13, 1501–1512.
- Besson, A.; Dowdy, S.F.; Roberts, J.M. CDK Inhibitors: Cell Cycle Regulators and Beyond. Dev Cell 2008, 14, 159–169. [CrossRef]
- Satoh, T.; Kaida, D. Upregulation of P27 Cyclin-Dependent Kinase Inhibitor and a C-Terminus Truncated Form of P27 Contributes to G1 Phase Arrest. Sci Rep 2016, 6. [CrossRef]
- Fry, D.W.; Harvey, P.J.; Keller, P.R.; Elliott, W.L.; Meade, M.; Trachet, E.; Albassam, M.; Zheng, X.; Leopold, W.R.; Pryer, N.K.; et al. Specific Inhibition of Cyclin-Dependent Kinase 4/6 by PD 0332991 and Associated Antitumor Activity in Human Tumor Xenografts. Mol Cancer Ther 2004, 3, 1427–1464.
- Herreros-Villanueva, M.; Bujanda, L.; Billadeau, D.D.; Zhang, J.S. Embryonic Stem Cell Factors and Pancreatic Cancer. World J Gastroenterol 2014, 20, 2247–2254. [CrossRef]
- Butera, G.; Brandi, J.; Cavallini, C.; Scarpa, A.; Lawlor, R.T.; Scupoli, M.T.; Marengo, E.; Cecconi, D.; Manfredi, M.; Donadelli, M. The Mutant P53-Driven Secretome Has Oncogenic Functions in Pancreatic Ductal Adenocarcinoma Cells. Biomolecules 2020, 10, 1–21. [CrossRef]
- Pan, M.; Jiang, C.; Zhang, Z.; Achacoso, N.; Alexeeff, ; Stacey; Solorzano, A. V; Tse, P.; Chung, E.; Tilak Sundaresan, ; Jennifer, ; et al. TP53 Gain-of-Function and Non-Gain-of-Function Mutations Are Associated With Differential Prognosis in Advanced Pancreatic Ductal Adenocarcinoma. JCO Precis Oncol 2023, 7, 2200570.
- Muller, P.A.J.; Vousden, K.H. P53 Mutations in Cancer. Nat Cell Biol 2013, 15, 2–8. [CrossRef]
- Brosh, R.; Rotter, V. When Mutants Gain New Powers: News from the Mutant P53 Field. Nat Rev Cancer 2009, 9, 701–713. [CrossRef]
- Freed-Pastor, W.A.; Prives, C. Mutant P53: One Name, Many Proteins. Genes Dev 2012, 26, 1268–1286. [CrossRef]
- Gartel, A.L.; Tyner, A.L. Transcriptional Regulation of the P21 (WAF1/CIP1) Gene. Exp Cell Res 1999, 246, 280–289. [CrossRef]
- Coqueret, O.; Gascan, H. Functional Interaction of STAT3 Transcription Factor with the Cell Cycle Inhibitor P21(WAF1/CIP1/SDI1). Journal of Biological Chemistry 2000, 275, 18794–18800. [CrossRef]
- Sulli, G.; Rommel, A.; Wang, X.; Kolar, M.J.; Puca, F.; Saghatelian, A.; Plikus, M. V.; Verma, I.M.; Panda, S. Pharmacological Activation of REV-ERBs Is Lethal in Cancer and Oncogene-Induced Senescence. Nature 2018, 553, 351–355. [CrossRef]
- Moreno-Smith, M.; Milazzo, G.; Tao, L.; Fekry, B.; Zhu, B.; Mohammad, M.A.; Di Giacomo, S.; Borkar, R.; Reddy, K.R.K.; Capasso, M.; et al. Restoration of the Molecular Clock Is Tumor Suppressive in Neuroblastoma. Nat Commun 2021, 12. [CrossRef]
- De Mei, C.; Ercolani, L.; Parodi, C.; Veronesi, M.; Vecchio, C. Lo; Bottegoni, G.; Torrente, E.; Scarpelli, R.; Marotta, R.; Ruffili, R.; et al. Dual Inhibition of REV-ERBβ and Autophagy as a Novel Pharmacological Approach to Induce Cytotoxicity in Cancer Cells. Oncogene 2015, 34, 2597–2608. [CrossRef]
- Wang, Y.; Solt, L.A.; Kojetin, D.J.; Burris, T.P. Regulation of P53 Stability and Apoptosis by a ROR Agonist. PLoS One 2012, 7. [CrossRef]
- Kojetin, D.; Wang, Y.; Kamenecka, T.M.; Burris, T.P. Identification of SR8278, a Synthetic Antagonist of the Nuclear Heme Receptor REV-ERB. ACS Chem Biol 2011, 6, 131–134. [CrossRef]
- Miller, S.; Aikawa, Y.; Sugiyama, A.; Nagai, Y.; Hara, A.; Oshima, T.; Amaike, K.; Kay, S.A.; Itami, K.; Hirota, T. An Isoform-Selective Modulator of Cryptochrome 1 Regulates Circadian Rhythms in Mammals. Cell Chem Biol 2020, 27, 1192-1198.e5. [CrossRef]
- Chan, A.B.; Lamia, K.A. Cancer, Hear My Battle CRY. J Pineal Res 2020, 69.
- Shafi, A.A.; McNair, C.M.; McCann, J.J.; Alshalalfa, M.; Shostak, A.; Severson, T.M.; Zhu, Y.; Bergman, A.; Gordon, N.; Mandigo, A.C.; et al. The Circadian Cryptochrome, CRY1, Is a pro-Tumorigenic Factor That Rhythmically Modulates DNA Repair. Nat Commun 2021, 12. [CrossRef]
- Jiang, W.; Zhao, S.; Jiang, X.; Zhang, E.; Hu, G.; Hu, B.; Zheng, P.; Xiao, J.; Lu, Z.; Lu, Y.; et al. The Circadian Clock Gene Bmal1 Acts as a Potential Anti-Oncogene in Pancreatic Cancer by Activating the P53 Tumor Suppressor Pathway. Cancer Lett 2016, 371, 314–325. [CrossRef]
- Stephenson, E.M.; Usselmann, L.E.J.; Tergaonkar, V.; Virshup, D.M.; Dallmann, R. Cancer Clocks in Tumourigenesis: The P53 Pathway and Beyond. Endocr Relat Cancer 2021, 28, R95–R110. [CrossRef]
- Ozturk, N.; Lee, J.H.; Gaddameedhi, S.; Sancar, A. Loss of Cryptochrome Reduces Cancer Risk in P53 Mutant Mice. 2009.
- Livak, K.J.; Schmittgen, T.D. Analysis of Relative Gene Expression Data Using Real-Time Quantitative PCR and the 2-ΔΔCT Method. Methods 2001, 25, 402–408. [CrossRef]
- Chen, C.; Okayama, H. High-Efficiency Transformation of Mammalian Cells by Plasmid DNA; 1987; Vol. 7.
Disclaimer/Publisher’s Note: The statements, opinions and data contained in all publications are solely those of the individual author(s) and contributor(s) and not of MDPI and/or the editor(s). MDPI and/or the editor(s) disclaim responsibility for any injury to people or property resulting from any ideas, methods, instructions or products referred to in the content. |
© 2024 by the authors. Licensee MDPI, Basel, Switzerland. This article is an open access article distributed under the terms and conditions of the Creative Commons Attribution (CC BY) license (http://creativecommons.org/licenses/by/4.0/).
Copyright: This open access article is published under a Creative Commons CC BY 4.0 license, which permit the free download, distribution, and reuse, provided that the author and preprint are cited in any reuse.


