1. Introduction
Environmental parameters and human behavior significantly influence the seasonality of acute respiratory viral infections (ARVIs). Research indicates that temperature and humidity affect the stability and transmission rates of respiratory viruses. Additionally, environmental factors impact the host’s immune responses—both congenital and adaptive—to viral infections in the respiratory tract. Other contributing factors include seasonal variations in absolute humidity; sunlight exposure; vitamin levels; and patterns of human interaction, which influence the contact rates between infected and susceptible individuals [
1]. Previous studies, particularly one on droplet size and influenza survival, indicate that higher temperatures and absolute humidity reduce the virus’s survival rate within an hour [
2,
3]. ARVIs are prevalent and can lead to significant morbidity and mortality, particularly in young children, the elderly, and immunocompromised adults [
4,
5,
6]. The most common viruses detected in ARVIs are influenza virus (INF), human rhinovirus (HRV), respiratory syncytial virus (RSV), human coronavirus (HCoV), and parainfluenza virus (PIV) [
7]. In recent years, the multiplex polymerase chain reaction (PCR) method has been developed to simultaneously detect all respiratory viruses responsible for infections using a single sample and test, complementing other microbiological diagnostic methods [
8]. PCR offers several advantages over traditional bacterial culture and direct fluorescence antibody (DFA) tests: it provides faster results, identifies sub-serotypes of certain viruses, detects viruses that cannot be cultured, and demonstrates higher sensitivity and specificity [
6,
9,
10,
11]. This study aimed to determine the frequency of viral agents identified through multiplex PCR in patients diagnosed with an ARVI at Edirne Sultan 1. Murat State Hospital from April 2023 to April 2024. It also sought to examine the relationship between the monthly average humidity and the incidence of viral factors in Edirne.
2. Materials and Methods
This study, conducted between April 1 2023 and 1 April 2024 examined adult patients (over 18 years old) who presented to the outpatient clinics and emergency department of Edirne Sultan 1. Murat State Hospital with flu symptoms, diagnosed according to the World Health Organization (WHO) (fever above 38 °C, weakness, rhinitis, headache and sore throat, cough, myalgia, etc.). Respiratory materials were obtained from patients with viral respiratory tract infections using multiplex PCR and sent to the routine microbiology laboratory of the hospital, and COVID-19, influenza A and B, and RSV results were retrospectively evaluated.
A total of 764 patients were evaluated, comprising 400 (52%) females and 364 (47%) males diagnosed with ARVIs. The correlation between viral PCR positivity and average daily relative humidity was examined, using data collected from the Edirne Meteorology Directorate covering April 1 2023 to April 1 2024.
This study received ethical approval from the Trakya University Faculty of Medicine Non-Interventional Scientific Research Ethics Committee under decision no. 09/26 on 06/05/2024.
2.1. Respiratory Tract Multiplex PCR
The respiratory samples (nasopharyngeal swabs) obtained from the patients with res-piratory infections were transported to the Medical Microbiology Laboratory under cold chain protocols using a viral transport medium (Tüseb, Diakit, Turkey). RNA isolation was performed with a Tüseb vNAT viral extraction kit (Diakit, Turkey). Quantitative PCR (qPCR) was conducted on the extracted samples using a Tüseb Diakit Multiplex -SARS-CoV-2/Influenza A&B/RSV RT-qPCR kit (Diakit, Turkey) on a Bio-Rad CFX 96 Real-Time Detection System. Each viral agent was classified as positive or negative based on the amplification curves and cycle threshold (Ct) values according to the kit’s in-structions.
2.2. Statistical Analysis
A statistical analysis was conducted using SPSS version 22. Continuous variables were expressed as mean±SD and categorial variables as n (%). Continuous variables in the study were compared with using t-test, categorial variables were compared with the chi-square test. A stepwise logistic regression analysis was performed for a multivariate logistic analysis of COVID-19. p-value of <0.05 was deemed significant.
3. Results
3.1. Virus Positivity
This study evaluated a total of 764 patient samples, consisting of 400 female samples (52%) and 364 male samples (47%), all of which were respiratory swabs. COVID-19 PCR positivity was detected in 142 patients (18.6%), with INF-A in 13 (3.7%), INF-B in 15 (4.2%), and RSV in 2 (0.6%). A gender-based analysis of COVID-19 positivity revealed that 70 females (17.5%) and 72 males (19.8%) tested positive. INF-A positivity was observed in 10 females (5.2%) and 3 males (1.9%), while INF-B positivity was observed in 11 females (5.7%) and 4 males (2.5%), and RSV positivity was detected in 1 female (0.5%) and 1 male (0.6%). No statistically significant difference was found between genders for the viruses studied (
Table 1).
In analyzing the relationship between PCR positivity and age within the viral panel, the 142 COVID-19-positive patients had a mean age of 42.0 ± 16.7. For the 13 INF-A-positive patients, the mean age was 40.5 ± 18.2, while the 15 INF-B-positive patients had a mean age of 43.3 ± 20.9. The mean age for the two RSV-positive patients was 61.0 ± 38.2. No significant relationship was found between virus positivity and age (p > 0.05).
The laboratory findings revealed leukopenia, leukocytosis, lymphopenia, lymphocytosis, and elevated C-reactive protein (CRP) levels. Among the 764 patients, leukopenia was present in 14 (1.8%), leukocytosis in 95 (12.4%), lymphopenia in 56 (7.3%), and lymphocytosis in 1 (0.1%). Elevated CRP levels were observed in 72 patients (9.4%). No significant relationship was found between COVID-19 positivity and CRP levels, although lower leukocyte (p > 0.05) and lymphocyte counts (p > 0.05) were noted (
Table 2).
Of the patients, 73 (9.6%) developed pneumonia, with 38 receiving treatment and 11 (1.4%) requiring intensive care. Among the hospitalized patients, 6 tested positive for COVID-19, and 1 tested positive for RSV. Additionally, 16 patients (2.1%) received oseltamivir, while 119 (15.6%) were treated with antibiotics. There were six patient deaths (0.8%), including one COVID-19-positive individual. Pneumonia, treatment, and death rates are detailed in
Table 3.
3.1.1. Seasonal Impact
Regarding seasonal effects, patient presentation dates revealed a total of 764 hospital visits: 240 (31.4%) in autumn, 239 (31.3%) in winter, 231 (30.2%) in spring, and 54 (7.1%) in summer. Statistically, autumn, winter, and spring had similar application numbers, with no significant differences, while summer showed a significant decrease, dropping by more than fourfold. An analysis of viral PCR positivity indicated that 70 of the 142 COVID-19 patients were positive in autumn (49%; September 19%, October 25%, and November 7%); 32 in winter (22%; December 6%, January 11%, and February 5%); and 35 (24%) in spring (3%; July 1% and August 2%). A statistical relationship was found between the rise in COVID-19 cases and the autumn season (p < 0.05).
Regarding INF-A, 13 positive patients were recorded: 5 in autumn (38%; September 30% and October 8%), 0 in winter, 7 in spring (53%; March 7% and April 46%), and 1 in summer (7%; June). The increase in INF-A cases during autumn and spring was statistically significant (p<0.05). Regarding INF-B, 15 positive patients were recorded: 7 in autumn and spring (53%; March 7% and April 46%); 0 in winter; and, like INF-A, 1 in summer (7%). PCR positivity was also statistically significant in autumn and spring (p<0.05). Regarding RSV, two positive patients were recorded, both in winter (December and January); however, due to the small sample size, a statistical analysis was not conducted (
Table 3).
To examine the relationship between the average relative humidity and viral PCR positivity, daily humidity data were averaged over 14 days for COVID-19, 3 days for INF-A and INF-B, and 4 days for RSV, focusing on the dates when patients tested positive for one or two viruses. COVID-19 positivity was higher at normal humidity (54%, 2 positives among 77 patients) than at high humidity (45.8%, 65 patients). Regarding INF-A, 5 patients (38.5%) tested positive at normal humidity, while 8 (61.5%) tested positive at high humidity. Regarding INF-B, 7 patients (46.7%) tested positive at normal humidity, while 8 (53.3%) tested positive at high humidity. These results were not statistically significant (p>0.05,
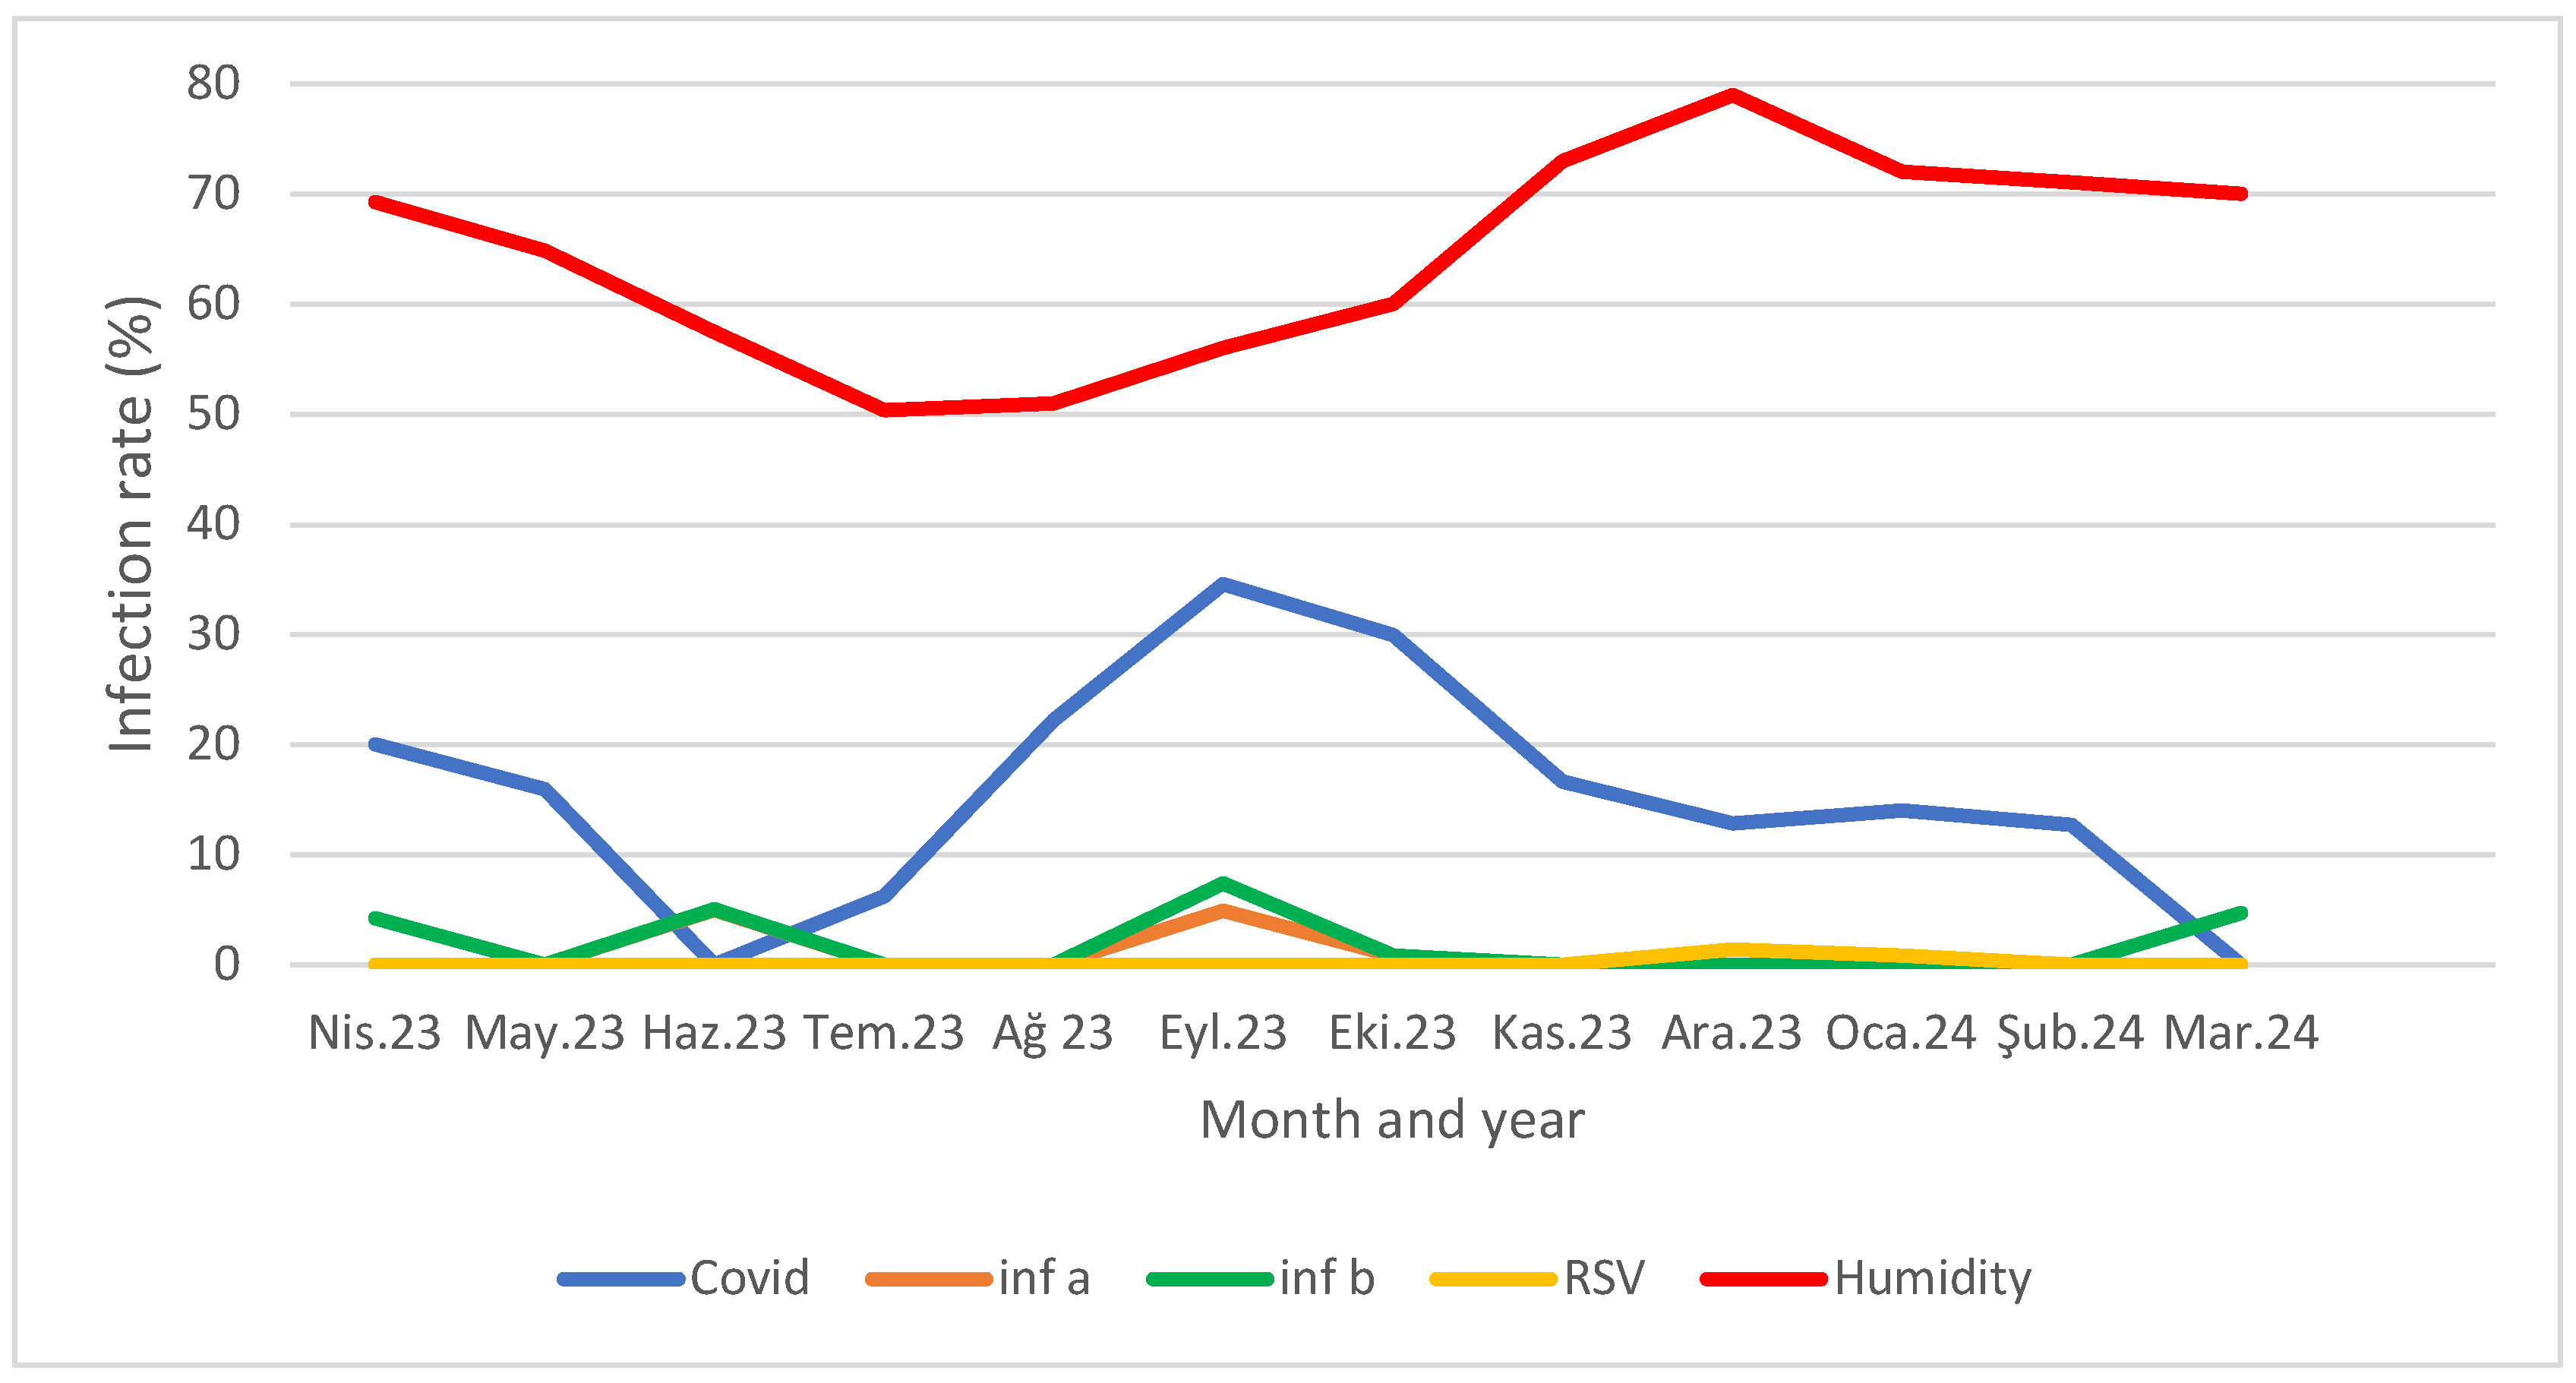
Table 3). When comparing viral PCR positivity rates with the monthly average humidity, a higher humidity correlated with fewer cases, particularly for COVID-19 and Inf B, while a lower average humidity coincided with peak cases (p<0.05 for COVID-19 and Inf-B) (Figure 1).
Figure 1.
Distribution of viral PCR positivity rates according to months and monthly average humidity.
Figure 1.
Distribution of viral PCR positivity rates according to months and monthly average humidity.
Disease positivity was taken as the dependent variable, and age, gender, and humidity level were taken as independent variables. In the analysis performed with the stepwise logistic regression model, it was found that a high humidity level was protective against COVID-19 (OR: 0.356; Cl 95%: 0.245-0.518) (
Table 4).
1. Discussion
Respiratory infections exhibit cyclical patterns every one to two years, indicating that their seasonal distribution is influenced by population sensitivity and environmental factors affecting virus survival, transmission, and behavior, which fluctuate throughout the year [
2]. Recent studies have proposed three mechanisms to explain the seasonality of epidemic respiratory viruses in humans (Moriyama et al., 2020): (i) virus stability and transmissibility under varying environmental conditions, particularly humidity and temperature; (ii) human behavior, including indoor/outdoor activities, crowding, and holiday travel; and (iii) the effect of changing environmental conditions on host defense mechanisms. The relative contributions of these factors to respiratory virus seasonality remain unclear [
12]. Due to the challenge of developing lasting immunity after respiratory infections, populations often remain susceptible, leading to intensified transmission in densely populated areas and resulting in epidemics. The timing of the flu season, typically from October to February or March, varies each year. From an epidemiological perspective, the WHO and European countries monitor these viruses. Data from the European Respiratory Viruses Surveillance Summary (ERVISS) are analyzed by selecting the four weeks with the highest number of reported cases, and the average and standard deviation are calculated.
Our study analyzed the data obtained from Edirne Sultan 1. Murat State Hospital and compared them with data from a second-level healthcare provider in ERVISS.
The results indicate that, for COVID-19, the average positivity rate is 19% (SD: 0.96) over four weeks, rising to 36% (SD: 0.96) in the first week and dropping to 35% (SD: 0.57) in the subsequent four weeks. ERVISS reports similar results for first-level health service providers at 21% [
13].
Influenza A and B were assessed together, showing an average positivity rate of 30% (SD: 3.37) for the fourth week of 2024 and 43% (SD: 2.06) across the following four weeks. According to the WHO data, RSV rates peak at week 48, with a 4-week average of 18% (SD: 0.72) from this week, while our results show only 1% (SD: 0.15) for the same period (excluding children).
Our COVID-19 and influenza A/B positivity rates are approximately 1.8 and 1.4 times higher than in European countries, respectively. Factors contributing to this include a lack of respiratory virus surveillance in healthcare institutions and insufficient differentiation among primary healthcare providers for upper respiratory infections. RSV rates are reported to be 18 times higher in European countries, although, in Turkey, RSV is noted as the most common upper respiratory agent in children [
14]. Since children were excluded from our study, our RSV rates appear lower in comparison. Furthermore, while ERVISS aggregates diagnostic results from European nations, the specific diagnostic methods are not detailed. Nonetheless, multiplex PCR is the most widely used respiratory virus panel globally [
15].
The evaluated viral panel showed no significant differences in age or gender among patients. While RSV and influenza virus infections were noted in children in previous studies, our focus on adults revealed no differences in gender or virus incidence [
16].
Research on the seasonal distribution of respiratory virus infections has expanded. Over the years, different virus panels have dominated during seasonal shifts. A 24-year retrospective study examining the impact of climate change on virus positivity found that RSV and Influenza viruses predominantly occur from November to April, with negligible activity in the summer [
17,
18].
Our study shows a 43% increase in influenza virus applications compared with in April. The total number of viruses in our region decreased in winter, resulting in infrequent influenza cases during that season. Consistent with the existing literature, only one positive case was reported in June during the summer months. In the case of Inf-B, positivity rates decline with rising humidity, but the low positivity rate in our study makes it challenging to link this directly to moisture levels. Research on the effects of relative and absolute humidity on virus transmission indicates that the mechanisms connecting vapor pressure (VP) and influenza virus survival time (IVS) are similar to those associated with relative humidity. These include (1) a heightened production of virus-laden droplet nuclei under low-VP conditions and (2) increased IVS in low-VP environments [
19,
20]. Even in the controlled environment of an animal shelter (22.2°C, 50% humidity, and a regulated light/dark cycle), the transmission rate of influenza virus was observed to be higher in winter (November-April, 58.2%) than in summer, despite using the same viral load in experiments [
1].
A study conducted across 21 countries revealed that the seasonal patterns of coronaviruses resemble those of influenza and RSV in temperate regions. Heat maps indicate that most cases in the northern hemisphere occur between December and March, while in the southern hemisphere, they peak from July to September. The human coronavirus 229E was found to survive the longest in stabilized aerosols at 4 °C, with relative humidity levels of 30%, 50%, or 80% having minimal impact. It survives better in 80% humidity at 30 °C and in 50% humidity at 20 °C. Our study noted that, during the peak COVID-19 period, when relative humidity was between 50 and 55%, it reached 80% in December to February, coinciding with a decline in cases to 10% or lower. Furthermore, an analysis of the human coronavirus in relation to environmental factors indicated that relative humidity, along with UV radiation and heat, significantly influences virus survival [
2].
2. Conclusions
In our study, we found that respiratory virus positivity in Edirne over one year does not vary by demographic characteristics. Additionally, corona, influenza, and RSV viruses are more prevalent in certain months, and a high relative humidity may provide protection against corona and RSV infections, aligning with the existing literature. Further research on virus transmissibility and the impact of humidity and environmental factors is needed. Our findings indicate that effective vaccination is significant to protection of seasonal viruses reduces mortality and morbidity from influenza and COVID-19, even when the patient’s vaccination status is unknown.
Limitations
Our study faced a restriction due to insufficient data on the specific criteria for requiring only the COVID-19 test and the four-virus panel test (COVID-19, influenza A/B, and RSV) for patients presenting flu symptoms at the clinic. The clinician’s judgment influenced this choice, preventing standardization. Furthermore, the absence of data regarding patients’ chronic illnesses obscured the determination of the relationship between hospitalization, death in intensive care, and viral infections.
Author Contributions
“Conceptualization, Sebnem Bukavaz; methodology, Sebnem Bukavaz, Kultural Gungor and Merve Kole; validation, Sebnem Bukavaz, Galip Ekuklu; formal analysis, Galip Ekuklu.; investigation, Merve Kole; data curation, Sebnem Bukavaz and Kultural Gungor; writing—Sebnem Bukavaz, writing—review and editing, Kultural Gungor, Galip Ekuklu. All authors have read and agreed to the published version of the manuscript.
Funding
“This research received no external funding”
Institutional Review Board Statement
“The study was conducted in accordance with the Declaration of Helsinki, and approved by Trakya University Faculty of Medicine Non-Interventional Scientific Research Ethics Committee under decision no. 09/26 on 06/05/2024.
Informed Consent Statement
“Not applicable.”
Data Availability Statement
All data generated or analyzed during this study are included in this article.
Acknowledgments
We would like to thank Infectious Diseases specialist Dr. Alper Eker and the Clinic and Emergency doctors of Edirne 1st Sultan Murat State Hospital.
Conflicts of Interest
“The authors declare no conflicts of interest.””.
References
- Moriyama M, Hugentobler WJ, Iwasaki A. Seasonality of Respiratory Viral Infections. Annu Rev Virol. 2020;7(1):83-101. [CrossRef]
- Nichols GL, Gillingham EL, Macintyre HL, et al. Coronavirus seasonality, respiratory infections and weather. BMC Infect Dis. 2021;21(1):1101. Published 2021 Oct 26. [CrossRef]
- Marr LC, Tang JW, Van Mullekom J, Lakdawala SS. Mechanistic insights into the effect of humidity on airborne influenza virus survival, transmission and incidence. J R Soc Interface. 2019;16(150):20180298. [CrossRef]
- Tregoning JS, Schwarze J. Respiratory viral infections in infants: causes, clinical symptoms, virology, and immunology. Clin Microbiol Rev. 2010;23(1):74-98. [CrossRef]
- Hall MJ, DeFrances CJ, Williams SN, Golosinskiy A, Schwartzman A. National Hospital Discharge Survey: 2007 summary. Natl Health Stat Report. 2010;(29):1-24. [CrossRef]
- Arslan A, Çiçek C, Saz EU, et al. Viral Solunum Yolu Enfeksiyonlarının Tanısında Bir Multipleks PCR Yönteminin Performansının Değerlendirilmesi [Evaluation of the Performance of a Multiplex PCR Method for the Diagnosis of Viral Respiratory Tract Infections]: 2016; 46(4):159-64. [CrossRef]
- Tsukagoshi H, Ishioka T, Noda M, Kozawa K, Kimura H. Molecular epidemiology of respiratory viruses in virus-induced asthma. Front Microbiol. 2013;4:278. Published 2013 Sep 12. [CrossRef]
- Vallières E, Renaud C. Clinical and economical impact of multiplex respiratory virus assays. Diagn Microbiol Infect Dis.2013;76(3):255-261. [CrossRef]
- Çiçek C, Arslan A, Karakuş HS, et al. Akut solunum yolu enfeksiyonu olan hastalarda solunum viruslarının prevalansı ve mevsimsel dağılımı, 2002-2014 [Prevalence and seasonal distribution of respiratory viruses in patients with acute respiratory tract infections, 2002-2014]. Mikrobiyol Bul. 2015;49(2):188-200. [CrossRef]
- Alcaide ML, Bisno AL. Pharyngitis and epiglottitis [published correction appears in Infect Dis Clin North Am. 2007 Sep;21(3):847-8]. Infect Dis Clin North Am. 2007;21(2):449-vii. [CrossRef]
- Appak Ö, Duman M, Belet N, Sayiner AA. Viral respiratory infections diagnosed by multiplex polymerase chain reaction in pediatric patients. J Med Virol. 2019;91(5):731-737. [CrossRef]
- Neumann G, Kawaoka Y. Seasonality of influenza and other respiratory viruses. EMBO Mol Med. 2022;14(4):e15352. [CrossRef]
- Operational considerations for respiratory virus surveillance in Europe. Available from: (https://www.ecdc.europa.eu/sites/default/files/documents/Operational-considerations-respiratory-virus-surveillance-euro-2022.pdf).
- Ciçek C, Bayram N, Anıl M, et al. Solunum virusları ve influenza A virus alt tiplerinin multipleks PCR yöntemi ile aynı anda saptanması [Simultaneous detection of respiratory viruses and influenza A virus subtypes using multiplex PCR]. Mikrobiyol Bul. 2014;48(4):652-660. [CrossRef]
- Lu S, Lin S, Zhang H, Liang L, Shen S. Methods of Respiratory Virus Detection: Advances towards Point-of-Care for Early Intervention. Micromachines (Basel). 2021;12(6):697. Published 2021 Jun 15. [CrossRef]
- Buchan SA, Hottes TS, Rosella LC, Crowcroft NS, Tran D, Kwong JC. Contribution of influenza viruses to medically attended acute respiratory illnesses in children in high-income countries: a meta-analysis. Influenza Other Respir Viruses. 2016;10(6):444-454. [CrossRef]
- Goka E, Vallely P, Mutton K, Klapper P. Influenza A viruses dual and multiple infections with other respiratory viruses and risk of hospitalisation and mortality. Influenza Other Respir Viruses. 2013;7(6):1079-1087. [CrossRef]
- García-Arroyo L, Prim N, Del Cuerpo M, et al. Prevalence and seasonality of viral respiratory infections in a temperate climate region: A 24-year study (1997-2020). Influenza Other Respir Viruses. 2022;16(4):756-766. [CrossRef]
- Lowen AC, Steel J. Roles of humidity and temperature in shaping influenza seasonality. J Virol. 2014;88(14):7692-7695. [CrossRef]
- Shaman J, Kohn M. Absolute humidity modulates influenza survival, transmission, and seasonality. Proc Natl Acad Sci U S A. 2009;106(9):3243-3248. [CrossRef]
Table 1.
Respiratory Viruses Detected in Patients.
Table 1.
Respiratory Viruses Detected in Patients.
| Viruses |
Female (n=400)
n (%) |
Male (n=364)
n (%) |
Total (n=764)
n (%) |
Covid-19
INF-A
INF-B
RSV |
70 (%17.5)
10 (%5.2)
11 (%5.7)
1 (%0.5) |
72 (%19.8)
3 (1.9)
4 (%2.5)
1 (%0.6) |
142 (%18.6)
13 (%3.7)
15 (%4.2)
2 (%0.6) |
Table 2.
Clinical and Laboratory Findings.
Table 2.
Clinical and Laboratory Findings.
| Lab. Find. |
Leucopenia |
Leukocytosis |
Lymphopenia |
Lymphocytosis |
CRP Elevation |
| n=764 n(%) |
14 (%1.8) |
95 (%12.4) |
56 (%7.3) |
1 (%0.1) |
72 (%94) |
| Cln. Find. |
Pneumonia |
Treatment
Oseltamivir Antibiotic
|
Hospitalization in intensive care Unit |
Death |
| n=764 n(%) |
73 (%9.6) |
16 (2.1) 119 (%15.6) |
11 (%1.4) |
6 (%0.8) |
Table 3.
Distribution of viral PCR positivity according to months and humidity rates.
Table 3.
Distribution of viral PCR positivity according to months and humidity rates.
| Months |
Number of samples |
Humidity Levels
% |
Covid-19 |
Inf-A |
Inf-B |
RSV |
| April 2023 |
140 |
69.3 |
28 (%20) |
6 (%43) |
6 (%43) |
- |
| May 2023 |
44 |
64.9 |
7 (%16) |
- |
- |
- |
| June 2023 |
20 |
57.5 |
- |
1 (%5) |
1 (%5) |
- |
| July 2023 |
16 |
50,4 |
1 (%6) |
- |
- |
- |
| August 2023 |
18 |
51 |
4 (%22) |
- |
- |
- |
| September 2023 |
81 |
56 |
28 (%35) |
4 (%5) |
6 ( %7) |
- |
| October 2023 |
117 |
60 |
35 (%30) |
1 (%0.9) |
1 (%0.9) |
- |
| November 2023 |
42 |
73 |
7 (%17) |
- |
- |
- |
| December 2023 |
70 |
79 |
9 (%13) |
- |
- |
1 (%1,4) |
| January 2024 |
114 |
72 |
16 (%14) |
- |
- |
1 (% 0.9) |
| February 2024 |
55 |
71 |
7 (% 13) |
- |
- |
- |
| March 2024 |
47 |
70 |
- |
1 |
1 |
- |
Table 4.
Multivariate logistic regression analysis of variables associated with Covid positivity.
Table 4.
Multivariate logistic regression analysis of variables associated with Covid positivity.
| |
B |
S.E. |
Sig. |
Exp(B) |
95% C.I.for EXP(B) |
| Step 1a |
Lower |
Upper |
| Age |
,007 |
,006 |
,186 |
1,007 |
,996 |
1,018 |
| Gender Men |
-,085 |
,191 |
,657 |
,919 |
,632 |
1,335 |
| High humidity |
-1,032 |
,191 |
,000 |
,356 |
,245 |
,518 |
| Constant |
1,630 |
,284 |
,000 |
5,102 |
|
|
|
Disclaimer/Publisher’s Note: The statements, opinions and data contained in all publications are solely those of the individual author(s) and contributor(s) and not of MDPI and/or the editor(s). MDPI and/or the editor(s) disclaim responsibility for any injury to people or property resulting from any ideas, methods, instructions or products referred to in the content. |
© 2024 by the authors. Licensee MDPI, Basel, Switzerland. This article is an open access article distributed under the terms and conditions of the Creative Commons Attribution (CC BY) license (http://creativecommons.org/licenses/by/4.0/).