
Submitted:
03 December 2024
Posted:
04 December 2024
You are already at the latest version
Abstract
Background: Pancreatic ductal adenocarcinoma (PDAC) remains one of the most lethal malignancies, largely due to its dense fibrotic stroma that promotes drug resistance and tumor progression. While patient-derived organoids (PDOs) have emerged as promising tools for modeling PDAC and evaluating therapeutic responses, current PDO models grown in soft matrices fail to replicate the tumor's stiff extracellular matrix (ECM), limiting their predictive value for advanced disease.Methods: We developed a biomimetic model using gelatin-based matrices of varying stiffness, achieved through modulated transglutaminase crosslinking rates, to better simulate the desmoplastic PDAC microenvironment. Using this platform, we investigated organoid morphology, proliferation, and chemoresistance to gemcitabine (Gem) and its lipophilic derivative, 4-N-stearoyl gemcitabine (Gem-S). Mechanistic studies focused on the interplay between ECM stiffness, hypoxia-inducible factor (HIF) expression, and the nuclear factor erythroid 2-related factor 2 (Nrf2) pathway in drug resistance.Results: PDAC organoids in stiffer matrices demonstrated enhanced stemness features, including rounded morphology and elevated cancer stem cell (CSC) marker expression. Matrix stiffness-induced gemcitabine resistance correlated with upregulation of ABC transporters and oxidative stress adaptive responses. While gemcitabine activated Nrf2 expression, promoting oxidative stress mitigation, Gem-S suppressed Nrf2 levels and induced oxidative stress, leading to increased reactive oxygen species (ROS) and enhanced cell death. Both compounds reduced HIF expression, with gemcitabine showing greater efficacy.Conclusions: Our study reveals ECM stiffness as a critical mediator of PDAC chemoresistance through promotion of stemness and modulation of Nrf2 and HIF pathways. Gem-S demonstrates promise in overcoming gemcitabine resistance by disrupting Nrf2-mediated adaptive responses and inducing oxidative stress. These findings underscore the importance of biomechanically accurate tumor models and suggest that dual targeting of mechanical and oxidative stress pathways may improve PDAC treatment outcomes.
Keywords:
PDAC
; patient-derived organoids
; matrix stiffness
; drug resistance
; stearoyl-gemcitabine
; oxidative stress
Introduction
Pancreatic ductal adenocarcinoma (PDAC) remains one of the most lethal malignancies, with a dismal five-year survival rate below 11% [1,2]. This poor prognosis stems largely from late-stage diagnosis, aggressive metastasis, and limited therapeutic efficacy [3]. A defining hallmark of PDAC is its dense fibrotic stroma, orchestrated by pancreatic stellate cells (PSCs), which creates a complex and protective tumor microenvironment (TME) [4,5].
While gemcitabine has served as the cornerstone of PDAC chemotherapy for decades, intrinsic and acquired resistance severely limits its clinical impact [6]. Traditional explanations for treatment failure have focused on the physical barrier theory, where dense extracellular matrix (ECM) components impede drug penetration and elevated interstitial pressure restricts drug delivery [7,8]. However, emerging evidence suggests a more nuanced role of the stroma in therapeutic resistance [9,10].
Research has identified several molecular pathways involved in resistance, including altered drug transporter expression, metabolic reprogramming, and enhanced DNA repair mechanisms. Additionally, the dynamic tumor microenvironment (TME) plays a critical role in conferring drug resistance [11].
Recent studies reveal that stromal mechanics actively reprogram cancer cell behavior beyond simple drug obstruction [10,12]. The dense ECM environment triggers mechanotransduction pathways that enhance invasiveness, alter metabolism, and promote survival signaling [13,14]. Furthermore, the stroma establishes an immunosuppressive niche through modified ECM composition and cytokine profiles, facilitating tumor immune evasion [11,15,16,17]. These biomechanical and biochemical interactions can induce drug resistance by activating survival pathways and upregulating drug efflux mechanisms [18,19,20,21,22].
Patient-derived organoids (PDOs) have emerged as promising tools for studying these complex tumor-stroma interactions [10,23,24]. However, conventional PDO models often fail to recapitulate the mechanical properties of the dense PDAC stroma, limiting their predictive value [24,25]. To address this gap, we developed a biomimetic platform using transglutaminase-crosslinked collagen matrices with tunable density and stiffness [26,27]. This approach is particularly relevant as transglutaminase 2 (TG2) overexpression in PDAC correlates with increased ECM stiffness, invasiveness, and chemoresistance [28,29].
In this study, we leverage this mechanically-tunable organoid platform to investigate how matrix stiffness influences the efficacy of gemcitabine and its lipophilic derivative, 4-N-stearoyl gemcitabine (Gem-S). By examining the interplay between mechanical forces, drug response, and resistance mechanisms, we aim to inform both drug design and therapeutic strategies for PDAC treatment.
Methods
Materials and Matrix Development
Gelatin-based matrices were prepared using Type A 300 Bloom gelatin (Sigma Aldrich) at concentrations of 3%, 6%, and 9%. Microbial transglutaminase (Tg) from Streptomyces mobaraense (Ajinomoto, Tokyo) was purified using SP Sepharose Fast Flow beads. Tg activity was quantified via o-phthaldialdehyde (OPA) assay with casein substrate, and protein concentration was determined using the Bradford method. Gemcitabine (Gem) was obtained from AK Scientific, while Gem-stearyl was synthesized according to previously established protocols [30]. All compounds were prepared as 10 mmol/L DMSO stock solutions for in vitro studies.
Matrix Characterization
Matrix mechanical properties were characterized using a novel non-contact ultrasound technique [31]. Three ultrasound transducers positioned 5 mm above the matrix surface measured rheological properties. A high-power ultrasonic transducer (440 kPa shear stress) with oblique angle provided mechanical input, while reflected acoustic energy was captured by secondary transducers. Deformation was measured with 1 µm spatial resolution, enabling precise stress-strain characterization over time.
Patient-Derived Cell Culture
Seven patient-derived PDAC cell lines were established from surgical specimens (University of Florida, IRB protocol 201600873). Cells were maintained in high-glucose DMEM supplemented with 10% FBS and 1% penicillin-streptomycin at 37°C, 5% CO2 [32]. Mycoplasma testing was performed regularly using MycoAlert Detection Kit (catalog No. LT07–318, Lonza).
3D Organoid Culture and Drug Treatment
Organoids were generated by embedding PDAC cells at a concentration of 2 × 10⁶ cells/mL in gelatin-Tg matrices. Cell suspensions were mixed with sterile gelatin solution (6% Type A and 6% Type B) and purified Tg. Twenty microliters of cell-matrix mixture were cast per well in 48-well suspension plates and allowed to solidify at 37°C for 45 minutes before adding 500 μL culture medium. Organoids were cultured for 7 days prior to drug treatment, with medium changes every 3 days.
Cell Viability and Proliferation Analysis
Cell viability was assessed using multiple complementary methods. For 2D cultures, viability was determined using MTT assay, with absorbance measured at 560 nm. In 3D cultures, viability was evaluated using both CellTiter-Glo®3D assay and CCK-8 assay (450 nm). Additionally, cellular viability was visualized using LIVE/DEAD Viability/Cytotoxicity Kit (Thermo Fisher Scientific) following manufacturer’s protocol. For proliferation assessment, cells were counted directly in 2D cultures, while 3D cultures required initial collagenase digestion (20 units Type II collagenase, 4 hours) to release cells prior to counting. All measurements were performed in triplicate and normalized to appropriate controls.
Drug Response Studies
Dose-response experiments utilized 7-point dilution series (10-2 to 10-8 M or 10-4 to 10-10 M) in both 2D and 3D formats. For 3D studies, organoids were established for 6 days before drug exposure for 3 or 6 days. Results were normalized to vehicle controls.
Immunofluorescence Analysis
Fixed organoids were analyzed for expression of E-cadherin, Ki67, HIF, and Vimentin. Samples were processed using standard immunofluorescence protocols with FITC-conjugated secondary antibodies and DAPI nuclear counterstain. F-actin staining visualized cytoskeletal organization.
Transcriptional Analysis
Total RNA was extracted from different culture conditions using RNeasy Mini Kit (Qiagen, CA). RNA sequencing libraries were prepared using the SMART-Seq Stranded kit (Takara, Japan) and sequenced on the Illumina NovaSeq 6000 platform with 100 bp paired-end reads, achieving >20 million reads per sample. Raw sequencing data underwent quality control and processing through a systematic bioinformatics pipeline. Initial adapter sequences were removed using Trim Galore!, followed by alignment of trimmed reads to the GRCh38 reference genome using STAR (version 2.7.10a). Gene-level quantification was performed using RSEM (version 1.3.1), and the resulting count data were normalized using TMM normalization in edgeR. Differential expression analysis was conducted using the edgeR package in R. For validation of key genes, RT-qPCR was performed using iTaq™ Universal SYBR® Green system (Bio-Rad, CA) with ACTB serving as the internal control. All samples passed quality control based on the manufacturer’s standards, and expression changes were calculated relative to control conditions. Primers used in the study are listed in the following table.
| ABCC1 F | CCGTGTACTCCAACGCTGACAT |
| ABCC1 R | ATGCTGTGCGTGACCAAGATCC |
| ABCC2 F | GCCAACTTGTGGCTGTGATAGG |
| ABCC2 R | ATCCAGGACTGCTGTGGGACAT |
| NRF-2 F | AAATTGAGATTGATGGAACAGAGAA |
| NRF-2 R | TATGGCCTGGCTTACACATTCA |
| HIF 1 F | TATGAGCCAGAAGAACTTTTAGGC |
| HIF 1 R | CACCTCTTTTGGCAAGCATCCTG |
| PTK 2 F | GCCTTATGACGAAATGCTGGGC |
| PTK 2 R | CCTGTCTTCTGGACTCCATCCT |
| CD44 F | CCAATGCCTTTGATGGACCA |
| CD44 R | TGTGAGTGTCCATCTGATTC |
Statistical Analysis
Group comparisons were performed using ANOVA with Tukey’s post-hoc test or two-sided unpaired Student’s t-test as appropriate. Significance was set at p<0.05.
Results
Distinct Matrix Mechanics Dictate PDAC Organoid Architecture and Growth
We developed two distinct viscoelastic matrices using 6% gelatin with differential transglutaminase crosslinking rates, achieved through acidic (6A) versus alkaline (6B) processing. Creep experiments under 440kPa stress revealed distinct mechanical signatures: the highly crosslinked 6A matrix exhibited minimal deformation (6-8 µm) with rapid recovery (20 sec), while the less crosslinked 6B matrix showed greater deformation (12-15 µm) and slower recovery (40 sec) (Figure 1A). This approach enabled us to study cellular responses across different mechanical environments while maintaining consistent matrix composition.
Within these defined matrices, seven patient-derived PDAC cell lines successfully formed organoids within both matrices over 6-8 days, displaying patient-specific morphological characteristics. The organoids exhibited diverse architectures ranging from compact spheroids to loose cell clusters, reflecting inherent biological heterogeneity (Figure 1B). Quantitative analysis revealed that matrix mechanics significantly influenced organoid size: cells consistently formed larger structures in the softer 6B matrix compared to the stiffer 6A matrix (59.69 µm vs 45.49 µm, p<0.01) (Figure 1C).
Matrix stiffness profoundly impacted cellular proliferation rates, with growth kinetics analysis revealing distinct patterns across culture conditions. Cells in 2D monolayer showed the fastest growth with a doubling time of approximately 64.4 hours, while those in 3D soft matrix (6B) exhibited intermediate growth rates with doubling times around 115.2 hours. The slowest proliferation was observed in the stiff 3D matrix (6A), where doubling times extended to approximately 152.2 hours. This progressive slowdown in proliferation from 2D to soft 3D to stiff 3D environments suggests that increasing matrix resistance creates a more restrictive growth environment, better reflecting the challenges faced by tumor cells in vivo (Figure 1D).
Matrix Mechanics Drive Distinct Transcriptional Programs in PDAC Organoids
To elucidate how matrix mechanics influence cellular phenotype, we performed comprehensive transcriptional profiling of three patient-derived organoid lines (G43, VG59, and LM-1) across different culture conditions. Multidimensional scaling (MDS) analysis of the top 1,000 most variable genes revealed distinct transcriptional signatures that segregated based on culture conditions (2D, soft matrix 6B, and stiff matrix 6A) (Figure 2A). This clear separation suggests that both three-dimensionality and matrix stiffness fundamentally reshape gene expression programs.
Differential expression analysis highlighted substantial transcriptional reprogramming between culture conditions. Mean difference plots revealed widespread gene expression changes, with numerous genes showing greater than two-fold changes (red: upregulated, FC > 2; blue: downregulated, FC < -2) in 3D cultures compared to conventional 2D culture (Figure 2B). This global shift in gene expression patterns suggests that the mechanical microenvironment profoundly influences cellular state beyond simple morphological adaptations.
Matrix Mechanics Modulate Drug Sensitivity and Survival Pathways in PDAC Organoids
We systematically evaluated how matrix mechanics influence chemoresistance using established PDAC organoids in matrices of distinct stiffness (Figure 3A). Initial studies with G43-derived organoids revealed substantially reduced gemcitabine (Gem) sensitivity in 3D cultures compared to 2D monolayers, with further resistance developing in stiffer matrices (Figure 3B). Quantitative analysis of IC50 values demonstrated that organoids required 4-12 fold higher drug concentrations for equivalent growth inhibition compared to monolayer cultures, though the magnitude varied among patient samples. Live/dead staining confirmed these findings, showing significantly reduced apoptosis in 3D cultures compared to 2D conditions at 1µM Gem (Figure 3C).
Immunofluorescence analysis revealed matrix stiffness-dependent alterations in key cellular markers. Stiffer matrices induced higher HIF-1α expression, reduced Ki67 positivity (particularly in organoid cores), and enhanced vimentin expression, suggesting activation of survival pathways and EMT-like phenotypes (Figure 3D).
Mechanistic investigation through transcriptional profiling revealed several stiffness-regulated pathways contributing to chemoresistance. Analysis of stemness markers showed enhanced CD44 expression specifically in stiff matrices, while PTK2 expression increased in both 3D conditions, suggesting matrix-dependent regulation of stem cell-like properties (Figure 3E–F). The drug efflux machinery also showed significant adaptation, with elevated expression of multidrug transporters ABCC1 and ABCC2 in 3D cultures, though their expression patterns varied with matrix stiffness (Figure 3G,H).
Furthermore, we observed significant activation of stress response pathways in matrix-specific organoids. The NRF2 pathway showed enhanced activity, indicating an elevated antioxidant response. Concurrent with this, we noted increased HIF-1 signaling, likely resulting from restricted oxygen diffusion and metabolic adaptations within the 3D environment (Figure 3I). These findings suggest that matrix mechanics orchestrate a complex adaptive response involving stemness maintenance, drug efflux, and stress response pathways, collectively contributing to chemoresistance.
Stearoyl-Modified Gemcitabine Shows Enhanced Efficacy in Stiff Matrices
To combat matrix-induced chemoresistance, we evaluated a modified version of gemcitabine featuring stearoyl conjugation at the 4N position (Gem-S) (Figure 4A). Initial studies using G68 cells revealed a striking matrix-dependent drug response pattern. While both compounds showed similar efficacy in 2D cultures, Gem-S demonstrated significantly enhanced potency in stiff matrices compared to soft matrices (IC50: 1.291x10⁻⁷M vs 1.339x10⁻⁸M, p<0.001) (Figure 4B).
We extended this analysis to PDOs derived from seven patients to validate these findings across a broader biological context. In soft matrices (6B), Gem and Gem-S exhibited comparable inhibitory effects, with no significant differences in therapeutic response. However, in stiff matrices (6A), a clear differentiation emerged: PDOs showed markedly higher sensitivity to Gem-S compared to unmodified gemcitabine (Figure 4D,E). This matrix-dependent divergence in drug efficacy suggests that the stearoyl modification enables Gem-S to overcome specific resistance mechanisms that emerge in mechanically restrictive environments.
Gem-S Efficacy is Mediated Through Oxidative Stress in Stiff Matrix Environments.
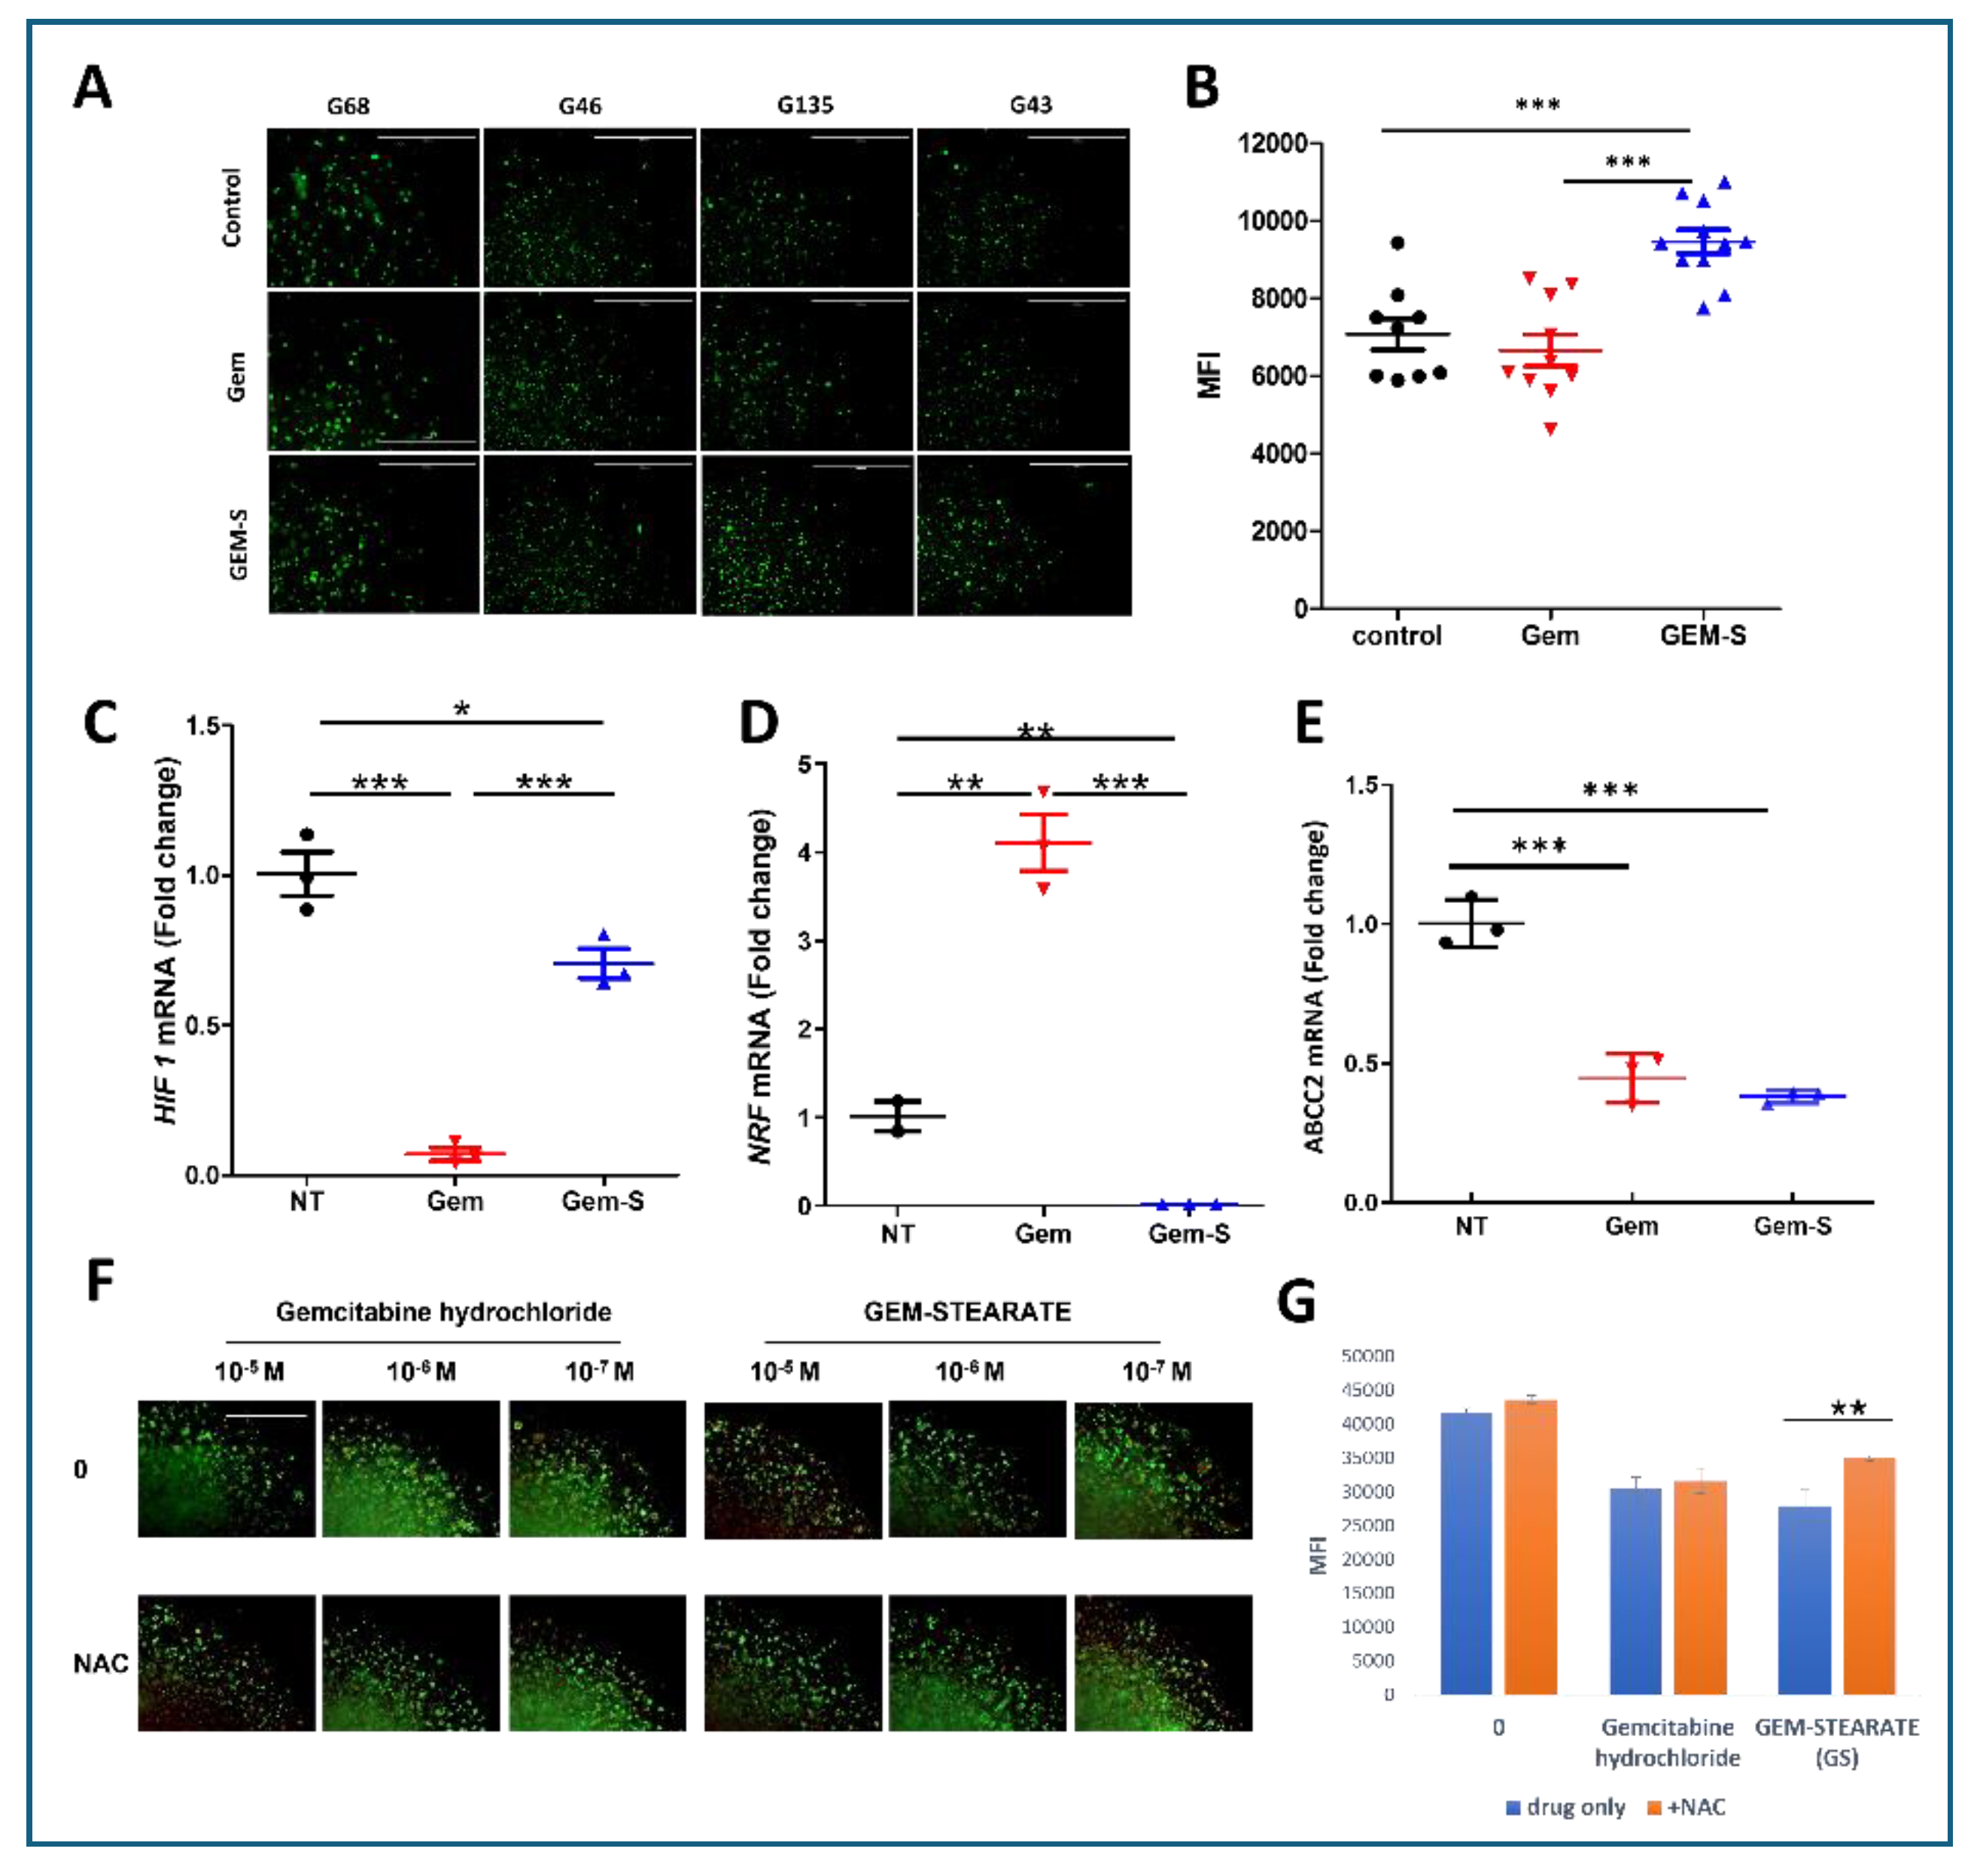
To elucidate the molecular mechanisms underlying differential drug responses in stiff matrices, we performed comprehensive marker analysis following treatment. Gem-S treatment induced significantly higher levels of reactive oxygen species (ROS) compared to unmodified gemcitabine in 6A matrices (Figure 5A,B), suggesting a distinct mode of action involving oxidative stress.
A key mechanistic insight emerged from the analysis of stress response pathways. While gemcitabine treatment activated NRF2, a master regulator of antioxidant responses, Gem-S notably suppressed NRF2 expression (Figure 5C). This differential regulation of the antioxidant defense system suggests that Gem-S may achieve enhanced efficacy by compromising cellular stress responses. Concurrent with NRF2 suppression, Gem-S treatment elevated HIF-1 expression (Figure 5D), indicating a complex interplay between oxidative stress and hypoxic responses.
Surprisingly, multidrug transporter expression remained unchanged or decreased following Gem-S treatment (Figure 5E), suggesting that enhanced drug efficacy operates independently of classical drug efflux mechanisms. To validate the role of oxidative stress in Gem-S-mediated cell death, we performed rescue experiments using the antioxidant N-acetylcysteine (NAC). NAC treatment partially reversed Gem-S cytotoxicity (Figure 5F,G), confirming that redox modulation is a key component of Gem-S’s therapeutic mechanism in stiff matrix environments.
(F-G) Effect of N-acetylcysteine (NAC) co-treatment: Live/Dead staining images after co-treatment with NAC, and mean fluorescence intensity (MFI) plots generated from the images, showing that NAC partially rescued cell viability after Gem-S treatment.
Discussion
Our study reveals a novel mechanistic insight into how matrix stiffness influences chemotherapeutic efficacy in pancreatic cancer, demonstrating that stearoyl-modified gemcitabine (Gem-S) exhibits enhanced potency specifically in stiff environments characteristic of advanced PDAC. This finding is particularly significant given that conventional gemcitabine’s efficacy often diminishes as tumors progress and become more fibrotic, suggesting that Gem-S could be especially valuable for treating late-stage disease.
To investigate matrix-dependent drug responses, we developed a tunable organoid platform that better reflects the mechanical complexity of PDAC. While most patient-derived organoids (PDOs) are cultured in soft Matrigel [23,24,25]., our gelatin-based system enables precise control over matrix stiffness while maintaining consistent biochemical composition [26,33]. By varying crosslinking degrees through distinct gelatin hydrolysis methods (acid versus alkaline), we created environments that more accurately mirror the progressive stiffening observed in PDAC development [34]. This approach revealed that PDAC cells demonstrate remarkable plasticity in response to mechanical cues, adapting their morphology, growth patterns, and drug sensitivity in a patient-specific manner [35,36].
The mechanical properties of the matrix profoundly influenced cellular phenotype and drug response [37]. In stiffer matrices, PDAC cells exhibited enhanced stemness features, adopted more compact morphologies, and showed increased resistance to conventional gemcitabine [37]. This resistance correlated with upregulation of ABC transporters and activation of stress response pathways, particularly in hypoxic regions [38,39]. Importantly, these adaptations varied among patient samples, highlighting the need for personalized therapeutic approaches that consider both mechanical and molecular factors.
Gemcitabine remains a cornerstone therapy for PDAC, but its efficacy is often limited by the development of resistance. To address this, we investigated 4-N-stearoyl gemcitabine (Gem-S), a lipophilic fatty acid derivative of gemcitabine that has shown improved drug delivery and efficacy in other studies [30,40,41]. The superior efficacy of Gem-S in stiff matrices appears to stem from a unique dual mechanism. While conventional gemcitabine activated the Nrf2-mediated antioxidant response [42], Gem-S suppressed this protective pathway while simultaneously increasing reactive oxygen species (ROS) production. This creates a vulnerability specifically in mechanically stressed cells, which typically rely heavily on antioxidant defenses to manage elevated baseline stress levels [43]. The concurrent reduction in HIF expression further compromises cellular adaptation to the challenging microenvironment, potentially explaining why Gem-S shows particular efficacy in stiff matrices where these stress responses are critical for survival.
The relationship between mechanical and oxidative stress emerges as a key therapeutic opportunity. Previous studies have shown that stiff matrices increase baseline cellular stress through mechanotransduction pathways [44,45,46]. Our findings suggest that Gem-S exploits this elevated stress state by simultaneously increasing ROS production and compromising antioxidant defenses. This may be particularly effective against cancer stem cells, which typically maintain careful redox balance to preserve their stemness. The stearoyl modification may also enhance drug accumulation in mechanically stressed cells through altered membrane properties or lipid metabolism [47,48], though this requires further investigation.
These findings have important clinical implications. First, they suggest that tumor stiffness could serve as a biomarker for predicting Gem-S efficacy, potentially allowing better patient stratification. Second, the identified mechanism suggests promising combination strategies, such as pairing Gem-S with inhibitors of antioxidant pathways or mechanical signaling. Finally, our results highlight the importance of considering matrix mechanics in drug development and testing, as conventional soft culture systems may fail to predict efficacy in the stiff PDAC environment.
Several questions warrant further investigation. The molecular mechanisms linking matrix stiffness to Nrf2 regulation and ROS generation need detailed elaboration. The role of lipid metabolism in Gem-S’s matrix-dependent effects requires clarification. Additionally, the potential for resistance development and optimal timing of Gem-S administration in the disease course should be examined.
In conclusion, our study not only identifies Gem-S as a promising agent for treating mechanically rigid PDAC but also establishes a new paradigm for considering matrix mechanics in drug development. By demonstrating how mechanical and oxidative stress pathways intersect to influence drug efficacy, this work opens new avenues for therapeutic intervention in PDAC and potentially other stiff tumors.
Funding
This work was supported by the NCI This work was supported by grants U54CA233465 (BH), U54CA233396 (EA), and U54CA233444 (SR, JB)
References
- Siegel, R.L.; Miller, K.D.; Fuchs, H.E.; Jemal, A. Cancer statistics, 2021. Ca Cancer J Clin 2021, 71, 7–33. [Google Scholar] [CrossRef] [PubMed]
- Halbrook, C.J.; Lyssiotis, C.A.; di Magliano, M.P.; Maitra, A. Pancreatic cancer: Advances; challenges. Cell 2023, 186, 1729–1754. [Google Scholar] [CrossRef] [PubMed]
- Weniger, M.; Honselmann, K.C.; Liss, A.S. The extracellular matrix and pancreatic cancer: a complex relationship. Cancers 2018, 10, 316. [Google Scholar] [CrossRef] [PubMed]
- Wang, D.; Li, Y.; Ge, H.; Ghadban, T.; Reeh, M.; Guengoer, C. The extracellular matrix: a key accomplice of cancer stem cell migration, metastasis formation, and drug resistance in PDAC. Cancers 2022, 14, 3998. [Google Scholar] [CrossRef]
- Pothula, S.P.; Pirola, R.C.; Wilson, J.S.; Apte, M.V. Multifunctional role of pancreatic stellate cells in pancreatic cancer. Annals of Pancreatic Cancer 2019, 2. [Google Scholar]
- Sarvepalli, D.; Rashid, M.U.; Rahman, A.U.; Ullah, W.; Hussain, I.; Hasan, B.; Jehanzeb, S.; Khan, A.K.; Jain, A.G.; Khetpal, N. Gemcitabine: a review of chemoresistance in pancreatic cancer. Critical Reviews™ in Oncogenesis 2019, 24. [Google Scholar] [CrossRef]
- Beutel, A.K.; Halbrook, C.J. Barriers and opportunities for gemcitabine in pancreatic cancer therapy. American Journal of Physiology-Cell Physiology 2023, 324, C540–C552. [Google Scholar] [CrossRef]
- Gong, M.; Meng, H.; Tan, D.; Li, P.; Qin, J.; An, Q.; Shi, C.; An, J. Establishment of organoid models for pancreatic ductal adenocarcinoma and screening of individualized therapy strategy. Animal Models and Experimental Medicine 2023, 6, 409–418. [Google Scholar] [CrossRef]
- Amrutkar, M.; Gladhaug, I.P. Pancreatic cancer chemoresistance to gemcitabine. Cancers 2017, 9, 157. [Google Scholar] [CrossRef]
- Calà, G.; Sina, B.; De Coppi, P.; Giobbe, G.G.; Gerli, M.F.M. Primary human organoids models: Current progress and key milestones. Frontiers in Bioengineering and Biotechnology 2023, 11, 1058970. [Google Scholar] [CrossRef]
- Hosein, A.N.; Brekken, R.A.; Maitra, A. Pancreatic cancer stroma: an update on therapeutic targeting strategies. Nature Reviews Gastroenterology & Hepatology 2020, 17, 487–505. [Google Scholar]
- Rossi, G.; Manfrin, A.; Lutolf, M.P. Progress and potential in organoid research. Nature Reviews Genetics 2018, 19, 671–687. [Google Scholar] [CrossRef] [PubMed]
- Seppälä, T.T.; Zimmerman, J.W.; Suri, R.; Zlomke, H.; Ivey, G.D.; Szabolcs, A.; Shubert, C.R.; Cameron, J.L.; Burns, W.R.; Lafaro, K.J. Precision medicine in pancreatic cancer: patient-derived organoid pharmacotyping is a predictive biomarker of clinical treatment response. Clinical Cancer Research 2022, 28, 3296–3307. [Google Scholar] [CrossRef] [PubMed]
- Provenzano, P.P.; Cuevas, C.; Chang, A.E.; Goel, V.K.; Von Hoff, D.D.; Hingorani, S.R. Enzymatic targeting of the stroma ablates physical barriers to treatment of pancreatic ductal adenocarcinoma. Cancer cell 2012, 21, 418–429. [Google Scholar] [CrossRef]
- Yu, M.; Tannock, I.F. Targeting tumor architecture to favor drug penetration: a new weapon to combat chemoresistance in pancreatic cancer? Cancer cell 2012, 21, 327–329. [Google Scholar] [CrossRef]
- Tape, C.J.; Ling, S.; Dimitriadi, M.; McMahon, K.M.; Worboys, J.D.; Leong, H.S.; Norrie, I.C.; Miller, C.J.; Poulogiannis, G.; Lauffenburger, D.A. Oncogenic KRAS regulates tumor cell signaling via stromal reciprocation. Cell 2016, 165, 910–920. [Google Scholar] [CrossRef]
- Apte, M.V.; Wilson, J.S.; Lugea, A.; Pandol, S.J. A starring role for stellate cells in the pancreatic cancer microenvironment. Gastroenterology 2013, 144, 1210–1219. [Google Scholar] [CrossRef]
- Huber, M.; Brehm, C.U.; Gress, T.M.; Buchholz, M.; Alhamwe, B.A.; von Strandmann, E.P.; Slater, E.P.; Bartsch, J.W.; Bauer, C.; Lauth, M. The immune microenvironment in pancreatic cancer. International journal of molecular sciences 2020, 21, 7307. [Google Scholar] [CrossRef]
- Tahkola, K.; Ahtiainen, M.; Mecklin, J.-P.; Kellokumpu, I.; Laukkarinen, J.; Tammi, M.; Tammi, R.; Väyrynen, J.P.; Böhm, J. Stromal hyaluronan accumulation is associated with low immune response and poor prognosis in pancreatic cancer. Scientific Reports 2021, 11, 12216. [Google Scholar] [CrossRef]
- Murphy, K.J.; Chambers, C.R.; Herrmann, D.; Timpson, P.; Pereira, B.A. Dynamic stromal alterations influence tumor-stroma crosstalk to promote pancreatic cancer and treatment resistance. Cancers 2021, 13, 3481. [Google Scholar] [CrossRef]
- Liang, C.; Shi, S.; Meng, Q.; Liang, D.; Ji, S.; Zhang, B.; Qin, Y.; Xu, J.; Ni, Q.; Yu, X. Complex roles of the stroma in the intrinsic resistance to gemcitabine in pancreatic cancer: where we are and where we are going. Experimental & molecular medicine 2017, 49, e406–e406. [Google Scholar]
- Capula, M.; Perán, M.; Xu, G.; Donati, V.; Yee, D.; Gregori, A.; Assaraf, Y.G.; Giovannetti, E.; Deng, D. Role of drug catabolism, modulation of oncogenic signaling and tumor microenvironment in microbe-mediated pancreatic cancer chemoresistance. Drug Resistance Updates 2022, 64, 100864. [Google Scholar] [CrossRef] [PubMed]
- Driehuis, E.; Van Hoeck, A.; Moore, K.; Kolders, S.; Francies, H.E.; Gulersonmez, M.C.; Stigter, E.C.; Burgering, B.; Geurts, V.; Gracanin, A. Pancreatic cancer organoids recapitulate disease and allow personalized drug screening. Proceedings of the National Academy of Sciences 2019, 116, 26580–26590. [Google Scholar] [CrossRef] [PubMed]
- Wensink, G.E.; Elias, S.G.; Mullenders, J.; Koopman, M.; Boj, S.F.; Kranenburg, O.W.; Roodhart, J.M. Patient-derived organoids as a predictive biomarker for treatment response in cancer patients. NPJ precision oncology 2021, 5, 30. [Google Scholar] [CrossRef]
- Raimondi, G.; Mato-Berciano, A.; Pascual-Sabater, S.; Rovira-Rigau, M.; Cuatrecasas, M.; Fondevila, C.; Sanchez-Cabus, S.; Begthel, H.; Boj, S.F.; Clevers, H. Patient-derived pancreatic tumour organoids identify therapeutic responses to oncolytic adenoviruses. EBioMedicine 2020, 56. [Google Scholar] [CrossRef]
- Fang, J.Y.; Tan, S.-J.; Yang, Z.; Tayag, C.; Han, B. Tumor bioengineering using a transglutaminase crosslinked hydrogel. PloS one 2014, 9, e105616. [Google Scholar] [CrossRef]
- Fang, J.Y.; Tan, S.-J.; Wu, Y.-C.; Yang, Z.; Hoang, B.X.; Han, B. From competency to dormancy: a 3D model to study cancer cells and drug responsiveness. Journal of translational medicine 2016, 14, 1–13. [Google Scholar] [CrossRef]
- Eckert, R.L. Transglutaminase 2 takes center stage as a cancer cell survival factor and therapy target. Molecular carcinogenesis 2019, 58, 837–853. [Google Scholar] [CrossRef]
- Zaltron, E.; Vianello, F.; Ruzza, A.; Palazzo, A.; Brillo, V.; Celotti, I.; Scavezzon, M.; Rossin, F.; Leanza, L.; Severin, F. The Role of Transglutaminase 2 in Cancer: An Update. International Journal of Molecular Sciences 2024, 25, 2797. [Google Scholar] [CrossRef]
- Inkoom; Ndemazie, N.B.; Smith, T.; Frimpong, E.; Bulusu, R.; Poku, R.; Zhu, X.; Han, B.; Trevino, J.; Agyare, E. Biological evaluation of novel gemcitabine analog in patient-derived xenograft models of pancreatic cancer. BMC cancer 2023, 23, 435. [Google Scholar]
- Eliahoo, P.; Setayesh, H.; Hoffman, T.; Wu, Y.; Li, S.; Treweek, J.B. Viscoelasticity in 3D Cell Culture and Regenerative Medicine: Measurement Techniques and Biological Relevance. ACS Materials Au 2024, 4, 354–384. [Google Scholar] [CrossRef] [PubMed]
- Pham, K.; Delitto, D.; Knowlton, A.E.; Hartlage, E.R.; Madhavan, R.; Gonzalo, D.H.; Thomas, R.M.; Behrns, K.E.; Jr, T.J.G.; Hughes, S.J. Isolation of pancreatic cancer cells from a patient-derived xenograft model allows for practical expansion and preserved heterogeneity in culture. The American journal of pathology 2016, 186, 1537–1546. [Google Scholar] [CrossRef]
- Tan, S.; Fang, J.Y.; Yang, Z.; Nimni, M.E.; Han, B. The synergetic effect of hydrogel stiffness and growth factor on osteogenic differentiation. Biomaterials 2014, 35, 5294–5306. [Google Scholar] [CrossRef] [PubMed]
- Saraswathibhatla, *!!! REPLACE !!!*; Indana, D.; Chaudhuri, O. Cell–extracellular matrix mechanotransduction in 3D. Nature Reviews Molecular Cell Biology 2023, 1–22. [Google Scholar] [CrossRef] [PubMed]
- Hadden, M.; Mittal, A.; Samra, J.; Zreiqat, H.; Sahni, S.; Ramaswamy, Y. Mechanically stressed cancer microenvironment: Role in pancreatic cancer progression. Biochimica et Biophysica Acta (BBA)-Reviews on Cancer 2020, 1874, 188418. [Google Scholar] [CrossRef] [PubMed]
- Hayward, M.-K.; Muncie, J.M.; Weaver, V.M. Tissue mechanics in stem cell fate, development, and cancer. Developmental cell 2021, 56, 1833–1847. [Google Scholar] [CrossRef]
- Rice, *!!! REPLACE !!!*; Cortes, E.; Lachowski, D.; Cheung, B.; Karim, S.; Morton, J.; Del Rio Hernandez, A. Matrix stiffness induces epithelial–mesenchymal transition and promotes chemoresistance in pancreatic cancer cells. Oncogenesis 2017, 6, e352–e352. [Google Scholar] [CrossRef]
- Adamska, *!!! REPLACE !!!*; Falasca, M. ATP-binding cassette transporters in progression and clinical outcome of pancreatic cancer: What is the way forward? World journal of gastroenterology 2018, 24, 3222. [Google Scholar] [CrossRef]
- Koltai, T.; Reshkin, S.J.; Carvalho, T.M.; Di Molfetta, D.; Greco, M.R.; Alfarouk, K.O.; Cardone, R.A. Resistance to gemcitabine in pancreatic ductal adenocarcinoma: A physiopathologic and pharmacologic review. Cancers 2022, 14, 2486. [Google Scholar] [CrossRef]
- Inkoom, *!!! REPLACE !!!*; Ndemazie, N.; Smith, T.; Frimpong, E.; Bulusu, R.; Poku, R.; Zhu, X.; Han, B.; Trevino, J.; Agyare, E. Application of modified gemcitabine-loaded solid lipid nanoparticle in the treatment of pancreatic cancer patient-derived xenograft model. 2022. [Google Scholar]
- Srinivas, P.; Preeti, S. Formulation and evaluation of gemcitabine hydrochloride loaded solid lipid nanoparticles. JGTPS 2014, 5, 2017–2023. [Google Scholar]
- Bae, T.; Hallis, S.P.; Kwak, M.-K. Hypoxia; oxidative stress, and the interplay of HIFs and NRF2 signaling in cancer. Experimental & Molecular Medicine 2024, 56, 501–514. [Google Scholar]
- Glasauer, *!!! REPLACE !!!*; Chandel, N.S. Targeting antioxidants for cancer therapy. Biochemical pharmacology 2014, 92, 90–101. [Google Scholar] [CrossRef] [PubMed]
- Gong, T.; Wu, D.; Pan, H.; Sun, Z.; Yao, X.; Wang, D.; Huang, Y.; Li, X.; Guo, Y.; Lu, Y. Biomimetic microenvironmental stiffness boosts stemness of pancreatic ductal adenocarcinoma via augmented autophagy. ACS Biomaterials Science & Engineering 2023, 9, 5347–5360. [Google Scholar]
- Ishihara, S.; Haga, H. Matrix stiffness contributes to cancer progression by regulating transcription factors. Cancers 2022, 14, 1049. [Google Scholar] [CrossRef]
- Nallanthighal, S.; Heiserman, J.P.; Cheon, D.-J. The role of the extracellular matrix in cancer stemness. Frontiers in cell and developmental biology 2019, 7, 86. [Google Scholar] [CrossRef]
- Sharmin, M.M.; Mizusawa, M.; Hayashi, S.; Arai, W.; Sakata, S.; Yonekura, S. Effects of fatty acids on inducing endoplasmic reticulum stress in bovine mammary epithelial cells. Journal of dairy science 2020, 103, 8643–8654. [Google Scholar] [CrossRef]
- Pineau, L.; Colas, J.; Dupont, S.; Beney, L.; Fleurat-Lessard, P.; Berjeaud, J.M.; Bergès, T.; Ferreira, T. Lipid-induced ER stress: synergistic effects of sterols and saturated fatty acids. Traffic 2009, 10, 673–690. [Google Scholar] [CrossRef]
Figure 1.
Matrix Mechanics Govern PDAC Organoid Architecture and Growth Dynamics. (A) Non-invasive rheological characterization of cell-embedded collagen-transglutaminase (Col-Tgel) matrices. Ultrasound transducers measured matrix deformation under 440 kPa shear stress over time. Representative stress-strain curves demonstrate distinct viscoelastic properties between matrix formulations. (B) Representative phase-contrast micrographs of seven patient-derived PDAC organoids cultured in stiff (6A) versus soft (6B) matrices for 6-8 days. Semi-dome 3D configuration enabled visualization of matrix-dependent morphological adaptations. Scale bars: 1000 µm (low magnification) and 100 µm (high magnification). (C) Quantitative analysis of organoid size using ImageJ software. Measurements represent organoid diameters from G68-derived cells after 8 days of culture in matrices 6A and 6B. Data presented as mean ± SD; **p < 0.01 (Student’s t-test). (D) Comparative analysis of cell proliferation kinetics across culture conditions. Doubling times were calculated following collagenase-mediated matrix digestion and automated cell counting (Beckman Coulter). Data shown as mean ± SD from three independent experiments.
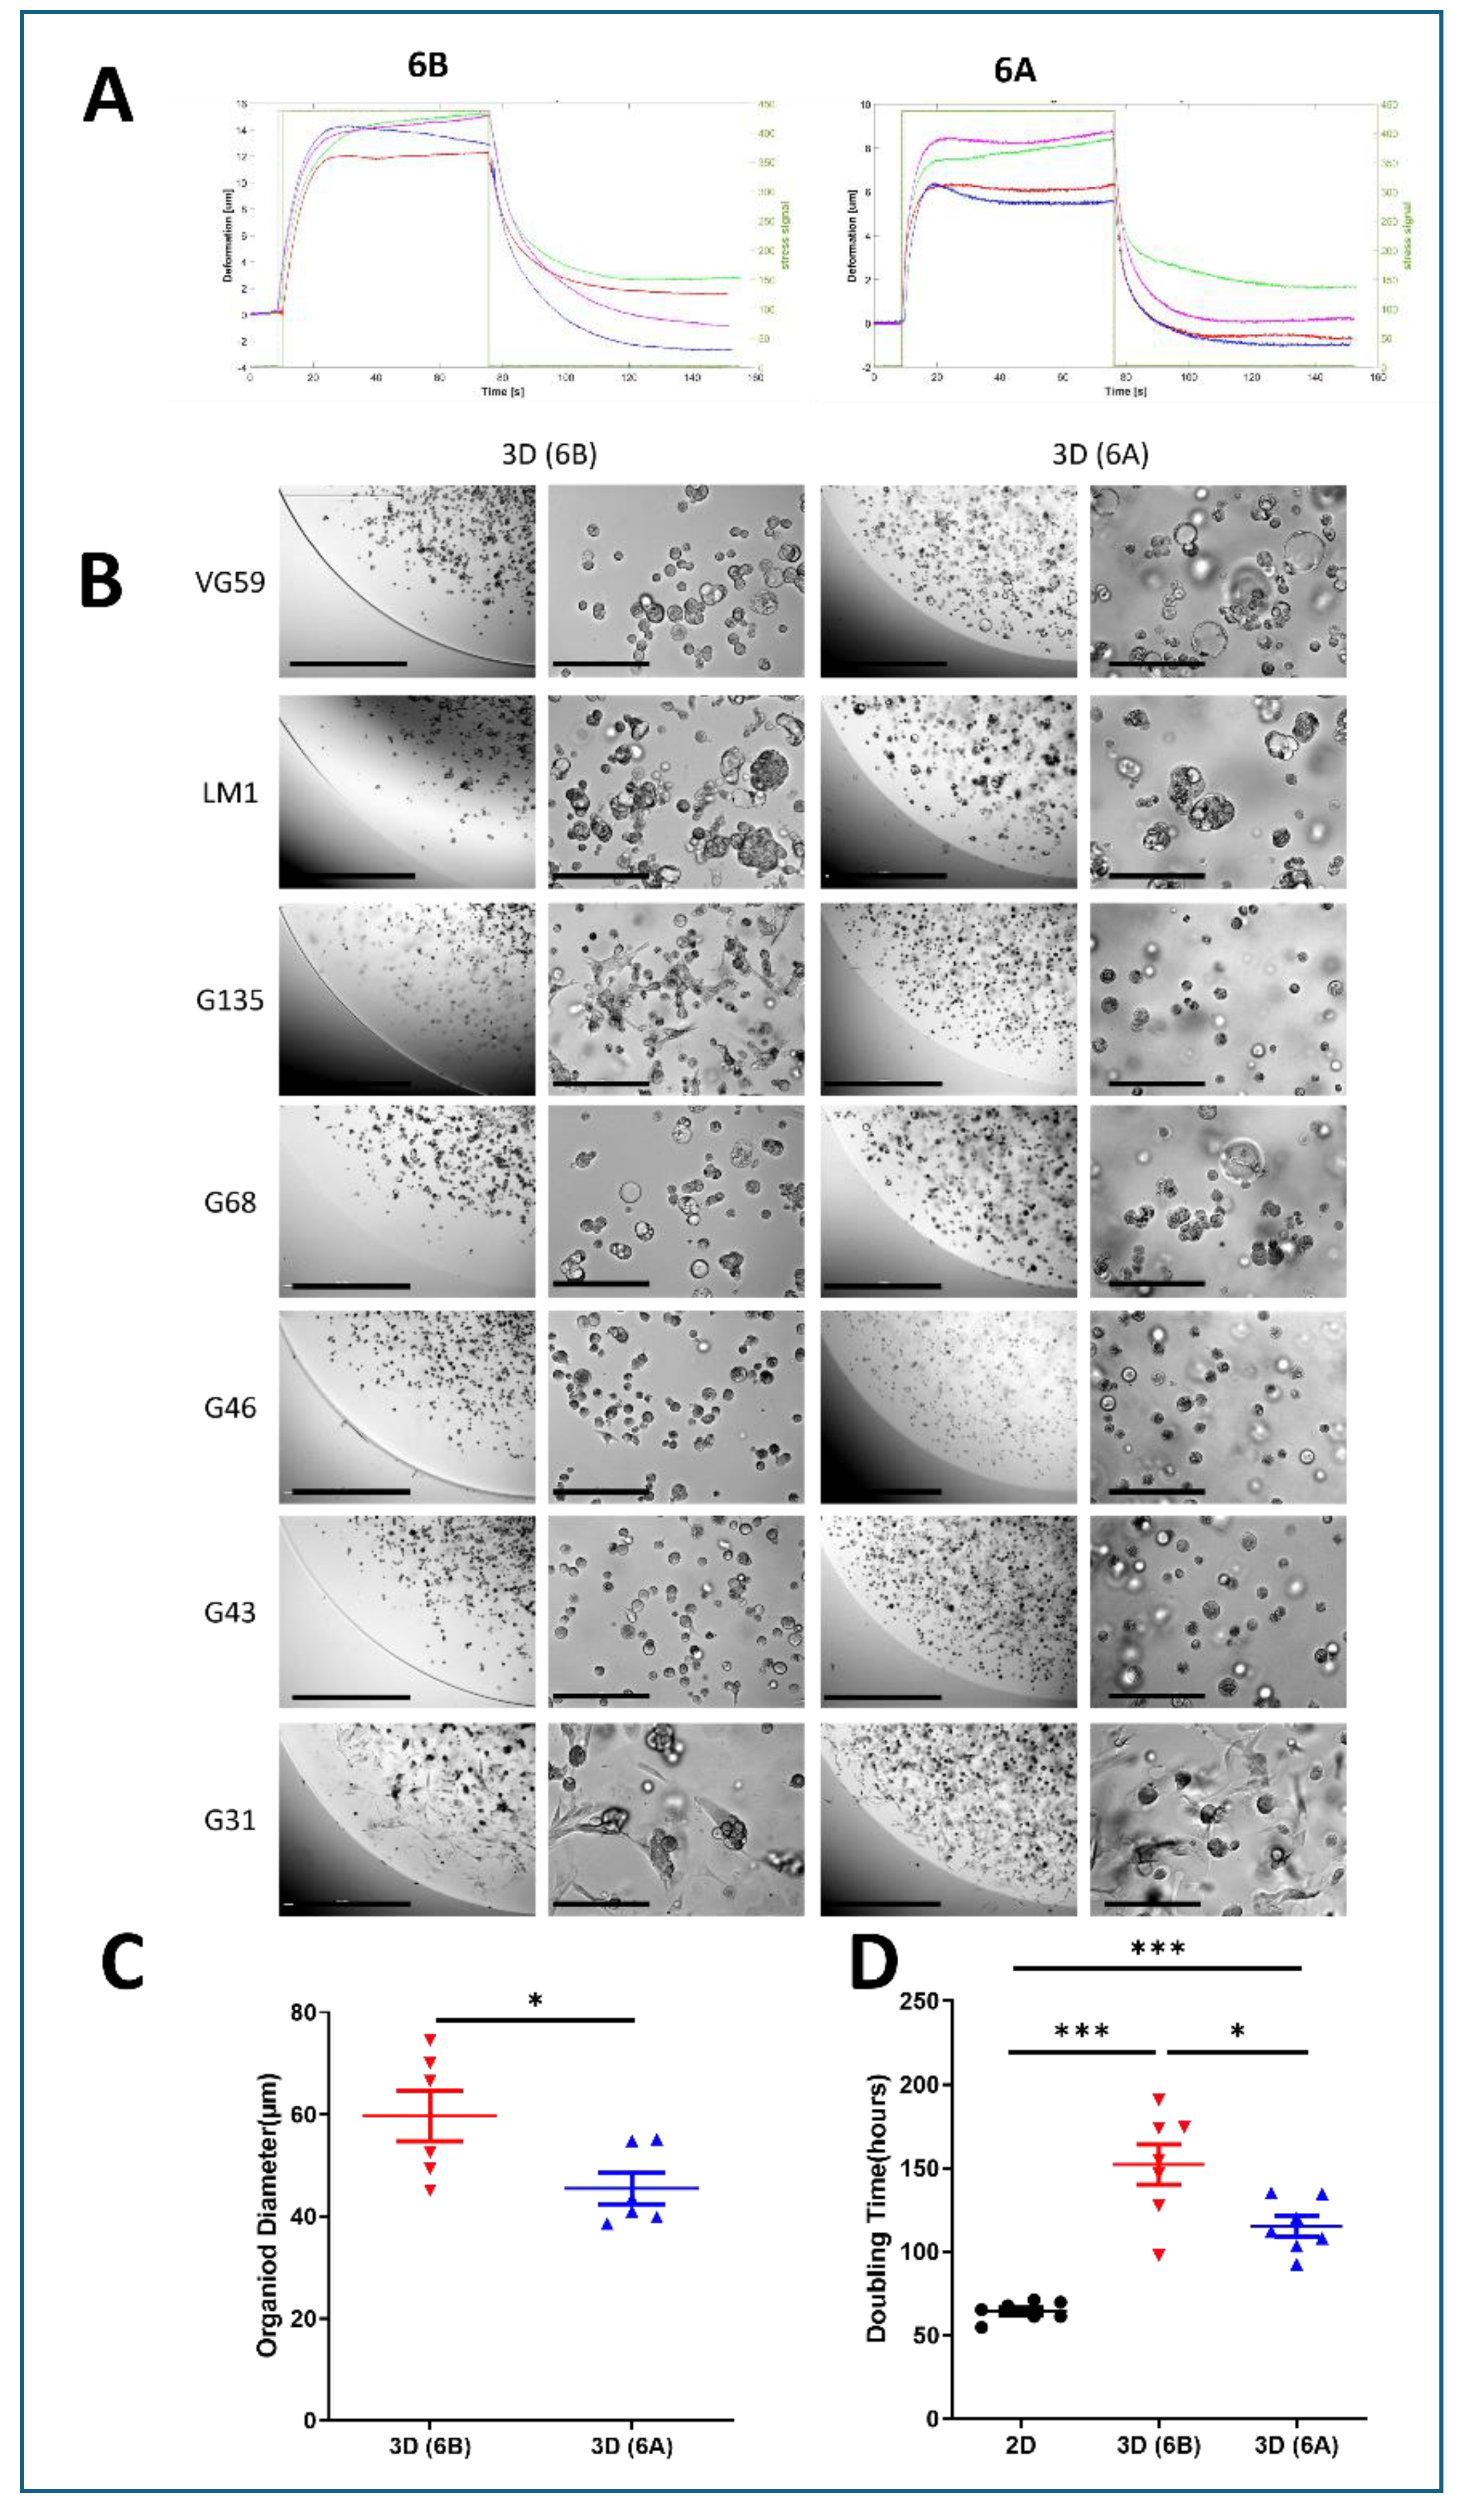
Figure 2.
Matrix-Dependent Transcriptional Reprogramming in PDAC Organoids. (A) Multidimensional scaling (MDS) plot of RNA-sequencing data from three patient-derived PDAC lines (G43, VG59, and LM-1) cultured under different conditions (2D monolayer, soft matrix 6B, and stiff matrix 6A). Analysis based on the top 1,000 most variable genes demonstrates distinct transcriptional clustering by culture condition. Each point represents an individual sample, with distances reflecting relative transcriptional similarities. (B) Mean difference plots comparing gene expression between culture conditions. Each point represents an individual gene, with red dots indicating upregulated genes (fold change > 2) and blue dots indicating downregulated genes (fold change < -2) relative to 2D culture. Gray dots represent genes with less than two-fold change in expression. Results shown for three pairwise comparisons: 3D soft matrix (6B) vs. 2D culture; 3D stiff matrix (6A) vs. 2D culture; and 3D stiff matrix (6A) vs. 3D soft matrix (6B). RNA-sequencing performed with >20 million reads per sample. Data analyzed using edgeR following TMM normalization. n = 3 biological replicates per condition.
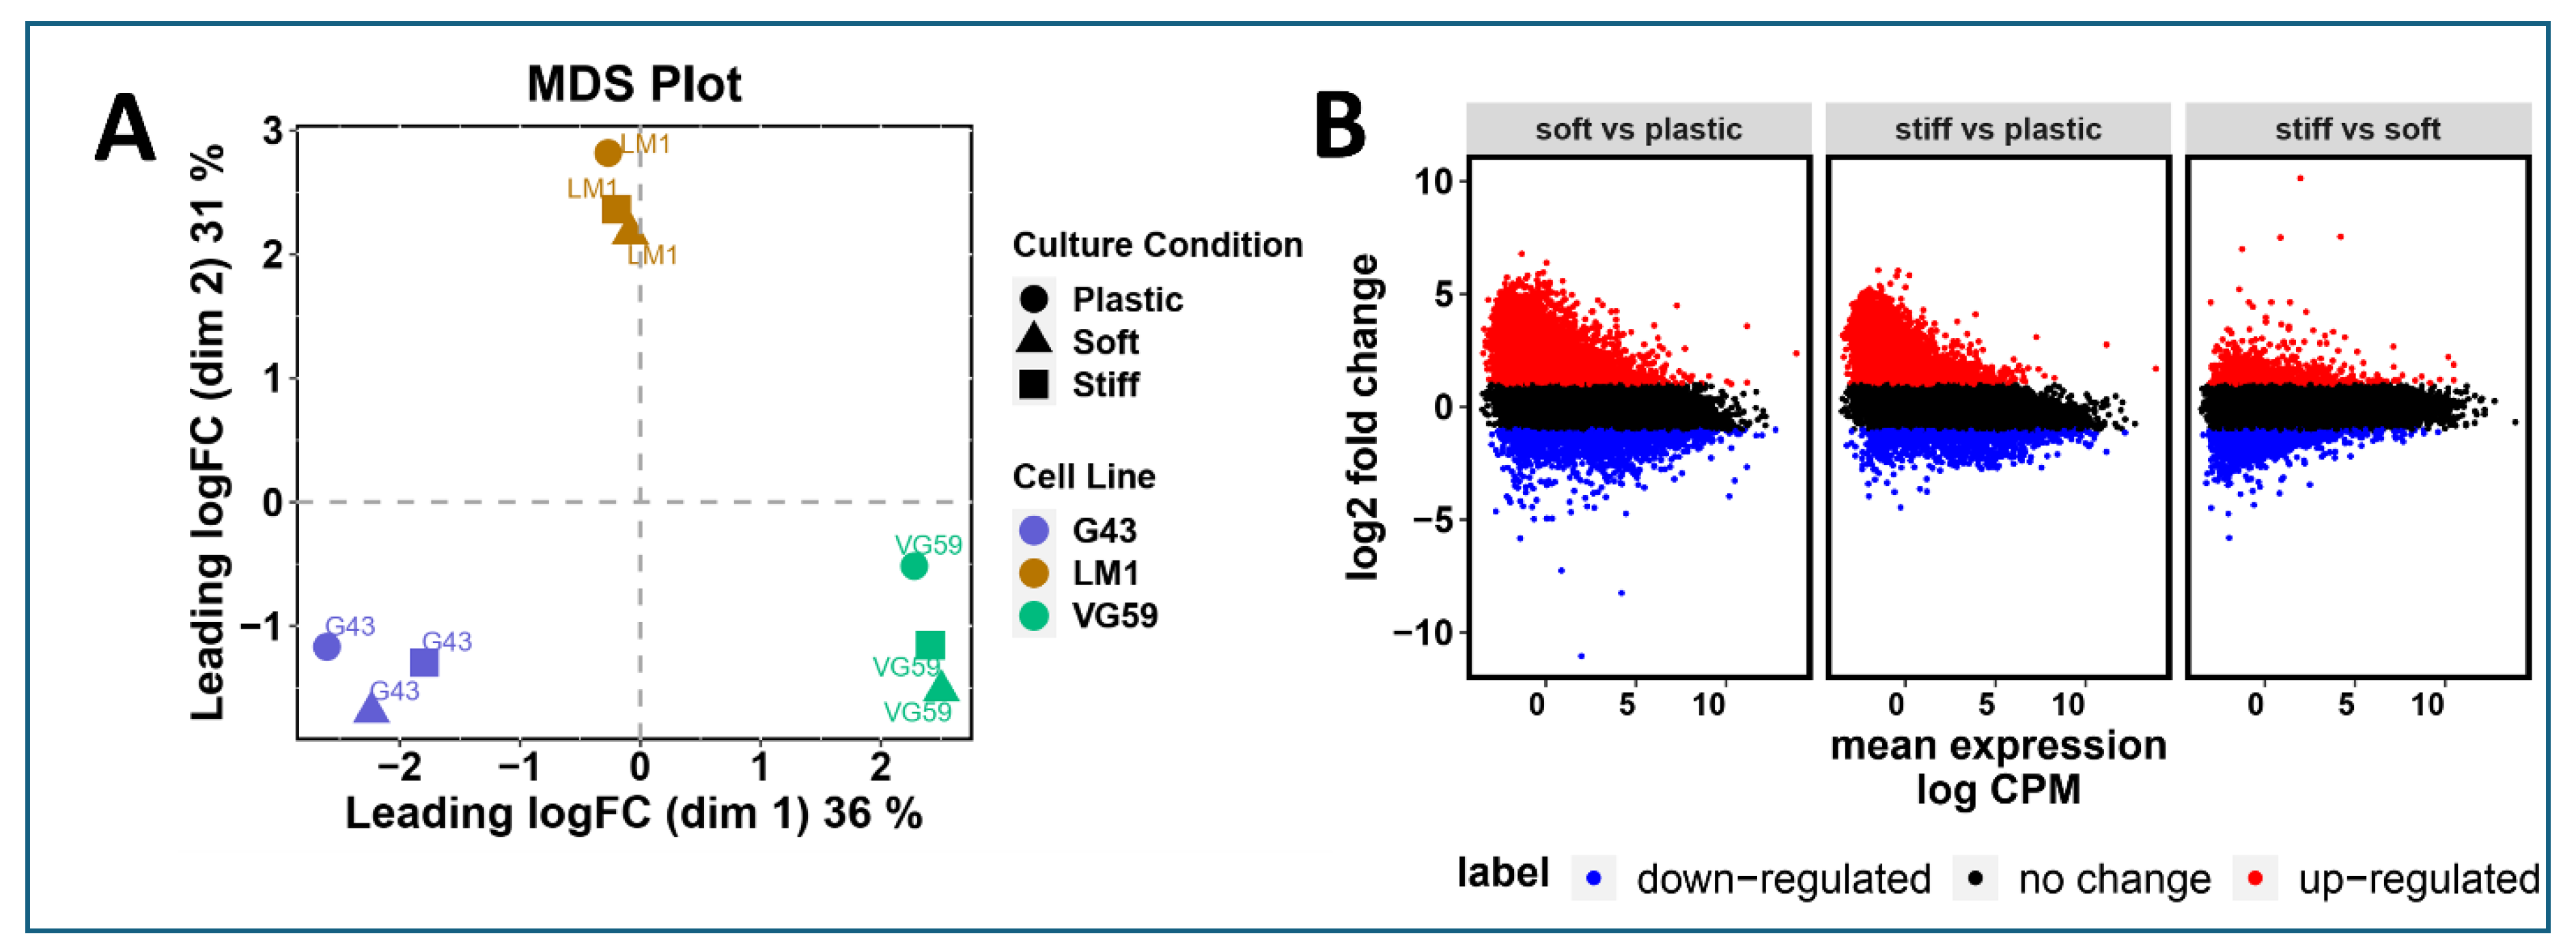
Figure 3.
Matrix Stiffness Orchestrates Drug Resistance Programs in PDAC Patient-Derived Organoids. (A) Schematic representation of experimental design. PDAC PDOs were established in soft (6B) and stiff (6A) matrices for 6 days prior to gemcitabine (Gem) treatment. Cell viability was quantified via CellTiter-Glo luminescence assay following 72-hour drug exposure. (B) Dose-response curves for G43-derived organoids treated with gemcitabine. IC50 values demonstrate progressive resistance from 2D monolayer to soft and stiff 3D cultures (4-12 fold increase in IC50). Data presented as mean ± SD from three independent experiments. (C) Quantitative assessment of cell death using Live/Dead fluorescence assay following 1 µM gemcitabine treatment. Representative images and quantification showing reduced apoptosis in 3D cultures compared to 2D conditions. Scale bar = 100 µm. (D) Immunofluorescence analysis of key cellular markers across culture conditions. Representative images showing differential expression of HIF-1α (hypoxia), Ki67 (proliferation), and vimentin (EMT) in 2D, soft 3D, and stiff 3D environments. Scale bar = 100 µm. (E-J) RT-qPCR analysis of mechanosensitive gene expression in G68-derived organoids. Data normalized to 2D culture and ACTB expression, showing matrix-dependent regulation of stemness regulators CD44 (E) and PTK2 (F), drug efflux transporters ABCC2 (G) and ABCC1 (H), and stress response factors NRF2 (I) and HIF-1α (J). Data represent mean ± SEM from three biological replicates. *p < 0.05, **p < 0.01, ***p < 0.001 by one-way ANOVA with Tukey’s post-hoc test.
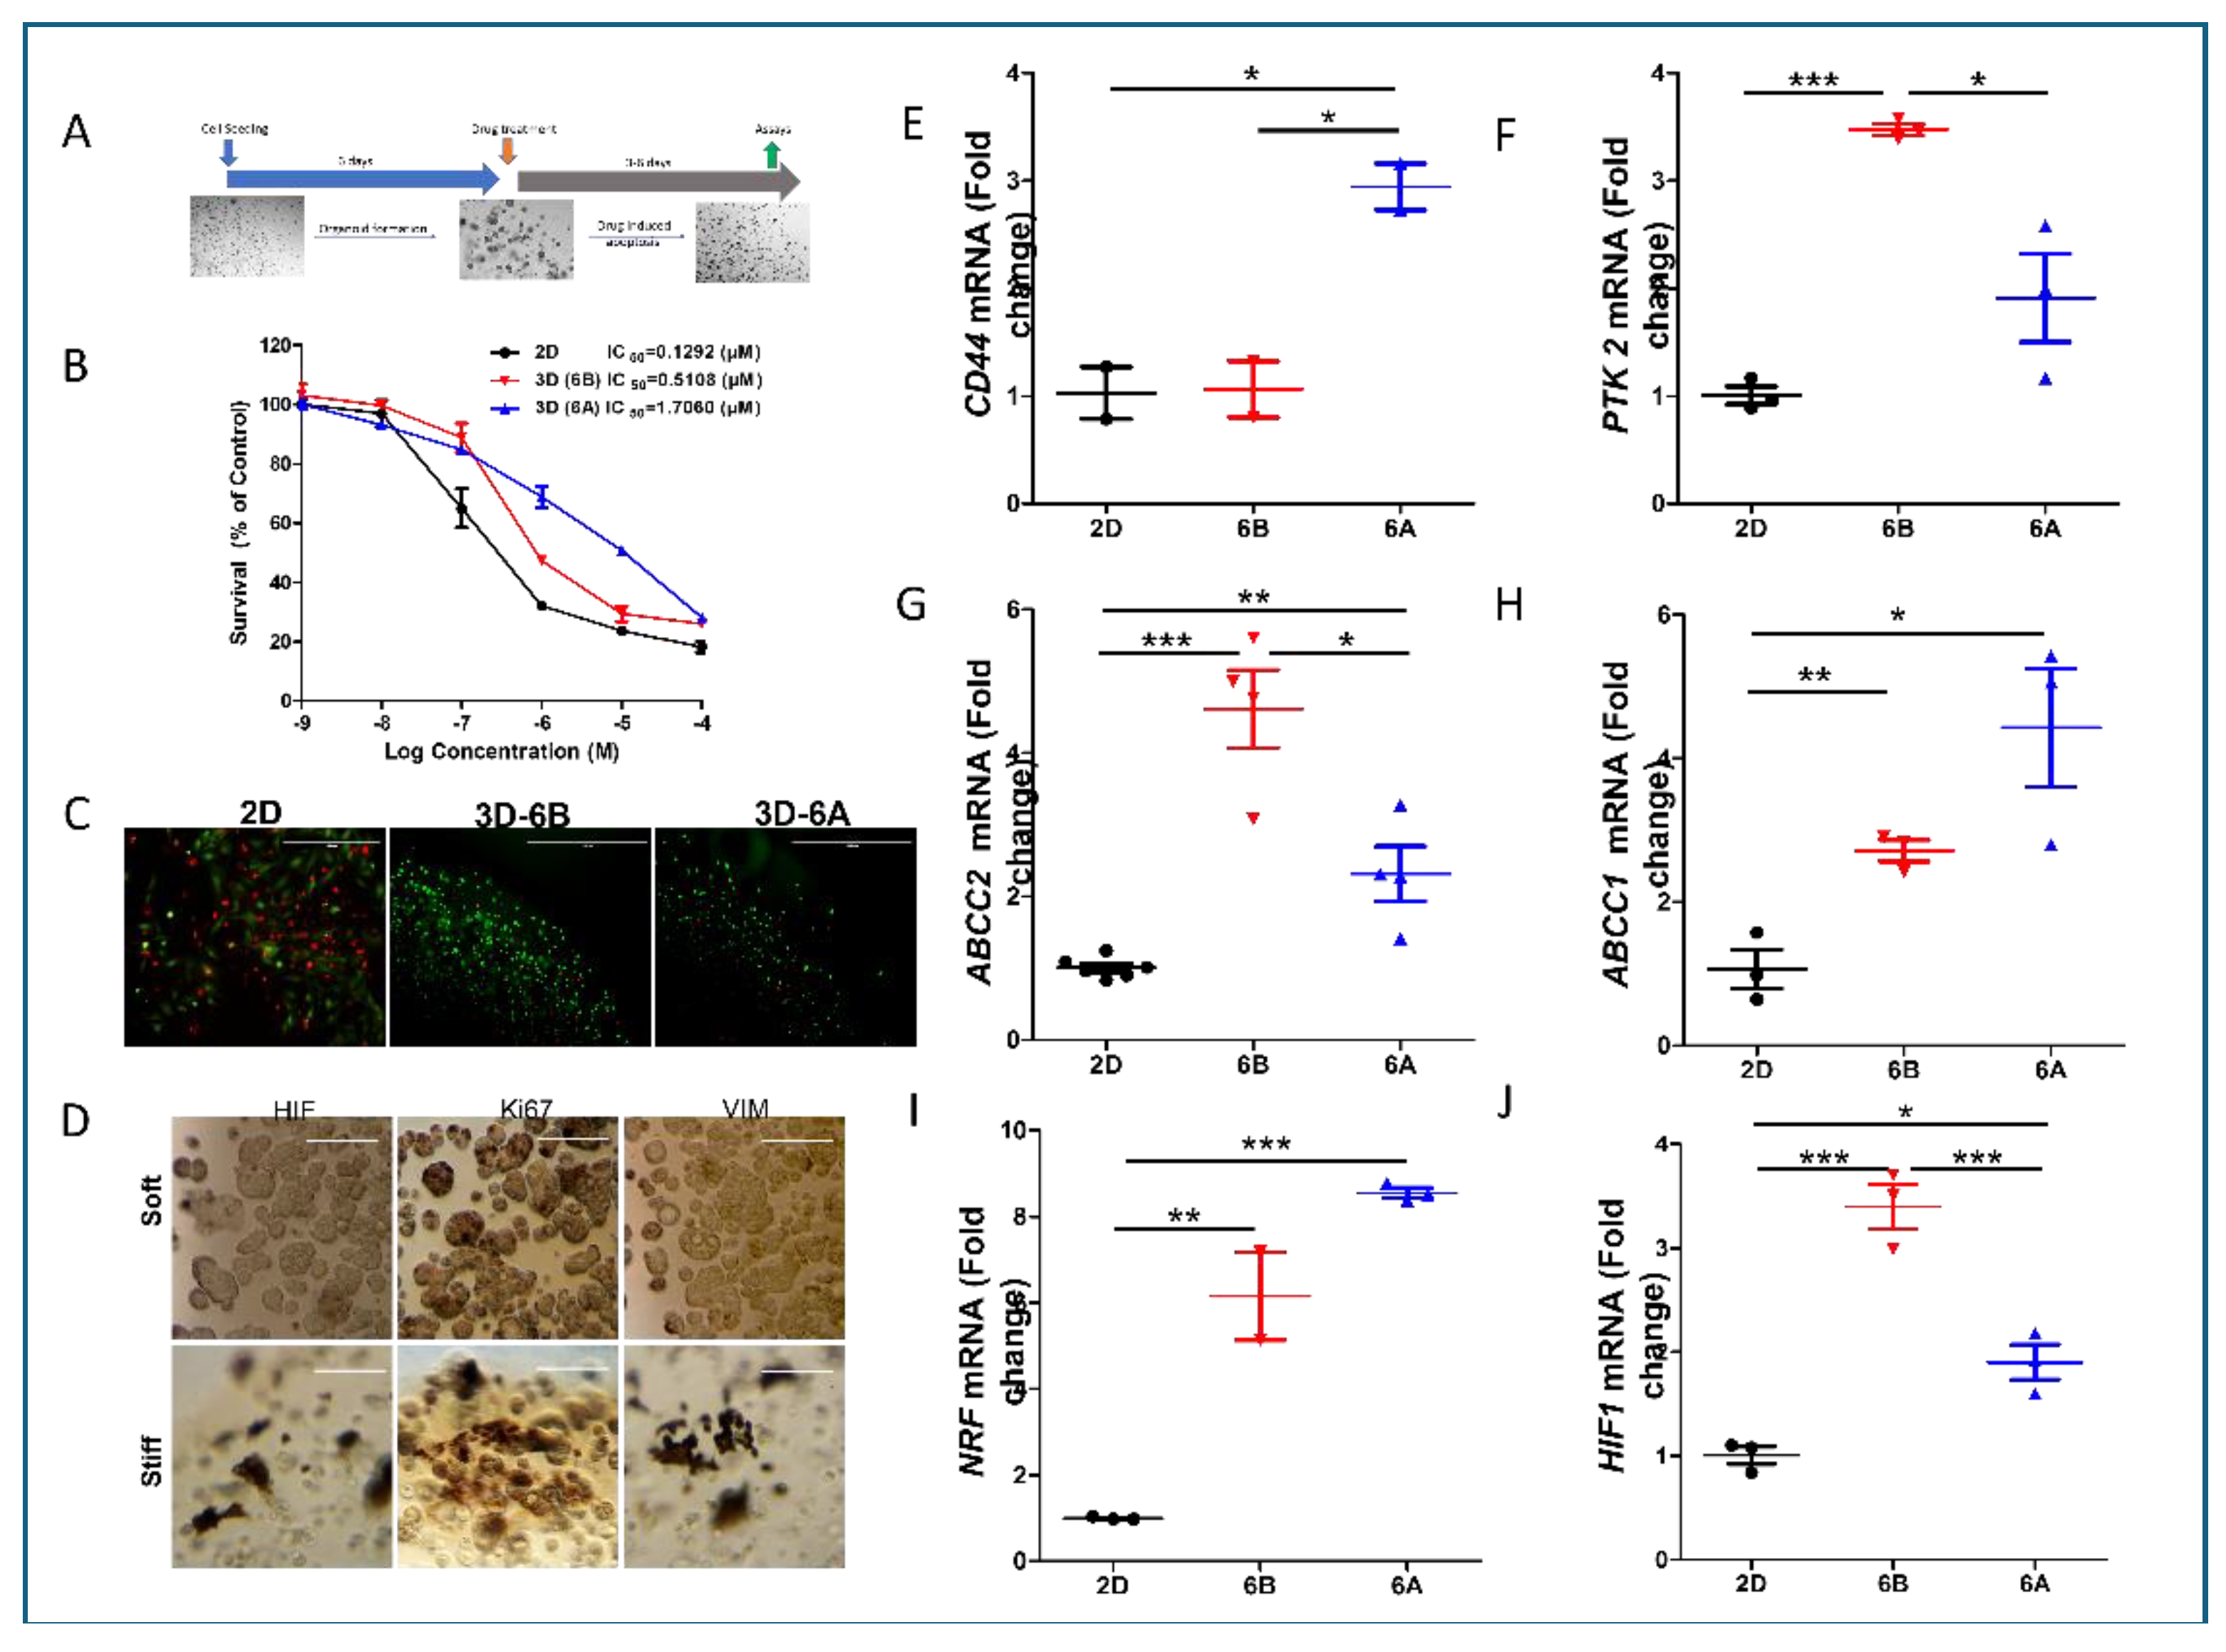
Figure 4.
Matrix Stiffness Differentially Modulates the Efficacy of Stearoyl-Modified Gemcitabine in PDAC Organoids. (A) Chemical structure and schematic representation of gemcitabine modification, showing stearoyl conjugation at the 4N position to generate Gem-S. (B-C) Comparative drug response analysis in G68 cells across matrix conditions. Dose-response curves demonstrate differential sensitivity to Gem and Gem-S in soft (6B) versus stiff (6A) matrices. IC50 values reveal significantly enhanced Gem-S potency in stiff matrices (1.291x10⁻⁷M vs 1.339x10⁻⁸M, p<0.001). Data presented as mean ± SD from three independent experiments. (D-E) Matrix-dependent drug sensitivity across seven patient-derived organoid lines. Cell viability assessed after 72-hour drug exposure in soft (6B) and stiff (6A) matrices. Similar drug responses observed in soft matrices, while stiff matrices show enhanced sensitivity to Gem-S compared to unmodified gemcitabine. Data normalized to vehicle controls and presented as mean ± SEM. Statistical significance determined by two-sided unpaired Student’s t-test (*p < 0.01, **p < 0.001, ***p < 0.0001).
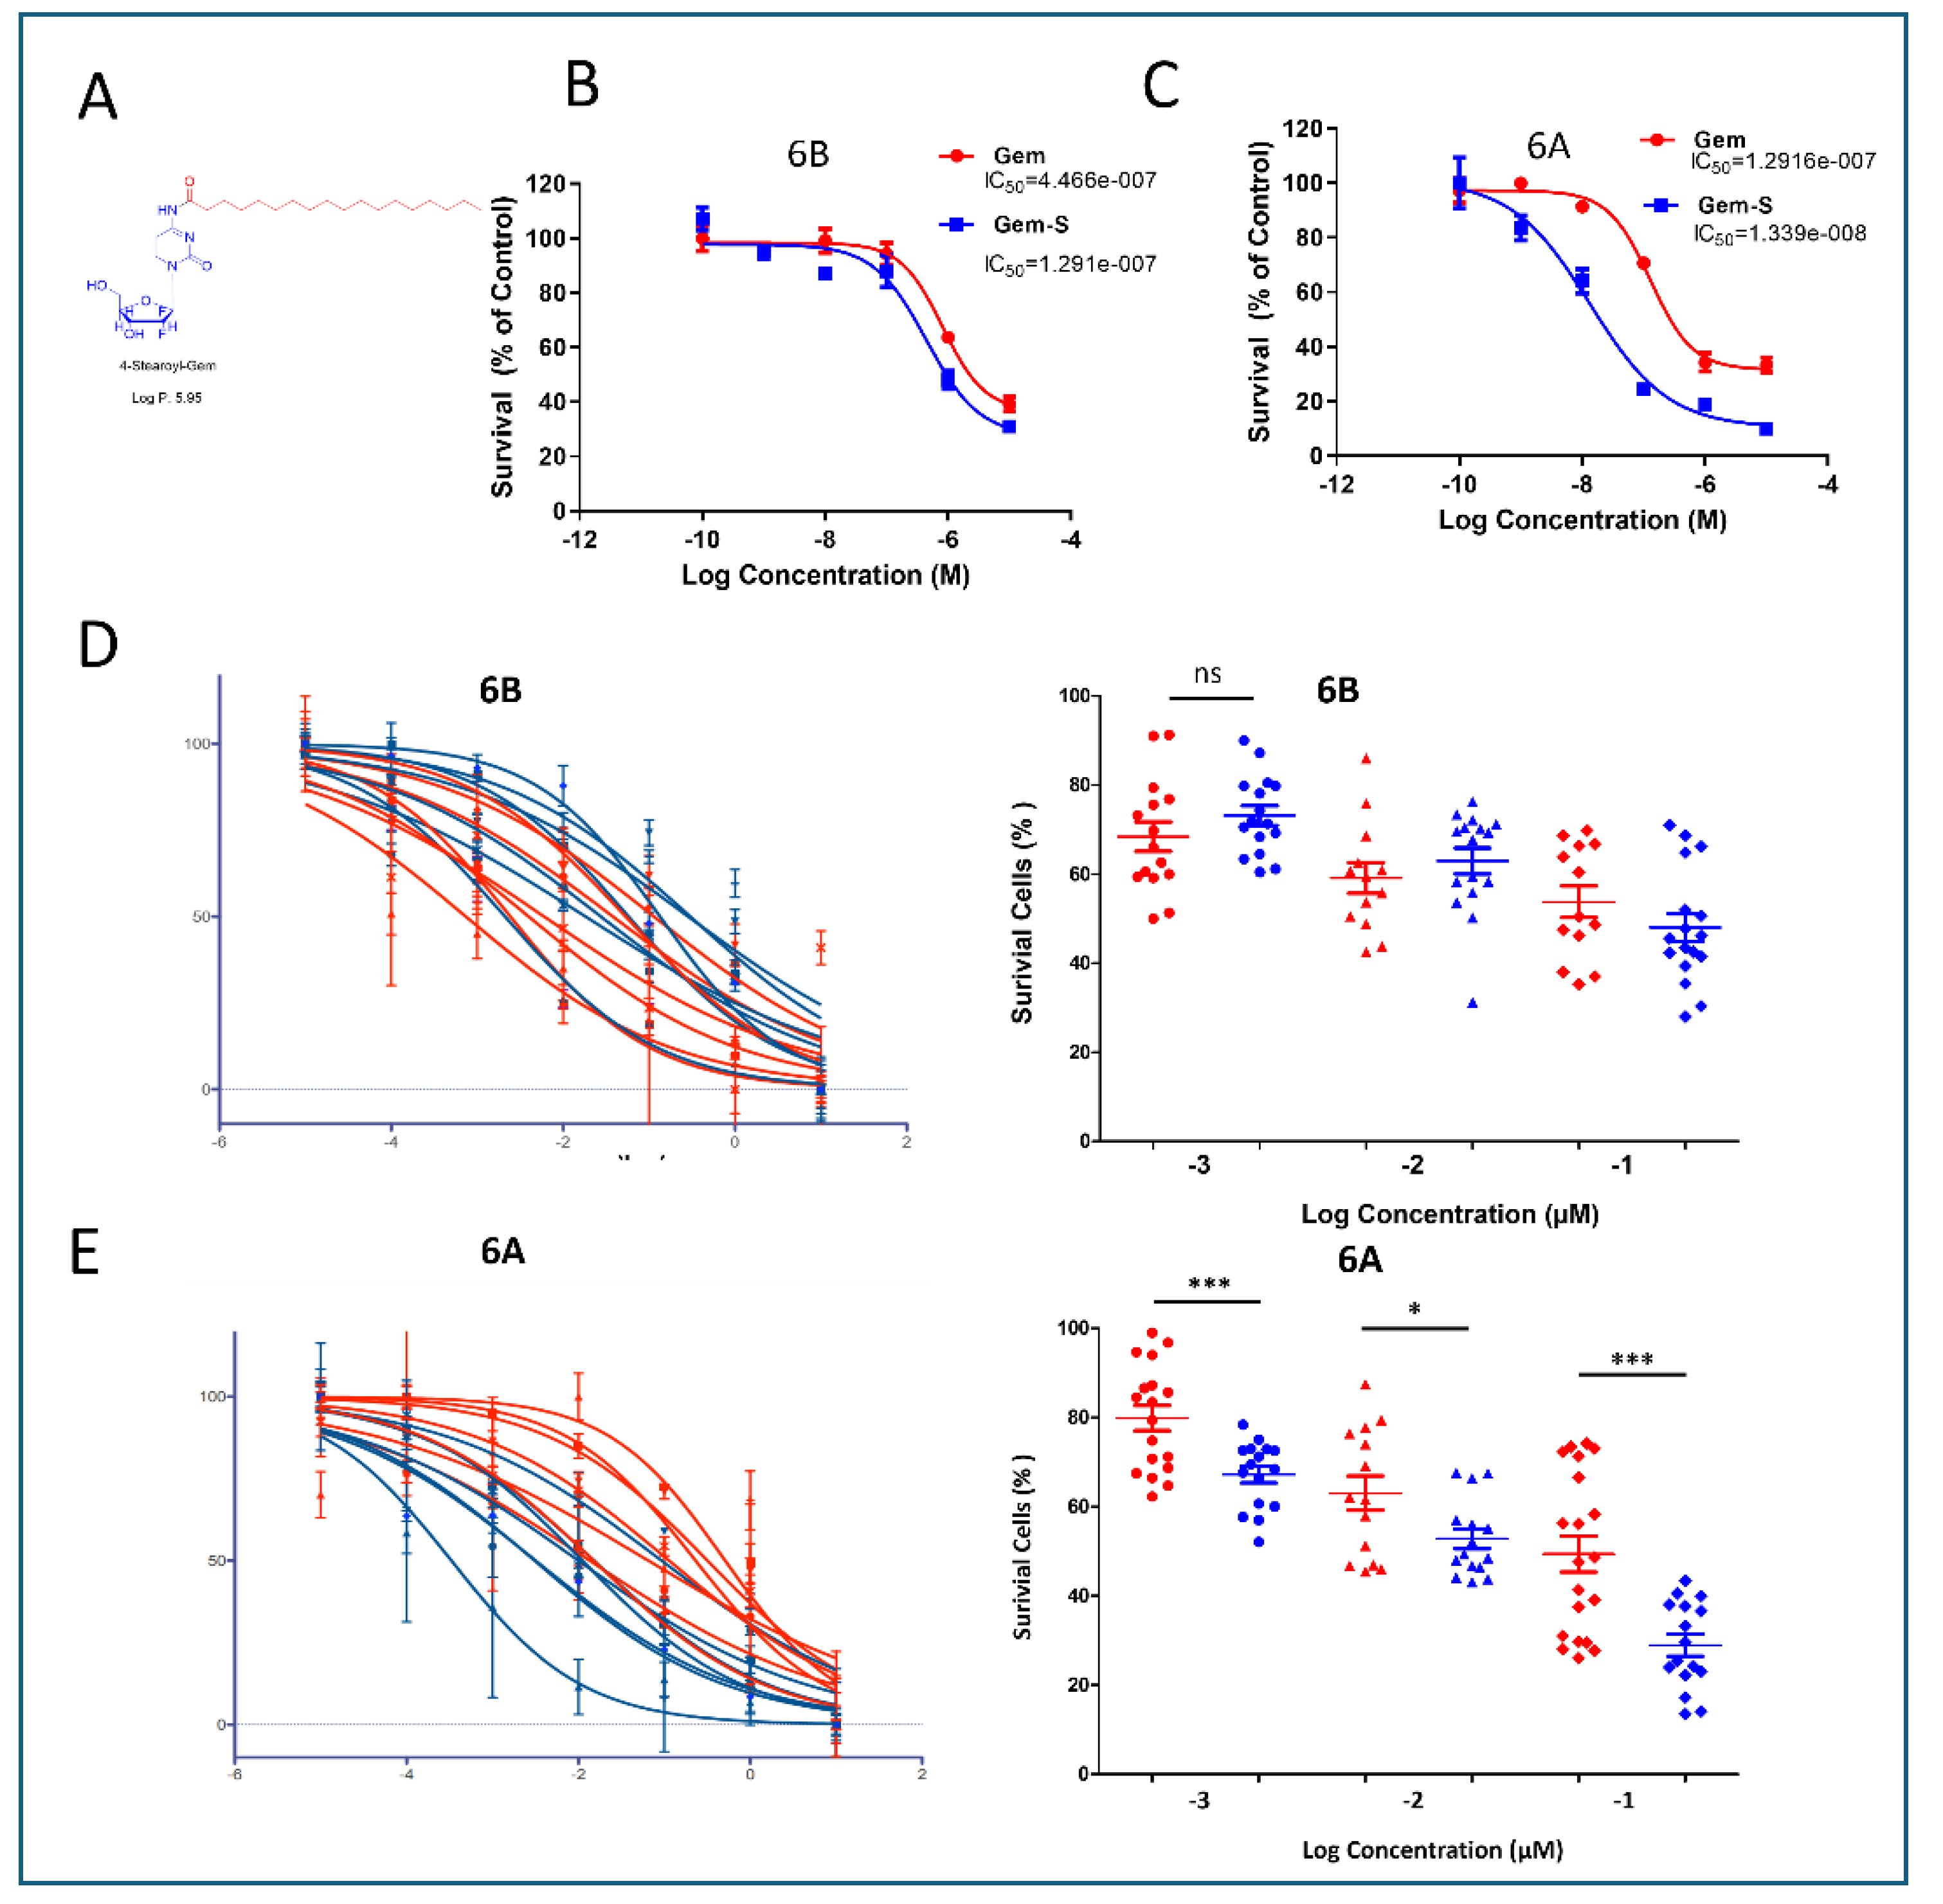
Figure 5.
Oxidative Stress Mediates Enhanced Gem-S Efficacy in Stiff Matrix Environments. (A) Visualization of reactive oxygen species (ROS) in PDOs cultured in stiff (6A) matrices following 48-hour drug exposure. Representative MitoROX fluorescence images from four independent PDO lines captured across quarter-sections of 3D droplets. Scale bar = 1000 µm. (B) Quantitative analysis of ROS levels. ImageJ-based fluorescence intensity measurements demonstrating significantly elevated ROS production in Gem-S treated organoids compared to Gem treatment (mean ± SD, ***p < 0.0001, Student’s t-test). (C-E) Differential regulation of stress response pathways and drug resistance mechanisms. RT-qPCR analysis showing drug-specific effects on HIF-1α expression (hypoxic response), NRF2 expression (antioxidant defense), and ABCC2 expression (drug efflux). Data normalized to vehicle control and presented as mean ± SEM from three independent experiments. (F-G) Antioxidant rescue experiments. (F) Representative Live/Dead fluorescence images following Gem-S treatment with or without N-acetylcysteine (NAC) co-treatment. (G) Quantification of mean fluorescence intensity (MFI) demonstrating partial rescue of cell viability by NAC in Gem-S treated organoids. Data presented as mean ± SD, *p < 0.05, **p < 0.01 by one-way ANOVA with Tukey’s post-hoc test.
Disclaimer/Publisher’s Note: The statements, opinions and data contained in all publications are solely those of the individual author(s) and contributor(s) and not of MDPI and/or the editor(s). MDPI and/or the editor(s) disclaim responsibility for any injury to people or property resulting from any ideas, methods, instructions or products referred to in the content. |
© 2024 by the authors. Licensee MDPI, Basel, Switzerland. This article is an open access article distributed under the terms and conditions of the Creative Commons Attribution (CC BY) license (http://creativecommons.org/licenses/by/4.0/).
Copyright: This open access article is published under a Creative Commons CC BY 4.0 license, which permit the free download, distribution, and reuse, provided that the author and preprint are cited in any reuse.


