
Submitted:
03 December 2024
Posted:
04 December 2024
You are already at the latest version
Abstract
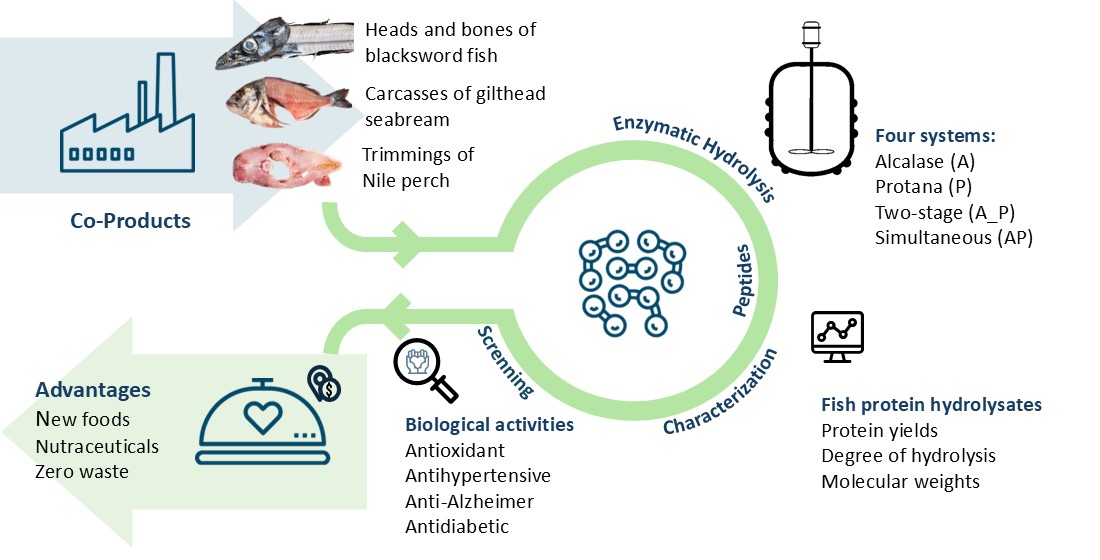
Co-products from the frozen fish processing industry often lead to financial losses. Therefore, it is essential to transform these co-products into profitable goods. This study explores the production of fish protein hydrolysates (FPH) from three co-products: heads and bones of black scabbardfish (Aphanopus carbo), carcasses of gilthead seabream (Sparus aurata), and trimmings of Nile perch (Lates niloticus). Four enzymatic hydrolysis systems were tested: an endopeptidase (Alcalase, A), an exopeptidase (Protana, P), two-stage hydrolysis with an endopeptidase followed by an exopeptidase (A+P), and a single stage with endo- and exopeptidase (AP). The results show that combined enzymatic treatments, especially single stage Alcalase and Protana (AP), achieved high protein yields (80%) and enhanced degrees of hydrolysis (41 to 61%), producing peptides with lower molecular weights. FPH exhibited significant antioxidant activity, with ABTS (2,2'-azino-bis(3-ethylbenzothiazoline-6-sulfonic acid) assays, with EC50 values below 5 mg/mL. Additionally, AP hydrolysates demonstrated over 60% ACE (angiotensin converting enzyme) inhibition at 5 mg/mL, indicating potential antihypertensive applications. The antidiabetic and anti-Alzheimer activities were present but at relatively low levels. AP hydrolysates, especially from gilthead seabream, proved to be the most promising. This study highlights the value of fish co-products as sources of functional peptides, contributing to waste reduction and potential applications in food, agriculture, and as nutraceuticals.
Keywords:
Bioactive Compounds
; Alcalase
; Protana
; Valorization
; Anti-diabetic
; Anti-hypertensive
; Anti-Alzheimer
; Antioxidant
; Molecular weight distribution
; Zero waste
1. Introduction
As 2030 approaches, concerns arise about the successful accomplishment of Sustainable Development Goals (SDGs). Conflicts, extreme weather events, environmental degradation, and economic shocks, along with the high cost of food, threaten over 40% of the world's population, who face food insecurity, and the current agri-food systems, who are extremely vulnerable to climate variability [1]. As the global population rapidly grows, expected to reach 9.8 billion by 2050, a surplus pressure is being placed on food production systems and resource management. Therefore, meeting the rising global demand for protein is crucial, especially for maintaining healthy diets for children and the aging population [2]. The increasing demand for protein, particularly from fish, has led to a surge in fish processing activities that are expected to further increase, as fisheries and aquaculture production are projected to reach 205 Mt by 2032, with most of this increase coming from aquaculture with 100 Mt [1].
While fish may be consumed fresh, the majority is processed, leading to a substantial rise in co-products generated. Fish processing industries (FPI) are significant contributors to food loss and waste (FLW), generating substantial amounts (20-80% of the fish weight) of biowaste in the form of heads, viscera, frames, and trimmings [3,4,5]. Traditionally used for animal feed or fish meal, co-product generators often fail to capitalize on their full potential nutritional and economic value [3].
To achieve sustainability, an innovative and cost-effective approach to utilize underutilized resources, such as fish processing co-products are necessary. This involves not only boosting alternative protein production but also ensuring consumer acceptance through effective communication [6]. Immediate policy changes are vital to securing affordable, nutritious, and sustainable protein sources for the future [2,6]. Although co-products are now classified as Category 3 material under European Regulation (EC) No.1069/2009, they were often overlooked in the past. However, they may hold significant economic and environmental value due to their valuable nutrient content, especially proteins (10-20% of total protein in fish) [5,7,8]. Also, their valorization contributes to the reduction of food waste, aligning with SDG 12, particularly target 12.3, which focuses on halving per capita global food waste and reducing food losses along production and supply chains.
To address the challenges of transforming co-products into high-value products, fish protein hydrolysates (FPH) emerge as a promising solution. Co-products having such high protein content (ca. 14%) enable their conversion into valuable products [8]. FPH are, by definition, the product of the cleavage of protein in fish into smaller peptides and amino acids, usually resulting in amorphous, hygroscopic powders with high protein content [9]. These hydrolysates can be obtained through various methods, including chemical hydrolysis (acid and alkaline), autolysis, microbial fermentation, and enzymatic hydrolysis [9].
While chemical hydrolysis is often used due to its low cost, enzymatic hydrolysis is preferred for its specificity and potential to preserve the nutritional value [10]. This process involves the use of proteases, such as endopeptidases and exopeptidases, that are proteolytic enzymes able to break protein chains by targeting specific peptide bonds [11]. Depending on the specificity, yields, degree of hydrolysis (DH), and functional properties desired, they can be targeted the interior or side chain of protein [9,11]. Commonly used proteolytic enzymes include Alcalase, trypsin, chymotrypsin, and papain [9,12]. Increasingly, combinations of endo- and exopeptidases are being employed to achieve specific hydrolysis outcomes [13,14,15].
FPH exhibits a wide range of functional properties, including emulsifying, foaming, gelling, and water-holding capacity, essential for their application in food systems [11]. Moreover, these hydrolysates possess valuable biological activities, such as antioxidant, anti-inflammatory, antihypertensive, and antimicrobial properties, making them desirable ingredients for functional foods and nutraceuticals [8,16,17]. By utilizing the fish processing co-products through FPH production, it is possible to tail high-value products while contributing to sustainable resource utilization.
Gilthead seabream (GB) is a highly consumed and produced fish in Southern Europe reaching 334 kt in 2022 from aquaculture production [18,19]. Black scabbardfish (BS), with 4.8 kt caught in 2022, holds a longstanding fishery tradition off the coast of Portugal, marking it as one of the oldest exploited fish species in the country [18,20]. Nile perch (NP), with a catch of 230 kt, poses challenges due to its size and the nature of its co-products [18]. Three types of co-products were used in this study: black scabbardfish heads (Aphanopus carbo, Lowe, 1839), gilthead seabream carcasses (Sparus aurata, Linnaeus, 1758) from aquaculture, and Nile perch trimmings (Lates niloticus, Linnaeus, 1758). These co-products were collected from local frozen FPI, chosen for their representativeness or the significant challenges they pose to the industry.
The research focuses on the hydrolysis process of selected fish co-products using various enzyme combinations: Alcalase 2.4L, Protana Prime, a sequential two-stage process, and a simultaneous combination of both enzymes. By utilizing co-products from resources that remain underexplored in hydrolysate production this work highlights the potential of these materials. Moreover, this study aims to evaluate the degree of hydrolysis, peptide size distribution, and various biological activities of different hydrolysates, with the objective of producing protein hydrolysates with enhanced characteristics and biological properties. Combining Alcalase with Protana, an understudied exopeptidase with debittering benefits and intense umami flavor generation, this work seeks to maximize hydrolysis efficiency provide a fresh perspective on FPH production. This approach not only offers advances in the valorization of underused marine resources, but also a sustainable solution for adopting a circular economy model for FPI.
2. Results and Discussion
2.1. Hydrolysis Process and FPH Characterization
2.1.1. Characterization of Co-Products and FPH - Proximate Composition
Processing of wild black scabbardfish (BS), farmed gilthead seabream (GB), and Nile perch (NP) generates significant co-products in local industries. From an average BS individual weighing 1.6 kg, the main co-products are the head and bones, representing 24.3% of the total fish weight. In the case of GB the average weigh of the fish is around 0.5 kg, with co-products primarily consisting of the carcass, making up 52.5% of it. As for NP, the co-products may have a significant expression. In the Portuguese industry, they mainly include trimmings, which represent approximately 1.6% of the processed fish. With around 1400 kg of fish processed daily, this equates to roughly 23 kg of trimmings per day.
The proximate composition of raw materials (RM), BS heads and bones, GB carcasses, and NP trimmings, is detailed in Table 1. NP showed the highest protein content (19.3 ± 0.3%), followed by GB (16.5 ± 0.6%) and BS (14.3 ± 1.9%). GB had the highest fat content, whereas the fat levels of BS and NP were similar. Moisture content was comparable in BS and NP, but significantly lower in GB. Ash content was highest in BS (6.9 ± 0.4%), followed by GB (5.3 ± 0.0%) and NP (2.4 ± 0.16%). These values align with reported values of by-products from these species [19,21,22].
Enzymatic treatments applied to the co-products triggered significant alterations in proximate compositions, particularly in increasing protein content, resulting in FPH with average protein values of around 72%. The protein found in FPH produced was consistent with those reported in the literature, which typically ranges from 60% to 91% [19,22,23]. The highest protein content was found in FPH produced from NP trimmings, which aligns with reports showing high protein content in hydrolysates from Nile perch [22,24]. Likewise, hydrolysates from gilthead seabream and black scabbardfish were also similar to values reported in literature, i.e. 73% and 76[19,21]. Concerning the protein content variation following enzymatic treatments, it is important to note that using different combinations of enzymes (A, P, A+P, AP) results in notable differences in the resulting FPH from the same raw material. This finding is consistent with prior research, emphasizing the significant impact of employing various enzyme combinations during enzymatic treatments on protein content [23]. Fat content consistently decreased with enzymatic treatments, resulting in a product with reduced lipid levels, averaging 5% fat, whereas in the BS with A + P, the fat content was only 0.5%. This trend is supported by previous reports where fat values in hydrolysates ranged from 0.2% up to 25% [22,23]. Ash content increased after the enzymatic treatment due to the pH adjustment during hydrolysis process, particularly in those under alkaline conditions. Significant differences in protein, fat, moisture, and ash contents were observed among treatments, emphasizing the biochemical diversity of the fish co-products and the influence in enzymatic hydrolysis. These results demonstrate that enzymatic hydrolysis effectively enhances protein content and produces a product with reduced fat from fish co-products.
2.1.2. Evolution of Degree of Hydrolysis and Yields
Alcalase 2.4L (A) was initially considered due to its versatility and widespread industrial application as a producer of small bioactive peptides [25]. Combining this enzyme with others can enhance its potential, particularly when involving an exo-peptidase, as endopeptidases, such as Alcalase, create a variety of peptide lengths that can be a good substracte for exo-peptidases [26]. As so, introducing Protana prime (P) into the system to achieve a higher degree of hydrolysis, enhance the quantity of amino acids released and operate at milder temperatures and pH levels [27]. Analysis of the DH in function of hydrolysis time revealed that while the hydrolysates generated through sequential enzymatic treatment with Alcalase followed by Protana (A + P) and those obtained through combined Alcalase and Protana treatment (AP) exhibited different profiles, they consistently displayed an increasing DH regardless of the raw materials used. This trend is exemplified in Figure 1, which presents the hydrolysis curves for gilthead seabream carcass subjected to these enzymatic treatments.
Tailoring enzyme selection to specific raw materials is essential. It has been observed that GB benefits most from the AP treatment, while NP and BS generally had better yields with A + P treatment. The addition of a second enzyme resulted in higher DH as shown in Table 2. During the first 20 min of hydrolysis a rapid increase in the DH was observed (Figure 1). After this period the DH of FPH with A + P remained stable until 180 min, while in the case of FHP prepared with AP the DH increased considerably up to 180 min. The addition of Protana in FPH A + P experiences a renewed boost, leading to a new phase of rapid increase that ends up plateauing in the final phase. These observed profiles are consistent with typical enzymatic reactions carried out in two steps, as reported by García-Moreno and co-authors [23]. A similar behavior was also observed for the hydrolysates prepared with BS and NP (data not shown).
At 180 min the DH ranged from 8.5% to 50.8% (Table 2). Lower DH values were observed in hydrolysates produced using a single enzyme, particularly those using Protana. As an exopeptidase acting alone, these values were expected since it only acts at the extremities of peptides [26]. When examining the DH of FPH prepared with AP, these consistently revealed higher values, and the maximum DH was observed with GB (50.8%). This aligns with the literature and may indicate that hydrolysis substantially benefit from the synergistic action both of enzymes [27]. It is worth noting that this enzyme combination has previously demonstrated the ability to achieve higher hydrolysis degree values, albeit not in this specific type of RM (i.e. chicken hydrolysates) [28]. However, when the reaction time was extended to 360 min, this trend was reversed, resulting in A+P hydrolysates with even higher degrees of hydrolysis, reaching values ranging from 45.0% to 61.4%.
Similarly to the observed with DH, also during the first hour of hydrolysis, the yield (Yh), had a significant increase (Figure 1). After that, the Yh slightly increased, attaining relative stability at 180 min. In contrast, the FPH with A + P samples experienced a minor additional increase at the 180 min mark. At the end of the hydrolysis process the Yh ranged from 3.4% to 18.8%. Notably, the two-enzyme system (A + P), with GB attained the highest yield. Regarding the protein yield (Yp), the results indicated that combined treatments (A + P and AP) typically resulted in significantly higher protein yields across all fish co-products, meaning that protein conversion is higher with enzyme combinations as expected [27]. The highest yields were observed in NP and GB with AP, with a maximum of 80% protein conversion. Single treatments (A or P) produced variable results, with A generally outperforming P. When compared to other studies in the field using similar raw materials, the yields obtained in this study fell within the expected range (20.3 – 57.5%), though in some treatments, they were slightly higher [8,19,21].
2.1.3. Molecular Weight
The methodology used in this study focused primarily on the FPH fraction with the lowest molecular weights, excluding molecules with a weight over 10 kDa. Gel filtration chromatography profiles of hydrolysate samples were similar and indicated extensive hydrolysis of fish proteins, resulting in mainly small peptides (<1000 Da) and free amino acids.
When considering the distribution of molecular mass, it was evident that most of the molecular weight falls within the range of 500-100 Da representing an average of 53-54% for the FPH of BS and GB, and 74% for NP, regardless of the enzyme used. It's worth noting that in NP hydrolysates, 7% of the compounds had a molecular weight below 100 Da, compared to 13% and 15% in BS and GB, respectively. In terms of molecular weights, the FPH can be ranked as follows: NP > BS > GB with Nile perch hydrolysates containing the greatest percentage of high molecular weight compounds. This was expected because higher degrees of hydrolysis (GB and BS) are associated with FPH containing higher proportions of smaller peptides [8]. Similar results were obtained by Batista and co-authors reporting that most peptides from enzymatically hydrolyzed black scabbardfish had molecular weights below 1000 Da [21]. In the case of GB, available data indicate that approximately 17.6–28.5% of peptides fall below 200 Da in hydrolysates prepared with Alcalase, which aligns with the values obtained in this study [19]. Conversely, for NP hydrolysates, Wasswa and collaborators found a lower proportion (51.8%) of peptides below 500 Da [22]. These discrepancies across studies are likely due to differences in enzyme selection, reaction time, and hydrolysis conditions [8,29].
The use of different enzymatic treatments leads to unique patterns of protein fragmentation in different raw materials (Table 3).
Specifically, Alcalase tends to form smaller peptides, especially in NP, where a significant amount (68.3%) of intermediate peptides (500-100 Da) was observed. When Alcalase and Protana are used together or sequentially, a wider range of protein fragment sizes is produced, resulting in a more balanced distribution across different molecular weight ranges. These combined approaches were particularly effective in producing smaller peptides (<100 Da) in BS and GB, indicating a continuous hydrolysis process.
The Figure 2 illustrates the changes in GB hydrolysates as example, highlighting the progressive evolution of molecular mass distribution over time during enzymatic treatments with AP.
Initially, larger protein fragments (>1000 Da) are predominant, however as the hydrolysis proceeds, these high-molecular-weight fractions decrease, and smaller peptides become more prominent. By the middle point (180 min), there is a noticeable shift towards smaller fragments, particularly in the 500-100 Da range, as seen in NP and GB. By the end of hydrolysis, the majority of peptides were within the smaller ranges (500-100 Da and <100 Da), indicating that prolonged hydrolysis effectively breaks down larger proteins into smaller peptides. This time-dependent breakdown is most evident in treatments with both Alcalase and Protana, where sequential hydrolysis results in a more even distribution of small and intermediate peptides by the end of the reaction.
2.2. Antioxidant Activity
The antioxidant activities of all FPH were evaluated through DPPH and ABTS radical scavenging assays by calculating the half-maximal effective concentration (EC50). Additionally, reducing power was assessed by comparing the concentration needed to achieve an absorbance of 0.5 (Abs = 0.5).
For DPPH scavenging, enzymatic treatments exhibited varying levels of effectiveness within FPH produced (Figure 3), revealing no clear pattern. The best result was obtained with BS using Protana (P), with an EC50 of 2.23 ± 0.09 mg/mL. Similar values were observed in GB treated with Alcalase and NP with Protana. Regarding enzyme combinations, A + P yielded the best results in BS and NP, with the scavenging capacity improving between 180 min (data not shown) and 360 min. This supports the idea that prolonged enzymatic treatment can enhance radical scavenging efficiency as more peptide bonds are cleaved, leading to more efficient radical scavenging over time [21]. Furthermore, the addition of another enzyme in the system in a second stage may lead to an increase in radical scavenging capacity as reported in the literature [23]. The simultaneous use of Alcalase and Protana (AP) demonstrated less efficient DPPH scavenging, though improvements were observed with longer reaction times. FPH from GB with AP had the lowest EC50 value at 180 min (3.68 ± 0.2 mg/mL), which further decreased to 3.24 ± 0.23 mg/mL at 360 min. However, despite these enhancements, the results remained different than previously reported findings for FPH of gilthead seabream, where the scavenging activity reached around 50% at a concentration of 1.44 mg/mL [19]. Among the raw materials tested, BS and GB exhibited the most effective DPPH scavenging activity, with generally lower EC50 values than NP hydrolysates. Although the results for all FPHs varied substantially, they fell within the expected range of DPPH values reported in the literature. Several authors have documented EC50values ranging from 1 to 10 mg/mL, with some studies reporting even values below 0.3 mg/mL [8,30,31,32]. Such differences are mainly attributed to variations in hydrolysis conditions and refining processes thus, significant variability in the outcomes are expected, given the diverse treatments methods used [23].
The ABTS scavenging activity in BS samples with AP treatment had the lowest EC50 at 180 min (2.85 ± 0.19 mg/mL), which slightly increased to 3.04 ± 0.16 mg/mL at 360 min. The A+P treatment showed similar trends but in slightly higher concentrations as seen in the Figure 3. The opposite was observed in the GB and NP samples where the ABTS scavenging activity was higher at 360 min (lower concentrations of EC50). A+P and AP treatments had similar values of EC50 within the same raw materials except in GB, where a distinction was observed between A+P and AP, with the latter being higher. The ABTS scavenging capacity was more consistent for all FPH samples, with EC50 values ranging from 1.71 to 3.74 mg/mL. The values achieved in this study were consistent with those reported for hydrolysates of by-products from Cape hake and salmon using Alcalase, which ranged from 2.1 to 2.4 mg/mL. Additionally, they align with results from various FPH, where concentrations ranged between 1.12 and 4.93 mg/mL. [8,31]. Furthermore, FPH treated only with Protana consistently underperformed, with EC50 values ranging from 4.49 ± 0.10 mg/mL to 12.36 ± 0.81 mg/mL, suggesting that Protana may not be as effective in enhancing ABTS scavenging compared to other enzyme treatments.
The DPPH• radical is stable in lipophilic media, while the ABTS•+ radical is stable in water-based solutions, but both are used to measure the presence of hydrogen atoms or electron-donating substances [33,34]. During hydrolysis, smaller peptides and individual amino acids were produced based on the specificity of enzymes involved as previous discussed. The results showed that Protana hydrolysates were more effective in capturing the DPPH•, suggesting the presence of less water-soluble peptides, formed by exposure of hydrophobic regions in the proteins [35]. However, when Alcalase introduced into the system, was an overall improvement in the ability to capture the ABTS•+ was obtained, indicating a possible formation of more hydrophilic peptides with this enzyme.
The reducing power assay typically involves the reduction of ferric ions (Fe³⁺) to ferrous ions (Fe²⁺) [36]. This assay (Figure 3) revealed that GB hydrolysate presented higher RP capacity, requiring an average of 9.81 mg/mL to reach 0.5 in absorbance, compared to 10.98 mg/mL for BS and 12.69 mg/mL for NP. The results obtained were within the same range as the findings reported in previous research [8,37]. For instance, an A0.5 value of 15.0 mg/mL was obtained for Cape hake protein hydrolysates, while A0.5 values ranging from 10.0 to 31.25 mg/mL were observed in FPH prepared from various discarded species and by-products [23,38]. In contrast, lower values, ranging from 3.19 to 6.35 mg/mL, have been documented for different hydrolysates derived from fish and fish parts [31]. In this study, for BS, the FPH with A + P treatment had the lowest reducing power at 180 min (12.73 ± 0.41 mg/mL) with minimal change over time. However, the AP treatment although similar in the initial phase, showed a higher reducing capacity which switched from 12.20 ± 0.09 mg/mL to 9.01 ± 0.34 mg/mL. GB hydrolysates treated with AP for over 360 min exhibited stronger reducing power (7.84 ± 0.08 mg/mL) compared to those treated with P. The others GB hydrolysates exhibited similar values of approximately 10 mg/mL. As for NP, reducing power decreased significantly with both A + P and AP treatments over time, showing a different behavior from its analogs FPH. Like in DPPH activity, FPH prepared with Protana showed the best results in the reducing power assay. The results also indicated that the simultaneous application of Alcalase and Protana (AP) generally enhanced the antioxidant properties of FPH. Among the raw materials, GB consistently exhibited the highest antioxidant activity. Regarding the influence of reaction time, the results were inconclusive, contrasting to some studies that concluded that antioxidant activity increases with a higher degree of hydrolysis [21,23].
2.3. Metal Chelating Activities
The capability to interact with transition metals such as copper and iron is, also as well, an important indicator of antioxidant activity. Transition metal ions, such as Fe²⁺ and Cu²⁺, catalyze the formation of reactive oxygen species, like the hydroxyl radical, which induce lipid peroxidation [23,39,40,41]. On the other hand, the chelation of these metals is extremely important to promote their absorption [42]. In the iron chelation assays, the EC50 values wide ranged as showed in the Figure 4a. For example, the EC50 value was 2.40 ± 0.04 mg/mL when using NP and AP, while it was nearly ten times higher when BS and P was used. The Protana hydrolysates performed poorly in this analysis, with all the raw materials showing lower effectiveness or producing values that did not allow the calculation of EC50.
The study found that in general, hydrolysates from BS had the lowest iron chelating activity. When Alcalase and Protana (AP) were used, the EC50 decreased from 5.59 ± 0.26 mg/mL to 4.24 ± 0.26 mg/mL over 360 min, indicating enhanced chelation capacity as the reaction progressed. However, the A + P treatment resulted in a significant decrease in chelation efficiency (16.66 ± 0.83 at 360 min). GB and NP hydrolysates showed the highest iron chelation activity with AP yielding the lowest EC50 values (2.79 ± 0.07 and 2.40 ± 0.08 respectively). The results obtained were comparable to the reported by Naghdi and co-authors, which found that FPH from tuna processing by-products exhibits iron chelating activity that increases with dosage, achieving 30-55% chelation at 4 mg/mL [41]. AP hydrolysates demonstrated high effective chelation, but their EC50 values were considerably higher from those reported in studies of Pires and collaborators and Henriques and co-authors, where EC50 values ranged from 0.26 to 0.53 mg/mL [8,31].
Concerning the copper chelation activities (Figure 4b), Protana hydrolysates had a behavior similar to that observed in the chelating activity of iron. In the remaining hydrolysates (i.e., A, A+P, and AP), EC50 concentrations are very similar, always presenting values below 1 mg/ml. However, GB hydrolysate produced with AP, achieved the lowest EC50 value (0.47 ± 0.01 mg/mL). These values were considerably lower than those presented in the literature, where introduces a range between 2.49 and 5.66 mg/mL in FPH were obtained from different by-products [31]. Nevertheless, some studies on FPH from salmon heads and Cape hake by-products mention similar results around 0.64 mg/ml [8].
In the chelating activities, the results indicate that the sequential application of Alcalase and Protana (AP) tends to enhance both iron and copper chelation activities. Notably, the hydrolysates studied were far more effective in copper chelation activity than in iron chelation activity. Some researchers have proposed that the rise in metal chelating activity is related with the increased DH. Low molecular weight peptides have stronger charges, particularly in carboxyl groups, and higher mass-to-charge ratios, enabling them to participate more effectively in metal complexation [41].
2.4. Biological Activities
Fish protein hydrolysates were tested for their biological activities to determine their potential as antidiabetic, anti-Alzheimer's, and antihypertensive agents. The activities were established based on their ability to inhibit α-amylase and α-glucosidase for antidiabetic activity, acetylcholinesterase (AChE) for anti-Alzheimer activity, and angiotensin-converting enzyme (ACE) for antihypertensive activity. AChE, and α-glucosidase inhibition percentages were measured at concentrations of 50 mg/mL, ACE inhibiton was tested at 5 mg/ml and α-amylase activity was determined using the half-maximal inhibitory concentration (IC50). The results (Figure 5) highlight the differences between enzymatic treatments and raw materials.
Both α-Amylase and α-glucosidase are essential for glucose metabolism. α-Amylase aids in digestion by breaking down dietary starch into oligosaccharides, whereas α-glucosidase breaks down disaccharides into glucose for absorption [35]. Thus, inhibition of these enzymes is an effective strategy for managing glucose levels in organisms. In the α-amylase inhibitory assay (Figure 5), IC50 values were only determined in some samples, as BS (A), BS (P) and NP (P) FPH did not reach the IC50, plateauing at lower inhibition percentages. Nevertheless, these FPH showed a concentration-dependent inhibitory effect, which is consistent with previous studies [8]. GB hydrolysates treated with Alcalase and Protana (AP) exhibited an IC50 of 23.86 ± 3.52 mg/mL at 180 min (data not shown), which increased to 26.58 ± 12.83 mg/mL at 360 min. This treatment produced the higher α-amylase inhibitory activity, along with NP hydrolyzed with A+P, although the differences were not statistically significant (p>0.05).. For NP hydrolysates, α-amylase inhibition was observed, with a notable result of 25.36 ± 5.4 mg/mL in the A+P treated samples at 360 min. The inhibition of α-amylase using 20 mg/mL of FPH prepared with various enzymes (Alcalase, papain, and pepsin) has been reported to range from 16.61% to 45.71% [35]. These results are similar to those obtained in this study, where 50% inhibition was observed at concentrations of 23–26 mg/mL. Other studies have reported IC50 values spanning a broad range from 5.70 to 84.37 mg/mL[31].
The α-glucosidase inhibition (Figure 5) varied significantly between the different fish co-products with BS hydrolysates presented the highest α-glucosidase inhibition and GB the lowest. In the case of BS, the use of A+P and AP resulted in an enhanced inhibition of 77.76 ± 4.62% and 74.3 % ± 3.17%, respectively. For GB, all treatments showed limited α-glucosidase inhibition, yet AP treatment provided the highest inhibition (21.83% ± 0.51%). As for NP, the highest α-glucosidase inhibition was observed in the FPH prepared with A (38.42 ± 1.13%) and AP (35.14 ± 4.35%) treatments. FPH has been reported to have a weak inhibitory effect on α-glucosidase [35]. Values above 100 mg/mL in IC50 were expected according to the results reported by Henriques and co-authors for FPH produced with Alcalase from several discarded fish and by-products [31]. Amini Sarteshnizi and collaborators referred a maximum 16.66% inhibition at 20 mg/mL of FPH from Sardinella produced with Alcalase [35].
Similarly to the observed in α-glucosidase inhibitory activity, the AChE inhibitory activity also showed limited in the produced FPH, as shown in Figure 6. The highest inhibition was observed in the GB hydrolysate when treated with the simultaneous AP, reaching over 50% inhibition, followed closely by a similar result in NP with A. Concerning the BS FPH, only hydrolysates prepared with Alcalase inhibited AChE, reaching 17.69 ± 1.26% with 50 mg/mL. GB hydrolysates demonstrated inhibition levels of 31.73 to 54.15%, while NP hydrolysates showed inhibition ranging from 40.04 to 49.65%. AChE inhibition levels observed in this study align with previous findings, although variations in inhibition can be noted depending on hydrolysis conditions. Indeed, AChE activity inhibition has been reported to range from 18.11 to 40.45% with FPH prepared from tilapia with Alcalase at concentration of 50 mg/mL [43]. Conversely, for anchovy hydrolysate prepared with Alcalase, papain, and pancreatin, FPH concentration ranged from 100 to 400 mg/mL resulting in inhibition percentages between 11.78% and 60.65% [44]. Similar to most studies on AChE inhibitory activity of FPH, none of the hydrolysates analyzed in this study exhibited particularly strong inhibition potential against AChE [43,44].
ACE inhibition had similar values in all FPH, with inhibition levels above 50%, except for those prepared using Protana (Figure 6). The results with BS indicated that neither the A+P nor the AP treatments led to an increase in activity compared to the enzymatic treatment with Alcalase alone. GB hydrolysates with AP had the highest ACE inhibition (78.12 ± 0.69%), however this value was not significantly different from that obtained in FPH with A (66.42 ± 4.65%). For NP, A was highly effective (76.32 ± 5.25%), but its inhibition decreased with the addition of Protana (A+P), resulting in 64.65 ± 3.58% inhibition. The ACE inhibition results from the current study align with prior research, although with slight differences in inhibition levels that can be attributed to variations in protein sources [31]. Pires and co-authors reported an IC50 of 0.86 to 2.2 mg/mL for Alcalase hydrolysates that exhibited ACE inhibitory activity in a concentration-dependent manner, directly comparable to the three FPH prepared with A in the present study, which displayed an inhibition between 66.30 to 76.32% [8]. Furthermore, other FPH obtained from various discarded fishes and by-products showed similar ACE inhibitory activity (61.20–85.95%) at 5 mg/mL, to that reported in this study [31]. ACE inhibitory activity in freshwater carp hydrolysates showed inhibition ranging from 43% to 71% at 5 mg/mL, depending on the enzyme specificity and degree of hydrolysis [45]. These authors suggested that higher enzyme specificity could contribute to higher inhibition, highlighting how enzyme type, substrate, and hydrolysis conditions create peptides with varying molecular weights and amino acid profiles, which significantly influence ACE inhibition [31,45].
3. Materials and Methods
3.1. Raw Materials
Frozen co-products generated during the portioning of fish within frozen fish processing industries served as raw material for this study. Artesanal Pesca Lda. (Sesimbra, Portugal), provided the heads and bones of wild black scabbardfish (Aphanopus carbo) after filleting. Vivid Food, Lda. (Vila Nova da Barquinha, Portugal), supplied the carcass of gilthead seabream (Sparus aurata) from aquaculture obtained after filleting. The trimming of Nile perch (Lates niloticus) was obtained from GelPeixe Lda. (Lisboa, Portugal). The co-products were received frozen, and after thawing, the material was crushed and homogenized using an industrial meat grinder (HOBART, USA) and knife mill grinder (Grindomix GM200, Retch GmbH, Haan, Germany). Next, the material was vacuum packed and stored at -20°C until further utilization.
3.2. Chemicals and Reagents
Food-grade Alcalase 2.4L® and Protana Prime® were generously provided by Novozymes (Bagsvaerd, Denmark). o-Phthaldialdehyde (OPA), 3-(2-pyridyl)-5,6-bis(4-phenyl-sulfonic acid)-1,2,4-triazine (ferrozine), 2,2-azinobis-(3-ethylbenzothiazoline-6-sulfonic acid (ABTS), 2,2-diphenyl-2-picrylhydrazyl (DPPH), cytochrome c from bovine heart, hexaglycine, triglycine, glycine, α-Amylase from porcine pancreas (EC 3.2.1.1), α-Glucosidase from Saccharomyces cerevisiae (EC 3.2.1.20), Acetylcholinesterase from electric eel (EC 3.1.1.7), Angiotensin Converting Enzyme (ACE) from rabbit lung (EC 3.4.15.1), Acarbose, Berberine, Captopril, Hippuryl-l-histidyl-leucine (HHL) and Hippuric acid (HA) were purchased from Sigma-Aldrich (St Louis, MO, USA). Ethylenediaminetetra-acetic Acid (EDTA) standard certified for nitrogen calibration was purchased from LECO Corporation (St Joseph, MI, USA). Ribonuclease A from bovine pancreas and aprotinin from bovine lung were purchased from Cytiva (Washington, D.C., EUA). All other chemicals used were of analytical grade.
3.3. Proximate Composition
Ash and moisture content of the different raw materials and fish protein hydrolysates (FPH) were analyzed according to AOAC standard methods [46]. Protein content was determined using an FP-528 LECO nitrogen analyzer (LECO, St Joseph, MI, USA) calibrated with EDTA (nitrogen = 9.57 ± 0.03%) according to the Dumas method [47]. The lipid content was measured using the Folch methodology described by Sapatinha co-authors [48].
3.4. Enzymatic Hydrolysis
The enzymatic hydrolysis experiment was conducted at a lab scale using two proteolytic enzymes, Alcalase, an endoprotease, and Protana, an exoprotease. Both enzymes were tested individually as well as in combination as represented in Figure S1, using simultaneous and two-stage addition methods. The reaction was carried out in a 5L glass reactor with controlled pH and agitation at 300 rpm, using a 1:2 ratio of raw material to distilled water. The pH, time, temperature, and enzyme ratio used in the reaction are displayed in Table 4. The enzymatic settings were selected based on the optimum operating conditions recommended by Novozymes for maximum enzyme activity [27,49].
Aliquots of 100 mL were collected at different intervals during hydrolysis (5, 10, 20, 30, 45, 60, 90, 120, 150, 180, 185, 190, 200, 210, 225, 240, 270, 300, 330, 360 min). For hydrolysis performed with the two enzymes (AP), after the first hour of hydrolysis, samples were collected every 30 min. The hydrolysates were inactivated at 90°C for 10 min, cooled and centrifuged (10000 g, 20 min, 4 °C). The supernatant with free fat and aqueous hydrolysate was recovered and separated by decantation. The final FPH were freeze-dried and stored at -20°C until further analyses.
3.5. Fish Protein Hydrolysates Characterization
3.5.1. Yields
The hydrolysis and protein yields of different hydrolysis processes were calculated using the following equations [8]:
In these equations, Wf represents the weight in grams (dw) of the FPH, and Wi is the weight in grams (dw) of the raw material. Similarly, Pf is the total protein content (in grams) of FPH and Pi is the total protein content (in grams) in the raw material.
3.5.2. Degree of Hydrolysis (DH)
To determine DH, the o-phthalaldehyde (OPA) method outlined by Nielsen and co-authors was employed [50]. The assay was carried out at room temperature. Four hundred microliters of samples (0.5 mg/mL) were added to 3 ml of OPA solution. The mixture was incubated for 2 min, and the absorbance was read at 340 nm using an Evolution 201 UV-Visible Spectrophotometer (Thermo Scientific, Waltham, MA, USA). A blank was prepared using distilled water. A control with serine 0.1 mg/mL was also prepared likewise. The degree of hydrolysis was calculated using the following formula:
where AbsSample is the absorbance of FPH, Absblank is the absorbance of the blank, AbsSerine is the absorbance of the serine solution, W is the weight in grams of hydrolysate, and N is the total nitrogen content (%) of FPH.
3.5.3. Molecular Weight Distribution (MWD)
The molecular mass distribution of the different FPH was determined using gel filtration chromatography on a FPLC ÄKTA system (Amersham Biosciences, Uppsala, Sweden) with a Superdex Peptide 10/300 GL column and a UV detector at 254 nm. The samples were filtered (0.22 µm) and loaded into a 100 µL loop. The eluent consisted of 30% acetonitrile with 0.1% trifluoroacetic acid at a flow rate of 0.5 ml/min. A molecular mass calibration curve was generated using the following standards: ribonuclease A (13700 Da), cytochrome C (12384 Da), aprotinin (6500 Da), angiotensin I (1296 Da), hexaglycine (360 Da) triglycine (189 Da), and glycine (78 Da). The molecular weight distribution of the peptides was estimated by dividing the area of each identified peak by the total area of all peaks [8].
3.6. Determination of Antioxidant Activity
3.6.1. DPPH• Radical Scavenging Activity
To determine antioxidant activity, FPH samples were prepared at concentrations ranging from 0.5 to 20 mg/mL in water. To determine DPPH radical scavenging the method of Shimada and co-authors was employed with adjustments and using an Evolution 201 UV-Visible Spectrophotometer (Thermo Scientific, Waltham, MA, USA). A control sample was prepared, using Milli-Q water instead of the FPH solution [8,33,51].
3.6.2. ABTS•+ Radical Scavenging Activity
3.6.3. Reducing Power (RP)
3.7. Metal Chelating Activities
3.7.1. Cu2+ Chelating Activity
3.7.2. Fe2+ Chelation Activity
The determination of iron chelating activity was tested at concentrations ranging from 0.5 to 20 mg/mL were tested. The methodology used was undertaken according to the method described by Decker and Welch, with the modifications presented in Pires et al. and using a control prepared with distilled water instead of the sample solution [8,39].
The percentage inhibition of each antioxidant and chelating activities, previously described was calculated according to the following equation:
where Abssample and Abscontrol correspond to the absorbance of the sample and the control, respectively. The EC50 value was determined for each hydrolysate, and all measurements were performed in triplicate. The results are presented as mean values ± standard deviation.
3.8. Determination of Biological Activity
3.8.1. α-Amylase Inhibitory Activity
For α-amylase inhibitory activity a concentration-dependent effect was tested for all FPH. The samples were prepared at concentrations ranging from 10 to 100 mg/mL in 0.1% dimethyl sulfoxide (DMSO). The enzyme substrate, starch dyed with Remazol Brilliant Blue R, was boiled in 1% in Tris-HCl buffer for 5 min and then cooled. The assay was initiated by adding 200 µL of the sample to 100 µL of porcine pancreatic α-amylase (PPA) prepared at 0.1 U/mL. in 0.5 M Tris-HCl buffer with 0.01 M CaCl₂ and pH 6.9 (A). After pre-incubation at 37°C for 20 min with shaking, 100 µL of the dyed starch substrate was added, followed by incubation (37°C for 10 min with shaking). The reaction was stopped by adding 500 µL of 50% acetic acid. The mixture was then centrifuged (5000 rpm, 5 min), and the absorbance of the supernatant was measured at 595 nm using an Evolution 201 UV-Visible Spectrophotometer. Simultaneously, a negative control (0-) was prepared by replacing the sample with 0.1% DMSO and the enzyme with a buffer. A positive control (0+) was obtained by substituting the sample with 0.1% DMSO. Blank (B) was prepared for each sample by changing the enzyme by buffer. All other non-mentioned steps were unchanged [8,53].
3.8.2. α-Glucosidase Inhibitory Activity
The α-glucosidase inhibitory activity was assessed by testing the FPH prepared at 50 mg/ml in potassium phosphate buffer (0.1M, pH6.9). The FPH solution was pre-incubated with 100 µL α-glucosidase (0.25 U/mL) at 37°C for 30 min. Following pre-incubation, 50 µL of p-NPG (5 mM, p-nitrophenyl–α-D-glucopyranoside in buffer) was added. The samples were incubated at 37°C for 5 min, and the absorbance was measured at 415 nm using a microplate reader (Bio Rad Model 680, Hercules, CA, USA). Similar to the previous inhibitory activity, a negative control (0-) was prepared by replacing both the sample and enzyme with buffer. A positive control (0+) was also prepared by replacing the sample with buffer. A blank was also prepared for each sample by exchanging the substrate with buffer. All other steps remain unchanged, unless specified otherwise. Higher concentrations could not be tested because of the solubility limitations of the hydrolysates in this assay, which prevented the preparation of higher concentrations needed to measure the IC50 for this activity [54].
For both α-glucosidase and α-amylase inhibitory activity assays, acarbose was used as a standard commercial inhibitor, at a concentration of 10 mg/mL. The assays were performed in quadruplicate and the results are presented as mean values ± standard deviation. The percentage inhibition was calculated as follows:
where A is the absorbance of the test sample (assay with hydrolysate and enzyme), B is the absorbance of the sample blank, 0+ is the absorbance of the positive control, and 0− is the absorbance of the negative control blank.
3.8.3. Acetylcholinesterase (AChE) Inhibitory Activity
The FPH samples were prepared at a concentration of 50 mg/mL in water for assessment of Acetylcholinesterase (AChE) inhibitory activity. The assay was performed with AChE from electric eel at a concentration of 0.36 U/mL. Briefly, 40 µL of enzyme was preincubated (37°C, 15 min) with 80 µL of sodium phosphate buffer (100mM with 1mM EDTA, pH 8.0) and 40 µL of the test sample. The control reaction was performed by changing the volume of the sample with Milli-Q water. Following pre-incubation, 40 µL of a substrate solution containing 0.3mM acetylthiocholine and 0.25mM DTNB (and 5,5′-dithio-bis-(2-nitrobenzoic acid) (DTNB) in buffer was added to each well. The reaction was monitored by measuring the absorbance at 415 nm for 5 min with readings taken at 20s intervals [55]. As a standard commercial inhibitor, 100 µM berberine prepared in 10% ethanol was used and subjected to the assay following the same procedure as the sample. The assay was performed in quadruplicate, and the results are presented as mean values ± standard deviation. The percentage inhibition was calculated using the following formula:
where Vsample is the reaction rate in the presence of the test sample and Vcontrol is the reaction rate of the control.
3.8.4. Angiotensin-Converting Enzyme (ACE) Inhibitory Activity
The ACE inhibitory activity using HHL as substrate was evaluated by high performance liquid chromatography (HPLC) [8,56]. Briefly, 10 µL of FPH solution (5 mg/mL), were mixed with 10 µL of 0.2 U/mL ACE prepared in sodium borate buffer (100 mM with 300 mM NaCl, pH 8.3). The mixture was pre-incubated at 37 °C for 20 min, after which 50 µ of HHL (2.17 mM in buffer) were added and the mixture was incubated at 37 °C for 30 min. A control reaction was made by changing the volume of sample with sodium borate buffer. The reaction was stopped by adding 85 µL of 1 M HCl and the solution was filtered. A 10 µL aliquot was injected into a HPLC (Agilent 1260 Infinity II; Agilent Technologies, Santa Clara, CA, USA) equipped with a reversed-phase C18 column (4.6 x 100 mm, 2.7 μm, InfinityLab Poroshell 120 EC-C18). The identity of HA and HHL was assessed by comparison with the retention times of the standards. Peak areas were obtained using an ChemStation software for LC (Agilent Technologies, Santa Clara, CA, USA). The assay was performed in triplicate, and the results are presented as mean values ± standard deviation. The percentage of ACE-inhibition was calculated as follows:
where HAControl is the concentration of HA in the reaction with the buffer instead of the sample and HAsample is the concentration of HA in the reaction with the sample. Captopril (21.7 µg/mL) concentration was used as the commercial inhibitor.
3.9. Statistical Analysis
The results of the analysis are presented as mean values ± standard deviation (SD). All statistical analyses were conducted using STATISTICA© software version 12, developed by StatSoft, Inc. (Tulsa, OK, USA). The data were assessed for normality of distribution and homogeneity of variances using the Shapiro–Wilk and Levene’s tests, respectively. Differences between the mean values of the groups were analyzed using a one-way analysis of variance (ANOVA) followed by Tukey’s HSD multiple comparison test. A p-value < 0.05 was considered statistically significant.
4. Conclusions
The study successfully produced FPH from frozen fish industry co-products, demonstrating their potential as valuable sources of bioactive compounds and offering a feasible approach to apply in fish processing “future by-products”. Employing enzymatic hydrolysis on co-products from black scabbardfish, gilthead seabream and Nile perch yielded a diverse range of protein hydrolysates with various biological characteristics. The enzymatic treatments, particularly the use of Alcalase and Protana in both single-stage and sequential methods, proved effective in maximizing hydrolysis yields and enhancing the bioactive potential of the resulting peptides, even when only 180 minutes of hydrolysis was considered. The hydrolysates exhibited high degrees of hydrolysis and protein yields, coupled with a lower molecular weight distribution, which enhanced the antioxidant and biological activity. These properties make the hydrolysates attractive for numerous applications. The biological activities observed—especially the antioxidant and antihypertensive—underscore the health-promoting potential of these FPH. While the antihypertensive properties indicated effective ACE inhibition at low concentrations, antioxidant assays further validated the capacity of FPH to counteract oxidative stress. Although the antidiabetic and anti-Alzheimer effects were less pronounced, still provide opportunities for further exploration in more targeted formulations. Notably, hydrolysates derived from gilthead seabream carcasses demonstrated the most promising bioactivities, particularly under combined enzymatic treatments such as single-step Alcalase and Protana.
This work offers a blueprint for utilizing fish processing co-products, which are typically low in value and costly to dispose of, even though they may become a source of functional ingredients with significant market potential in the food, agriculture, and nutraceutical sectors. The enzymatic approaches explored align with sustainable development goals by reducing waste, maximizing resource efficiency, improving nutrition, and promoting sustainable fish industry and agriculture. Further research focusing on the identification of specific peptide sequences responsible for bioactivity could expand the applications of FPH and support their integration into various formulations, enhancing the functional and economic value of fish processing by-products. Additionally, addressing sensory attributes such as color, odor, and taste would be crucial for ensuring broader acceptance and applicability in the food, nutraceutical, and cosmetics industries. Through these innovative approaches, the fish processing industry can better contribute to a circular economy model, adding value to co-products and advancing sustainable waste management solutions.
Supplementary Materials
The following supporting information can be downloaded at the website of this paper posted on Preprints.org. Figure S1: Diagram for processing co-products through various enzymatic treatments. Four different processes involving the enzymes Protana Prime (P), Alcalase 2.4L (A), Alcalase followed by Protana (A + P) and Alcalase and Protana added simultaneously (AP). Fish protein hydrolysates (FPH) were labeled as FPH P, FPH A, FPH A+P, and FPH AP, corresponding to the specific enzymatic treatment applied, resulting in a total of twelve FPH.
Author Contributions
Conceptualization, M.S.; A.L.F.; A.M.; C.P., methodology, M.S.; C.C.; J.C.; C.P., validation, M.S.; J.C.; C.P., formal analysis, M.S.; C.C.; J.C., investigation, M.S.; C.C.; J.C., resources, A.L.F.; A.M.; C.P., data curation, M.S.; J.C.; C.P., writing—original draft preparation, M.S.; C.P., writing—review and editing, M.S.; C.C.; J.C.; A.L.F.; A.M.; C.P., visualization, M.S.; A.L.F.; A.M.; C.P., supervision, A.L.F.; A.M.; C.P., project administration, A.M., funding acquisition, A.M.; C.P. All authors have read and agreed to the published version of the manuscript.
Funding
This work was developed within the scope of the “BLUE BIOECONOMY INNOVATION PACT” (Project No. C644915664-00000026) funded by NextGenerationEU, under the incentive of “Agenda for Business Innovation” of the recovery and resilience plan (PRR). This work was also supported by Portuguese Foundation for Science and Technology (FCT; projects https://doi.org/10.54499/UIDB/04077/2020, https://doi.org/10.54499/UIDP/04077/2020, UIDB/04423/2020, UIDP/04423/2020).
Institutional Review Board Statement
Not applicable.
Informed Consent Statement
Not applicable.
Data Availability Statement
The original contributions presented in the study are included in the article/supplementary material, further inquiries can be directed to the corresponding author.
Acknowledgments
M.S. is thankful for the doctoral scholarship (2023.02017.BDANA) provided by the Foundation for Science and Technology, I.P. The authors express their gratitude to Gelpeixe, Alimentos Congelados S.A. (Loures, Portugal), Vivid Foods, Lda (Vila Nova da Barquinha, Portugal) e ArtesanalPesca – Organização de Produtores de Pesca, C.R.L. (Sesimbra, Portugal) for supplying the co-products used. Additionally, the authors thankfully acknowledge Novozymes A/S (Copenhagen, Denmark), which, through the company Univar Solutions S.A. (Maia, Portugal), kindly provided the enzymes used in this research.
Conflicts of Interest
The authors declare no conflicts of interest.
References
- FAO. The State of World Fisheries and Aquaculture 2024; FAO: Rome, 2024; ISBN 978-92-5-138763-4. [Google Scholar]
- Smith, K.; Watson, A.W.; Lonnie, M.; Peeters, W.M.; Oonincx, D.; Tsoutsoura, N.; Simon-Miquel, G.; Szepe, K.; Cochetel, N.; Pearson, A.G.; et al. Meeting the Global Protein Supply Requirements of a Growing and Ageing Population. Eur J Nutr 2024. [Google Scholar] [CrossRef] [PubMed]
- Ideia, P.; Pinto, J.; Ferreira, R.; Figueiredo, L.; Spínola, · Vítor; Castilho, P.C. Fish Processing Industry Residues: A Review of Valuable Products Extraction and Characterization Methods Statement of Novelty. Waste Biomass Valorization 2020, 11, 3223–3246. [CrossRef]
- IFFO By-Product. Available online: https://www.iffo.com/product (accessed on 19 October 2023).
- Lorenzo, J.M.; Barba, F.J. Advances in Food and Nutrition Research; 1st ed.; Academic Press, 2020; Vol. 92;
- Ellen MacArthur Foundation Towards the Circular Economy Vol. 1: An Economic and Business Rationale for an Accelerated Transition; 2013; Vol. 1;
- European Union Regulation (EC) No 1069/2009 of the European Parliament and of the Council. Official Journal of the European Union 2009.
- Pires, C.; Leitão, M.; Sapatinha, M.; Gonçalves, A.; Oliveira, H.; Nunes, M.L.; Teixeira, B.; Mendes, R.; Camacho, C.; Machado, M.; et al. Protein Hydrolysates from Salmon Heads and Cape Hake By-Products: Comparing Enzymatic Method with Subcritical Water Extraction on Bioactivity Properties. Foods 2024, 13, 2418. [Google Scholar] [CrossRef]
- Siddik, M.A.B.; Howieson, J.; Fotedar, R.; Partridge, G.J. Enzymatic Fish Protein Hydrolysates in Finfish Aquaculture: A Review. Rev Aquac 2021, 13, 406–430. [Google Scholar] [CrossRef]
- Zamora-Sillero, J.; Ramos, P.; Monserrat, J.M.; Prentice, C. Evaluation of the Antioxidant Activity In Vitro and in Hippocampal HT-22 Cells System of Protein Hydrolysates of Common Carp (Cyprinus Carpio) By-Product. Journal of Aquatic Food Product Technology 2018, 27, 21–34. [Google Scholar] [CrossRef]
- Venugopal, V. Enzymes from Seafood Processing Waste and Their Applications in Seafood Processing. In; 2016; pp. 47–69.
- Kristinsson, H.G.; Rasco, B.A. Fish Protein Hydrolysates: Production, Biochemical, and Functional Properties. Crit Rev Food Sci Nutr 2000, 40, 43–81. [Google Scholar] [CrossRef]
- Iñarra, B.; Bald, C.; Gutierrez, M.; San Martin, D.; Zufía, J.; Ibarruri, J. Production of Bioactive Peptides from Hake By-Catches: Optimization and Scale-Up of Enzymatic Hydrolysis Process. Mar Drugs 2023, 21, 552. [Google Scholar] [CrossRef]
- Hunsakul, K.; Laokuldilok, T.; Sakdatorn, V.; Klangpetch, W.; Brennan, C.S.; Utama-ang, N. Optimization of Enzymatic Hydrolysis by Alcalase and Flavourzyme to Enhance the Antioxidant Properties of Jasmine Rice Bran Protein Hydrolysate. Sci Rep 2022, 12, 12582. [Google Scholar] [CrossRef]
- Ramírez Fuentes, L.; Richard, C.; Chen, L. Sequential Alcalase and Flavourzyme Treatment for Preparation of α-Amylase, α-Glucosidase, and Dipeptidyl Peptidase (DPP)-IV Inhibitory Peptides from Oat Protein. J Funct Foods 2021, 87, 104829. [Google Scholar] [CrossRef]
- Heffernan, S.; Giblin, L.; O’Brien, N. Assessment of the Biological Activity of Fish Muscle Protein Hydrolysates Using in Vitro Model Systems. Food Chem 2021, 359, 129852. [Google Scholar] [CrossRef] [PubMed]
- Abd El-Rady, T.K.; Tahoun, A.M.; Abdin, M.; Amin, H.F. Effect of Different Hydrolysis Methods on Composition and Functional Properties of Fish Protein Hydrolysate Obtained from Bigeye Tuna Waste. Int J Food Sci Technol 2023, 58, 6552–6562. [Google Scholar] [CrossRef]
- FAO Fisheries and Aquaculture (FishInfo). Resources factsheets 2024.
- Valcarcel, J.; Sanz, N.; Vázquez, J.A. Optimization of the Enzymatic Protein Hydrolysis of By-Products from Seabream (Sparus Aurata) and Seabass (Dicentrarchus Labrax), Chemical and Functional Characterization. Foods 2020, 9, 1503. [Google Scholar] [CrossRef] [PubMed]
- Freitas, M.; Costa, L.; Delgado, J.; Jiménez, S.; Timóteo, V.; Vasconcelos, J.; González, J.A. Deep-Sea Sharks as by-Catch of an Experimental Fishing Survey for Black Scabbardfishes (Aphanopus Spp.) off the Canary Islands (NE Atlantic). Sci Mar 2018, 82, 151. [Google Scholar] [CrossRef]
- Batista, I.; Ramos, C.; Coutinho, J.; Bandarra, N.M.; Nunes, M.L. Characterization of Protein Hydrolysates and Lipids Obtained from Black Scabbardfish (Aphanopus Carbo) by-Products and Antioxidative Activity of the Hydrolysates Produced. Process Biochemistry 2010, 45, 18–24. [Google Scholar] [CrossRef]
- Wasswa, J.; Tang, J.; Gu, X. Functional Properties of Grass Carp ( Ctenopharyngodon Idella), Nile Perch (Lates Niloticus) and Nile Tilapia (Oreochromis Niloticus) Skin Hydrolysates. Int J Food Prop 2008, 11, 339–350. [Google Scholar] [CrossRef]
- García-Moreno, P.J.; Batista, I.; Pires, C.; Bandarra, N.M.; Espejo-Carpio, F.J.; Guadix, A.; Guadix, E.M. Antioxidant Activity of Protein Hydrolysates Obtained from Discarded Mediterranean Fish Species. Food Research International 2014, 65, 469–476. [Google Scholar] [CrossRef]
- Mhina, C.F.; Jung, H.Y.; Kim, J.K. Recovery of Antioxidant and Antimicrobial Peptides through the Reutilization of Nile Perch Wastewater by Biodegradation Using Two Bacillus Species. Chemosphere 2020, 253, 126728. [Google Scholar] [CrossRef]
- Tacias-Pascacio, V.G.; Morellon-Sterling, R.; Siar, E.-H.; Tavano, O.; Berenguer-Murcia, Á.; Fernandez-Lafuente, R. Use of Alcalase in the Production of Bioactive Peptides: A Review. Int J Biol Macromol 2020, 165, 2143–2196. [Google Scholar] [CrossRef]
- Forde, A.; Fitzgerald, G.F. Biotechnological Approaches to the Understanding and Improvement of Mature Cheese Flavour. Curr Opin Biotechnol 2000, 11, 484–489. [Google Scholar] [CrossRef]
- Domínguez, H.; Iñarra, B.; Labidi, J.; Mendiola, D.; Bald, C. Comparison of Amino Acid Release between Enzymatic Hydrolysis and Acid Autolysis of Rainbow Trout Viscera. Heliyon 2024, 10, e27030. [Google Scholar] [CrossRef] [PubMed]
- Carrera-Alvarado, G.; Toldrá, F.; Mora, L. DPP-IV Inhibitory Peptides GPF, IGL, and GGGW Obtained from Chicken Blood Hydrolysates. Int J Mol Sci 2022, 23, 14140. [Google Scholar] [CrossRef] [PubMed]
- Fuentes, C.; Verdú, S.; Grau, R.; Barat, J.M.; Fuentes, A. Impact of Raw Material and Enzyme Type on the Physico-Chemical and Functional Properties of Fish by-Products Hydrolysates. LWT 2024, 201, 116247. [Google Scholar] [CrossRef]
- Dong, Y.; Yan, W.; Zhang, Y.-Q. Effects of Spray Drying and Freeze Drying on Physicochemical Properties, Antioxidant and ACE Inhibitory Activities of Bighead Carp (Aristichthys Nobilis) Skin Hydrolysates. Foods 2022, 11, 2083. [Google Scholar] [CrossRef]
- Henriques, A.; Vázquez, J.A.; Valcarcel, J.; Mendes, R.; Bandarra, N.M.; Pires, C. Characterization of Protein Hydrolysates from Fish Discards and By-Products from the North-West Spain Fishing Fleet as Potential Sources of Bioactive Peptides. Mar Drugs 2021, 19, 338. [Google Scholar] [CrossRef]
- Wang, J.; Wang, Y.-M.; Li, L.-Y.; Chi, C.-F.; Wang, B. Twelve Antioxidant Peptides From Protein Hydrolysate of Skipjack Tuna (Katsuwonus Pelamis) Roe Prepared by Flavourzyme: Purification, Sequence Identification, and Activity Evaluation. Front Nutr 2022, 8. [Google Scholar] [CrossRef] [PubMed]
- Shimada, Kazuko.; Fujikawa, Kuniko.; Yahara, Keiko.; Nakamura, Takashi. Antioxidative Properties of Xanthan on the Autoxidation of Soybean Oil in Cyclodextrin Emulsion. J Agric Food Chem 1992, 40, 945–948. [CrossRef]
- Opitz, S.E.W.; Smrke, S.; Goodman, B.A.; Yeretzian, C. Methodology for the Measurement of Antioxidant Capacity of Coffee. In Processing and Impact on Antioxidants in Beverages; Elsevier, 2014; pp. 253–264.
- Amini Sarteshnizi, R.; Sahari, M.A.; Ahmadi Gavlighi, H.; Regenstein, J.M.; Nikoo, M.; Udenigwe, C.C. Influence of Fish Protein Hydrolysate-Pistachio Green Hull Extract Interactions on Antioxidant Activity and Inhibition of α-Glucosidase, α-Amylase, and DPP-IV Enzymes. LWT 2021, 142, 111019. [Google Scholar] [CrossRef]
- Oyaizu, M. Reducing Power - Studies on Products of Browning Reaction. Japanese Journal of Nutrition 1986, 44, 307–315. [Google Scholar]
- Karoud, W.; Sila, A.; Krichen, F.; Martinez-Alvarez, O.; Bougatef, A. Characterization, Surface Properties and Biological Activities of Protein Hydrolysates Obtained from Hake (Merluccius Merluccius) Heads. Waste Biomass Valorization 2019, 10, 287–297. [Google Scholar] [CrossRef]
- Pires, C.; Clemente, T.; Batista, I. Functional and Antioxidative Properties of Protein Hydrolysates from Cape Hake By-products Prepared by Three Different Methodologies. J Sci Food Agric 2013, 93, 771–780. [Google Scholar] [CrossRef] [PubMed]
- Decker, E.A.; Welch, B. Role of Ferritin as a Lipid Oxidation Catalyst in Muscle Food. J Agric Food Chem 1990, 38, 674–677. [Google Scholar] [CrossRef]
- Torres-Fuentes, C.; Alaiz, M.; Vioque, J. Affinity Purification and Characterisation of Chelating Peptides from Chickpea Protein Hydrolysates. Food Chem 2011, 129, 485–490. [Google Scholar] [CrossRef]
- Naghdi, S.; Rezaei, M.; Tabarsa, M.; Abdollahi, M. Fish Protein Hydrolysate from Sulfated Polysaccharides Extraction Residue of Tuna Processing By-Products with Bioactive and Functional Properties. Global Challenges 2023, 7. [Google Scholar] [CrossRef] [PubMed]
- Li, Y.; Jiang, H.; Huang, G. Protein Hydrolysates as Promoters of Non-Haem Iron Absorption. Nutrients 2017, 9, 609. [Google Scholar] [CrossRef]
- Moreira, T.F.M.; Pessoa, L.G.A.; Seixas, F.A.V.; Ineu, R.P.; Gonçalves, O.H.; Leimann, F.V.; Ribeiro, R.P. Chemometric Evaluation of Enzymatic Hydrolysis in the Production of Fish Protein Hydrolysates with Acetylcholinesterase Inhibitory Activity. Food Chem 2022, 367. [Google Scholar] [CrossRef]
- Su, G.; Zhao, T.; Zhao, Y.; Sun-Waterhouse, D.; Qiu, C.; Huang, P.; Zhao, M. Effect of Anchovy (Coilia Mystus) Protein Hydrolysate and Its Maillard Reaction Product on Combating Memory-Impairment in Mice. Food Research International 2016, 82, 112–120. [Google Scholar] [CrossRef]
- Elavarasan, K.; Shamasundar, B.A. Angiotensin I-converting Enzyme Inhibitory Activity of Protein Hydrolysates Prepared from Three Freshwater Carps (Catla Catla, Labeo Rohita and Cirrhinus Mrigala) Using Flavorzyme. Int J Food Sci Technol 2023, 49, 1344–1350. [Google Scholar] [CrossRef]
- AOAC Official Methods of Analysis of the Association of Official Analytical Chemists 1990.
- Saint-Denis, T.; Goupy, J. Optimization of a Nitrogen Analyser Based on the Dumas Method. Anal Chim Acta 2004, 515, 191–198. [Google Scholar] [CrossRef]
- Sapatinha, M.; Afonso, C.M.; Cardoso, C.L.; Pires, C.; Mendes, R.; Montero, M.P.; Gómez-Guillén, M.C.; Bandarra, N.M. Lipid Nutritional Value and Bioaccessibility of Novel Ready-to-eat Seafood Products with Encapsulated Bioactives. Int J Food Sci Technol 2022. [Google Scholar] [CrossRef]
- Vázquez, J.A.; Fernández-Compás, A.; Blanco, M.; Rodríguez-Amado, I.; Moreno, H.; Borderías, J.; Pérez-Martín, R.I. Development of Bioprocesses for the Integral Valorisation of Fish Discards. Biochem Eng J 2019, 144, 198–208. [Google Scholar] [CrossRef]
- Nielsen, P.M.; Petersen, D.; Dambmann, C. Improved Method for Determining Food Protein Degree of Hydrolysis. J Food Sci 2001, 66, 642–646. [Google Scholar] [CrossRef]
- Picot, L.; Ravallec, R.; Fouchereau-Péron, M.; Vandanjon, L.; Jaouen, P.; Chaplain-Derouiniot, M.; Guérard, F.; Chabeaud, A.; LeGal, Y.; Alvarez, O.M.; et al. Impact of Ultrafiltration and Nanofiltration of an Industrial Fish Protein Hydrolysate on Its Bioactive Properties. J Sci Food Agric 2010, n/a-n/a. [CrossRef]
- Re, R.; Pellegrini, N.; Proteggente, A.; Pannala, A.; Yang, M.; Rice-Evans, C. Antioxidant Activity Applying an Improved ABTS Radical Cation Decolorization Assay. Free Radic Biol Med 1999, 26, 1231–1237. [Google Scholar] [CrossRef] [PubMed]
- Hansawasdi, C.; Kawabata, J.; Kasai, T. Alpha-Amylase Inhibitors from Roselle ( Hibiscus Sabdariffa Linn.) Tea. Biosci Biotechnol Biochem 2000, 64, 1041–1043. [Google Scholar] [CrossRef]
- Li, N.; Qiu, L.; Song, H.; Xiao, T.; Luo, T.; Deng, Z.; Zheng, L. Inhibition Mechanism of Oligopeptides from Soft-shelled Turtle Egg against A-glucosidase and Their Gastrointestinal Digestive Properties. J Food Biochem 2022, 46. [Google Scholar] [CrossRef]
- Ahn, C.-B.; Lee, K.-H.; Je, J.-Y. Enzymatic Production of Bioactive Protein Hydrolysates from Tuna Liver: Effects of Enzymes and Molecular Weight on Bioactivity. Int J Food Sci Technol 2010, 45, 562–568. [Google Scholar] [CrossRef]
- Wu, J.; Aluko, R.E.; Muir, A.D. Improved Method for Direct High-Performance Liquid Chromatography Assay of Angiotensin-Converting Enzyme-Catalyzed Reactions. J Chromatogr A 2002, 950, 125–130. [Google Scholar] [CrossRef]
Figure 1.
Degree of hydrolysis (DH) and yield of the hydrolysate (Yh) process of gilthead seabream carcass (GB) with Alcalase and Protana (AP and A+P) over time.
Figure 1.
Degree of hydrolysis (DH) and yield of the hydrolysate (Yh) process of gilthead seabream carcass (GB) with Alcalase and Protana (AP and A+P) over time.
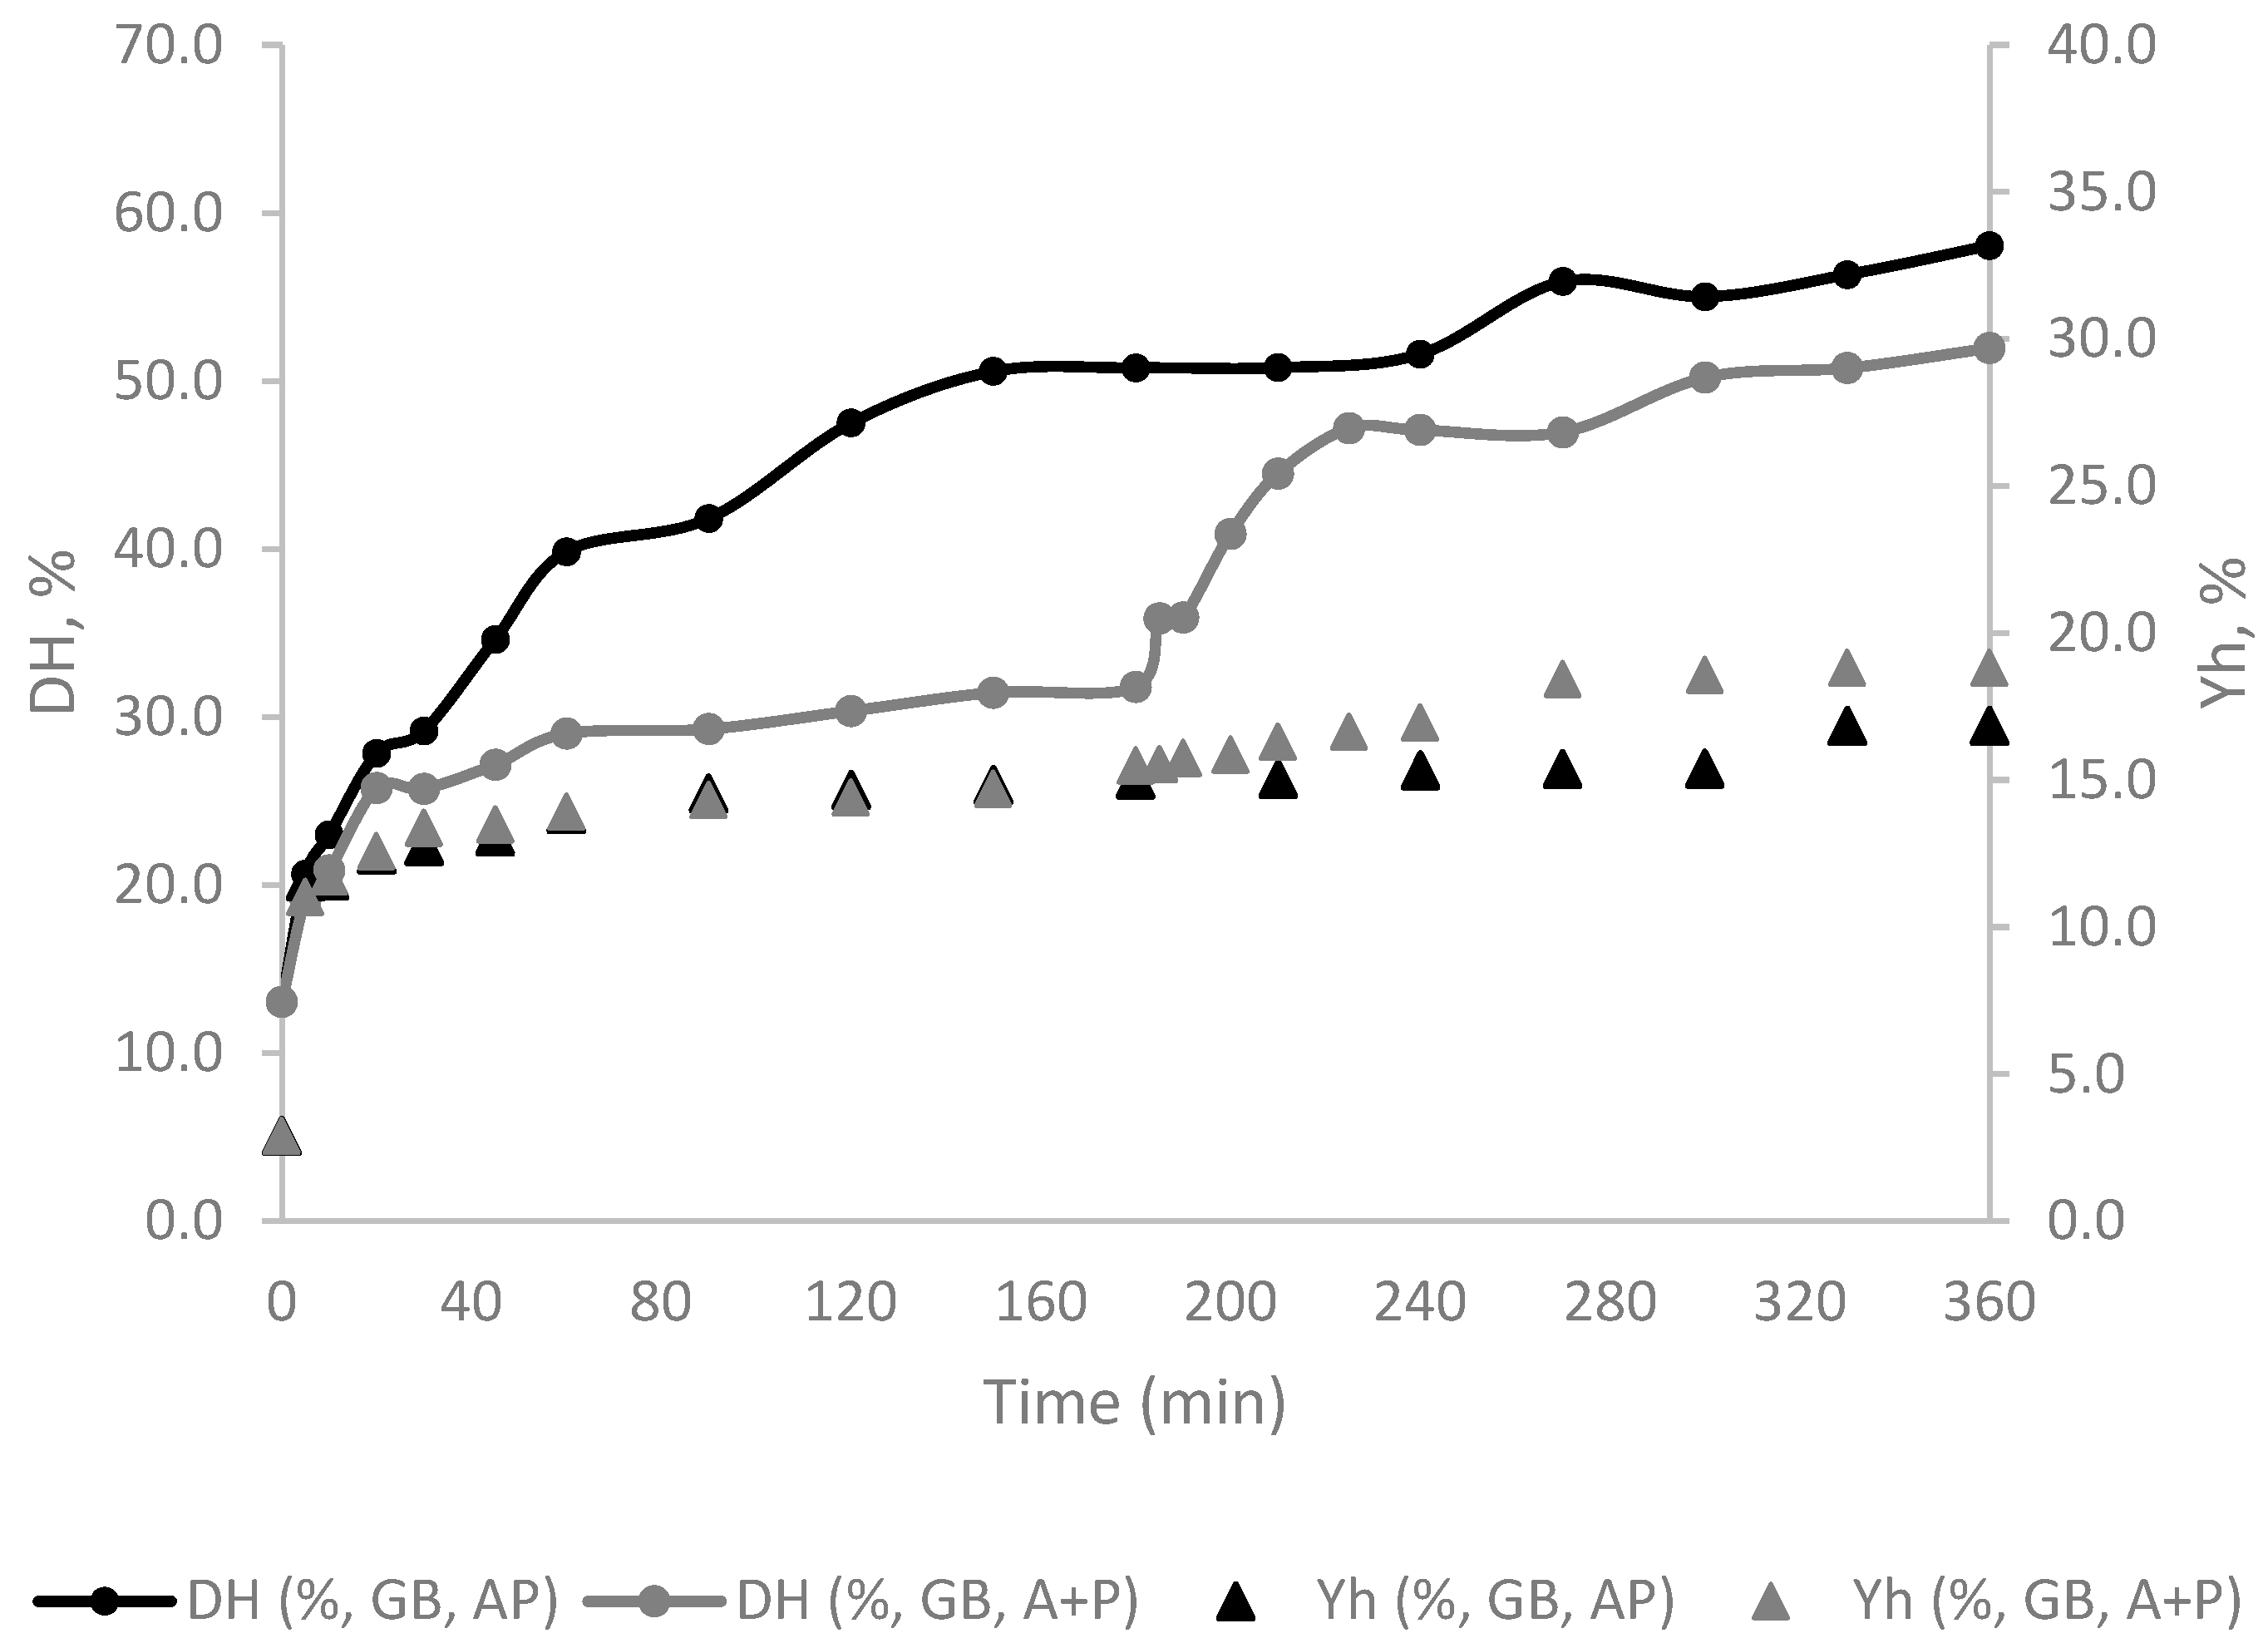
Figure 2.
Size-exclusion chromatograms of fish protein hydrolysates of gilthead seabream (GB) prepared with Alcalase and Protana (AP) at three different stages of hydrolysis (0 min, 180 min, and 360 min). Peaks separated by molecular weight ranges (>1000 Da, >500 Da, <500 Da, <100 Da).
Figure 2.
Size-exclusion chromatograms of fish protein hydrolysates of gilthead seabream (GB) prepared with Alcalase and Protana (AP) at three different stages of hydrolysis (0 min, 180 min, and 360 min). Peaks separated by molecular weight ranges (>1000 Da, >500 Da, <500 Da, <100 Da).
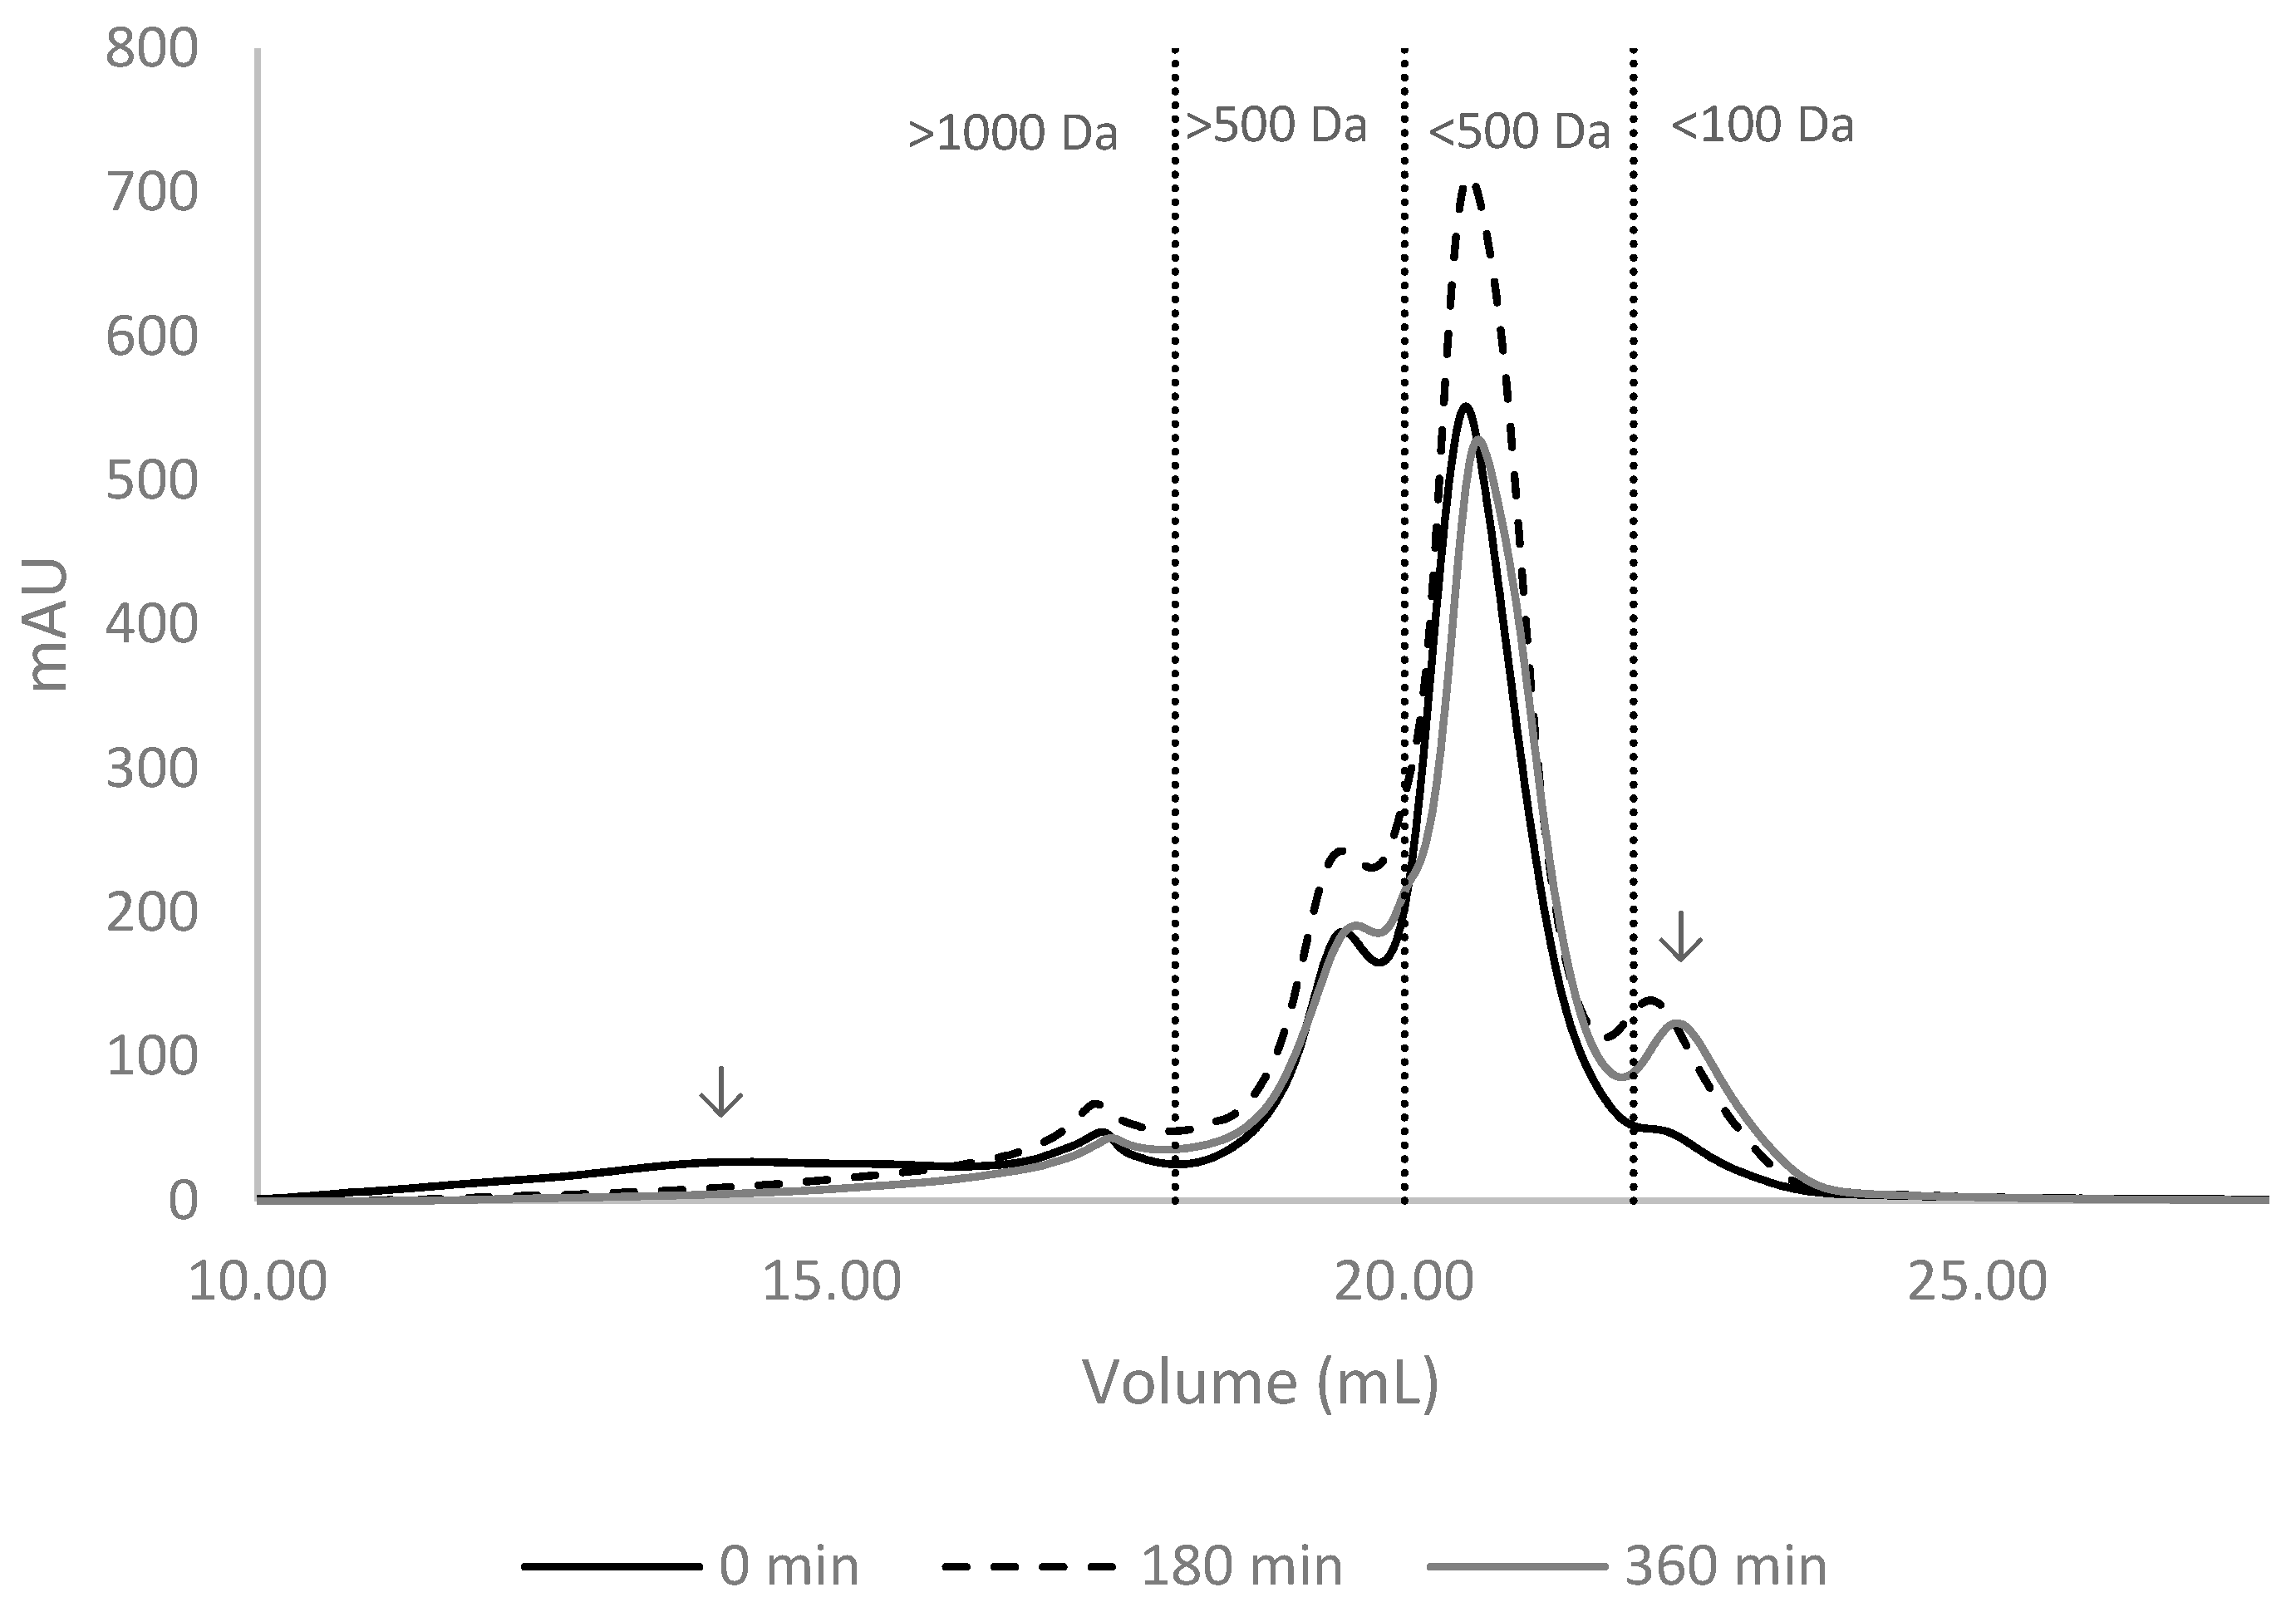
Figure 3.
Antioxidant assays (DPPH, ABTS, Reducing Power (RP)) with different hydrolysates prepared with black scabbardfish heads and bones (BS), gilthead seabream carcass (GB) and Nile perch trimmings (NP) using various enzyme combinations: Alcalase (A), Protana (P), Alcalase followed by Protana (A+P), and Alcalase and Protana added simultaneously (AP). The columns represent the mean values, and different letters significant differences (p<0.05).
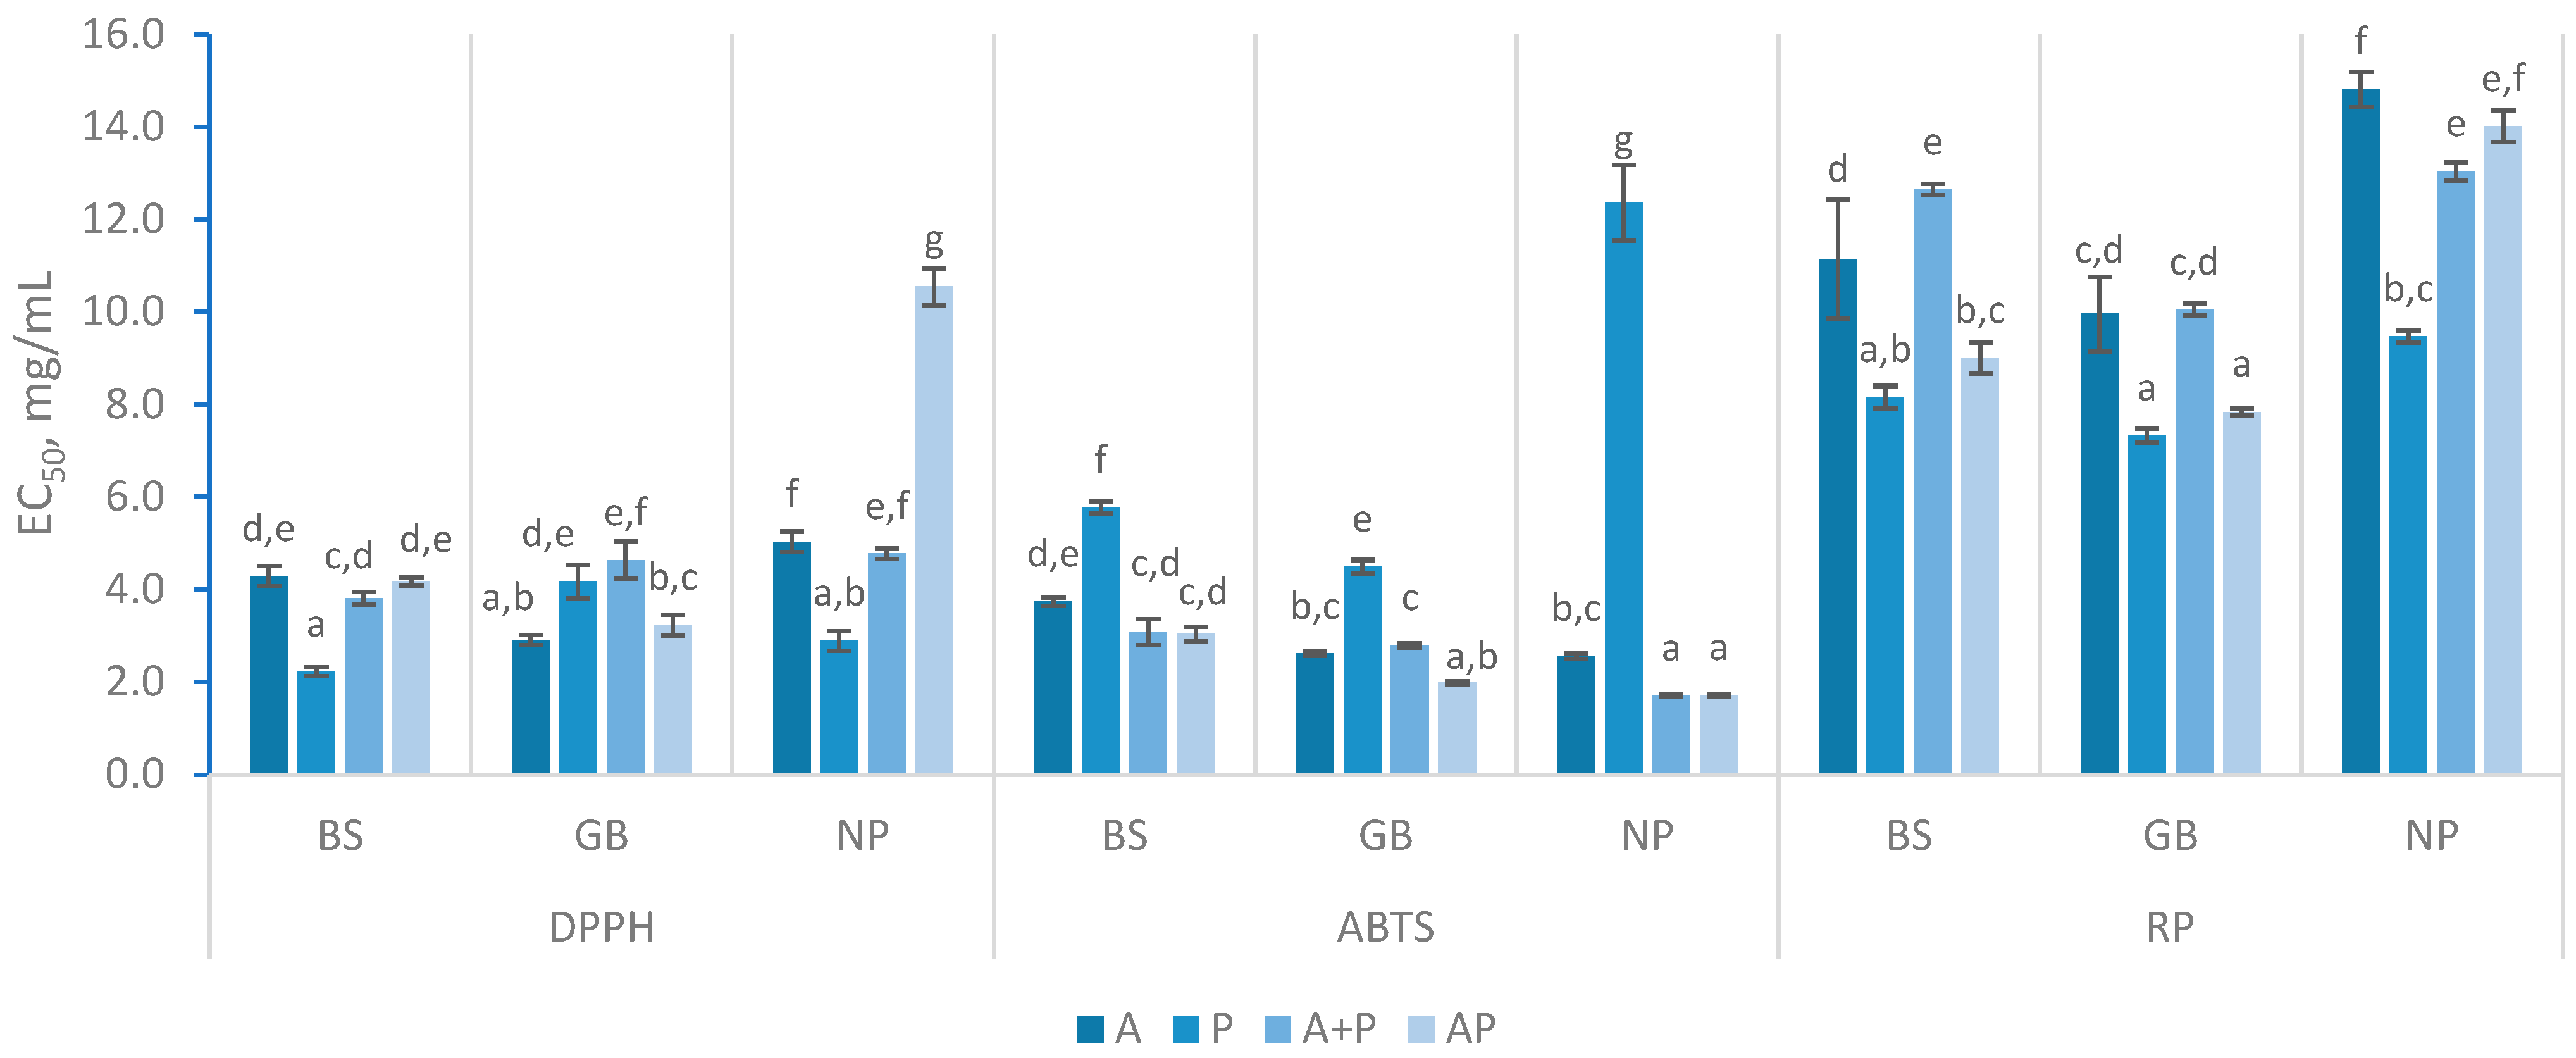
Figure 4.
Iron (a) and cooper (b) chelation activity with different hydrolysates prepared with black scabbardfish heads and bones (BS), gilthead seabream carcass (GB) and Nile perch trimmings (NP) using various enzyme combinations: Alcalase (A), Protana (P), Alcalase followed by Protana (A+P), and Alcalase and Protana added simultaneously (AP). 'n.d.' indicates values that could not be determined for the samples. The columns represent the mean values, and different letters reveal significant differences (p<0.05).
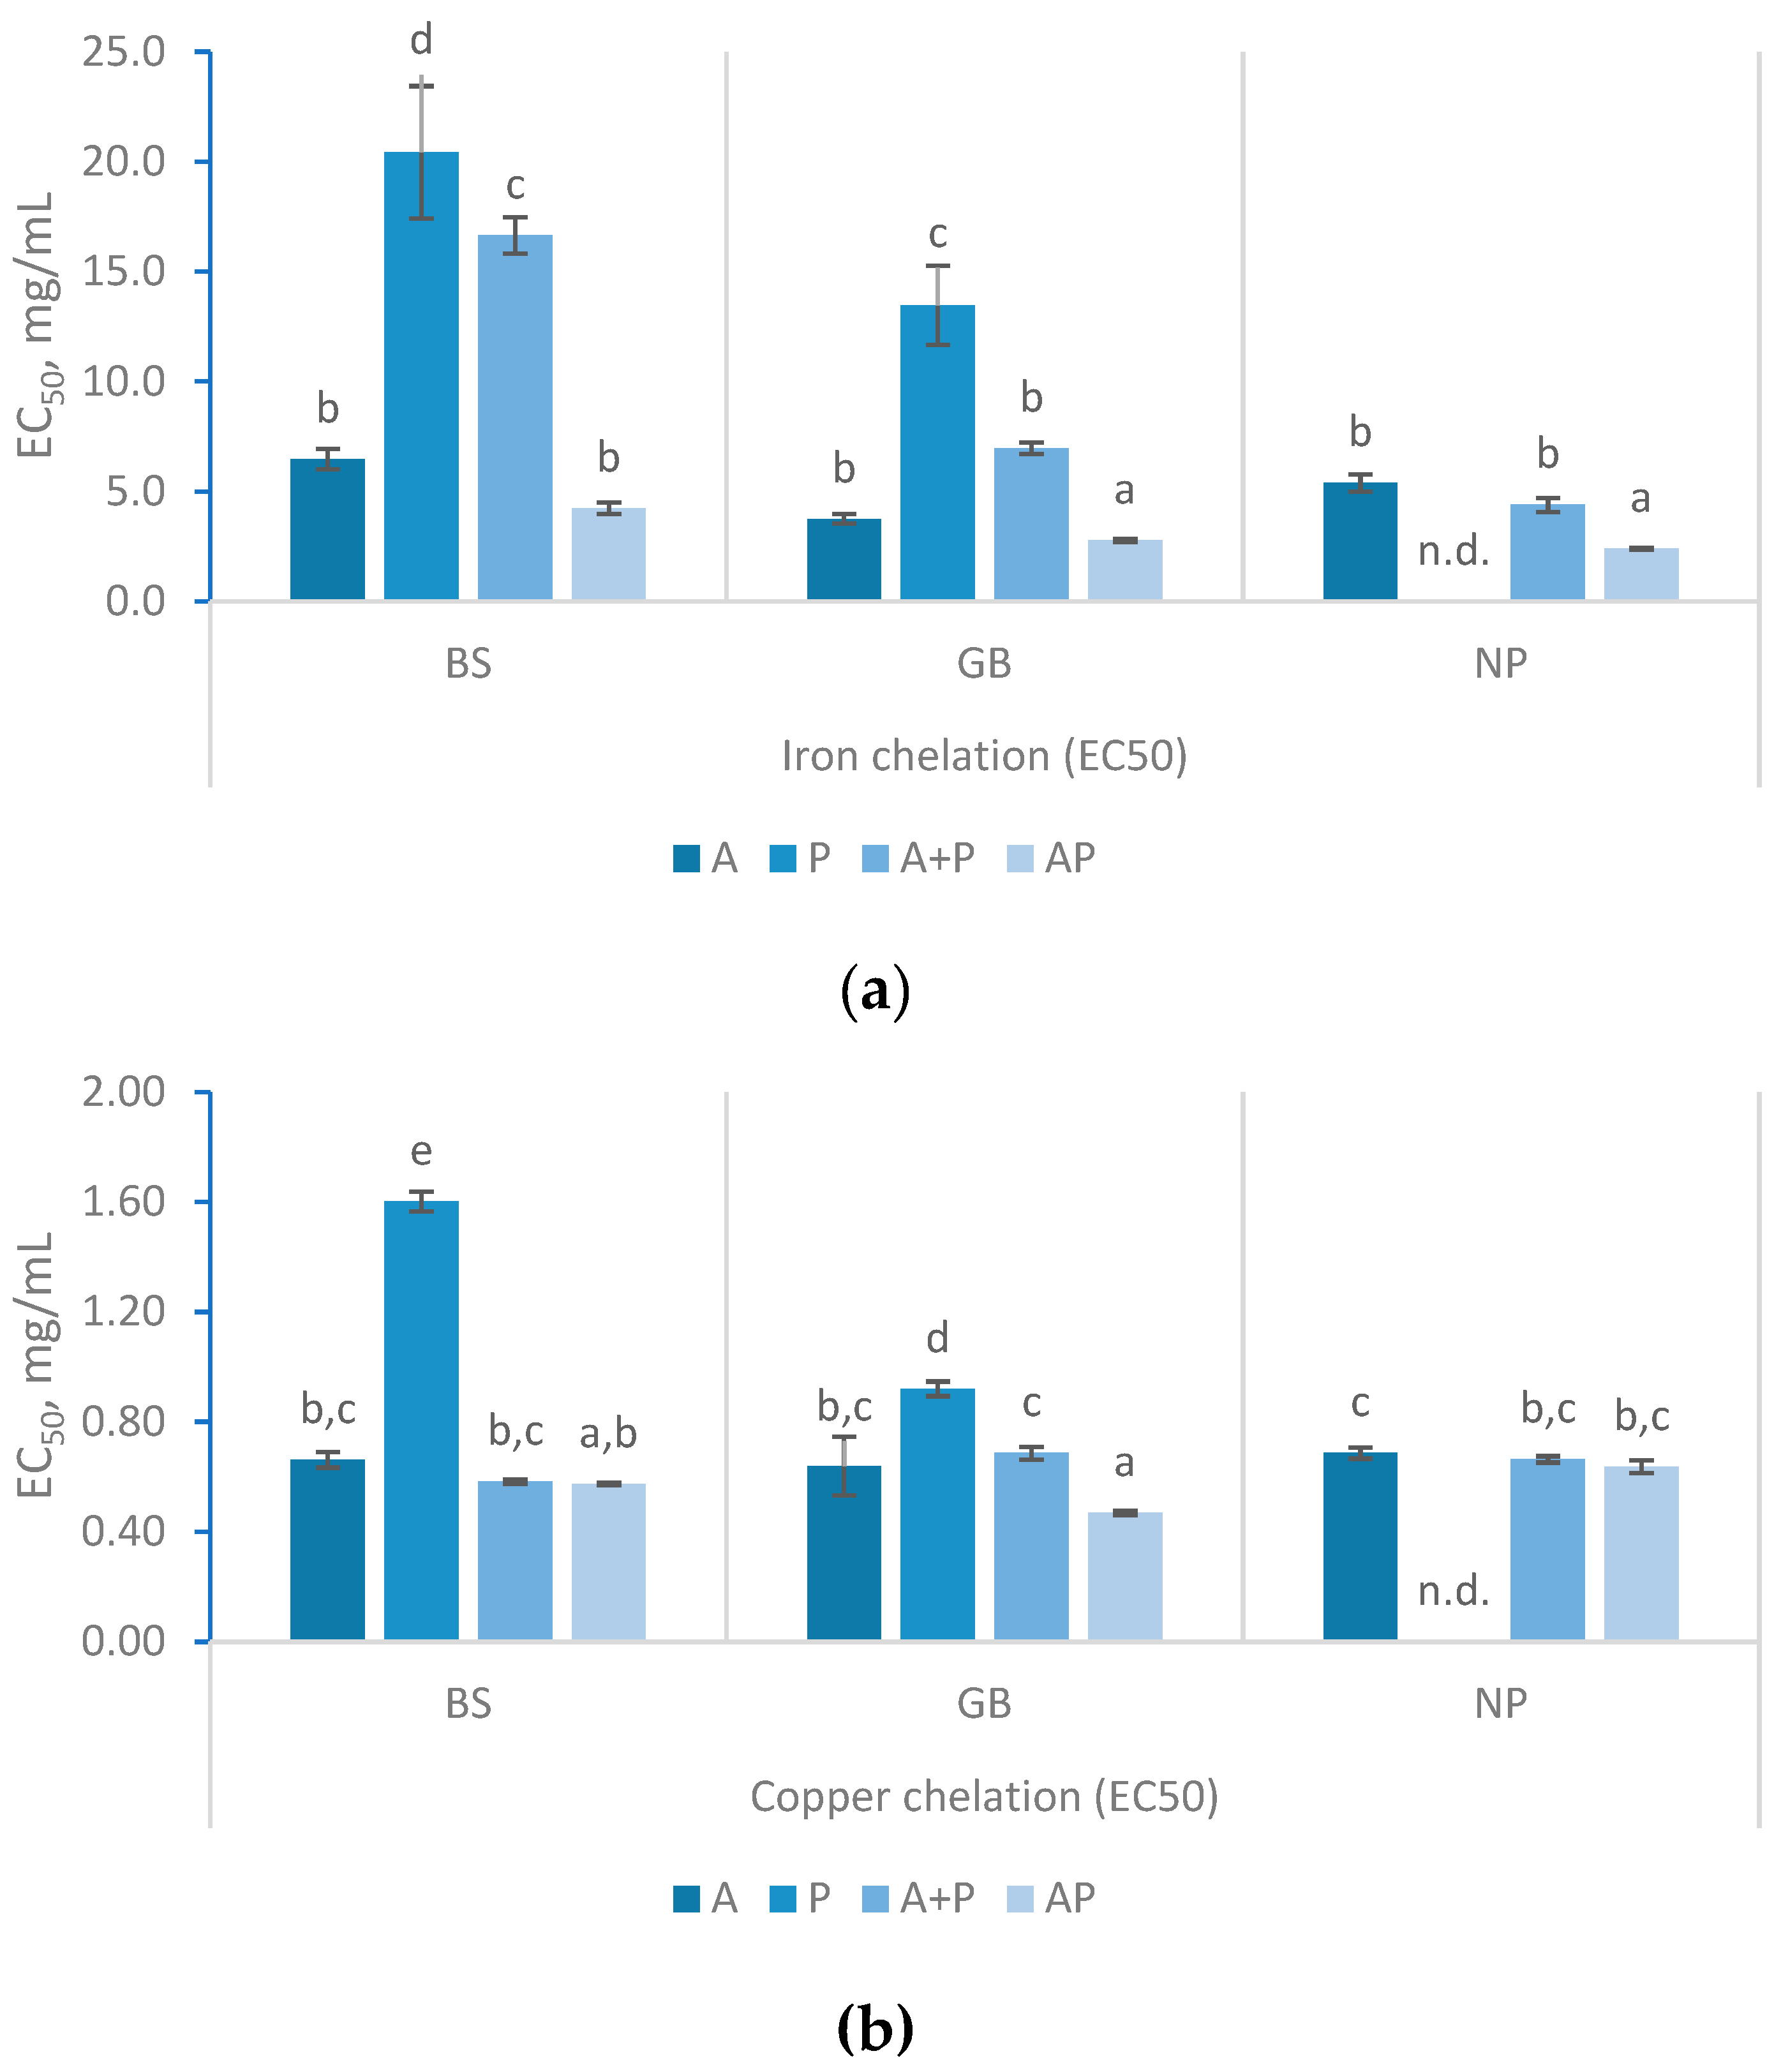
Figure 5.
IC50 values for α-Amylase inhibitory activity and α-glucosidase inhibition percentages (%) with 50 mg/mL of FPH prepared from black scabbardfish heads and bones (BS), gilthead seabream carcass (GB) and Nile perch trimmings (NP) using various enzyme combinations: Alcalase (A), Protana (P), Alcalase followed by Protana (A+P), and Alcalase and Protana added simultaneously (AP). 'n.d.' indicates values that could not be determined for the samples. The columns represent the mean values, and different letters indicate significant differences (p<0.05).
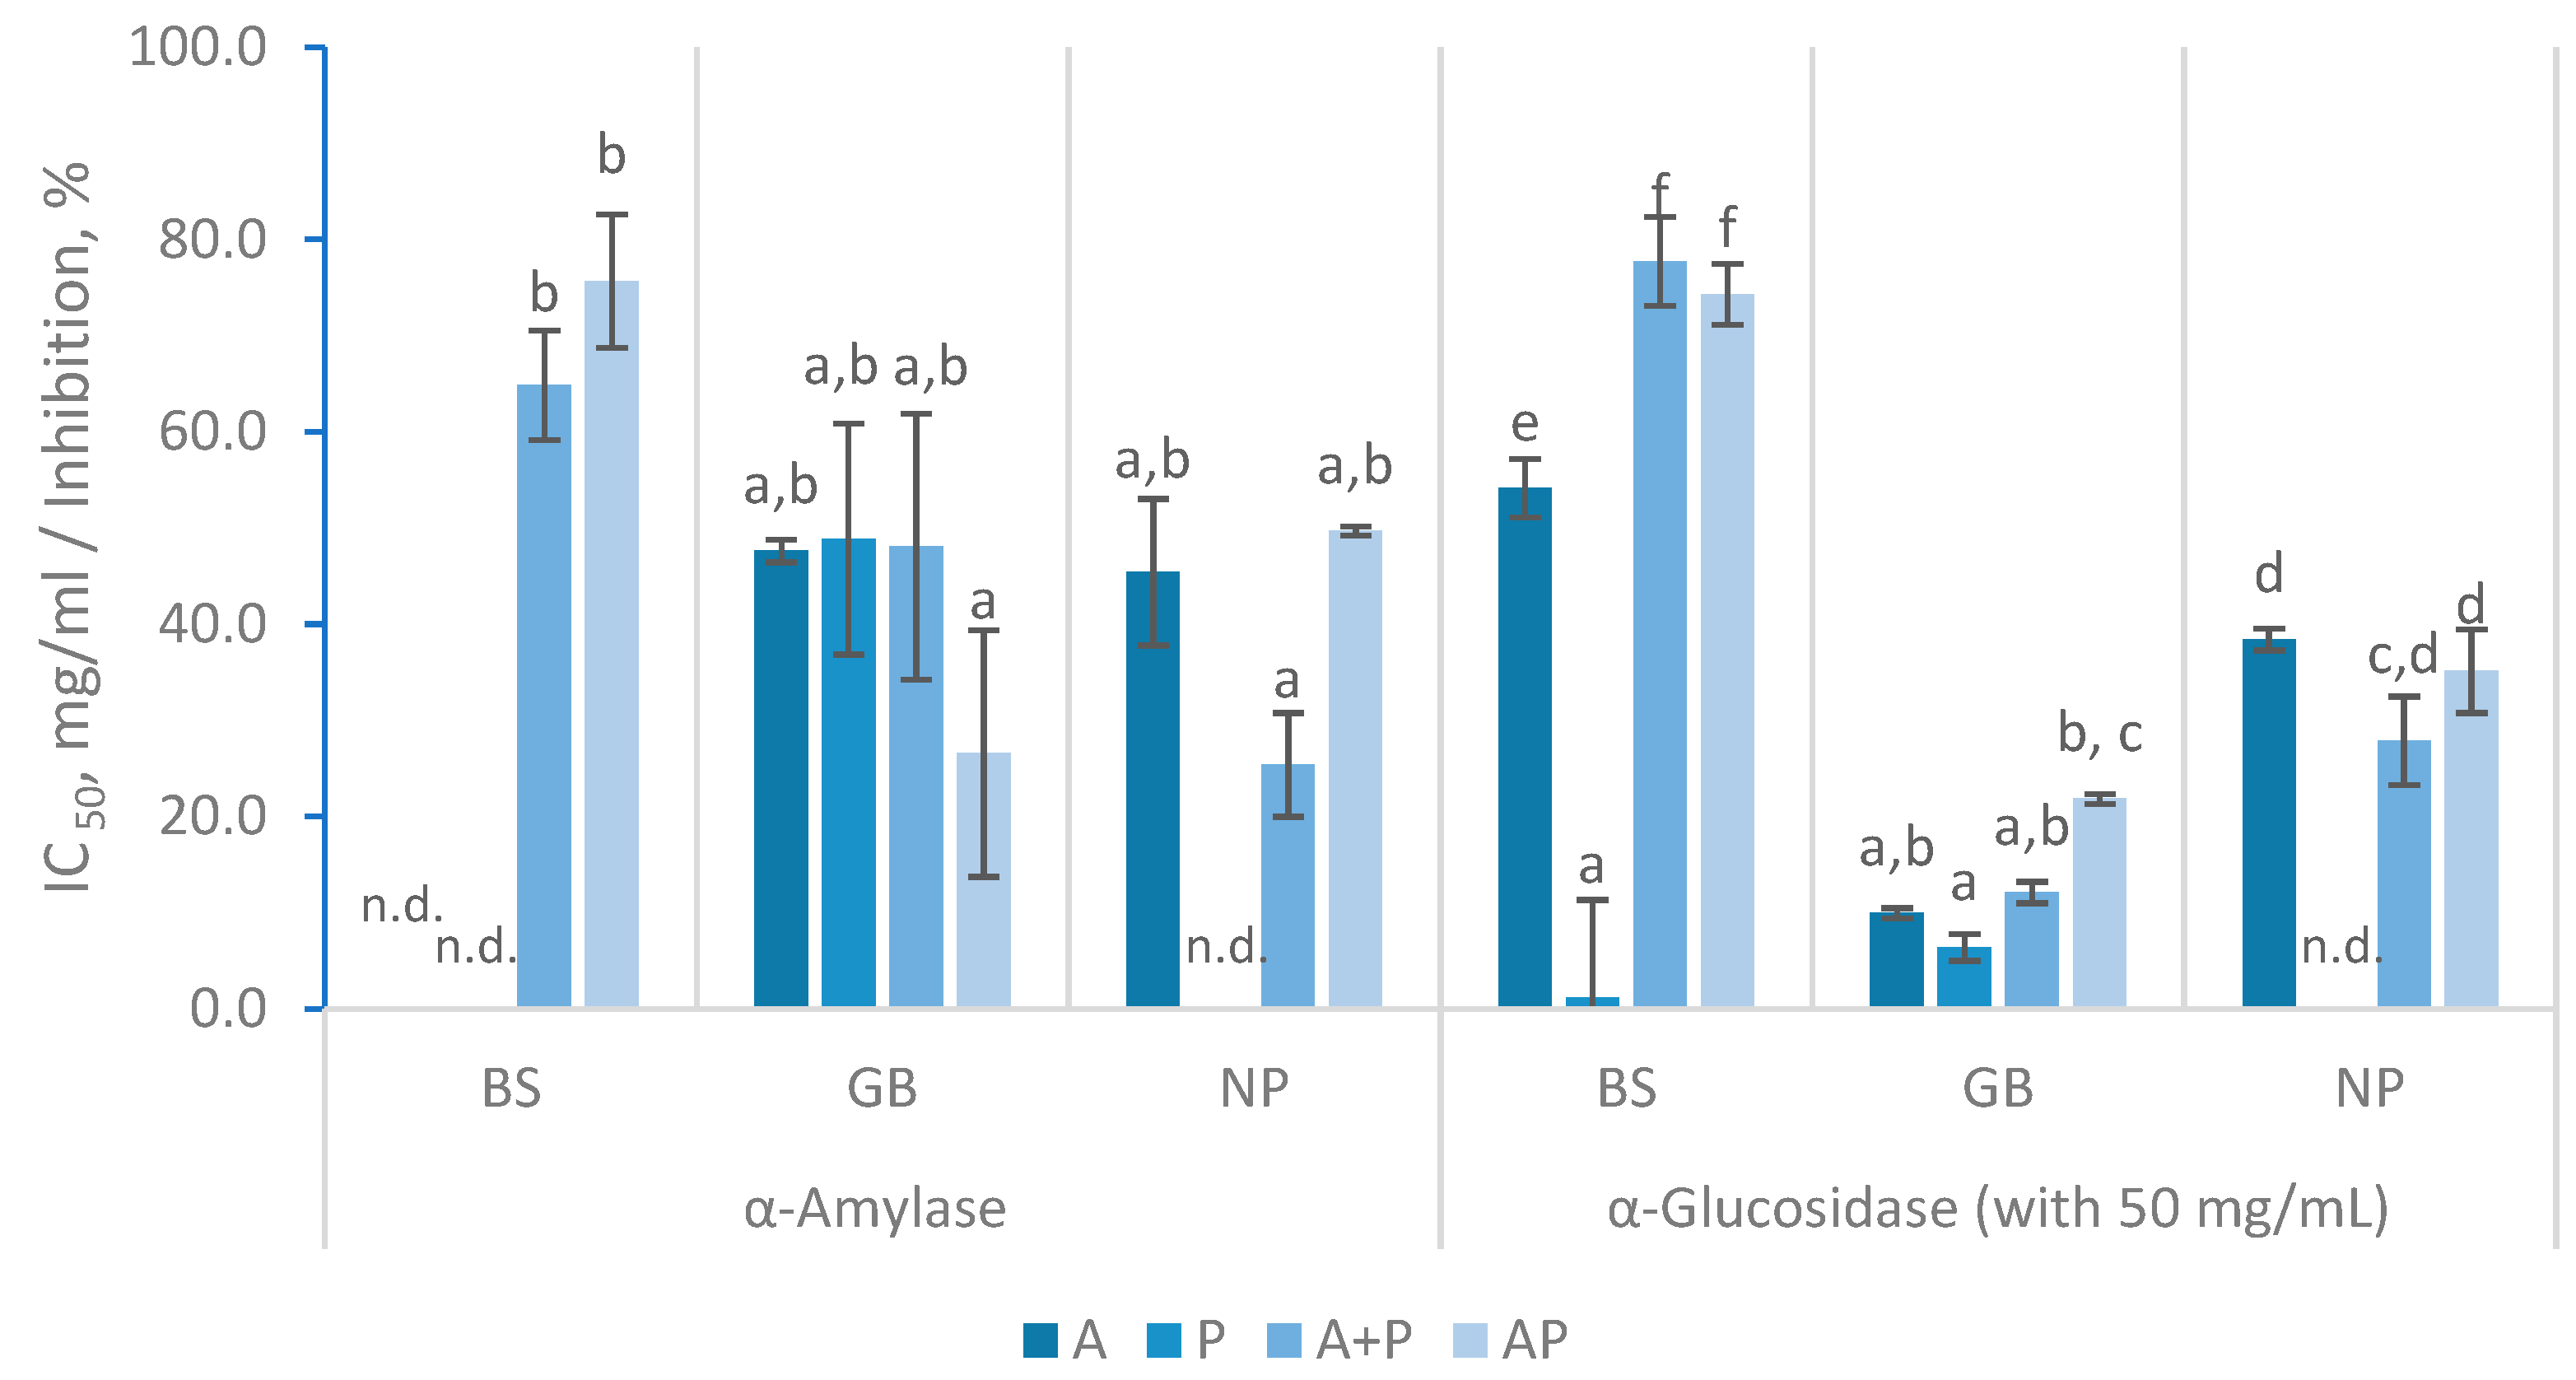
Figure 6.
AChE inhibition percentages (%) with 50 mg/mL and ACE inhibition percentages (%) with 5 mg/mL of FPH prepared from black scabbardfish heads and bones (BS), gilthead seabream carcass (GB) and Nile perch trimmings (NP) using various enzyme combinations: Alcalase (A), Protana (P), Alcalase followed by Protana (A+P), and Alcalase and Protana added simultaneously (AP). 'n.d.' indicates values that could not be determined for the samples. The columns represent the mean values, and different letters significant differences (p<0.05).
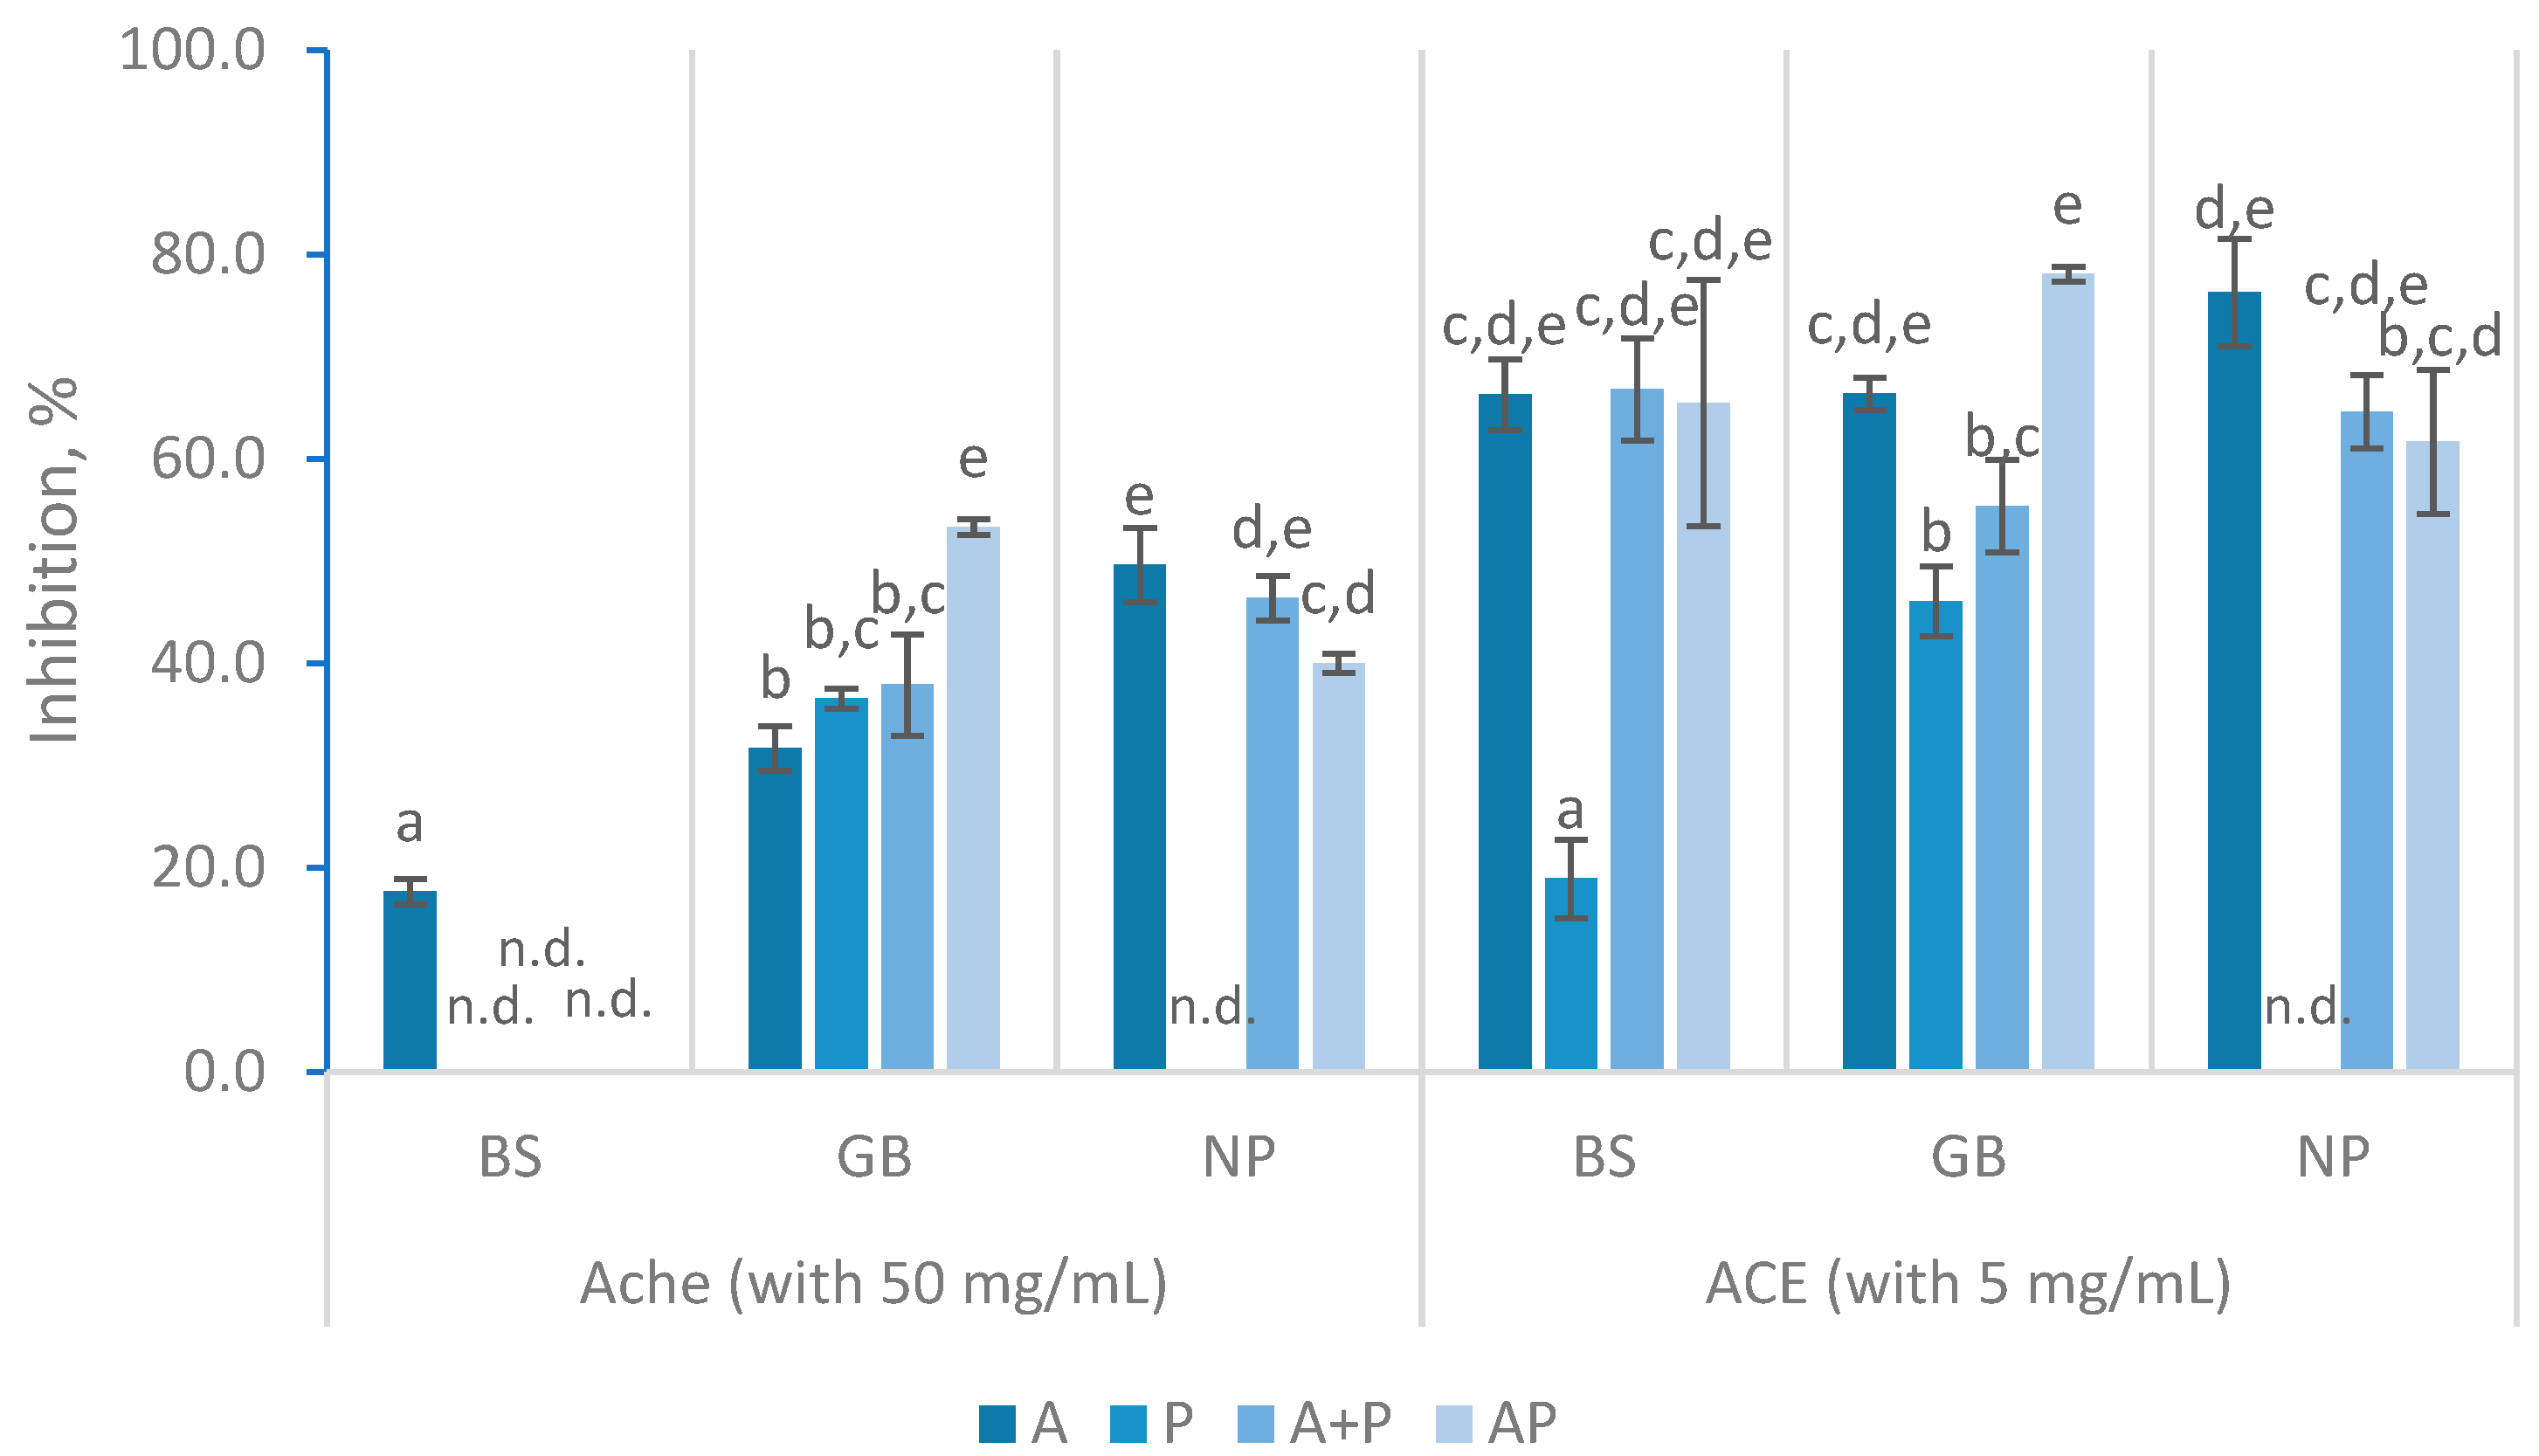

Table 1.
Proximate composition of black scabbardfish heads and bones (BS), gilthead seabream carcass (GB) and Nile perch trimmings (NP) co-products raw materials (RM, ww) and their final hydrolysates (dw) produced with the different enzyme combination (A, P, A+P and AP), in terms of protein, fat, moisture and ash content. Values correspond to average ± SD for n = 3. Different upper cases in the RM samples indicate statistically differences (p < 0.05). Different lower cases in the remaining samples indicate statistically differences between hydrolysates (p < 0.05).
| Co-Products | Protein, % | Fat, % | Moisture, % | Ash, % | |
|---|---|---|---|---|---|
| BS | RM | 14.3 ± 1.9 A | 8.1 ± 0.3 A | 71.0 ± 0.1 B | 6.9 ± 0.4 C |
| A | 77.1 ± 0.1 g | 2.3 ± 0.1 a,b | 5.4 ± 0.1 b | 15.2 ± 0.0 d | |
| P | 56.8 ± 0.2 a | n.d. | n.d. | n.d. | |
| A + P | 64.2 ± 0.4 c | 0.5 ± 0.0 a | 9.1 ± 0.1 f | 17.7 ± 0.1 f | |
| AP | 68.4 ± 0.0 d | 4.1 ± 0.2 c,d | 7.3 ± 0.3 c | 18.7 ± 0.7 f | |
| GB | RM | 16.5 ± 0.6 A,B | 11.6 ± 0.2 B | 60.9 ± 0.1 A | 5.3 ± 0.0 B |
| A | 70.0 ± 1.0 e | 5.6 ± 0.5 d | 4.5 ± 0.1 a | 16.5 ± 0.2 e | |
| P | 72.9 ± 0.5 f | 11.9 ± 1.0 f | 7.7 ± 0.0 d | 12.7 ± 0.0 b,c | |
| A + P | 59.6 ± 0.8 b | 12.1 ± 1.2 f | 7.2 ± 0.1 c | 17.7 ± 0.8 f | |
| AP | 77.1 ± 0.5 g | 9.3 ± 0.0 e | 5.5 ± 0.1 b | 9.7 ± 0.3 a | |
| NP | RM | 19.3 ± 0.3 B | 9.1 ± 0.9 A | 72.9 ± 0.1 C | 2.4 ± 0.2 A |
| A | 82.2 ± 0.2 h | 2.0 ± 0.4 a,b | 4.3 ± 0.1 a | 13.4 ± 0.3 c | |
| P | 86.5 ± 0.1 i | n.d. | 5.3 ± 0.0 b | 12.3 ± 0.1 b | |
| A + P | 68.6 ± 0.1 d | 3.6 ± 0.1 b,c | 8.7 ± 0.1 e | 16.3 ± 0.2 e | |
| AP | 81.7 ± 0.1 h | 3.3 ± 1.0 b,c | 5.2 ± 0.0 b | 12.7 ± 0.0 b,c |
* n.d. – not determined.
Table 2.
Degree of hydrolysis (DH), hydrolysis yield (Yh) and protein yield (Yp) for the different raw materials hydrolysates with Alcalase 2.4L (A), Protana Prime (P), the sequential addition of these enzymes (A+P) and for simultaneous addition (AP). Different lowercase (a, b) letters in each column indicate significant differences (p < 0.05) between FPH.
| Hydrolysate raw material | Enzyme | DH (%) | Y hydrolysis (%) | Y protein (%) |
| 180 min / 360 min | ||||
| BS | A | 25.9 ± 0.4 b | 12.5 ± 0.2 c | 68.3 ± 0.1 d |
| P | 28.2 ± 0.2 b,c | n.d. | n.d. | |
| A + P | 29.6 ± 0.5 c,d / 61.4 ± 0.9 i | 15.7 ± 0.3 d,e | 73.3 ± 0.4 f | |
| AP | 44.7 ± 0.5 g / 51.9 ± 0.9 h | 14.7 ± 0.3 c | 71.9 ± 0.0 e | |
| GB | A | 36.2 ± 0.6 f | 16.5 ± 0.3 d | 71.3 ± 1.0 e |
| P | 32.8 ± 1.2 e | 5.9 ± 0.1 b | 26.2 ± 0.2 b | |
| A + P | 31.8 ± 0.3 d,e / 52.0 ± 0.4 h | 18.8 ± 0.2 f | 67.9 ± 0.9 d | |
| AP | 50.8 ± 2.8 h / 58.1 ± 0.8 g | 16.9 ± 0.3 e | 80.7 ± 0.7 g | |
| NP | A | 28.5 ± 2.9 b,c | 14.0 ± 1.76 c | 55.4 ± 0.1 c |
| P | 8.5 ± 0.4 a | 3.4 ± 0.2 a | 16.2 ± 0.0 a | |
| A + P | 29.3 ± 0.7 c,d / 56.1 ± 1.8 g | 11.3 ± 0.3 g | 79.7 ± 0.1 g | |
| AP | 36.5 ± 0.6 f / 45.0 ± 1.5 g | 12.6 ± 0.4 f | 80.8 ± 0.1 g |
n.d. – not determined.
Table 3.
Molecular weight distribution (percentage of total area) obtain for the hydrolysates from the different raw materials with Alcalase 2.4L (A) and Protana Prime (P) at the final stage (180 min*) and with sequential addition of this enzymes (Alcalase followed by Protana, A+P) and simultaneous addition (Alcalase and Protana, AP) at an initial stage (5 min), middle point (180 min) and final stage (360 min).
| Enzyme | Time (min) | Range | Peak area (%) | ||
|---|---|---|---|---|---|
| BS | GB | NP | |||
| Alcalase (A) | 180 * | >1000 Da | 23.6 | 19.7 | 21.3 |
| 1000-500 Da | 13.0 | 20. 2 | 10.5 | ||
| 500 - 100 Da | 55.1 | 56.1 | 68.3 | ||
| <100 Da | 8.2 | 4.0 | --- | ||
| Protana (P) | 180 * | >1000 Da | n.d. | 4.7 | 5.1 |
| 1000-500 Da | n.d. | 22.2 | 6.2 | ||
| 500 - 100 Da | n.d. | 68.9 | 83.6 | ||
| <100 Da | n.d. | 4.3 | 5.04 | ||
| Alcalase followed by Protana (A+P) |
5 | >1000 Da | 26.3 | 17.7 | 17.2 |
| 1000-500 Da | 6.2 | 18.0 | 4.6 | ||
| 500 - 100 Da | 59.1 | 60.6 | 78.2 | ||
| <100 Da | 8.3 | 3.8 | --- | ||
| 180 | >1000 Da | 24.1 | 15.4 | 21.8 | |
| 1000-500 Da | 12.1 | 21.0 | 8.8 | ||
| 500 - 100 Da | 53.6 | 59.0 | 69.5 | ||
| <100 Da | 10.2 | 4.6 | --- | ||
| 360 | >1000 Da | 15.8 | 7.67 | 9.0 | |
| 1000-500 Da | 11.3 | 19.89 | --- | ||
| 500 - 100 Da | 54.3 | 62.2 | 80.9 | ||
| <100 Da | 18.6 | 10.23 | 10.1 | ||
| Alcalase and Protana (AP) |
5 | >1000 Da | 24.9 | 17.2 | 22.2 |
| 1000-500 Da | 5.0 | 16.8 | 4.9 | ||
| 500 - 100 Da | 59.2 | 62.8 | 68.8 | ||
| <100 Da | 11.0 | 3.1 | 4.1 | ||
| 180 | >1000 Da | 14.4 | 10.0 | 15.7 | |
| 1000-500 Da | 17.5 | 17.4 | 10.8 | ||
| 500 - 100 Da | 50.2 | 60.6 | 66.5 | ||
| <100 Da | 17.8 | 12.0 | 7.0 | ||
| 360 | >1000 Da | 9.6 | 8.7 | 11.7 | |
| 1000-500 Da | 25.3 | 16.1 | --- | ||
| 500 - 100 Da | 47.2 | 62.1 | 79.3 | ||
| <100 Da | 17.8 | 13.1 | 9.0 | ||
n.d. – not determined.
Table 4.
Enzyme combinations and hydrolysis conditions (time, temperature, pH, and enzyme/substrate ratio).
Table 4.
Enzyme combinations and hydrolysis conditions (time, temperature, pH, and enzyme/substrate ratio).
| Enzyme | Time (min) | Temperature (°C) | pH | E/S ratio (v/w) |
| Alcalase (A) | 180 | 60 | 8.5 | 1% |
| Protana (P) | 180 | 55 | 5.5 | 1% |
| Alcalase + Protana (A+P) | 180; 180 | 55 | 8.5 (A); 5.5 (P) | 1% (A); 1% (P) |
| Alcalase and Protana (AP) | 360 | 55 | 7 | 1% and 1% |
Disclaimer/Publisher’s Note: The statements, opinions and data contained in all publications are solely those of the individual author(s) and contributor(s) and not of MDPI and/or the editor(s). MDPI and/or the editor(s) disclaim responsibility for any injury to people or property resulting from any ideas, methods, instructions or products referred to in the content. |
© 2024 by the authors. Licensee MDPI, Basel, Switzerland. This article is an open access article distributed under the terms and conditions of the Creative Commons Attribution (CC BY) license (http://creativecommons.org/licenses/by/4.0/).
Copyright: This open access article is published under a Creative Commons CC BY 4.0 license, which permit the free download, distribution, and reuse, provided that the author and preprint are cited in any reuse.


