Submitted:
03 December 2024
Posted:
03 December 2024
You are already at the latest version
Abstract
The construction industry faces persistent inefficiencies, with projects often failing to meet time, cost, quality and other conditions of satisfaction. This study investigates real estate owners’ early perceptions of Lean Integrated Project Delivery (Lean IPD) as a potential solution, analysing the acceptance of principles such as early stakeholder involvement, risk-reward compensation, and open-book accounting among other key features in Lean IPD. A survey of 62 professionals in Real Estate development compa-nies in Spain was conducted, analyzing their experience with collaborative contracts and Lean techniques, including Last Planner System and Target Value Design. Statis-tical methods such as hierarchical clustering and PLS-SEM modeling revealed two dis-tinct groups: those receptive to Lean IPD’s economic mechanisms and those less in-clined. While governance principles like early collaboration and team co-responsibility received widespread support, skepticism was noted toward economic transparency practices due to cultural and structural barriers. Additionally, the findings indicate a significant gap in formal training for Lean IPD. Despite challenges, there is strong in-terest in adopting Lean IPD, driven by its potential to address critical project ineffi-ciencies. The study concludes that successful Lean IPD implementation requires stra-tegic leadership from owners, targeted training programs, and a cultural shift within the industry to embrace collaborative and transparent practices.
Keywords:
Integrated Project Delivery (IPD)
; Owner
; Lean Construction
; Lean IPD
; Project Management
; Construction Management
; Engineering
; Construction
1. Introduction
The outcomes of construction projects are poor. Despite efforts, innovations in management techniques, and increasing digitization, projects repeatedly fail to be delivered on time, within budget, and meeting the conditions of satisfaction required by their owners [1]. The value of the average dispute from construction activities grew since 2010 until 2022. In 2022, the average global dispute value was 52.6 million USD, with an average resolution time of 15.4 months [2,3]. Productivity has remained stagnant since the 2000s, with a compound annual growth rate of 0.4%, compared to 3% in manufacturing and 2% in the overall economy [4]. This failure, in addition to negatively impacting financial results for all stakeholders, affects their motivation, mental health [5] and ultimately, environmental sustainability [6,7,8]. The situation is unsustainable, and urgent action is required.
It is essential to redesign project governance from scratch, establishing rules that eliminate waste and maximize the talents and capabilities of all stakeholders to achieve project objectives.
The benefits of Lean Integrated Project Delivery (Lean IPD) have been widely demonstrated by the scientific community [9], but its application is far from being the standard in the sector.
The implementation of Lean IPD significantly depends on the context in which it is carried out. Each country presents unique conditions, such as regulatory frameworks, levels of conflict, openness to change, or the degree of Lean Construction adoption, among others. The effects of implementing Lean IPD have been studied from various perspectives in countries such as the United States[10,11,12,13], Canada[14,15,16], China[17,18] , Germany [19], France [20], Norway [21,22], Colombia [23], Peru [24] and the Middle East [25,26], among others. However, little attention has been paid to the role of owners as the true drivers of this delivery method.
Real estate developers have the power to establish the rules under which design and construction projects are managed. The success and dissemination of Lean IPD as a delivery method depend on developers deciding to implement it. This research observes the level of acceptance of the various principles of Lean IPD while highlighting possible barriers and opportunities to drive its future adoption.
Despite its critical importance, scientific literature on Lean IPD provides little depth regarding the role of real estate developers and their capacity to make strategic project decisions. Authors like Fischer, Allison, or Mosey illustrate the functioning of IPD through the inclusion of quotes or advice from developers for the successful implementation of IPD [27,28,29]. However, these references do not analyze their perceptions or concerns in depth or in a structured way. Bhonde, on the other hand, focuses on the role of developers, identifying possible barriers through various study groups. However, his research is purely qualitative and does not identify the relative importance of these barriers for the sample nor does it explore potential opportunities [14].
The main finding of this research is that opinions on Lean IPD largely depend on respondents’ perceptions of Open Books, first, and risk-reward compensation, second.
Secondly, the high level of acceptance of principles related to governance and team management stands out, such as early stakeholder involvement, shared decision-making responsibility, intensive owner involvement, or co-location.
Regarding the state of affairs in Spain, it is evident that developers have more experience with collaborative contracts than with the application of Lean techniques such as the Last Planner System (LPS), Target Value Design (TVD), or Value Stream Mapping (VSM). A low level of training in these areas is observed, but there is a high interest in expanding training.
As for the relative importance developers place on these topics compared to other concerns, it is noteworthy that design and construction are not seen as critical issues for developers. While Lean Construction and IPD generate interest, they do not reach the level of other megatrends such as sustainability, digitization, or industrialized construction.
2. Materials and Methods
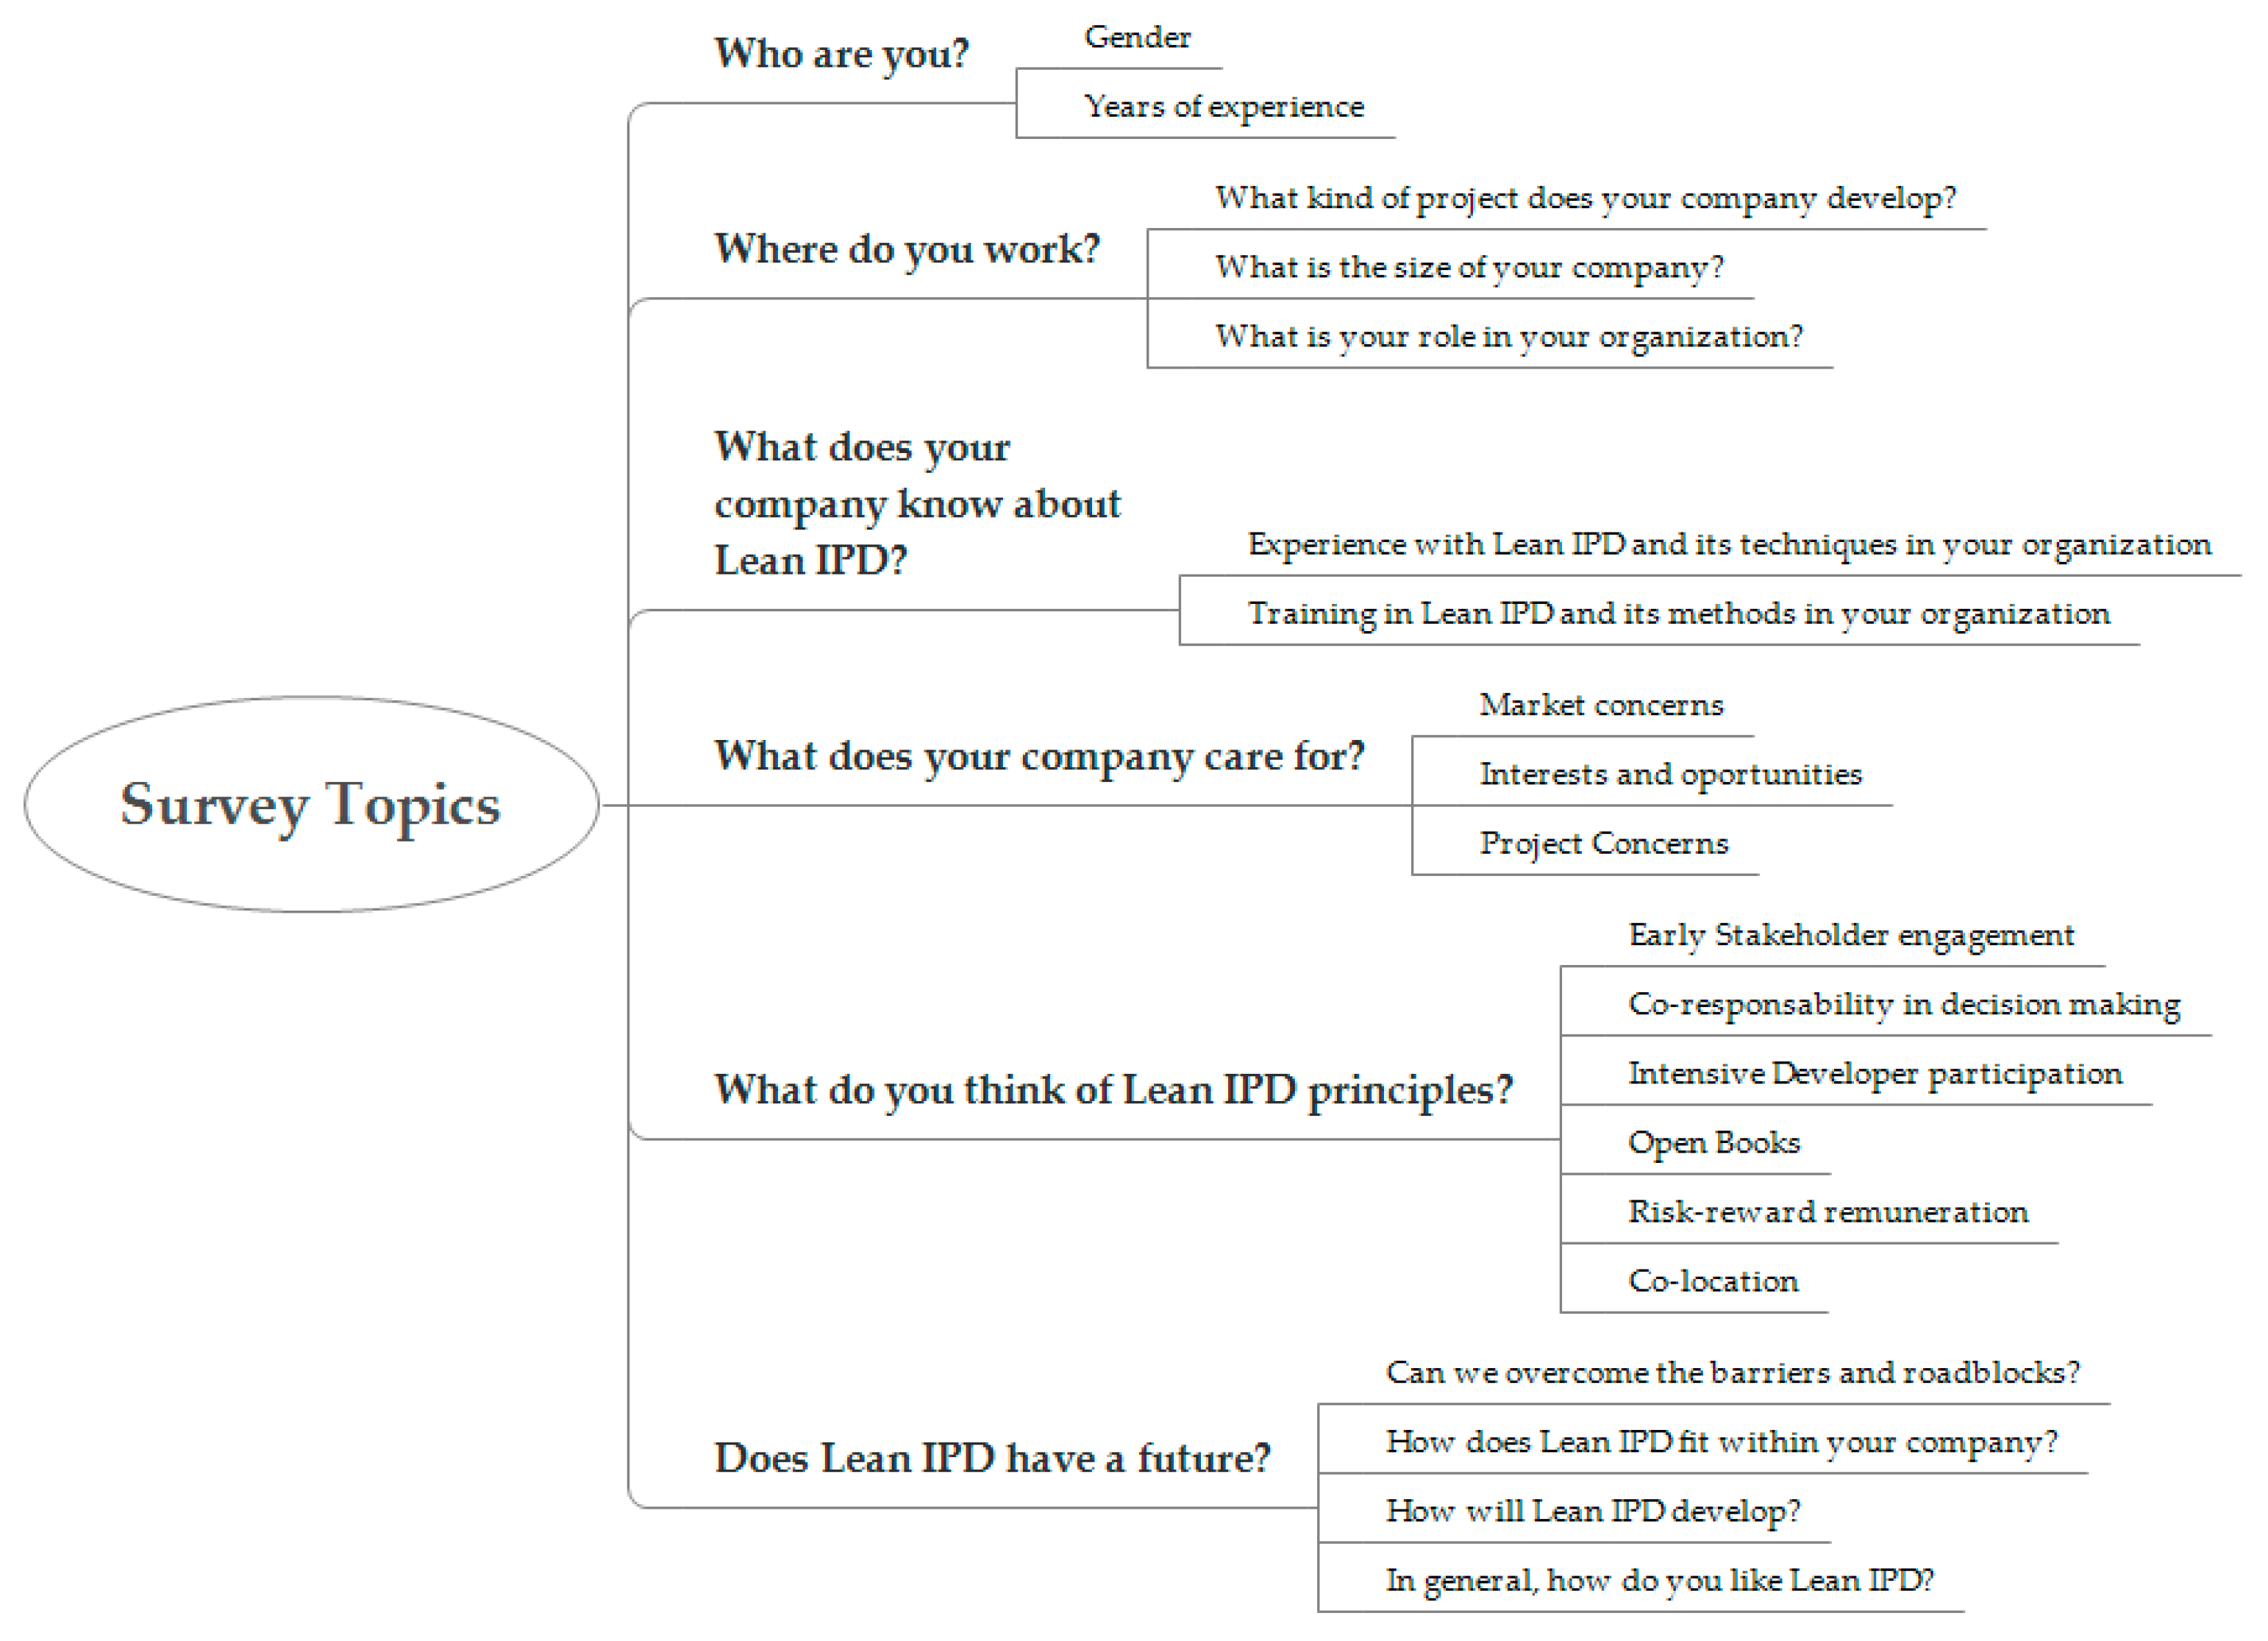
This research is based on the results obtained from surveys completed by 62 professionals working in real estate development companies. The questionnaire, consisting of 47 questions, was divided into six sections: Who are you?, What does your company know?, What does your company care for?, What do you think of Lean IPD principles?, and Does Lean IPD have a future? The core questions of the study are from the last two sections, which were collected using a Likert scale to facilitate analysis and interpretation.
Before its distribution, the questionnaire was shared with three industry experts to ensure that the questions were sufficiently clear and that the data collection method functioned properly. Thanks to this consultation, some questions were reformulated, and errors were avoided. The questionnaire was distributed between September 2023 and June 2024. In addition to being shared on social media and among the direct contacts of the authors, it was distributed through various provincial associations of real estate development companies across Spain. It also benefited from the collaboration of several training centers specializing in real estate and multidisciplinary associations in the construction sector.
Figure 1.
Survey Topics.
Despite the representation of companies of various sizes, most companies in the sample are small or medium-sized, with 53.2% having fewer than 50 employees. The segmentation by company size shows a steady decrease in frequency as company size increases. This is consistent with the typical structure of the industry, where small and medium-sized enterprises are more common than large ones. Similarly, companies focused on residential project development are overrepresented in the sample (67.74%) compared to other segments such as office projects (6.45%), commercial-retail (8.06%), or hospitality (4.84%). The actual market structure differs: the living sector leads Spanish real estate investment in 2024 with 27% of the total, followed by hospitality (25%), retail (20%), offices (15%), industrial (7%), and alternative uses and healthcare around 6% [30]. Due to the size and divergence of the sample from the real market structure, differences between sectors were not analyzed in this study.
Most respondents are men (70.97%), which may reflect a reality in the real estate industry where men have greater presence and public exposure, making them more accessible. However, it should be noted that bidirectional analyses (tau-b, tau-c, and Spearman) showed no statistically significant correlations between the responses and the participants' genders. Thus, gender was irrelevant for the purposes of this analysis.
The analysis of the variable "Role" within the sample reveals a predominance of leadership and management roles (43.55%), with significant representation from owners and partners (19.35%). The presence of technical and other roles indicates the representation of the complex organizational structure of real estate companies.
There is a balanced distribution in years of experience among the developers in the sample, ranging from less than 15 years to more than 30 years of experience. This diversity may help provide visibility to different positions within the study group. Despite this distribution, the majority of developers have more than 20 years of experience (61.3%), suggesting that the sample comprises highly experienced professionals, indicative of a deep understanding of the market.
The data was collected through Google Forms and analyzed using IBM SPSS statistical software. Descriptive analyses were performed, including mean, median, standard deviation, variance, skewness, standard error of skewness, kurtosis, standard error of kurtosis, minimum, maximum, and percentiles. These statistics allowed for the identification of potential biases in the distribution and an evaluation of data normality, which was key in determining subsequent analyses.
Several analyses were conducted to reveal latent relationships. The first was a Hierarchical Cluster Analysis. The resulting dendrogram shows that, starting at stage 13, two clusters of comparable sizes emerge.
The second study involved the development of two PLS-SEM models, which delved deeper into the relationships of the variables highlighted by the Hierarchical Cluster Analysis. These models corroborated the indications from the dendrogram and provided further insights into the relationships between the variables and their importance in shaping perceptions of Lean IPD.
Lastly, a bivariate correlation analysis was conducted on the responses using different methods depending on the nature of the data. Kendall’s tau-b and tau-c were used to analyze relationships between ordinal variables, depending on whether the matrices were rectangular or square. Spearman’s correlation was applied due to the ordinal nature of the data, the lack of normal distribution in most variables, and the small sample size. Spearman allowed for the evaluation of monotonic relationships without assuming a strictly linear relationship or normality in the data [31].
Of the 166 statistically significant correlations (p < 0.05), 80 had coefficients considered strong (p < 0.01). Among these 80, the seven most relevant correlations were analyzed, considering the results from the Hierarchical Cluster Analysis and the PLS-SEM models.
Through the study of bivariate correlations, a more comprehensive understanding of the latent relationships among the study variables was achieved, allowing for insights into how seemingly isolated variables directly affect each other.
3. Results
3.1. Experiencies and Training in Lean IPD
3.1.1. Experience
To understand the experience of real estate development companies with Lean and IPD, participants were asked about the most common techniques, such as the implementation of the Last Planner System®, the use of collaborative contracts, or the application of Target Value Design. It is important to note that many professionals currently refer to collaborative contracts when they are actually discussing the application of certain Lean IPD principles, usually early stakeholder involvement during the design phase. Thus, under the term "collaborative contracts," each respondent may have considered something slightly different. Regardless of the terminology, there is a perception that what they have practiced is distinct from traditional contracting.
That said, the majority of respondents (46.8%) reported having experience with collaborative contracts in 1 to 5 projects, while 38.7% reported no experience with such contracts. Only a small fraction has worked on more than 5 projects involving collaborative contracts. These findings reinforce the idea that experience with collaborative contracts is mostly moderate and aligns with a median of 2.00 (experience in 1–5 projects).
A significant majority of respondents (67.7%) reported having no experience with Target Value Design. Only 21.0% have worked on 1 to 5 projects, and 11.3% have worked on 5 to 10 projects. These findings confirm that experience with Target Value Design is considerably low among the respondents, as reflected by the median of 1.00 in the initial statistics table, indicating that most individuals have little to no experience with TVD.
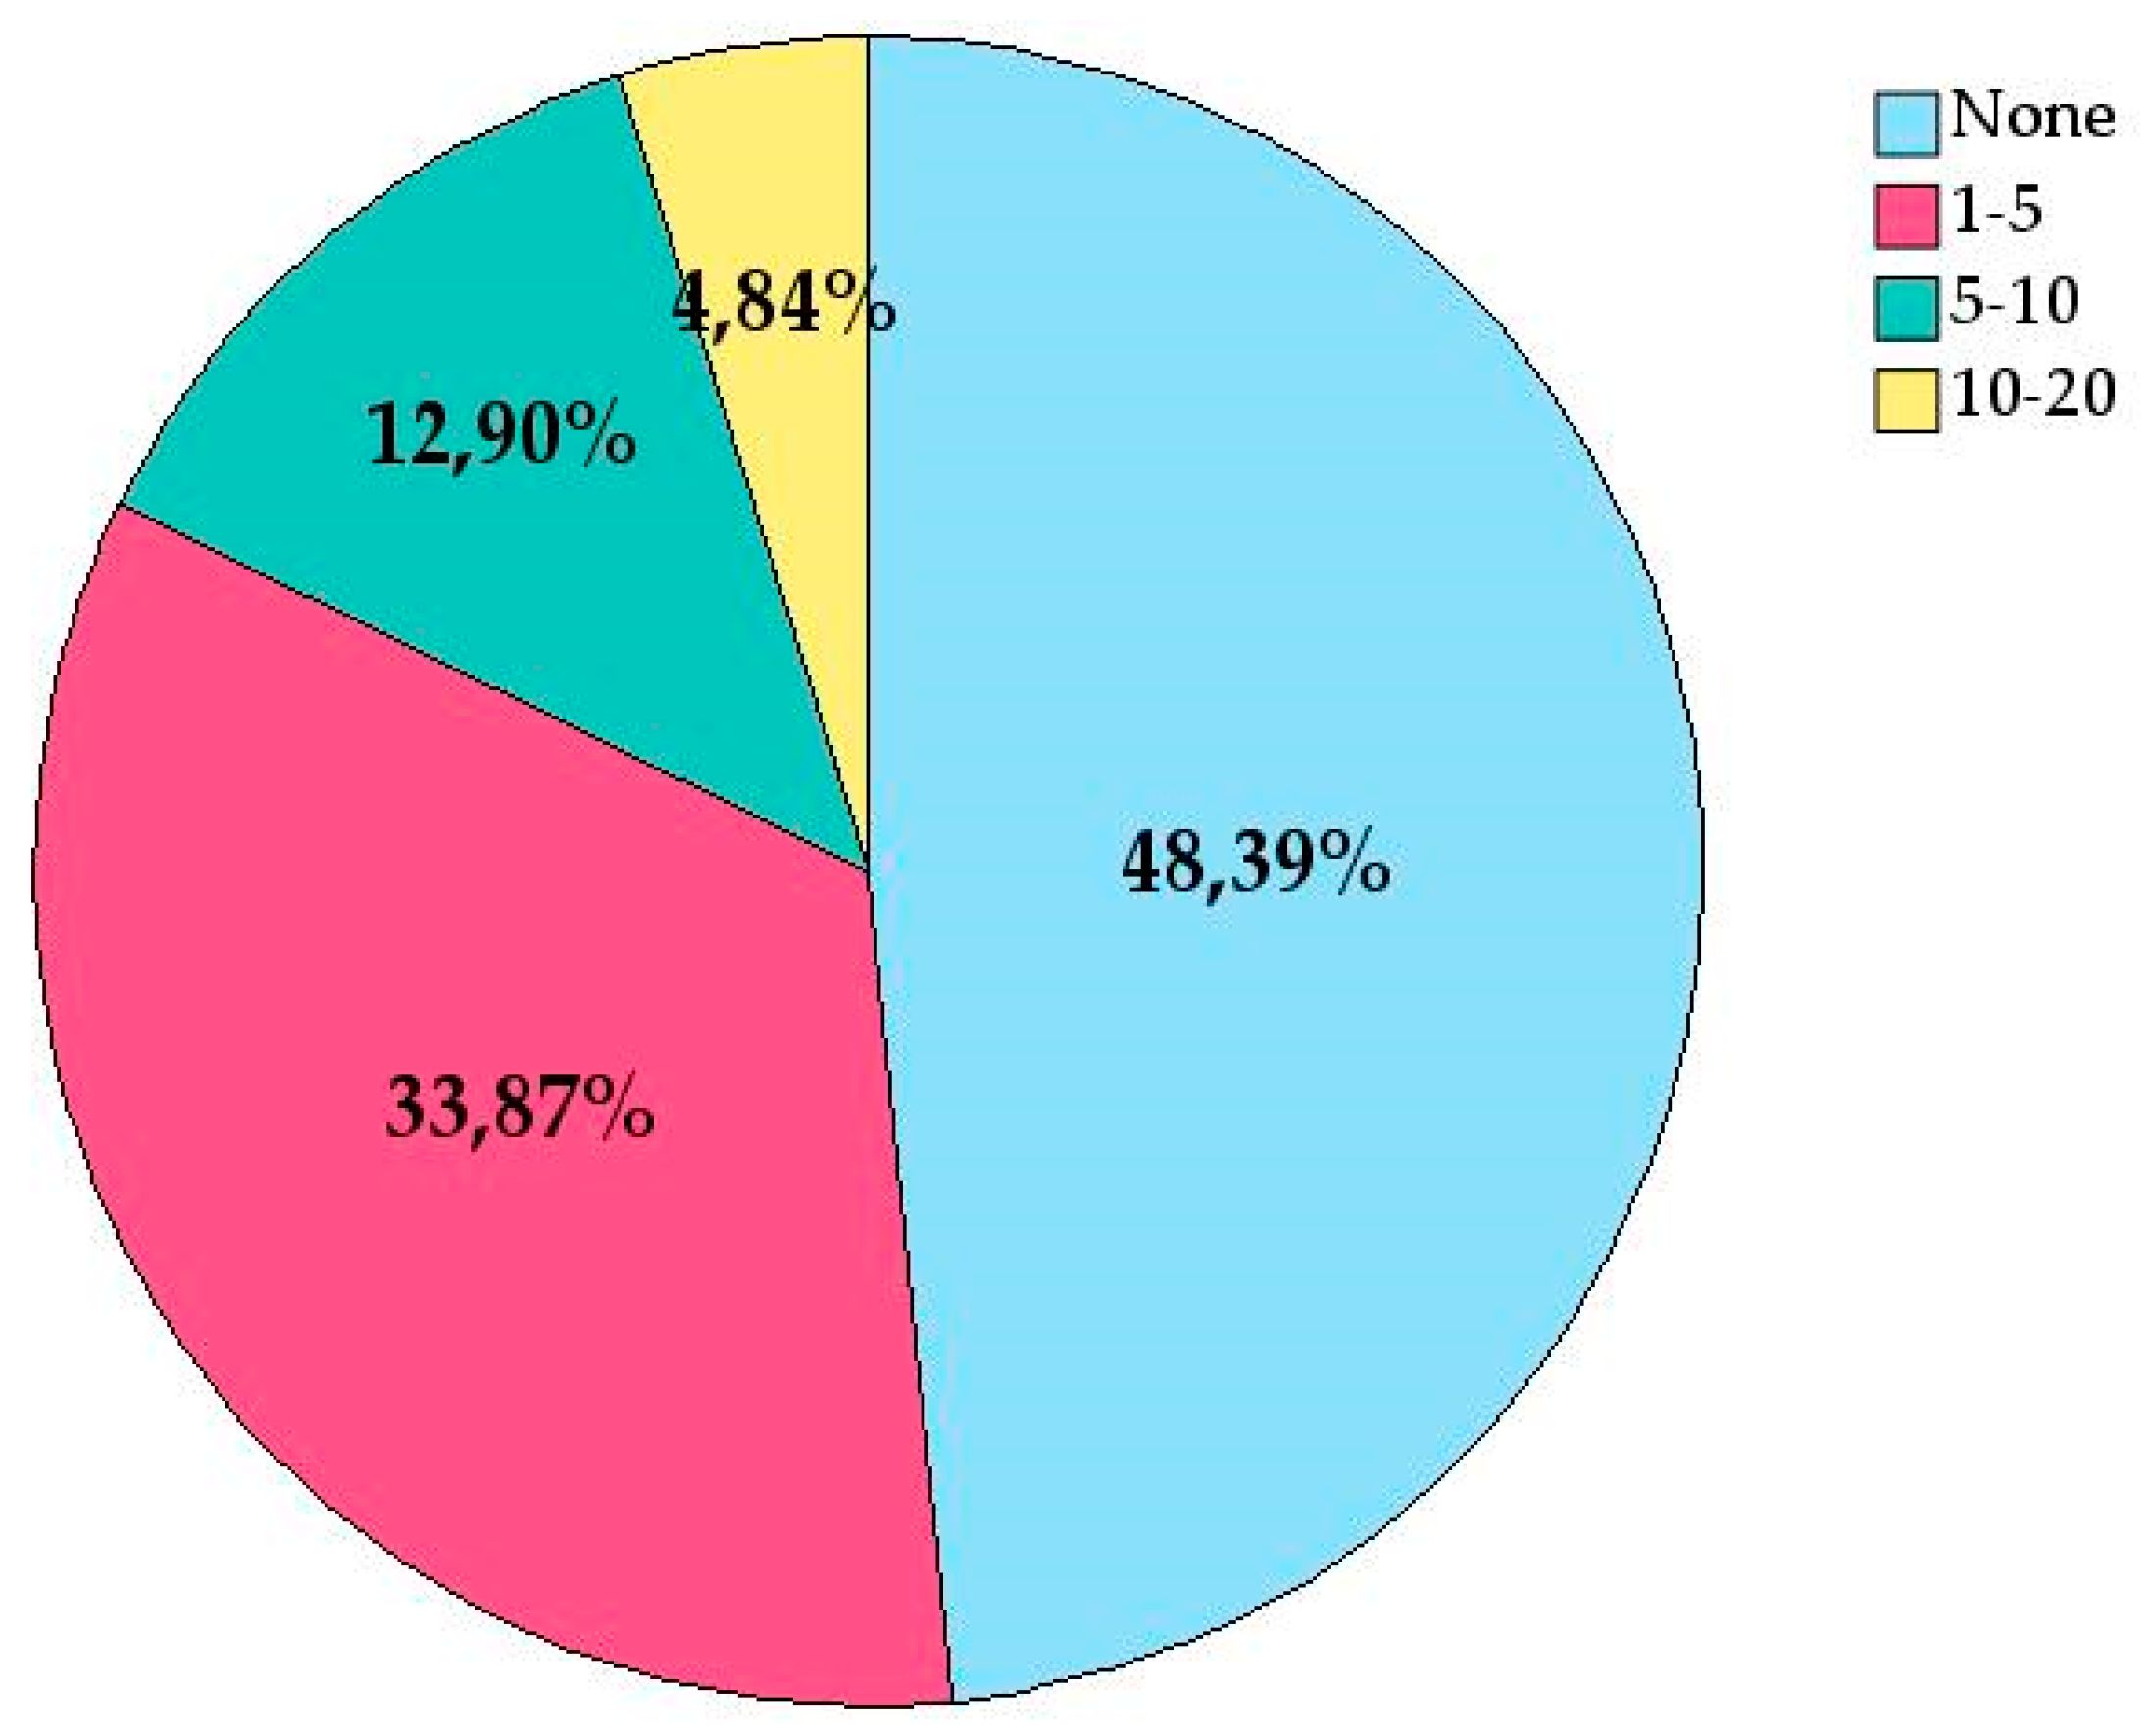
Nearly half of the respondents (48.4%) reported no experience with the Last Planner System, while 33.9% have experience in 1 to 5 projects. These findings suggest that experience with this system is lower compared to collaborative contracts. The median of 2.00 in the initial statistics table indicates that, although a significant portion of respondents have some experience, the majority fall within the lowest level (1–5 projects).
From the above, it can be concluded that respondents have the most experience with collaborative contracts, followed by the Last Planner System, and significantly less with Target Value Design. Most respondents have experience with collaborative contracts in up to 5 projects, while experience with the Last Planner System is more varied, although a large portion still lacks experience. In the case of Target Value Design, the majority have no experience, which is clearly reflected in the high levels of skewness and kurtosis in the initial data distribution.
Figure 2.
-Experience with collaborative contracting.
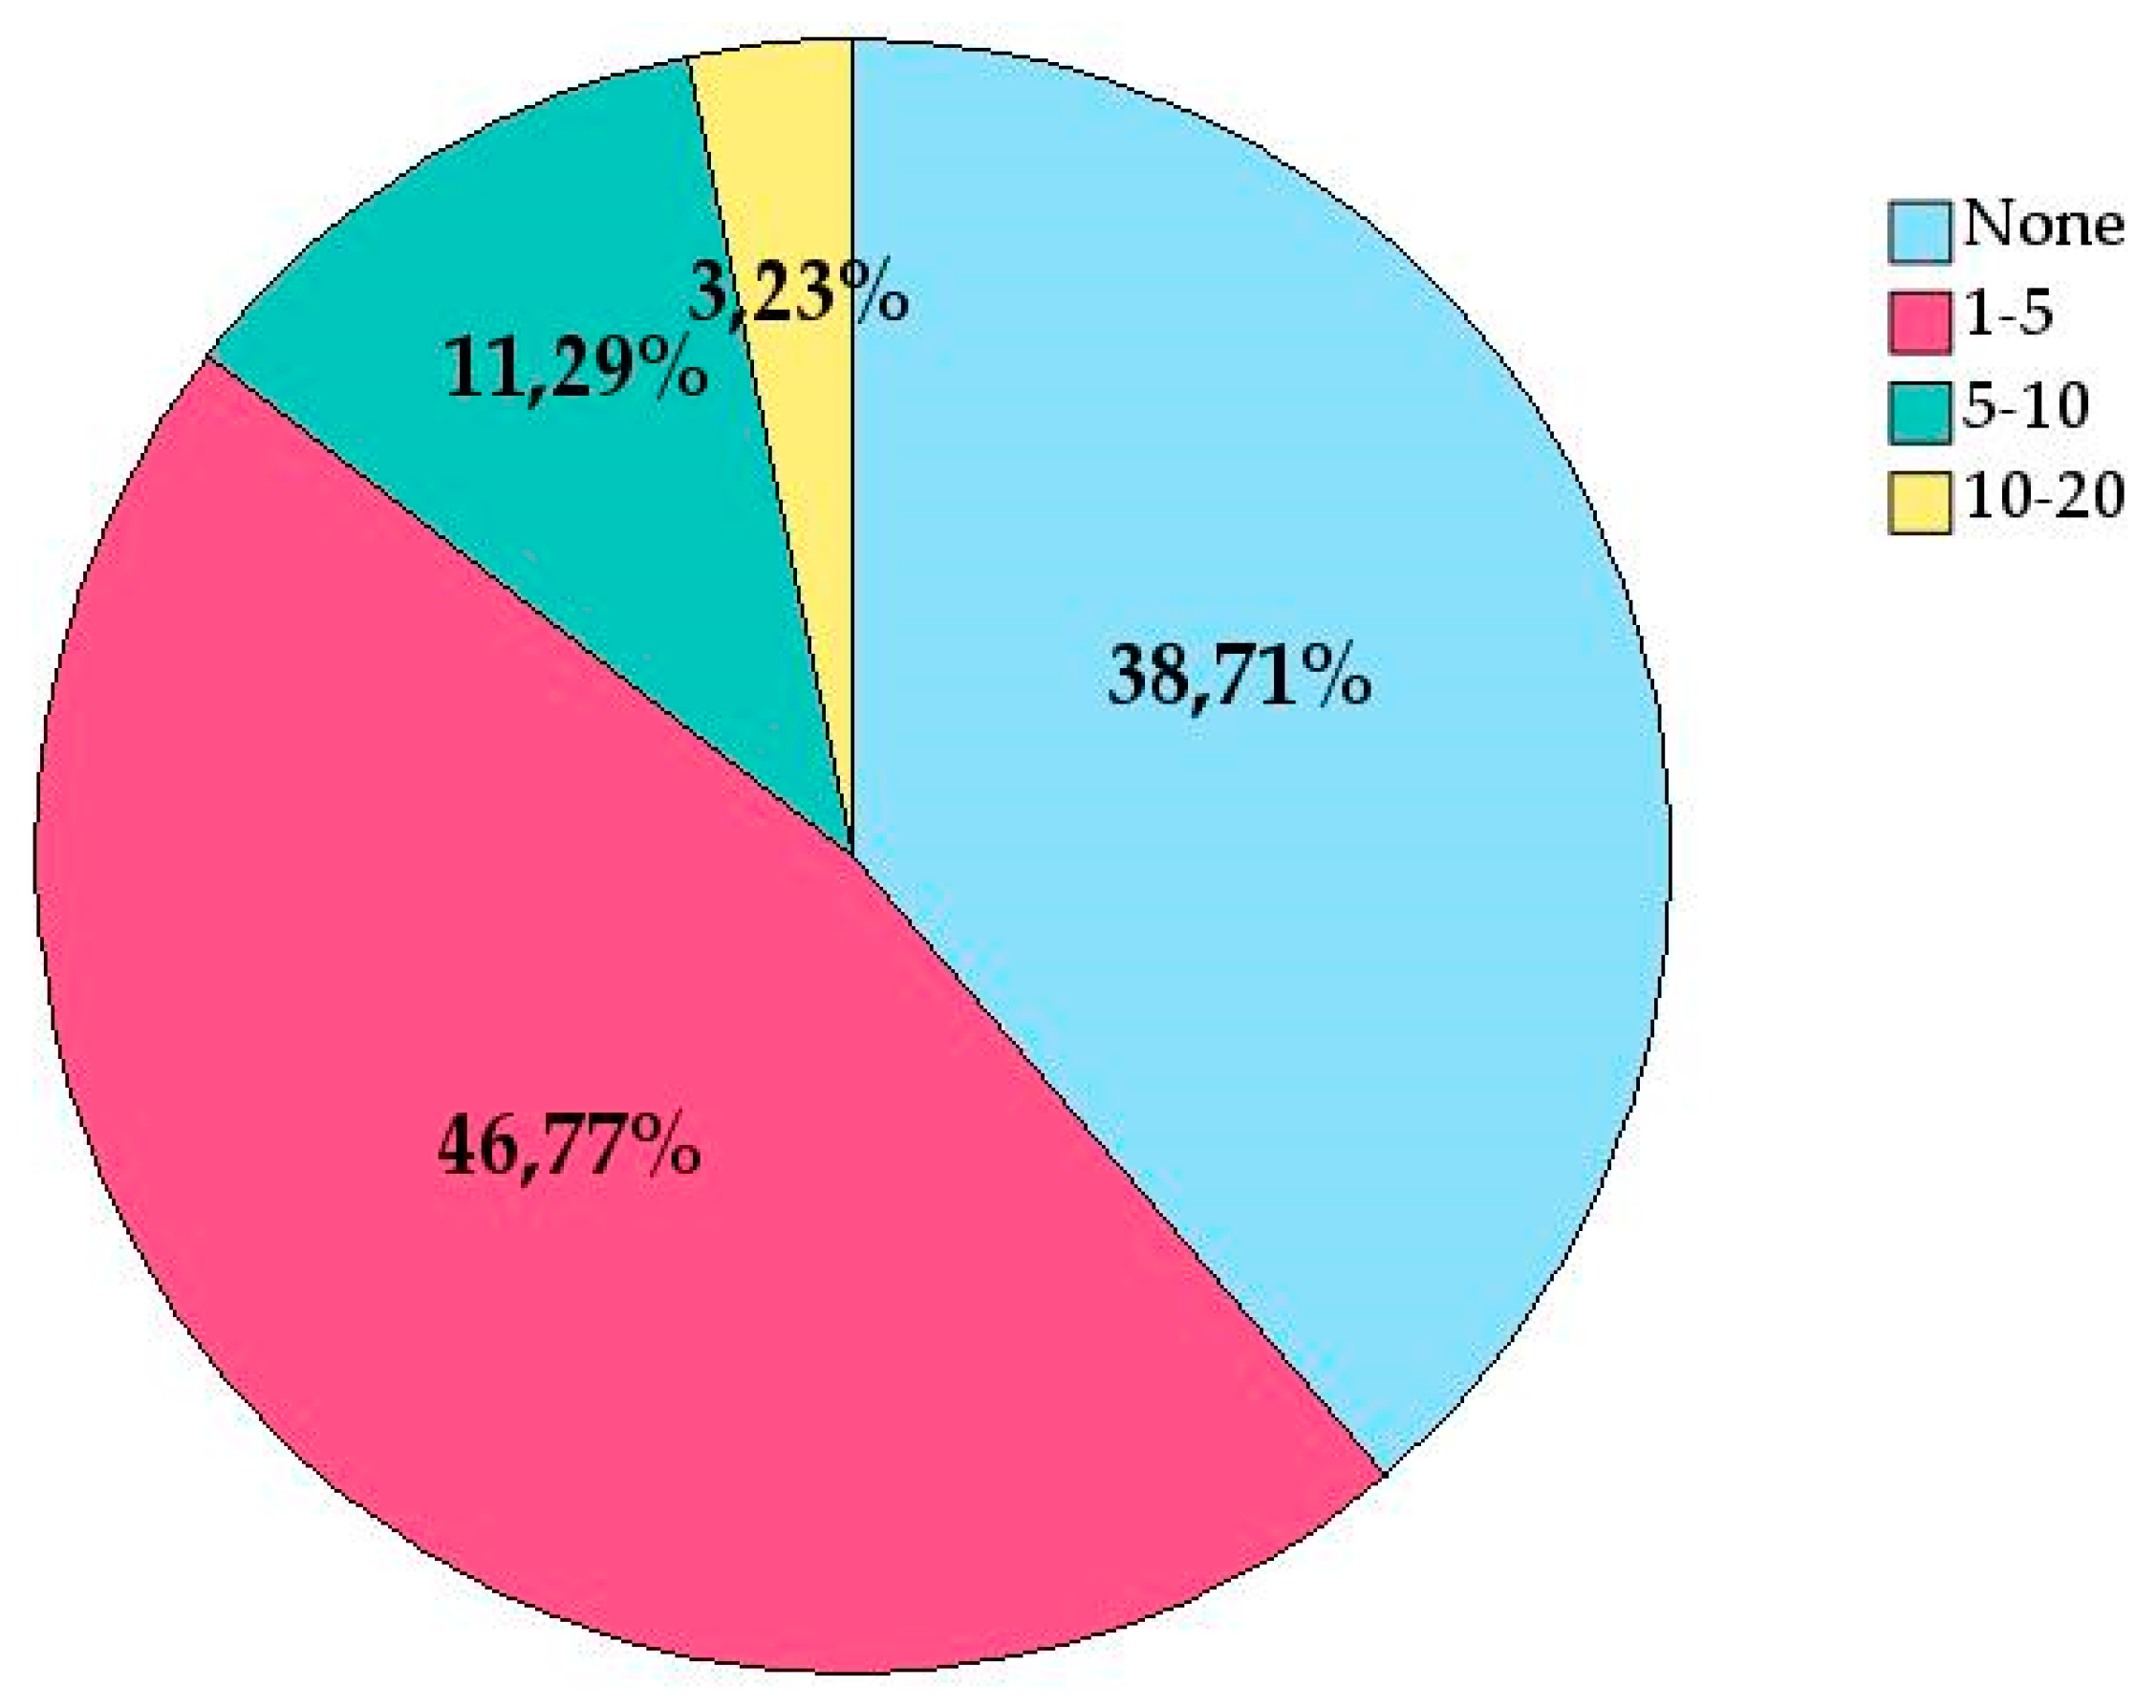
Figure 3.
Experience with Target Value Design.
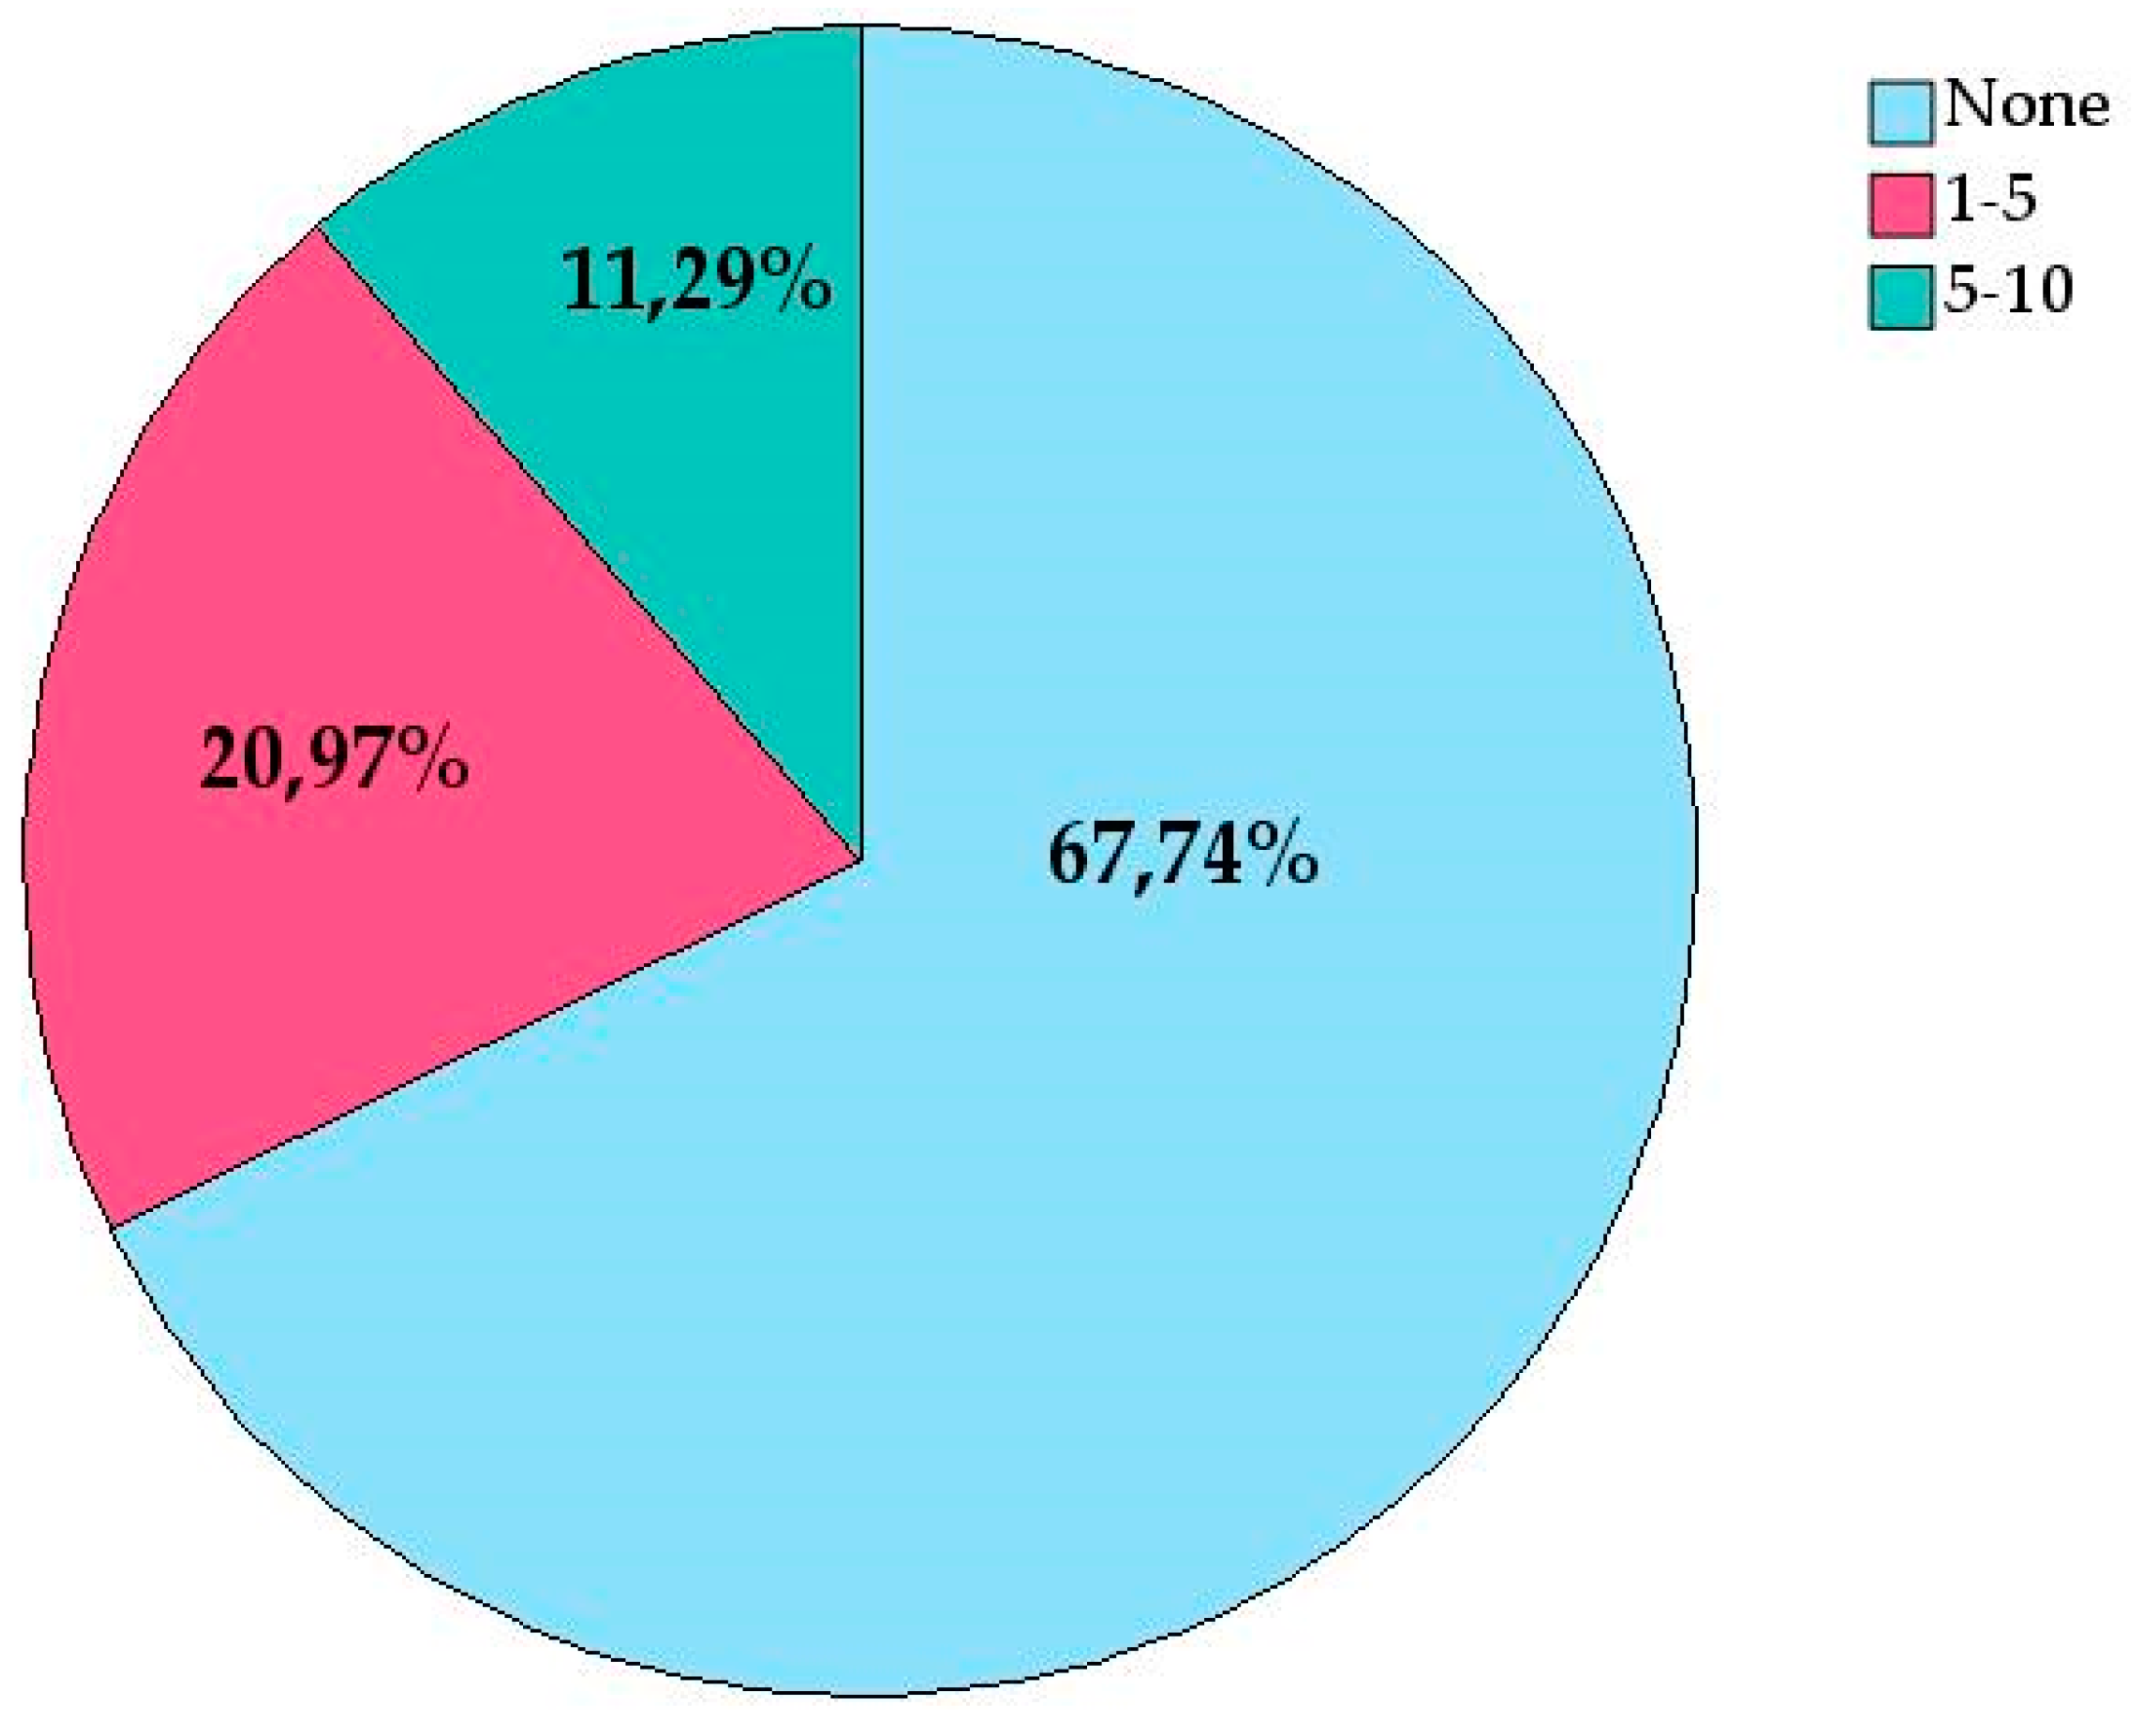
Figure 4.
Experience with Last Planner System.
3.1.2. Training
In the construction sector, professionals typically gain training through pilot projects. It is common for companies embarking on a project that includes an innovative aspect to train their employees using an approach that combines theoretical training with the practical application of this knowledge in a real project. Both the demand for and supply of training in Lean Construction and IPD are still limited. There are few centers and courses offering this type of training. The study examined the number of people in companies with self-taught training in Lean IPD, those who had completed a master's degree including these topics, and those who had attended certified workshops and/or specialized courses.
A total of 30.6% of respondents reported that their company had no personnel with self-taught training in Lean IPD. Meanwhile, 59.7% indicated that their company had between one and five self-taught individuals, and 9.7% stated that their organization had between five and ten employees with self-taught training in Lean IPD.
The vast majority of respondents (91.9%) affirmed that no one in their organization had completed a master's program with content related to Lean IPD. Very few (6.5%) reported that their company had between one and five individuals who had completed such master's programs. Only one respondent indicated that their organization had between five and ten people who had undergone master's-level training in Lean IPD. This raises the question of whether respondents are fully aware of their colleagues' training or the content of the master's programs in which they enroll.
Most respondents (72.6%) reported that no one in their organization had participated in certified workshops and/or specialized courses on Lean IPD. A quarter of the sample (25.8%) indicated that their organization had between one and five people trained in this way, while only one respondent stated that more than ten individuals in their organization had received certified specialized training.
Figure 5.
People Trained in Certified Workshops and/or Specialized Courses.
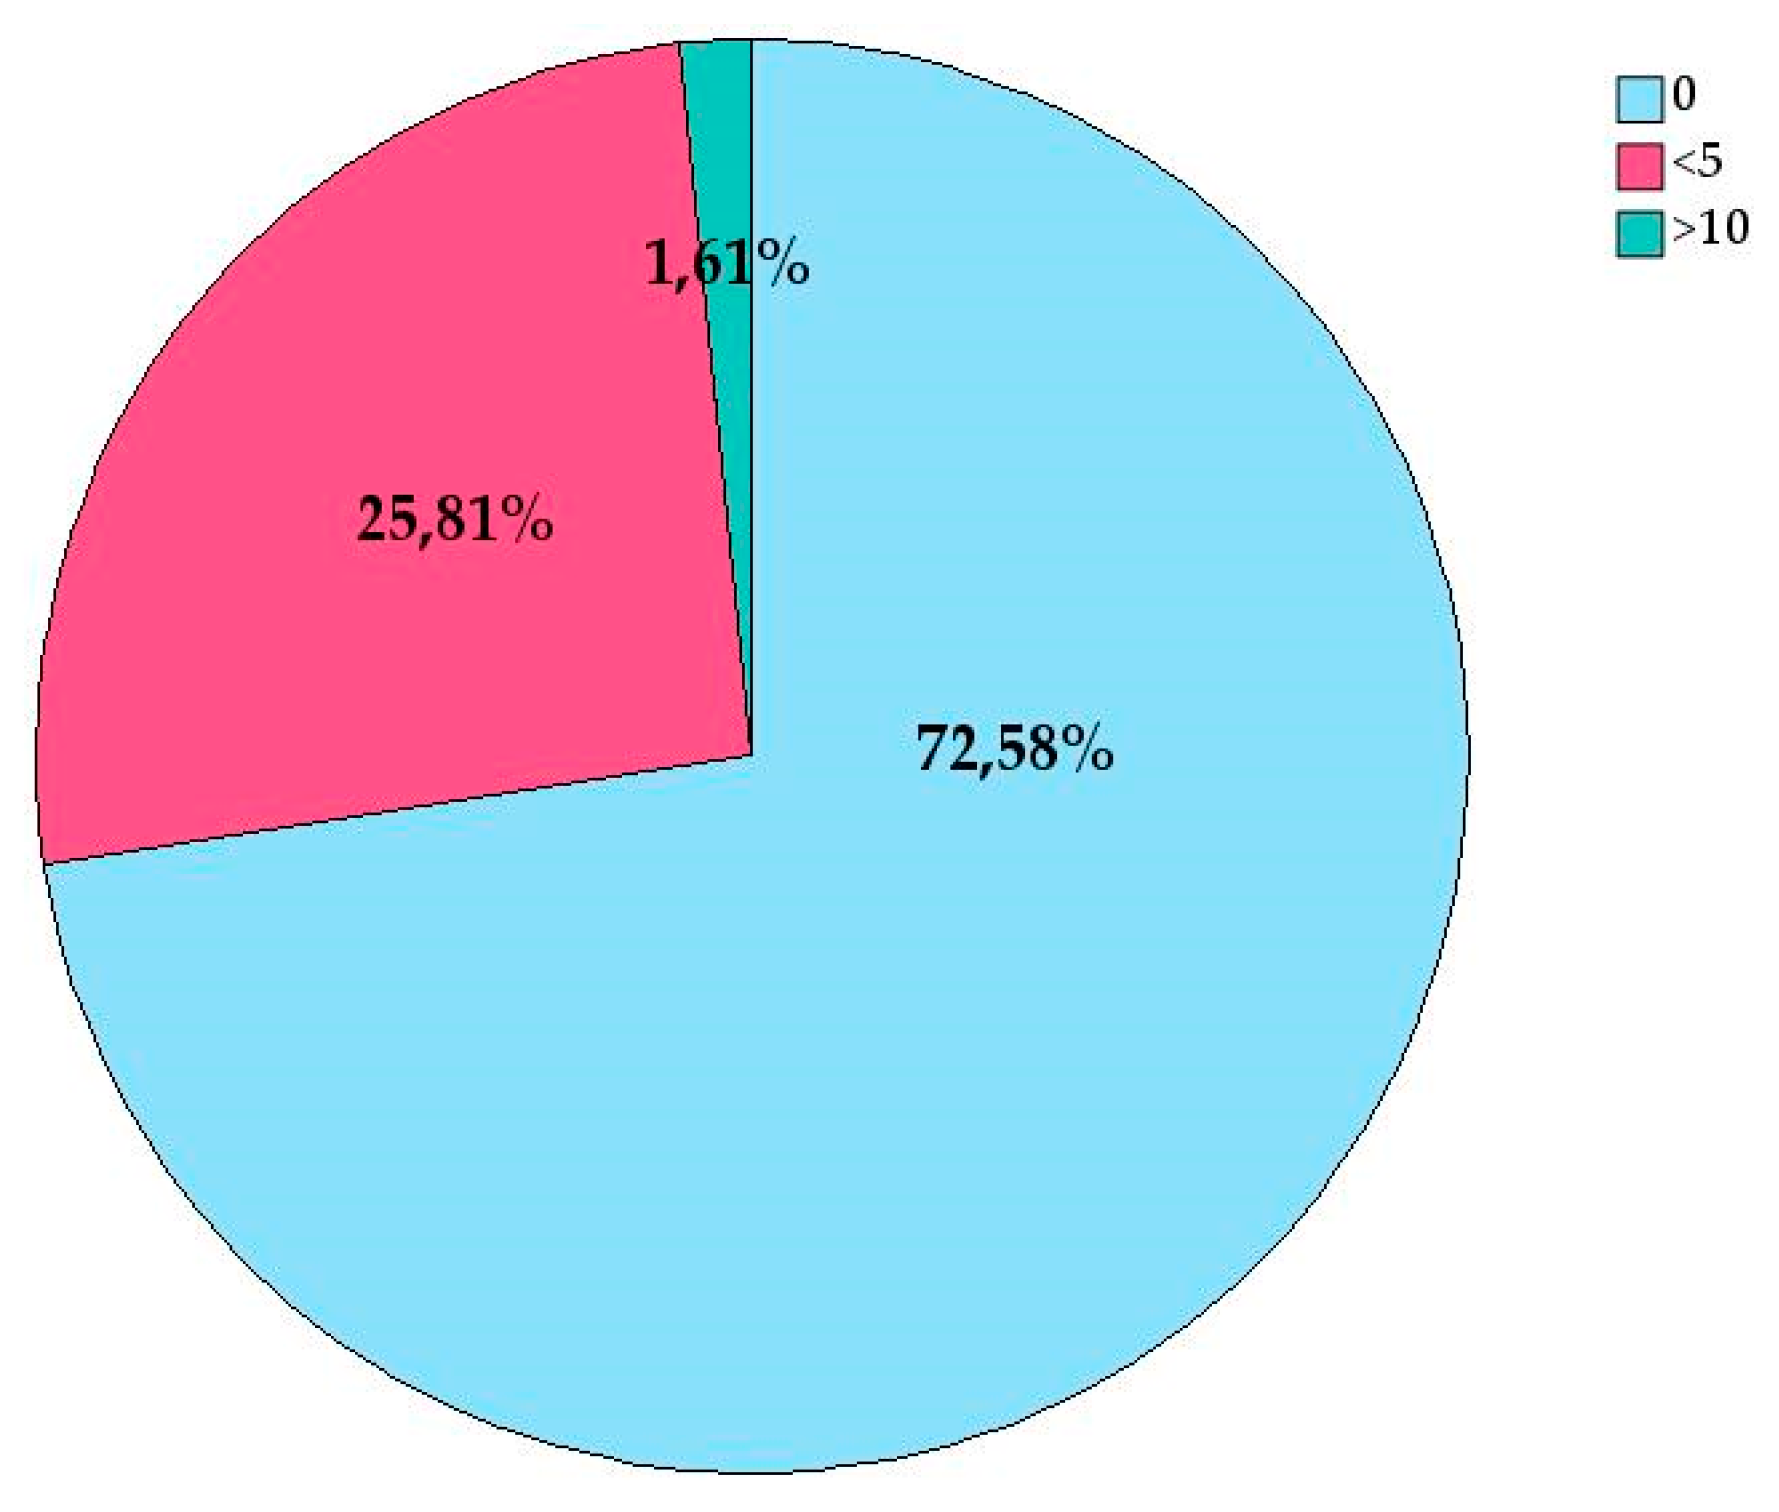
Figure 6.
People Trained in Master's Programs with Lean IPD Content.
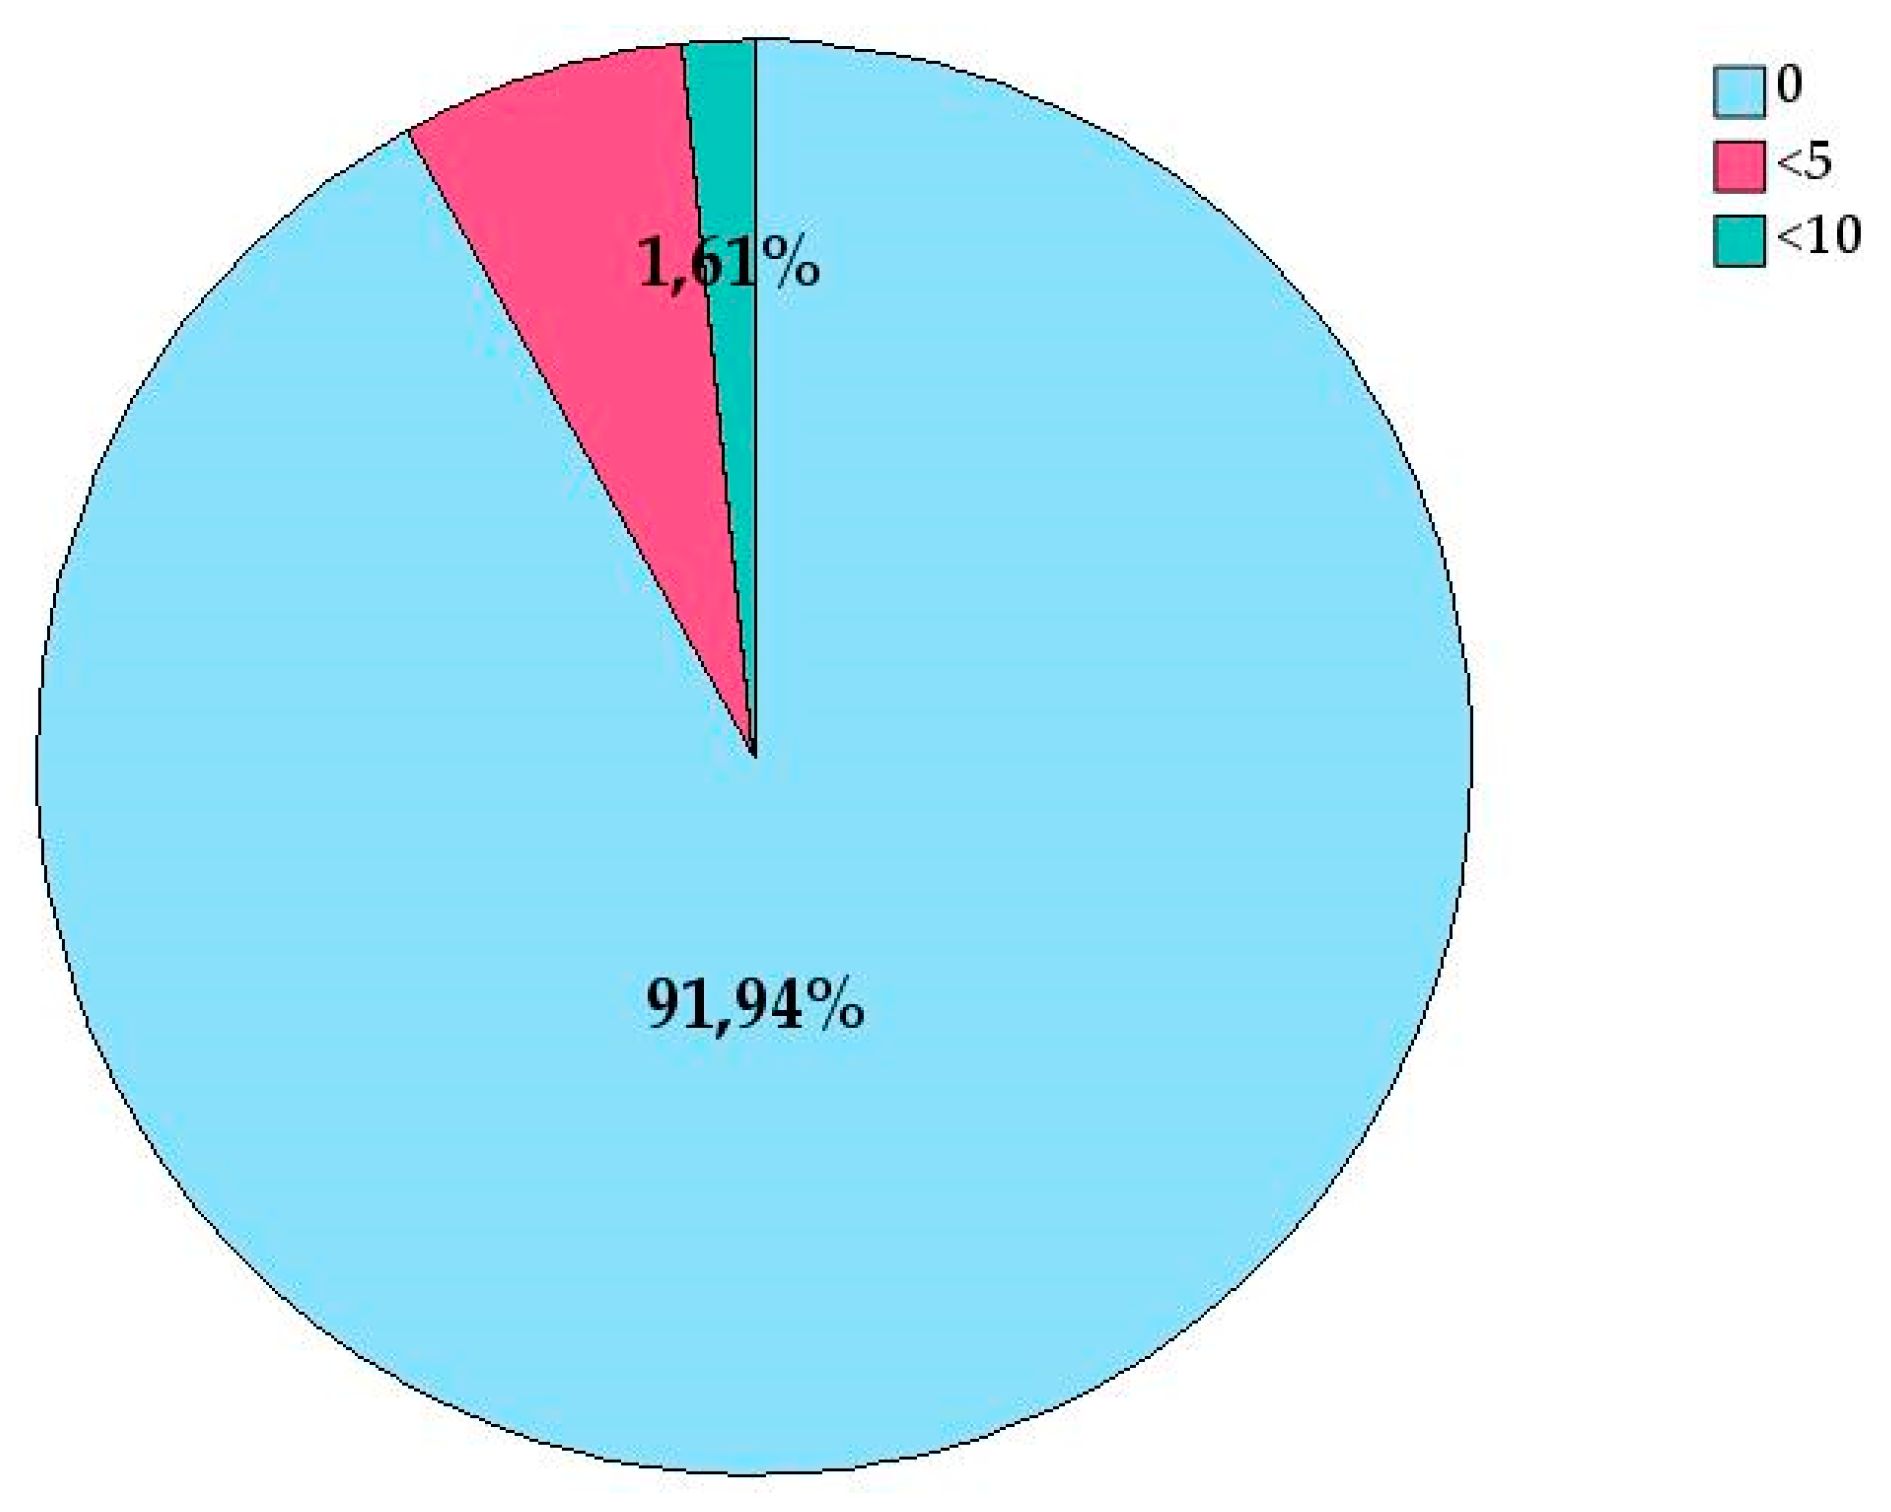
Figure 7.
People Who have undertaken Self-Taught Training.
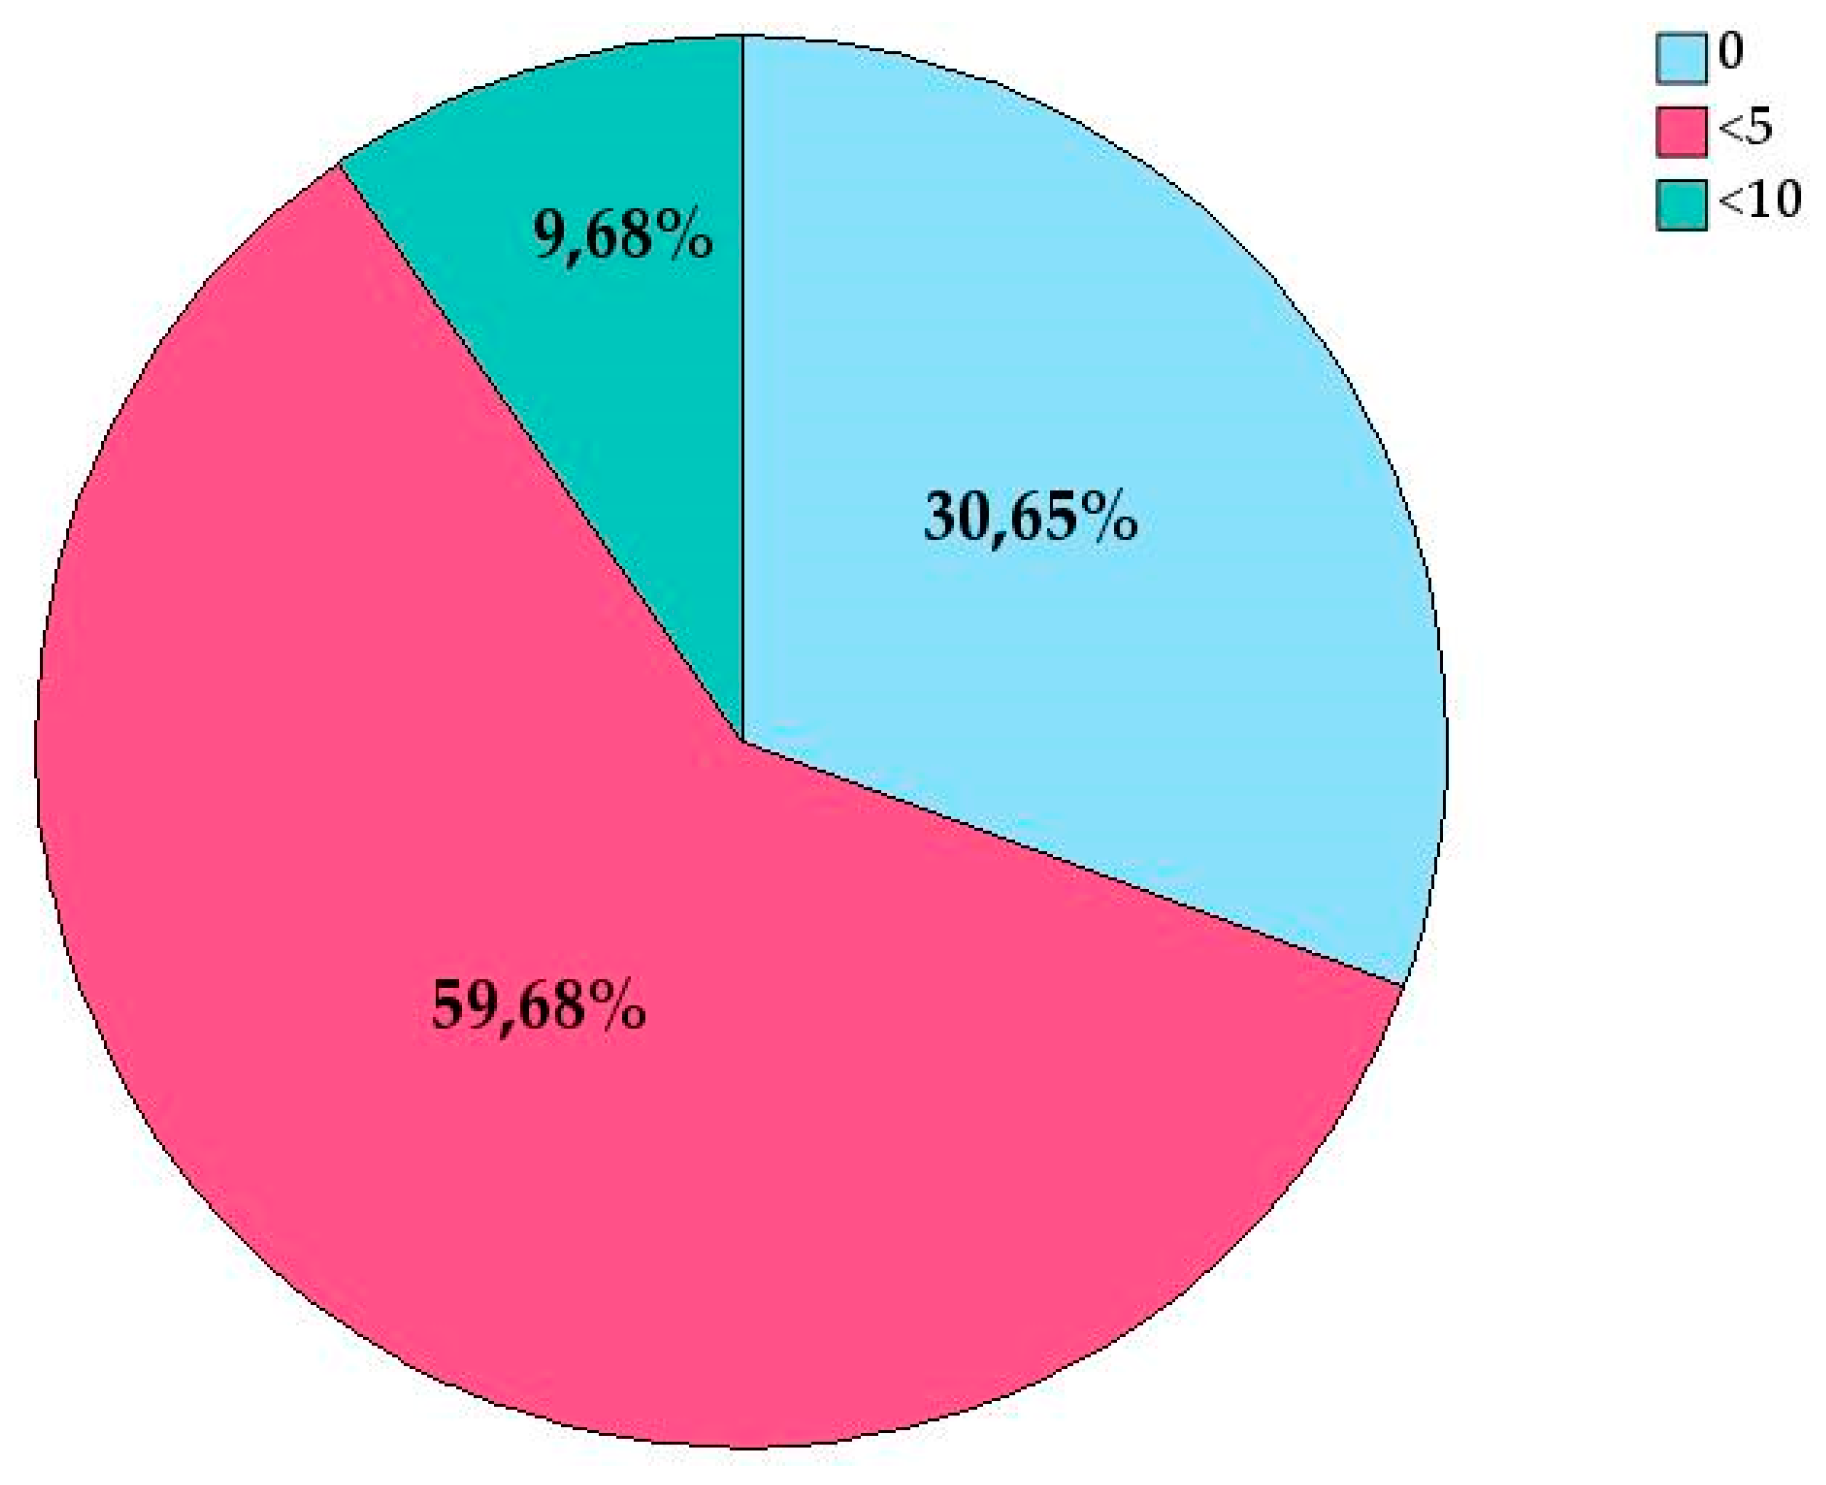
Figure 8.
The training of companies and individuals in Lean IPD is low. To ensure the success of IPD, it is necessary to invest in training.
Figure 8.
The training of companies and individuals in Lean IPD is low. To ensure the success of IPD, it is necessary to invest in training.
The data shows that self-taught training is more widespread than structured training. It is likely that companies have not yet identified the need to train their workers in these areas and that employees have taken the initiative to learn on their own. However, the high skewness and kurtosis observed in the statistics for courses, workshops, and master's programs indicate that, although very few companies have provided formal training, those that did may have done so extensively. The analysis highlights a clear need to improve the availability of training within real estate development companies. The heavy reliance on self-taught training suggests that employees are motivated to learn and develop their skills but require more support and formal resources from their employers.
Implementing strategies to enhance structured training and support self-directed learning could lead to stronger professional development and more skilled employees.
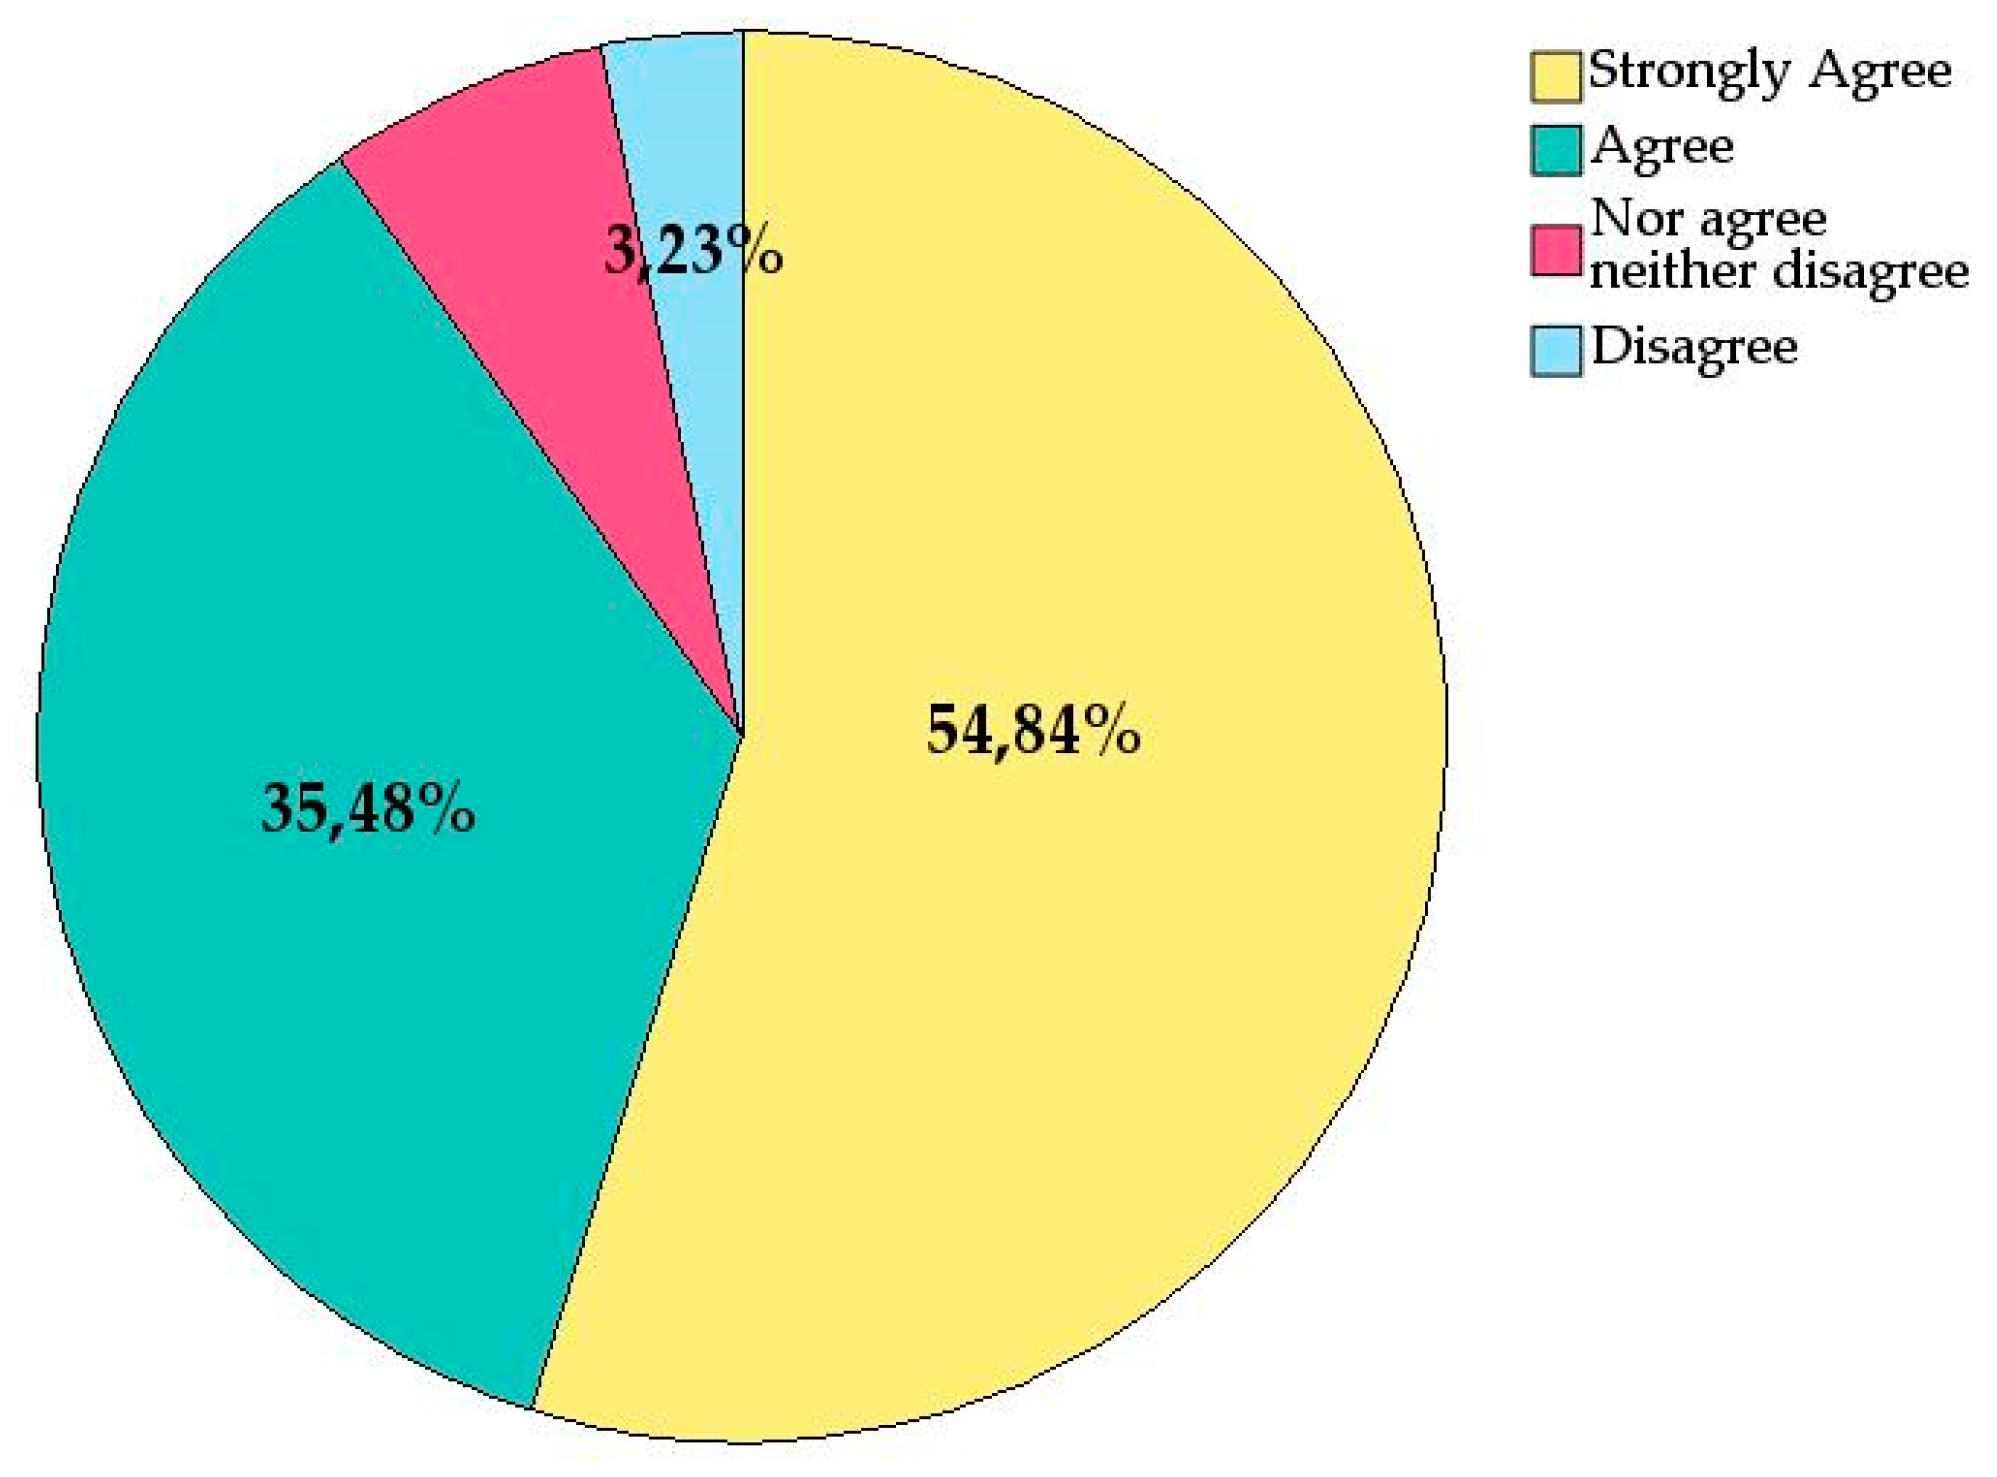
In response to a direct question, an overwhelming majority (90.3%) of respondents agreed or strongly agreed that training in IPD within companies and among individuals is insufficient and that investing in training is essential for IPD to succeed. This underscores the importance of improving IPD-related skills and knowledge for its effective implementation.
3.2. Concerns and Interests of Real Estate Developers
A real estate developer, understood as a person or entity that decides, initiates, plans, and finances construction works—either with their own resources or external funding—for their own use or future sale, faces the challenging task of directing, managing, and controlling a range of technical, financial, economic, and human resources to achieve optimal efficiency [32]. Given the wide array of disciplines they must be familiar with and lead decision-making on, this study sought to understand the relative importance they assign to design and construction issues compared to other common concerns.
3.2.1. Concerns
Respondents were asked to rank the relative importance of several recognized issues to contextualize the relevance of Lean IPD among their concerns and interests.
The analyzed issues included delays in licensing processes (administrative and legal), a shortage of available land (raw material), financing costs, a lack of sales (economic/financial), and design and construction issues (technical). Respondents rated these issues on a Likert scale from 1 (least important) to 5 (most important).
- License approval delays emerged as the greatest concern, with an average score of 4.23 and a median of 5.00, indicating that many developers consider this issue extremely important. The high negative skewness (-0.951) and negative kurtosis (-0.193) suggest that most responses are at the upper end of the scale.
- Lack of ready-to build land is also a significant concern, with an average score of 3.73 and a median of 4.00. The negative skewness (-0.650) and kurtosis (-0.684) indicate that a large number of developers regard this issue as very important.
- Financing costs scored an average of 3.56 and a median of 4.00, showing it is an important concern, though not as pressing as licensing delays and land shortages. The near-zero skewness and kurtosis indicate a relatively symmetric distribution.
- Design and construction issues and lack of sales received average scores of 2.85 and 2.45, respectively, both with positive skewness. This suggests that many respondents consider these issues less important compared to the others.
Design and construction issues appear as a lesser concern among the challenges faced by developers. It is important to note, however, that among all the mentioned issues, design and construction are the only ones where developers have tools, such as Lean IPD, to address or mitigate them. This is not the case with permitting timelines, financing costs, or other challenges, which present external circumstances over which developers individually have little control.

Table 1.
Relative importance of issues perceived by real estate developers (as a percentage of the sample).
Table 1.
Relative importance of issues perceived by real estate developers (as a percentage of the sample).
| Irrelevant | Slightly Important | Moderately Important | Very Important | Extremely Important | |
|---|---|---|---|---|---|
| License approval delays | -1 | 6,5% | 16,1% | 25,8% | 51,6% |
| Lack of ready-to build land | 8,1% | 9,7% | 24,2% | 17,7% | 40,3% |
| Financing costs | 4,8% | 8,1% | 33,9% | 32,3% | 21% |
| Design and construction issues | 11,3% | 30,6% | 27,4% | 22,6% | 8,1% |
| Lack of sales | 22,6% | 30,6% | 33,9% | 4,8% | 8,1% |
1 No respondent marked License approval delays as irrelevant.
3.2.2. Interests
Real estate developers were surveyed to determine the relative importance they assign to various innovative megatrends observed in the market. The innovations analyzed included industrialized construction, sustainability and ESG, digitization, and Lean Construction & IPD.
- Industrialized Construction has the highest average score and a large percentage of high ratings (64.5%).
- Sustainability and ESG and Digitalization also show high interest, with more than half of the developers rating them as very or extremely important.
- Lean Construction and IPD received more moderate evaluations but were still generally rated positively.
All innovations exhibit slight negative skewness, indicating that evaluations tend to lean more toward the positive. The innovation with the least variability in responses is Digitalization, reflecting consensus on its importance.
Table 2.
Relative importance of innovations as perceived by real estate developers (as a percentage of the sample).
Table 2.
Relative importance of innovations as perceived by real estate developers (as a percentage of the sample).
| Irrelevant | Slightly Important | Moderately Important | Very Important | Extremely Important | |
|---|---|---|---|---|---|
| Industrialized Construction | 6,5% | 12,9% | 16,1% | 33,9% | 30,6% |
| Sustainability and ESG | 6,5% | 22,6% | 14,5% | 25,8% | 30,6% |
| Digitalization | 3,2% | 17,7% | 27,4% | 30,6% | 21% |
| Lean Construction and IPD | 12,9% | 21% | 27,4% | 24,2% | 14,5% |
This suggests that innovations in industrialized construction and digitalization are especially high priorities for real estate developers, closely followed by sustainability and ESG initiatives. Innovation in Lean Construction and IPD is also important but is rated slightly more moderately.
3.3. Issues in Design and Construction Projects
Real estate developers were surveyed regarding design and construction issues that IPD could significantly address. The issues presented were: lack of early involvement, lack of speed, consensus, and quality in decision-making, lack of alignment in the economic motivations of stakeholders, lack of transparency, and lack of commitment and leadership in projects.
- Early engagement: This is the most prominent issue, with the highest average and the largest proportion of responses in the high-importance categories. This suggests that projects could benefit significantly from involving key stakeholders from the early stages.
- Rapid and consensus-based decisions: The speed and quality of decision-making are another crucial issue. This highlights the need to improve decision-making processes and communication among teams.
- Alignment of economic motivations: There is a clear need to ensure that the economic motivations of all stakeholders are aligned to avoid conflicts and foster collaboration.
- Transparency: Transparency in projects is critical, and its absence is a significant concern. Implementing more transparent practices could enhance trust and cooperation.
- Commitment and leadership: Although important, this issue is perceived as less severe compared to the others. Nonetheless, improving commitment and leadership could still yield additional benefits.
Table 3.
Relative importance of design and construction issues as perceived by real estate developers (as a percentage of the sample).
Table 3.
Relative importance of design and construction issues as perceived by real estate developers (as a percentage of the sample).
| Irrelevant | Slightly Important | Moderately Important | Very Important | Extremely Important | |
|---|---|---|---|---|---|
| Early engagement | 3,2% | 8,1% | 22,6% | 32,3% | 33,9% |
| Rapid and consensus-based decisions | 3,2% | 22,6% | 17,7% | 38,7% | 17,7% |
| Alignment of economic motivations | 8,1% | 16,1% | 22,6% | 37,1% | 16,1% |
| Transparency | 8,1% | 19,4% | 21% | 30,7% | 21% |
| Commitment and leadership | 19,4% | 19,4% | 24,2% | 19,4% | 17,7% |
3.3. Percepción of Owners
3.3.1. Lean IPD Principles
Lean IPD is based on the simultaneous application of a series of governance mechanisms and the use of a specific operating system [33] he philosophical foundation of Lean emphasizes values such as long-term thinking, putting people at the center, eliminating waste, and stabilizing workflow, among others [34]. The application of certain techniques such as the Last Planner System, Target Value Design, Takt-Time, or 5S aims to promote these values and constitutes the operating system of projects.
Among the governance principles of Lean IPD are early stakeholder involvement, shared decision-making responsibility, intensive developer participation, open-book accounting, risk-reward compensation, and co-location [35]
- Early Stakeholder engagement
The involvement of the contractor, the owner, and the architectural firm from the start of the project is one of the foundations of Lean IPD and one of its most distinguishing principles compared to the sequential Design-Bid-Build method. Its purpose is to leverage the expertise of contractors during the design phase to avoid rework in the future. In a broader sense, it can be stated that: “The knowledge about the construction, operation, and use processes is often introduced sequentially, greatly diminishing its impact of making a building high-performing. Integrating process knowledge makes knowledge about all critical life cycle phases available to the IPD team early and comprehensively.” [27]
The majority of respondents (79.03%) strongly agreed that the involvement of the contractor, the owner, and the architectural firm from the beginning of the project enhances product definition, the integration of various technical solutions, team training, understanding of project objectives, understanding of costs, and reduces uncertainties and risks. None of the respondents disagreed or strongly disagreed, and only one person was neutral.
The broad consensus on the positive effects of early stakeholder engagement makes it the most celebrated principle of Lean IPD among respondents. This finding opens the door to many reflections: How are teams formed before the design phase? How is the contractor remunerated during this phase? How is the expected construction cost established? Can a different contractor be selected for the construction phase than the one involved in the design?
- Co-responsibility in decision-making
The decision-making process in Lean IPD differs from the traditional Design-Bid-Build approach, as decisions are made collaboratively by all stakeholders for the benefit of the project. With the involvement of all parties from the outset, the contractor, the architectural firm, and the owner or their representative have a voice and vote in project decisions, contributing their experience and expertise. This does not exclude that “one of the first things the IPD team needs to do is to assign work and decision-making responsibilities that cover the duration of the project. For example, in earlier phases of the project, the designer will often take the lead, whereas when it transitions to construction, the general contractor or a trade contractor may lead the effort. Documentation of these responsibilities is sometimes called a task or responsibility matrix"[28]
The vast majority of respondents (83.87%) agreed or strongly agreed that co-responsibility in decision-making ensures that the work executed must be consensus-based. This approach improves the quality of decisions, reduces blame attribution, and prioritizes the project’s interests over those of individual parties. Only one respondent disagreed, and none strongly disagreed with this statement.
- Intensive Owner Participacion
Lean IPD promotes a shift in the role of the owner, who must transition from the role of a client to that of an active member of the development and construction team. To achieve this, the owner must have professionals with real estate market knowledge, as well as technical profiles capable of dedicating sufficient time to actively fulfill this new role in projects. Intensive Owner Participacion "… requires effort, but it is also an opportunity because it allows the owner to directly influence the project's outcome. Moreover, by being directly engaged, the owner eliminates the propose/review/approve cycles that can result in delay and rework."[28] Besides, "this leadership role should not be delegated to outside consultants, because they rarely are empowered to make owner-level decisions". [36]
The vast majority of respondents (93.55%) agree or strongly agree that intensive owner participation improves their understanding of the project and accelerates decision-making. Additionally, 82.26% of respondents agree or strongly agree that the owner should attend integrated project team meetings as an equal member, valuing intensive participation over occasional involvement during key moments.
To achieve this level of dedication in projects, it is essential for real estate development companies to have sufficient technical staff prepared to participate intensively in projects. A significant majority of respondents (79.03%) stated that their organizations place great importance on technical profiles and that they are ready to engage intensively in projects.
- Open-book Accounting
Although there is no consistent definition of Open-Book Accounting (OBA), most authors “emphasize two important characteristics of OBA practices: the regular disclosure of private information beyond corporate borders and the sharing of financial data”[37].
In practical terms, sharing financial records provides opportunities to optimize costs across the entire value chain while promoting trust and a culture of accountability. The appeal of implementing open-book accounting (OBA) depends not only on the specific nature of the sector in which it is introduced but also on exogenous environmental factors, such as the degree of market competition or the prevailing economic growth trend at the time of consideration. Endogenous variables also come into play, such as company size, the ability to manage accounting systems, competitive policies, and a long-term commitment vision.[38]
Most respondents (61.33%) agree or strongly agree that open-book accounting improves transparency and trust among stakeholders during the design and construction process. They also believe that by eliminating economic tension, the likelihood of one party attempting to profit at the expense of others is reduced. However, despite generally agreeing that open-book accounting is beneficial for projects, there is greater variability in responses when asked if their organization would be willing to embrace the level of transparency and cost uncertainty it entails. While 50% are willing to take on the challenges of open-book accounting, 30.64% of the sample expressed disagreement or strong disagreement. Additionally, the percentage of respondents who were neutral (neither agree nor disagree) increased to 19.35%.
These results, although positive, highlight a potential misalignment between industry culture and the principles of Lean IPD, which will be explored further below. According to Bhonde, “there is resistance throughout the construction industry to provide financial transparency and ‘open book’ project management, believing that such transparency could make an organization more vulnerable."[14]
- Risk-Reward Compensation
One of the most effective tools for aligning the interests of all parties is to compensate stakeholders based on the risk they assume in the project and the success they achieve in meeting shared objectives. These objectives, set by the owner and agreed upon by the rest of the IPD team, are not exclusively economic; they may also relate to factors such as schedule, sustainability, or compliance with other conditions of satisfaction.
According to Rodrigues et al. (2021), "the greatest benefit of sharing risk and reward reported in the Tønsberg project is the parties realizing they need to work toward the common goal, prioritizing the whole instead of individual performance."[39]
Most respondents (69.36%) agree or strongly agree that risk-reward compensation encourages collaboration and a sense of teamwork, placing the project at the center rather than the individual interests of the stakeholders. A quarter of the sample neither agree nor disagree, and only 4.84% disagree with this statement.
However, the level of agreement drops to 50% when respondents are asked if linking stakeholders’ profits to the project’s success could be unfair, given the multitude of factors beyond their control, such as labor shortages or economic conditions. Additionally, 22.6% disagree or strongly disagree with this statement, indicating that many consider this approach to be unfair.
- Co-location
Co-location involves members of the integrated project team working in the same physical space during the development and construction phases. This location should be a neutral space that fosters a sense of belonging to the project for all team members, regardless of their employer. There is broad consensus regarding the benefits of co-location: “co-location can build relationships and ensure those right experts are available in a timely manner." [10] and although research “tends to acknowledge this as a highly recommendable solution” [40], reservations may arise when projects are of moderate size and resources are not fully dedicated.[35]
Figure 9.
The involvement of the contractor, the owner, and the architectural firm from the start of the project improves product definition, the integration of various technical solutions, team training, understanding of project objectives, understanding of costs, and the reduction of uncertainties and risks.
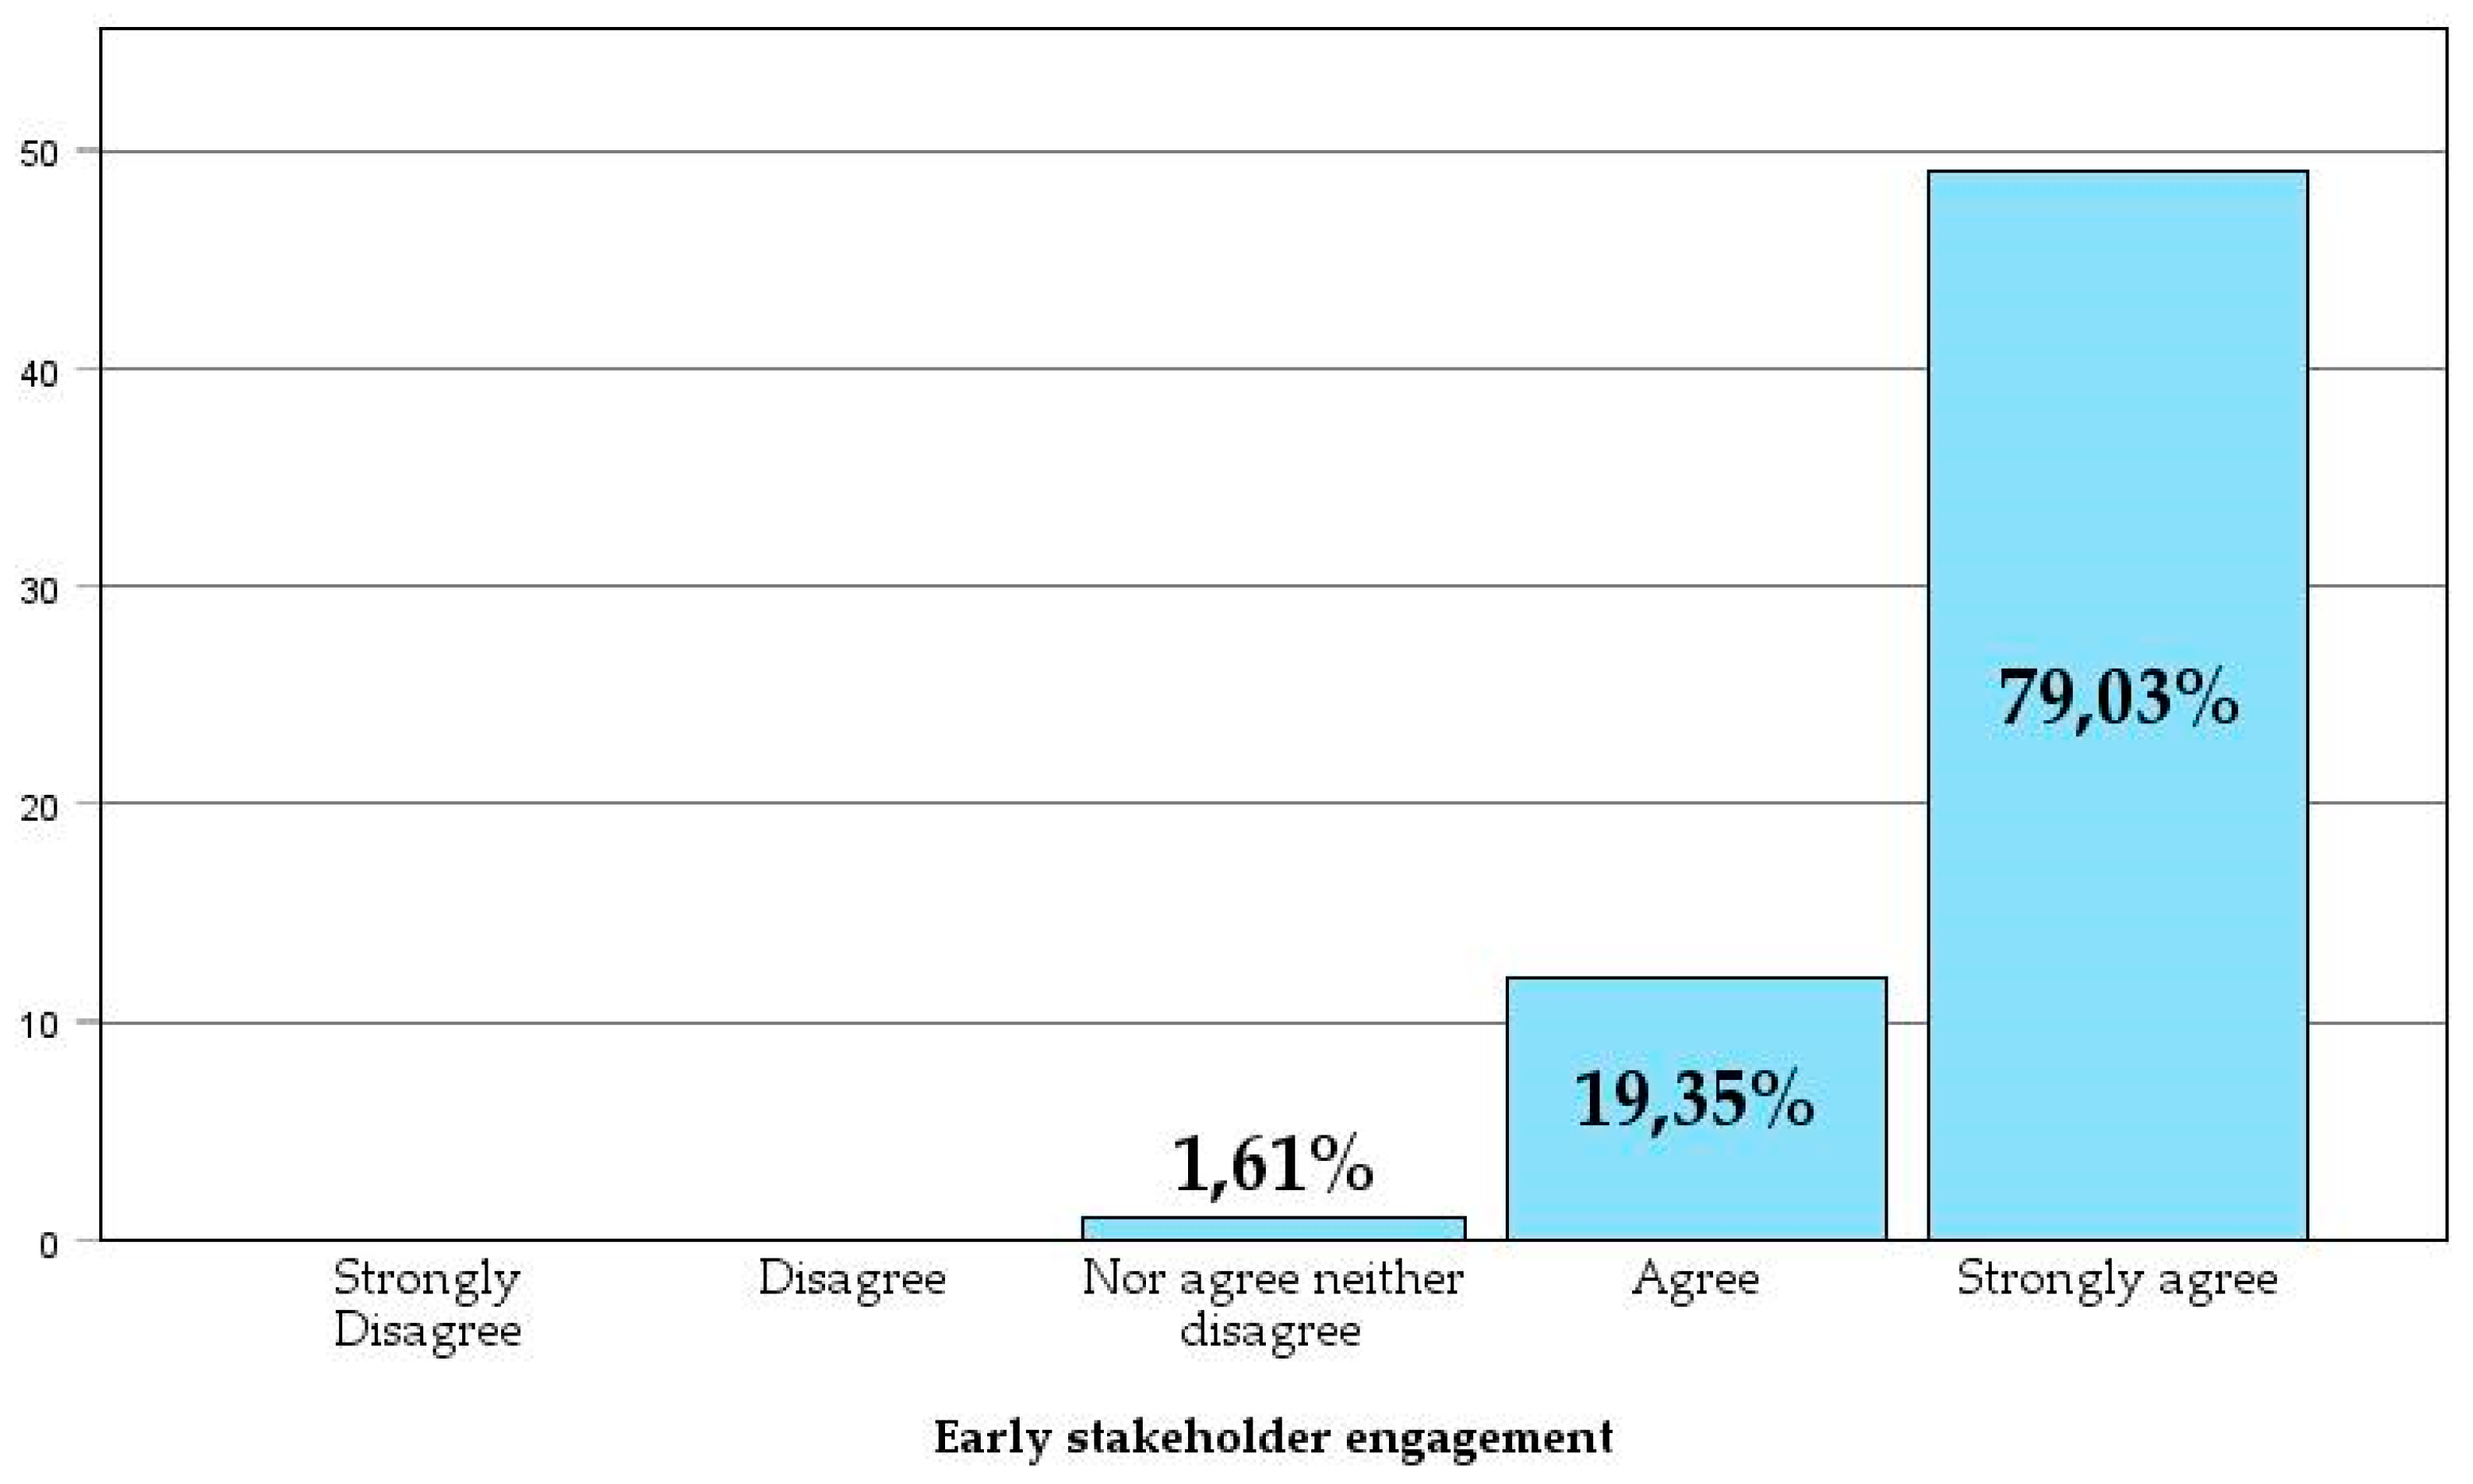
Figure 10.
Co-responsibility in decision-making improves the quality of decisions, reduces blame attribution, and prioritizes the project’s interests over those of individual parties.
Figure 10.
Co-responsibility in decision-making improves the quality of decisions, reduces blame attribution, and prioritizes the project’s interests over those of individual parties.
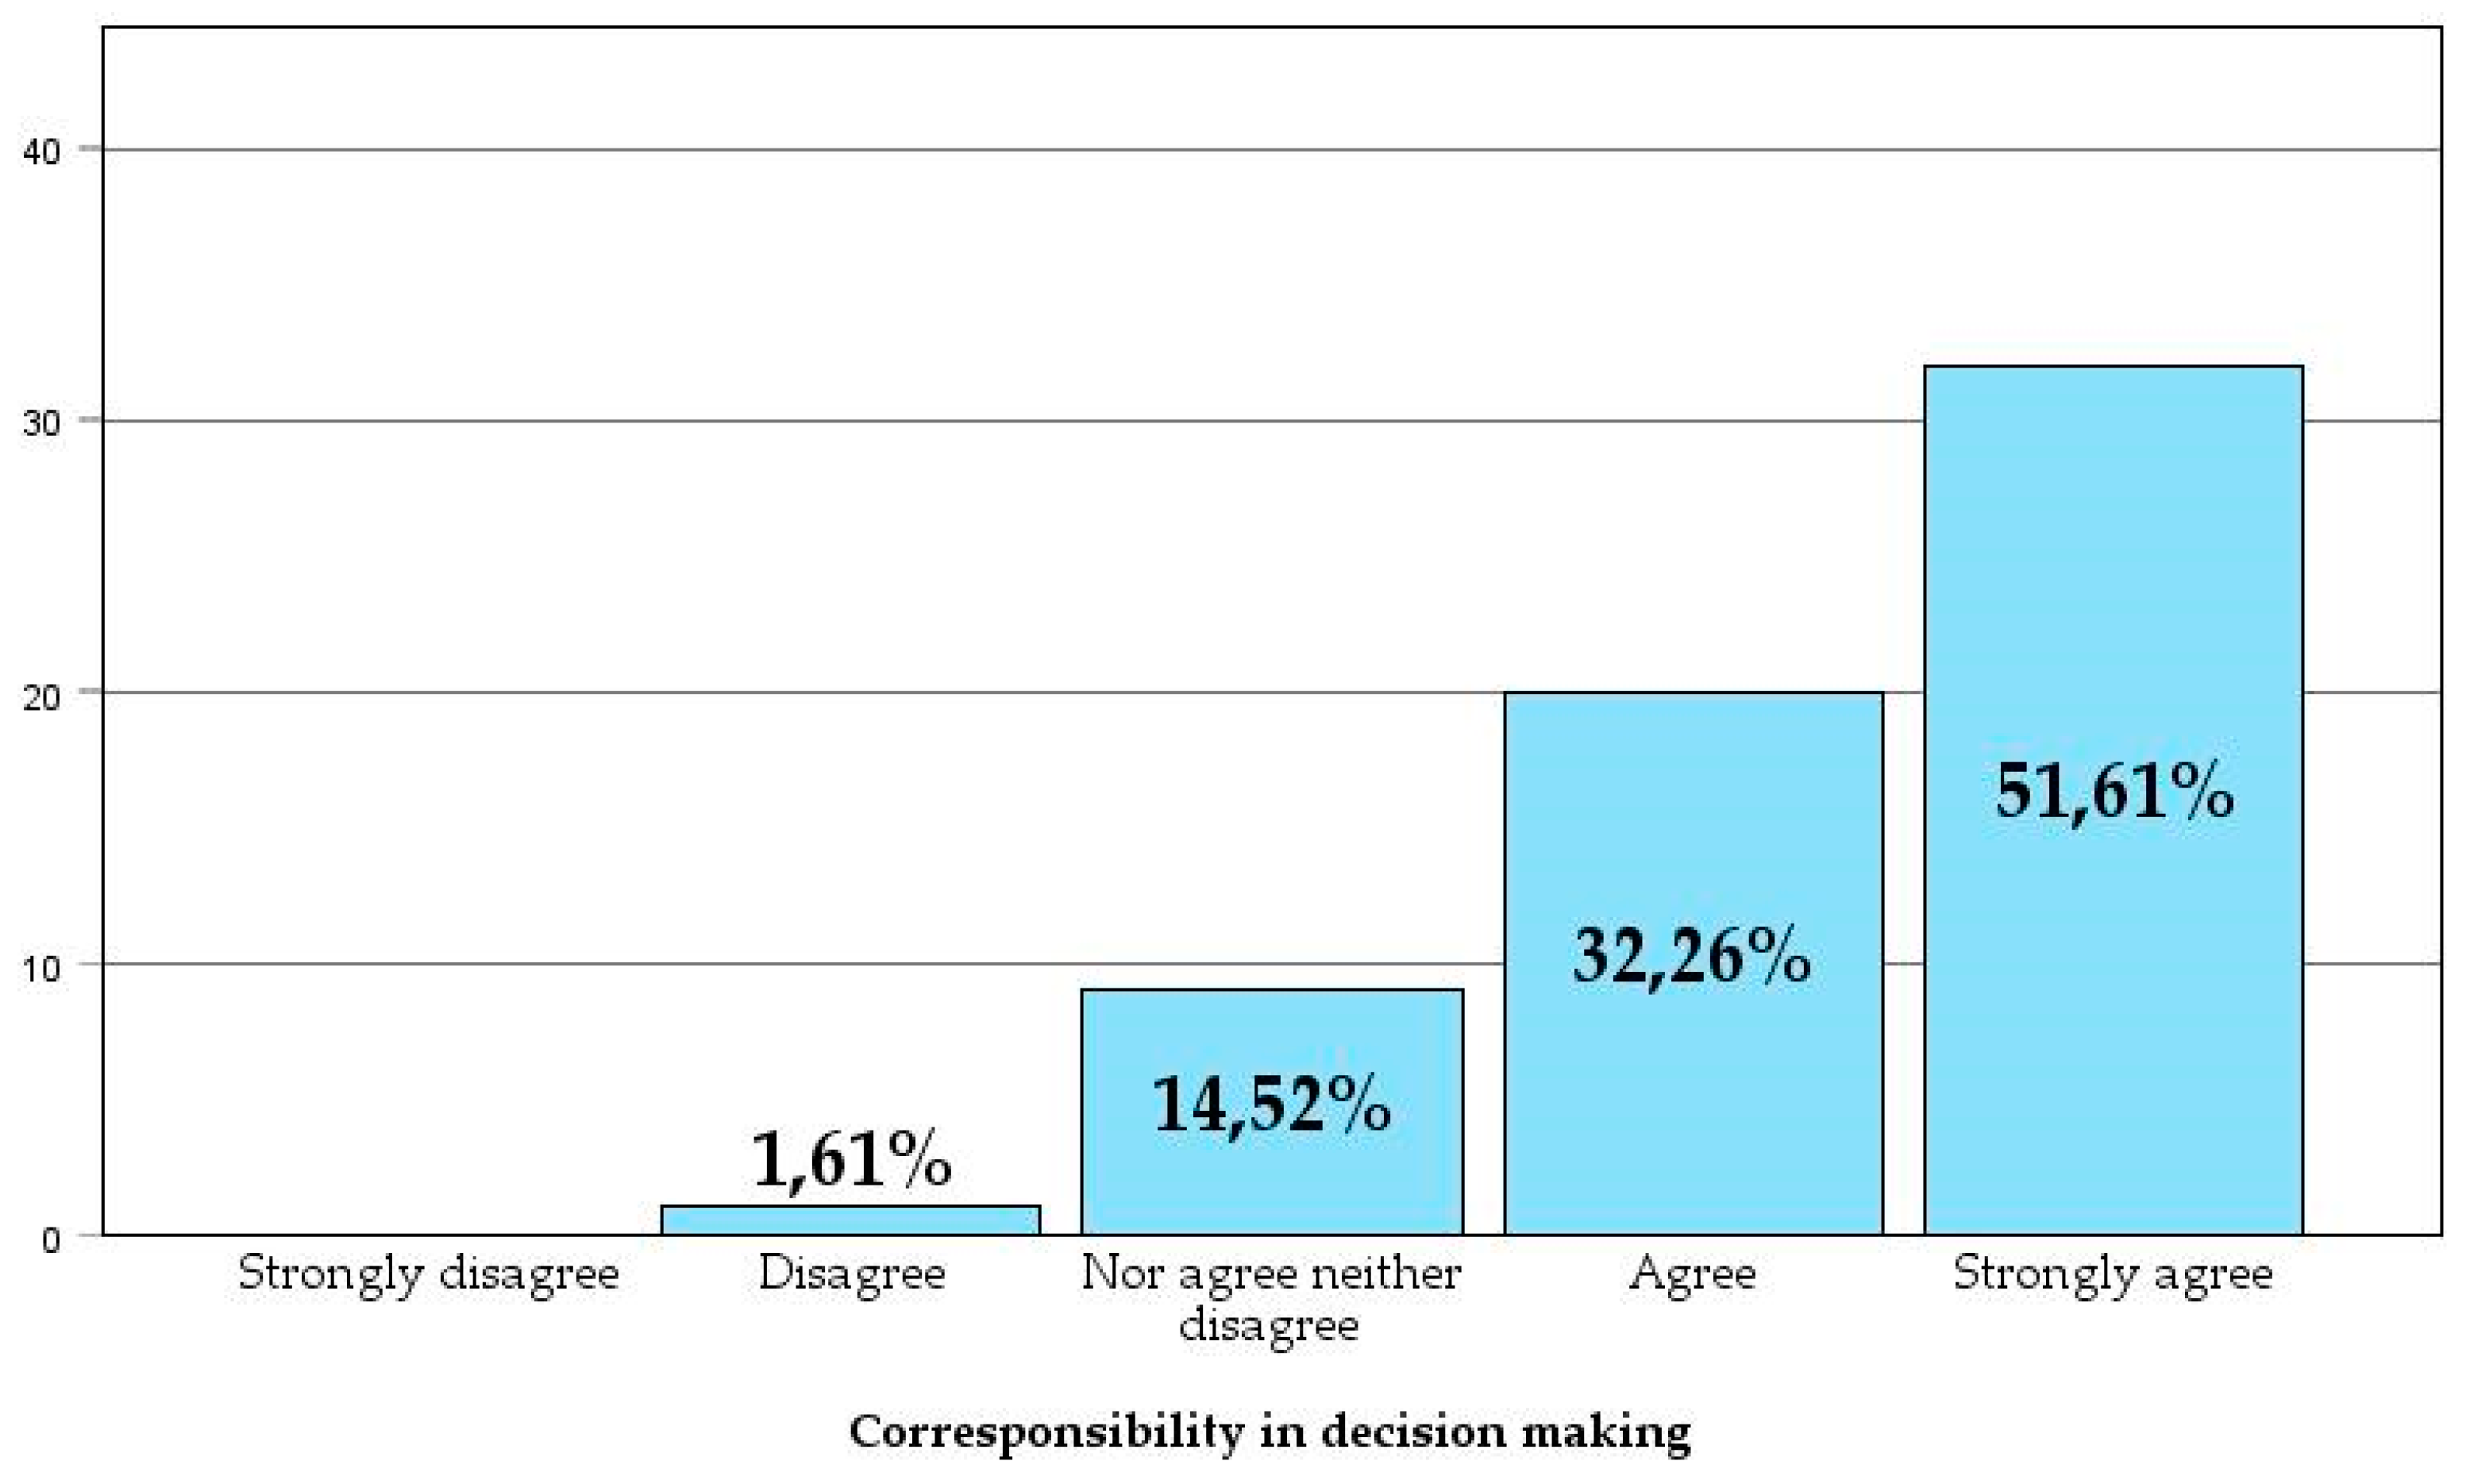
Figure 11.
Intensive owner participation—understood as attending work meetings as an active member of the team—improves understanding and accelerates decision-making.
Figure 11.
Intensive owner participation—understood as attending work meetings as an active member of the team—improves understanding and accelerates decision-making.
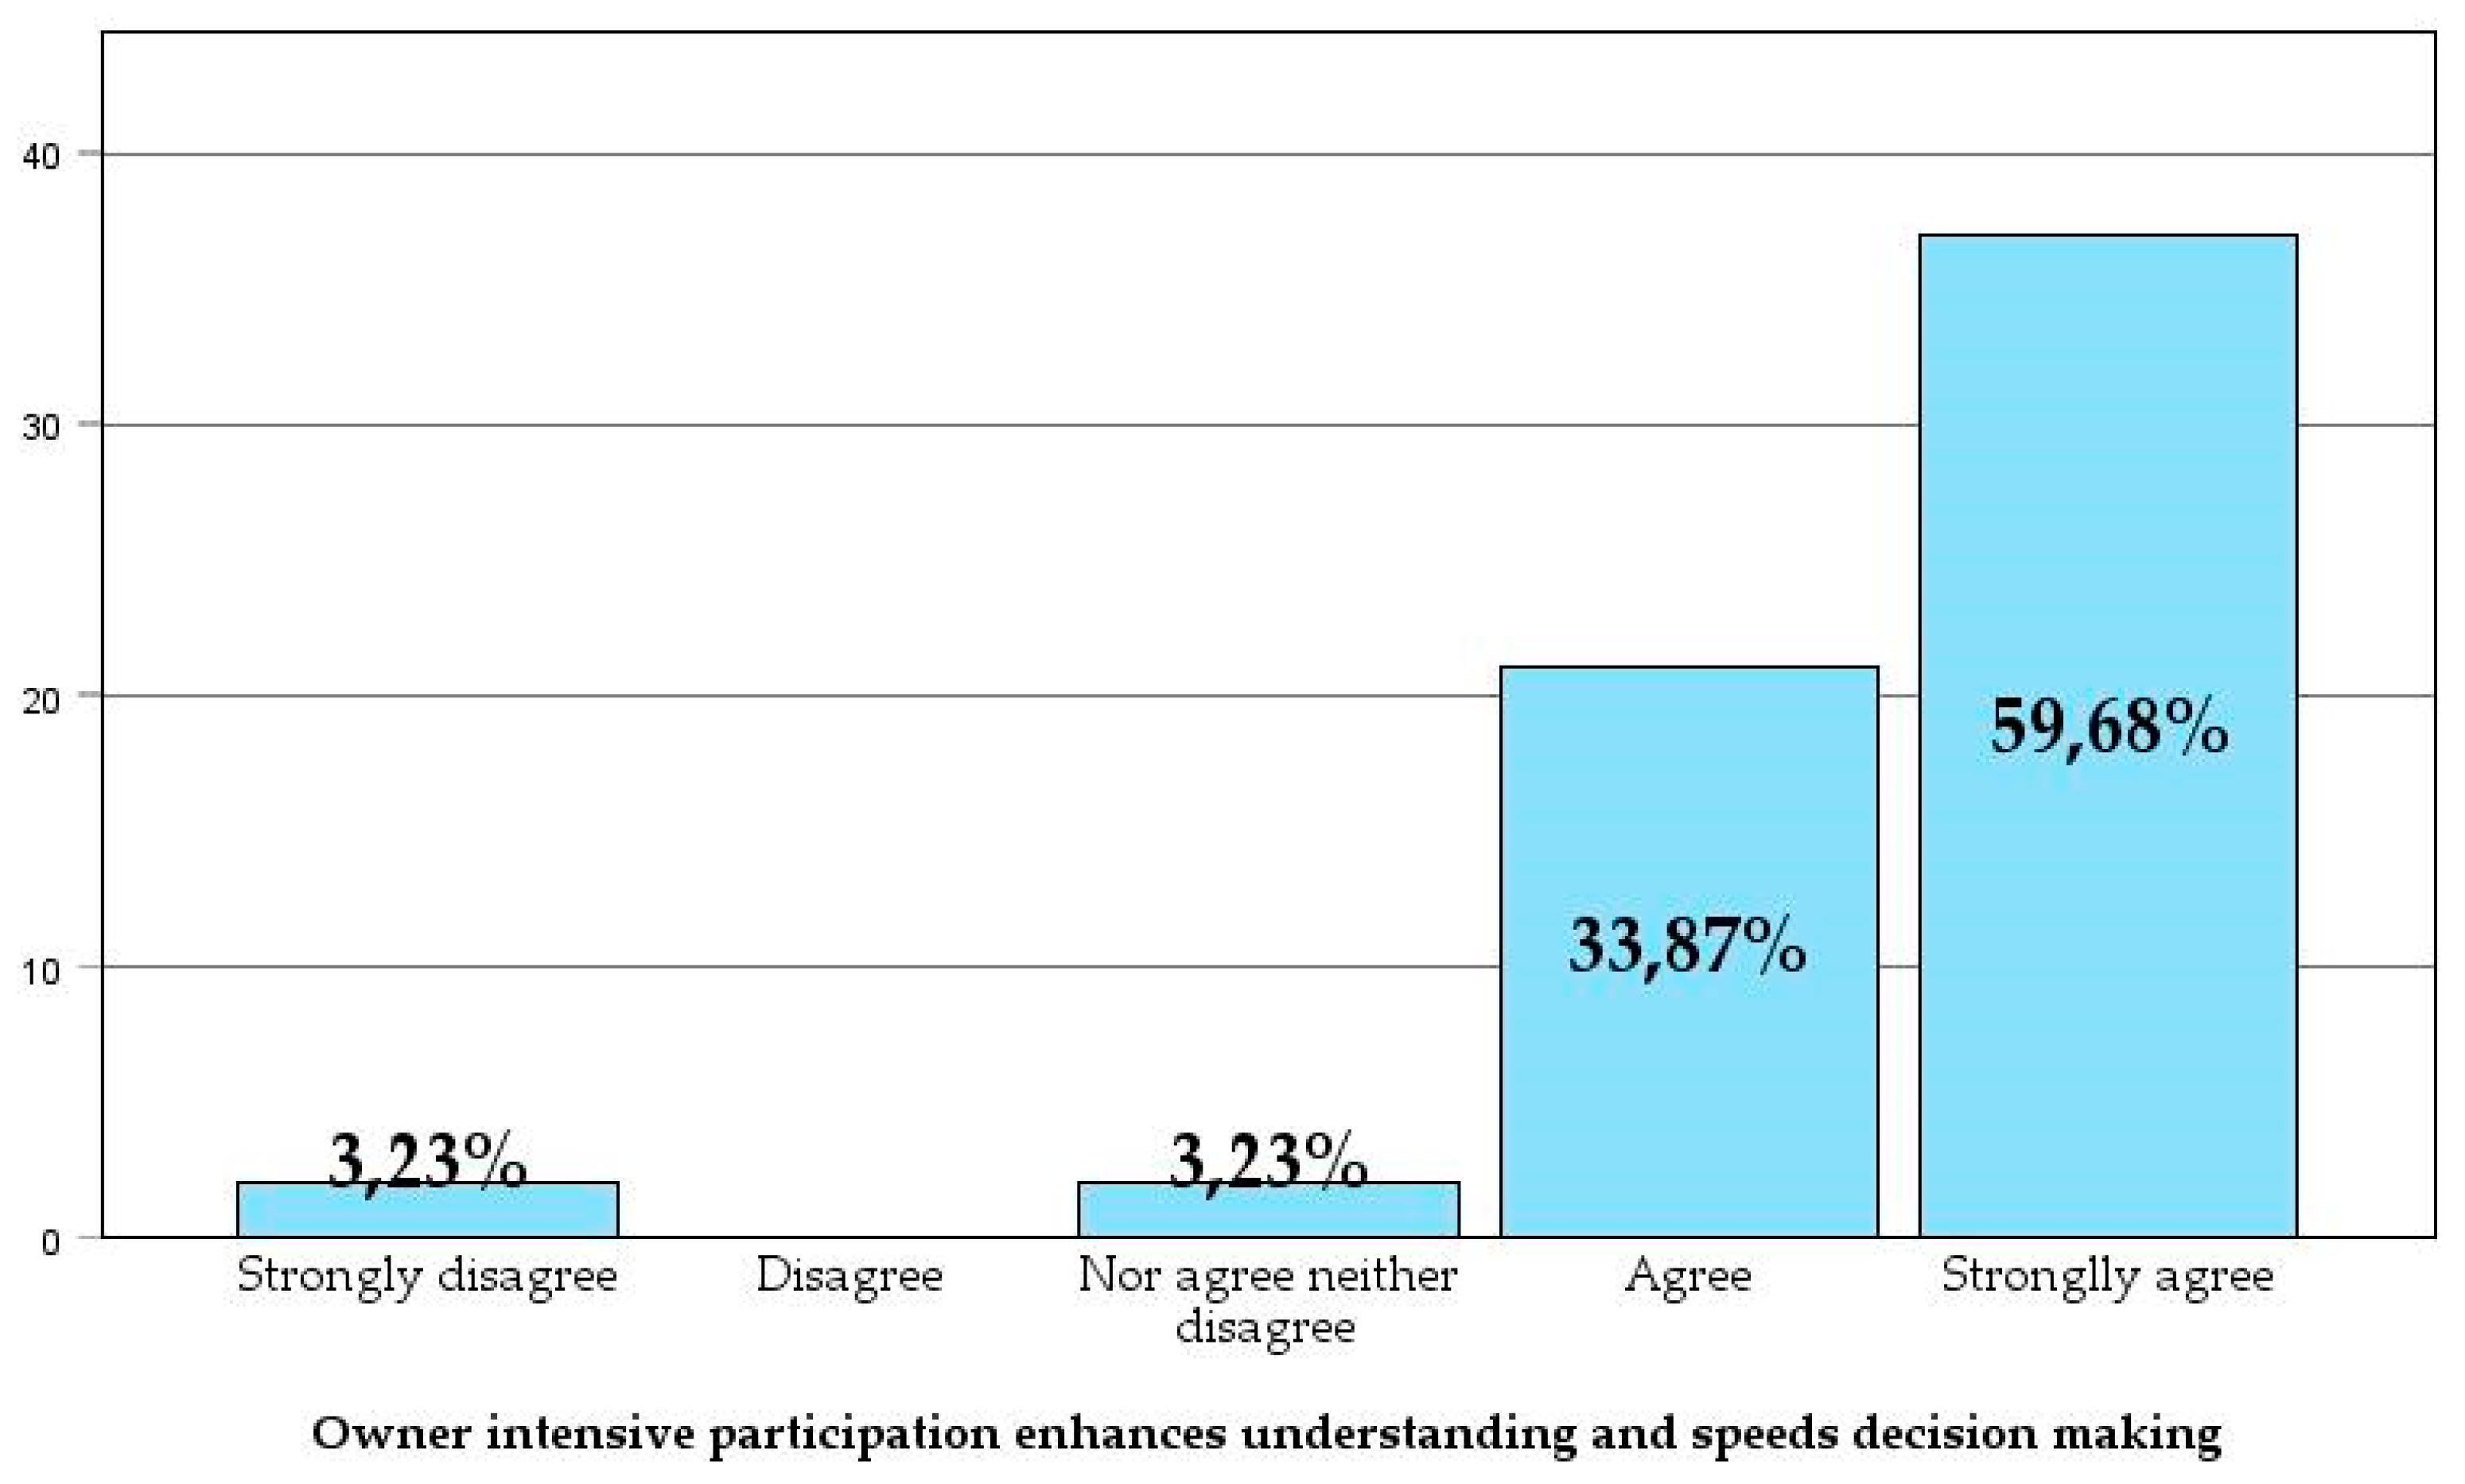
Figure 12.
Open-book accounting improves transparency and trust among stakeholders during the process. By eliminating economic tension between parties, it reduces the likelihood of one party attempting to profit at the expense of others.
Figure 12.
Open-book accounting improves transparency and trust among stakeholders during the process. By eliminating economic tension between parties, it reduces the likelihood of one party attempting to profit at the expense of others.
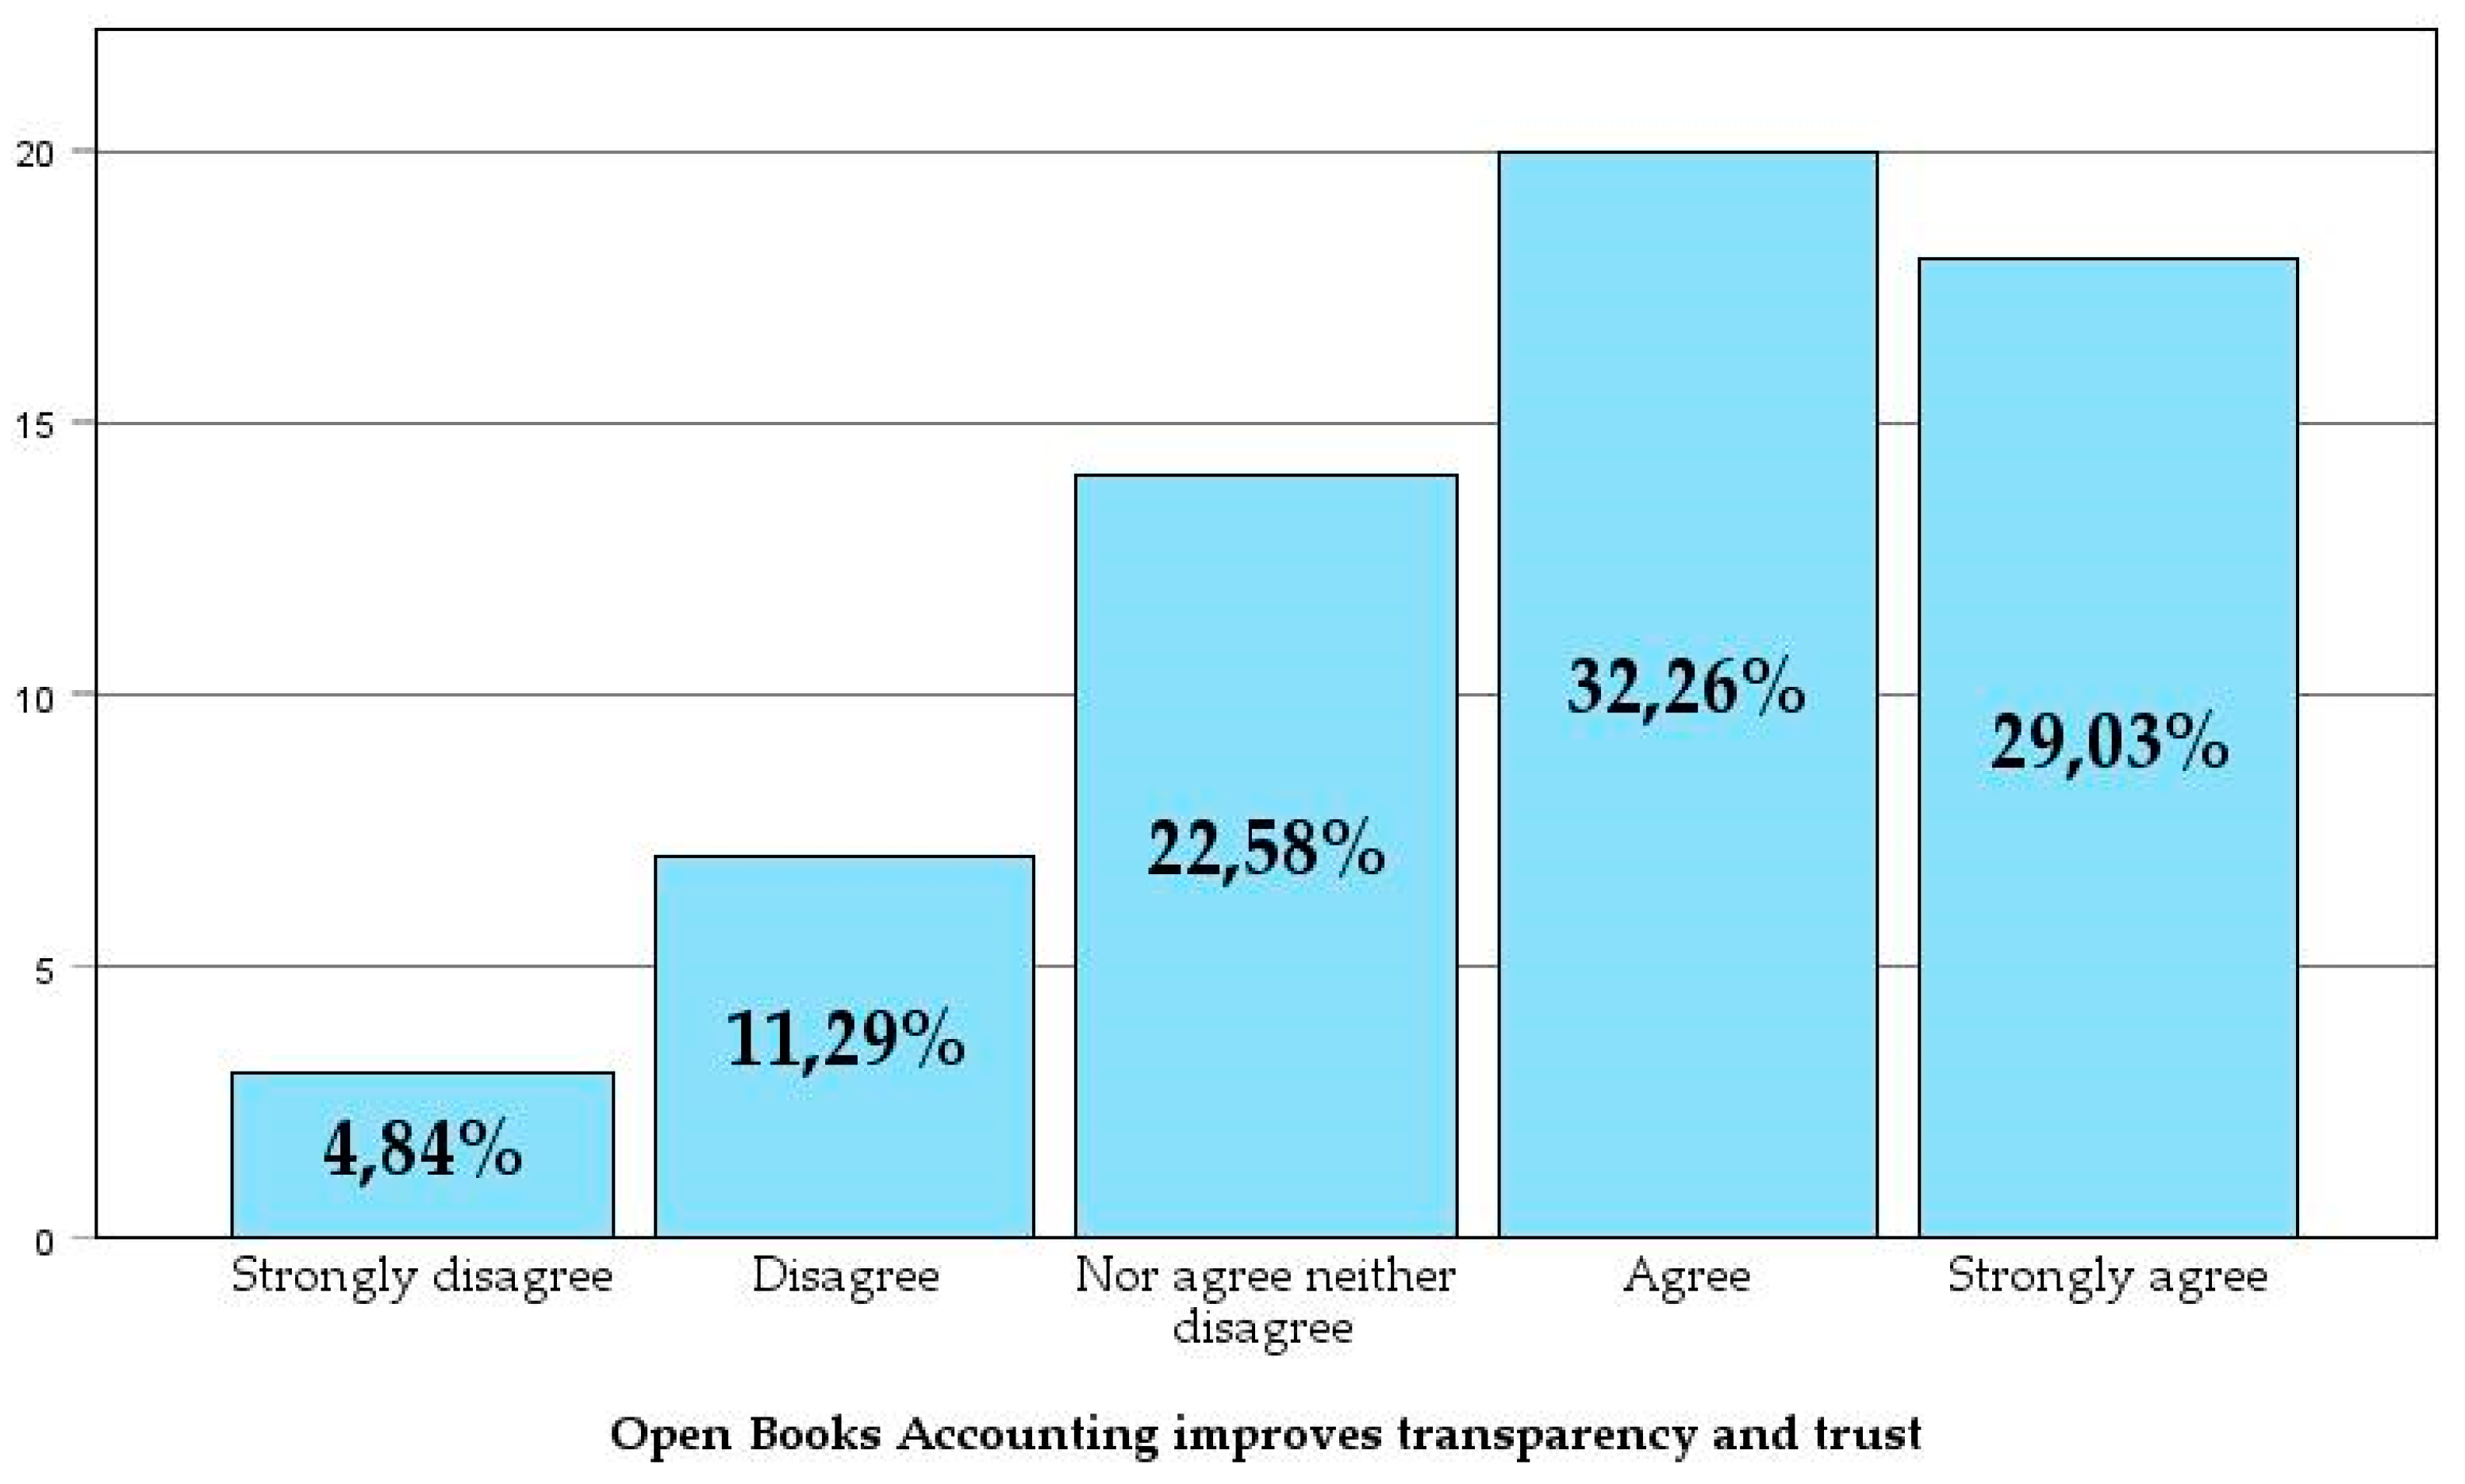
Figure 13.
Risk-reward compensation incentivizes collaboration and teamwork while prioritizing the project over the individual interests of the stakeholders.
Figure 13.
Risk-reward compensation incentivizes collaboration and teamwork while prioritizing the project over the individual interests of the stakeholders.
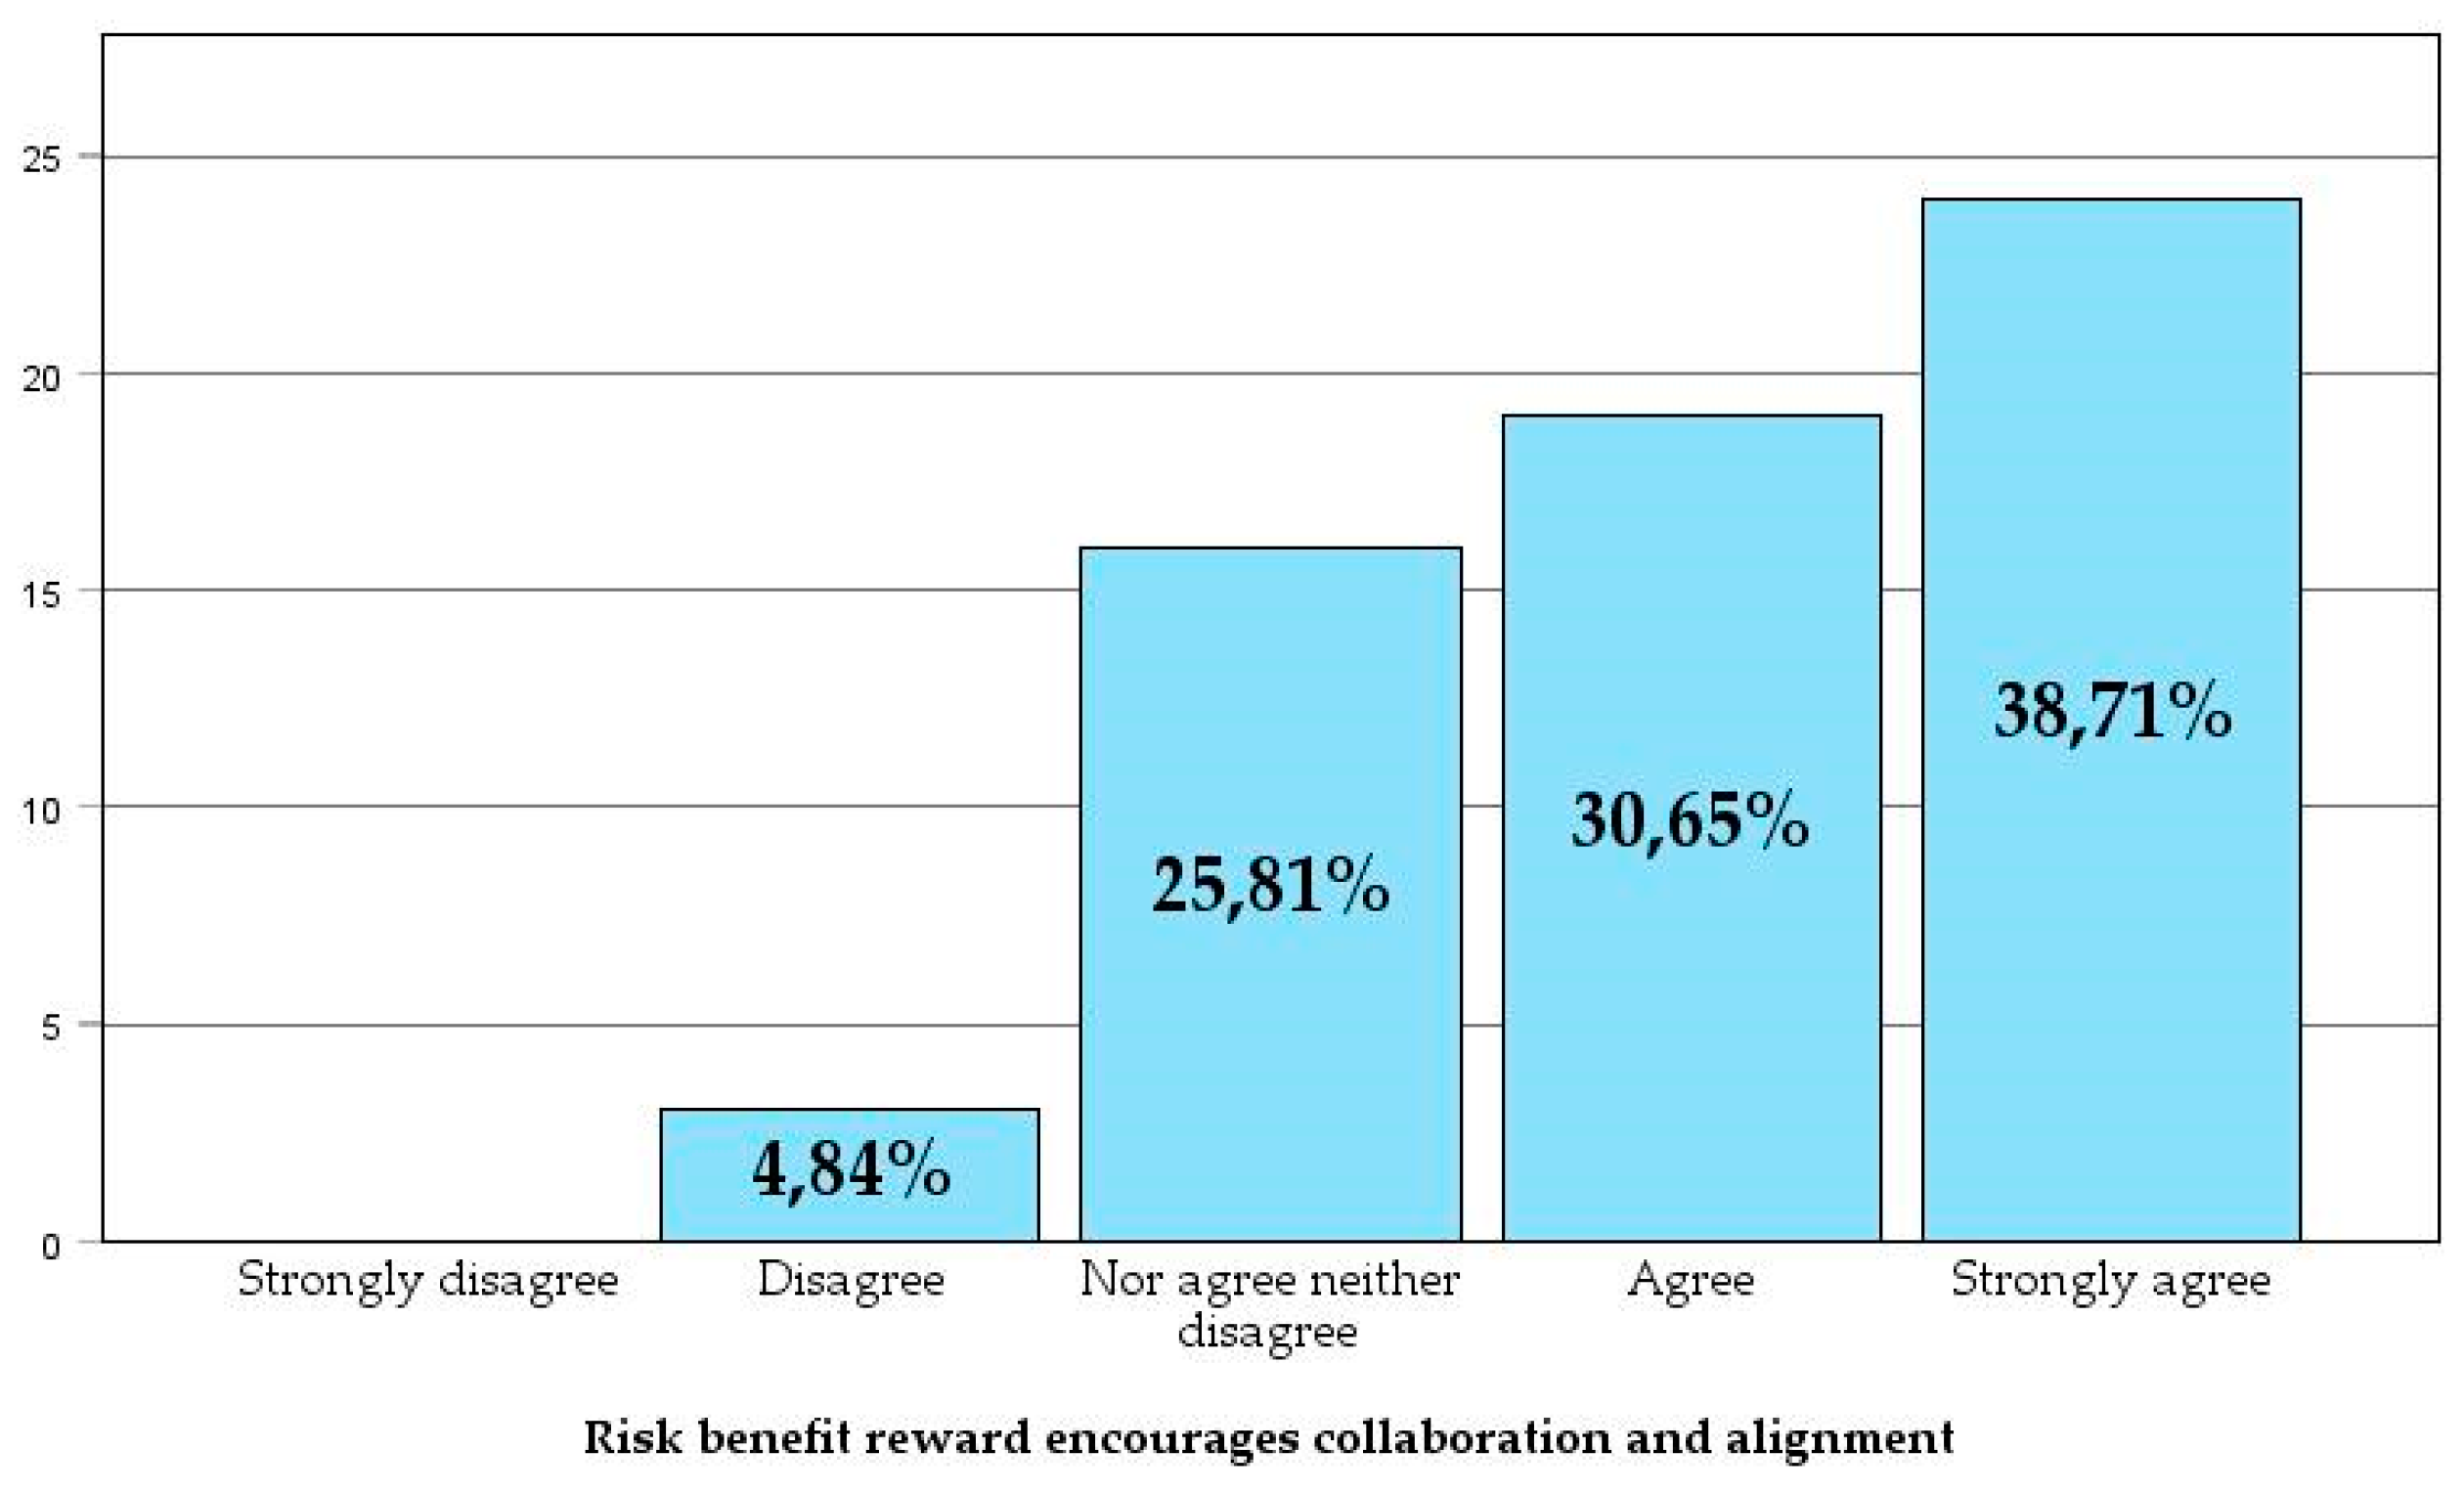
Figure 14.
Co-location enhances communication by accelerating the flow of information and decision-making while fostering a sense of teamwork and prioritizing the project.
Figure 14.
Co-location enhances communication by accelerating the flow of information and decision-making while fostering a sense of teamwork and prioritizing the project.
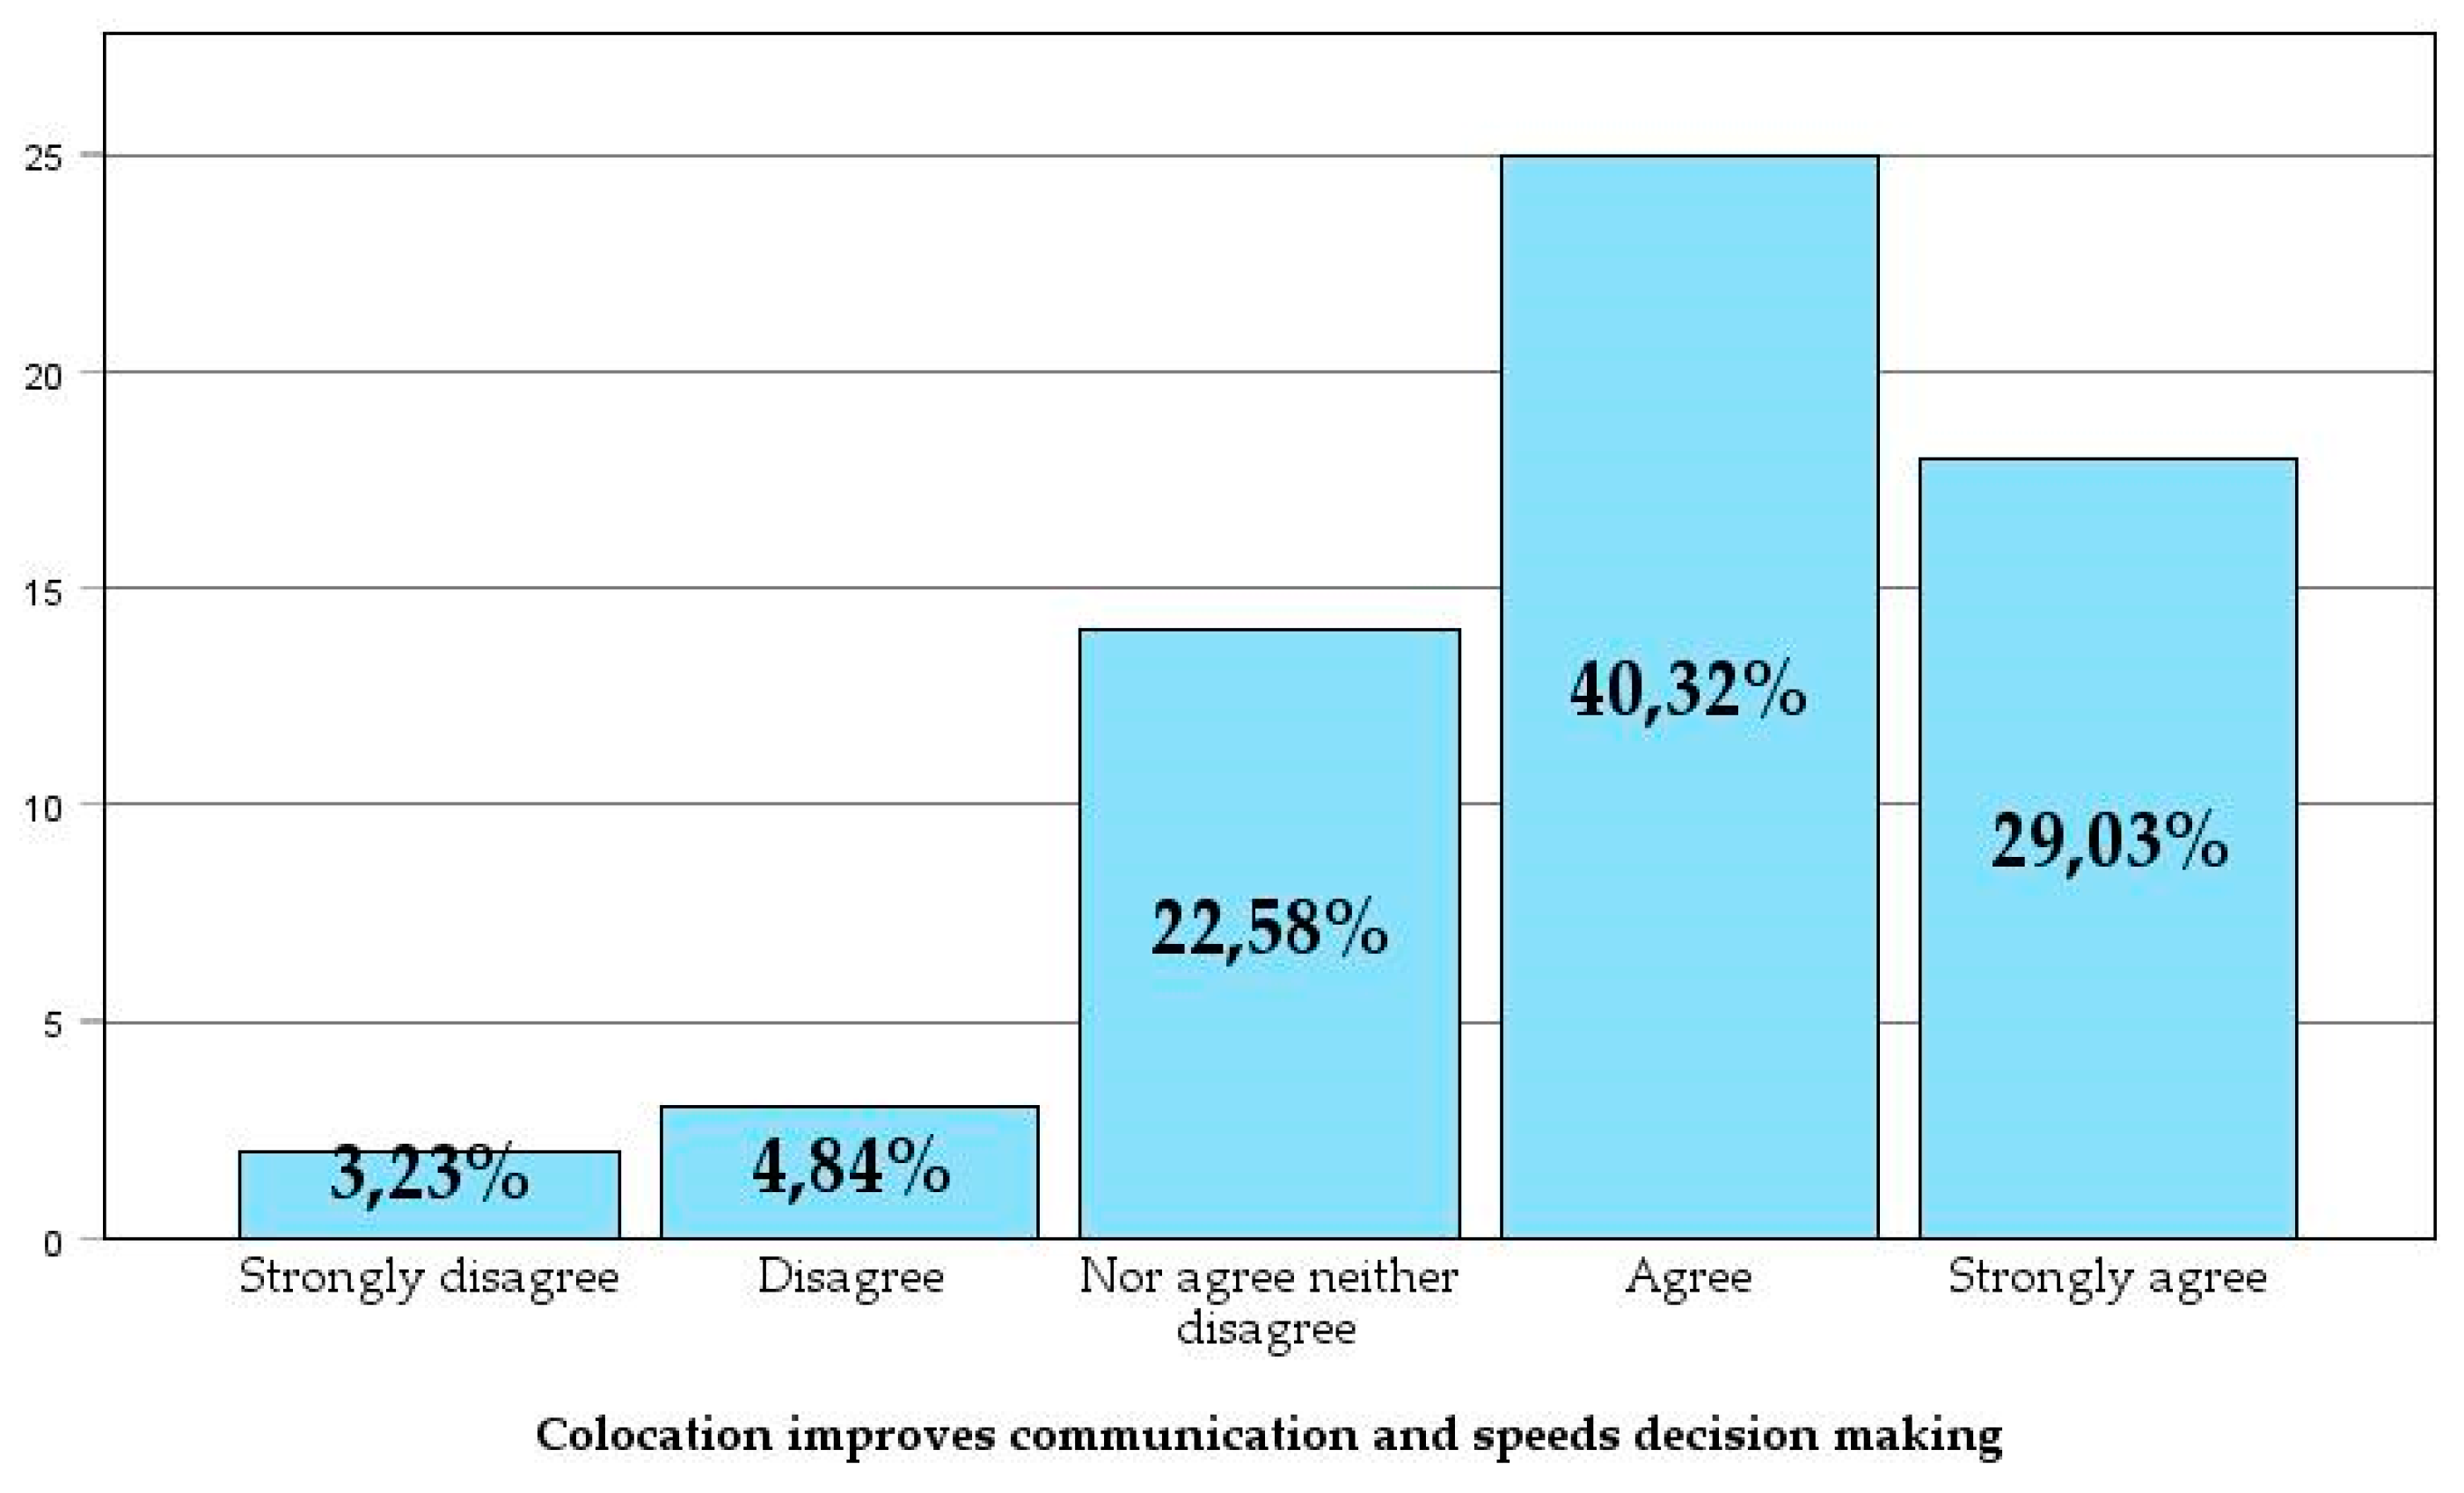
A total of 69.35% of respondents agree or strongly agree that co-location is beneficial for projects. Additionally, 40.32% agree that co-location, combined with intensive owner participation, improves communication by enabling faster information flow and accelerating decision-making. It also enhances the sense of belonging to the project, placing the project above individual organizations.
When asked about the economic feasibility of this strategy, 50% of respondents stated that it would be possible to cover the costs for projects within their organization, while 22.58% said it would not be feasible. A further 27.42% were neutral, indicating a division of opinions on this issue.
Most respondents (43.5%) remained neutral about whether co-location is desirable but not essential for Lean IPD, while 37.1% agreed and 19.4% disagreed.
3.3.2. Industry Culture and Barriers to Implementation
- Industry Culture
The culture of the construction sector operates under the logic of zero-sum games, [41] where for one party to gain, another must lose. This is largely because the Design-Bid-Build (DBB) delivery method has been adopted as if there were no other way to govern projects. However, the DBB method was not always the dominant paradigm; it only began to gain popularity after the Rural Post Roads Act of 1916, which aimed to minimize corruption in public procurement in the United States[42]. Until well into the 20th century, projects often followed a much more collaborative approach [43].
In Spain, the legal framework prescribes a single delivery method—DBB. While this method has been applied to all types of projects, it becomes inefficient in the face of the increasing complexity and uncertainty that many projects must handle [44] and it is considered the least effective in terms of outcomes [45]. Breaking projects into phases to seek the most competitive bid and assigning isolated responsibilities to each stakeholder has led to a scenario where, in the face of potential project failure, stakeholders prioritize their own interests over those of the project. The rules of DBB encourage opportunistic behaviors from all parties, resulting in distrust and, ultimately, conflict.
The culture of confrontation and lack of trust are seen as significant barriers to Lean IPD by the majority of respondents (56.5%). Respondents agreed that the confrontational culture, lack of trust, and entrenched behaviors of stakeholders are deeply ingrained. They also noted that a generational shift would likely be necessary for Lean IPD to reach its full potential. Nonetheless, 25.8% of respondents remained neutral. This suggests that these cultural issues are perceived as major obstacles that need to be addressed for the effective implementation of Lean IPD.
- Building Regulation Law
In Spain, the Building Regulation Law of 1999 (LOE) implicitly repeals the Civil Code of 1889 [46] with the aim of regulating the design and construction processes of real estate properties. This law provides a limited list of Construction Agents and clearly defines their roles and responsibilities [47]. Over the last 30 years, numerous roles and positions have emerged that were impossible to foresee at the time. Today, construction projects often include roles not covered by the law, such as Project Managers, sustainability consultants, certification entities, Lean Construction consultants, Quantity Surveyors, Cost Managers, BIM Managers, and a wide range of specialists who address the increasingly complex demands of real estate projects.
For many professionals and academics, the restrictive nature of the definition of Construction Agents in the law, along with its Napoleonic approach to assigning responsibilities, presents barriers to innovation [48] and raises significant doubts about the implementation of collaborative contracting [49].
Most respondents (56.45%) agree or strongly agree that the responsibilities described in the LOE for various construction agents hinder innovation in contract design, compared to the Common Law systems in Anglo-Saxon countries, which allow greater flexibility. However, 38.7% remain neutral, which could indicate uncertainty or a lack of clear information about the impact of the LOE.
- Role of the Owner in diffusion and implementation
The cross-disciplinary nature of Lean IPD's implementation may raise questions about who should drive this paradigm shift, whether it should be a collaborative effort or led by a specific stakeholder. A recent precedent can be found in the mid-2010s when architectural firms and engineering companies led the adoption of BIM, despite limited demand from their clients[50].
Maturity in Lean Construction is not something that will be achieved overnight. Similarly, the adoption of Lean IPD will encounter many types of barriers. But who should be the figure to lead this transformation?
A total of 80.7% of surveyed owners agree or strongly agree that real estate owners should take on the role of driving Lean Construction and IPD, indicating strong expectations for these actors to lead the adoption of these methodologies.
It is possible, and often the case, that in their effort to improve outcomes, contractors take the initiative to implement Lean Construction techniques such as the Last Planner System, 5S, or Takt-Time. These changes can have a positive impact on a limited portion of the production process. However, the design of relationships between various stakeholders and the governance principles of projects should align with the owner's corporate philosophy.
Owners should ask themselves this question: Do we want to build stable, long-term teams of collaborators who treat the company's projects as their own, or do we prefer to seek the highest bidder for each project?
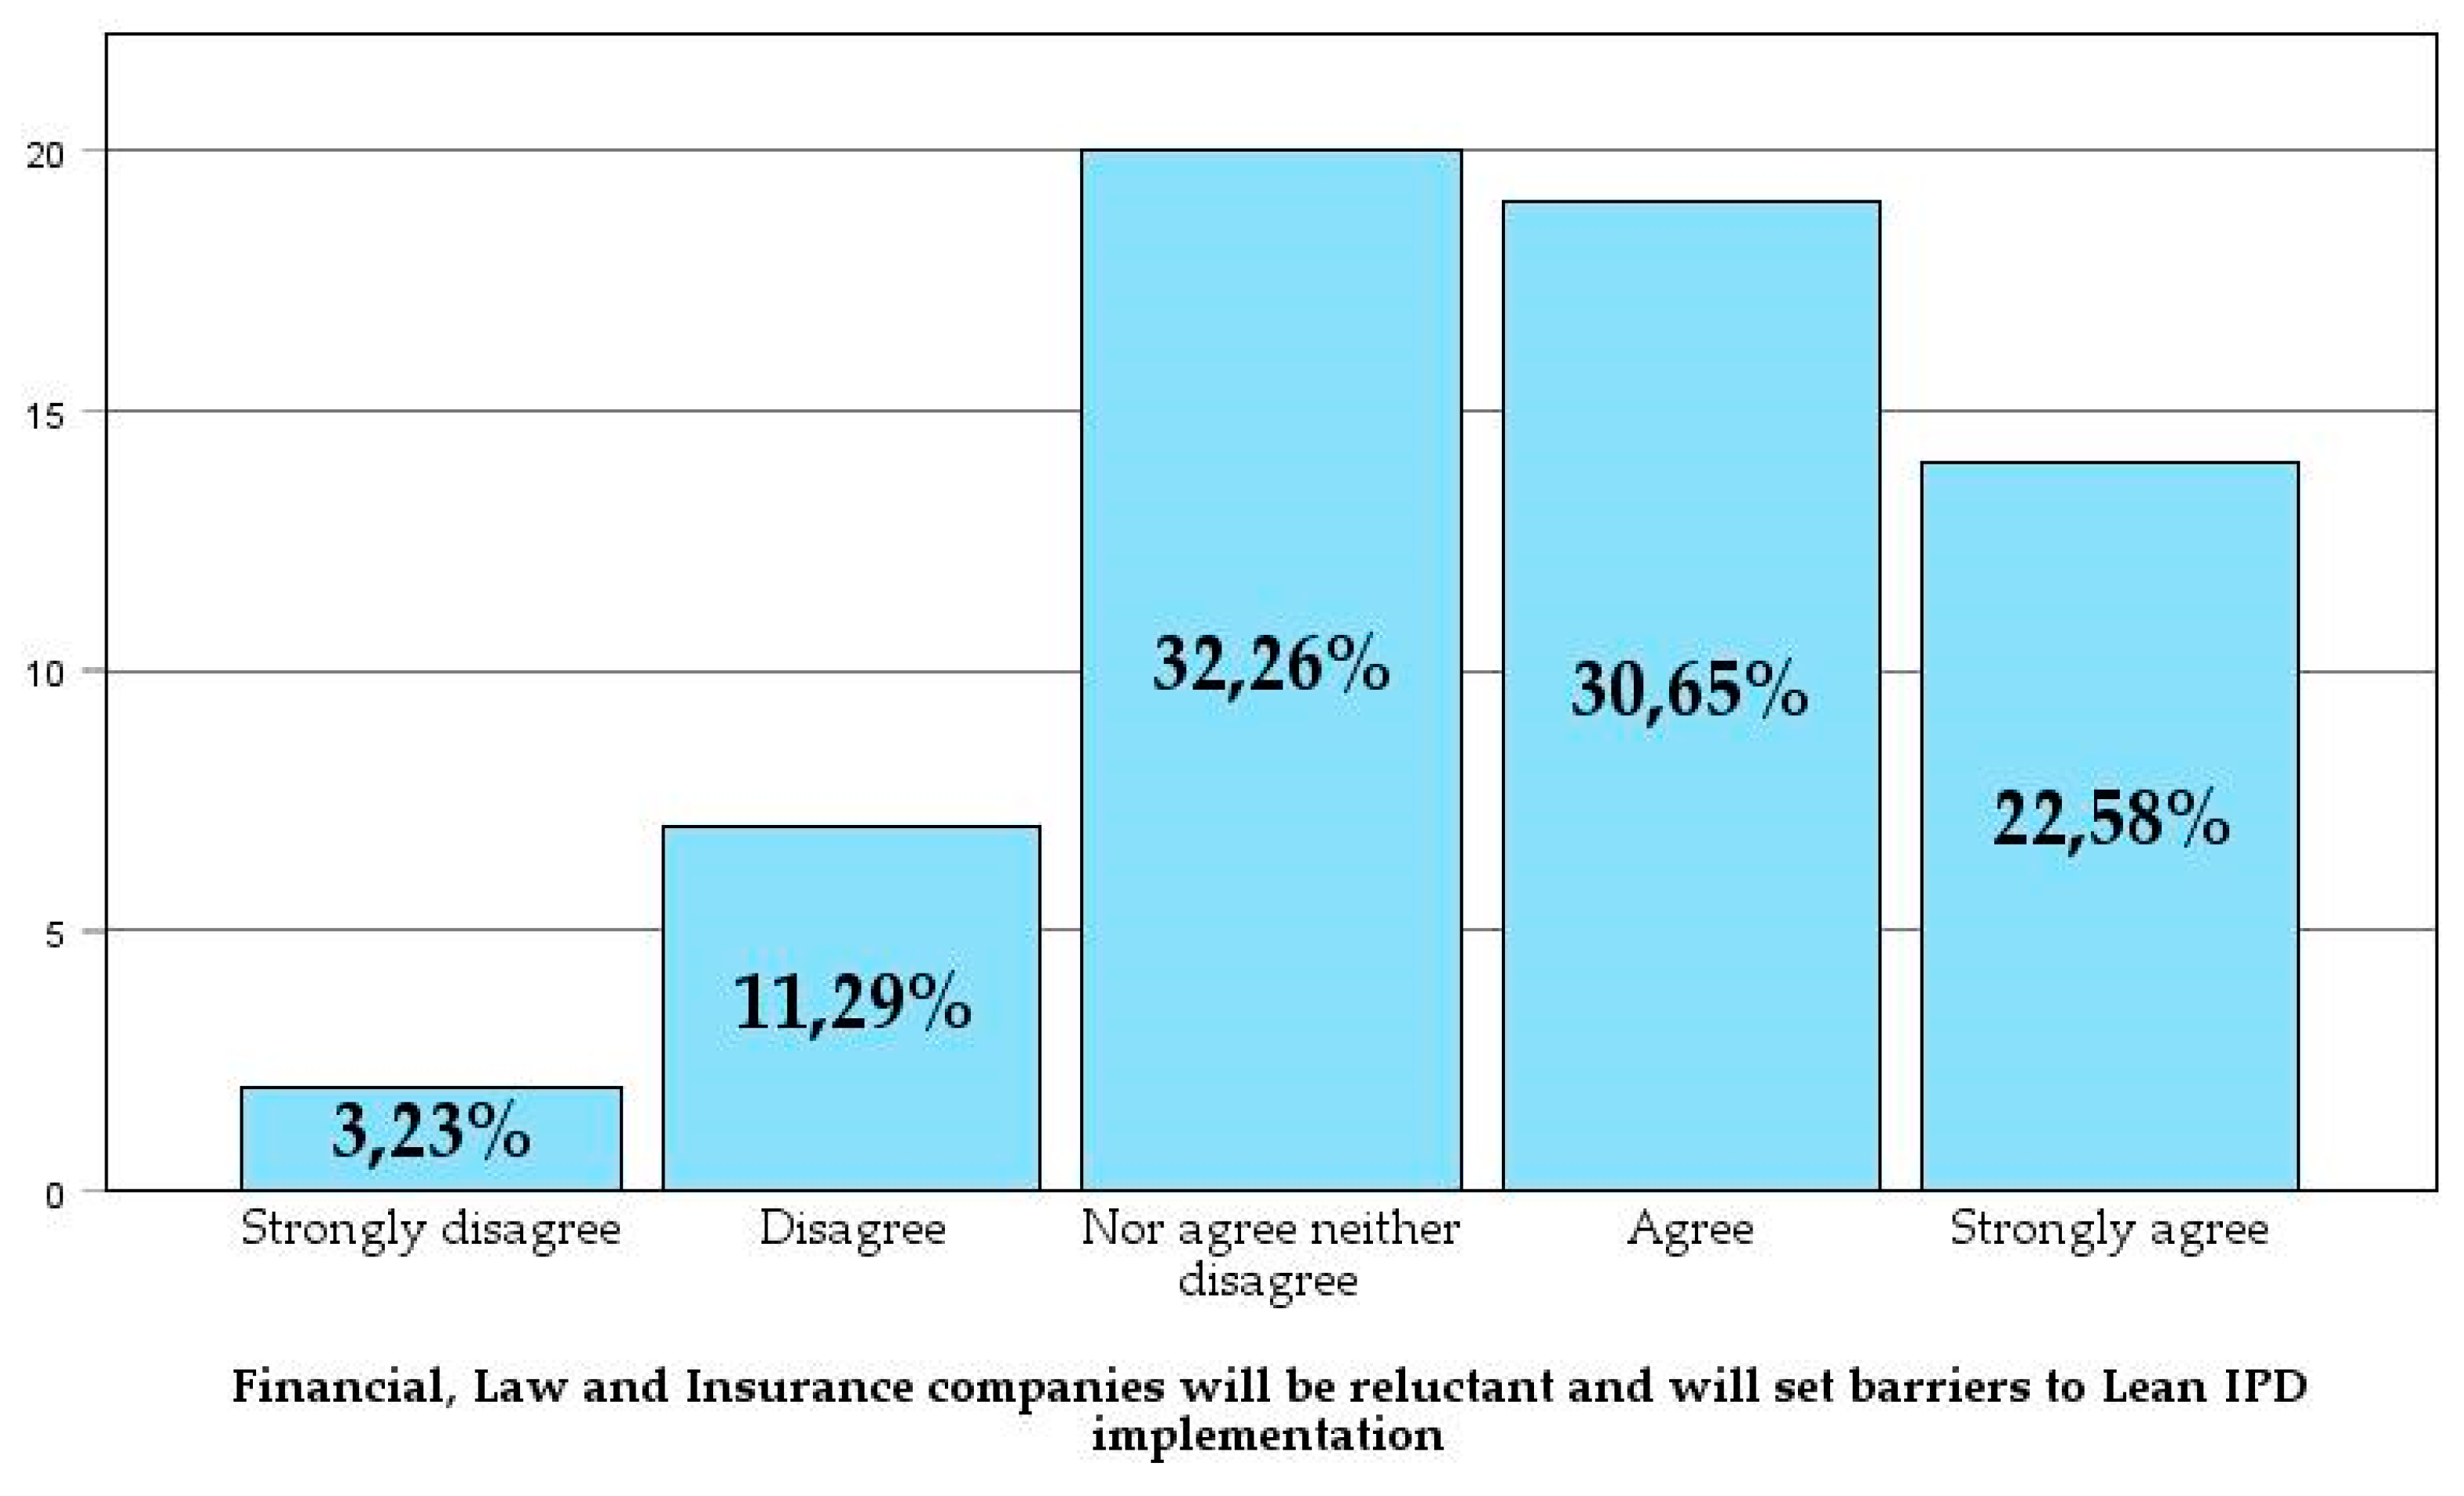
- Role of Other External Stakeholders
Construction projects are complex, and increasingly so [51]. In addition to the traditional objectives of time, cost, and quality, new goals have emerged, such as building wellness, ESG objectives, corporate social responsibility, brand reputation, and end-user satisfaction. Financial needs and risk aversion have also evolved, giving greater importance to actors like banks, law firms, and insurance companies in the construction process. Significant changes, such as those proposed by Lean IPD during the design and construction phases, could intimidate these non-technical stakeholders and potentially introduce new barriers to Lean IPD’s advancement.
A total of 53.3% of owners agree or strongly agree that banks, lawyers, and insurers represent a significant barrier to the implementation of Lean IPD and that it will be challenging for them to understand it. However, 32.26% of respondents are neutral, and 14.23% disagree or strongly disagree. This indicates a perception of moderate resistance from these institutions, with only a slight majority holding this view.
Figure 15.
The responsibilities described in the LOE for various construction agents hinder innovation in contract design compared to the Common Law systems in Anglo-Saxon countries, which allow greater flexibility.
Figure 15.
The responsibilities described in the LOE for various construction agents hinder innovation in contract design compared to the Common Law systems in Anglo-Saxon countries, which allow greater flexibility.
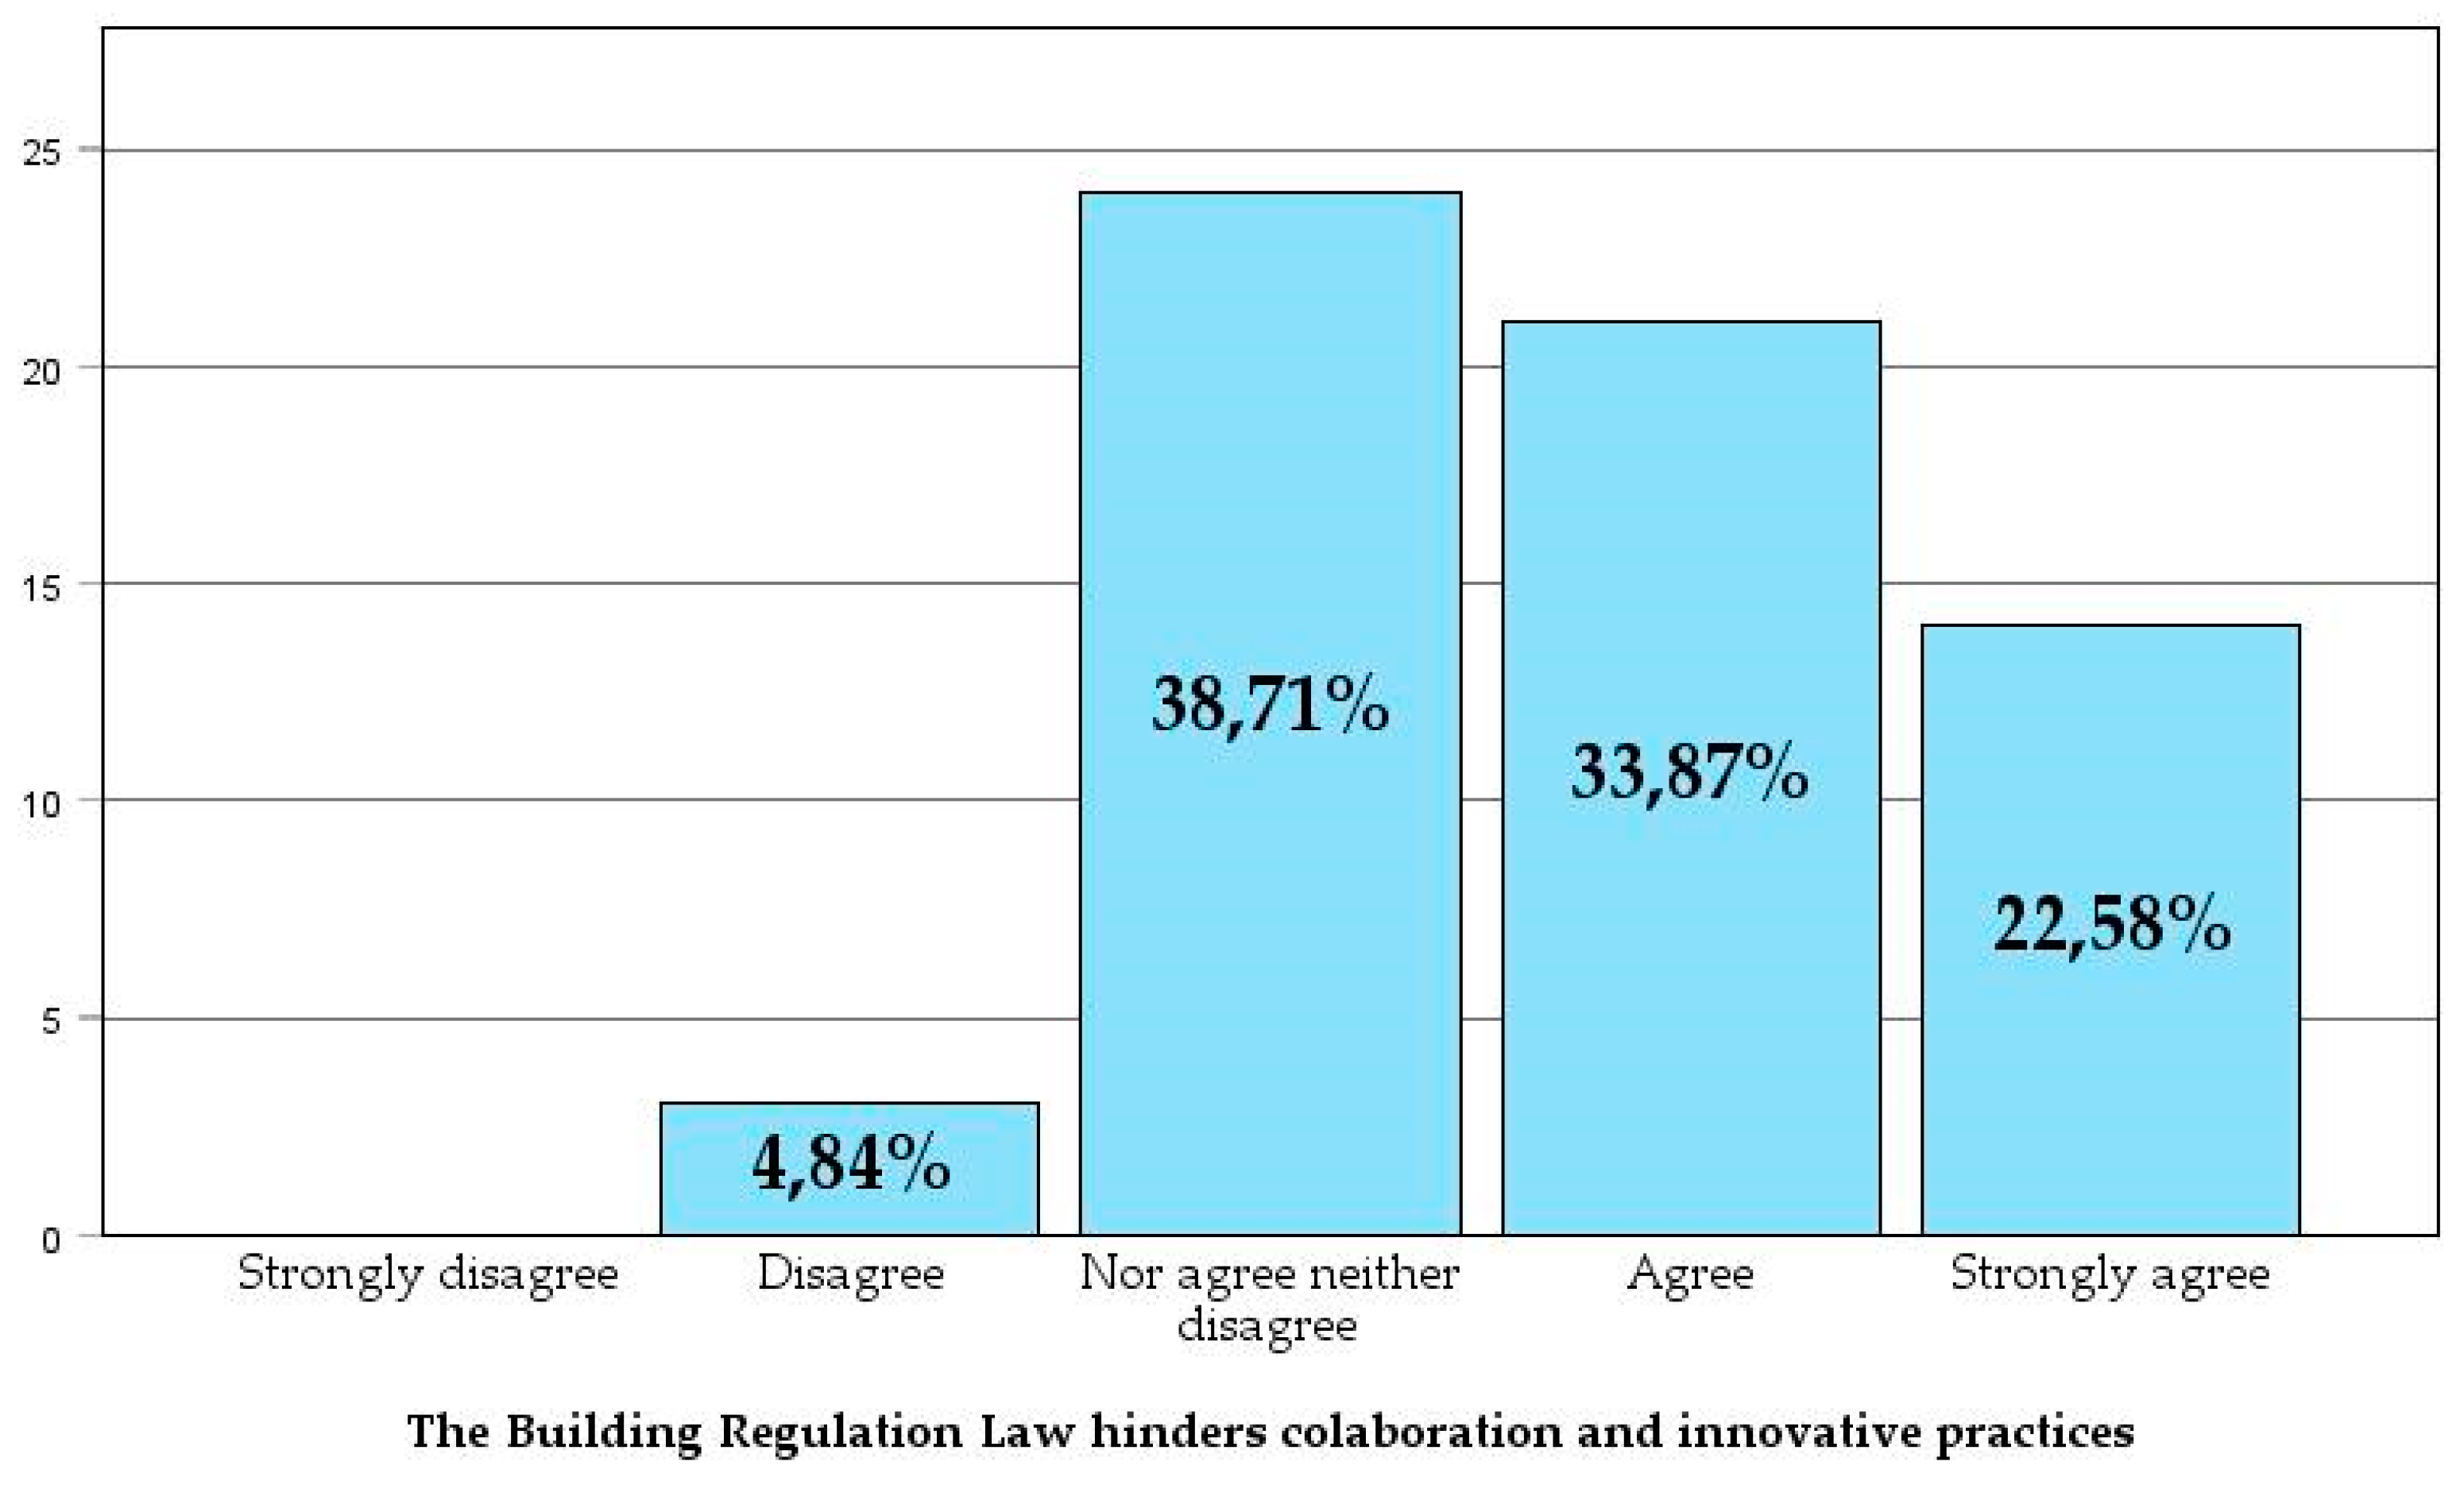
Figure 16.
The owner is the key figure who must drive Lean Construction and Integrated Project Delivery for their own benefit.
Figure 16.
The owner is the key figure who must drive Lean Construction and Integrated Project Delivery for their own benefit.
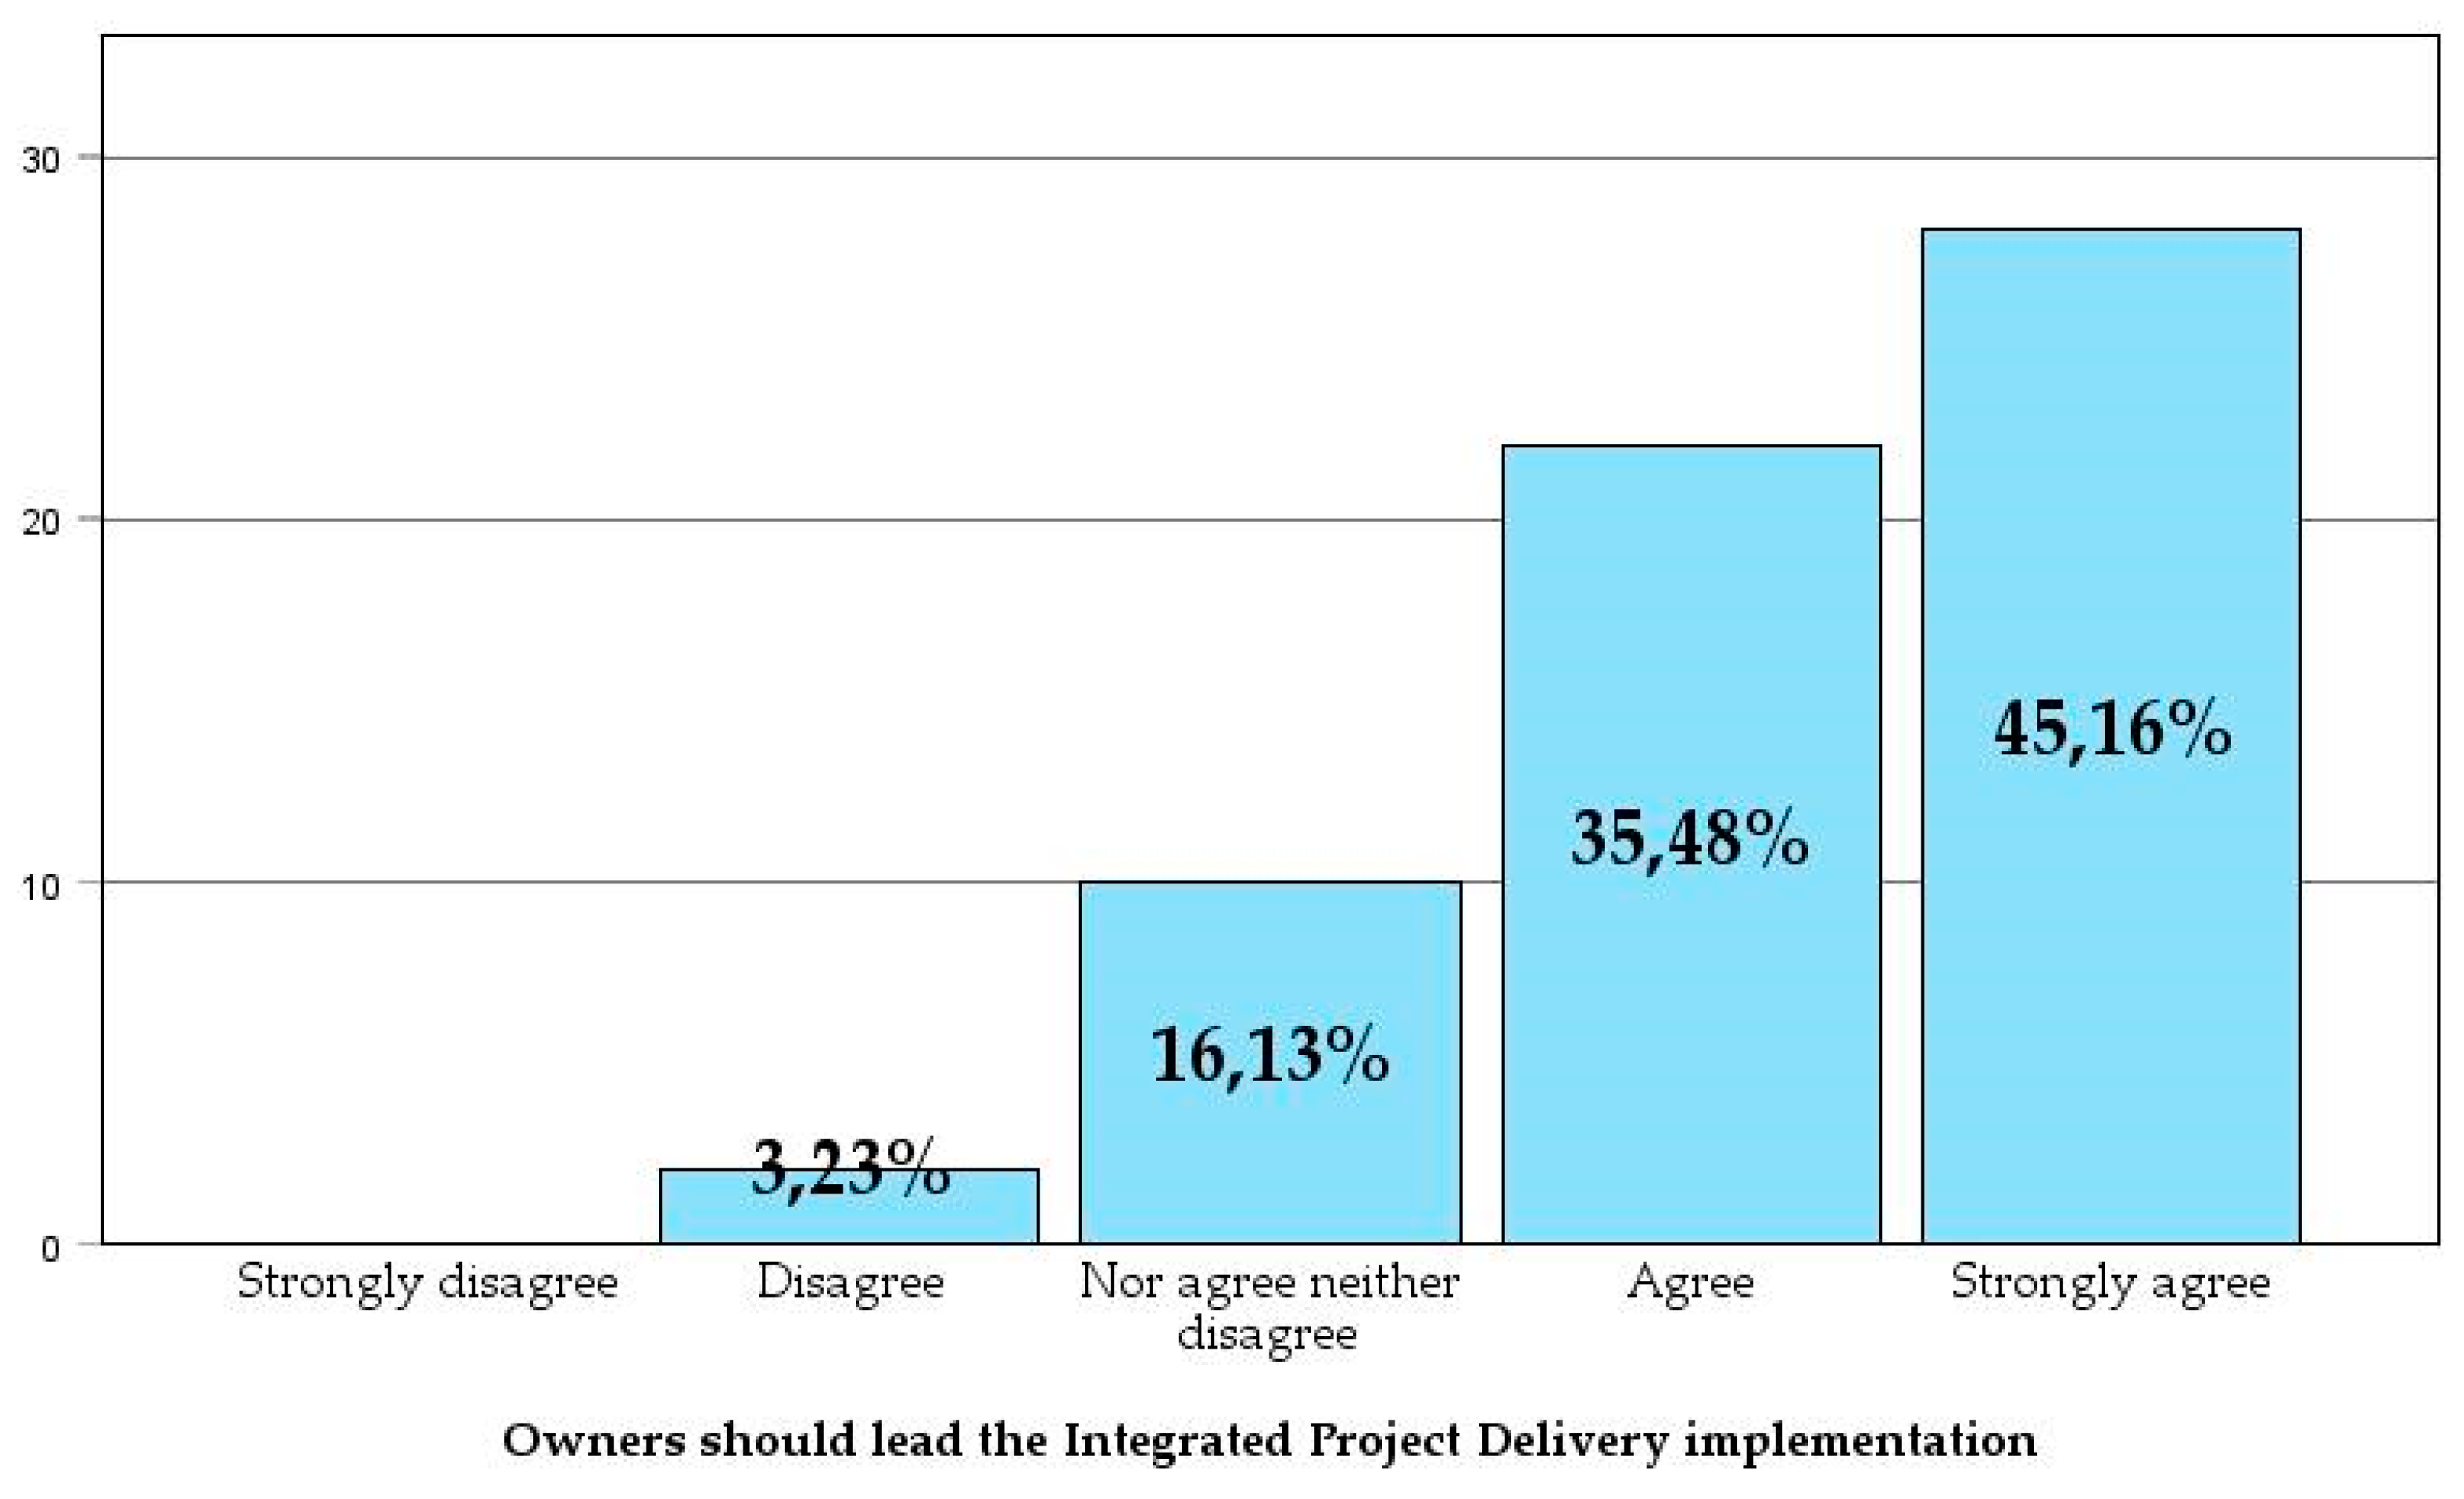
Figure 17.
Banks, lawyers, and insurers are a significant barrier to the implementation of Lean IPD. It will be very challenging for them to understand it, and they are likely to impose considerable resistance.
Figure 17.
Banks, lawyers, and insurers are a significant barrier to the implementation of Lean IPD. It will be very challenging for them to understand it, and they are likely to impose considerable resistance.
3.4. Fit Within the Organization and Personal Perceptionl
Real estate development companies can have vastly different philosophies, business approaches, structures, and ways of addressing the design and construction process. Some may be constrained by internal procedures, others by the very nature of their activities—in short, each company is unique.
The majority of respondents (62.9%) agree or strongly agree that the principles of Lean IPD align with their organization’s culture. However, 24.2% remain neutral, indicating either a lack of familiarity with IPD or the perception of barriers that need to be overcome.
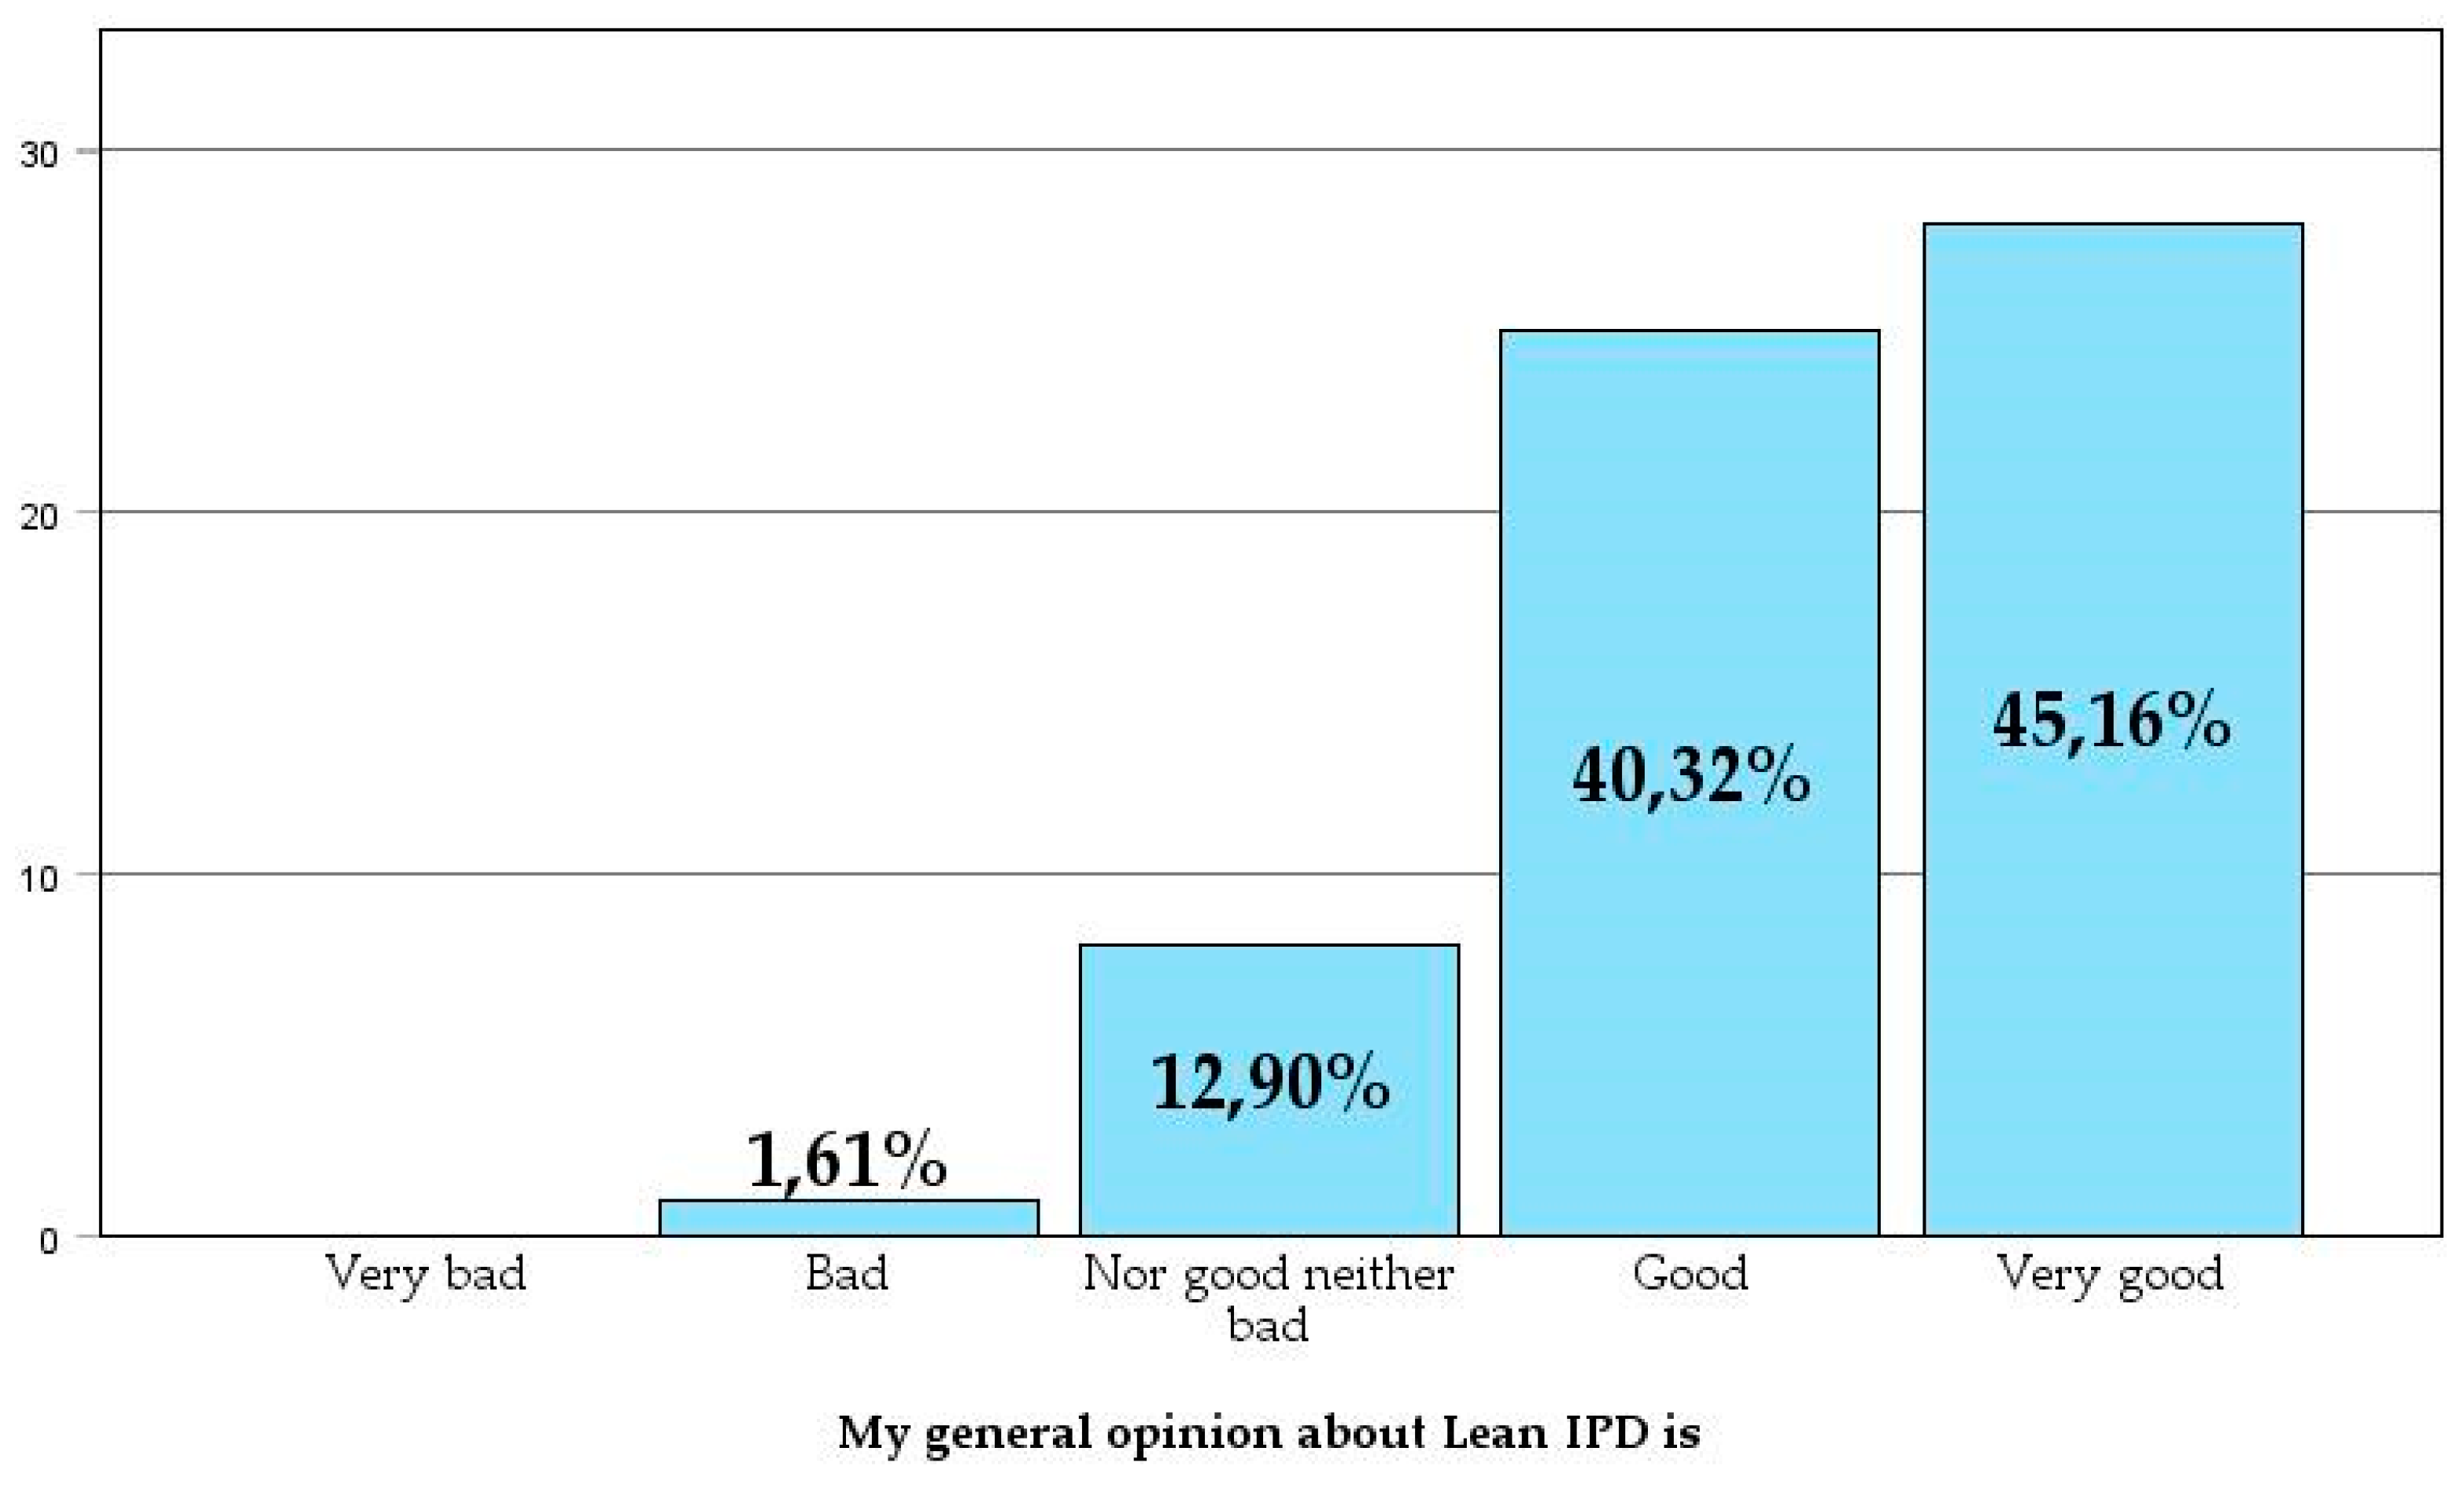
When the company factor is removed, and respondents are asked about their personal perception, 85.48% have a generally good or very good opinion of Lean IPD as a development system. This favorable perception suggests that Lean IPD is viewed as an effective and beneficial delivery method.
Figure 18.
The principles of Lean IPD align with my organization’s culture.
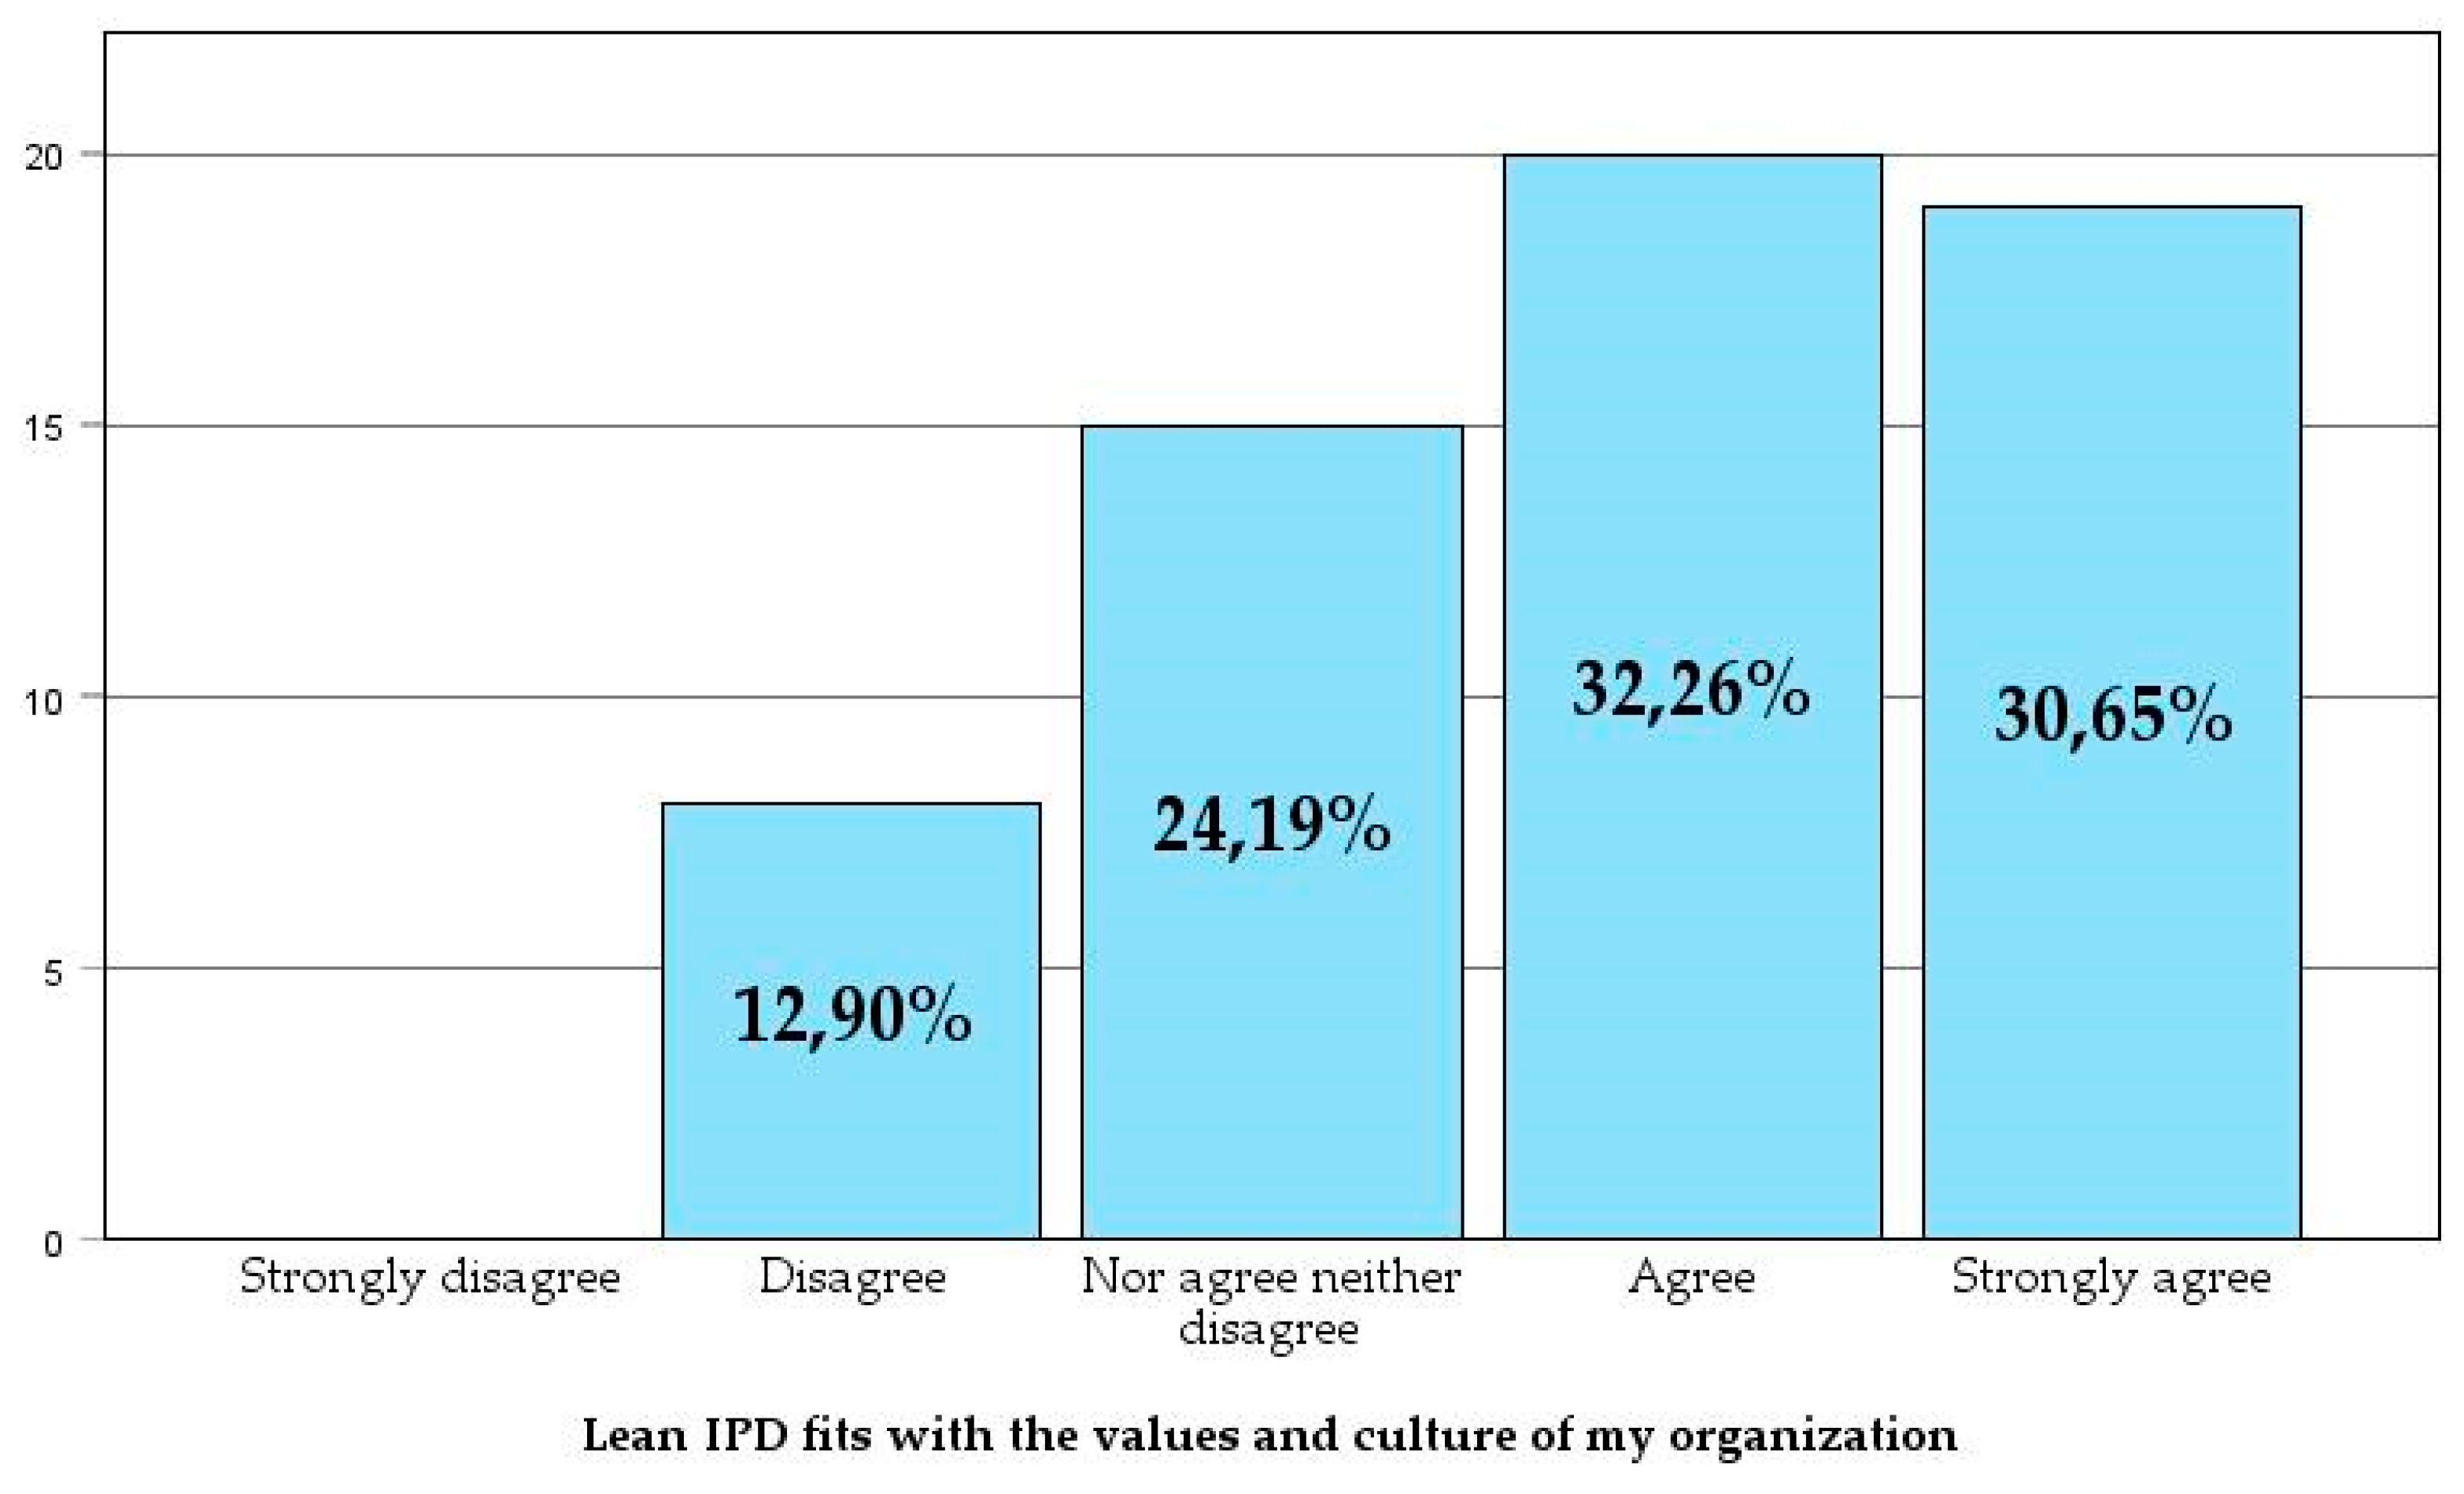
Figure 19.
My general perception of Lean IPD as a delivery method is.
3.5. Analysis of Latent Relationships
The principles underlying IPD interact in complex ways, and there may be underlying relationships between them that influence developers’ perceptions of the delivery method as a whole. To uncover these relationships, which are not immediately apparent, three complementary analyses were conducted. First, a Hierarchical Cluster Analysis, which was complemented by a K-means analysis. Then, a PLS-SEM model was built to verify the findings from the clustering. Finally, a multivariable analysis was performed to delve deeper into statistically significant correlations observed in the two previous procedures.
Clustering
Cluster analysis refers to an area of multivariate statistics that involves the grouping of objects based on some measure of proximity defined among those objects [52]. To perform the Hierarchical Cluster Analysis, the Ward method was used, which groups data points into clusters in a nested sequence of clustering. This method favors the creation of clusters of similar sizes while minimizing intra-cluster variability, thereby reducing the variance of each group as they merge.[53]. This is particularly useful in a Likert scale, where differences between responses can be subtle, and it is desirable to form homogeneous and meaningful clusters based on the responses. [54]. In the same vein, an interval-based measure using squared Euclidean distance was selected, which reinforces Ward’s objective of forming clusters with low internal variance and strongly penalizes large differences between cases. The resulting dendrogram shows that, starting from stage 13, two clusters of comparable sizes emerge.
Next, a K-means analysis was performed for two clusters. [55]. By comparing the centroids of both clusters, it was possible to identify which questions divided the sample into two groups. The results show that the sample is split into two groups based on their perceptions of three factors: 1) open-book accounting, 2) willingness to embrace the level of transparency required to implement open-book accounting, and 3) their perception of risk-reward compensation. The perception each group holds of these three factors directly influences how they view the fit of Lean IPD within their organization and, to a lesser extent, their individual perception of it.
Thus, Cluster 2, consisting of 33 cases, is highly receptive to the use of open-book accounting, risk-reward compensation, and companies willing to achieve high levels of transparency. Conversely, Cluster 1, made up of 29 cases, is much less receptive to these principles. Additionally, this latter group finds that Lean IPD does not align as well with their company culture and expresses a less favorable personal perception of this delivery method.
Figure 20.
The dendrogram shows that, starting from stage thirteen, two clusters of similar sizes emerge.
Figure 20.
The dendrogram shows that, starting from stage thirteen, two clusters of similar sizes emerge.
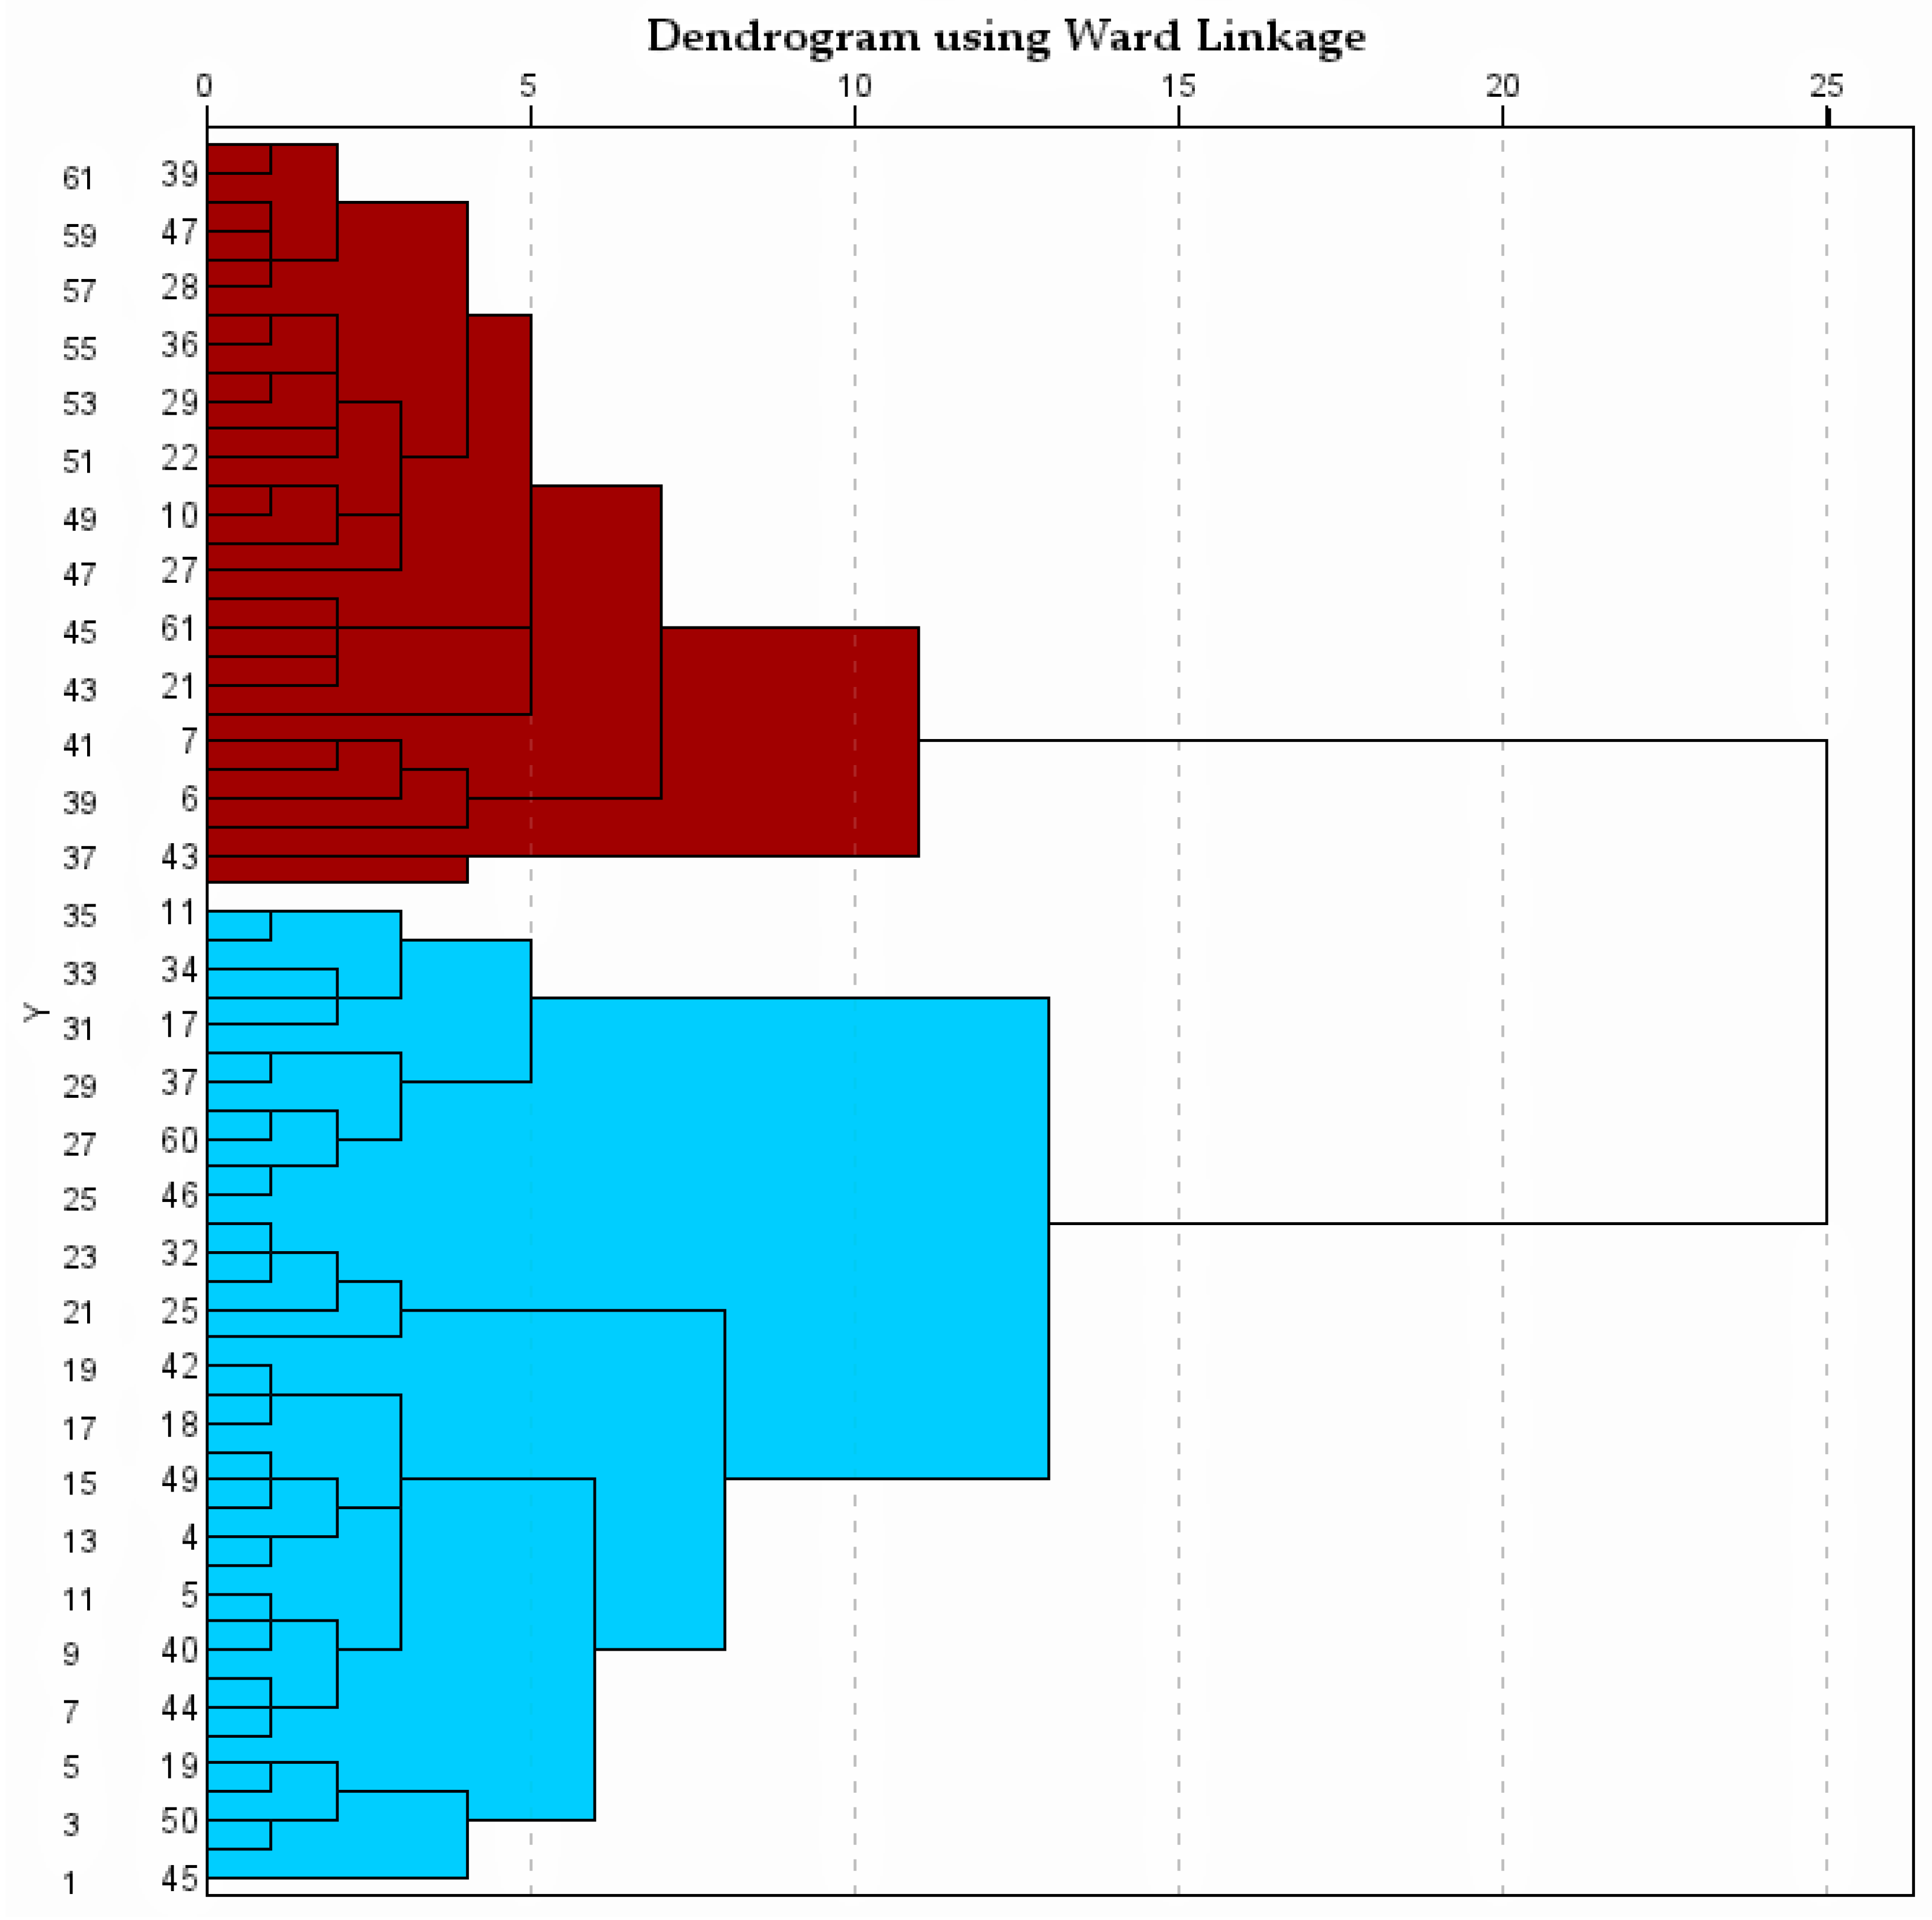
Figure 21.
Cluster centroids (C1 - red, C2 - blue) for each indicator.
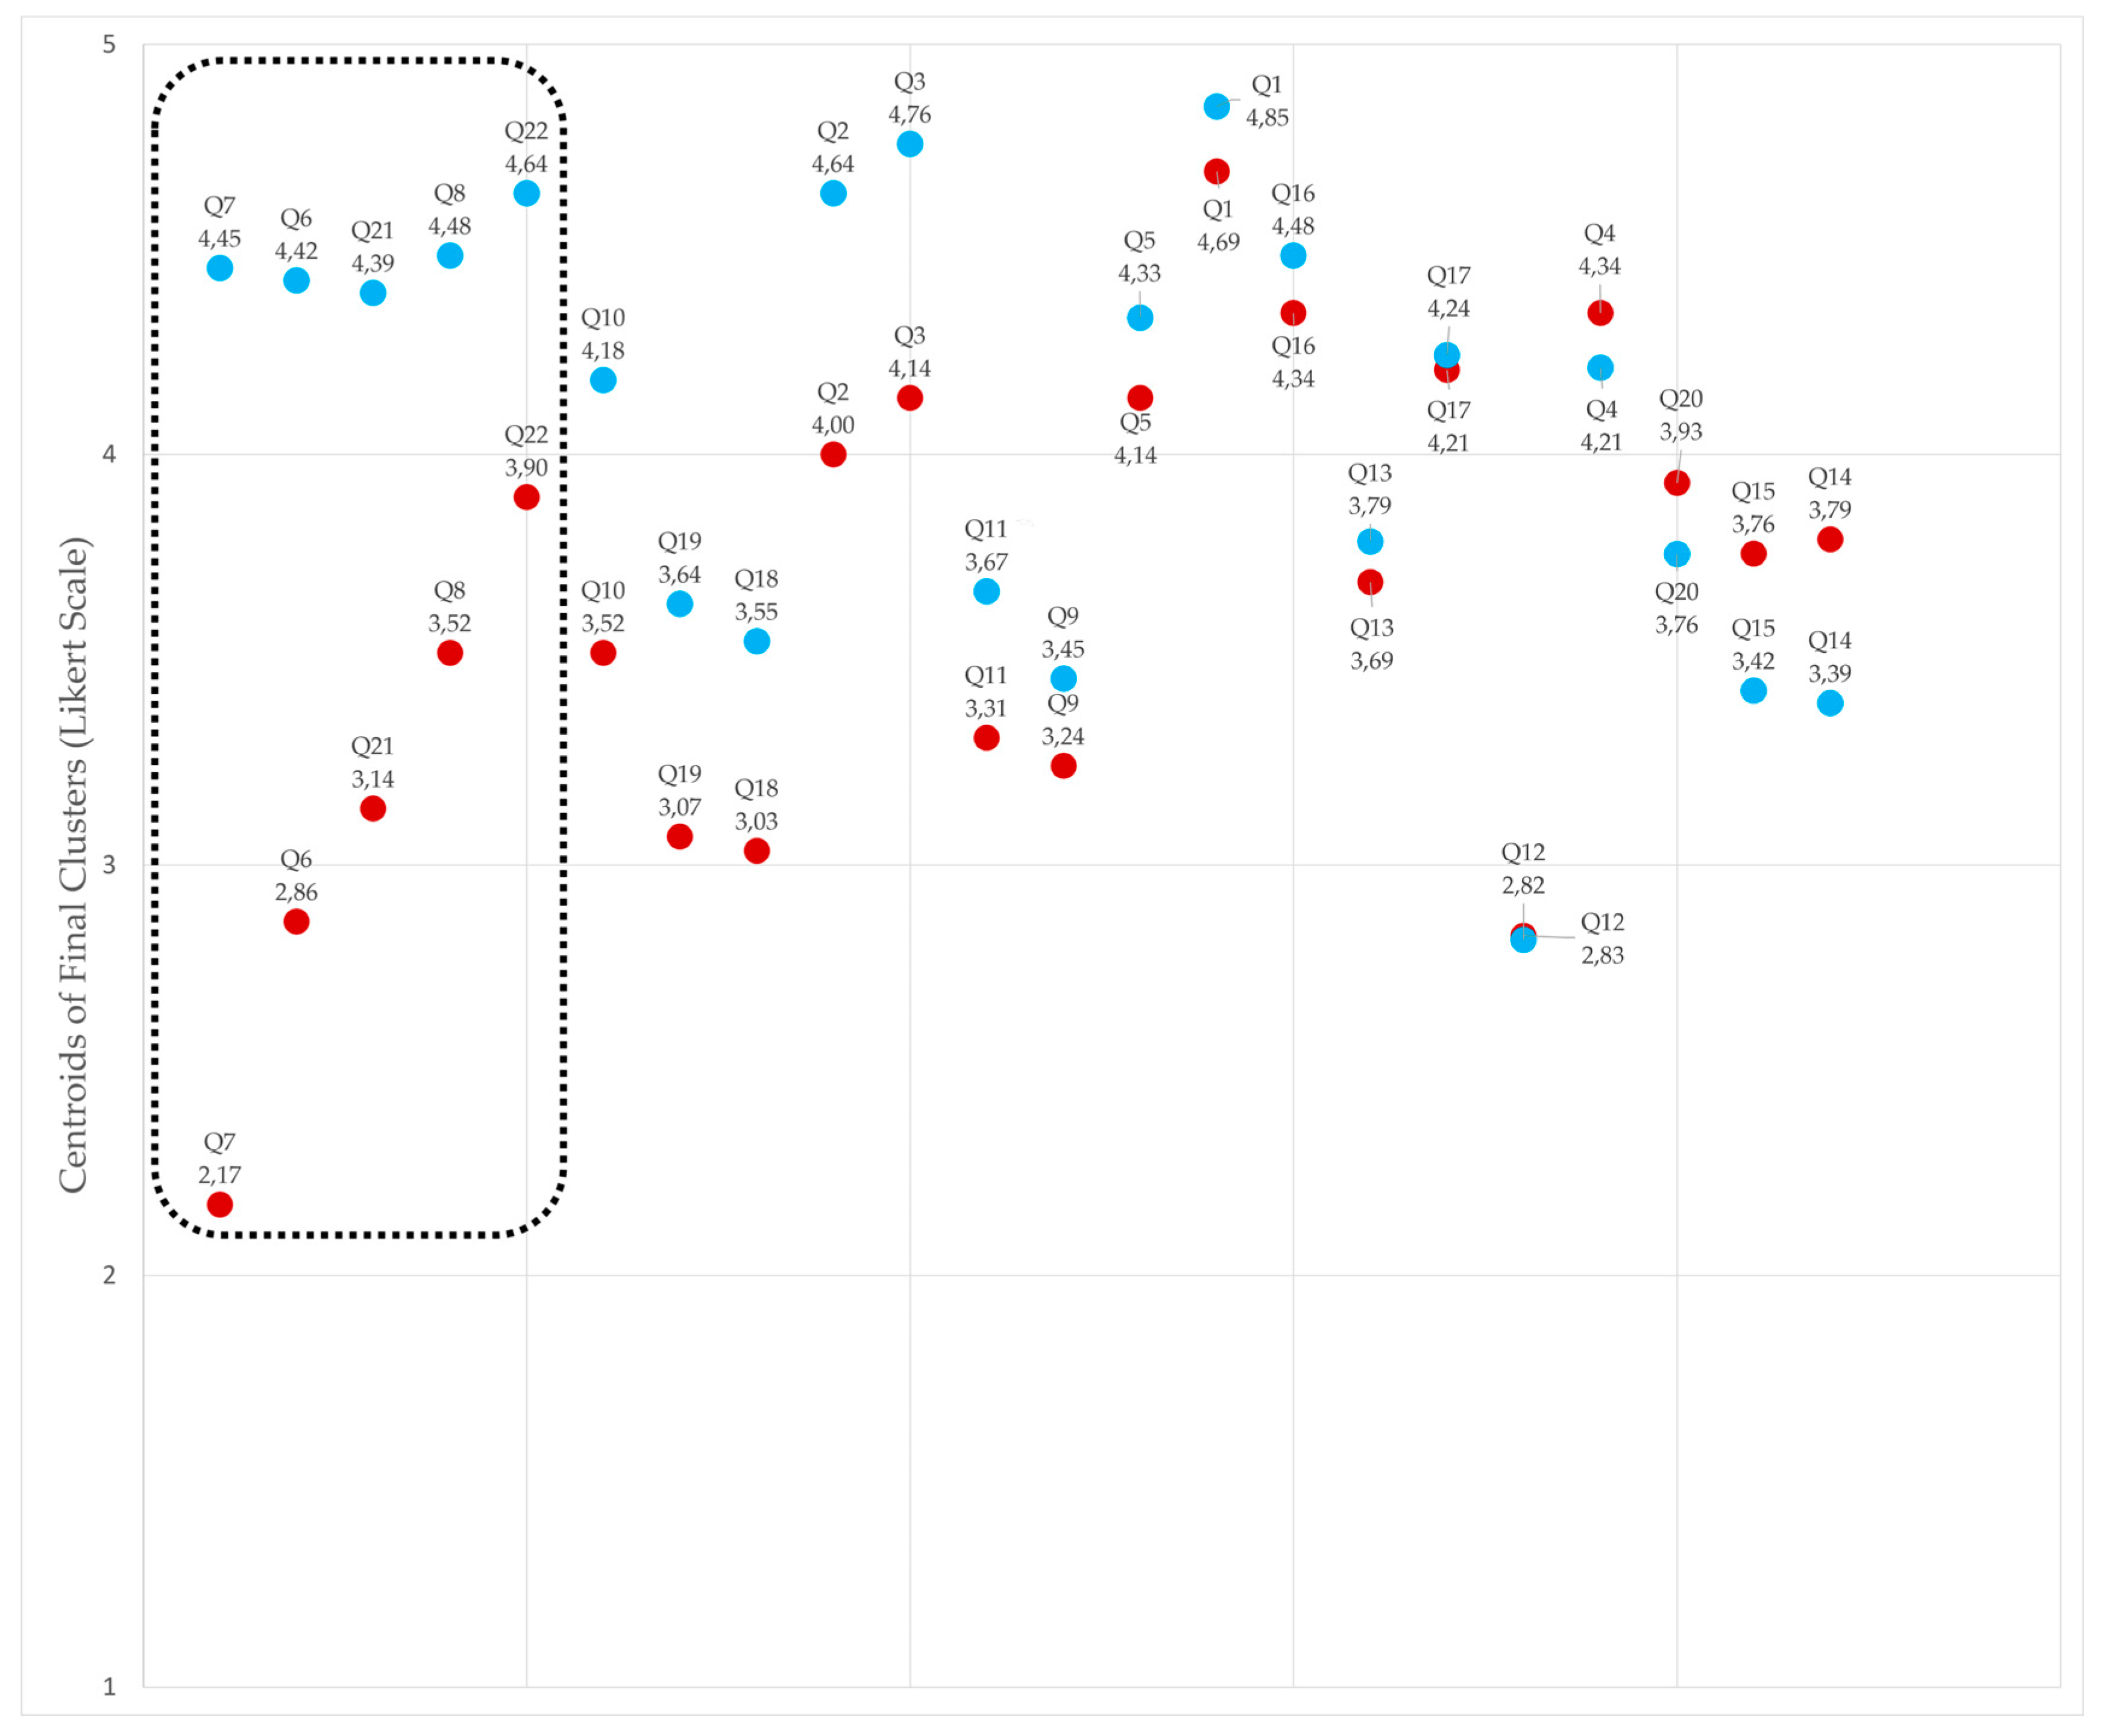
Table 4.
Centroides de Clúster (C1, C2) para cada indicador.
| Centroids of Final Clusters | ||||||
|---|---|---|---|---|---|---|
| Question | Statement | C1 | C2 | Dif. | D% | |
| q7 | In my organization, we are willing to embrace the level of transparency and cost uncertainty required by open-book accounting. | 2,17 | 4,45 | 2,28 | 105% | |
| q6 | Open-book accounting improves transparency and trust among stakeholders during the process. By eliminating economic tension, it reduces the likelihood of parties profiting at the expense of others. | 2,86 | 4,42 | 1,56 | 55% | |
| q21 | The principles of Lean IPD align with my organization’s culture. | 3,14 | 4,39 | 1,25 | 40% | |
| q8 | Risk-reward compensation incentivizes collaboration and teamwork while prioritizing the project over individual interests. | 3,52 | 4,48 | 0,96 | 27% | |
| q22 | My general perception of Lean IPD as a development system is... | 3,90 | 4,64 | 0,74 | 19% | |
| q10 | Co-location, combined with intensive owner participation in the project, improves: a) communication by enabling faster information flow and accelerating decision-making, and b) the sense of belonging to the project. | 3,52 | 4,18 | 0,66 | 19% | |
| q19 | Sooner or later, Integrated Project Delivery will be applied to most projects. | 3,07 | 3,64 | 0,57 | 19% | |
| q18 | Integrated Project Delivery is simple, and its barriers are surmountable. It will be widely adopted with ease. | 3,03 | 3,55 | 0,52 | 17% | |
| q2 | Shared decision-making ensures that the work executed must be consensus-based. This improves the quality of decisions, reduces blame attribution, and prioritizes the project’s interests over individual ones. | 4,00 | 4,64 | 0,64 | 16% | |
| q3 | Intensive owner participation—understood as attending work meetings as an active team member—improves understanding and accelerates decision-making. | 4,14 | 4,76 | 0,62 | 15% | |
| q11 | The cost associated with co-location makes it viable for projects in my organization. | 3,31 | 3,67 | 0,36 | 11% | |
| q9 | Linking stakeholders’ profits to the project’s success is fair because there are not many external factors beyond their control (e.g., labor shortages, economic conditions, etc.). | 3,24 | 3,45 | 0,21 | 6% | |
| q5 | In my organization, significant importance is placed on technical profiles, and they are prepared to participate intensively in projects. | 4,14 | 4,33 | 0,19 | 5% | |
| q1 | Perception of early participation. | 4,69 | 4,85 | 0,16 | 3% | |
| q16 | Training in IPD within companies and among individuals is low. For IPD to succeed, investment in training is necessary. | 4,34 | 4,48 | 0,14 | 3% | |
| q13 | The responsibilities described in the LOE for various construction agents hinder innovation in contract design compared to the Common Law systems in Anglo-Saxon countries, which allow greater flexibility. | 3,69 | 3,79 | 0,1 | 3% | |
| q17 | The real estate owner is the key figure who must drive Lean Construction and Integrated Project Delivery for their own benefit. | 4,21 | 4,24 | 0,03 | 1% | |
| q12 | Co-location is a desirable and essential aspect for Lean IPD. | 2,83 | 2,82 | -0,01 | 0% | |
| q4 | The owner needs to attend work meetings of the integrated project team. Decision-making during key moments is not as effective as intensive participation. | 4,34 | 4,21 | -0,1 | -3% | |
| q20 | Integrated Project Delivery will be applied to large, complex projects with a certain level of uncertainty. | 3,93 | 3,76 | -0,2 | -4% | |
| q15 | Banks, lawyers, and insurers are significant barriers to the implementation of Lean IPD. It will be very challenging for them to understand and will likely impose considerable resistance. | 3,76 | 3,42 | -0,3 | -9% | |
| q14 | The culture of confrontation, lack of trust, and stakeholder inertia are too strong. A generational shift will be required for Lean IPD to reach its full potential. | 3,79 | 3,39 | -0,4 | -11% | |
Partial Least Square – Structural Ecuation Modeling
To verify this finding, a PLS-SEM model was developed. PLS-SEM models are "causal models aimed at maximizing the explained variance of the dependent latent constructs."[56] or, in other words, they serve to show the degree of correspondence between the observations derived from the data and the construct, latent variables, and relationships proposed by the researcher. PLS-SEM models are increasingly being used in various fields of knowledge, such as organizational management, human resources, information systems management, operations management, marketing, accounting, strategic management, and supply chain management, among other social sciences [57]. These models are particularly useful when sample sizes are small, cases do not exhibit a normal distribution [58] and variables are categorical or ordinal, as is the case in this study.
To achieve this, the indicators (Q1 to Q22) were grouped into various latent variables until, through simplification and the removal of less relevant indicators, a reasonably good Model Fit was obtained.
The most relevant indicators were grouped into two reflective latent variables: Team Management and Economic Management. Both latent variables have an impact on a higher-order construct, which is the General Perception of IPD.
In Figure 22, it can be observed that aspects of Economic Management, such as the use of Open-book accounting or risk-reward compensation, have a greater impact on the general perception than team management aspects, such as early stakeholder involvement, collective decision-making, or intensive owner participation, among others.
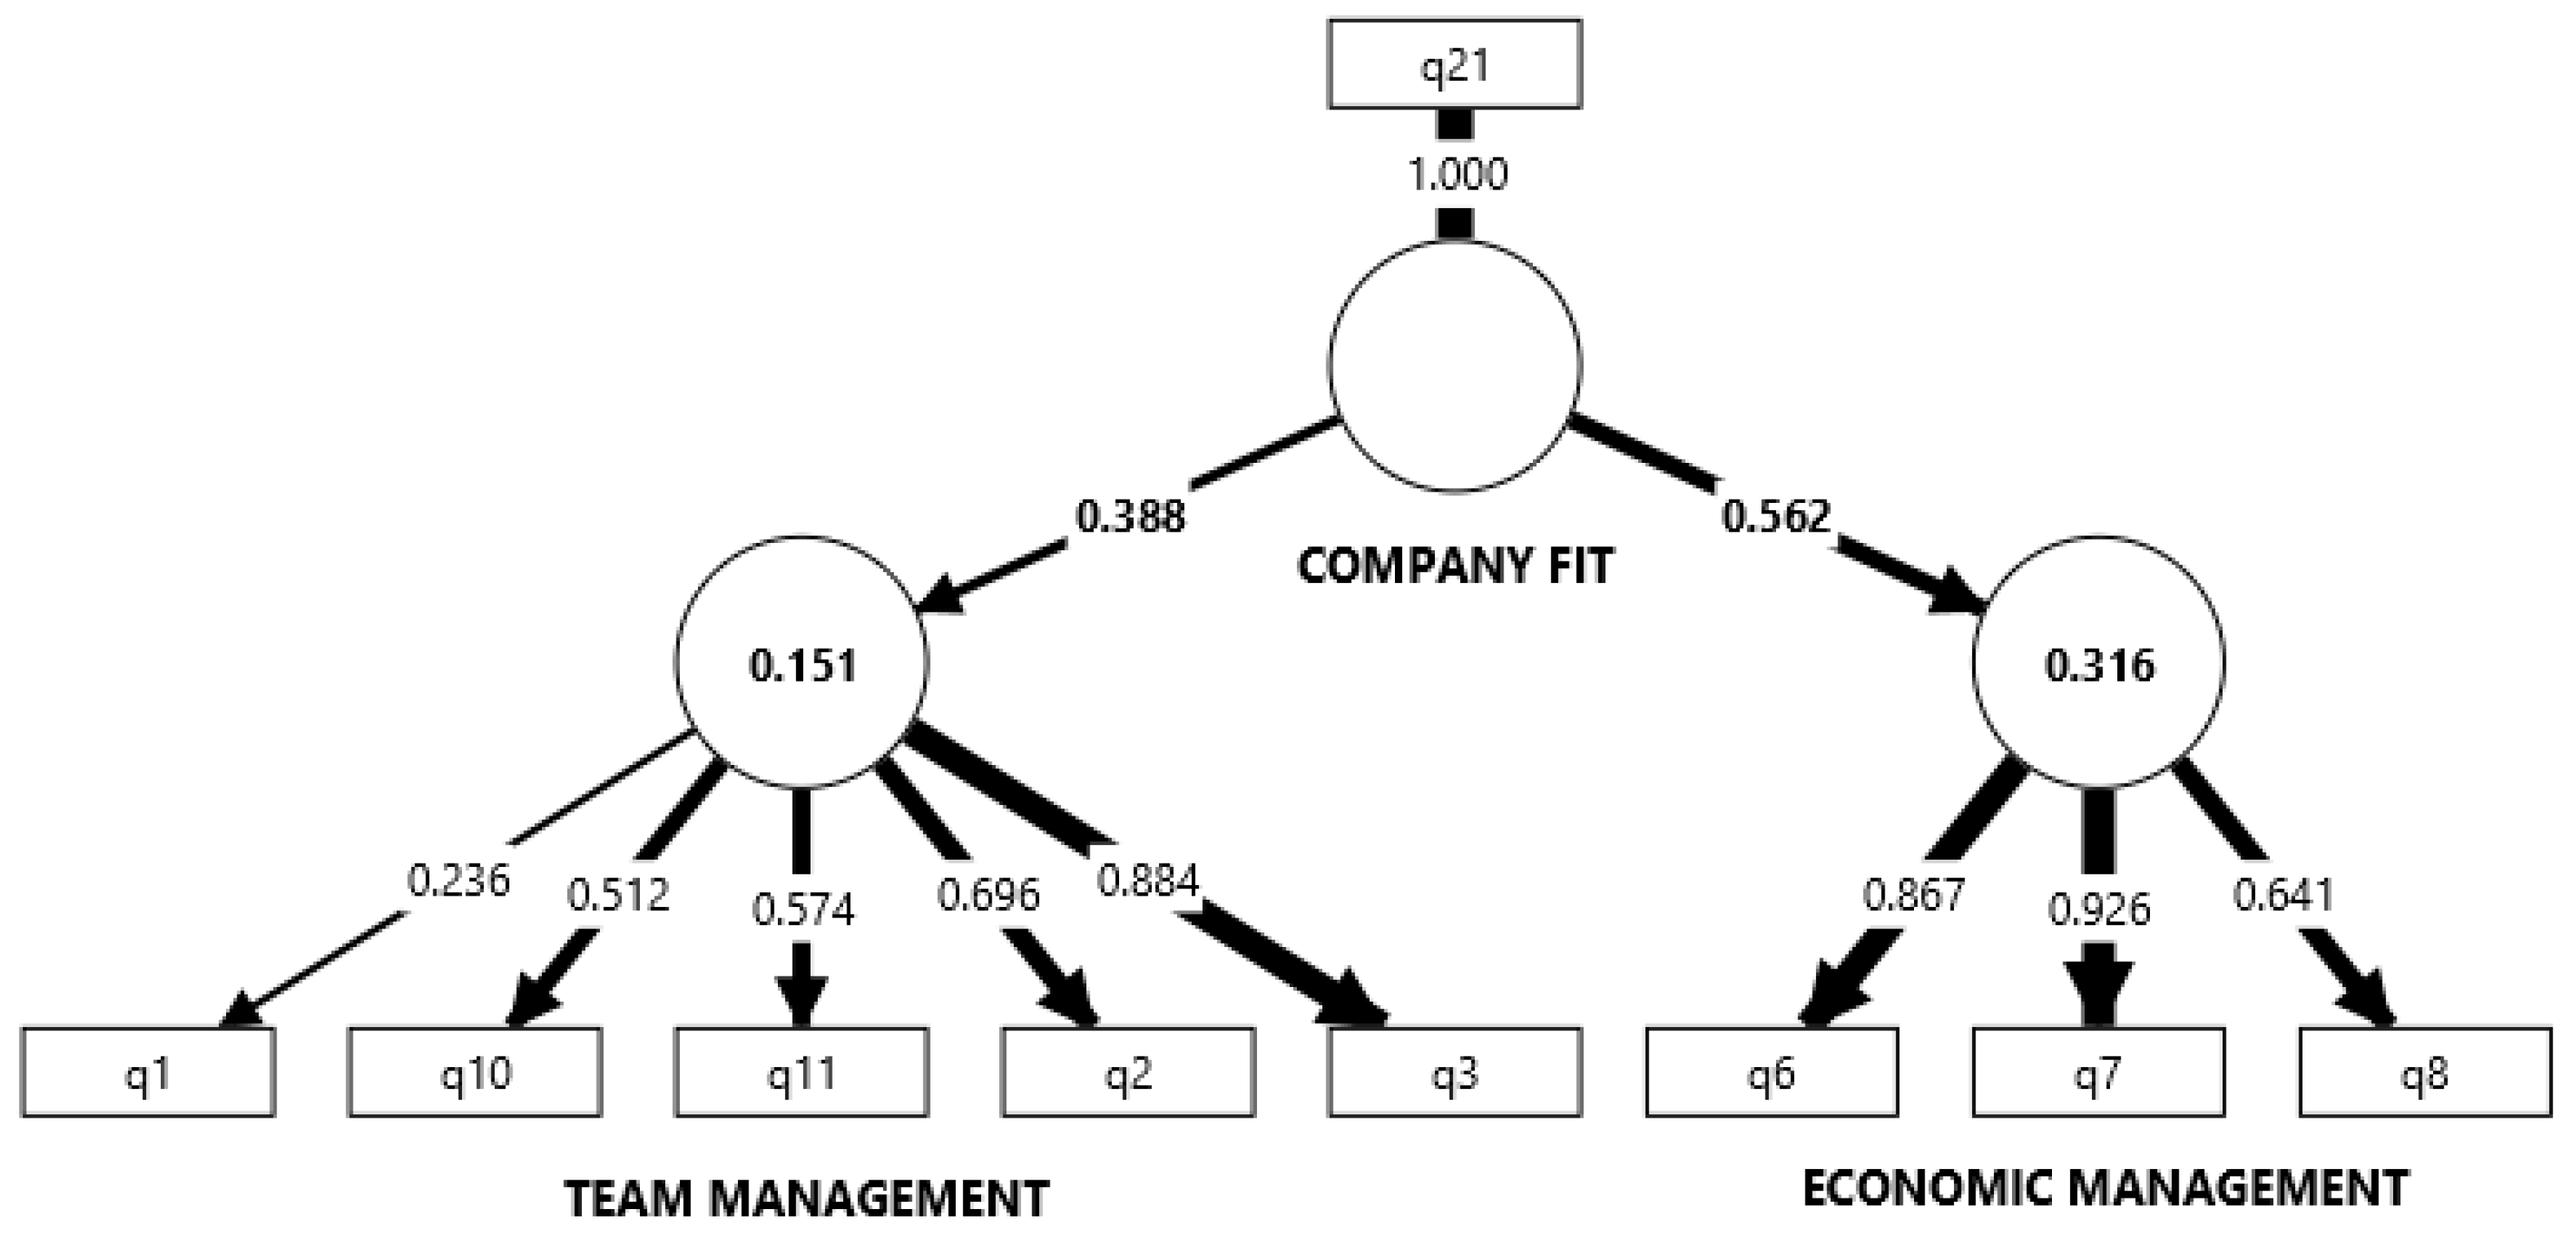
This difference becomes even more pronounced when the same construct is applied to study the fit of Lean IPD within their organization.
Figure 22.
PLS-SEM model used to study the contribution of indicators and latent variables to the general perception of Lean IPD.
Figure 22.
PLS-SEM model used to study the contribution of indicators and latent variables to the general perception of Lean IPD.
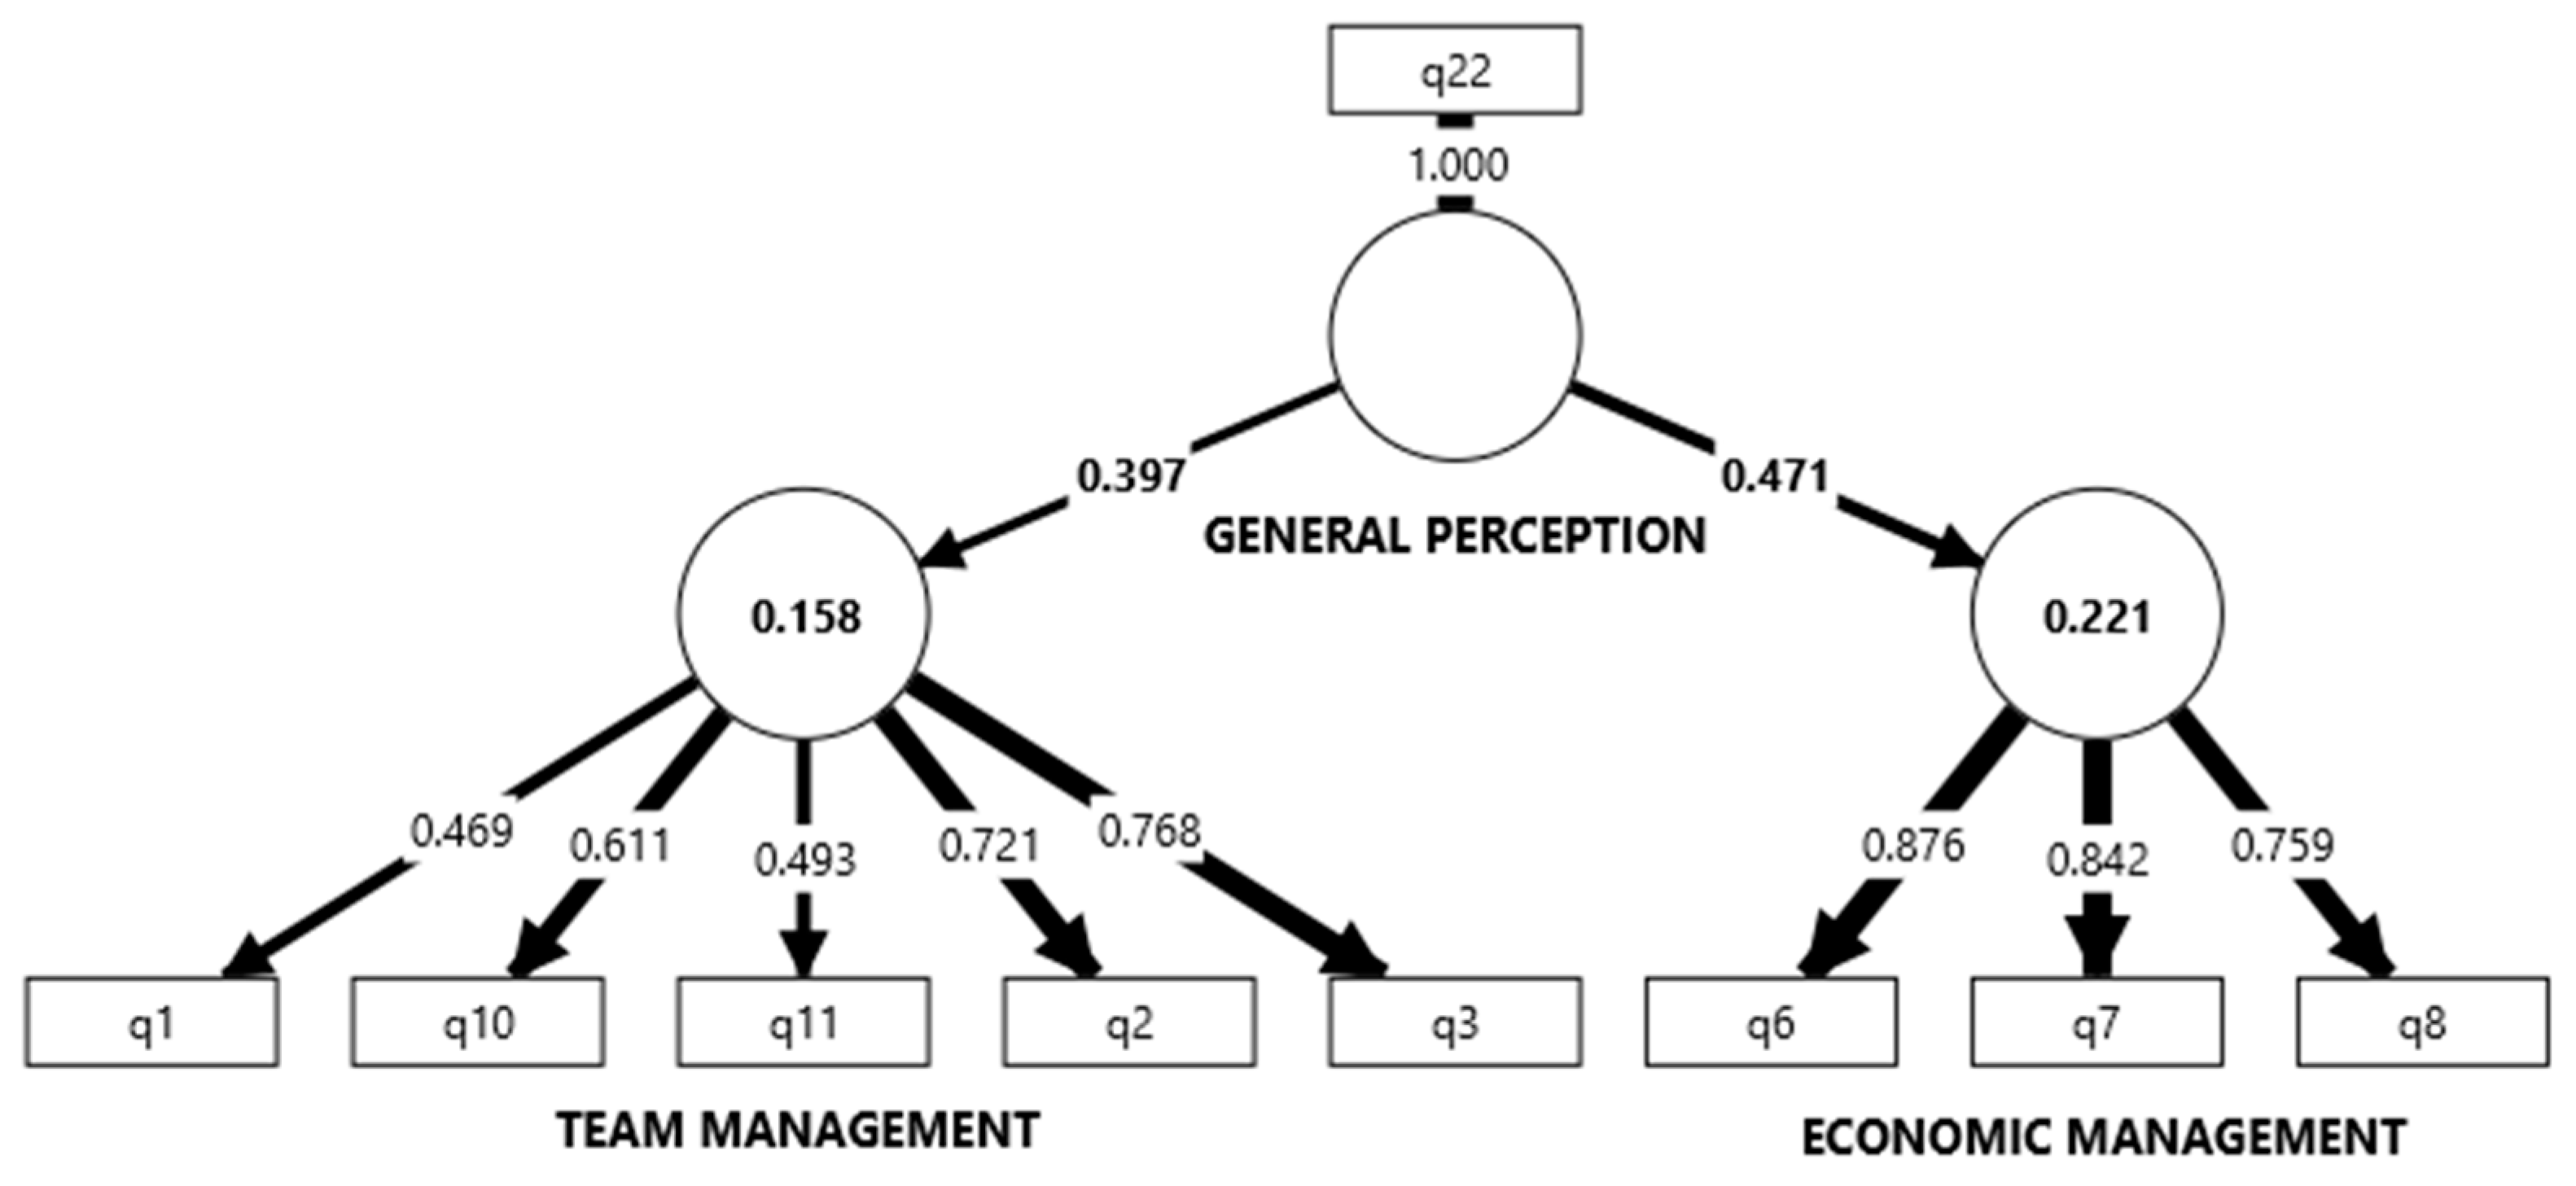
Figure 23.
PLS-SEM model used to study the contribution of indicators and latent variables to the fit of Lean IPD within the respondents’ organizations.
Figure 23.
PLS-SEM model used to study the contribution of indicators and latent variables to the fit of Lean IPD within the respondents’ organizations.
The analysis reveals that the use of open-book accounting has a greater impact on the perception of the delivery method and its fit within the organization than any other issue presented. It is important to understand that its implementation could be a dealbreaker when it comes to adopting collaborative contracting.
Table 5.
Model Fit parameters.
| Saturated model | Estimated model | |
| SRMR | 0,124 | 0,139 |
| d_ULS | 0,687 | 0,871 |
| d_G | 0,202 | 0,220 |
| Chi-square | 67,078 | 70,511 |
| NFI | 0,581 | 0,559 |
Table 6.
Path coefficients per indicator. General Perception (q22) vs. Company Fit (q21).
| Indicator | Statement | Reference Indicator |
Dif. | D% | |
|---|---|---|---|---|---|
| q21 | q22 | ||||
| q1 | Perception of early participation | 0,236 | 0,469 | 0,233 | 99% |
| q2 | Shared decision-making ensures that the work executed must be consensus-based. This improves the quality of decisions, reduces blame attribution, and prioritizes the project’s interests over individual ones. | 0,696 | 0,721 | 0,025 | 4% |
| q3 | Intensive owner participation—understood as attending work meetings as an active team member—improves their understanding and accelerates decision-making. | 0,884 | 0,768 | -0,12 | -13% |
| q6 | Open-book accounting improves transparency and trust among stakeholders during the process. By eliminating economic tension, it reduces the likelihood of one party attempting to profit at the expense of others. | 0,867 | 0,876 | 0,009 | 1% |
| q7 | In my organization, we are willing to embrace the level of transparency and cost uncertainty required by open-book accounting. | 0,926 | 0,842 | -0,09 | -9% |
| q8 | Risk-reward compensation incentivizes collaboration and teamwork while placing the project at the center, above individual stakeholders' interests. | 0,641 | 0,759 | 0,118 | 18% |
| q10 | Co-location, combined with intensive owner participation in the project, improves: a) communication by enabling faster information flow and accelerating decision-making, and b) the sense of belonging to the project. | 0,512 | 0,611 | 0,099 | 19% |
| q11 | The cost associated with co-location makes it viable for projects in my organization. | 0,574 | 0,493 | -0,08 | -14% |
| Reference Indicator | |||||
| q21 | The principles of Lean IPD align with my organization’s culture. | ||||
| q22 | My general perception of Lean IPD as a delivery method is... | ||||
| Latent Variables | |||||
| TM | Team Management | 0,397 | 0,388 | -0,01 | -2% |
| ECO | Economic Management | 0,471 | 0,562 | 0,091 | 19% |
Bivariate Correlations
Bivariate data arise from the simultaneous observation of two variables and are used to describe them jointly or one in relation to the other [59]. Through the study of bivariate correlations (Kendall’s Tau-b, Tau-c, and Spearman), 166 statistically significant correlations were identified among all the variables in the study.
In light of the previously described findings, the focus was placed on the main correlations between the use and predisposition to use open-book accounting and the other variables in the questionnaire. Seven highly significant correlations were found (p-value < 0.01).
- Company Size vs. Disposition to Use Open-Book Accounting
Larger companies are less willing to adopt open-book accounting. To reach this conclusion, ordinal and interval correlation coefficients were calculated to explore this relationship in greater depth. Kendall’s Tau-b and Tau-c coefficients were negative and significant, τ_b = -.263, p = .003 and τ_c = -.259, p = .003, respectively, indicating an inverse relationship between company size and willingness to embrace cost transparency. Spearman's correlation also showed a negative relationship, ρ = -.329, p = .009, as did Pearson's correlation coefficient, r = -.300, p = .018, reinforcing the initial conclusion.
- Open-Book Accounting vs. Risk-Reward Compensation
A better perception of open-book accounting correlates with a better perception of using risk-reward compensation. The results indicate a positive and significant association between these two variables. Respondents who believe that transparency reduces economic tensions between parties also tend to view project focus and teamwork as essential.
Correlation tests showed significant relationships between the ordinal and interval variables. Kendall’s Tau-b was .419, and Tau-c was .400, both with a T of 5.123 and significant at a level of p < .001. Spearman’s correlation reached .499 (T = 4.455, **p < .001), while Pearson’s R was .471 (T = 4.141, **p < .001). For chi-square tests, Pearson’s chi-square was 26.308 with df = 12 and p = .010, while the likelihood ratio was 27.431 with p = .007, and the linear-by-linear association achieved p < .001.
- Risk-Reward Compensation vs. Disposition to Adopt Open-Book Accounting
The results suggest that participants who agree that a risk-reward compensation structure incentivizes collaboration also tend to be disposed to adopt open-book accounting.
Correlation tests indicate significant associations between the two variables. Kendall’s Tau-b showed a correlation of .361 (T = 4.211, p < .001), while Spearman’s correlation reached .456 (T = 3.971, p < .001). Additionally, Pearson’s R was .410, with a T value of 3.486, also significant (p < .001). In the chi-square analysis, Pearson’s chi-square was 38.145 with df = 12 and p < .001, indicating a significant association. However, 90% of the cells had expected counts of less than 5, which suggests caution in interpreting these tests.
- Open-Book Accounting vs. Co-Location
Developers who agree that co-location facilitates communication and accelerates decision-making also tend to perceive that cost transparency and the reduction of economic tensions benefit the project.
Correlations between co-location, project participation, and the perception of transparency showed significant associations. Kendall’s Tau-b was .365 (T = 3.306, p < .001), and Spearman’s correlation reached .407 (T = 3.450, p = .001). Additionally, Pearson’s R resulted in .349 (T = 2.884, p = .005), indicating a moderate relationship.
- Organizational Culture vs. Open-Book Accounting
Developers who believe that the principles of Lean IPD align with their organization’s culture tend to agree that transparency and the elimination of individual interests are beneficial for projects.
Correlations between the two variables were statistically significant. Kendall’s Tau-b showed a correlation of .351 (T = 3.293, p < .001), while Spearman’s correlation was .402 (T = 3.404, p = .001). Pearson’s R was also significant with a value of .380 (T = 3.182, p = .002).
- General Perception of Lean IPD vs. Disposition to Adopt Open-Book Accounting
The results indicate that participants with a positive perception of Lean IPD are more willing to embrace the transparency and cost uncertainty associated with the use of open-book accounting in their organizations.
The correlations between the variables were significant. Kendall’s Tau-b was .338 (T = 3.365, p < .001), while Spearman’s correlation reached .389 (T = 3.270, p = .002). Pearson’s R was also significant, with a value of .374 (T = 3.124, p = .003). In the chi-square tests, Pearson’s chi-square did not reach significance (p = .070), but the linear-by-linear association was significant (p = .003), suggesting a linear relationship between the variables.
- General Perception of Lean IPD vs. Perception of Open-Book Accounting
The results suggest that developers with a positive perception of Lean IPD are more inclined to value transparency and the reduction of conflicts of interest through the use of open-book accounting. Those who consider the Lean IPD system a good development model also tend to agree that cost transparency benefits the project.
The correlations between variables were statistically significant. Kendall’s Tau-b was .392 (T = 4.241, p < .001), while Spearman’s correlation reached .449 (T = 3.895, p < .001). Pearson’s R was also significant, with a value of .405 (T = 3.431, p = .001). However, chi-square tests did not show significance for Pearson’s chi-square (p = .122), but the linear-by-linear association was significant (p = .002), indicating a linear relationship between the variables.
Table 7.
Bivariate Correlation. Company Size vs. Disposition to Use Open-Book Accounting.
| In my organization, we are willing to embrace the level of transparency and cost uncertainty required by open-book accounting. | Total | ||||||
| Strongly disagree | Disagree | Nor agree neither disagree | Agree | Strongly agree | |||
| Company Size | <10 people | 0 | 1 | 3 | 2 | 8 | 14 |
| <50 people | 2 | 4 | 5 | 2 | 6 | 19 | |
| <100 people | 0 | 1 | 0 | 3 | 2 | 6 | |
| <150 people | 3 | 2 | 1 | 1 | 0 | 7 | |
| <200 people | 0 | 2 | 0 | 2 | 2 | 6 | |
| <250 people | 2 | 2 | 3 | 2 | 1 | 10 | |
| Total | 7 | 12 | 12 | 12 | 19 | 62 | |
Table 8.
Bivariate Correlation: Perception of Risk-Reward Compensation vs. Perception of Open-Book Accounting.
Table 8.
Bivariate Correlation: Perception of Risk-Reward Compensation vs. Perception of Open-Book Accounting.
| Perception of Risk-Reward Compensation | Total | |||||
| Disagree | Nor agree neither disagree | Agree | Strongly agree | |||
| Perception of Open-Book Accounting | Strongly disagree | 1 | 1 | 1 | 0 | 3 |
| Disagree | 0 | 2 | 5 | 0 | 7 | |
| Nor agree neither disagree | 1 | 6 | 5 | 2 | 14 | |
| Agree | 1 | 5 | 5 | 9 | 20 | |
| Strongly agree | 0 | 2 | 3 | 13 | 18 | |
| Total | 3 | 16 | 19 | 24 | 62 | |
Table 9.
Bivariate Correlation: Disposition to Adopt Open-Book Accounting vs. Risk-Reward Compensation.
Table 9.
Bivariate Correlation: Disposition to Adopt Open-Book Accounting vs. Risk-Reward Compensation.
| Disposition to Adopt Open-Book Accounting | Total | ||||||
| Strongly disagree | Disagree | Nor agree neither disagree | Agree | Strongly agree | |||
| Risk-Reward Compensation | Disagree | 1 | 0 | 2 | 0 | 0 | 3 |
| Nor agree neither disagree | 0 | 4 | 7 | 4 | 1 | 16 | |
| Agree | 5 | 6 | 2 | 3 | 3 | 19 | |
| Strongly agree | 1 | 2 | 1 | 5 | 15 | 24 | |
| Total | 7 | 7 | 12 | 12 | 12 | 19 | |
Table 10.
Bivariate Correlation: Perception of Open-Book Accounting vs. Perception of Co-Location.
| Perception of Open-Book Accounting | Total | ||||||
| Strongly disagree | Disagree | Nor agree neither disagree | Agree | Strongly agree | |||
| Perception of Co-Location. | Strongly disagree | 0 | 2 | 0 | 0 | 0 | 2 |
| Disagree | 0 | 0 | 2 | 1 | 0 | 3 | |
| Nor agree neither disagree | 0 | 3 | 6 | 3 | 2 | 14 | |
| Agreeo | 0 | 2 | 6 | 11 | 6 | 25 | |
| Strongly agree | 3 | 0 | 0 | 5 | 10 | 18 | |
| Total | 7 | 3 | 7 | 14 | 20 | 18 | |
Table 11.
Bivariate Correlation: Perception of Open-Book Accounting vs. Fit of Lean IPD in the Organization.
Table 11.
Bivariate Correlation: Perception of Open-Book Accounting vs. Fit of Lean IPD in the Organization.
| Perception of Open-Book Accounting | Total | ||||||
| Strongly disagree | Disagree | Nor agree neither disagree | Agree | Strongly agree | |||
| Fit of Lean IPD in the Organization | Disagree | 1 | 2 | 3 | 1 | 1 | 8 |
| Nor agree neither disagree | 1 | 2 | 4 | 6 | 2 | 15 | |
| Agree | 0 | 2 | 5 | 9 | 4 | 20 | |
| Strongly agree | 1 | 1 | 2 | 4 | 11 | 19 | |
| Total | 7 | 3 | 7 | 14 | 20 | 18 | |
Table 12.
Bivariate Correlation: Disposition to Adopt Open-Book Accounting vs. General Perception of Lean IPD.
Table 12.
Bivariate Correlation: Disposition to Adopt Open-Book Accounting vs. General Perception of Lean IPD.
| Disposition to Adopt Open-Book Accounting | Total | ||||||
| Strongly disagree | Disagree | Nor agree neither disagree | Agree | Strongly agree | |||
| General Perception of Lean IPD. | Bad | 0 | 1 | 0 | 0 | 0 | 1 |
| Nor good nor bad | 2 | 1 | 3 | 0 | 2 | 8 | |
| Good | 4 | 6 | 7 | 4 | 4 | 25 | |
| Very good | 1 | 4 | 2 | 8 | 13 | 28 | |
| Total | 7 | 7 | 12 | 12 | 12 | 19 | |
Table 13.
Bivariate Correlation: Perception of Open-Book Accounting vs. General Perception of Lean IPD.
Table 13.
Bivariate Correlation: Perception of Open-Book Accounting vs. General Perception of Lean IPD.
| Perception of Open-Book Accounting | Total | ||||||
| Strongly disagree | Disagree | Nor agree neither disagree | Agree | Strongly agree | |||
| General Perception of Lean IPD | Bad | 0 | 0 | 1 | 0 | 0 | 1 |
| Nor good neither bad | 1 | 1 | 3 | 2 | 1 | 8 | |
| Good | 2 | 4 | 7 | 9 | 3 | 25 | |
| Very good | 0 | 2 | 3 | 9 | 14 | 28 | |
| Total | 7 | 3 | 7 | 14 | 20 | 18 | |
4. Discussion
The research yields several relevant results. First, design and construction are not critical issues for developers. Second, within the realm of design and construction, Lean Construction and IPD generate interest but do not reach the level of other megatrends such as sustainability, digitalization, or industrialized construction.
Regarding experience and training in Lean IPD, there is a low level of training in these areas but a high interest in expanding it. As for experience, it stands out that developers have more experience with collaborative contracts than with Lean techniques such as LPS, TVD, or VSM.
With respect to principles, those related to governance and team management, such as early stakeholder involvement, shared decision-making responsibility, intensive owner participation, or co-location, enjoy broad acceptance. In contrast, those related to economic management show greater disagreement. This is evidenced by the hierarchical cluster analysis, which divides the group into two: those who, in addition to agreeing with governance principles, also agree with economic management principles, and those who do not share the latter. This difference becomes even more pronounced when the question is asked in general versus when it is directed at the fit of Lean IPD within their specific organizations. In other words, the perception of Lean IPD is more favorable in general than when considered within their particular organizations, as demonstrated by the PLS-SEM models.
The study delves deeper into economic management through multivariable analysis, revealing correlations such as the link between the perception of Lean IPD and the perception of open-book accounting, the strong relationship between the perception of risk-reward compensation and open-book accounting, and the influence of company size on their disposition to adopt open-book accounting, among others.
Author Contributions
Conceptualization, J.G; Methodology, J.G.; Validation, M.S; Formal analysis, JG.; Investigation, J.G; Resources, J.G.; Data curation, J.G.; Writing—original draft preparation, J.G.; writing—review and editing, J.G.; Visualization, J.G.; Supervision, M.S.; Project administration, J.G.; Funding acquisition, J.G. All authors have read and agreed to the published version of the manuscript.
Funding
This research received no external funding.
Data Availability Statement
The data presented in this study are available upon reasonable request from the corresponding author.
Acknowledgments
The authors warmly appreciate the participation of the respondents in this study and thank the following organizations for helping diffuse the questionnaire: Asociación Española de Dirección Integrada de Proyecto (AEDIP); APCE-Catalunya; APPUNLE; APROVA; Clúster de la Edificación; FADECO Promotores; Federación de empresas de La Rioja; FECZA; Grado Inmobiliario ASPRIMA-UPM; IteC; PROVIA;.
Conflicts of Interest
The authors declare no conflicts of interest.
References
- Ibrahim, M.W.; Hanna, A.; Kievet, D. Quantitative comparison of project performance between project delivery systems. J. Manag. Eng. 2020, 36, 04020082. [Google Scholar] [CrossRef]
- Global Construction Disputes Report: Middle East—Don’t get left behind. (2016). Arcadis. https://www.arcadis.com/media/B/2/3/%7BB233AA1F-3A1A-4F85-B187-DEA56F67365F%7DFinal-2020-GCDR-Report-Spreads-Layout.pdf.
- Global Construction Disputes Report: Successfully navigating through turbulent times. (2022). Arcadis. https://www.arcadis.com/media/B/2/3/%7BB233AA1F-3A1A-4F85-B187-DEA56F67365F%7DFinal-2020-GCDR-Report-Spreads-Layout.pdf.
- Mischke, J. , Stokvis, K., Vermeltfoort, K., & Biermans, B. (2024). Delivering on construction productivity is no longer optional (p. 15). McKinsey & Company.
- Tijani, B.; Jin, X.-H.; Robert, O.-K. Impact of AEC project organizational design on the mental health of project management practitioners (PMPs) in Australia. Int. J. Build. Pathol. Adapt. ahead-of-p. 2024. [Google Scholar] [CrossRef]
- Koskela, L. , & Huovila, P. (1998). Contribution of the Principles of Lean Construction to meet the Challenges of Sustainable Development. Proceedings IGLC ’98. IGLC, Guarujá, Brazil.
- Moradi, S.; Sormunen, P. Integrating lean construction with BIM and sustainability: a comparative study of challenges, enablers, techniques, and benefits. Constr. Innov. 2023, 24, 188–203. [Google Scholar] [CrossRef]
- De Carvalho, A.C.V.; Granja, A.D.; Da Silva, V.G. A Systematic Literature Review on Integrative Lean and Sustainability Synergies over a Building’s Lifecycle. Sustainability 2017, 9, 1156. [Google Scholar] [CrossRef]
- Ilozor, B.D.; Kelly, D.J. Building Information Modeling and Integrated Project Delivery in the Commercial Construction Industry: A Conceptual Study. 2012; 2, 23–36. [Google Scholar] [CrossRef]
- Cheng, R. (2016). Teams matter: Lessons from ARRA. University of Minnesota.
- Cheng, R. (2012). IPD Case Studies. AIA & Minnesota School of Architecture.
- Ghassemi, R.; Becerik-Gerber, B. Transitioning to Integrated Project Delivery: Potential barriers and lessons learned. Lean Constr. J. 2011, 32–52. [Google Scholar] [CrossRef]
- Kent, D.C.; Becerik-Gerber, B. Understanding construction industry experience and attitudes toward integrated project delivery. J. Constr. Eng. Manag. 2010, 136, 815–825. [Google Scholar] [CrossRef]
- Bhonde, D. , Zadeh, P., & Staub-French, S. (2020). Owners’ Perceived Barriers to Adoption of IPD in Canada. Integrated Project Delivery Alliance. https://www.ipda.ca/site/assets/files/3071/barriers_to_ipd_july_2020.pdf.
- Jobidon, G., Lemieux, P., & Beauregard, R. (2018). Implementation of Integrated project delivery in quebec's procurement for public infrastructure: A comparative and relational perspective. Sustainability, 10(8). [CrossRef]
- Ebrahimi, G.; Dowlatabadi, H. Perceived Challenges in Implementing Integrated Project Delivery (IPD): Insights from Stakeholders in the U.S. and Canada for a Path Forward. Int. J. Constr. Educ. Res. 2018, 15, 291–314. [Google Scholar] [CrossRef]
- Li, S.; Ma, Q. Barriers and Challenges to Implement Integrated Project Delivery in China. 341-348.
- Mei, T.; Wang, Q.; Xiao, Y.; Yang, M. Rent-seeking behavior of BIM- and IPD-based construction project in China. Eng. Constr. Arch. Manag. 2017, 24, 514–536. [Google Scholar] [CrossRef]
- Weinmann, M.; Baier, C.; Miguel, A.S.; Haghsheno, S. Structuring Approach and Current Status of Integrated Project Delivery (IPD) in Germany. 143-154.
- Attouri, E.; Mossman, A.; Fehlmann, L.; Heptinstall, I.; Ducoulombier, L. IPD en France: Is It Legal. 297-308.
- Aslesen, A.R.; Nordheim, R.; Varegg, B.; Lædre, O. IPD in Norway. 326-336.
- Simonsen, S.H.F.; Skoglund, M.H.; Engebø, A.; Varegg, B.E.; Lædre, O. Effects of IPD in Norway – A Case Study of the Tønsberg Project. 251-262.
- Forero, S. , Vargas, H., & Garcia, C. (s. f.). A Deeper Look Into the Perception and Disposition to Integrated Project Delivery (IPD) In Colombia.
- Erazo, A.; Guzman, G.; Espinoza, S. Applying BIM Tools in IPD Project in Peru. 973-984.
- AbouDargham, S.; Bou Hatoum, M.; Tohme, M.; Hamzeh, F. Implementation of integrated project delivery in Lebanon: Overcoming the challenges. In Proceedings of the 27th Annual Conference of the International, Group for Lean Construction, Dublin, Ireland, 1–9 July 2019; pp. 917–928. [Google Scholar] [CrossRef]
- Korb, S. , Haronian, E., Sacks, R., Judez, P., & Shaked, O. (2016). Overcoming «But we’re different»: An IPD implmentation in the middle east. 10.
- Fischer, M. , Khanzode, A., Reed, D. P., & Ashcraft, H. W. (2017). Integrating project delivery. Wiley.
- Allison, M. , Ashcraft, H. W., Cheng, R., Klawans, S., & Pease, J. (2018). Integrated Project Delivery—An Action Guide for Leaders.
- Collaborative Construction Procurement and Improved Value; Wiley: Hoboken, NJ, United States, 2019.
- Spain Real Estate Investment Volumes Q2 2024. (2024). CBRE. https://img06.en25.com/Web/CBRERealEstateSA/%7Bb3ee677f-7d33-4434-9d78-0e47c9b2218a%7D_Figures_Investment_Spain-_Q2_2024_ES.pdf.
- Hauke, J.; Kossowski, T. Comparison of Values of Pearson's and Spearman's Correlation Coefficients on the Same Sets of Data. Quaest. Geogr. 2011, 30, 87–93. [Google Scholar] [CrossRef]
- Fernández Martín, D. (2004). La Promoción inmobiliaria: Aspectos prácticos. Cie Dossat 2000.
- Júdez, P. (2023, enero 30). Contrato Leonardo IPD_v1.4.1.
- Liker, J. K. (2013). Toyota way: 14 management principles from the world’s greatest manufacturer (First edition). McGraw-Hill Education.
- Gil Sebastián, J.J.; Severino, M.J.S. Percepción de las empresas de Dirección Integrada de Proyecto sobre la implantación de Lean IPD en España. ACE 2024, 18. [Google Scholar] [CrossRef]
- Ashcraft, H. W. (2011). IPD Teams: Creation, Organization and Management. 30.
- Caglio, A. To Disclose or Not to Disclose? An Investigation of the Antecedents and Effects of Open Book Accounting. Eur. Account. Rev. 2016, 27, 263–287. [Google Scholar] [CrossRef]
- Kajüter, P.; Kulmala, H.I. Open-book accounting in networks. Manag. Account. Res. 2005, 16, 179–204. [Google Scholar] [CrossRef]
- Rodrigues, M.R.; Lindhard, S.M. Benefits and challenges to applying IPD: experiences from a Norwegian mega-project. Constr. Innov. 2021, 23, 287–305. [Google Scholar] [CrossRef]
- Lahdenperae, P. (2012). Making sense of the multi-party contractual arrangements of project partnering, project alliancing and integrated project delivery. Construction Management & Economics, 30(1–3), 57–79. [CrossRef]
- Tsai, J.-S.; Chi, C.S.F. Learning for Win-Win Collaboration. J. Constr. Eng. Manag. 2015, 141. [Google Scholar] [CrossRef]
- Miller, J.B. Principles of Public and Private Infrastructure Delivery; Springer Nature: Dordrecht, GX, Netherlands, 2000. [Google Scholar]
- Francés, F. (2024). Cuando las Catedrales eran Blancas las obras eran transparentes [Universitat Politècnica de València]. http://polipapers.upv.es/index.php/IA/article/view/3293.
- Touran, A.; Gransberg, D.D.; Molenaar, K.R.; Ghavamifar, K.; Mason, D.J.; Fithian, L.A. Transportation Research Board; Transit Cooperative Research Program A Guidebook for the Evaluation of Project Delivery Methods; The National Academies Press: Washington, DC, United States, 2009. [Google Scholar]
- Konchar, M.; Sanvido, V. Comparison of U.S. project delivery systems. J. Constr. Eng. Manag. 1998, 124, 435–444. [Google Scholar] [CrossRef]
- Cabanillas Sánchez, A. (2000). La responsabilidad civil por vicios en la construcción en la Ley de Ordenación de la Edificación. Anuario de derecho civil, 53(2), 405-510.
- Ley 38/1999, de 5 de noviembre, de Ordenación de la Edificación., 38, BOE-A-1999-21567 21 (1999).
- Humero Martín, A. E. (with Sierra Pérez, I.). (2022). Arquitectura legal y valoraciones inmobiliarias (6a ed). Dykinson.
- lvarez Pérez, M. Á. , Soler Severino, M., & Pellicer, E. (2017). Los Métodos Colaborativos (Integrated Project Delivery), una Metodología Lean Construction que mejora el Proceso Constructivo.
- Monteiro, J. , & Diezel, J. (2018). Small big BIM Diffusion of BIM technology in small architecture offices. Chalmers University of Technology.
- The Next Normal in Construction: How disruption is reshaping the world’s largest ecosystem. (2020). McKinsey & Company. https://www.mckinsey.com/~/media/mckinsey/business%20functions/operations/our%20insights/the%20next%20normal%20in%20construction/the-next-normal-in-construction.pdf?
- Brusco, M.J.; Steinley, D.; Cradit, J.D.; Singh, R. Emergent clustering methods for empirical OM research. J. Oper. Manag. 2012, 30, 454–466. [Google Scholar] [CrossRef]
- Johnson, D. E. (1998). Applied multivariate methods for data analysts. Duxbury Press.
- Michalopoulou, C.; Symeonaki, M. Improving Likert Scale Raw Scores Interpretability with K-means Clustering. Bms-Bulletin Sociol. Methodol. De Methodol. Sociol. 2017, 135, 101–109. [Google Scholar] [CrossRef]
- MacQueen, J. (1967). Some methods for classification and analysis of multivariate observations. En Proceedings of the Fifth Berkeley Symposium on Mathematical Statistics and Probability, Volume 1: Statistics: Vol. 5.1 (pp. 281-298). University of California Press. https://projecteuclid.org/ebooks/berkeley-symposium-on-mathematical-statistics-and-probability/Proceedings-of-the-Fifth-Berkeley-Symposium-on-Mathematical-Statistics-and/chapter/Some-methods-for-classification-and-analysis-of-multivariate-observations/bsmsp/1200512992.
- Marsh, H.W.; Hau, K.T.; Balla, J.R.; Grayson, D. Is More Ever Too Much? The Number of Indicators per Factor in Confirmatory Factor Analysis. Multivar. Behav. Res. 1998, 33, 181–220. [Google Scholar] [CrossRef] [PubMed]
- Richter, N.F.; Cepeda, G.; Roldán, J.L.; Ringle, C.M. European management research using Partial Least Squares Structural Equation Modeling (PLS-SEM). Eur. Manag. J. 2015, 33, 1–3. [Google Scholar] [CrossRef]
- Hair, F.J.; Sarstedt, M.; Hopkins, L.; G. Kuppelwieser, V. Partial Least Squares Structural Equation Modeling (PLS-SEM): An emerging tool in business research. Eur. Bus. Rev. 2014, 26, 106–121. [Google Scholar] [CrossRef]
- Daniel Peña, & Romo, J. (1997). Introduccion a la Estadistica para las Ciencias Sociales. McGraw-Hill.
Disclaimer/Publisher’s Note: The statements, opinions and data contained in all publications are solely those of the individual author(s) and contributor(s) and not of MDPI and/or the editor(s). MDPI and/or the editor(s) disclaim responsibility for any injury to people or property resulting from any ideas, methods, instructions or products referred to in the content. |
© 2024 by the authors. Licensee MDPI, Basel, Switzerland. This article is an open access article distributed under the terms and conditions of the Creative Commons Attribution (CC BY) license (https://creativecommons.org/licenses/by/4.0/).
Copyright: This open access article is published under a Creative Commons CC BY 4.0 license, which permit the free download, distribution, and reuse, provided that the author and preprint are cited in any reuse.


