
Submitted:
03 December 2024
Posted:
04 December 2024
You are already at the latest version
Abstract
CD19 and CXCR4 are pivotal regulators of B cell activation and migration, respectively. Specifically, CXCR4 signaling critically influences the dissemination of various malignant B cells through constitutive activation and aberrant expression. This study explores the interaction between CD19 and CXCR4 signaling in the context of B-cell lymphomas, particularly focusing on diffuse large B-cell lymphoma (DLBCL) and Waldenström Macroglobulinemia (WM). We assessed the roles of CD19 in survival and CXCL12-induced migration by using knock-out (KO) cells of DLBCL and WM origin, alongside evaluating the impact of CD19 monoclonal antibodies (mAbs) on antibody-dependent cell-mediated cytotoxicity (ADCC). Our results highlight that CD19 is important for survival and CXCL12-induced migration, and mAbs variably increase CXCL12-induced migration and enhance ADCC. Additionally, we demonstrate that the endogenous peptide inhibitor of CXCR4 (EPI-X4) derivative JM#21 effectively inhibits CD19-mediated migration enhancement and promotes ADCC, thereby augmenting the therapeutic efficacy of CD19 mAb-based immunotherapy in lymphoma models. Our study underscores the potential of targeting both CD19 and CXCR4 to refine therapeutic strategies for treating B-cell malignancies, suggesting a synergistic approach could improve clinical outcomes in WM treatment.
Keywords:
B cell lymphoma
; Waldenströms Macroglobulinemia (WM)
; CD19
; monoclonal antibody (mAb)
; CXCR4
1. Introduction
CD19, an integral member of the immunoglobulin superfamily, serves as a coreceptor together with the B cell antigen receptor (BCR). As a B lineage-specific marker, CD19 is expressed throughout the lifecycle of B cells, including in most B cell lymphomas. While B BCR signaling controls B cell development and maturation, CD19 generates co-stimulatory activation signals that prevents from antibody deficiencies or hypogammaglobulinemia [1,2]. As a critical component of the BCR signal amplifier, CD19 uniquely lacks a natural ligand. However, its cytoplasmic tail contains multiple phosphorylation sites that are crucial for docking of various adapter proteins and kinases, such as Lyn, ERK, and PI3K, upon BCR stimulation. These structural features enable CD19 to act a hub for signal integration and amplification of downstream cascades essential for B cell activation and function [3,4]. Upon antigen engagement of BCR, CD19 coordinates PI3K signaling pathway which in turn regulates the cellular metabolism, redox balance and survival fitness of the activated B cells[5]. Consequently, nearly 98% of malignant B cells retain CD19 expression on their surface, underscoring its value as a promising target for immunotherapy. Currently, CD19 targeted immunotherapy is an alternative to classical chemoimmunotherapy regimen that combines cytolytic anti-CD20 antibody rituximab with cyclophosphamide, doxorubicin, vincristine, and prednisone (R-CHOP) [6,7].
CD19-targeted immunotherapy has significantly improved the treatment options for various B-cell malignancies, spanning aggressive Diffuse Large B-cell Lymphoma (DLBCL) to more indolent Waldenström Macroglobulinemia (WM). Particularly, those cases that are non-responsive, refractory, or have relapsed (R/R) from the R-CHOP regimen, accounting for approximately 40%, benefit from anti-CD19 based therapeutics [8]. Therapeutic approaches range from humanized Fc-modified monoclonal antibodies (mAbs) to antibody-drug conjugates and CAR-T cells [9]. Engineered anti-CD19 monoclonal antibodies (CD19 mAbs) with enhanced cytolytic activity are commonly used as B cell–depleting therapies for treating R/R cases of different B cell lymphomas as well as autoimmune diseases[10,11]. These functionalized mAbs recruit phagocytes like Natural Killer (NK) cells or Macrophages (Mφ). As a result, treatment efficacy of CD19 mAbs largely depend on the number of recirculating immune cells, tumor-invading effector cells and their activation states. Thus, lack of infiltrating effector cells impairs targeting of tissue-resident malignant B cells and in many instances leading to unexpected development of escape mechanisms such as loss of CD19 from the cell surface [12,13].
Frequently, most B cell non-Hodgkin lymphomas including DLBCL are characterized by dissemination already at diagnosis. Dissemination of malignant B cells involves chemokine receptor responsiveness, cytoskeletal remodeling, and migration, all those are critically regulated by BCR and CD19 signaling[14]. Among the chemokine receptors, the C-X-C chemokine receptor type 4 (CXCR4) is notably prominent in many B cell lymphomas[15]. CXCR4 is a key receptor that binds to the chemokine CXCL12 (also known as stromal cell-derived factor 1, SDF-1), playing a crucial role in the homing and retention of hematopoietic stem cells within the bone marrow. This signaling pathway has gained particular importance due to its aberrant upregulation upon treatment with common BCR signaling inhibitors that target PI3K, BTK, and SYK kinases[16-18]. The upregulation of CXCR4 contributes to the increased migratory and invasive capabilities of lymphoma cells, facilitating their spread and complicating treatment. Additionally, dysregulated CXCR4 expression and a C-terminally truncated constitutive active CXCR4 mutant are major prognostic biomarker for the relatively indolent lymphomas such as germinal center B cell type (GCB)-DLBCL and lymphoplasmacytic lymphoma (LPL) or WM[15,19,20], respectively.
We have shown that CXCR4 signaling is activated by BCR cascade and CD19 signaling module in mouse models [21,22]. Thus, activation of the CD19 module by the CD19 mAbs, could cause enhanced BCR and CXCR4 signaling impacting growth and migration in malignant B cells. This effect could be more aggravated when there are inadequate number of recirculating effector cells or CD19 mAbs fail to recruit cytolytic Natural Killer (NK) cells and induce antibody-dependent cell-mediated cytotoxicity (ADCC). Coherent to our hypothesis, a recently developed nondepleting CD19 mAb LY3541860 which readily inhibits B cell activation, proliferation and differentiation independent of NK cell recruitment, demonstrates improved efficacy over B cell depletion therapy in autoimmune disease models[23]. Presumably, the nondepleting and inhibitory CD19 mAb impairs CD19-CXCR4 signaling crosstalk even in the lack of tumor-invading effector cells and prevents further dissemination of malignant B cells. However, the role of CD19 in promoting CXCL12 induced migration and survival of lymphoma cells largely remained undetermined.
To investigate this, we studied the role of CD19 and effect of CD19 mAbs on CXCR4 signaling in GCB-DLBCL and WM models using SU-DHL-6 (hereafter called DHL6) and BCWM.1 cell lines, respectively. Moreover, we test the differences of anti-CD19 mAb clonotypes causing CXCR4 stimulation and their cytolytic abilities by testing the effect on migration and efficacy in ADCC, respectively. We showed that CD19 signaling is required for CXCL12 induced migration and survival of lymphoma cells. Next, we utilizeed CXCR4 peptide antagonists to impair CD19-CXCR4 crosstalk. Altogether our data shows that a selective CXCR4 peptide antagonist improves on CD19 mAb for targeted immunotherapy against DLBCL and WM.
2. Results
2.1. Generation and Characterization of CD19 Knock-Out Lymphoma Cell Lines
To test our hypothesis that CD19 is important for CXCR4 signaling and overall survival of WM cells, we generated CD19 knock-out (KO) BCWM.1 cells by CRISPR-Cas9 methods (Figure S1). In parallel, we also generated IgM KO BCWM.1 cells to investigate the influence of BCR on the survival of these cells. We adopted a two-step strategy that supports CRISPR-Cas9 engineering both through lentivirus (BSL2) and murine ecotropic γ-retrovirus (BSL1) based delivery of the targeting sgRNA (see methods). Supporting our hypothesis, cells transduced with the CD19 targeting sgRNA accompanying a GFP reporter were outcompeted by the untransduced cells and lost from the mixture between 7-15 days post transfection and prior to single cell sorting (Figure S1A). We, therefore first sorted all GFP positive transduced cells in bulk, grow them for few days and then sorted as single cell for generating clones. The average numbers of growing clones were significantly lower for CD19 KO cells compared to WT cells (Figure S1B). In case of IgM KO, the effect was even stronger (Figure S1B). Upon collecting the growing CD19 KO BCWM.1 clones, we first confirmed the loss of CD19 expression in these cells by flow cytometry (Figure S1C) and determined the mutation in the CD19 locus by sequencing (Figure S1D). Compared to WT BCWM.1 cells, CD19 KO cells did not show any differences in the surface expression of IgM-BCR and CXCR4 (Figure S1E) as well as in IgM secretion (Figure S1F), suggesting no autoregulation and compromised receptor expressions in this model. Following the same method, we also generated CD19 KO of GCB-DLBCL derived DHL6 cells and characterized them (Figure S1G-H).
2.2. CD19 Is Required for Growth and CXCL12 Induced Migration of Lymphoma Cells
To investigate the survival competence of CD19 KO BCWM.1 cells in competition with the WT cells, we cocultured them at 1:1 ratio and measured cell growth by counting of the cell number by flow cytometry (Figure S1I). Expectedly, the CD19 KO clones were slow growing and were ~40% lost (surviving fractions on day2-4: 75.5±16.9; 60.1±18.3 and 62.8±15.9) in competition to WT counterpart within 3-4 days of coculturing (Figure 1A). IgM KO cells, on the other hand, were more rapidly declined to <60% (day2-4: 52.1±14.9; 55.5±6.7; 56.3±6.5) within 2 days (Figure 1A), indicative to the stronger BCR signaling dependence of lymphoma cells. Overall, this data suggests that both CD19 and IgM play crucial role in survival and overall growth of BCWM.1 cells.
Next, we assessed the colony forming ability of these cells by culturing them in methylcellulose-based matrix and monitored the colony formation (Figure 1B-C). Compared to WT BCWM.1 cells, CD19 KO clones were grown significantly slower and produced smaller sized colonies (Figure 1B). While the number of colonies produced by the CD19 KO clones (mean±SD, 100±32) was unchanged compared to WT (103±29), significantly reduced numbers of colonies were produced by the IgM KO (59±22) BCWM.1 clones (Figure 1C). This suggests a specific role of CD19 in cell proliferation and growth. In contrast, IgM KO cells failed to begin the colony formation due to severe survival disadvantage and produced significantly reduced numbers of colonies (Figure 1C). Like WM, the loss of CD19 in GCB-DLBCL derived DHL6 cells also caused reduced colony size without changes in the number of colonies (Figure 1D-E). Notably, we failed to generate IgM KO DHL6 cells suggesting an indispensable role of BCR signaling for survival of DLBCL cells [12,24]. Intriguingly, the CD19 KO colonies appeared condensed compared to WT colonies for both cell types, most prominently for DHL6 cells, suggesting a role of CD19 in intra-colony cell mobilization, spreading and subsequent growth of colony size.
We, therefore performed live cell imaging to monitor colony formation and spreading of BCWM.1 cells over time (Figure 1F). Like CFC assay we plated CD19 KO BCWM.1 cells and empty vector (EV) transduced GFP positive control cells in methylcellulose-based matrix and monitored the cell growth every 24 hours by real-time imaging (see method). Between 6-8 days, the colonies became visible and spread around the proliferation center. As depicted in Figure 1F, CD19 KO BCWM.1 cells failed to grow and spread resulting in smaller sized and condensed colonies compared EV transduced cells.
Next, we analyzed the CXCR4 response in CD19 KO cells by testing CXCL12 induced migration. Both BCWM.1 and DHL6 failed to migrate in response to CXCL12 upon loss of CD19 (Figure 1G-H). IgM KO BCWM.1 cells, on the other hand, exhibited only partial reduction in CXCL12 induced migration suggesting differential role of CD19 and BCR on CXCR4 signaling (Figure 1G). Notably, the rate of specific migration by WT DHL6 cells (no cytokine control, 3.3±1.5%; 60nM CXCL12, 9.7±1.5%) was much lower than BCWM.1 cells (no cytokine control, 2.4±2.0%; 60nM CXCL12, 19±8%) and below 10% which could not be improved by increasing the incubation period or dose of CXCL12 in the migration assay (Figure 1H). This is in line with the general CXCR4 non-responsiveness of the DLBCL cells[25]. Together, these data suggest a specific role of CD19 in cell growth, colony spreading and CXCL12 induced migration.
2.3. CD19 mAbs Increase Survival and CXCL12 Induced Migration of WM Cells
Knowing the essential role of CD19 in survival and CXCL12 induced migration of both BCWM.1 and DHL6 lymphoma cells, we tested whether treatment with anti-CD19 monoclonal antibodies (mAb) have any effect on these cells. To this end, we generated a humanized anti-CD19 monoclonal antibody (mAbo) by cloning the variable sequences from an anti-CD19 hybridoma, and we compared its effects with those of commercially available humanized anti-CD19 mAbs (mAb1 and mAb2) used in therapeutic and preclinical studies (see Methods). Notably, most therapeutic and preclinical mAbs from commercial sources are available only in limited quantities for research use, with minimal information and no options for experimental modification. Therefore, we sought to produce mAbo in HEK293T cells and purified it using HiTrap Protein G affinity chromatography (Figure S2A-C). Upon determining the amount and purity by SDS-PAGE and ELISA (Figure S2B-C), we tested the binding specificity of mAbo on human peripheral B cells and BCWM.1 cells compared to non-B cells and CD19 KO BCWM.1 cells, respectively (Figure S2D). In both cases, mAbo specifically detected CD19 positive B cells.
Next, we performed migration assays on BCWM.1 cells in the presence of mAbo. As depicted in Figure 2A, mAbo treatment significantly enhanced the migration of these cells towards CXCL12, suggesting a role for activated CD19 signaling crosstalk with CXCR4 signaling. As controls, we used two other commercial humanized CD19 clones, mAb1 and mAb2. The mAb1 clone effectively increased CXCL12-induced migration similar to our mAbo. In contrast, the mAb2 clone minimally affected the migration, suggesting differential activation responses through CD19 antibody clones (Figure 2A). Additionally, we tested the Fc silent (FcS) mutant versions of all these humanized mAbs to avoid aberrant Fc receptor (FcR) mediated recruitment. In all cases, the FcS versions behaved similarly to the unmutated mAbs, thereby eliminating interference through FcR on the B cell surface. When tested on CD19 KO BCWM.1 cells, none of these mAbs altered CXCL12-induced migration (Figure S2E). In parallel to migration, we assessed the effect of mAbo on colony formation (Figure 2B-D). While DHL6 colony sizes significantly increased upon the addition of mAbo (Figure 2B), BCWM.1 colonies only exhibited a trend toward increase after 10 days (Figure 2C). Therefore, we replated the colonies to allow them to grow on a new surface, where BCWM.1 colonies were found to significantly increase in size in response to mAbo treatment (Figure 2C-D). Notably, mAbo treatment did not affect the number of colonies, suggesting no impact on colony seeding or initiation. Instead, it led to enhanced proliferation and spreading, resulting in larger colonies.
As shown in Figure 1H, DHL6 cells exhibited minimal migration in response to CXCL12. We, therefore, analyzed the CXCR4 and BCR proximal phosphorylation signaling using an intracellular phospho-flow cytometry assay (Figure 2E-F and Figure S2F). To optimize assay conditions, we tested phosphorylation signals for pCD79a (Y182), pERK (T202, Y204), pAKT (S473) and pPLC-γ2 (Y759) in DHL6 cells following anti-IgM or CXCL12 treatment for 5 and 10 minutes (Figure S2F). While BCR stimulation with anti-IgM readily increased phosphorylation of all tested markers, CXCL12 treatment selectively induced pAKT and pPLC-γ2 in DHL6 cells (Figure 2E and Figure S2F). Notably, DHL6 cells were only minimally responsive to CXCL12 induced migration as compared to BCWM.1 (Figure 1G-H). Interestingly, the combination of mAbo and CXCL12 treatments resulted in a greater increase in pPLC-γ2 and pCD79a, suggesting a synergistic CXCR4 signal amplification through CD19. Similar results were observed for BCWM.1 cells (Figure 2F). In contrast to DHL6 cells, CXCL12 treatment alone induced phosphorylation of all tested markers in BCWM.1 cells [26], reaching levels comparable to those induced by anti-IgM treatment. This suggests differential effects of BCR and CXCR4 signaling between WM and DLBCL.
2.4. Variable Efficiencies of CD19 mAbs in Inducing ADCC
The clinical success of anti-CD19 mAbs relies on B cell–depleting cytolytic activity, specifically through antibody dependent cell mediated cytotoxicity (ADCC) in presence of activated natural killer (NK) cells[27]. We therefore evaluated the efficacy of the CD19 mAbs in ADCC in presence of IL-2 stimulated NK cells isolated from the human peripheral blood (Figure 3 and Figure S3). We optimized a FACS based quantitative analysis to determine the absolute live cell count and distinguish cell types based on endogenous markers post ADCC assay (Figure S3A-E)). Briefly, cell numbers were normalized to the number of live lymphoma cells obtained from the 4 hours control experimental ADCC coculture of lymphoma and rhIL-2 activated NK cells without any mAb (no mAb) addition (Figure S3C). Expectedly, we found that ADCC in presence mAbo reduced the WT BCWM.1 cells to 68.9±7.2% in comparison to no mAb control 100.4±9.4% (Figure 3A and Figure S3C,E)). Similarly, live IgM KO BCWM cells were reduced from 108.7±14.6% in no mAb control to 81.6±7.8% due to mAbo induced ADCC. In contrast CD19 KO cells remained unaffected by mAbo induced ADCC in presence of activated NK cells. Similarly, the mAboFcS treatment failed to kill any of the WT and KO BCWM.1 cells due to lack of NK cell engagement through FcR (Figure 3A and Figure S3C,D). Interestingly, normalized percentage of living WT and IgM KO BCWM.1 cells treated with mAboFcS were increased to 143.6±17% and 142.8±15.4%, respectively. This result supports our hypothesis that the failure to ligate a cytotoxic NK could potentially increase survival of lymphoma cells in presence of CD19 mAbs. Notably, the absolute lymphoma cell counts decreases for all BCWM.1 and DHL6 cell types in presence of activated NK cells in 4 hours control experimental ADCC coculture without any mAb (Figure S3B,C,F). This systemic loss of cell survival under control experimental ADCC coculture is prevented by the addition mAboFcS treatments (Figure 3A and Figure S3F).
Similar ADCC responses against different BCWM.1 cell types were seen for other two clonotypes of CD19 antibodies mAb1 and mAb2, and their corresponding FcS forms mAb1FcS and mAb2FcS (Figure 3B-C). While mAb1 clone reduced the WT BCWM.1 cells to 75.8±7% only, mAb2 treatment reduced to 54.8±8.3% survival, suggesting a variable response to different mAb clonotypes. Similarly, mAb1 and mAb2 induced ADCC reduced the IgM KO cells to 87.5±6.2% and 44.3±11.4% (Figure 3B-C), respectively. As control, there were no effect of these clonotypes on CD19 KO cells. Interestingly, both mAb1FcS and mAb2FcS caused significant increase in survival of WT BCWM.1 cells up to 138.9±5.8% and 142.5±14.2% (Figure 3B-C), respectively. Unlike WT and IgM KO cells, there were no increase in survival of CD19 KO BCWM.1 cells upon mAb1FcS or mAb2FcS treatment, demonstrating the role of activated CD19 signaling in survival advantage.
For DHL6 cells, all three different CD19 mAb clones showed relatively higher ADCC efficacy compared to BCWM.1 cells (Figure 3D-F). The parentages of WT DHL6 survived in ADCC upon mAbo, mAb1 and mAb2 treatments were 49±25.4, 37.4±7.4 and 25.8±4.5, respectively. In contrast to the effects on BCWM.1 cell types, all three clonotypes in their FcS forms failed to cause any survival advantage of DHL6 cells compared to no mAb treatment (Figure 3D-F and Figure S3F). In other words, reverting the systemic loss of cell survival under control experimental ADCC coculture were ineffective for DHL6 cells.
To improve on the efficacy of our mAbo clonotype in ADCC, we aimed generating mutant with enhanced FcR binding, as described before [28,29]. To this end, we introduced two point-mutations at IgG1 CH2 domain, namely S239D and I332E resulting in mAbo Fc enhanced (mAboFcE) version. We repeated the ADCC assay on BCWM.1 and DHL6 cells with this mAboFcE and compared to original unmutated mAbo treatment (Figure 3G-H). Expectedly, the mAboFcE treatment enhanced ADCC and drastically reduced survival of WT BCWM.1 cells to 36±3.8% compared to 60.4±8.2% survival upon non-modified mAbo treatment (Figure 3G). Similarly, survival of WT DHL6 cells were reduced to 26.3±8.4% by mAboFcE treatment compared to 40.2±6.7% upon non-modified mAbo treatment (Figure 3H). As control, there were no effect of mAboFcE on any CD19 KO cell types. Altogether, these data show differential effects of CD19 mAb clonotypes on ADCC response against lymphoma cells, with highest efficacy caused by mAb2 clonotype against both WM and DLBCL. The clonotype specific variations were more pronounced for BCWM.1 as compared to DHL6 cells, which is indicative to their relative CXCR4 signaling dependency (Figure 2A). Furthermore, by creating enhanced FcR binding mutant mAboFcE, we could improve on our in-house generated ant-CD19 antibody and attain the similar efficacy as mAb2 clonotype (Figure 3C and G).
2.5. CXCR4 Antagonizing Peptide Enhances CD19 mAbs Induced ADCC
To down-modulate the CD19 mAb-induced activation of CXCR4 response, we then explored the synergistic potential of CXCR4 inhibition to improve the mAb induced ADCC. The endogenous peptide inhibitor of CXCR4 (EPI-X4) specifically antagonizes CXCR4 and is therefore a promising candidate for drug development for the treatment of CXCR4-dependent diseases [30]. Optimized EPI-X4 derivatives reduced tumor burden in different cancer models, and specifically the survival of WM cell line in immunocompromised mouse recipient [26,31,32]. We here tested the original EPI-X4, and an optimized version named EPI-X4 JM#21 (hereon referred to as JM#21), which showed 1000-fold increased antagonistic activity compared to the wildtype peptide[32]. In addition, we included the small molecule CXCR4 antagonist AMD3100 (Plerixafor), which is clinically approved for autologous stem cell transplantation[33]. Previously, both EPI-X4 and JM#21 treatments were shown to inhibit basal survival signaling pathways by reducing ERK and AKT phosphorylation, and subsequent loss of survival and apoptosis in WM cells [26]. Therefore, we first tested the dose response of EPI-X4 and JM#21 for 4 hours of treatment as described for ADCC assay and measured the cell survival after 12-18 hours post removal of inhibitors (Figure S4A). The calculated IC50 for EPI-X4 and JM#21 treatments were 21.3 and 5.1µM, respectively. Then we tested the inhibitory effect of same concentrations of EPI-X4 and JM#21peptides on CXCL12 induced migration of BCWM.1 cells (Figure S4B). While >50µM of EPI-X4 peptide was required to significantly reduce the CXCL12 induced migration to 13±1.3%, only 20µM of JM#21 reduced to 10±2.7% compared to PBS treatment resulting 19.3±0.7% migration. Of note, 10µM JM#21 and AMD3100 and 200µM of EPI-X4 was found to be effective for suppressing the CXCL12 induced migration of BCWM.1 cells overexpressing CXCR4 isoform 1, which caused unusual increase in specific migration up to 80% [26]. Since we were intended to prevent the CXCR4 activation in wildtype BCWM.1 cells expressing endogenous CXCR4, we therefore used 20µM of JM#21 in mAbo induced ADCC and equivalent concentrations of EPI-X4 and AMD3100 (Figure S4C). While both JM#21 and EPI-X4 treatments improved the mAbo induced ADCC and reduced survival of BCWM.1 significantly compared no inhibitor control, AMD3100 treatment caused no significant difference (Figure S4C, upper panels). In contrast, all three CXCR4 antagonists caused no significant decrease in survival of DHL6 cells in mAbo induced ADCC assays (Figure S4C, bottom panels). As control, we also performed mock ADCC coculture experiment with mAboFcS in presence and absence of CXCR4 antagonists. As shown before, mAboFcS treatment did not cause any ADCC alone and survival loss, instead increased the cell survival due to activation of CD19 signaling in absence of NK ligation (Figure S4C and Figure 3A-C). However, in presence of all of the CXCR4 antagonists used, survival of mAboFcS treated BCWM.1 cells were significantly decreased (Figure S4C). And as shown before, DHL6 cells did not have any survival advantage upon mAboFcS treatment in ADCC assay (Figure S4C and Figure 3D-F). Despite no added survival advantage, all CXCR4 antagonists except EPI-X4 caused significant decrease in survival in mock ADCC assay in presence of mAboFcS. These results demonstrate the differential effect of CXCR4 antagonists on CD19 mediated activation signal in lymphoma cells and warrants further improvement of combinatorial efficacy in CD19 mAb induced ADCC and enhanced migration. In particular, the peptide antagonist JM#21 effectively enhanced the mAbo induced ADCC in both BCWM.1 and DHL6 cells, as well as prevented the enhanced survival caused by mAboFcS due to lack of NK cell ligation.
To this end, we tested the effect of JM#21 on the mAboFcE induced ADCC on BCWM.1 and DHL6 cells and compared to mAbo treatment (Figure 4A). Addition of 20µM JM#21 significantly enhanced the efficacy of mAboFcE causing decreases in survival of BCWM.1 cells to 15.2±2.8% from no inhibitor control 36.1±3.8% (Figure 4A). In contrast the survival in mAbo induced ADCC was only decreased to 30.9±4.1% from 40.7±5.9%. The survival of DHL6 cells in ADCC assays with mAbo and mAboFcE in presence and absence of 20µM JM#21 were reduced to 47.7±3.3% from control 56.5±2.7% and 24.2±2.3% from 35.2±4.3%, respectively. This result demonstrates the combinatorial efficacy of JM#21 and Fc engineered CD19 mAb that surpasses the individual single treatments. Next, we tested whether JM#21 prevents the CD19 mAb induced enhancement of CXCL12 induced migration (Figure 4B). As shown before mAbo treatment increased the CXCL12 induced migration of BCWM.1 cells (Figure 2A). This increased migration was inhibited by JM#21 in a dose dependent manner significantly at doses >10µM (Figure 4B). Similarly, the enhanced CXCL12 induced migration caused by mAboFcE treatment were significantly blocked by JM#21 doses >20µM. In parallel, we also tested the efficacy of EPI-X4 to prevent the mAbo and mAboFcE induced increase in migration (Figure S4D). While a minimum of 50µM EPI-X4 was required to significantly prevent mAbo induced increased migration, above 10µM of the same was effectively blocked the mAboFcE induced increase. These results show the efficacy of JM#21 over EPI-X4 against CD19 mAb induced activation of CXCR4 signaling.
Next, we tested the effect of JM#21 on intracellular phosphorylation of BCWM.1 and DHL6 cells (Figure 4C and Figure S4E). As shown before, both BCR stimulation with anti-IgM and CXCR4 stimulation with CXCL12 treatment readily induced phosphorylation of pCD79a, pAKT, pERK and pPLC-γ2 in BCWM.1 (Figure 2E and Figure S2F). In DHL6 cells, CXCL12 treatment only in presence of mAbo induced pCD79a and pPLC-γ2. Therefore, we first analyzed the effect of mAboFcE in presence of CXCL12 on induction of pCD79a and pPLC-γ2 in both BCWM.1 and DHL6 cells, and then combined with JM#21 treatments (Figure 4C). Congruent to previous results using mAbo, combination of mAboFcE and CXCL12 (mAboFcE+CXCL12) treatments caused increased pCD79a and pPLC-γ2 in both BCWM.1 and DHL6 cells as compared to CXCL12 only treatments. In contrast, the mAboFcE+CXCL12 treatments induced pAKT and pERK only in BCWM.1 cells similar to that of mAbo +CXCL12 treatments (Figure S4E). To compare the effect of CXCR4 antagonist, we pretreated cells with 20µM JM#21 similarly as in ADCC assays and then stimulated with anti-IgM, CXCL12, mAbo +CXCL12 and mAboFcE +CXCL12 (Figure 4C and Figure S4E). Congruent to previous report by Kaiser et al.[26], JM#21 treatment caused reduced basal phosphorylation of pAKT and pERK without any addition of stimulation in BCWM.1 cells (Figure S4E). In addition, we found a decrease in basal pCD79a and pPLC-γ2 level in BCWM.1 cells (Figure 4C). However, the basal phosphorylation for all four markers remained unchanged in DHL6 cells upon JM#21 treatments (Figure 4C and Figure S4E) suggesting a complete CXCR4 signaling independent survival of these cells, which is in resonance to the minimal CXCL12 induced migration (Figure 1H). Similar to reduced basal phosphorylation, JM#21 pretreatments reduced the anti-IgM and CXCL12 stimulated pCD79a, pAKT, pERK and pPLC-γ2 induction only in BCWM.1 cells but not in DHL6 cells (Figure 4C and Figure S4E). In addition, JM#21 pretreatments inhibited the increased pCD79a, pAKT, pERK and pPLC-γ2 in response to mAbo +CXCL12 and mAboFcE +CXCL12 stimulations in both cell types. As such the synergistic increase in phosphorylation in DHL6 cells were less pronounced and therefore the effect of JM#21 pretreatments is minimal as compared to BCWM.1 cells. Altogether these results show that in combination with JM#21 the efficacy of CD19 mAbs including the modified FcR binding enhanced version (mAboFcE) were instantly increased by enhanced ADCC and inhibition of CD19 induced activation signal. Broadly, blocking CXCR4 with optimized EPI-X4 derived peptide antagonist like JM#21 is a promising approach to augment therapeutic effects of CD19 mAbs for the treatment of WM.
3. Discussion
In this study, we investigated the role of CD19, a crucial co-receptor for B-cell receptor (BCR) signaling, in the context of B-cell lymphomas, including aggressive forms like Diffuse Large B Cell Lymphoma (DLBCL) and indolent forms like Waldenström Macroglobulinemia (WM). Our study highlights the essential role of CD19 in the survival, proliferation, and CXCL12 induced migration of lymphoma cells. In parallel, treatment with certain anti-CD19 monoclonal antibodies (mAbs) effectively enhances CXCL12 induced migration of WM cells. The generation of CD19 KO BCWM.1 and DHL6 cell lines provided a crucial model to elucidate the of CD19 in WM and GCB-DLBCL, respectively. Both cells were marked by deficiencies in cell growth and CXCL12-driven migration upon CD19 loss (Figure 1 and Figure S1). Altogether the CD19 regulated pathways are critical for both growth and maintenance of B-cell lymphomas as well as chemotaxis, a crucial step towards dissemination.
We find that CD19 KO cells were significantly outcompeted by wild-type (WT) cells in coculture assays (Figure 1A), indicating the necessity of CD19 for maintaining cell viability under competitive conditions. This was further evidenced by the reduced number and size of colonies formed by CD19 KO cells in CFC assays (Figure 1B-E). Apart from growth retardation, the CD19 KO cells showed no CXCL12-induced migration, highlighting the critical role of CD19 in maintaining B-cell lymphoma viability and mobility (Figure 1F-H). Additionally, treatment with anti-CD19 mAbs increased migration. However the increase was largely dependent on the mAb’s binding specificity and clonotype, underscoring the complex impacts of targeting CD19, which can potentially promote lymphoma cell growth under certain conditions.
Targeting CD19 with mAbs has become a focal point in personalized medicine due to its ubiquitous expression on all B lineage cells including neoplastic and autoimmune B cells[34]. However, the enhanced migration capabilities of lymphoma cells towards CXCL12, indicate that CD19’s signaling interaction with CXCR4 is a crucial mechanism in lymphoma cell chemotaxis. Furthermore, our findings underscored the variable efficacy of different CD19 mAb clones. While some clones significantly enhanced CXCL12-induced migration, others had minimal effects, highlighting the importance of selecting the appropriate therapeutic clone to target specific lymphoma subtypes [6]. The Fc silent (FcS) versions of these mAbs maintained similar functionalities, indicating that the effects were predominantly mediated through CD19 signaling rather than secondary Fc receptor engagement on the same B cell surface. Contrastingly, experimental results showed that a failure to ligate NK cells, as demonstrated by FcS mutations, enhances CD19-mediated pathways and confers a survival advantage to lymphoma cells. Thus, the availability of NK cells and the type of anti-CD19 mAb used together determine the treatment outcome. To our knowledge, such direct comparative studies elucidiating the differences in CD19 mAb clones has not beed conducted. Together our finding supports the notion that the optimal schedule and type of CD19 mAbs in therapy has yet to be determined [7].
We show that CD19 mAbs significantly enhance cytotoxicity, particularly when combined with CXCR4 antagonists. This combination therapy not only inhibited the survival and proliferation of lymphoma cells by interevening the CD19-CXCR4 signaling crosstalk, but also enhanced their susceptibility to ADCC. The overexpression of CXCR4 and introduction of activating mutations were associated with poor prognosis and an impaired response to rituximab [35]. The process facilitates lymphoma cell migration towards CXCL12-producing stromal cells and promoting severe bone marrow infiltrations. Also, the dissemination patterns of most B cell malignancies reflect the fundamental principles of lymphocyte homing to secondary lymphoid organs and the restricted tissue-specific egress, indicating a reiterated chemokine receptor signaling. This signaling overdrive suggests a mechanism by which lymphoma cells evade treatment, particularly noted in B-cell malignancies like WM, acute lymphoblastic leukemia, and multiple myeloma [31,36,37]. Under these conditions, lymphoma cells exploit the enhanced chemokine receptor signaling to hide within bone marrow niches and stay away from the grasp of infused mAbs and chemotherapy.
Here we used JM#21, a peptide antagonist derivative of the naturally occurring CXCR4 peptide blocker EPI-X4 [30,32], which inhibited growth of B-ALL and WM in previous studies [26,31]. In this study, we demonstrated that the CXCR4 antagonist EPI-X4 and its optimized derivative, JM#21, effectively enhance the therapeutic effects of CD19-targeted immunotherapy in B-cell lymphomas, particularly in DLBCL and WM. Both, the parental peptide and the optimized derivative disrupted CXCL12-mediated signaling, which plays a key role in lymphoma cell migration and survival, especially in CXCR4-expressing malignant B cells. By inhibiting CXCR4 signaling, JM#21 synergized with CD19 mAbs to significantly improve ADCC. Simultaneously, the JM#21 antagonized the CXCR4 and prevented CXCL12-induced migration upon CD19 mAb treatment. Our findings underscore the potential of combining CD19-targeted immunotherapy with CXCR4 antagonists to overcome resistance mechanisms often associated with CXCL12/CXCR4 signaling in lymphoma cells [15,16,35]. This approach not only enhances mAb efficacy but may also limit dissemination of malignant B cells, which rely on CXCR4 for homing to protective niches in the bone marrow and lymphoid tissues [6,12]. These results support further investigation into EPI-X4 derivatives with increased stability [38,39] as adjuncts to CD19-targeted therapies, offering a promising strategy for enhancing clinical outcomes in CXCR4-dependent lymphomas.
In conclusion, our results illustrate the complex interplay between CD19 and CXCR4 in lymphoma pathophysiology and therapeutic response. The insights gained from this study advocate for the continued development of targeted therapies that leverage the synergistic effects of CD19 and CXCR4 inhibition. Future research should focus on evaluating the efficacy of these combined therapies in diverse lymphoma settings, aiming to optimize treatment regimens and improve outcomes in B-cell lymphoma treatment.
4. Methods and Materials
4.1. Antibodies and Other FACS Reagents
For FACS based receptor expression and intracellular phospho-flowcytometry analyses of different gene knockout (KO) cells, the following anti-human antibodies were used: anti-IgM Alexa Fluor 647 (Cat. No.314536, Biolegend), anti-IgM-BV605 (Cat.No. 314524, Biolegend), anti-IgD-APC (Cat. No. 348222, Biolegend), anti-CXCR4-BV421 (Cat. No. 306518, Biolegend), anti-CD19-BV786 (Cat. No. 563,325 BD Biosciences), pCD79a(Y182) AF647 (Cat. No. 297425, Cell signaling Technology), pERK(pT202/pY204)-AF488 (Cat No. 612592, BD Biosciences), pAKT-BV421(pS473) (Cat. No. 562599, BD Biosciences), pAKT(S473)-PE-Cy7 (Cat. No. 881065, Cell Signaling Technology), pPLC-γ2 (pY759)-PE (Cat. NO. 558490, BD Biosciences). For live cell counting: SytoxTM Blue Live-Dead Cell Stain (Cat No. S34857, Invitrogen), AccuCheck Counting Bead (Cat. No. PCB100, Invitrogen).
4.2. Cell Culture
WM cell line BCWM.1 was kind gift from Steven P. Treon[40]. Germinal center B cell (GCB) type DLBCL cell line SU-DHL-6 (called DHL6) was obtained from German Collection of Microorganisms and Cell Cultures, DSMZ Repository ID ACC-572. Both cell lines were cultured in complete RPMI medium (Invitrogen) containing 10% FBS (type: standard; Pan Biotech), 10 U/mL Penicillin and 100 µg/mL Streptomycin, 2 mM L-Alanyl-L-glutamine solution (stable glutamine), 1 mM sodium Pyruvate, 5 µM β-mercaptoethanol (all from Invitrogen/Gibco) and 10 mM HEPES (Sigma) at 37° C in humidified 5% CO2 incubator. For recombinant antibody production, HEK293T were maintained in complete Iscove’s medium (Sigma) containing 5% FBS (type: standard, Pan Biotech), penicillin/streptomycin, Glutamine, Sodium Pyruvate and 50 mM β-mercaptoethanol (gibco) at 37° C in humidified 7.5% CO2 incubator. For retrovirus and lentivirus packaging, HEK293T derivative Phoenix-Eco and Lenti-X™ 293T (Takara Bioscience) cells were maintained under similar condition.
4.3. Immunochemical, Cytokine and Inhibitors
For stimulations following immunochemical and cytokines were used: anti-IgM goat polyclonal (Cat. No. 2020-01, SouthernBiotech), rhCXCL12 (Cat. No. 300-28A, PeproTech), rhIL-2 (Cat. No. 11340025, ImmunoTools). Preparations of CXCR antagonists EPI-X4 and its derivative JM#21 and their usage on WM cells were previously described [26,32]. In brief, lyophilized EPI-X4 (Mol. Wt. 1832) and JM#21 (Mol. Wt. 1458) peptides were dissolved in H2O, stored frozen as 5mM stocks, and further diluted in phosphate-buffered saline (PBS) or cell culture media as necessary for usage. Similarly, the AMD3100 octahydrochloride (cat. no. S3013, Seleckchem) was also dissolved in H2O and stored frozen as 5mM stock.
4.4. CRISPR/Cas9 Plasmids Generation
The lentiviral Cas9 expression blasticidin resistance (BsdR) plasmid pL Cas9-mCat-1 BsdR was generated by constructing N-terminal FLAG-tagged spCas9 (Addgene #48138) followed by p2a self-cleavage peptide linked to murine cationic amino acid transporter-1, mCat-1 (Addgene #17224) for γ-ecotropic retroviral susceptibility. The cassette followed by BsdR gene under SV40 promoter was then inserted into lentiviral vector pCDH_MSCV (System Bioscience). The designing of the guide RNA (sgRNA) for CRISPR/Cas9 was done by using CrispR Tool in Geneious Prime® software by selecting protospacer adjacent motif (PAM) option [41]. Two sets of highest scoring sgRNAs along with extensions needed for cloning in BbsI sites were synthesized from Eurofin Genomics as complimentary paired oligos, annealed and cloned into the BbsI sites of pR_U6sgRNA_mRFP-1 (Addgene plasmid #112914) or pR_U6sgRNA_eFGP(Addgene plasmid #116926) for IgM and CD19, respectively. Finally, the most effective target sequences were determined by frequency of deleted cells in FACS analyses post transduction. Selected target sgRNAs were IGHM: 5′ CCCGTCGGATACGAGCAGCGTGG 3′and CD19: 5′ GGTCTC-GGGAGTCCCCGCTT 3′.
4.5. Lentiviral and Retroviral Transductions
For lentivirus preparation, Lenti-X™ 293T cells were transfected with pL Cas9-mCat-1 BsdR plasmid together with helper plasmids pMD2.G (Addgene #12259) and pxPAX2 (Addgene #12260) mixed at a ratio of 9:7:4 using PolyFect (Qiagen) reagent. The produced virus particles were concentrated from the culture supernatant after 72 hours using Lenti-X™ Concentrator (Takara Bio) according to manufacturer’s instructions and the concentrated virus medium (VCM) aliquots were stored at -80°C until use. For transduction, RetroNectin® (Takara Bio) coated 6 well plates were added with 1mL of VCM supplemented with 8 µg/mL Polybrene centrifuged at 1800 rpm for 3 hours at 32-37°C. After removing VCM, the 1 × 10^6 lymphoma cells were added to each well containing 2mL of complete RPMI and the plates were centrifuged at 1200 rpm for 30 min at 32-37°C followed by incubation at 37℃, 5% CO2 incubator. After 2 days of incubation, all the adherent and non-adherent cells were collected, washed and replated at an estimated seeding density of 100-250K cells/mL and cultured in larger vessels or flasks. On day 6, cells were added with 20 µg/mL of Blasticidin and continued in culture with fresh Blasticidin every 2 days for 8 days. Positively selected cells were tested for Cas9 and mCat-1 (Cas9Eco cells) expression by performing FACS staining with anti-mouse mCat-1 APC (cat. no. 150505, Biolegend) and anti-FLAG Alexa Fluor 647 (cat no. NB600-344AF647, Bio-techne) intracellular labeling using FIX&PERM® (NordicMUBio) cell fixation and permeabilization kit according to manufacturer’s instruction. All procedure related to lentiviral packaging and transductions until complete removal of viral particles were carried out in BSL-2 environment and approved by institutional genetic engineering and GMO regulatory.
Retroviral transduction of the CD19 and IgM targeting sgRNA plasmids were performed as previously described[42,43]. In brief, HEK293T or Phoenix-Eco cells were transfected with BCR encoding retroviral plasmids together with ecotropic packaging helper plasmid using the GeneJuice Transfection Reagent (Millipore) as recommended by the manufacturer’s protocol. Culture supernatants containing the matured retroviral particles were collected 72 hours after transfection and used for the subsequent transduction of Cas9Eco lymphoma cells by the spin-infection method in presence of 5µg/ml polybrene (Millipore). The transduction efficiency was evaluated four to five days after inoculation by measuring the percentage of the GFP or mRF1 positive cells and respective targeted receptor.
4.6. Generating CD19 KO Clones
For the generation of single cell CD19 KO clones, GFP positive cells were sorted as single cells in 96-well U-bottom suspension plates containing 75 µL of complete RPMI medium in each well and maintained in 37℃, 5% CO2 incubator. After 15 days 75 µL of additional medium was added and the growing clones are identified by changing the color of the media or can be observed under the microscope. For sequencing, genomic DNA was isolated from each grown clone, around 500bp regions encompassing sgRNA target site were PCR amplified and sequenced. The primers used for genotyping and sequencing IGHMCµ1_F 5′ CCCCAGCAGCCTTGGACAAAGACC 3′, IGHMCµ1_R 5′ GCTGGACTTTGCACACCACGTGTTCG 3′, CD19Intron1_F01 5′GTGTGCAGCGTAAAATTCAGGAAAGGGTTGGAAGG3′ and CD19Exon2_R03 5′AGTCGAGATACATGACTGTCCAGCCAGGCTGCCAG 3′.
4.7. Colony Forming Cell Assay
For each KO clones, 2000 cells in 100µL of serum free Isocove’s medium were added with 2 mL prewarmed aliquots MethocultTM 4236 (StemCELL Technologies) media supplemented with 25 µL of 100x penicillin/streptomycin (Gibco) and 25 µL 1M HEPES solution (Sigma). Total volume was adjusted with serum free Iscove’s media up to 2.5 mL and vortexed vigorously for 20sec. Upon settling the medium for 5 min, triplicates of 500µL mixture were distributed in a 12 well plate (Corning) using a 16-gauge blunt end needle. To prevent evaporation and retain humidity, sterile water was added in between the wells and incubated at 37° C, 5% CO2 for 8-10 days. The CFC plates was scanned in Incucyte S3 Live Cell imager (Sartorius) at 10x magnification with an overlapping 7x7 image grid. The images were stitched and the colonies were scored according to their number and size in ImageJ.
4.8. ELISA
The day before the ELISA assay, 96-well plates were coated with 10 µg/mL goat polyclonal anti human-IgM antibody (cat. no. 2020-01, Southern Biotech) or goat polyclonal anti human-IgG antibody (cat. no. 2040-01, Southern Biotech) and incubated overnight at 4°C. The next day, plates were washed with PBS containing 0.5% Tween-20, blocked with 1%BSA containing wash buffer for 1 hour at 37°C. Afterwards, serial dilutions of culture supernatant for IgM secretion or purified mAbo were added. For standard curve, 1:3 serial dilutions starting from 1µg/mL of human IgM or IgG standard were added. Plates were incubated for 1 hour at 37°C, washed and then added with 1:3000 dilution of Alkaline phosphatase (AP) conjugated IgM (cat. no. 9020-04, Southern Biotech) or IgG (cat. no. 2020-04, Southern Biotech) detection antibodies for 1 hour. OD were then measured at 405 nm in a multiplate reader after 30 min of adding the AP-substrate solution followed by stopping with 1:3 volume of 3M NaOH.
4.9. Competitive Survival Assay
For the suspension cell growth assay, individual single cell clones of knock out (KO) cells were co-cultured with wild type (WT) cells at an initial starting ratio of 1:1 in a 96 well plate, each well receiving a total of 100K cells. The growth was determined by counting the SytoxTM Blue negative live cells with reference to AccuCheck counting beads every 24 hours interval from day 0 to day 4 using FACS based assay. The CD19 KO and IgM KO cells were identified by reporter GFP and mRFP1 expressions, respectively.
4.10. Generation of Recombinant Anti-CD19 Monoclonal Antibodies
To generate CD19 mAbs, functional VJ and VDJ sequences derived from in-house subcloned anti-CD19 hybridoma derived from CAT.131E10, were cloned into human Igκ light chain and IgG1 heavy chain, respectively. A self-cleaving p2a peptide linked the Igκ and IgG1 chains to produce a single chain recombinant humanized anti-CD19 IgG (called mAbo) construct, cloned in modified pRVL IgG1 (Addgene #104583) expression vector with episomal amplification system[29]. The Fc receptor non-binder or Fc silent (FcS) and Fc receptor binding enhanced (FcE) versions were generated by introducing point mutations as described before [28,29]. Two other humanized anti-CD19 mAbs named as mAb1 and mAb2 (cat. no. Ab01511-10.0 and Ab00823-10.0) and their respective FcS versions named as mAb1FcS and mAb2FcS (cat. no. Ab01511-10.3 and Ab00823-10.3) were purchased from Absolute Antibody, UK for research use only. Reportedly, both mAb1 and mAb2 are either in therapeutic usage or preclinical studies for directly targeting B cell lymphoma or toxin delivery (Absolute Antibody, UK). For the expression mAbo antibodies, 12x10^6 HEK293T cells were seeded on a 15cm adherent culture dish day before transfection. Approximately, 80µg of plasmids were transfected with using PEI Max® (Polysciences) and cultured in 20mL complete media [29]. After 48 hours, additional 20mL serum free medium was added to each plate. The antibody-containing supernatant was collected at day 5 of transfection, filtered, and concentrated with VivaSpin® 100KDa ultrafiltration units. For purification, HiTrap Protein G HP 1mL (Cytiva) columns were used in a ÄKTApure chromatography system. Antibodies were eluted in 500µL fractions with 100mM glycine-HCl, pH 2.7 and immediately neutralized with equal volume of 1M Tris buffer, pH 11.0. Neutralized antibody preparations were buffer exchanged with spin desalting columns in PBS. The wmount of antibodies and purity were measured by ELISA and SDS-PAGE analyses of the fractions.
4.11. NK Cell Preparation and ADCC Assay
To isolate Natural Killer (NK) cells, peripheralPeripheral blood mononuclear cells (PBMCs) were purified from buffy coats by Ficoll (cytiva) density gradient centrifugation). Subsequently the cells were and subsequently labelled with CD56 microbeads (cat. no. 130-097-42, Miltenyi Biotec) and incubated for 15 minutes. Next, the labelled PBMCscells were washed in MACs buffer and loaded into MACS Columns, placed in the magnetic separator. The columns were washed three times for depleting unlabeled cells. Magnetically labelled CD56 positive NK cells were retained and eluted as the positively selected cell fraction.
Isolated NK cells were first labeled with 0.5µM of CellTraceTM Far Red dye (Invitrogen) according to manufacturer’s protocol. To activate, labeled NK cells were stimulated with 10ng/mL of rhIL-2 for overnight (18-22 hours) in complete RPMI medium containing 10% FCS. On the day of the experiment, frequencies of live-dead fractions were determined for both activated NK cells and lymphoma cells and resuspended at a concentration of 1x10^6 cells/mL in serum free RPMI. To combine KO and WT, cells were mixed at equal ratio and kept at final concertation of 1x10^6 cells/mL. For ADCC, lymphoma cells were mixed with activated NK cells at a ratio of 1:4, mixed and added with 5µg/mL of mAbs. For CXCR4 antagonist treatment, lymphoma cells were preincubated with 20µM of peptide inhibitor and maintained in the same condition during the ADCC assay. After 4 hours of coculturing, cells were analyzed by FACS after adding AccuCheck counting beads and 2µM SytoxTM Blue (ThermoFischer).
4.12. Migration Assay (Chemotaxis Assay)
Lymphoma cells were resuspended in Serum-free RPMI media at 2×10⁶/mL. 50 µL cells were loaded in the upper chamber of an 8.0-µm pore size transwell (Corning HTS Transwell®-96 well). The lower chamber was filled with 150 µL of serum-free media with or without rhCXCL12 (60 nM) and anti-human CD19 (5-10 µg/mL). Cells that migrated into the lower chamber were harvested after 4 hours of incubation at 37° C, 5% CO2, and counted by using CellTiter-Glo® 2.0 Assay according to manufacturer’s instruction.
4.13. Phospho-Flow Assay
Lymphoma cells were resuspended in 1% FBS Iscove’s media at 20×106 cells/mL and the aliquots 50 - 75 µL (1-1.5×10⁶ cells) were added in each 1.5 mL Eppendorf tube. Cells were incubated at 37°C for 20-30 min in a tabletop shaker before the addition of stimuli. Meanwhile stimulating antibodies were prepared by dissolving in 1% Iscove’s media at 2x dissolved final concentration in 50 - 75 µL volume. The prepared stimulating antibodies were added to the incubated samples according to the experimental design time points as 0′, 5′,10′ and 20′. After each time point, 0.5% Sodium Azide prepared in PBS (ice cold) were added and washed by centrifuge at 500 g for 5 min at 4°C. The cells were fixed by adding 4% Paraformaldehyde (PFA) incubated at RT for 20 min or directly by 1x prewarmed BD Phosflow™ Lyse/Fix Buffer (Cat. No. 558049, BD Bioscience) for 20 min at RT. For staining of cells, the antibodies were dissolved in a 1x permeabilization Buffer (Cat. No. GAS-002B-1, Nordic MUBio) added to the cells, and incubated for 15-30 min at room temperature. Finally, cells were washed with 0.5% Saponin prepared in PBS. Cells were recorded in FACS Buffer (3% FBS, 0.1% Sodium Azide in PBS) at BD Fortessa.
4.14. Data Analysis
Statistical analysis was performed using GraphPad Prism 10.4 software. Whereever possible specific statistical tests and number of replicates are mentioned in the figure legends. All FACS data were plotted and analyzed in FlowLogic 8.4 software. All image data were visualized and analyzed by Fiji (ImageJ2) software.
Supplementary Materials
Author Contributions
Study design and supervision by PCM; Funding acquisition by PCM and CB; Experimental works by NK, MK and PCM with specific supports from MD and JDH; Data interpretation and manuscript writing by PCM together with MD, NK and MK; MS. MH, DA, FK, JM, SS and CB contributed specific reagents and supported through CXCR4 antagonist and ADCC assays.
Acknowledgments
This work is supported by Fritz Thyssen Stiftung (FTS) project 10.23.1.012MN to PCM and Deutsche Forschungsgemeinschaft (DFG) CRC1279 project B01 to CB and A06 to J.M. Authors thank FTS and CRC1279 projects for the supporting position of MK, NK and PCM, respectively. M.H. was supported by Ulm Univerity Bausteinprogramm (L.SBN.0209) and Baden-Württemberg Foundation. Authors thank Dr. Thomas Gronemeyer, Inst. of Molecular Genetics and Cell Biology, and FACS core facility at University of Ulm for technical supports.
Declaration of competing interest
M.H, F.K., and J.M. are coinventors of pending and issued patents that claim to use EPI-X4 (ALB408-423) and derivatives for the therapy of CXCR4-associated diseases.
References
- van Zelm, M.C.; et al. CD81 gene defect in humans disrupts CD19 complex formation and leads to antibody deficiency. J Clin Invest 2010, 120, 1265–1274. [Google Scholar] [CrossRef]
- Wentink, M.W.J.; et al. Deficiencies in the CD19 complex. Clin Immunol 2018, 195, 82–87. [Google Scholar] [CrossRef] [PubMed]
- Pelanda, R.; et al. B-cell intrinsic and extrinsic signals that regulate central tolerance of mouse and human B cells. Immunol Rev 2022, 307, 12–26. [Google Scholar] [CrossRef] [PubMed]
- Xu, W.; et al. Targeting B-cell receptor and PI3K signaling in diffuse large B-cell lymphoma. Blood 2021, 138, 1110–1119. [Google Scholar] [CrossRef] [PubMed]
- Jellusova, J. and Rickert, R.C. The PI3K pathway in B cell metabolism. Crit Rev Biochem Mol Biol 2016, 51, 359–378. [Google Scholar] [CrossRef] [PubMed]
- Lownik, J.; et al. Sequencing of Anti-CD19 Therapies in the Management of Diffuse Large B-Cell Lymphoma. Clin Cancer Res 2024, 30, 2895–2904. [Google Scholar] [CrossRef] [PubMed]
- Zinzani, P.L. and Minotti, G. Anti-CD19 monoclonal antibodies for the treatment of relapsed or refractory B-cell malignancies: a narrative review with focus on diffuse large B-cell lymphoma. J Cancer Res Clin Oncol 2022, 148, 177–190. [Google Scholar] [CrossRef] [PubMed]
- Sarkozy, C. and Sehn, L.H. Management of relapsed/refractory DLBCL. Best Pract Res Clin Haematol 2018, 31, 209–216. [Google Scholar] [CrossRef]
- Duell, J.; Westin, J. The future of immunotherapy for diffuse large B-cell lymphoma. Int J Cancer 2024. [Google Scholar] [CrossRef] [PubMed]
- Salles, G.; et al. Tafasitamab plus lenalidomide in relapsed or refractory diffuse large B-cell lymphoma (L-MIND): a multicentre, prospective, single-arm, phase, 2 study. Lancet Oncol 2020, 21, 978–988. [Google Scholar] [CrossRef]
- Zhang, Z.; et al. B cell depletion therapies in autoimmune diseases: Monoclonal antibodies or chimeric antigen receptor-based therapy? Front Immunol 2023, 14, 1126421. [Google Scholar] [CrossRef]
- Schultz, L. and Gardner, R. Mechanisms of and approaches to overcoming resistance to immunotherapy. Hematology 2019, 2019, 226–232. [Google Scholar] [CrossRef]
- Shalabi, H.; et al. Sequential loss of tumor surface antigens following chimeric antigen receptor T-cell therapies in diffuse large B-cell lymphoma. Haematologica 2018, 103, e215–e218. [Google Scholar] [CrossRef]
- Moreno, M.J.; et al. CXCR4 expression enhances diffuse large B cell lymphoma dissemination and decreases patient survival. J Pathol 2015, 235, 445–455. [Google Scholar] [CrossRef]
- Chen, J.; et al. Dysregulated CXCR4 expression promotes lymphoma cell survival and independently predicts disease progression in germinal center B-cell-like diffuse large B-cell lymphoma. Oncotarget 2015, 6, 5597–5614. [Google Scholar] [CrossRef] [PubMed]
- Chen, L.; et al. CXCR4 upregulation is an indicator of sensitivity to B-cell receptor/PI3K blockade and a potential resistance mechanism in B-cell receptor-dependent diffuse large B-cell lymphomas. Haematologica 2020, 105, 1361–1368. [Google Scholar] [CrossRef] [PubMed]
- Arribas, A.; et al. Secondary resistance to the PI3K inhibitor copanlisib in marginal zone lymphoma. European Journal of Cancer 2020, 138, S40. [Google Scholar] [CrossRef]
- Tarantelli, C.; et al. PQR309 Is a Novel Dual PI3K/mTOR Inhibitor with Preclinical Antitumor Activity in Lymphomas as a Single Agent and in Combination Therapy. Clin Cancer Res 2018, 24, 120–129. [Google Scholar] [CrossRef] [PubMed]
- Mouhssine, S.; et al. Targeting BTK in B Cell Malignancies: From Mode of Action to Resistance Mechanisms. Int J Mol Sci 2024, 25. [Google Scholar] [CrossRef] [PubMed]
- Buske, C.; et al. Managing Waldenstrom’s macroglobulinemia with BTK inhibitors. Leukemia 2023, 37, 35–46. [Google Scholar] [CrossRef] [PubMed]
- Maity, P.C.; et al. Isotype Specific Assembly of B Cell Antigen Receptors and Synergism With Chemokine Receptor CXCR4. Front Immunol 2018, 9, 2988. [Google Scholar] [CrossRef] [PubMed]
- Becker, M.; et al. CXCR4 signaling and function require the expression of the IgD-class B-cell antigen receptor. Proceedings of the National Academy of Sciences of the United States of America 2017, 114, 5231–5236. [Google Scholar] [CrossRef]
- Boyles, J.S.; et al. A nondepleting anti-CD19 antibody impairs B cell function and inhibits autoimmune diseases. JCI Insight 2023, 8. [Google Scholar] [CrossRef] [PubMed]
- Eken, J.A.; et al. Antigen-independent, autonomous B cell receptor signaling drives activated B cell DLBCL. J Exp Med 2024, 221. [Google Scholar] [CrossRef]
- Pansy, K.; et al. The CXCR4-CXCL12-Axis Is of Prognostic Relevance in DLBCL and Its Antagonists Exert Pro-Apoptotic Effects In Vitro. Int J Mol Sci 2019, 20. [Google Scholar] [CrossRef]
- Kaiser, L.M.; et al. Targeting of CXCR4 by the Naturally Occurring CXCR4 Antagonist EPI-X4 in Waldenström’s Macroglobulinemia. Cancers (Basel) 2021, 13. [Google Scholar] [CrossRef] [PubMed]
- Chen, D.; et al. Inebilizumab, a B Cell-Depleting Anti-CD19 Antibody for the Treatment of Autoimmune Neurological Diseases: Insights from Preclinical Studies. J Clin Med 2016, 5. [Google Scholar] [CrossRef] [PubMed]
- Richards, J.O.; et al. Optimization of antibody binding to FcgammaRIIa enhances macrophage phagocytosis of tumor cells. Mol Cancer Ther 2008, 7, 2517–2527. [Google Scholar] [CrossRef]
- Vazquez-Lombardi, R.; et al. Expression of IgG Monoclonals with Engineered Immune Effector Functions. Methods Mol Biol 2018, 1827, 313–334. [Google Scholar] [CrossRef] [PubMed]
- Zirafi, O.; et al. Discovery and characterization of an endogenous CXCR4 antagonist. Cell Rep 2015, 11, 737–747. [Google Scholar] [CrossRef]
- Pohl, J.; et al. An Optimized Peptide Antagonist of CXCR4 Limits Survival of BCR-ABL1-Transformed Cells in Philadelphia-Chromosome-Positive B-Cell Acute Lymphoblastic Leukemia. Int J Mol Sci 2024, 25. [Google Scholar] [CrossRef] [PubMed]
- Harms, M.; et al. An optimized derivative of an endogenous CXCR4 antagonist prevents atopic dermatitis and airway inflammation. Acta Pharm Sin B 2021, 11, 2694–2708. [Google Scholar] [CrossRef]
- Wieliczka, M.L.; et al. Optimizing the Use of Plerixafor for Stem Cell Collection (SCC) for Autologous Stem Cell Transplant (ASCT) and Developing an Algorithm. Biology of Blood and Marrow Transplantation 2019, 25, S180. [Google Scholar] [CrossRef]
- Gambella, M.; et al. CD19-Targeted Immunotherapies for Diffuse Large B-Cell Lymphoma. Front Immunol 2022, 13, 837457. [Google Scholar] [CrossRef] [PubMed]
- Laursen, M.B.; et al. High CXCR4 expression impairs rituximab response and the prognosis of R-CHOP-treated diffuse large B-cell lymphoma patients. Oncotarget 2019, 10, 717–731. [Google Scholar] [CrossRef]
- Kaiser, L.M.; et al. CXCR4 in Waldenström’s Macroglobulinema: chances and challenges. Leukemia 2021, 35, 333–345. [Google Scholar] [CrossRef] [PubMed]
- Hideshima, T. and Anderson, K.C. Signaling Pathway Mediating Myeloma Cell Growth and Survival. C. Signaling Pathway Mediating Myeloma Cell Growth and Survival. Cancers (Basel) 2021, 13. [Google Scholar] [CrossRef]
- Harms, M.; et al. Fatty acid conjugated EPI-X4 derivatives with increased activity and in vivo stability. J Control Release 2024, 373, 583–598. [Google Scholar] [CrossRef]
- Harms, M.; et al. Development of N-Terminally Modified Variants of the CXCR4-Antagonistic Peptide EPI-X4 for Enhanced Plasma Stability. J Med Chem 2023, 66, 15189–15204. [Google Scholar] [CrossRef] [PubMed]
- Ditzel Santos, D.; et al. Establishment of BCWM.1 cell line for Waldenstrom’s macroglobulinemia with productive in vivo engraftment in SCID-hu mice. Exp Hematol 2007, 35, 1366–1375. [Google Scholar] [CrossRef]
- Doench, J.G.; et al. Optimized sgRNA design to maximize activity and minimize off-target effects of CRISPR-Cas9. Nat Biotechnol 2016, 34, 184–191. [Google Scholar] [CrossRef] [PubMed]
- Maity, P.C.; et al. IGLV3-21*01 is an inherited risk factor for CLL through the acquisition of a single-point mutation enabling autonomous BCR signaling. Proceedings of the National Academy of Sciences of the United States of America 2020, 117, 4320–4327. [Google Scholar] [CrossRef] [PubMed]
- Iype, J.; et al. Differences in Self-Recognition between Secreted Antibody and Membrane-Bound B Cell Antigen Receptor. Journal of immunology (Baltimore, Md.: 1950) 2019, 202, 1417–1427. [Google Scholar] [CrossRef]
Figure 1.
CD19 is essential for survival and migration of lymphoma cells. A. Left, FACS analyses showing percentage changes in living population of CD19 KO (GFP positive) BCWM.1 cells compared to WT cells at 1-3 days after seeding the coculture. Cells were gated for size by FSC-A and SSC-A followed by live-dead Sytox Blue staining. Right, time kinetics showing changes in ratio of CD19 KO:WT (green) cell numbers compared to EV:WT (black) or IgM KO:WT (red), obtained from the FACS analyses of the coculture (as depicted in Figure S1J). B. Ensembled microscopic images of 10 days CFC assay showing overview of colonies formed by WT and CD19 KO (green) BCWM.1 cells. For comparison of individual colony features, single colonies form three independent clones of CD19 KO BCWM.1 cells were shown below. Image was produced in Fiji (ImageJ) by stitching a grid of overlapping brightfield images taken at 10x magnification. Dimension of the images were indicated in their axes. C. Quantification of number of colonies (left) obtained in a 4 cm^2 well and estimated colony (area) size (right) of the individual colonies obtained from a minimum of three independent clones for CD19 KO and IgM KO compared to WT BCWM.1 cells. D. Representative images of single colonies form three independent clones of CD19 KO DHL6 cells compared to WT cells. E. Quantification of number of colonies (left) and colony size (right) of CD19 KO clones compared to WT DHL6 cells. F. Live cell fluorescence images of EV (GFP) transduced WT and CD19 KO (GFP positive) BCWM.1 cells representing a single growing colony at day 6 and 8, and corresponding quantification of colony sizes. G. Specific migration of CD19 KO and IgM KO clones towards CXCL12 (60nM) compared to WT BCWM.1 cells. H. Same as G, specific migration of CD19 KO DHL6 clones compared to WT control. Data in A, G and H, and colony counts in C and E represent mean±SD of indicated N number of replicates and were analyzed by Two-Way ANOVA followed by Dunnett’s multiple comparison for each pairs with reference to control. Colony size data (C, E-F) as meadian±range, and were analyzed by One-Way ANOVA followed by Dunn’s multiple comparison and directly by Mann-Whitney test, respectively. * p<0.05, **p<0.01, *** p<0.001, **** p<0.0001.
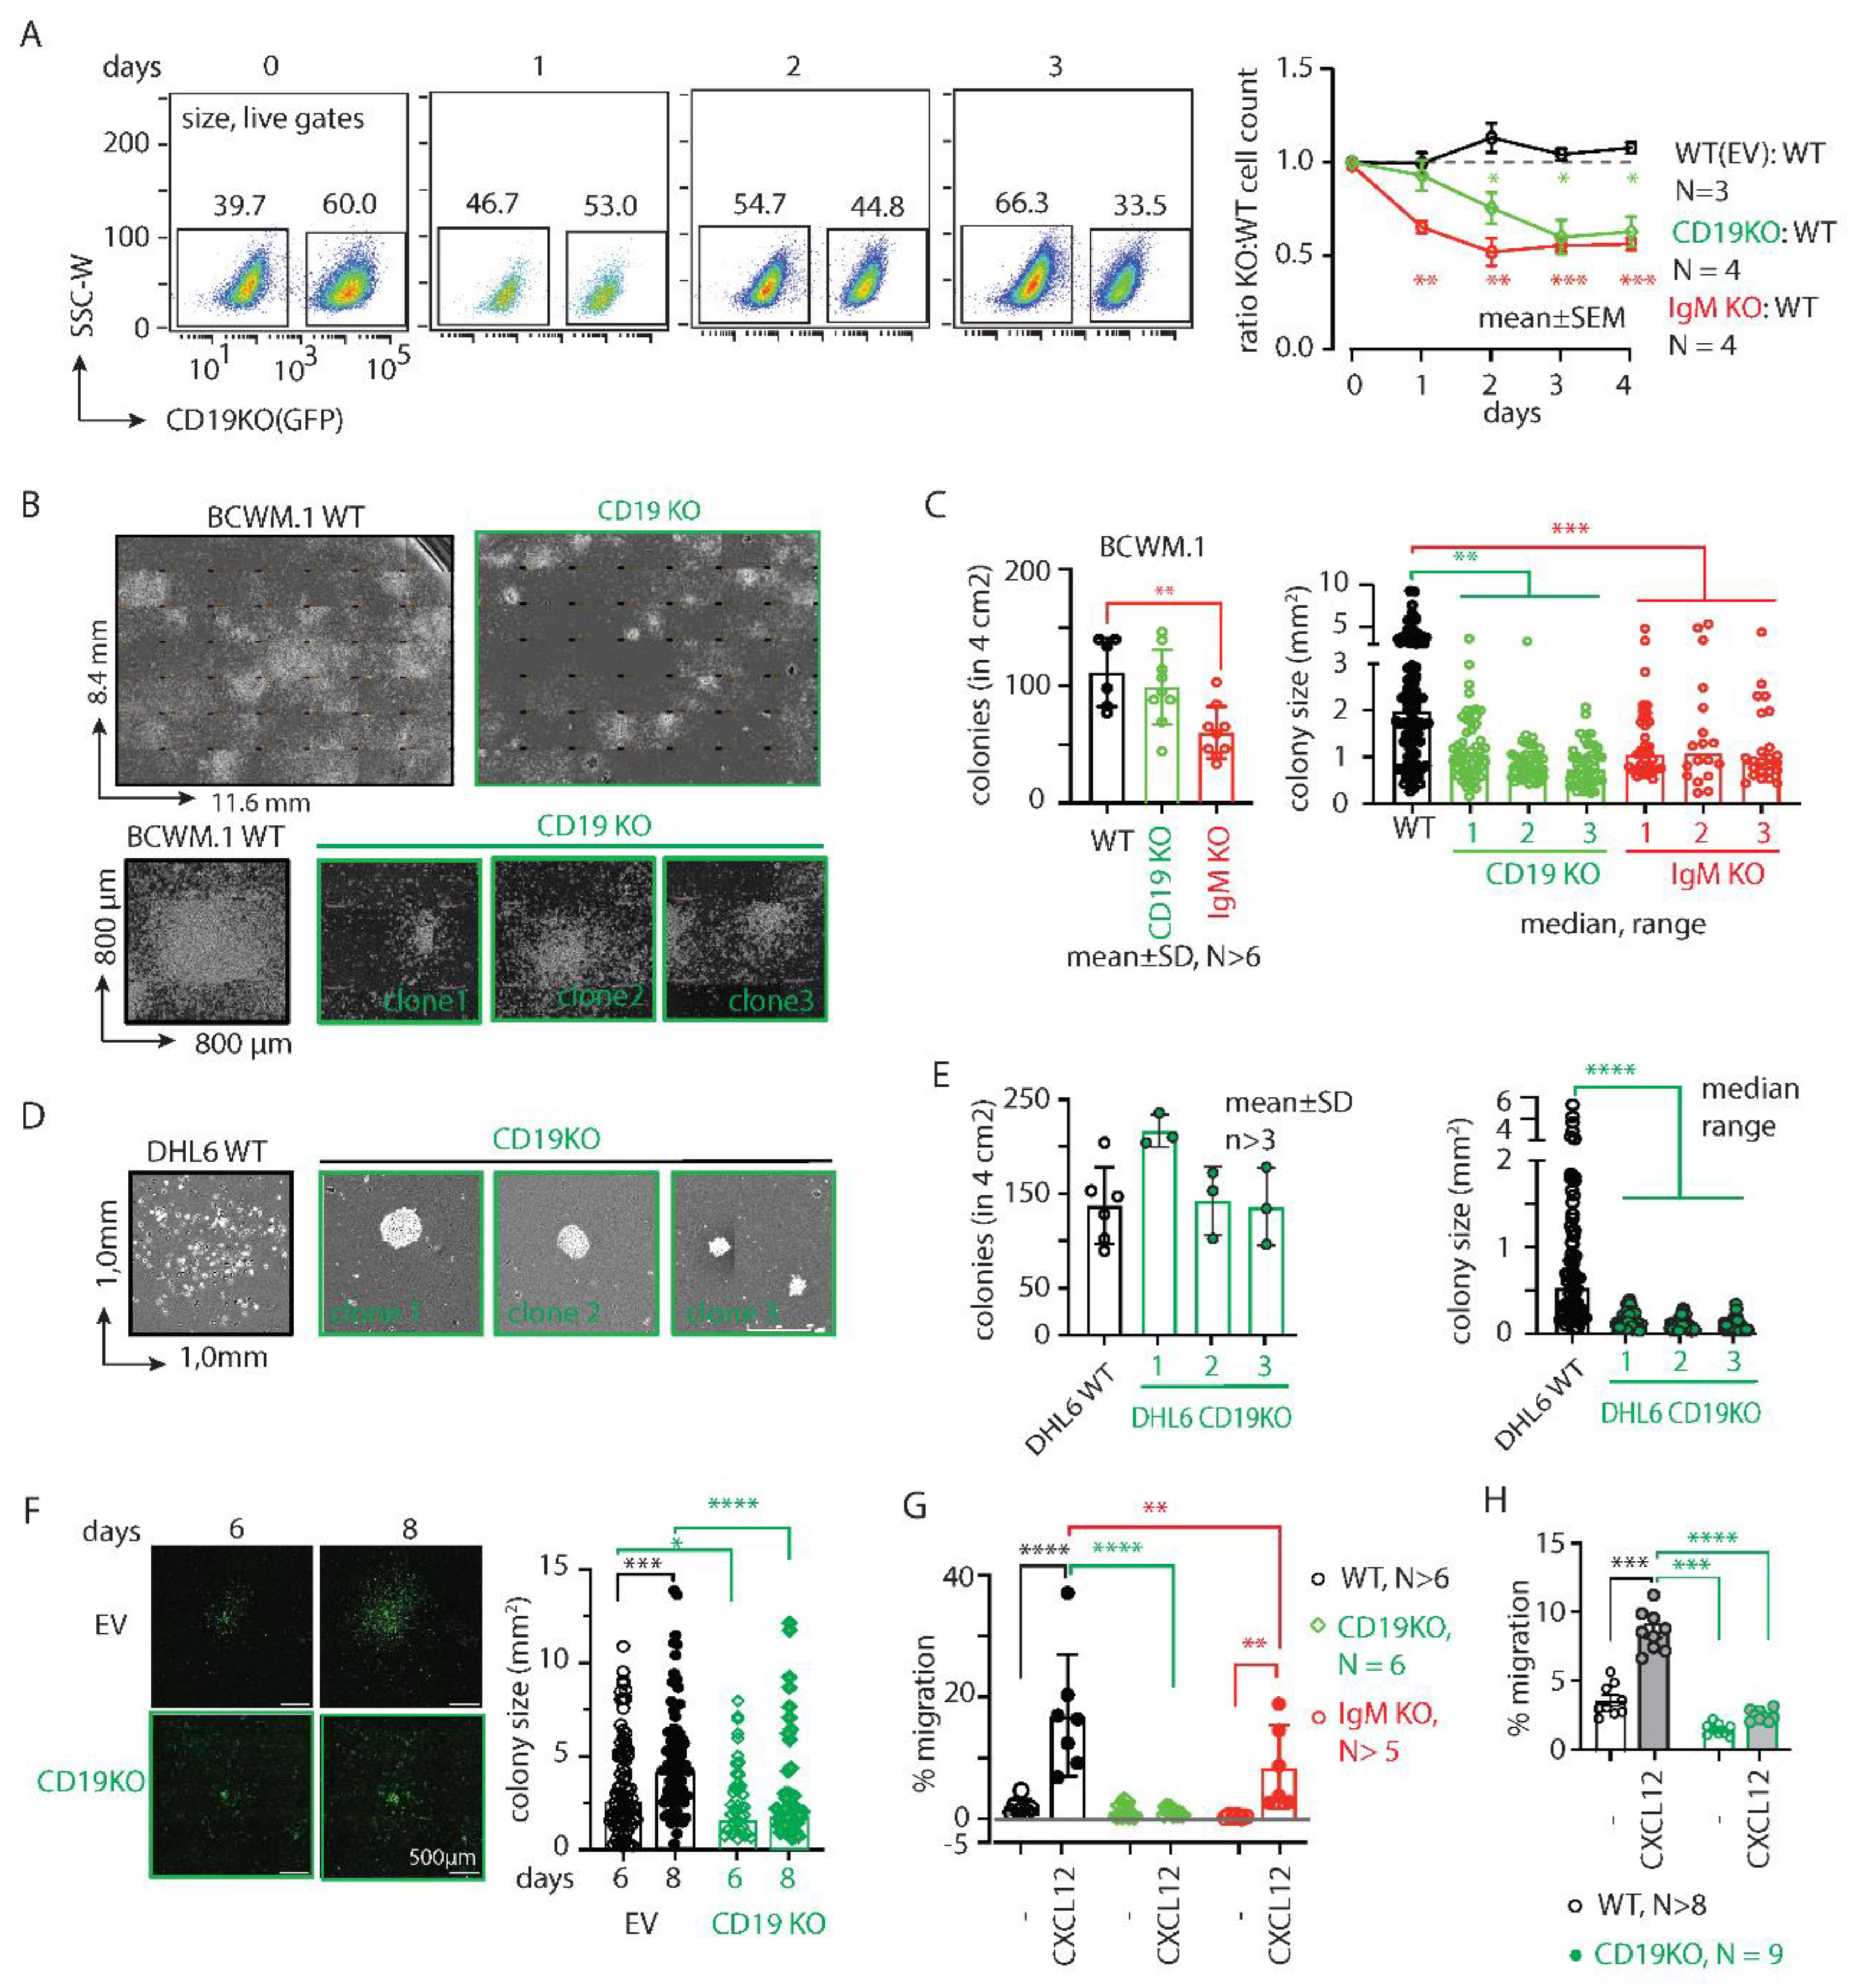
Figure 2.
CD19 mAbs increase CXCL12 induced migration and growth. A. Specific migration of BCWM.1 cells towards CXCL12 alone (gray filled bar) and in presence of wildtype anti-CD19 clone mAbo (dark blue bar) and its Fc silent (FcS) counterpart (light blue bar), in comparison with other commercially available therapeutic anti-CD19 clones mAb1 and mAb2 and their FcS forms. B. Left panels, representative images of single colonies of CD19 KO DHL6 cells at 10 days of CFC assay in absence (control) and presence of mAbo. Middle and right panels, quantification of number of colonies and estimated colony size in absence and presence of mAbo, respectively. C. Representative images of single colonies of CD19 KO DHL6 cells at 10 days of CFC assay (upper panels) and after 8 days of colony replating (bottom panels) in presence of 5µ/mL anti-CD19 clone mAbo and its FcS form D. Quantification of number of colonies (left) and estimated colony size (right) of the individual colonies of CD19 KO BCWM.1 cells in presence and absence of mAbo or mAboFcS from first CFC plating and after replating. E. Quantification of pCD79a (Y182), pERK (T202, Y204), pAKT (S473) and pPLCγ2 median fluorescence intensity (MFI) of DHL6 cells (as depicted in Figure S2E) in response to stimulants - 5µg/mL anti-IgM, 60nM CXCL12, 5µg/mL mAbo anti-CD19 and mAbo + CXCL12 for 5 min. F. Same as E, quantification of MFIs of stimulated BCWM.1 cells. Data in A, E, F and colony counts in B and D represent mean±SD of indicated number of replicates and were analyzed by One-Way ANOVA followed by multiple comparison with reference to control. Colony size data in B and D represent median±range and were analyzed by Mann-Whitney test.
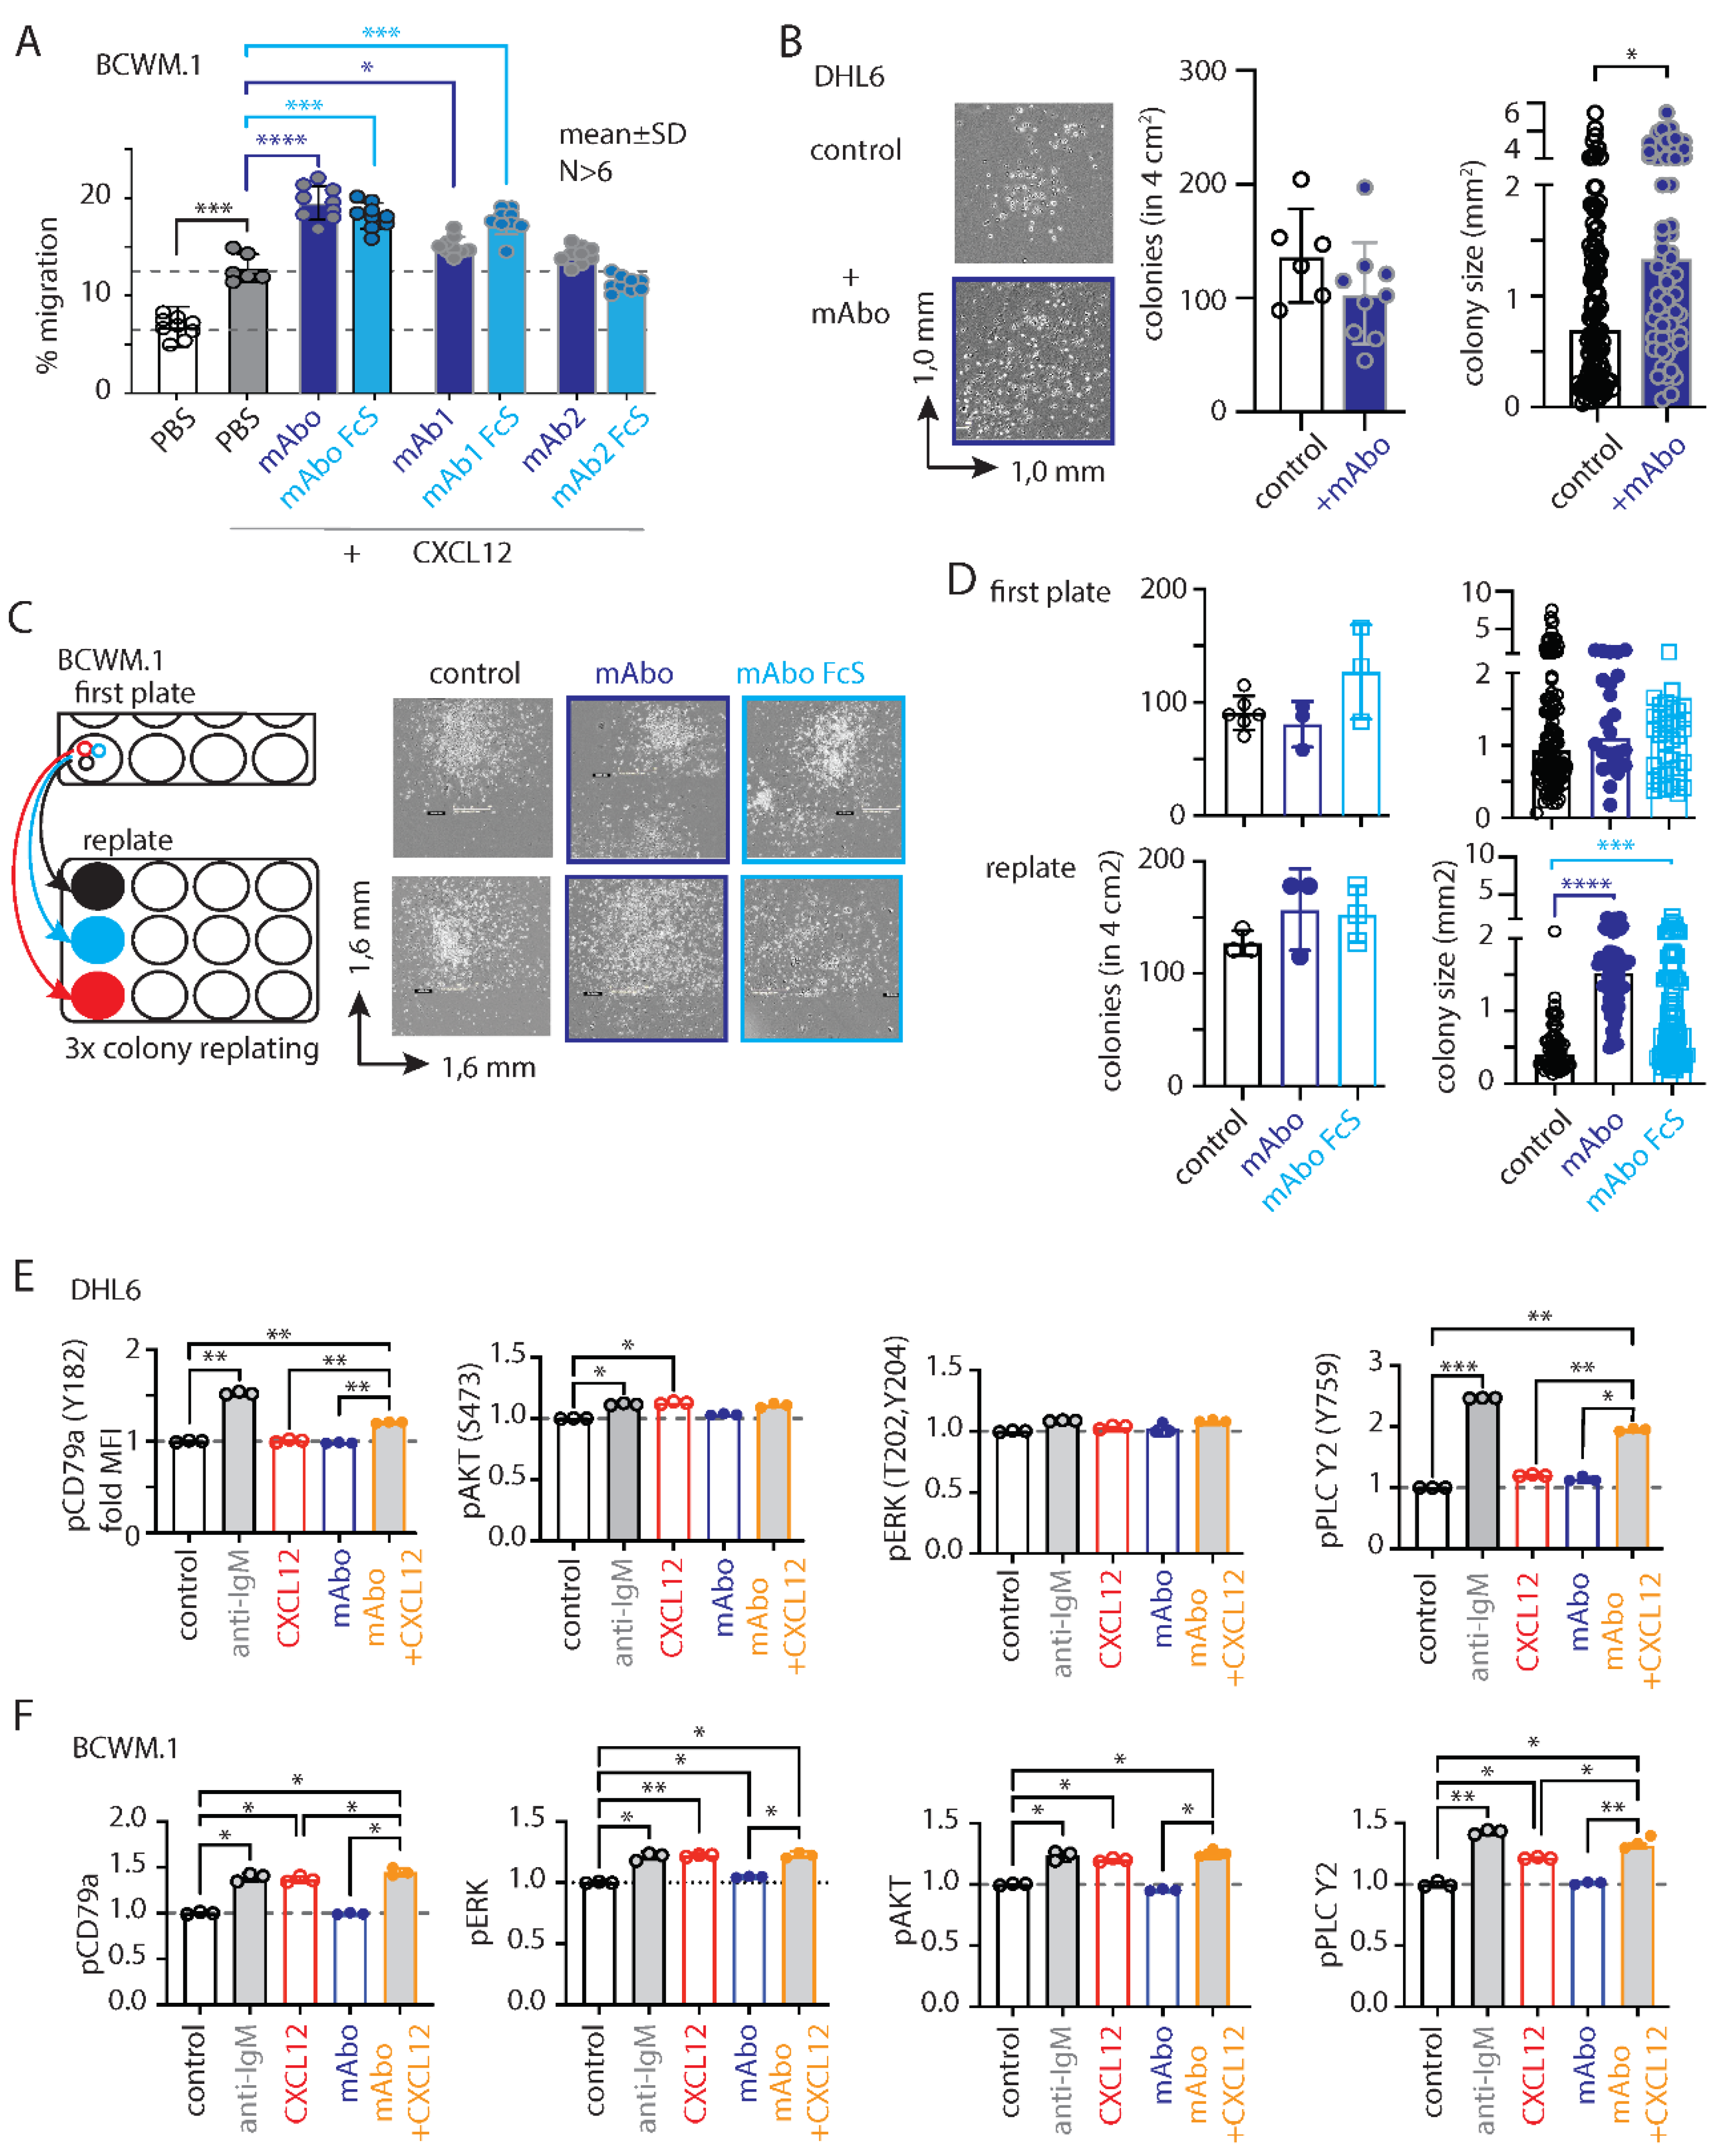
Figure 3.
Variable efficiencies of CD19 mAb induced ADCC on different lymphoma cells. A. Quantification of WT (black, open circles), IgM KO (red, solid circles) and CD19 KO (green, solid circles) BCWM.1 live cell count in ADCC assay (as depicted in Figure S3) in absence (gray bars), and presence of mAboFcS mutant (blue bars) or mAbo (brown bars) as indicated. Plots represent mean±SD of three or more replicate data normalized to no mAb control and were analyzed by Two-Way ANOVA followed by Dunnett’s multiple comparison. Dashed lines represent 100 and 50% survival values. B-C. Same as A, ADCC assay with mAb1FcS vs. mAb1 (B). and mAb2FcS vs. mAb2 (C). D-F. Same as A, live cell counts of WT (black, open circles) and CD19 KO (green, solid circles) DHL6 cells upon ADCC assay with mAboFcs vs. mAbo (D), mAb1Fcs vs. mAb1 (E) and mAb2Fcs vs. mAb2 (F). G. Effect of Fc binding enhanced (FcE) anti-CD19 clone mAboFcE (purple bars) on WT (black, open circles), IgM KO (red, solid circles) and CD19 KO (green, solid circles) BCWM.1 cells in ADCC assay compared to no mAb (gray bars) and standard mAbo (brown bars) controls. H. Same as G, enhanced ADCC of mAboFcE on DHL6 cells compared to standard mAbo control.
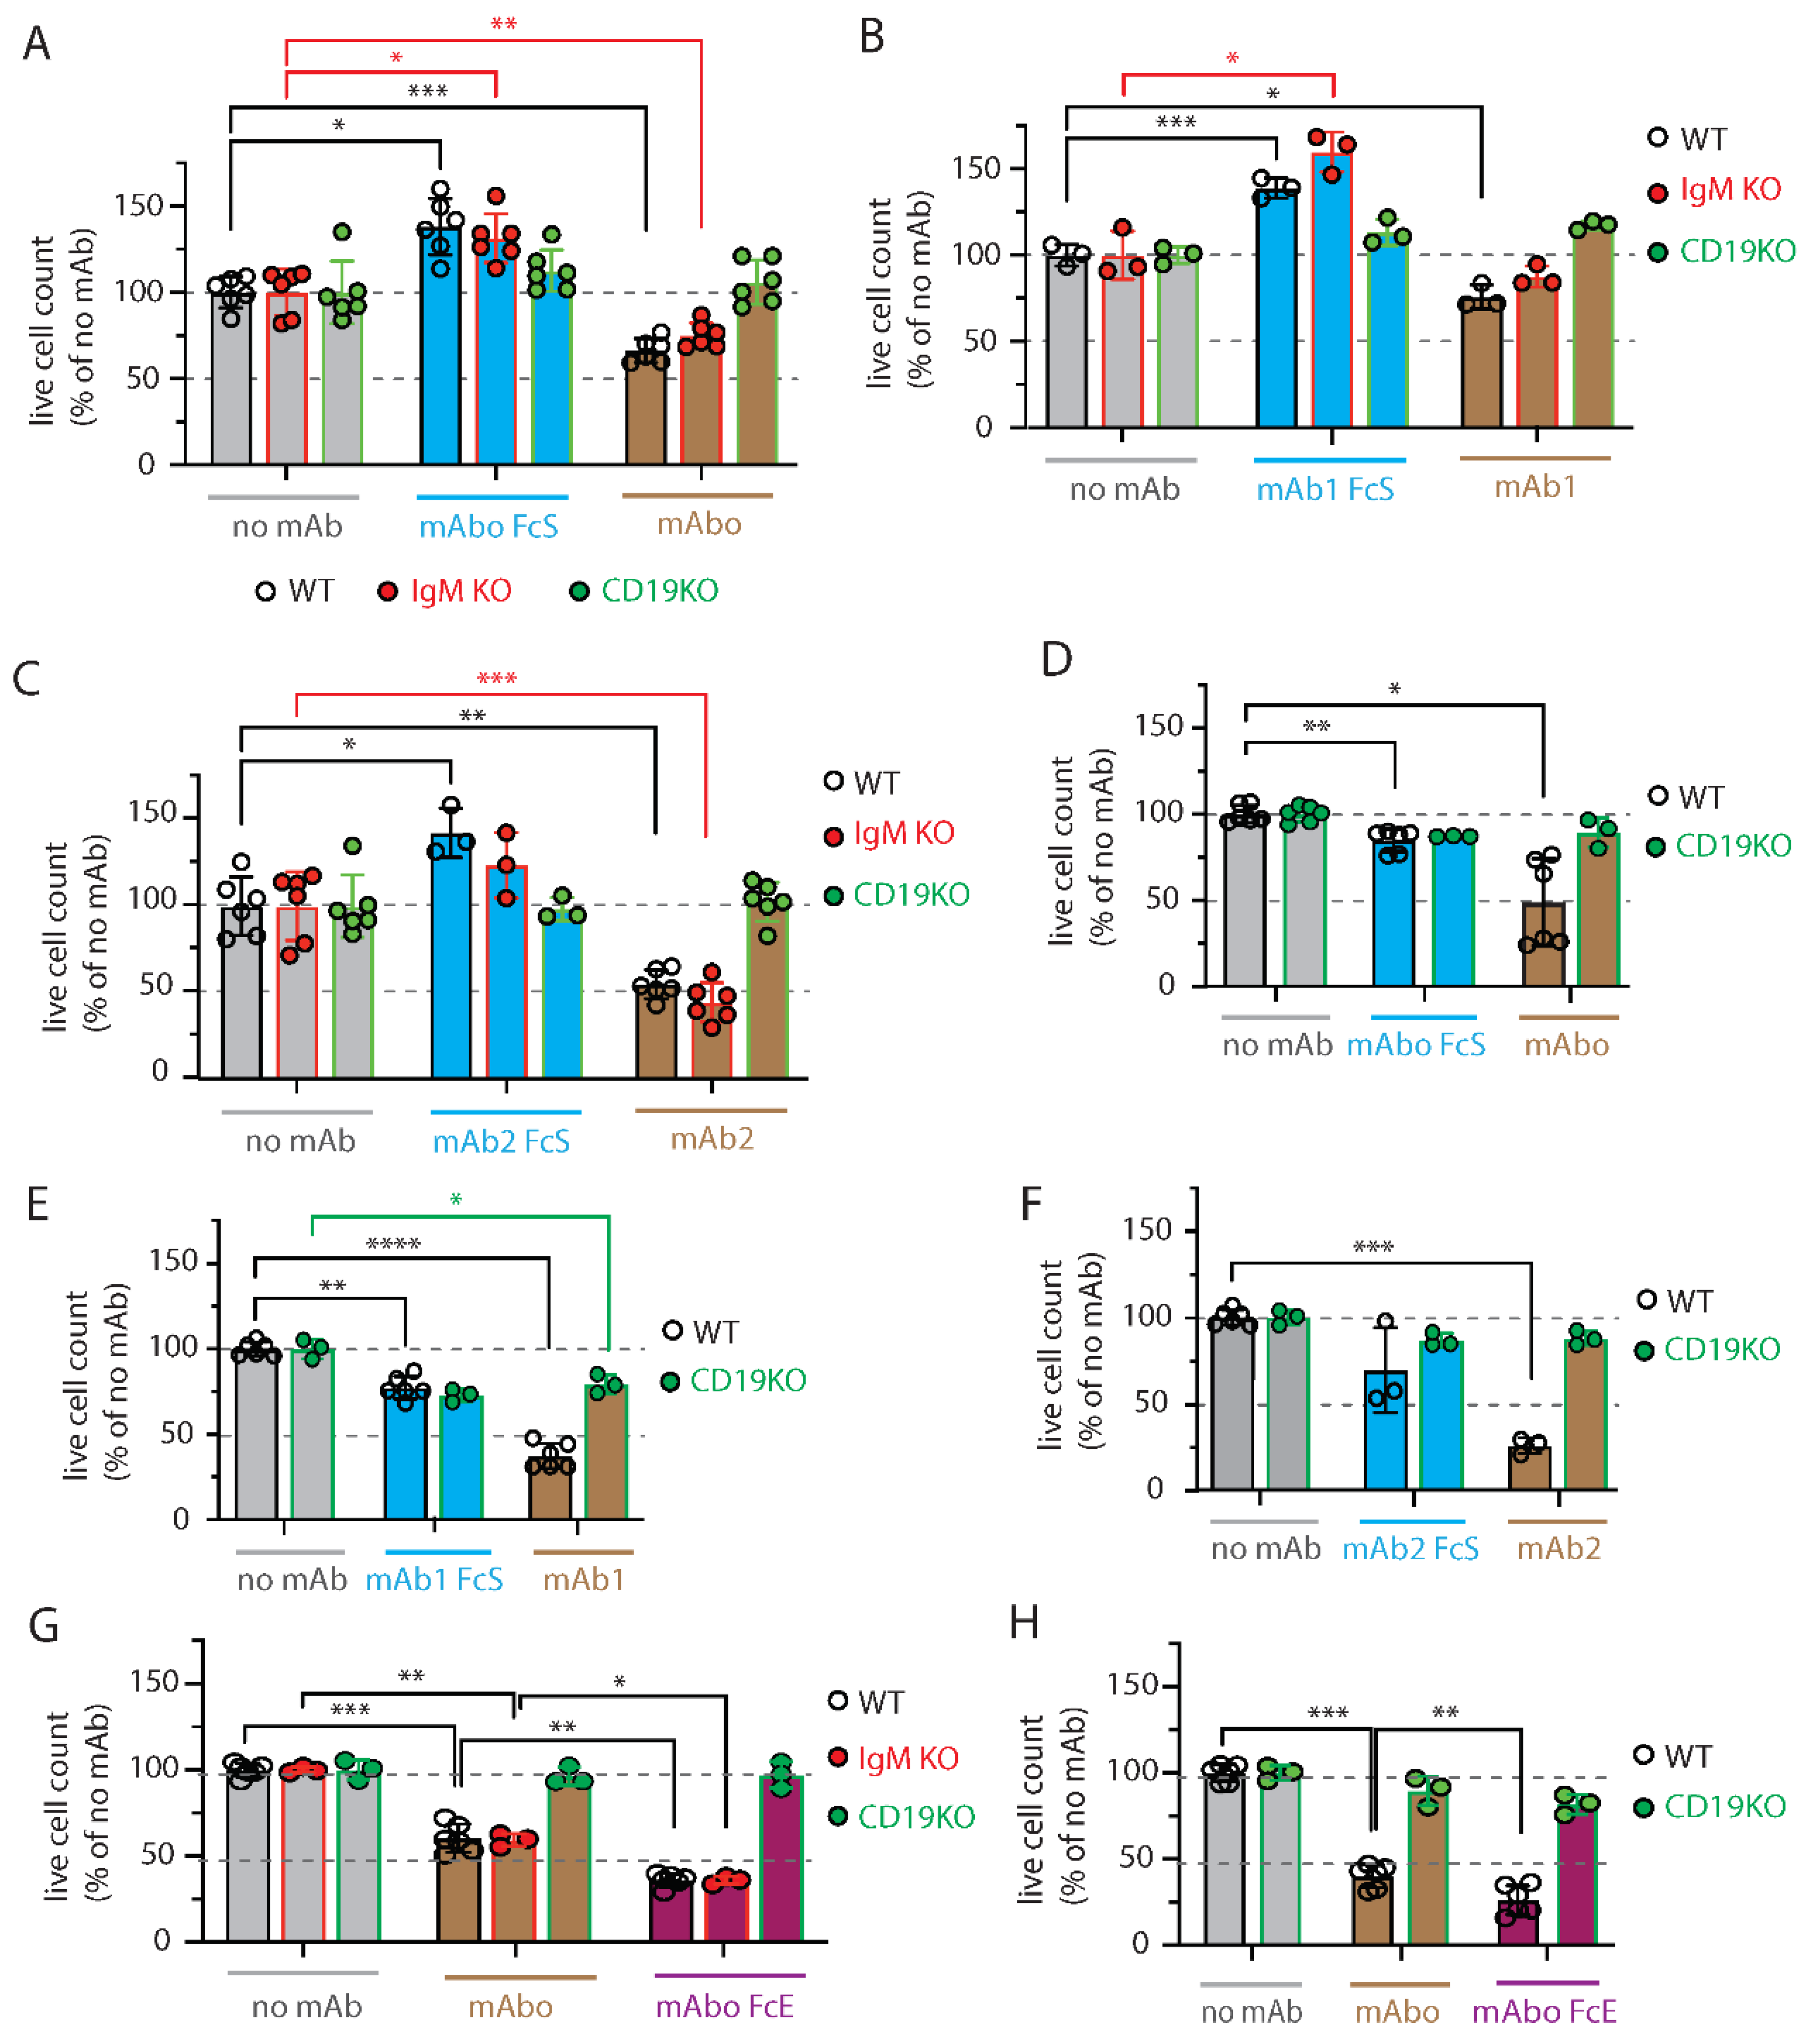
Figure 4.
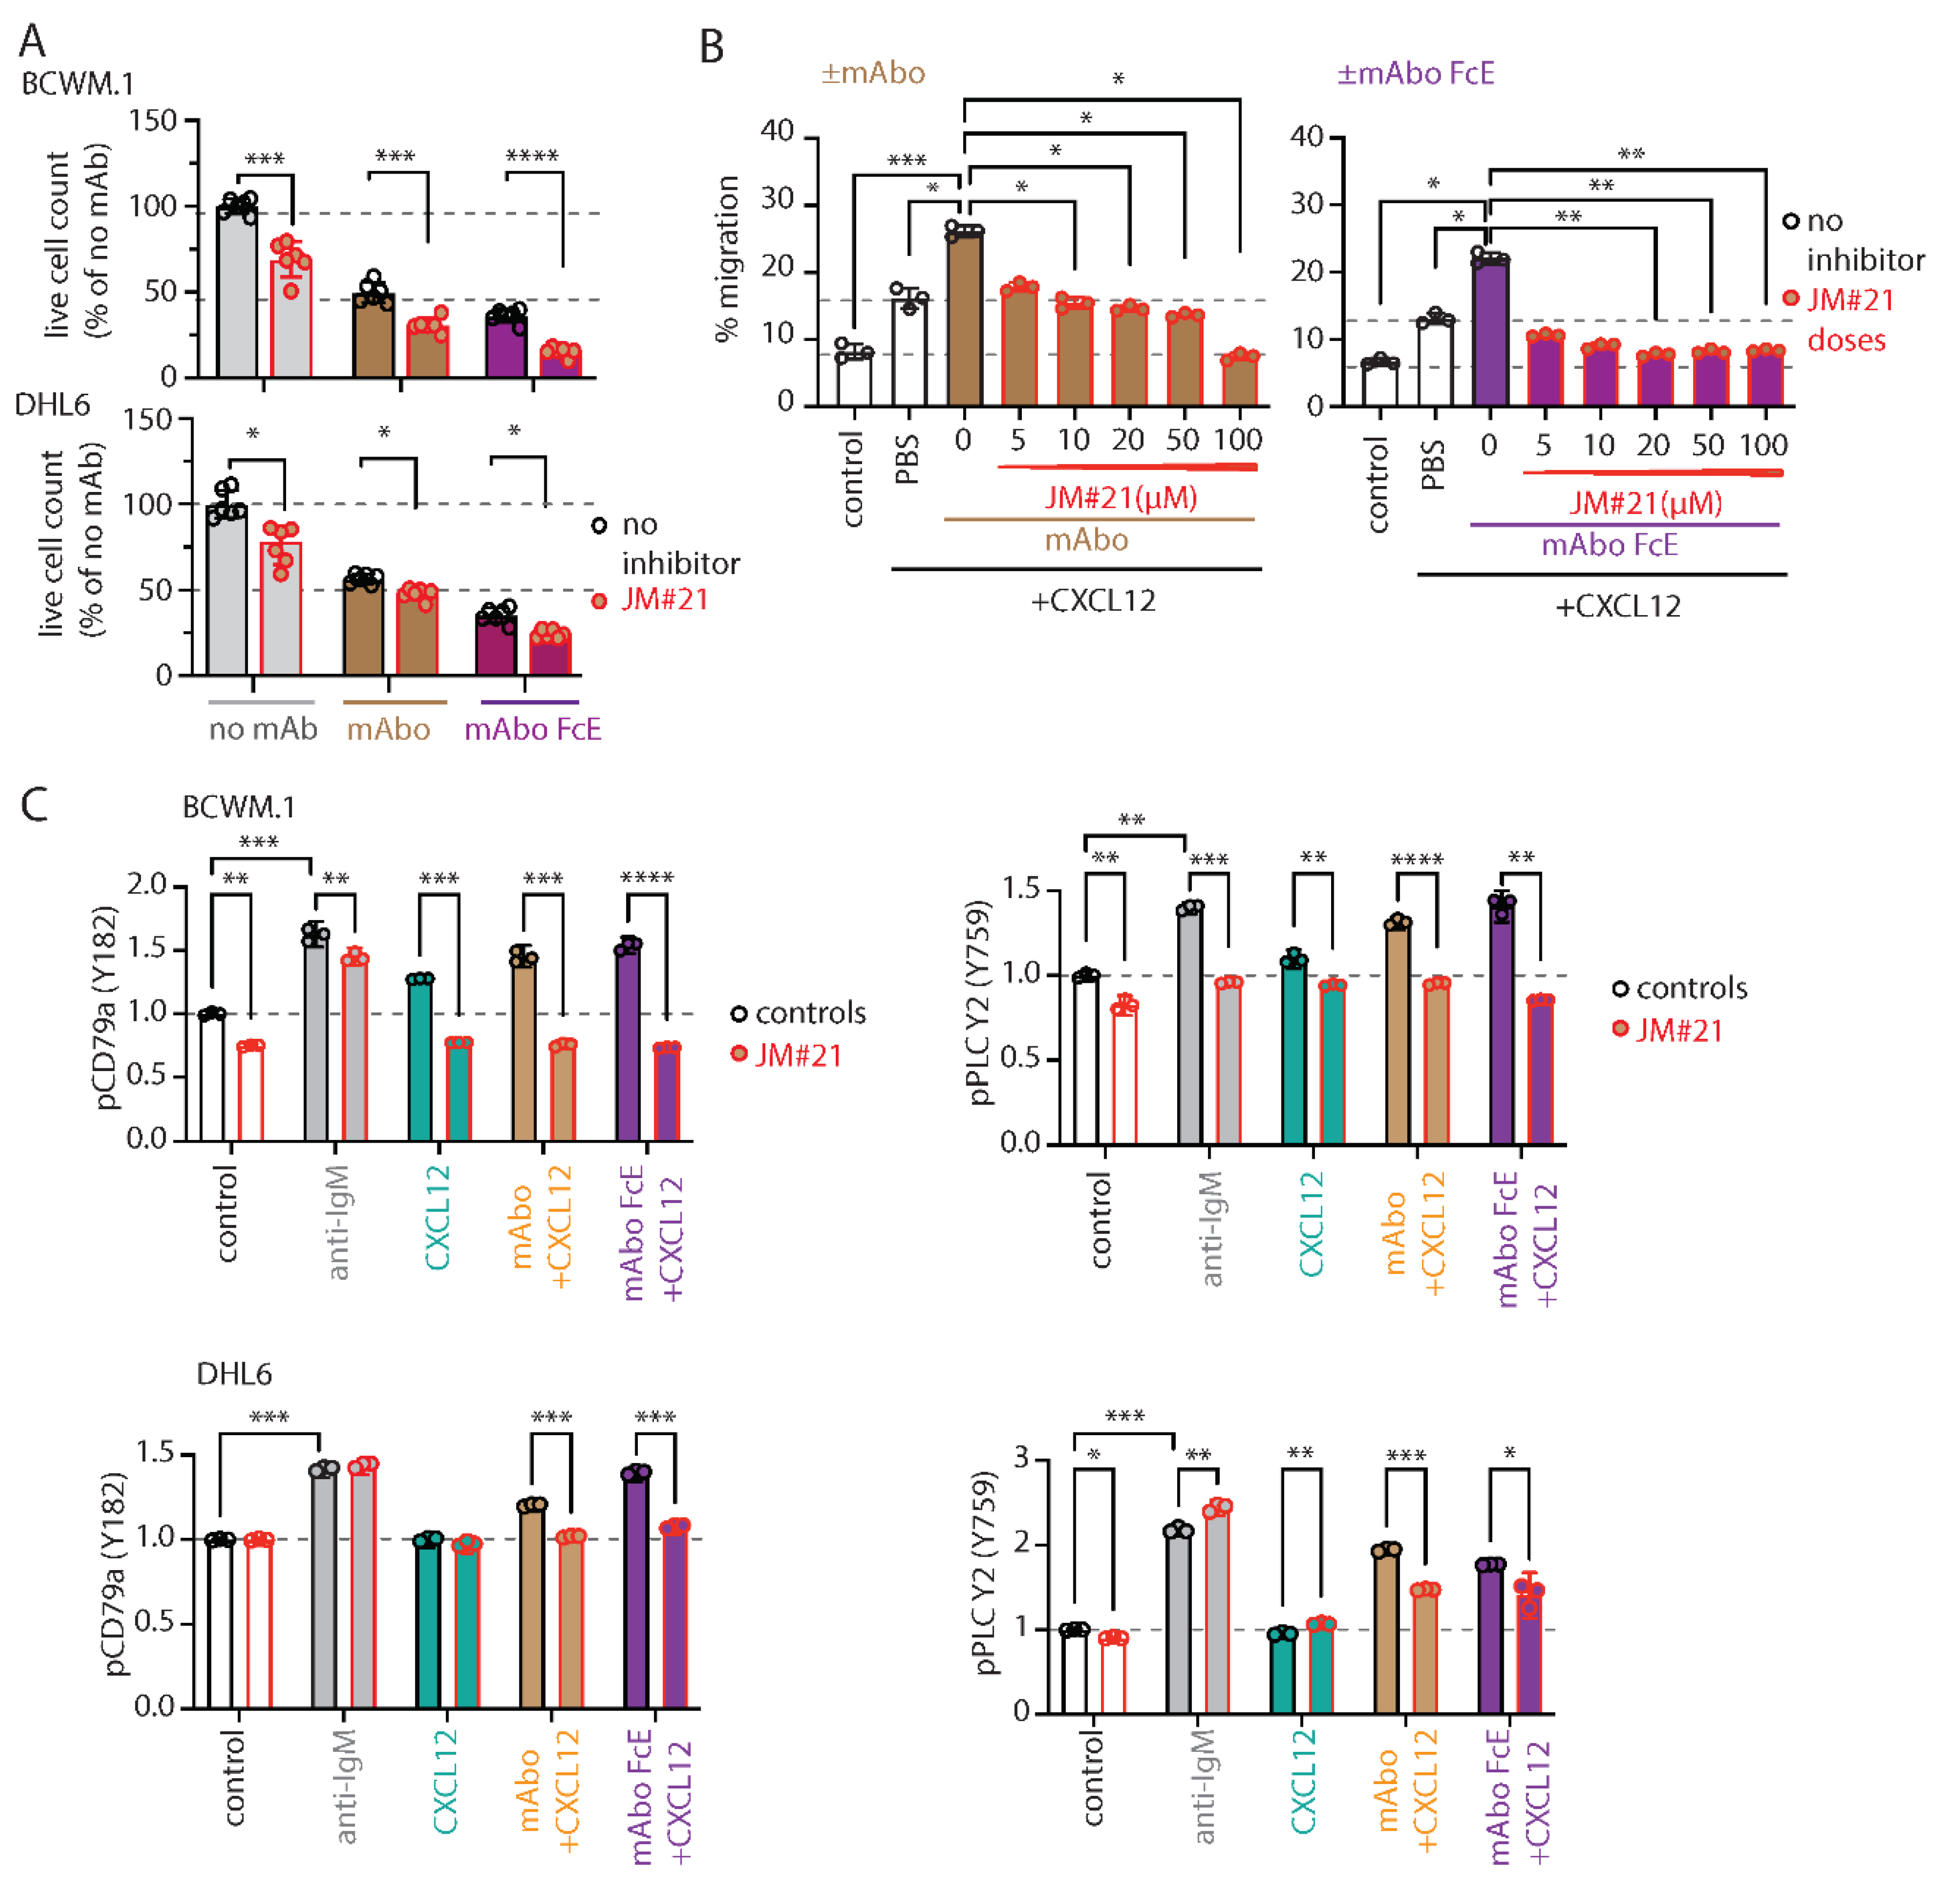
CXCR4 antagonizing peptides enhance CD19 mAbs induced ADCC. A. Quantification of live cell count of BCWM.1 (upper panel) and DHL6 (lower panel) cells in ADCC induced by mAbo (brown bars) and mAboFcE (purple bars) antibodies in absence (black, open circles) and presence of 20µM CXCR4 antagonist peptide JM#21 (red, filled circles). B. Inhibitory dose response of JM#21 on enhanced CXCL12 induced migration of BCWM.1 cells in presence of mAbo (left panel) and mAboFcE (right panel). C. Effect of JM#21 on increased pCD79a (Y182) and pPLCγ2 (Y759) levels in BCWM.1 (upper panels) and DHL6 cells (bottom panels) in response to stimulants - anti-IgM, mAbo + CXCL12 and mAboFcE+ CXCL12 for 5 min. Data in A and C were analyzed by Two-Way ANOVA followed by Dunnett’s multiple comparison, and data in B were analyzed by One-Way ANOVA followed by Dunn’s multiple comparison.
Figure 4.
CXCR4 antagonizing peptides enhance CD19 mAbs induced ADCC. A. Quantification of live cell count of BCWM.1 (upper panel) and DHL6 (lower panel) cells in ADCC induced by mAbo (brown bars) and mAboFcE (purple bars) antibodies in absence (black, open circles) and presence of 20µM CXCR4 antagonist peptide JM#21 (red, filled circles). B. Inhibitory dose response of JM#21 on enhanced CXCL12 induced migration of BCWM.1 cells in presence of mAbo (left panel) and mAboFcE (right panel). C. Effect of JM#21 on increased pCD79a (Y182) and pPLCγ2 (Y759) levels in BCWM.1 (upper panels) and DHL6 cells (bottom panels) in response to stimulants - anti-IgM, mAbo + CXCL12 and mAboFcE+ CXCL12 for 5 min. Data in A and C were analyzed by Two-Way ANOVA followed by Dunnett’s multiple comparison, and data in B were analyzed by One-Way ANOVA followed by Dunn’s multiple comparison.
Disclaimer/Publisher’s Note: The statements, opinions and data contained in all publications are solely those of the individual author(s) and contributor(s) and not of MDPI and/or the editor(s). MDPI and/or the editor(s) disclaim responsibility for any injury to people or property resulting from any ideas, methods, instructions or products referred to in the content. |
© 2024 by the authors. Licensee MDPI, Basel, Switzerland. This article is an open access article distributed under the terms and conditions of the Creative Commons Attribution (CC BY) license (http://creativecommons.org/licenses/by/4.0/).
Copyright: This open access article is published under a Creative Commons CC BY 4.0 license, which permit the free download, distribution, and reuse, provided that the author and preprint are cited in any reuse.


