Submitted:
02 December 2024
Posted:
03 December 2024
You are already at the latest version
Abstract
An actual biological problem is to identify the effect of mycorrhization by fungi of arbuscular mycorrhiza (АМ) on the metabolic profiles of plant roots at the key stages of host plant development. The aim of the study was to evaluate the effect of Rhizophagus irre-gularis inoculation and/or phosphorus treatment on the root metabolome of Medicago lupulina at the stages from the first leaf to the mature fruit. The assessment of metabolic profiles was performed using GC-MS. 327 metabolites were identified: 26 amino acids, 20 carboxylic acids, 14 fatty acids, 58 sugars, sterols, phenolic compounds, etc. The efficient AM is characterized with upregulation of the metabolism of proteins, carbohydrates and lipids, as well as an increase in the content of phosphates. The level of acids of tricar-boxylic acid cycle were generally lower during mycorrhization. For the first time, the lateral branching initiation stage was shown to have a key importance for the development of efficient AM symbiosis. 14 metabolic markers of the efficient AM symbiosis development were identified. The conclusion is that AM significantly improve plant adaptation to low Pi conditions through metabolic alterations.
Keywords:
soil microorganisms
; biochemical networks
; Medicago lupulina
; arbuscular mycorrhiza
; Rhizophagus irregularis
; symbiotic efficiency
; plant development
; physiological stage
; root
; metabolic profile
1. Introduction
Phosphorus, along with nitrogen, is the main macronutrient for plants [1]. But up to 80% of soil phosphorus is immobile and unavailable for plant uptake due to conversion to organic form, precipitation or adsorption [2]. Meanwhile, plants actively absorb the forms of inorganic phosphorus (Pi) available for nutrition: HPO42–, H3PO4 and, mainly, H2PO4–. Moreover, phosphorus mobilization is possible due to the development of proteoid roots in phosphorus deficiency conditions [3]. Such roots produce a significant amount of organic acids (up to 23% of net photosynthesis), acidifying the soil and chelating metal ions. However, in this way plants are able to absorb only 8% of the Pi from the rhizosphere [1,4]. The most powerful mechanism for providing plant organisms with phosphorus is the symbiotic pathway due to the development of arbuscular mycorrhiza (AM) [5].
It is known that AM fungi form the only class of Glomeromycetes of the monophyletic division Glomeromycota [6,7]. They form a symbiosis with more than 80% of terrestrial plant species [5]. Symbiosis with AM fungi allows plants to adapt to low levels of Pi in the soil via several mechanisms: 1) mycelium of the AM fungus increases the absorbent surface of the root 100-fold [5]; 2) AM fungi help the host plant to overcome the depletion zone with a low Pi content with a radius of 1-2 mm at the surface of the root and root hairs [8,9]; 3) the host plant and the mycosymbiont form a developed sphere of interaction with the soil substrate, a zone with a diameter of 10 to 150 mm around the root, called the mycorrhizosphere [9]; 4) in Pi deficiency conditions, phosphorus uptake into the plant is possible mainly due to phosphate transporters of the AM fungus, for example, RiPT7 in Rhizophagus irregularis [10], the expression of plant phosphate transporters [11,12] and H+-ATPases [13] specifically involved in roots with AM increases; 5) AM fungi secrete organic acids [14] and their own phosphatases [15], that allows plants to reduce the resources required for phosphatase activity. In the work of S. Qi et al. it was also found that AM fungi alter the phosphatase activity of plants [16]. It is known that the contribution of inorganic phosphorus uptake by AM fungi through hyphae and arbuscules can reach 90-99% of the total demand of the host plant [17,18,19,20]. Such diverse processes cannot proceed without corresponding changes at the systemic level, which are actively studied using approaches such as transcriptomics, proteomics and metabolomics [21,22,23]. However, at present, the mechanisms of plant adaptation to low Pi levels in the soil have not been fully studied [10].
A significant number of papers have been devoted to the study of metabolic rearrangements of the host plant during mycorrhization. Mechanisms of adaptation to low Pi levels have been studied quite actively on such model plants as: Medicago truncatula [24,25], Anadenanthera colubrina [26], Nightshade lycopersicum [27], etc. Many of the studies contain only an analysis of the vegetation period stages without evaluating the reproductive stages, or vice versa. Only in a small number of species, changes in the metabolome were studied during the long-term development of plants in symbiosis with an AM fungus: Stevia rebaudiana leaves at 69-123 dai [28]; Pisum sativum leaves and roots at 7-110 dai [29,30], M. lupulina leaves at 14-52 dai [31], Solanum lycopersicum shoots and roots at 7-91 dai [32] and at 28–140 dai [33].
Studies are often conducted under conditions of low Pi levels in order to identify the greatest effect of AM fungus on the metabolome of the host plant in the following plant microbial systems (PMS): “Medicago lupulina + R. irregularis” [31,34]; “Sorghum caudatum/S. bicolor + Rhizophagus irregularis/Gigaspora gigantea” [35]; “Malus domestica + Rhizophagus irregularis” [35]; “Coffea arabica + Funnelliformis mosseae” [36]; etc. On the other hand, studies were provided under conditions of high Pi levels in such PMS as: “Triticum durum + mixture of strains of 9 AM fungi species, including R. irregularis” with a weak response to mycorrhization [37]; etc. A promising area of research is the analysis of the development of PMS in conditions of a sufficient Pi level in the substrate. Such conditions can be considered as control conditions, since the lack of Pi is a stress factor that has its own effect on the metabolic profile. Meanwhile, studies related to the development of mycorrhizal plants under conditions of different levels of Pi are few and do not fully reveal the mechanisms of adaptation of mycorrhizal plants to the lack of Pi in the substrate [10,16,38]. Thus, in the study by S. Pu et al. it has been shown the application of phosphorus fertilizer significantly reduces the Mycorrhizal Growth Response (MGR) in Salvia miltiorrhiza during the formation of AM with Glomus versiforme [38]. Concentrations of biologically active compounds (rosmarinic acid, salvianolic acid, dihydrotanshinone, ryptotanshinone), tanshinone I and tanshinone IIA were significantly higher in the roots of S. miltiorrhiza inoculated with G. versiforme under low Pi conditions. When adding phosphorus fertilizer, mycorrhizal response of bioactive compounds was absent [38]. Research by S. Qi et al. in another model system, “Solidago canadensis + Rhizophagus intraradices” showed that phosphatase activity in S. canadensis decreased significantly with the addition of Pi, but did not change with the addition of insoluble phosphorus [16]. In the PMS “Glycyrrhiza uralensis + R. irregularis” it was shown determined that improving phosphorus nutrition under mycorrhization as a result of symbiosis is of paramount importance in regulating the biosynthesis of secondary metabolites (increased accumulation of glycyrrhizin and liquiritin). Moreover, the effect of AM on the growth of the host plant was higher than the application of phosphorus fertilizer in the amount of 140 mg P /kg both by dry weight of stems and roots [39]. In the PMS “Medicago sativa + Funneliformis mosseae” it was demonstrated that mycorrhization intensively increased biomass of aboveground parts, chlorophyll content in leaves and soluble sugars, but excessive phosphorus application restrained the increase in these traits [40].
However, some model plant species may be less suitable to study metabolic rearrangements during mycorrhization. For example, the analysis of PMS “Pisum sativum + R. irregularis (previously referred to Glomus intraradices)” under conditions of different Pi availability showed that under low Pi conditions, a high level of strigolactones in the roots was observed, and under high Pi conditions, even the addition of exogenous strigolactones did not contribute to the restoration of the root colonization level. This indicates that strigolactones are not the only factor involved in the interaction between the plant and the AM fungus, which was almost completely stopped at a very early stage, before the formation of hyphopodia [41]. On the other hand, it is known that the phosphorus level in the soil (high and low Pi) does not affect the species richness and diversity of AM fungi in field experiments in efficient PMS “Daucus carota/Allium cepa + R. irregularis” [42]. In this regard, it is necessary to select precisely model plants with a high response to mycorrhization not only in conditions of low, but also in conditions of high Pi level. Thereby the general concept about AM effect on the host plant metabolic network is absent. The application of metabolomic approach on a responsive model plant will overcome the problem of the functional dependence of the plant on Pi with its low content in the substrate and in the absence of a reaction to mycorrhization in conditions of high Pi content. A study of the effect of various species of fungi on the growth and development of the phytosymbiont, on the content of metabolites in various plant species showed a lack of specificity by species of AM fungi [21,43], but revealed the presence of specificity by plant species [25,29,30,34,44,45,46,47,48]. Therefore, in order to identify the mechanisms of adaptation of the host plant to the Pi level, our team selected a highly mycorrhizalion responsive Medicago lupulina MlS-1 line, characterized by MGR>200-350% depending on growing conditions using the highly efficient AM fungus Rhizophagus irregularis RCAM00320 [31,34,49,50]. The aim of this investigation was to evaluate the effect of Rhizophagus irregularis inoculation and phosphorus treatment on the root metabolome of the Medicago lupulina MIS-1 line throughout key vegetative and reproductive stages from the first leaf development to the mature fruit.
2. Results
2.1. Medicago lupulina MlS-1 Line Plant Development Under Low and High Phosphorus Levels
Firstly the parameters of plant productivity were estimated: plant height, fresh weight of shoots and roots. As a control, the variant with the addition of fertilizer without AM-fungus (AM-P+) inoculation was used since the low Pi level in the substrate in the variant without fertilizer (AM-P-) is inhibitory (Figure S1; [34]), and any of the variants with AM inoculation (AM+P-; AM+P+) appears to stimulate the growth and development of the host plant.
The symbiotic efficiency of AM (MGR), calculated on the height of the main stem (Figure 1A), was reliable under conditions of phosphorus deficiency (P-) at all stages of interest, starting from the stage of third leaf development, characterized by the appearance of the stem. MGR regarding stem height of plants grown under the condition of phosphorus treatment (P+) was significant only at the stage of the third leaf development (3L). MGR calculated on the fresh weight of shoots and roots, generally, did not exceed 50% under P+ conditions, but was significantly higher at the stage of lateral branching (BI) initiation of plants under conditions P- (Figure 1B-1C).
The values of root mycorrhizal intensity in root M, abundance of arbuscules and vesicles in root, A and B, respectively, increased throughout the development of the host plant under P- conditions (Figure 2). But under conditions of optimal phosphorus (P+) supply, all analyzed mycorrhization parameters had a lower value at the third leaf (3L) development and the lateral branching (BI) initiation stages. The most intense differences in the mycorrhization parameters were revealed in the AM+P+ and AM+P variants at the BI stage, which can be attributed to the fact that by this time AM contributes to a significant adaptation of plants to phosphorus deficiency in the soil (it can be seen the highest MGR value in the AM+P variant was observed at the BI stage; Figure 1).
2.2. General Characteristics of Metabolic Profiles
The resulting metabolic profile of M. lupulina roots included 327 metabolites (Figure 3-9). Of these, 92 were identified and 59 more were annotated to a class (pentoses, hexoses, sterols, etc.). These included 26 amino acids, including 18 standard, 20 carboxylic acids, including intermediates of energy metabolism, 14 fatty acids and their derivatives, as well as nitrogenous bases, sterols, phenolic compounds, etc. Sugars and their derivatives were most widely represented in the obtained profiles (58), including pentoses, hexoses and complex sugars.
2.3. Changes in the Root Metabolome During Plant Development
In order to identify and visualize the similarities and differences of the metabolomes, we presented them in smaller spaces obtained using the principal component method (PCA). In Figure 3.A, the AM-/P+ metabolic profiles are presented in the account space of the first two PCs. As well as the first two measurements obtained by the MDS method, conducted at Pearson distances (1-r). The samples are grouped according to the development stages. Along PC1, which explains 33.7% of the disorder, the early stages of development are separated from the later stages (F; MF). Along PC2 (24.1%), the samples are also arranged according to age, but only until the flowering stage. After the transition to fruiting, the vector of changed to the opposite. Thus, developmental processes play a crucial role in determination of the metabolite profile. The most significant changes were revealed during the transition to flowering and fruiting. Therefore, the analysis of metabolomic profiles fully corresponds to the idea of plant development as an uneven and nonmonotonic process, regardless of how optimal the development conditions are.
2.4. The effect of Mycorrhization by AM Fungus and Phosphorus on the Metabolic Profile of Roots. Exploratory Analysis
Since the age of plants severaly affected the profile of metabolites, we examined the metabolic differences between mycorrhizal and control variants (roots) at each point of development separately. The primary PCA revealed common patterns in the similarities of the obtained profiles (Figure 3.B). At the first leaf (1L) stage, the metabolic profiles are grouped according to both the status of mycorrhization and phosphorus. The effect of mycorrhization associated with PC1 was 26%, and phosphorus with PC2 was 19.5%. Thus, at this stage, the influence of both factors is expressed, and it is proportionate. At the stage of the second leaf (2L) the situation changes. In the PC1 space (28%) there are no differences between AM+P+ and AM+P-, AM-P- is maximally distant from these variants, and the AM-P+ is between them. Thus, the effects of phosphorus and mycorrhization are partially similar, and considerably the effect of mycorrhization compensates the lack of phosphorus. The differences between P+ and P- plants are associated with PC3 (12.3%). At the next stage, SI/3L distribution along PC1 is similar, but it already explains 40% of the variance. Thus, the effects associated with mycorrhization have increased. The differences between P+ and P- plants are associated with PC2 (14.3%) that is similar to the previous development stage. Further, at the BI stage, the distribution along PC1 is similar, but it already explains 29.5% of the variance. The effect of phosphorus on mycorrhization is weakly expressed. Some distance between AM+P+ and AM+P- is observed in the PC2 and PC3 spaces. At the flowering stage (F), the effect of phosphorus during mycorrhization was not revealed. AM-P+ plant metabolic profiles were formed along PC1 (29.5%), and AM-P- along PC2 (23.1%). A similar pattern is observed at the mature fruit (MF) stage: also, the effect of phosphorus under mycorrhization is almost not pronounced. AM-P- plants were notable along PC1 (25.7%), and AM-P+ plants along PC2 (23%).
2.5. Identification of Differentially Accumulating Metabolites
One of the most important indicators characterizing the metabolic profile is differentially accumulating compounds. The analysis of the dynamics of this parameter was carried out on the basis of classification by the OPLS-DA method for each stage of development.
Differentially accumulating metabolites in the AM+P+ vs AM-P+ at the 1L stage. 31% of the variance in the content of metabolites was associated with the predictive component, Q2Ypred = 0.81. The results indicate that during this period, the effect of mycorrhiza, even in the presence of phosphorus, in the formation of the metabolite profiles, was significant. Among the differentially accumulating metabolites (DAMs), compounds of various classes are revealed (Figure 4.A). Mycorrhization reduced the content of many carboxylates, including intermediates of the Krebs cycle. Accumulation of several amino acids (aspartate, lysine) and nitrogen metabolism intermediates (putrescine, ornithine) has been shown. An increase in the level of hexoses and sugar phosphates indirectly indicates an increase in the activity of the upper part of glycolysis. At the same time, a number of complex sugars were characterized by multidirectional changes. Mycorrhiza also causes an increase in the level of major sterol campesterol, and C16 free fatty acids (FFA). Whereas, the accumulation of two acylglycerols decreased in comparison with glycerin and its derivatives. Among the secondary compounds, attention can be paid to an increase in the level of quinic acid, a decrease in cinnamic and gallic acids. It turned out that mycorrhization increases the accumulation of phosphates even at an optimal level of phosphorus in the substrate.
Differentially accumulating metabolites in the AM+P- vs AM-P+ variant at the 1L stage. In the OPLS-DA model, 37% of the variance in the content of metabolites was associated with the predictive component, Q2Ypred = 0.88. It can be argued that phosphorus supply and mycorrhization are not metabolically identical, despite similar growth characteristics (Figure S1). DAMs analysis (Figure 4.A) revealed a decrease in the level of tricarboxylic acid cycle (TCA) intermediates: citrate and malate in AM+P-, as in AM+P+. Among other carboxylates, an increase in the accumulation of lactate, malonate and glutarate in AM+P- can be distinguished. The amino acids with an increased content in the AM+P- include glutamine, methionine, tryptophan, only proline was noted to decrease that is consistent with the accumulation of intermediates of amino acids metabolism according to MSEA (Figure 4.B). Among the non-proteinogenic amino acids, the accumulation of β-alanine and ornithine and a decrease in the level of several others (hydroxyiminoacetic and pipecolic acids) can be noted. Other intermediates of nitrogen metabolism, such as urea and putrescine, also had a higher content. Also noteworthy, the accumulation of uracil and the repression of adenine accumulation, which may be related to the activity of pyrimidine base metabolism that is indicated by MSEA. Differences in the pattern of monosaccharide content were few and almost always associated with the suppression of their accumulation, including glucose and fructose. The level of sucrose, as well as a number of other complex sugars (for example, trehalose), was also lower in AM+P-. Serious rearrangements occur in the composition of lipophilic compounds. As in the previous AM+P+ variant, in the case of AM+P- more major palmitic acid and its monounsaturated analog accumulated. However, the level of monoacylglycerols (MG) is significantly reduced. The accumulation of sterols decreases more often than it increases. A greater accumulation of campesterol can be noted. Secondary compounds were also characterized by multidirectional changes. There was an increase in the level of quinic and caffeic acids, pyrogallol, but a decrease in cinnamic and gallic acids. Interestingly, there was no difference in the level of phosphates, which indicates that mycorrhiza, even at this stage, copes well with the supply of phosphorus to the plant. In AM+P, only the level of glycerophosphoglycerol is reduced.
To compare the effects of mycorrhization in the presence and deficiency of phosphorus, the loadings of the predictive components of the corresponding OPLS-DA models were compared (Figure S2). It was found that the effect of mycorrhization is generally similar in both cases (rho=0.58, P<10-16).
Differentially accumulating metabolites in the AM-P- vs AM-P+at the 1L stage. At this stage of plant development, 41% of the variance in the content of metabolites was associated with the predictive component, Q2Ypred = 0.91. It is expected that phosphorus deficiency is more pronounced in the absence of mycorrhization. TCA intermediates (citrate, fumarate and succinate) had a higher level in AM-P-, unlike malate. The lack of phosphorus had a stronger effect on the accumulation of amino acids. Half of the standard amino acids showed a decrease, including glutamate, proline, and phenylalanine. At the same time, the levels of α-alanine and γ-aminobutyric acid (GABA) were reduced. The exceptions were tryptophan, asparagine and glutamine, their accumulation was higher in AM-P-. Other intermediates of nitrogen metabolism, such as urea, putrecin and uracil, also had a higher content. Among monosaccharides, a decrease in glucose and fructose levels can be noted, which is probably due to a decrease in the activity of hexose metabolism. However, the level of sucrose did not differ significantly. As in the previous variant, AM-P- plants accumulated more major palmitic and linoleic acids, and the MG level was reduced. The accumulation of sterols was suppressed. Among the secondary compounds, an increase in the level of 2-furoic and caffeic acids was observed, with a decrease in cinnamic and gallic acids. The level of phosphoric acid did not differ, but the level of several organic phosphates was reduced. Probably, at this stage there are still enough reserves of phosphate obtained from the seed or medium.
Differentially accumulating metabolites at the 1L stage: comparison of effects. To compare the effects of phosphorus deficiency in the presence and absence of mycorrhization, we compared the loadings of predictive components from the corresponding OPLS-DA models (Figure S2). As it turned out, the effects of phosphorus are quite similar (rho=0.45, P<10-16).
Differentially accumulating metabolites in the AM+P+ vs AM-P+ at the 2L stage. 27% of the variance in the content of metabolites was associated with the predictive component, Q2Ypred = 0.87 (P<0.05). As shown in Figure 5.A, mycorrhization with sufficient phosphorus content causes a greater accumulation of amino acids, nitrogen-containing compounds, hexoses and some complex sugars, sterols, phosphorylated forms of glycerol and phosphates. It is possible to separately note the higher content of aromatic amino acids and secondary compounds during mycorrhization. However, mycorrhization suppressed the accumulation of carboxylates, especially those associated with TCA. Also, without mycorrhiza, there was a greater accumulation of FFA and acylglycerols. MSEA (Figure 5.B) showed that in case of optimal phosphorus supply, the development of AM symbiosis causes repression of the accumulation of metabolites associated with TCA and carboxylate metabolism, moderate activation of amino acid-related pathways, activation of monosaccharide metabolism.
Differentially accumulating metabolites in the AM+P- vs AM-P+ at the 2L stage. 35% of the variance in the content of metabolites was associated with the predictive component, Q2Ypred = 0.83. The replacement of phosphorus with mycorrhiza (Figure 5.A) led to a decrease in the level of TCA intermediates such as 2-ketoglutarate, succinate and lactate, but not fumarate and glycolate. The levels of most amino acids and nitrogen-containing compounds also increased, which probably indicates the activation of appropriate pathways (Figure 3B). In addition, the accumulation of sterols was noted. Among the FFA, an increase in the level of 16:1 can be distinguished with a decrease in the levels of several other FFA and acylglycerols. Sugars showed multidirectional patterns of differences, but the main sugars glucose, fructose and sucrose did not show such differences. But the level of trehalose was increased. Higher relative levels of phosphates of both inorganic and organic phosphorus were found in AM+P- plants. As it turned out, the effect of mycorrhization under phosphorus deficiency and abundance (Figure S3) is quite similar (rho=0.61, P<10-16), pointing to intense effect of mycorrhization on black medick metabolism. Its main features are stimulation of the accumulation of amino acids and sterols, as well as a change in the pattern of accumulation of sugars.
Differentially accumulating metabolites in the AM-P- vs AM-P+ at the 2L stage. In this variant, 33% of the variance in the content of metabolites was already associated with the predictive component, Q2Ypred = 0.83. As shown in Figure 5.A and 5.B, there was a deficiency in the accumulation of TCA intermediates, as well as several other carboxylates. Amino acids have shown different trends. Thus, among the standard amino acids, glutamine, asparagine and tryptophan showed an increase in accumulation, but the levels of aspartate, glycine, proline and tyrosine were reduced. Attention is drawn to the lower content of GABA and the increased level of aminoadipate and aminomalonate. Sterols and FFA showed a downward trend. Together with a decrease in the level of glycerol phosphate, this indicates a repression of glycerolipid metabolism. The level of fructose is reduced. Complex sugars, including sucrose, have shown a general trend towards higher content during phosphorus starvation. The exception was trehalose.
Differentially accumulating metabolites at the 2L stage: comparison of effects. A comparison of the effects of phosphorus starvation in the absence of mycorrhization (AM-P+ vs AM-P-) and when phosphorus is replaced by mycorrhization (AM-P+ vs AM+P-) showed that they are not fully similar (Figure S3, rho=0.02, P=0.78). But it can be assumed that mycorization neutralises the effects of starvation.
Differentially accumulating metabolites in the AM+P+ vs AM-P+ at the SI/3L stage. 45% of the variance was associated with the class difference at the 3rd leaf stage, which is higher than at the previous stage Q2Ypred = 0.90. As shown in Figure 6, mycorrhization under optimal phosphorus content causes a reduction in the accumulation of metabolites associated with TCA, the metabolism of pyruvate and other carboxylates. Symbiosis with the AM fungus causes multidirectional changes in the accumulation of amino acids. The accumulation of metabolites associated with the synthesis of amino acids, the metabolism of glycine, serine, threonine and tyrosine is somewhat reduced. But the accumulation of methionine, lysine, and leucine increases. The level of some other intermediates of nitrogen metabolism increases, such as ornithine, putrescine, etc. Mycorrhization stimulates the accumulation of sterols, including major stigmosterin and campeterin. The effect of mycorrhization on the accumulation of FFA, acylglycerines and secondary metabolites was relatively weak or even repressive. A complex multidirectional dynamics of sugar accumulation was noted: a certain decrease in glucose accumulation and stimulation of trehalose. Higher levels of phosphates, phosphorylated forms of glycerol and sugars were detected during mycorrhization.
Differentially accumulating metabolites in the AM+P- vs AM-P+ at the SI/3L stage. The results obtained indicate that 37% of the variance was associated with the predictive component, Q2Ypred = 0.88. As can be seen in Figure 6, mycorrhization combination with phosphorus deficiency also suppresses the accumulation of carboxylates, but not as intensively as in the previous varient (AM+P+). There was a decrease in the intermediates of TCA: malate and succinate. As in the previous variant, there was a repression of glycine, serine and threonine metabolism with an increase in leucine accumulation. A decrease in methionine, proline and valine was found. You can pay attention to the greater accumulation of key amino acids such as glutamine, glutamate and GABA. The accumulating nitrogen-containing compounds include ornithine and putrescine. AM inoculation still stimulated the accumulation of sterols. Among the FFA, a greater accumulation of unsaturated FFA should be noted. Whereas, the level of the sterol acid and two acylglycerols was lowered, as in the previous variant. The pattern of influence on the accumulation of sugars was complex, but at the same time similar to the action of mycorrhiza in the presence of phosphorus. Interestingly, mycorrhization again stimulated the accumulation of phosphates even with phosphorus deficiency.
Differentially accumulating metabolites in the AM-P- vs AM-P+ at the SI/3L stage. In this model, 42% of the variance in the content of metabolites, Q2Ypred = 0.92, was associated with the predictive component. As can be seen in Figure 6.A, there are much fewer carboxylates among DAMs than was observed when analyzing the effect of mycorrhization. Only 2-ketoglutarate showed a decrease, while citrate showed an increase. Glycerin and its derivatives also showed a decrease. Phosphorus deficiency had a great negative effect on the accumulation of amino acids and nitrogen-containing compounds. The accumulation of sterols was observed. Herewith, the FFA were characterized by different trends. The accumulation of monosaccharides was generally suppressed. Separately, an increase in sucrose levels can be noted.
Differentially accumulating metabolites at the SI/3L stage: comparison of effects. Comparison of the effects of mycorrhization under deficiency and optimal phosphorus supply (Figure S4) confirms their high similarity (rho=0.68, P<10-16). A comparison of the effects of phosphorus starvation in the absence of mycorrhization (AM-P- vs AM-P+) and when phosphorus is replaced by mycorrhization (AM+P- vs AM-P+) showed that they are absolutly not similar (Figure S4, rho=0.1, P=0.07), as at the previous stage.
Differentially accumulating metabolites in the AM+P+ vs AM-P+ at the BI stage. 38% of the variance was associated with the predictive component, Q2Ypred = 0.85. The interaction of AM fungus with alfalfa again suppressed the accumulation of intermediates of TCA and other carboxylates, but to a lesser extent (Figure 7). Nevertheless, we note a slight decrease in the level of 2-ketoglutarate, succinate and glycolate. The main feature of the mycorrhiza influence at this stage is the stimulation of the accumulation of nitrogen metabolism intermediates and standard amino acids, which is probably due to the intensification of their metabolism and protein synthesis. The response to mycorrhization and the pattern of sterol accumulation differed. Attention is drawn to the increase in campesterol and the decrease in cumoestrol. Among the FFA, an increase of 16:0, 16:1 and 18:1 was noted. With a lower accumulation of glycosides in AM+P+, the content of sucrose and trehalose increased along with glucose, fructose and other hexoses. As at other stages of development, mycorrhiza contributed to a greater accumulation of phosphates.
Differentially accumulating metabolites in the AM+P- vs AM-P+ at the BI stage. 40% of the variance was associated with the predictive component, which is slightly lower than at the previous stage, Q2Ypred = 0.92. As shown in Figure 7, mycorrhization under phosphorus deficiency, as usual, helps to suppress the accumulation of carboxylates, in particular: fumarate, succinate, malate and glycolate, with the exception of 2-ketoglutarate, the level of which increased. The data obtained may indicate the repression of the decarboxylation reaction. The AM+P- plants were characterized by an increase in the level of amino acids and nitrogen metabolism intermediates, but, unlike the previous variant, their number was not large: β-alanine, leucine, tryptophan and putrescine. In addition, there is a trend towards increased accumulation of sterols and FFA, for example, monounsaturated fatty acids (FA). Herewith, the 16:0 major pool did not show significant differences. Among the sugars, higher levels of sucrose and trehalose can be noted, but glucose and fructose did not differ. As in other cases, mycorrhiza contributed to a greater accumulation of phosphates, including the phosphorus deficiency cases.
Differentially accumulating metabolites in the AM-P- vs AM-P+ at the BI stage. It was found that 33% of the variance was associated with the predictive component, Q2Ypred = 0.81. AM-P- plants also had a lower accumulation of carboxylates (Figure 7). Among the TCA intermediates, the accumulation of malate and fumarate was suppressed, but the level of 2-ketoglutarate increased. The level of glycerol and its derivatives also decreased, which is probably due to the suppression of the level of glycerol-lipid synthesis. The content of several amino acids, including GABA, β-alanine, serine, threonine and aspartate, was reduced. A very small number of amino acids and other nitrogen-containing molecules accumulated, for example, asparagine, glutamine and putrescine. Also, the AM-P was characterized by a pronounced regression of carbohydrate metabolism, observed by a decrease in the level of a large number of monosaccharides and glycosides. In this variant (AM-P-), as in other cases, the plants contained less phosphate and phosphorylated glycerol and sugars.
Differentially accumulating metabolites at the BI stage: comparison of effects. Comparison of the effect of mycorrhization under deficiency and optimal phosphorus supply (Figure S5) confirms their significant similarity (rho=0.52, P<10-16), as at the previous stages. However, the effects of phosphorus starvation in the absence of AM fungus (AM-P- vs AM-P+) and phosphorus replacement by mycorrhization (AM-P+ vs AM+P-) had very little similarity (Figure S5, rho=0.18, P=0.02), which is slightly different from the previous stage.
Differentially accumulating metabolites in the AM+P+ vs AM-P+ at the F stage. During the further stage of development, 43% of the variance was associated with the predictive component, Q2Ypred = 0.87. Figure 8 shows that mycorrhization once again leads to the suppression of the accumulation of carboxylates, including malate and succinate, which is probably due to the repression of TCA and the total exchange of oxocarboxylates. The differences in amino acid accumulation were weak. Worth mentioning a decrease in the level of Branched-Chain Amino Acids (BCAA) metabolism. Together the levels of glutamine, glycine, GABA and β-alanine increased. The content of many nitrogen-containing compounds has also increased, including such important ones as, for example, putrescine. Complex sugars, in particular trehalose, increased accumulation during mycorrhization. At the same time, the level of sucrose did not differ, as well as glucose and fructose. The remaining monosaccharides showed multidirectional trends. These include the repression of hexose metabolism. It is also necessary to note the trends towards an increase in the content of sterols, acylglycerols and FFA. As usual, mycorrhization led to an increase in phosphate pools.
Differentially accumulating metabolites in the AM+P- vs AM-P+ at the F stage. In this comparison pair, 42% of the variance was associated with the predictive component, Q2Ypred = 0.84. In the absence of phosphorus supply (Figure 8), 2-ketoglutarate is characterized by a higher level, but the accumulation of other TCA participants (fumarate and succinate) was suppressed. On the contrary, several amino acids and other nitrogen-containing compounds accumulated, for example, tryptophan, GABA, β-alanine, putrescine. Sugars showed various patterns, including some repression of hexose metabolism. There was a greater accumulation of sterols and acylglycerols, as well as monounsaturated C16 and C18 FFA. As in the earlier stages, mycorrhization contributed to the accumulation of phosphates.
Differentially accumulating metabolites in the AM-P- vs AM-P+ at the F stage. The value of the variance (Q2Ypred = 0.89) associated with the predictive component was 47%. As at the previous stage, phosphorus starvation led to an increase in the level of 2-ketoglutarate, and a decrease in the level of fumarate, malate and some other carboxylates. Mostly, the amino acid levels were reduced. But the content of glutamine, alanine and a small number of other nitrogen-containing compounds, including ornithine and putrescine, increased. Along with this, there was a pronounced repression of the metabolic pathways of monosaccharides. Among related lipophilic compounds, an increase in the accumulation of cumoestrol, acylglycerols and linoleic acid can be distinguished. It was noted that in AM-P-, as in other variants, the plants contained less phosphate and phosphorylated compounds.
Differentially accumulating metabolites at the F stage: comparison of effects. Comparison of the effects of mycorrhization under deficiency and optimal phosphorus supply (Figure S6) confirms their very high similarity (rho=0.82, P<10-16). A comparison of phosphorus starvation in the absence of mycorrhization (AM-P- vs AM-P+) and in its presence (AM+P- vs AM-P+) showed that the effects are significantly and fairly similar (Figure S6, rho=0.55, P<10-16), which differs from the previous stage.
Differentially accumulating metabolites in the AM+P+ vs AM-P+ at the MF stage. At the last stage, at the reproductive stage of development of the host plant, 29% of the variance was associated with the predictive component, which corresponds to the very beginning of development (Q2Ypred = 0.77). As shown in Figure 9, the effects of mycorrhization on the accumulation of carboxylates significantly weakened, malate accumulation and a decrease in 2-ketoglutarate were observed. The level of amino acids is sharply increased, which is probably due to the repression of protein synthesis (the exception is a decrease in tyrosine levels), and perhaps with increased proteolysis. There was no effect on the FA level. But there were some differences in the accumulation of sterols. The content of complex sugars decreased, but the level of trehalose was higher, and the level of sucrose did not differ from its level in AM-P+ plants. The accumulation of phosphates was noted during mycorrhization.
Differentially accumulating metabolites in the AM+P- vs AM-P+ at the MF stage. 31% of the variance was associated with the predictive component, Q2Ypred = 0.75. At this stage, mycorrhization under the absence of phosphorus application stopped to have an effect on the accumulation of carboxylates. While, amino acids accumulated in greater quantities (Figure 9), with the exception of tyrosine. The level of complex sugars has been reduced. The level of sterols decreased more often, including stigmasterol. Unlike the previous stages, mycorrhization under phosphorus deficiency did not contribute to the growth of the phosphate pool.
Differentially accumulating metabolites in the AM-P- vs AM-P+ at the MF stage. Phosphorus deficiency was associated with 39% of the variance, Q2Ypred = 0.82. Phosphorus deficiency in the absence of mycorrhiza was associated with a large accumulation of fumarate and succinate with a decrease in 2-ketoglutarate. The accumulation of amino acids and nitrogen-containing compounds was relatively high in this case as well (Figure 9). It is noteworthy that there was no effect on lipid metabolism. The accumulation of sugars has been suppressed. And the lack of phosphorus no longer leads to a smaller accumulation of phosphorus.
Differentially accumulating metabolites at the MF stage: comparison of effects. Comparison of the effects of mycorrhization under deficiency and optimal phosphorus supply (Figure S7) confirms their high similarity of metabolomic profiles (rho=0.76, P<10-16). At the last stage, a common feature of the influence of both mycorrhization and phosphorus is the trend towards increased accumulation of amino acids and suppression of sugar accumulation, and, consequently, greater physiological activity in plants, which may indicate a faster aging of AM-P+ plants. Unlike the previous development stage, at the MF stage, AM-P- plants were characterized by repression of carbohydrate metabolism in the roots. The distribution of amino acids was different, which showed multidirectional trends. Thus, GABA, asparagine, phenylalanine and lysine showed high levels in AM-P-, and β-alanine, tryptophan in AM+P+ plants. AM+P+ plants contained more Pi and phosphorylated glycerol and sugars. It is also necessary to note the increase in the accumulation of succinate and some other carboxylates with a lack of phosphorus and the absence of mycorrhization.
The difference in correlations. To identify the effect of mycorrhization on the functional relationships of pools in the process of ontogenetic changes, the metabolite was mapped by strong correlations of the average values of their concentrations at each time point (the stage of development of the host plant). Figure 10 shows graphs where the nodes correspond to metabolites, and the edges correspond to a strong correlation (r>0.9). The graphs were constructed in such a way that positive bonds attract metabolites in proportion to the correlation value. The networks differ both in appearance and characteristics (Table S1). A common feature for all graphs is the distribution of the number of neighbors similar to the power distribution. Networks demonstrate heterogeneity. In addition, there are more positive relationships in all networks than negative ones, and the ratio of the number of positive to the number of negative ones increases in the absence of mycorrhiza and/or phosphorus deficiency. Besides, AM- and/or P- plants tend to have networks with a smaller diameter and radius. It is also interesting that the absence of mycorrhiza or phosphorus deficiency leads to an increase in the average number of neighbors, and a decrease in the characteristic path length, an increase in the clustering coefficient, network density, at the same time, the combination of AM-/P- leads to the opposite effect. Thus the nework structure differs significantly. Two large clusters are expressed in AM+ networks. Nitrogen-containing compounds and sterols are concentrated in the left cluster. While, in AM+/P+, this cluster consists of two regions, “sterol” and “amino acid”. In the right cluster, mainly sugars and FA are combined. Carboxylates are located in both clusters. Carboxylates from the initial part of the TCA (citrate, 2-ketoglyctarate) were found together with sugars and FA, and carboxylates from the final part of the TCA (malate, succinate, fumarate) were found together with amino acids. In the absence of mycorrhiza, they were more heterogeneous. On the left, the AM-/P+ group has separated with sterols, amino acids and other nitrogen intermediates are distinguishable. On the right, the cluster was divided into two parts: one with a predominance of glycosides and FA, and the second with monosaccharides.
In order to determine the similarity of the structure of functional relationships, the variants were clustered according to the correlation values for all pairs of metabolites (Figure 10, dendrogram). It turned out that AM+/P+ and AM+/P- are the closest, which indicates a relatively low effect of phosphorus availability in the presence of mycorrhiza. The absence of mycorrhiza has a greater effect, especially with phosphorus deficiency.
3. Discussion
It is known, that the role of AM symbiosis in ensuring plant growth and development is especially important under the influence of various environmental stress factors [5]. In order to determine the mechanisms of development of effective AM, studies are carried out mainly with a deficiency of basic macronutrients: nitrogen [37], potassium [51] and especially phosphorus [26,27], since AM fungi are able to significantly enhance the phosphate nutrition of plants. Under Pi deficiency conditions, sensitive plants to this stress factor show significant phenotypic differences from development under optimal phosphate nutrition conditions: 1) reduced leaf blades size and reduced photosynthetic activity; 2) reduced plant height and productivity; 3) weak branching; 4) delayed developmental stage (Figure S1) [31,34,50,52]. In the presented study, as a result of analysis under conditions of deficiency and optimal Pi level in the substrate, it was shown that the fresh weight of both aboveground parts and roots was significantly lower under Pi deficiency conditions without inoculation with the AM-fungi (AM-R-) (Figure S1). Meanwhile, the phenotype of the host plant returns to normal ones under AM fungus inoculation conditions.
It is well known that any phenotypic changes are due to the possibility to develop various adaptive processes, including at the metabolic level. To date, a fairly large number of data has been accumulated using conventional biochemistry methods, as well as modern methods of metabolic profiling. They indicate a large range of reactions of primary and secondary metabolism [24,25]. Of particular interest are the metabolic rearrangements that can be detected in the roots of the host plant during the development of symbiotic relationships with an effective and ineffective AM fungus [43,53]. It is noted that the intensity of these rearrangements depends on the efficiency of the symbiotic plant-fungus association [43]. It should be assumed that the most pronounced effects of AM on the root metabolome can be expected when using an effective plant-microbial system when conducting a comparative analysis of development under conditions of deficiency and optimal phosphorus levels in the substrate for plant nutrition. Unfortunately, there are no experimental works with this kind of analysis during the main key vegetative and reproductive stages. Therefore, our study was aimed at a longitudinal (from the 1st leaf stage to the formation of mature fruits) analysis of the intensity of growth and development of the host plant using various variants of the AM fungus effect with different levels of phosphate supply from the soil using the highly efficient PMS “Medicago lupulina + Rhizophagus irregularis”. The closest studies are the following: weakly efficient PMS “Stevia rebaudiana + R. irregularis” at 69-123 day after inoculation (dai) with different Pi treatment [28]; inefficient PMS “P. sativum + R. irregularis” at 7-110 dai [29,30]; efficient PMS “M. lupulina + R. irregularis” at 14-52 dai [31], at 14-24 dai [34]; PMS “Solanum lycopersicum + R. irregularis” at 7-91 dai [32], at 28-140 dai [33]; weakly efficient PMS “Salvia miltiorrhiza + Glomus versiforme” at 120 dai with different Pi treatment [38]; efficient PMS “Solidago canadensis + R. intradices” at 45 dai [16]; efficient PMS “Glycyrrhiza uralensis + R. irregularis” at 90 dai with different Pi treatment [39]; efficient PMS “Medicago sativa + Funneliformis mosseae” at 93-134 dai with different Pi treatment [40] and PMS “M. truncatula + R. irregularis” at 7-63 dai [10]. However, in the vast majority of these studies under different Pi supply, there is no detailed analysis of primary metabolites, or PMS is insufficiently effective for studying metabolic rearrangements in different Pi availability conditions. In the present study in the PMS “M. lupulina + R. irregularis” it was shown that plants with AM were characterized by higher levels of monosaccharides (hexose), comlex sugars, lipids (campesterol and a number of sterols) and phosphates (phosphate, methyl phosphate); the content of FA varied greatly depending on the stage of the plant; the content of some acids of the TCA cycle was significantly lower during mycorrhization (Figure 4-9). It was previously shown that the roots of AM plants at 14-24 dai had a higher content of the following compounds: monosaccharides (hexose, for example); comlex sugars; lipids (campesterol, other sterols); phosphates (phosphate, methyl phosphate). The content of some TCA cycle acids was also lower during mycorrhization [34]. Thus, the metabolic profiles of roots obtained using GC-MS in this study are generally consistent with the data obtained by us at the early stages of AM development [34].
As a control, for which changes in the intensity of metabolic processes were calculated, we chose the variant without AM fungus inoculation under conditions of an optimal level of Pi (AM-P+), since it was assumed that under conditions of optimal phosphate supply, alfalfa plants would demonstrate development maximally regulated by endogenous factors. The phosphorus deficiency in the absence of AM caused significant changes in metabolic profiles, mainly of a repressive nature (Figure 4-9). Only at the first leaf stage, Medicago lupulina plants enhanced protein metabolism, that corresponds to the general deterministic development of legumes. Protein biosynthesis and carbohydrate metabolism in AM-P- vs AM-P+ plants were characterized by significant downregulation. Generally, under stress conditions (AM-P-), pronounced repression of the monosaccharide metabolic pathways was observed (Figure 4-9). On the other hand, plants under stress (AM-P-) tended to positively regulate the metabolism of pyruvate and TCA acids at all developmental stages of the host plant. Lipid metabolism had a pronounced negative regulation in AM-P- plants. The level of fatty acids such as FA 16:0, 16:1, 17:0, 18:0, 18:1, 18:2, 18:3, 20:0 was, tend, significantly lower in AM-P- plants up to and including the FL stage. In AM-P- vs AM-P+ plants, reduced GABA levels were observed with increased levels of aminoadipate and aminomalonate (for example, 2L stage) with general repression of glycerolipid metabolism. These data are consistent with previous studies [23].
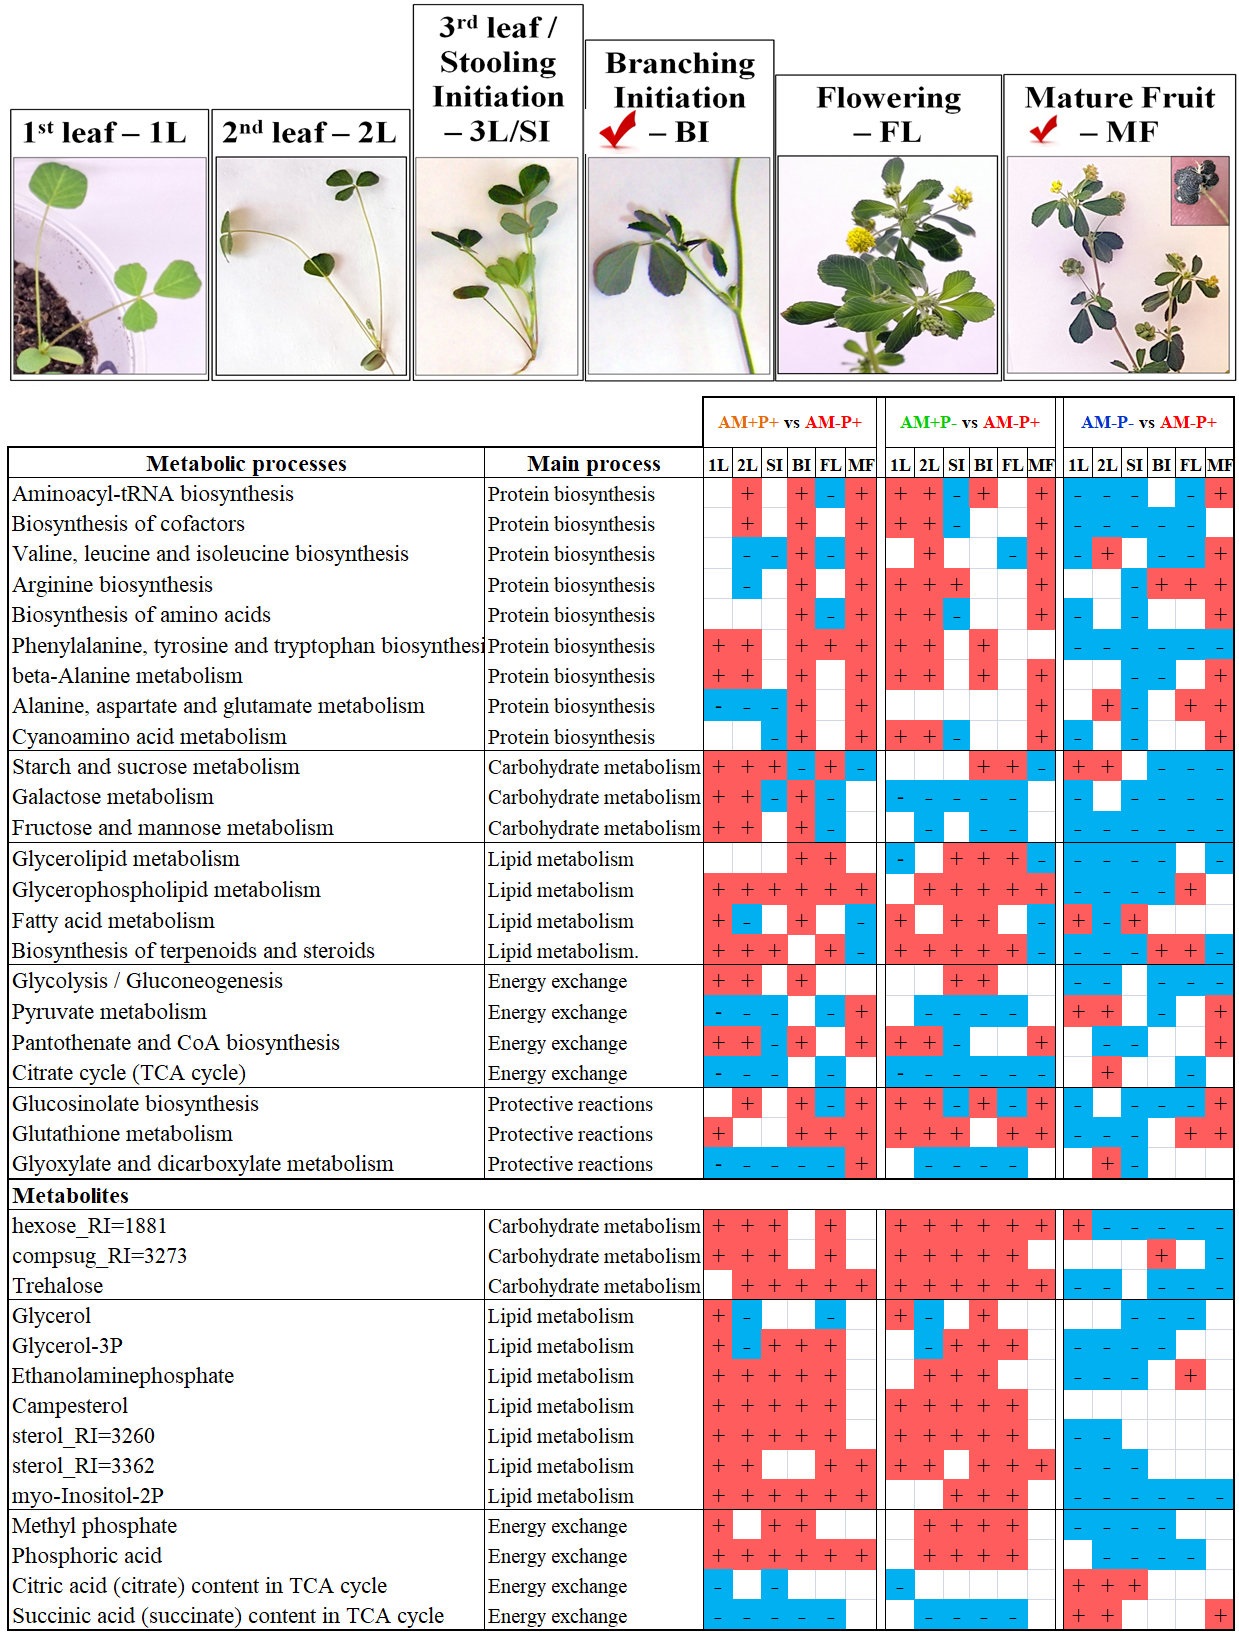
Let us further consider the metabolic rearrangements in the roots of the host plant caused by the AM development (AM+P-, AM+P+). Previously, it was demonstrated that in the presence of phosphorus in the soil and during the AM development, the most intensive plant development was observed [39,40,54]. The key metabolic rearrangements in AM+P+, AM+P-, AM-P- vs AM-P+ plants are shown in Figure S8. Sugars were widely represented in the obtained metabolic profiles of the roots of AM+P+ plants (Figure 4-9). It was shown for the first time that AM significantly suppressed the formation of carboxylates, but stimulated the growth of metabolites such as glycerin, phosphates and starch in M. lupulina roots.
AM upregulates protein biosynthesis. Analysis of key metabolic rearrangements in AM+P+, AM+P- vs AM-P+ plants (Figure S8) showed that AM plants were characterized by positive regulation of protein biosynthesis: aminoacyl-tRNA biosynthesis, cofactor biosynthesis, biosynthesis of proteinogenic amino acids (valine, leucine, isoleucine, arginine, phenylalanine, tyrosine, tryptophan), metabolism of alanine, aspartate, glutamate, cyanoamic acid were enhanced. AM+P+ plants had positive regulation of all groups of amino acids presented at both the BI and MF stages. At the same time, under Pi deficiency conditions (plants AM+P-), mycorrhization led to an increase in the biosynthesis of proteinogenic amino acids in earlier phases, already beginning from 1L and 2L stages. The SI stage in both variants (AM+P+ and AM+P-) was characterized, on the contrary, by significant negative regulation of most processes associated with protein biosynthesis. Under stress conditions in the AM-P, all stages, except MF, were characterized by significant negative regulation of protein biosynthesis processes. According to the literature data in the PMS “Anchusa officinalis + R. irregularis” mycorrhization also led to an increased content of aspartic and glutamic acids in the roots [55]. The effective PMS “Allium cepa + Funneliformis mosseae + F. constrictum + Gigaspora margarita + R. irregularis” showed an increased content of the following amino acids in shoots: phenylalanine, isoleucine, leucine, histidine, lysine, methionine, threonine, valine, as well as glycine, arginine, aspartic acid, serine, glutamic acid, cysteine, alanine, tyrosine and proline [56]. In the PMS “Solanum lycopersicum + R. irregularis/F. mosseae” the content of asparagine, glutamic, aspartic and pyroglutamic acids in the roots was higher during mycorrhization, but these plants were characterized by lower levels of phenylalanine, tyrosine, tryptophan, alanine and leucine [27]. Thus, the effect of the AM fungus on the amino acid content in the host plant largely depends on the type of host plant.
AM upregulates the biosynthesis of carbohydrates. It was shown that the content of trehalose was significantly higher at all 6 developmental stages in the roots of AM+P- plants and at 5 developmental stages in the roots of AM+P+ vs AM-P+ plants (only had the same level at 1L stage). This is easily explained and is associated with the predominantly fungal origin of trehalose formed by the AM fungus in the mycorrhizal roots of the host plant [57]. At the 1L and 2L stages, increased regulation of galactose, fructose, mannose, sucrose, and starch metabolism was observed in AM+P+ vs AM-P+ plants. It is noteworthy, that the addition of phosphorus fertilizer (AM-P+) led to a more active metabolism of galactose, fructose, mannose and sucrose than mycorrhization (AM+P-). hexose_RI=1881, compsug_RI=3273, trehalose (Figure S8) can act as marker metabolites of carbohydrate metabolism for the development of efficient AM symbiosis with positive regulation. A similar AM-induced enhancement of protein and carbohydrate biosynthesis was obtained in studies on other plants: M. truncatula [24], Solanum lycopersicum [58], Sorghum caudatum and S. bicolor [43]. In the PMS “M. truncatula + R. irregularis”, an increased level of amino acids (aspartic and glutamic acid, lysine) was observed in AM plants with unreliable differences in sugar levels both under conditions of deficiency and with a sufficient Pi level [24]. On the other hand, in the inefficient PMS “Vitis vinifera + R. irregularis” mycorrhization led to negative regulation of sugars [23]. In the PMS “Solanum lycopersicum + R. irregularis” and “Solanum lycopersicum + F. mosseae”, upregulation of amino acids (aspartic and glutamic acid, histidine) was observed [58]. Very interesting data were obtained on highly efficient PMS “Sorgum caudatum + R. irregularis” and “Sorgum bicolor + R. irregularis” and inefficient PMS “Sorgum caudatum + Gigaspora gigantea” and “Sorgum bicolor + Gigaspora gigantea” [43]. Thus, under Pi deficiency at 30 dai, highly efficient PMS showed upregulation of carbohydrates (galactose, glucose, fructose, sucrose, trehalose), as well as TCA (citrate, succinate, fumarate and malate) with negative regulation of GABA and a number of proteinogenic amino acids (serine, lysine, threonine, tyrosine, aspartic acid, glycine, glutamine, valine, leucine, isoleucine) [43]. Inefficient PMS “Sorgum caudatum + Gigaspora gigantea“ and ”Sorgum bicolor + Gigaspora gigantea” were characterized by reverse regulation of all listed metabolites, except also positive regulation of sucrose [43]. The presented data are consistent with the results of our study in the PMS “M. lupulina + R. irregularis”, obtained approximately at the same time point (at 28 dai = 28 DAS) at the SI stage, characterized by a significant decrease in the upregulation of metabolism of amino acids, carbohydrates and lipids up to the negative regulation of some metabolites. This comparison indicates the importance of dynamic analysis of PMS “Sorgum caudatum + R. irregularis”, “Sorgum bicolor + R. irregularis”, “Sorgum caudatum + Gigaspora gigantea” and “Sorgum bicolor + Gigaspora gigantea” with the inclusion of analysis at the next developmental stage (at ~35 dai). An analysis of the literature data showed that studies have revealed some features of the AM effect on carbohydrate and amino acid metabolism in the roots of the host plant with a deficiency and a sufficient Pi level, but so far the features of the dynamics of lipid metabolism and energy metabolism have not been fully disclosed with the efficient AM symbiosis development.
AM upregulates lipid biosynthesis. The metabolism of glycerolipids, glycerophospholipids and fatty acids had a predominant positive regulation during mycorrhization both under low Pi conditions and under conditions of its sufficient level (AM+P+ and AM+P-, respectively; Figure S8). The largest number of probable marker metabolites for the development of efficient AM symbiosis was revealed in the group of lipid metabolism: glycerol, glycerol-3P, ethanolaminephosphate, campesterol, sterol_RI=3260, sterol_RI=3362, myo-Inositol-2P (Figure S8). The level of fatty acids such as FA 16:0, 16:1, 17:0, 18:0, 18:1, 18:2, 18:3, 20:0 was, as a rule, higher in plants AM+P+ and AM+P-. In general, in AM+P+ vs AM-P+ plants AM causes a greater accumulation of phosphorylated forms of glycerol and phosphates, amino acids, nitrogen-containing compounds, hexoses and some complex sugars, as well as sterols. Surprisingly, AM+P- vs AM-P+ showed a higher relative phosphate level of both inorganic and organic phosphorus (for example, 2L stage). Note that in the inefficient PMS “Vitis vinifera + R. irregularis” mycorrhization also led to significant positive regulation of certain fatty acids (C16:1, C18:2, C18:3, C20:4, C20:5) [23]. Lipids are known to stimulate the growth and branching of the mycelium of the AM fungus [59]. Actually, all fatty acids contained in fungal lipids are probably derived from host plants (since AM fungi lack de novo cytosolic fatty acid synthase genes; [60]), although they may not be present in fungi in the form in which they were originally obtained. Lipids are the main source of organic carbon delivered to the fungus [61]. Moreover, some lipids act as triggers regulating the development of AM fungi. However, the mechanisms by which AM fungi import lipids are still unknown [59]. Thus, the AM fungus can import both the acyl and glycerol parts of 2-monoacylglycerols exported from plants [62], but it remains unclear whether 2-monoacylglycerols can be directly imported or they are hydrolyzed in the periarbuscular space to free fatty acids and glycerol, or converted to other compounds before import. Besides, fatty acids (C16:1, C15:0, C14:0) are able to stimulate significantly the development of fungal spores [63,64]. In addition, such lipid biosynthesis enzymes (AM specific) as FatM and RAM2 are necessary for effective AM symbiosis. FatM increases the outflow of 16:0 fatty acids from plastids for subsequent RAM2 use to produce 16:0 β-monoacylglycerol, which is transferred to the AM fungus through the periarbuscular membrane [65].
The effect of AM on energy metabolism has multidirectional trends. During mycorrhization, an increase in glycolysis and biosynthesis of pantothenate and cofactor A (AM+P+ and AM+P-, respectively; Figure S8) was observed. But the metabolism of pyruvate and TCA acids was repressed during mycorrhization in both variants. It has been shown that, both at early and late developmental stages, downregulation of TCA cycle is observed, including in AM+P+ (Figure 4-9). Worth mentioning, that earlier we also showed the repressive effect of mycorrhization on the metabolites of the Krebs cycle (citrate, succinate, malate and fumarate levels) under Pi deficiency conditions at the early stages of AM symbiosis development from 14 to 24 DAS [34]. The reason for this may be the inhibition of the early stages of the Krebs cycle, as well as the intensification of transamination reactions, leading to rapid depletion of the ketoacids pool. This may be due to activation of mitochondrial and plastid metabolism during mycorrhization [24,66], the negative effect of AM symbiosis on central catabolism. The content of citric acid (citrate), 2-ketoglutaric acid, glutamic acid, succinic acid (succinate), fumaric acid (fumarate) at the 1L, 2L, 3L/SI stages is reduced most of all in AM+P+ plants. In AM+P- plants, content is also reduced at the key developmental stages, except for the content of 2-ketoglutaric acid, an increased content of which was observed at the BI and FL stages. The negative regulation of TCA cycle has previously been shown in the roots in the efficient “M. truncatula + R. irregularis” PMS (primarily for fumarate and cisaconate) also at 42 dai [24], as well as for citric acid, isocitric acid, fumaric acid, malic acid in inefficient dicots PMS [25]: in “M. truncatula + R. irregularis” the content of citrate, succinate, fumarate and malate was reduced, and in the “Plantago major + R. irregularis” PMS the content of isocitrate was reduced. Positive AM regulation of TCA cycle in Plantago lanceolata, Plantago major, M. truncatula, Veronica chamaedrys, Pisum sativum, forming an inefficient symbiosis with R. irregularis has not been observed [25,29]. Negative AM regulation of TCA cycle was also observed under conditions of deficiency and a sufficient level of Pi in the substrate in the “M. truncatula + R. irregularis” PMS [24]. Similar data (reduced levels of citric acid, succinic acid, malic acid) were previously also obtained in leaves in the “Lotus japonicus + F. mosseae” PMS at 70-84 dai under Pi deficiency conditions [67]. Interestingly, in the “Vigna radiata + Claroideoglomus etunicatum” PMS (a salt-sensitive plant genotype was used) under salt stress (100 mM NaCl) at 15-70 DAS, it was shown that the level of malic acid in the leaves was lower during mycorrhization in the absence of stress, but, conversely, higher during mycorrhization under salt stress [68]. The opposite reaction (positive regulation of TCA cycle) was obtained in the roots of monocot cereal (Poaceae) in the “Poa annua + R. irregularis”, “Hordeum vulgare + Glomus sp.” PMS [69], which may be due to differences in the metabolism of dicotyledonous and monocotyledonous plants. Thus, cereals (Poaceae) are characterized by lower AM colonization of roots compared to dicotyledonous species, which is consistent with the results of other studies [70]. Differences in colonization levels may reflect opposite strategies for obtaining nutrients. For example, according to [71], monocotyledonous species allocate more resources to the development of the root system, and dicotyledonous plants (including M. lupulina) develop more symbiotic structures. Thus, under conditions of high Pi levels in cereal PMS “Triticum durum + a mixture of strains of 9 species of AM fungi (including R. irregularis)” with a weak response to mycorrhization [37], it was shown that inoculation reduced the concentration of most compounds in all metabolic pathways in roots, especially amino acids and saturated FA, while the activity of amination in the roots decreased, most likely due to the transition from the biosynthesis of common amino acids to the biosynthesis of GABA [37]. In addition, positive AM regulation of TCA cycle may probably play a role in the activation (for citric acid, succinate) and suppression (for cis-Aconitate, α-ketoglutarate, fumarate) of the immune responses [72]. Thus, in the “T. aestivum + R. intraradices” PMS, an increased level of citric acid (as well as succinic acid) in the leaves was observed with the addition of As, but the level of pyruvic acid under stress was significantly lower [73]. An increased level of tricarboxylic acids (fumaric acid, malic acid) was observed during salt stress in leaves in the “Zea mays + F. mosseae” PMS [74]. In the AM absence under the salt effect, an increased level of succinic acid was observed in the T. aestivum leaves with a reduced level of citric acid, cis-aconitate, fumaric acid and malic acid [75]. It is known that under salt stress, all TCA enzymes are inhibited by salt. But this inhibition is overcome by increasing the activity of the GABA shunt, which provides an alternative carbon source for mitochondria, bypassing salt-sensitive enzymes, which promotes enhanced respiration [75]. TCA metabolites can play an important role in chelation of metals and nutrients, redox regulation, can bind signaling proteins, serve as precursors of phytohormones, and can also be regulated by them [76]. Thus, the analysis of organic acids of the TCA should be detailed, evaluated depending on the developmental stage and the influence of certain stresses. Interestingly, the AM fungus affects both the glyoxylate pathway and the GABA shunt pathway of the TCA cycle. Increasing the enzymatic activity of the GABA shunt is one of the strategies of AM plants for the predominant synthesis of GABA, rather than proline, from a common precursor, glutamate [68]. Nevertheless, a detailed analysis of the developmental stages of M. lupulina conducted by us showed that a significantly increased GABA content in the AM+P+ and AM+P- vs AM-P+ in the roots of M. lupulina was observed only at the FL and MF stages (Figure 4-9). Thus, phosphates methyl phosphate and phosphoric acid can act as marker metabolites of energy metabolism for the development of efficient AM symbiosis with positive regulation, and succinate and, to a lesser extent, citrate with negative regulation (Figure S8).
Key metabolic rearrangements during the change of the host plant developmental stage. The results of the study showed that during the transition to each subsequent stage, the largest number of changes in the metabolism of key processes (Figure S8) were characterized by BI and MF stages (stage transitions 1L-2L, 2L-SI and BI-FL on average had ~1.5 times fewer changes in metabolic profiles than SI-BI and FL-MF transitions). Since, changes from the FL to the MF stage are primarily associated with a difference in the aging processes of the host plant, and not with AM symbiosis, only one transition, from the SI to the BI stage (the beginning of lateral branching), is associated with critical changes in AM, both under conditions of low and high Pi level. The symbiotic efficiency was maximal under conditions of a low Pi level (AM+P-) at the branching initiation (BI) stage, which is consistent with previously obtained data [31]. But the symbiotic efficiency under phosphorus supply to the substrate (AM+P+) was minimal during this stage (Figure 1), which is shown for the first time. These data correlate with high rates of mycorrhization (M, A, B) at the BI stage in AM+P- plants and low values of these parameters in AM+P+ plants at the 3L/SI and the BI stage (Figure 2). Probably, with the development of lateral branching (BI) in plants, multidirectional metabolic rearrangements occur under conditions of a low and sufficient level of Pi in the substrate for plant nutrition. In particular, during the transition from the 3L/SI to the BI stage, M. lupulina plants under an optimal Pi level (AM+P+) showed an increase in protein biosynthesis, carbohydrate metabolism (galactose, fructose and mannose), lipid metabolism, pantothenate and CoA biosynthesis, there was no increase in the biosynthesis of steroids and terpenoids, and under Pi deficiency in AM+P- plants, no significant increase in the biosynthesis of proteinogenic amino acids was observed. On the contrary, there was an increase in starch and sucrose metabolism with negative regulation of galactose, fructose and mannose metabolism, and AM+P- plants were characterized by increased lipid metabolism while maintaining significant activity of steroid and terpenoid biosynthesis (Figure S8). Meanwhile, many works are aimed at research at the late developmental stage: in Lotus japonicus at 84 dai [67]; Plantago lanceolata, P. major, Veronica chamaedrys, M. truncatula, Poa annua at 62 dai [25]; Senecio jacobaea at 70 dai [77]; Vitis vinifera at 60 dai [23]; Withania somnifera, Tagetes erecta at 90 dai [78], Glycyrrhiza glabra at 180 dai [78], Elymus nutans, E. sibiricus at 85 dai [79]; Leymus chinensis at 127 dai [80] On the other hand, there are very few studies covering the effect of a wide range of stage transitions of the host plant during the AM development on the metabolome [24,28,29,30,31,32,33]. Only in a study [10] it was shown that approximately at the BI stage (at 42 dai), the gene expression of both the fungal RiPT7 transporter and the plant phosphate MtPT4 transporter was greatest in the “M. truncatula + R. irregularis” PMS, which is consistent with the highest AM efficiency obtained in our study in the “M. lupulina + R. irregularis” PMS. In this regard, it can be concluded that the BI stage has not yet been considered as a stage determining critical metabolic rearrangements in the development of efficient AM symbiosis.
The effect of mycorrhization and phosphorus on the metabolite relationships. The analysis of the relationships between the components is an important aspect of systemic biological research. Correlation analysis is often used to assess how closely metabolites are related [81]. Since, stimuli cause changes in the activity of transporters and enzymes binding pools of metabolites, this, in turn, will be reflected in their correlation patterns [82,83,84]. It is known, that correlation patterns are specific to organs and tissues [85,86], to the genotype, including point mutations [86] and to environmental conditions [87,88,89]. Clustering of variants based on the similarity of correlations of average values (Figure 10, dendrogram) showed that mycorrhizal plants were the most similar to each other, and non-mycorrhizal plants were close to them under fertilizer supply conditions. The most peculiar were non-mycorrhizal plants with phosphorus deficiency. Thus, mycorrhization is the most important driver determining the pattern of metabolite relationships in the context of development. The fact that plants without mycorrhiza, but with sufficient phosphorus levels, turned out to be closer to mycorrhizal ones, indicates that the effects of mycorrhiza on metabolic connections are associated with the phosphorus supply to the plant.
Mapping of metabolites by strong correlations is often used to analyze and visualize the correlation pattern. To reveal the AM influence on the structure of interrelations of metabolite levels dynamic changes during development, they were mapped by strong correlations of their average content at each time point. The networks differ both in appearance (Figure 10) and in characteristics (Table S1). This indicates significant functional differences between the variants. The networks turned out to be similar in structure to scale-free networks. This pattern is often found in the analysis of biological systems. A characteristic feature of such networks is heterogeneity [90]. In our case (Figure 10), heterogeneity manifested itself in the fact that two large clusters are expressed in AM+ networks. Nitrogen-containing compounds and sterols are concentrated in one of the clusters; in the case of AM+P+, this cluster forms two regions. The other cluster contains mainly sugars and FA. The TCA cycle intermediates did not form a single group. Carboxylates from the initial part of the TCA cycle turned out to be together with sugars and FA, and carboxylates from the final part of the TCA cycle turned out to be together with amino acids. The formation of clusters in the correlation networks by compounds related metabolically observed regularly [29,86,88,89]. Under AM-, networks became less homogeneous, in particular, the group with sterols separated. In AM-P+ plants in the right cluster, one region was distinguished – with a predominance of glycosides and FA, and the second – with monosaccharides.
Interestingly, the AM+P- and AM-P+ networks differed in the largest number of edges. For AM+P+, the number is less by a quarter, and for AM-P-, it is almost half as much. Correlations are the result of a combination of all reactions and regulatory processes [82,83,84]. This suggests that this is due to stricter regulation under only mycorrhization or only P deficiency. A characteristic feature of the networks was the predominance of positive correlations (Table S1). Positive correlations are observed in various biological systems, including: roots and leaves of arabidopsis [85], human tumor cell cultures [89], microalgae cultures [91]. The reason for the high positive correlation may be, on the one hand, proximity to equilibrium and a high level of metabolic flow [82,92]. On the other hand, negative correlations between metabolite levels are determined by the energy conservation law [83]. The ratio of the number of positive to the number of negative correlations increases under AM absence and/or under phosphorus deficiency. Interestingly, the lowest ratio of positive and negative correlations is typical for AM+P+ plants. This may be the result of an intense metabolism between the plant and the fungus. It is known that in exchange for macronutrients (mainly phosphates), AM consumes up to 20% of photoassimilated carbon [5]. With a more intense outflow of photoassimilates, there may be some metabolites deficiency, which determines a large proportion of negative correlations.
4. Materials and Methods
4.1. Plant and Fungus Biomaterials
Medicago lupulina MlS-1 line, characterized by high AM symbiotic efficiency (Mycorrhizal Growth Response, MGR), was used under conditions of deficiency (starvation) or abundance of Pi (treatment by phosphorus fertilizer). The efficient strain RCAM00320 Rhizophagus irregularis was isolated in the Laboratory No. 4 of Ecology of Symbiotic and Associative Rhizobacteria at All-Russia Research Institute for Agricultural Microbiology, ARRIAM; the strain was previously known as strain CIAM8 Glomus intraradices Shenck&Smith. The strain forms a highly efficient AM symbiosis with most crops [93,94,95,96] and was identified by members of the author’s team [97]. R. irregularis is an obligate symbiont of plants, therefore the culture of AM fungus was grown in Plectranthus australis in Laboratory No. 4 at ARRIAM. The preparation of the AM fungal inoculant was described earlier [31]. To inoculate one M. lupulina seedling, a fragment of the P. australis root with ~100 vesicles of the AM fungus was used.
4.2. Experimental Design and Plant Growth Conditions
A mixture of soil and sand (2:1) for cultivation was treated in an autoclave at 134℃, 2 atm. for 1 h with repeated treatment in an autoclave after 2 days. The details of the experiment were described earlier [31]. Agrochemical characteristics of the soil: sod-podzolic loam-poor soil with a very low phosphorus content (P2O5 – 23 mg/kg); K2O – 78 mg/kg; organic matter content – 3.64%; pHKCl – 6.4, pHH2O – 7.3. To simulate sufficient phosphorus nutrition of plants, phosphorus fertilizer in the form of CaH2PO4*2H2O was introduced into half of the pots before the experiment, according to the prescription of D.N. Pryanishnikov [98]. The final phosphorus content in the soil-sand mixture was 165 mg P2O5/kg. M. lupulina seeds were scarified for 5 min in concentrated H2SO4. The seeds were then stratified in Petri dishes for 1 day at +5℃, and then germinated for 2 days at +27℃ in the dark. Seedlings of the same size were grown in a soil-sand substrate. Half of the plants at each level of Pi (starvation and optimal phosphorus level) were inoculated with AM inoculant simultaneously with planting (variants AM+P- and AM+P+), and the other half were not treated with AM inoculant (variants AM-P- and AM-P+). The control for assessing the effect of AM and Pi treatment on the metabolic profile of the roots was the AM-P+ variant, characterized by the absence of the influence of a stress factor – a low level of Pi in the absence of AM. The plants were grown by 2 seedlings in one pot filled with 210 g of soil-sand substrate. Plant watering was carried out every other day up to 0.6 of saturated water content. The growing protocol using a light phytobox sterilized by ultraviolet radiation was described earlier [31,96]. The micro-vegetative method provided optimal conditions for the development of AM and allowed to avoid spontaneous infection with rhizobia and other symbiotic microorganisms. Biochemical and microscopic analyses of plants were performed in 6 stages of the host plant development: 1) at the 14th day after sowing and inoculation (DAS), the 1st true leaf development stage; 2) at the 21st DAS, the 2nd leaf development stage ; 3) at the 28th DAS, the 3rd leaf development stage, the schooling initiation stage; 4) at the 35th DAS, the lateral branching initiation stage ; 5) at the 42nd DAS, the flowering stage; and 6) at the 56th day, the mature fruit stage. The fresh mass of roots and aboveground parts of plants, the height of the main stem of the plant were determined. For subsequent biochemical analysis, the roots of 8 plants were collected for 1 biological repeat (3 biological repeats per 1 treatment option), weighed and quickly frozen in liquid nitrogen, and then stored at a temperature of -80℃.
4.3. Evaluation of Mycorrhization Parameters
For AM analysis, the roots were dried at room temperature, then macerated and stained with trypan blue [99]. Mycorrhization indices were calculated [100]: M – the intensity of root mycorrhization; A and B – the abundance of arbuscules and vesicles in the root, respectively. Microscopic analysis of the AM development was carried out using a computer program for calculating the mycorrhization indicators of plant roots, developed by A.P. Yurkov et al. [101].
4.4. Evaluation of Mycorrhizal Growth Response – AM Symbiotic Efficiency
The mycorrhizal growth response (MGR, symbiotic efficiency of AM) was calculated as an increase in the raw weight of shoots and roots, the height of the plant stem, using the well-known formula of Odum:
MGR = ((AM+) – (AM-)) x 100%/(AM-), (1)
where (AM+) is the value of the productivity parameter in mycorrhizal plants; (AM-) is the value of the productivity parameter in plants without AM. MGR is evaluated independently for low-level Pi (P-) variants and under the conditions of phosphorus fertilizer (P+) application.
4.5. GC-MS Analysis
Root samples, weighing 100 mg, were collecteated at 6 different stages of cultivation and immediately frozen in liquid nitrogen. The plant material was crushed using a mill (MM 400, Retsch, Germany). The metabolites were then extracted using 2 ml of an extraction mixture: methanol, chloroform, water (5:2:1) with shaking 900 rpm at 4 ℃ on thermoshaker (BioSan TS-100C). Tissue debris was removed by centrifugation at 12,000 g for 10 minutes at 4 ℃ and resulting supernatant was collected and evaporated in a vacuum evaporator (CentriVap, Labconco, USA). Dried samples were dissolved and derivatized in pyridine in the ratio BSTFA:TMCS 99:1 (Sigma-Aldrich) at 90℃ for 20 minutes. An internal standard of tricosan (normal hydrocarbon) was added.
Samples were analyzed with Agilent 6850 chromatograph equipped Rxi-5Sil (Restek) capillary column and coupled with an Agilent 5975 quadrupole mass selective (Agilent Technologies, Santa Clara, CA, USA). Flow rate of the helium was 1 mL/min. Inlet was operated in splitless mode at 250 ℃. Column temperature regime: initial – 70 ℃, final – 320 ℃, rate – 6 ℃ per min. Electron impact ionization was performed at 70 V and an ion source temperature of 230 ℃. The analysis of the GC-MS data was processed using the PARADISe software (Department of Food Science Faculty of Science, University of Copenhagen, Denmark; [102]) coupled with NIST MS Search (National Institute of Standards and Technology (NIST), USA). The ANDES system (Automated Mass Spectral Deconvolution and Identification System, NIST, USA) was used for the deconvolution and identification of metabolites. Analytes were identified by mass-spectra and Kovats retention indices using libraries: NIST2020, Golm Metabolome Database (GMD; [103]). In addition, the “in house” library created by the laboratory of analytical phytochemistry with the financial support of the BIN RAS No. 124020100140-7 was also used.
4.6. Statistical Analysis
Statistical analysis of the metabolomic data were processed using R 4.3.1 [104]. Data were normalized against sample median. Outliers were detected and excluded on the basis of Dixon’s test in outliers package [105]. The data were log-transformed and standardized. If a compound was not detected in a sample but was present in the other replicates it was considered as a technical error and imputed by KNN (k-nearest neighbors) with impute R package [106]. PCA (Principal Component Analysis, PCA) was performed with pcaMethods [107]. Orthogonal Partial Least Squares (OPLS-DA) was used for classification with ropls. Factor loadings of predictive component and Variable Importance in Projection (VIP) was used to asses statistical relationship between features and factor of interest [108]. For metabolite set enrichment analysis fgsea algorithm was used [109].
Metabolite sets for metabolic pathways were downloaded from the KEGG database [110] through KEGGREST package [111] with M. truncatula as reference organism. Lists of metabolites for pathways were manualy corrected: poor represented or extra-large sets were excluded, for some metabolites obligatory needful pathways were added, compounds identified up to class (hexose, disaccharide, among others), were joined relevant pathways. Correlation graphs were built from the Cytoscape software [112].
5. Conclusions
The effect of R. irregularis inoculation and phosphorus treatment on the content of 327 metabolites (amino acids, carboxylic and fatty acids, sterols, phenolic compounds, sugars) in the roots of M. lupulina during key stages of the host plant development from the stage of the first leaf to the mature fruit was evaluated. The results of the study showed that the highest AM efficiency is in the highly efficient PMS “M. lupulina + R. irregularis” manifests itself under Pi deficiency conditions at the BI stage, and under conditions of optimal phosphorus levels for plant nutrition, on the contrary, minimal AM efficiency indicators and mycorrhization parameters were observed. Just the BI stage was characterized by the most significant AM-induced metabolic rearrangements in the roots of the host plant. Probably, the BI stage is key one for the development of an efficient AM symbiosis. The development of efficient AM is accompanied by a significant increase in the metabolism of proteins, carbohydrates and lipids, as well as a significant increase in the content of phosphates (methyl phosphate, phosphoric asid). Mycorrhization, generally, downregulated the acid content of the TCA cycle, both in conditions of deficiency and at the optimal Pi level for nutrition. As a result of the study, among the metabolites of the roots of M. lupulina, the following 14 markers of the development of efficient AM symbiosis can be distinguished, characterized by upregulation with a deficiency and a sufficient Pi level: hexose_RI=1881, compsug_RI=3273, trehalose (carbohydrate metabolism); glycerol, glycerol-3P, ethanolaminephosphate, campesterol, sterol_RI=3260, sterol_RI=3362, myo-Inositol-2P (lipid metabolism); methyl phosphate and phosphoric acid. A significant upregulation of the phosphate content indicates that inoculation with AM-fungus significantly leveled the effect of phosphorus starvation on AM+P- plants. A negative marker of the development of efficient AM symbiosis was succinic acid (and to a lesser extent citric acid), the content of which was, mainly, lower during mycorrhization, both with deficiency and with a optimal Pi level.
Based on the analysis of metabolic rearrangements, it can be concluded that mycorrhization led to the adaptation of plants to low Pi level conditions. AM determined the most significant proportion of metabolic rearrangements with different Pi availability, therefore AM should be considered the priority factor on the metabolome of the host plant in comparison with the phosphorus supply.
Supplementary Materials
The following supporting information can be downloaded at the website of this paper posted on Preprints.org. Figure S1: Plant height (A), fresh weight of shoots (B) and roots (B) per one M. lupulina plant inoculated with R. irre-gularis. “1st leaf”, etc. – stages of plant development; “a”, “b”, “c” – different letters indicate significant differences within the same MGR parameter (ANOVA and Tukey’s test; p < 0.05). The average values with standard errors are presented; Figure S2: Loadings of predictive components from the corresponding OPLS-DA models at the 2L stage. Figure S3: Loadings of predictive components from the corresponding OPLS-DA models at the 2L stage; Figure S4: Loadings of predictive components from the corresponding OPLS-DA models at the SI/3L stage; Figure S5: Loadings of predictive components from the corresponding OPLS-DA models at the BI stage; Figure S6: Loadings of predictive components from the corresponding OPLS-DA models at the F stage; Figure S7: Loadings of predictive components from the corresponding OPLS-DA models at the MF stage; Figure S8: Key metabolic rearrangements in AM+P+, AM+P-, AM-P- vs AM-P+ plants. “+” – apregulation (vs AM-P+); “-” – downregulation vs AM-P+; empty cells – absence of significant (P>0.05) differences in the compared variants; TCA – tricarboxylic acids; Table S1: Summary Statistics of networks from Figure 10.
Author Contributions
Individual contributions in conceptualization, A.P.Y., R.K.P. and M.F.S.; methodology, A.A.K. and R.K.P.; software, A.P.Y. and A.A.K.; validation, A.I.G., Y.V.L.; formal analysis, A.P.Y., R.K.P., T.R.K., A.L.S. and M.F.S.; investigation, A.P.Y., R.K.P., E.M.B., A.A.K. and V.V.Y.; resources, A.P.Y.; data curation, A.P.Y. and M.F.S.; writing—original draft preparation, A.P.Y. and R.K.P.; writing—review and editing, A.P.Y., R.K.P., D.A.R., A.A.K., A.I.K., A.L.S. and M.F.S.; visualization, R.K.P. and A.P.Y.; supervision, A.P.Y., R.K.P. and M.F.S.; project administration, A.P.Y.; funding acquisition, A.P.Y. All authors have read and agreed to the published version of the manuscript.
Funding
The article was made with support of the Russian Science Foundation (RSF) No. 22-16-00064.
Data Availability Statement
not applicable.
Acknowledgments
The research was performed using equipment from the Core Center “Genomic Technologies, Proteomics and Cell Biology” in ARRIAM and equipment from the Research Park “Center for Molecular and Cell Technologies” in Saint Petersburg State University.
Conflicts of Interest
The authors declare no conflict of interest.
References
- Schachtman, D.P.; Reid, R.J.; Ayling, S.M. Phosphorus Uptake by Plants: From Soil to Cell. Plant Physiology 1998, 116, 447–453. [CrossRef]
- Holford ICR (1997) Soil phosphorus: its measurement, and its uptake by plants. Aust J Soil Res 35: 227–239.
- Marschner H (1995) Mineral Nutrition of Higher Plants. Academic Press, San Diego, CA.
- Harnett D.C., Wilson G.W.T. The role of mycorrhizas in plant community structure and dynamics: lessons from grasslands. Plant and Soil 2002, 244, 319-331. [CrossRef]
- Smith, S.E.; Read, D.J. Mycorrhizal Symbiosis, 3rd ed.; Academic Press: San Diego, CA, USA, 2008.
- Schüßler A., Scwarzott D., Walker C. A New Fungal Phylum, the Glomeromycota: Phylogeny and Evolution. Mycological Research 2001, 105, 1413–1421. [CrossRef]
- Schüßler A. Glomeromycota phylogeny. http://www.amf-phylogeny.com. Accessed and last updated 04 Apr 2024.
- Zhu Y.-G., Cavagnaro T.R., Smith S.E. Backseat driving? Accessing phosphate beyond the rhizosphere-depletion zone. Trends Plant Sci. 2001, 6, 194-195. [CrossRef]
- Smith S.E., Smith F. A., Jakobsen I. Mycorrhizal Fungi Can Dominate Phosphate Supply to Plants Irrespective of Growth Responses. Plant Physiology 2003, 133, 16–20. [CrossRef]
- Xie X., Lai W., Che X., Wang S., Ren Y., Hu W., Chen H., Tang M. A SPX domaincontaining phosphate transporter from Rhizophagus irregularis handles phosphate homeostasis at symbiotic interface of arbuscular mycorrhizas. New Phytologist 2022, 234, 650–671. [CrossRef]
- Liu, J.; Versaw,W.K.; Pumplin, N.; Gomez, S.K.; Blaylock, L.A.; Harrison, M.J. Closely related members of the Medicago truncatula PHT1 phosphate transporter gene family encode phosphate transporters with distinct biochemical activities. Journal of Biological Chemistry 2008, 283, 24673–24681. [CrossRef]
- Voß, S.; Betz, R.; Heidt, S.; Corradi, N.; Requena, N. RiCRN1, a crinkler effector from the arbuscular mycorrhizal fungus Rhizophagus irregularis, functions in arbuscule development. Front. Microbiol. 2018, 9, 2068. [CrossRef]
- Krajinski, F.; Courty, P.E.; Sieh, D.; Franken, P.; Zhang, H.; Bucher, M.; Gerlach, N.; Kryvoruchko, I.; Zoeller, D.; Udvardi, M.; et al. The H+-ATPase HA1 of Medicago truncatula is essential for phosphate transport and plant growth during arbuscular mycorrhizal symbiosis. The Plant Cell 2014, 26, 1808–1817. [CrossRef]
- Bagyaraj, D. J., Sharma, M. P., Maiti, D. Phosphorus nutrition of crops through arbuscular mycorrhizal fungi. Current Science. 2015 108, 1288–1293, http://www.jstor.org/stable/24905490.
- Priyadharsini, P.; Muthukumar, T. The Root Endophytic Fungus Curvularia Geniculata from Parthenium Hysterophorus Roots Improves Plant Growth through Phosphate Solubilization and Phytohormone Production. Fungal Ecology 2017, 27, 69–77. [CrossRef]
- Qi S., Wang J., Wan L., Dai Z., da Silva Matos D.M., Du D., Egan S., Bonser S.P., Thomas T., Moles A.T. Arbuscular mycorrhizal fungi contribute to phosphorous uptake and allocation strategies of Solidago canadensis in a phosphorous-deficient environment. Front. Plant Sci. 2022, 13, 831654. [CrossRef]
- Smith, S.E.; Smith, F.A.; Jakobsen, I. Functional diversity in arbuscular mycorrhizal (AM) symbioses: The contribution of the mycorrhizal P uptake pathway is not correlated with mycorrhizal responses in growth or total P uptake. New Phytologist 2004, 162, 511–524. [CrossRef]
- Bucher, M. Functional biology of plant phosphate uptake at root and mycorrhiza interfaces. New Phytologist 2007, 173, 11–26. [CrossRef]
- Li, H. Y., Smith, S. E., Holloway, R. E., Zhu, Y. G., Smith, F. A. Arbuscular mycorrhizal fungi contribute to phosphorus uptake by wheat grown in a phosphorus-fixing soil even in the absence of positive growth responses. New Phytologist 2006, 172, 536–543. [CrossRef]
- Yang, S.-Y.; Grønlund, M.; Jakobsen, I.; Grotemeyer, M.S.; Rentsch, D.; Miyao, A.; Hirochika, H.; Kumar, C.S.; Sundaresan, V.; Salamin, N.; et al. Nonredundant Regulation of Rice Arbuscular Mycorrhizal Symbiosis by Two Members of the PHOSPHATE TRANSPORTER1 Gene Family. Plant Cell 2012, 24, 4236–4251. [CrossRef]
- Watts-Williams, S.J.; Emmett, B.D.; Levesque-Tremblay, V.; MacLean, A.M.; Sun, X.; Satterlee, J.W.; Fei, Z.; Harrison, M.J. Diverse Sorghum bicolor accessions show marked variation in growth and transcriptional responses to arbuscular mycorrhizal fungi. Plant Cell & Environment 2019, 42, 1758–1774. [CrossRef]
- Olalde-Portugal, V.; Cabrera-Ponce, J.L.; Gastelum-Arellanez, A.; Guerrero-Rangel, A.; Winkler, R.; Valdés-Rodríguez, S. Proteomic Analysis and Interactions Network in Leaves of Mycorrhizal and Nonmycorrhizal Sorghum Plants under Water Deficit. PeerJ 2020, 8, e8991. [CrossRef]
- Goddard, M.-L.; Belval, L.; Martin, I.R.; Roth, L.; Laloue, H.; Deglène-Benbrahim, L.; Valat, L.; Bertsch, C.; Chong, J. Arbuscular Mycorrhizal Symbiosis Triggers Major Changes in Primary Metabolism Together with Modification of Defense Responses and Signaling in Both Roots and Leaves of Vitis vinifera. Front. Plant Sci. 2021, 12, 721614. [CrossRef]
- Schliemann, W.; Ammer, C.; Strack, D. Metabolite profiling of mycorrhizal roots of Medicago truncatula. Phytochemistry 2008, 69, 112–146. [CrossRef]
- Schweiger, R.; Baier, M.C.; Persicke, M.; Müller, C. High specificity in plant leaf metabolic responses to arbuscular mycorrhiza. Nat Commun 2014, 5, 3886. [CrossRef]
- Pedone-Bonfim, M.V.; A Lins, M.; Coelho, I.R.; Santana, A.S.; Da Silva, F.S.B.; Maia, L.C. Mycorrhizal technology and phosphorus in the production of primary and secondary metabolites in cebil (Anadenanthera colubrina (Vell.) Brenan) seedlings. J Sci Food Agric 2013, 93, 1479–1484. [CrossRef]
- Rivero, J.; Gamir, J.; Aroca, R.; Pozo, M.J.; Flors, V. Metabolic transition in mycorrhizal tomato roots. Front. Microbiol. 2015, 6. [CrossRef]
- Tavarini, S.; Passera, B.; Martini, A.; Avio, L.; Sbrana, C.; Giovannetti, M.; Angelini, L.G. Plant Growth, Steviol Glycosides and Nutrient Uptake as Affected by Arbuscular Mycorrhizal Fungi and Phosphorous Fertilization in Stevia Rebaudiana Bert. Industrial Crops and Products 2018, 111, 899–907. [CrossRef]
- Shtark, O.Y.; Puzanskiy, R.K.; Avdeeva, G.S.; Yurkov, A.P.; Smolikova, G.N.; Yemelyanov, V.V.; Kliukova, M.S.; Shavarda, A.L.; Kirpichnikova, A.A.; Zhernakov, A.I.; et al. Metabolic Alterations in Pea Leaves during Arbuscular Mycorrhiza Development. PeerJ 2019, 7, e7495. [CrossRef]
- Shtark, O.; Puzanskiy, R.; Avdeeva, G.; Yemelyanov, V.; Shavarda, A.; Romanyuk, D.; Kliukova, M.; Kirpichnikova, A.; Tikhonovich, I.; Zhukov, V.; et al. Metabolic Alterations in Pisum Sativum Roots during Plant Growth and Arbuscular Mycorrhiza Development. Plants 2021, 10, 1033. [CrossRef]
- Yurkov, A.P.; Puzanskiy, R.K.; Avdeeva, G.S.; Jacobi, L.M.; Gorbunova, A.O.; Kryukov, A.A.; Kozhemyakov, A.P.; Laktionov, Y.V.; Kosulnikov, Y.V.; Romanyuk, D.A.; et al. Mycorrhiza-Induced Alterations in Metabolome of Medicago Lupulina Leaves during Symbiosis Development. Plants 2021, 10, 2506. [CrossRef]
- Andrino, A.; Guggenberger, G.; Sauheitl, L.; Burkart, S.; Boy, J. Carbon Investment into Mobilization of Mineral and Organic Phosphorus by Arbuscular Mycorrhiza. Biol Fertil Soils 2021a, 57, 47–64. [CrossRef]
- Andrino, A.; Guggenberger, G.; Kernchen, S.; Mikutta, R.; Sauheitl, L.; Boy, J. Production of Organic Acids by Arbuscular Mycorrhizal Fungi and Their Contribution in the Mobilization of Phosphorus Bound to Iron Oxides. Front. Plant Sci. 2021b, 12, 661842. [CrossRef]
- Yurkov, A.P.; Puzanskiy, R.K.; Kryukov, A.A.; Gorbunova, A.O.; Kudriashova, T.R.; Jacobi, L.M.; Kozhemyakov, A.P.; Romanyuk, D.A.; Aronova, E.B.; Avdeeva, G.S.; et al. The Role of Medicago Lupulina Interaction with Rhizophagus Irregularis in the Determination of Root Metabolome at Early Stages of AM Symbiosis. Plants 2022, 11, 2338. [CrossRef]
- Jing, S.; Li, Y.; Zhu, L.; Su, J.; Yang, T.; Liu, B.; Ma, B.; Ma, F.; Li, M.; Zhang, M. Transcriptomics and Metabolomics Reveal Effect of Arbuscular Mycorrhizal Fungi on Growth and Development of Apple Plants. Front. Plant Sci. 2022, 13, 1052464. [CrossRef]
- Chialva, M.; Patono, D.L.; De Souza, L.P.; Novero, M.; Vercellino, S.; Maghrebi, M.; Morgante, M.; Lovisolo, C.; Vigani, G.; Fernie, A.; et al. The Mycorrhizal Root-shoot Axis Elicits Coffea Arabica Growth under Low Phosphate Conditions. New Phytologist 2023, 239, 271–285. [CrossRef]
- Saia, S.; Ruisi, P.; Fileccia, V.; Di Miceli, G.; Amato, G.; Martinelli, F. Metabolomics Suggests That Soil Inoculation with Arbuscular Mycorrhizal Fungi Decreased Free Amino Acid Content in Roots of Durum Wheat Grown under N-Limited, P-Rich Field Conditions. PLoS ONE 2015, 10, e0129591. [CrossRef]
- Pu, C.; Yang, G.; Li, P.; Ge, Y.; Garran, T.A.; Zhou, X.; Shen, Y.; Zheng, H.; Chen, M.; Huang, L. Arbuscular Mycorrhiza Alters the Nutritional Requirements in Salvia Miltiorrhiza and Low Nitrogen Enhances the Mycorrhizal Efficiency. Sci Rep 2022, 12, 19633. [CrossRef]
- Xie, W.; Hao, Z.; Yu, M.; Wu, Z.; Zhao, A.; Li, J.; Zhang, X.; Chen, B. Improved Phosphorus Nutrition by Arbuscular Mycorrhizal Symbiosis as a Key Factor Facilitating Glycyrrhizin and Liquiritin Accumulation in Glycyrrhiza Uralensis. Plant Soil 2019, 439, 243–257. [CrossRef]
- Liu, J.; Liu, X.; Zhang, Q.; Li, S.; Sun, Y.; Lu, W.; Ma, C. Response of Alfalfa Growth to Arbuscular Mycorrhizal Fungi and Phosphate-Solubilizing Bacteria under Different Phosphorus Application Levels. AMB Expr 2020, 10, 200. [CrossRef]
- Balzergue, C.; Puech-Pagès, V.; Bécard, G.; Rochange, S.F. The Regulation of Arbuscular Mycorrhizal Symbiosis by Phosphate in Pea Involves Early and Systemic Signalling Events. Journal of Experimental Botany 2011, 62, 1049–1060. [CrossRef]
- Ilyas, U.; Du Toit, L.J.; Hajibabaei, M.; McDonald, M.R. Influence of Plant Species, Mycorrhizal Inoculant, and Soil Phosphorus Level on Arbuscular Mycorrhizal Communities in Onion and Carrot Roots. Front. Plant Sci. 2024, 14, 1324626. [CrossRef]
- Kaur, S.; Campbell, B.J.; Suseela, V. Root Metabolome of Plant–Arbuscular Mycorrhizal Symbiosis Mirrors the Mutualistic or Parasitic Mycorrhizal Phenotype. New Phytologist 2022, 234, 672–687. [CrossRef]
- Davey, M.P.; Burrell, M.M.; Woodward, F.I.; Quick, W.P. Population-specific Metabolic Phenotypes of Arabidopsis Lyrata ssp. Petraea. New Phytologist 2008, 177, 380–388. [CrossRef]
- Bertram, H.C.; Weisbjerg, M.R.; Jensen, C.S.; Pedersen, M.G.; Didion, T.; Petersen, B.O.; Duus, J.Ø.; Larsen, M.K.; Nielsen, J.H. Seasonal Changes in the Metabolic Fingerprint of 21 Grass and Legume Cultivars Studied by Nuclear Magnetic Resonance-Based Metabolomics. J. Agric. Food Chem. 2010, 58, 4336–4341. [CrossRef]
- Kim, H.K.; Saifullah; Khan, S.; Wilson, E.G.; Kricun, S.D.P.; Meissner, A.; Goraler, S.; Deelder, A.M.; Choi, Y.H.; Verpoorte, R. Metabolic Classification of South American Ilex Species by NMR-Based Metabolomics. Phytochemistry 2010, 71, 773–784. [CrossRef]
- Miyagi, A.; Takahashi, H.; Takahara, K.; Hirabayashi, T.; Nishimura, Y.; Tezuka, T.; Kawai-Yamada, M.; Uchimiya, H. Principal Component and Hierarchical Clustering Analysis of Metabolites in Destructive Weeds; Polygonaceous Plants. Metabolomics 2010, 6, 146–155. [CrossRef]
- Schweiger, R.; Müller, C. Leaf Metabolome in Arbuscular Mycorrhizal Symbiosis. Current Opinion in Plant Biology 2015, 26, 120–126. [CrossRef]
- Yurkov, A.P.; Jacobi, L.M.; Gapeeva, N.E.; Stepanova, G.V.; Shishova, M.F. Development of Arbuscular Mycorrhiza in Highly Responsive and Mycotrophic Host Plant–Black Medick (Medicago Lupulina L.). Russ J Dev Biol 2015, 46, 263–275. [CrossRef]
- Yurkov, A.; Kryukov, A.; Gorbunova, A.; Sherbakov, A.; Dobryakova, K.; Mikhaylova, Y.; Afonin, A.; Shishova, M. AM-Induced Alteration in the Expression of Genes, Encoding Phosphorus Transporters and Enzymes of Carbohydrate Metabolism in Medicago Lupulina. Plants 2020, 9, 486. [CrossRef]
- Zhang, H.; Wei, S.; Hu, W.; Xiao, L.; Tang, M. Arbuscular mycorrhizal fungus Rhizophagus irregularis increased potassium content and expression of genes encoding potassium channels in Lycium barbarum. Front. Plant Sci. 2017, 8. [CrossRef]
- Yurkov, A.P.; Kryukov, A.A.; Gorbunova, A.O.; Kudriashova, T.R.; Kovalchuk, A.I.; Gorenkova, A.I.; Bogdanova, E.M.; Laktionov, Y.V.; Zhurbenko, P.M.; Mikhaylova, Y.V.; et al. Diversity of Arbuscular Mycorrhizal Fungi in Distinct Ecosystems of the North Caucasus, a Temperate Biodiversity Hotspot. JoF 2023, 10, 11. [CrossRef]
- Kaur, S.; Suseela, V. Unraveling Arbuscular Mycorrhiza-Induced Changes in Plant Primary and Secondary Metabolome. Metabolites 2020, 10, 335. [CrossRef]
- Kryukov, A.A.; Gorbunova, A.O.; Kudriashova, T.R.; Ivanchenko, O.B.; Shishova, M.F.; Yurkov, A.P. SWEET Transporters of Medicago Lupulina in the Arbuscular-Mycorrhizal System in the Presence of Medium Level of Available Phosphorus. Vestn. VOGiS 2023, 27, 189–196. [CrossRef]
- Cartabia, A.; Tsiokanos, E.; Tsafantakis, N.; Lalaymia, I.; Termentzi, A.; Miguel, M.; Fokialakis, N.; Declerck, S. The Arbuscular Mycorrhizal Fungus Rhizophagus Irregularis MUCL 41833 Modulates Metabolites Production of Anchusa Officinalis L. Under Semi-Hydroponic Cultivation. Front. Plant Sci. 2021, 12, 724352. [CrossRef]
- Metwally, R.A.; Soliman, S.A.; Abdel Latef, A.A.H.; Abdelhameed, R.E. The Individual and Interactive Role of Arbuscular Mycorrhizal Fungi and Trichoderma Viride on Growth, Protein Content, Amino Acids Fractionation, and Phosphatases Enzyme Activities of Onion Plants Amended with Fish Waste. Ecotoxicology and Environmental Safety 2021, 214, 112072. [CrossRef]
- Douds, D.D., Jr.; Pfeffer, P.E.; Shachar-Hill, Y. Carbon partitioning, cost and metabolism of arbuscular mycorrhizas. In Arbuscular Mycorrhizas: Physiology and Function; Kapulnik, Y., Douds, D.D., Jr., Eds.; Kluwer Academic Press: Dordrecht, The Netherlands, 2000, 107–130. [CrossRef]
- Rivero, J.; Álvarez, D.; Flors, V.; Azcón-Aguilar, C.; Pozo, M.J. Root metabolic plasticity underlies functional diversity in mycorrhiza-enhanced stress tolerance in tomato. New Phytologist 2018, 220, 1322–1336. [CrossRef]
- Kameoka, H.; Gutjahr, C. Functions of Lipids in Development and Reproduction of Arbuscular Mycorrhizal Fungi. Plant and Cell Physiology 2022, 63, 1356–1365. [CrossRef]
- Brands, M.; Dörmann, P. Two AMP-Binding Domain Proteins from Rhizophagus Irregularis Involved in Import of Exogenous Fatty Acids. MPMI 2022, 35, 464–476. [CrossRef]
- Luginbuehl, L.H.; Oldroyd, G.E.D. Understanding the arbuscule at the heart of endomycorrhizal symbioses in plants. Current Biology 2017, 27, R952–R963. [CrossRef]
- Luginbuehl, L.H., Van Erp, H., Cheeld, H., Mysore, K.S., Wen, J., Oldroyd, G.E., et al. Plants export 2-monopalmitin and supply both fatty acyl and glyceryl moieties to arbuscular mycorrhizal fungi. 2021. [CrossRef]
- Kameoka, H.; Tsutsui, I.; Saito, K.; Kikuchi, Y.; Handa, Y.; Ezawa, T.; Hayashi, H.; Kawaguchi, M.; Akiyama, K. Stimulation of Asymbiotic Sporulation in Arbuscular Mycorrhizal Fungi by Fatty Acids. Nat Microbiol 2019, 4, 1654–1660. [CrossRef]
- Sugiura, Y.; Akiyama, R.; Tanaka, S.; Yano, K.; Kameoka, H.; Marui, S.; Saito, M.; Kawaguchi, M.; Akiyama, K.; Saito, K. Myristate Can Be Used as a Carbon and Energy Source for the Asymbiotic Growth of Arbuscular Mycorrhizal Fungi. Proc. Natl. Acad. Sci. U.S.A. 2020, 117, 25779–25788. [CrossRef]
- Bravo, A.; Brands, M.; Wewer, V.; Dormann, P.; Harrison, M.J. Arbuscular mycorrhiza-specific enzymes FatM and RAM2 fine-tune lipid biosynthesis to promote development of arbuscular mycorrhiza. New Phytologist 2017, 214, 1631–1645. [CrossRef]
- Lohse, S.; Schliemann, W.; Ammer, C.; Kopka, J.; Strack, D.; Fester, T. Organization and Metabolism of Plastids and Mitochondria in Arbuscular Mycorrhizal Roots of Medicago Truncatula. Plant Physiology 2005, 139, 329–340. [CrossRef]
- Fester T, Fetzer I, Buchert S, Lucas R, Rillig MC, Härtig C. 2011. Towards a systemic metabolic signature of the arbuscular mycorrhizal interaction. Oecologia 2011, 167, 913–924. [CrossRef]
- Sharma K., Kapoor R. Arbuscular mycorrhiza differentially adjusts central carbon metabolism in two contrasting genotypes of Vigna radiata (L.) Wilczek in response to salt stress. Plant Science 2023, 332, 111706. [CrossRef]
- Kogel, K.-H.; Voll, L.M.; Schäfer, P.; Jansen, C.; Wu, Y.; Langen, G.; Imani, J.; Hofmann, J.; Schmiedl, A.; Sonnewald, S.; et al. Transcriptome and Metabolome Profiling of Field-Grown Transgenic Barley Lack Induced Differences but Show Cultivar-Specific Variances. Proc. Natl. Acad. Sci. U.S.A. 2010, 107, 6198–6203. [CrossRef]
- Reinhart, K.O.; Wilson, G.W.T.; Rinella, M.J. Predicting Plant Responses to Mycorrhizae: Integrating Evolutionary History and Plant Traits. Ecology Letters 2012, 15, 689–695. [CrossRef]
- Brundrett, M.C. Coevolution of Roots and Mycorrhizas of Land Plants. New Phytologist 2002, 154, 275–304. [CrossRef]
- Choi, I.; Son, H.; Baek, J.-H. Tricarboxylic Acid (TCA) Cycle Intermediates: Regulators of Immune Responses. Life 2021, 11, 69. [CrossRef]
- Gupta, S.; Thokchom, S.D.; Kapoor, R. Arbuscular Mycorrhiza Fungus Alleviates Arsenic Mediated Disturbances in Tricarboxylic Acid Cycle and Nitrogen Metabolism in Triticum Aestivum L. Plant Physiology and Biochemistry 2023, 197, 107631. [CrossRef]
- Sheng, M.; Tang, M.; Zhang, F.; Huang, Y. Influence of Arbuscular Mycorrhiza on Organic Solutes in Maize Leaves under Salt Stress. Mycorrhiza 2011, 21, 423–430. [CrossRef]
- Che-Othman, M.H.; Jacoby, R.P.; Millar, A.H.; Taylor, N.L. Wheat Mitochondrial Respiration Shifts from the Tricarboxylic Acid Cycle to the GABA Shunt under Salt Stress. New Phytologist 2020, 225, 1166–1180. [CrossRef]
- Zhang, T.; Peng, J.T.; Klair, A.; Dickinson, A.J. Non-Canonical and Developmental Roles of the TCA Cycle in Plants. Current Opinion in Plant Biology 2023, 74, 102382. [CrossRef]
- Hill, E.M.; Robinson, L.A.; Abdul-Sada, A.; Vanbergen, A.J.; Hodge, A.; Hartley, S.E. Arbuscular Mycorrhizal Fungi and Plant Chemical Defence: Effects of Colonisation on Aboveground and Belowground Metabolomes. J Chem Ecol 2018, 44, 198–208. [CrossRef]
- Johny, L.; Cahill, D.M.; Adholeya, A. AMF Enhance Secondary Metabolite Production in Ashwagandha, Licorice, and Marigold in a Fungi-Host Specific Manner. Rhizosphere 2021, 17, 100314. [CrossRef]
- Yu, L.; Zhang, W.; Geng, Y.; Liu, K.; Shao, X. Cooperation With Arbuscular Mycorrhizal Fungi Increases Plant Nutrient Uptake and Improves Defenses Against Insects. Front. Ecol. Evol. 2022, 10, 833389. [CrossRef]
- Wang, Y.; Lin, J.; Yang, F.; Tao, S.; Yan, X.; Zhou, Z.; Zhang, Y. Arbuscular Mycorrhizal Fungi Improve the Growth and Performance in the Seedlings of Leymus Chinensis under Alkali and Drought Stresses. PeerJ 2022, 10, e12890. [CrossRef]
- Kose, F.; Weckwerth, W.; Linke, T.; Fiehn, O. Visualizing Plant Metabolomic Correlation Networks Using Clique–Metabolite Matrices. Bioinformatics 2001, 17, 1198–1208. [CrossRef]
- Camacho, D.; De La Fuente, A.; Mendes, P. The Origin of Correlations in Metabolomics Data. Metabolomics 2005, 1, 53–63. [CrossRef]
- Steuer, R. Review: On the Analysis and Interpretation of Correlations in Metabolomic Data. Briefings in Bioinformatics 2006, 7, 151–158. [CrossRef]
- Rosato, A.; Tenori, L.; Cascante, M.; De Atauri Carulla, P.R.; Martins Dos Santos, V.A.P.; Saccenti, E. From Correlation to Causation: Analysis of Metabolomics Data Using Systems Biology Approaches. Metabolomics 2018, 14, 37. [CrossRef]
- Morgenthal, K.; Weckwerth, W.; Steuer, R. Metabolomic Networks in Plants: Transitions from Pattern Recognition to Biological Interpretation. Biosystems 2006, 83, 108–117. [CrossRef]
- Fukushima, A.; Kusano, M.; Redestig, H.; Arita, M.; Saito, K. Metabolomic Correlation-Network Modules in Arabidopsis Based on a Graph-Clustering Approach. BMC Syst Biol 2011, 5, 1. [CrossRef]
- Weckwerth, W.; Wenzel, K.; Fiehn, O. Process for the Integrated Extraction, Identification and Quantification of Metabolites, Proteins and RNA to Reveal Their Co-regulation in Biochemical Networks. Proteomics 2004, 4, 78–83. [CrossRef]
- Szymanski, J.; Jozefczuk, S.; Nikoloski, Z.; Selbig, J.; Nikiforova, V.; Catchpole, G.; Willmitzer, L. Stability of Metabolic Correlations under Changing Environmental Conditions in Escherichia Coli – A Systems Approach. PLoS ONE 2009, 4, e7441. [CrossRef]
- Kotze, H.L.; Armitage, E.G.; Sharkey, K.J.; Allwood, J.W.; Dunn, W.B.; Williams, K.J.; Goodacre, R. A Novel Untargeted Metabolomics Correlation-Based Network Analysis Incorporating Human Metabolic Reconstructions. BMC Syst Biol 2013, 7, 107. [CrossRef]
- Jeong, H.; Tombor, B.; Albert, R.; Oltvai, Z.N.; Barabási, A.-L. The Large-Scale Organization of Metabolic Networks. Nature 2000, 407, 651–654. [CrossRef]
- Puzanskiy, R.; Romanyuk, D.; Shishova, M. Coordinated Alterations in Gene Expression and Metabolomic Profiles of Chlamydomonas Reinhardtii during Batch Autotrophic Culturing. BioComm 2018, 63, 87–99. [CrossRef]
- Min Lee, J.; Gianchandani, E.P.; Eddy, J.A.; Papin, J.A. Dynamic Analysis of Integrated Signaling, Metabolic, and Regulatory Networks. PLoS Comput Biol 2008, 4, e1000086. [CrossRef]
- Sergaliev, N.Kh.; Yurkov, A.P.; Tlepov, A.S.; Dzhaparov, R.Sh.; Volodin, M.A.; Amenova, R.K. Influence of arbuscular mycorhiza fungus (Glomus intraradices) on the productivity of spring durum wheat in dark-chestnut soil under the dry-steppe zone conditions of Priuralie. Novosti nauki Kazahstana 2013, 3(117), 149–154.
- Yurkov, A.P.; Jacobi, L.M.; Stepanova, G.V.; Shoshova, M.F. Symbiotic efficiency and mycorrhization indices for ten strains of arbuscular mycorrhizal fungi in black medic under conditions of different phosphorus levels in soil. Nat Tech Sci 2016, 12(102), 67–74.
- Yurkov, A.P.; Kryukov, A.A.; Jacobi, L.M.; Kozhemyakov, A.P.; Shishova, M.F. Identification, symbiotic efficiency and activity of collection strains of arbuscular mycorrhiza fungi. Curr Biotechnol 2017, 2(21): 270–274.
- Yurkov, A.P.; Kryukov, A.A.; Yacobi, L.M.; Kozhemyakov, A.P.; Shishova, M.F. Correlations of activity and efficiency charachteristics for arbuscular mycorrhizal fungi with different origin. Tavričeskij vestnik agrarnoj nauki (TVAN) 2017, 4(12): 31–41.
- Kryukov, A.A.; Yurkov, A.P. Optimization procedures for molecular-genetic identification of arbuscular mycorrhizal fungi in symbiotic phase on the example of two closely kindred strains. Mikol. Fitopatol. 2018, 52, 38–48.
- Klechkovsky V.M., Petersburgsky A.V. Agrochemistry. Moscow: Kolos Publ., 1967.
- Phillips, J.M.; Hayman, D.S. Improved procedures for clearing roots and staining parasitic and vesicular-arbuscular mycorrhizal fungi for rapid assessment of infection. Transactions of the British Mycological Society 1970, 55, 158-IN18. [CrossRef]
- Trouvelot, A.; Kough, J.L.; Gianinazzi-Pearson, V. Mesure du taux de mycorhization VA d’un système radiculaire. Recherche de méthodes ayant une signification fonctionnelle. In Physiological and Genetical Aspects of Mycorrhizae; Gianinazzi-Pearson, V., Gianinazzi, S., Eds.; INRA-Press: Paris, France, 1986, 217–221.
- Vorobyev, N.I.; Yurkov, A.P.; Provorov, N.A. Certificate N2010612112 about the Registration of the Computer Program “Program for Calculating the Mycorrhization Indices of Plant Roots” (Dated 2 December 2016); The Federal Service for Intellectual Property: Moscow, Russia, 2016.
- Johnsen, L.G.; Skou, P.B.; Khakimov, B.; Bro, R. Gas chromatography – mass spectrometry data processing made easy. Journal of Chromatography A 2017, 1503, 57–64. [CrossRef]
- Hummel, J.; Selbig, J.; Walther, D.; Kopka, J. The Golm Metabolome Database: A Database for GC-MS Based Metabolite Profiling. In Metabolomics; Nielsen, J., Jewett, M.C., Eds.; Topics in Current Genetics; Springer Berlin Heidelberg: Berlin, Heidelberg, 2007; Vol. 18, pp. 75–95 ISBN 978-3-540-74718-5.
- R Core Team. R: A language and environment for statistical computing. R Foundation for Statistical Computing, Vienna, Austria, 2020. Available online: https://www.R-project.org/ (accessed on 19 July 2024).
- Komsta, L. Outliers: Tests for Outliers. 2011. Available online: https://CRAN.R-project.org/package=outliers (accessed on 19 July 2024).
- Hastie, T.; Tibshirani, R.; Narasimhan, B.; Chu, G. Impute: Imputation for Microarray Data. R Package Version 1.60.0. 2019. Available online: https://bioconductor.org/packages/release/bioc/html/impute.html (accessed on 19 July 2024).
- Stacklies, W.; Redestig, H.; Scholz, M.; Walther, D.; Selbig, J. pcaMethods-a bioconductor package providing PCA methods for incomplete data. Bioinformatics 2007, 23, 1164–1167. [CrossRef]
- Thévenot, E.; Roux, A.; Xu, Y.; Ezan, E.; Junot, C. Analysis of the human adult urinary metabolome variations with age, body mass index, and gender by implementing a comprehensive workflow for univariate and OPLS statistical analyses. J. Proteome Res. 2015, 14, 3322–3335. [CrossRef]
- Korotkevich, G.; Sukhov, V.; Sergushichev, A. Fast gene set enrichment analysis. BioRxiv 2021, 060012. [CrossRef]
- Kanehisa, M. Toward understanding the origin and evolution of cellular organisms. Protein Sci. 2019. 28, 1947–1951. [CrossRef]
- Tenenbaum, D.; Maintainer, B. KEGGREST: Client-Side REST Access to the Kyoto Encyclopedia of Genes and Genomes (KEGG). R Package Version 1.36.3. 2022. Available online: https://bioconductor.org/packages/release/bioc/html/KEGGREST.html (accessed on 19 July 2024). https://doi.org/10.18129/B9.bioc.KEGGREST.
- Shannon, P.; Markiel, A.; Ozier, O.; Baliga, N.S.; Wang, J.T.; Ramage, D.; Amin, N.; Schwikowski, B.; Ideker, T. Cytoscape: A software environment for integrated models of biomolecular interaction networks. Genome Res. 2003, 13, 2498–2504. [CrossRef]
Figure 1.
Mycorrhizal growth response of plant height (A), of fresh weight of shoots (B) and roots (C) per one M. lupulina plant inoculated with R. irregularis. “1st leaf”, etc. – stages of plant development; “a”, “b”, “c” – different letters indicate significant differences within the same MGR parameter (ANOVA and Tukey’s test; p < 0.05). The average values with standard errors are presented.
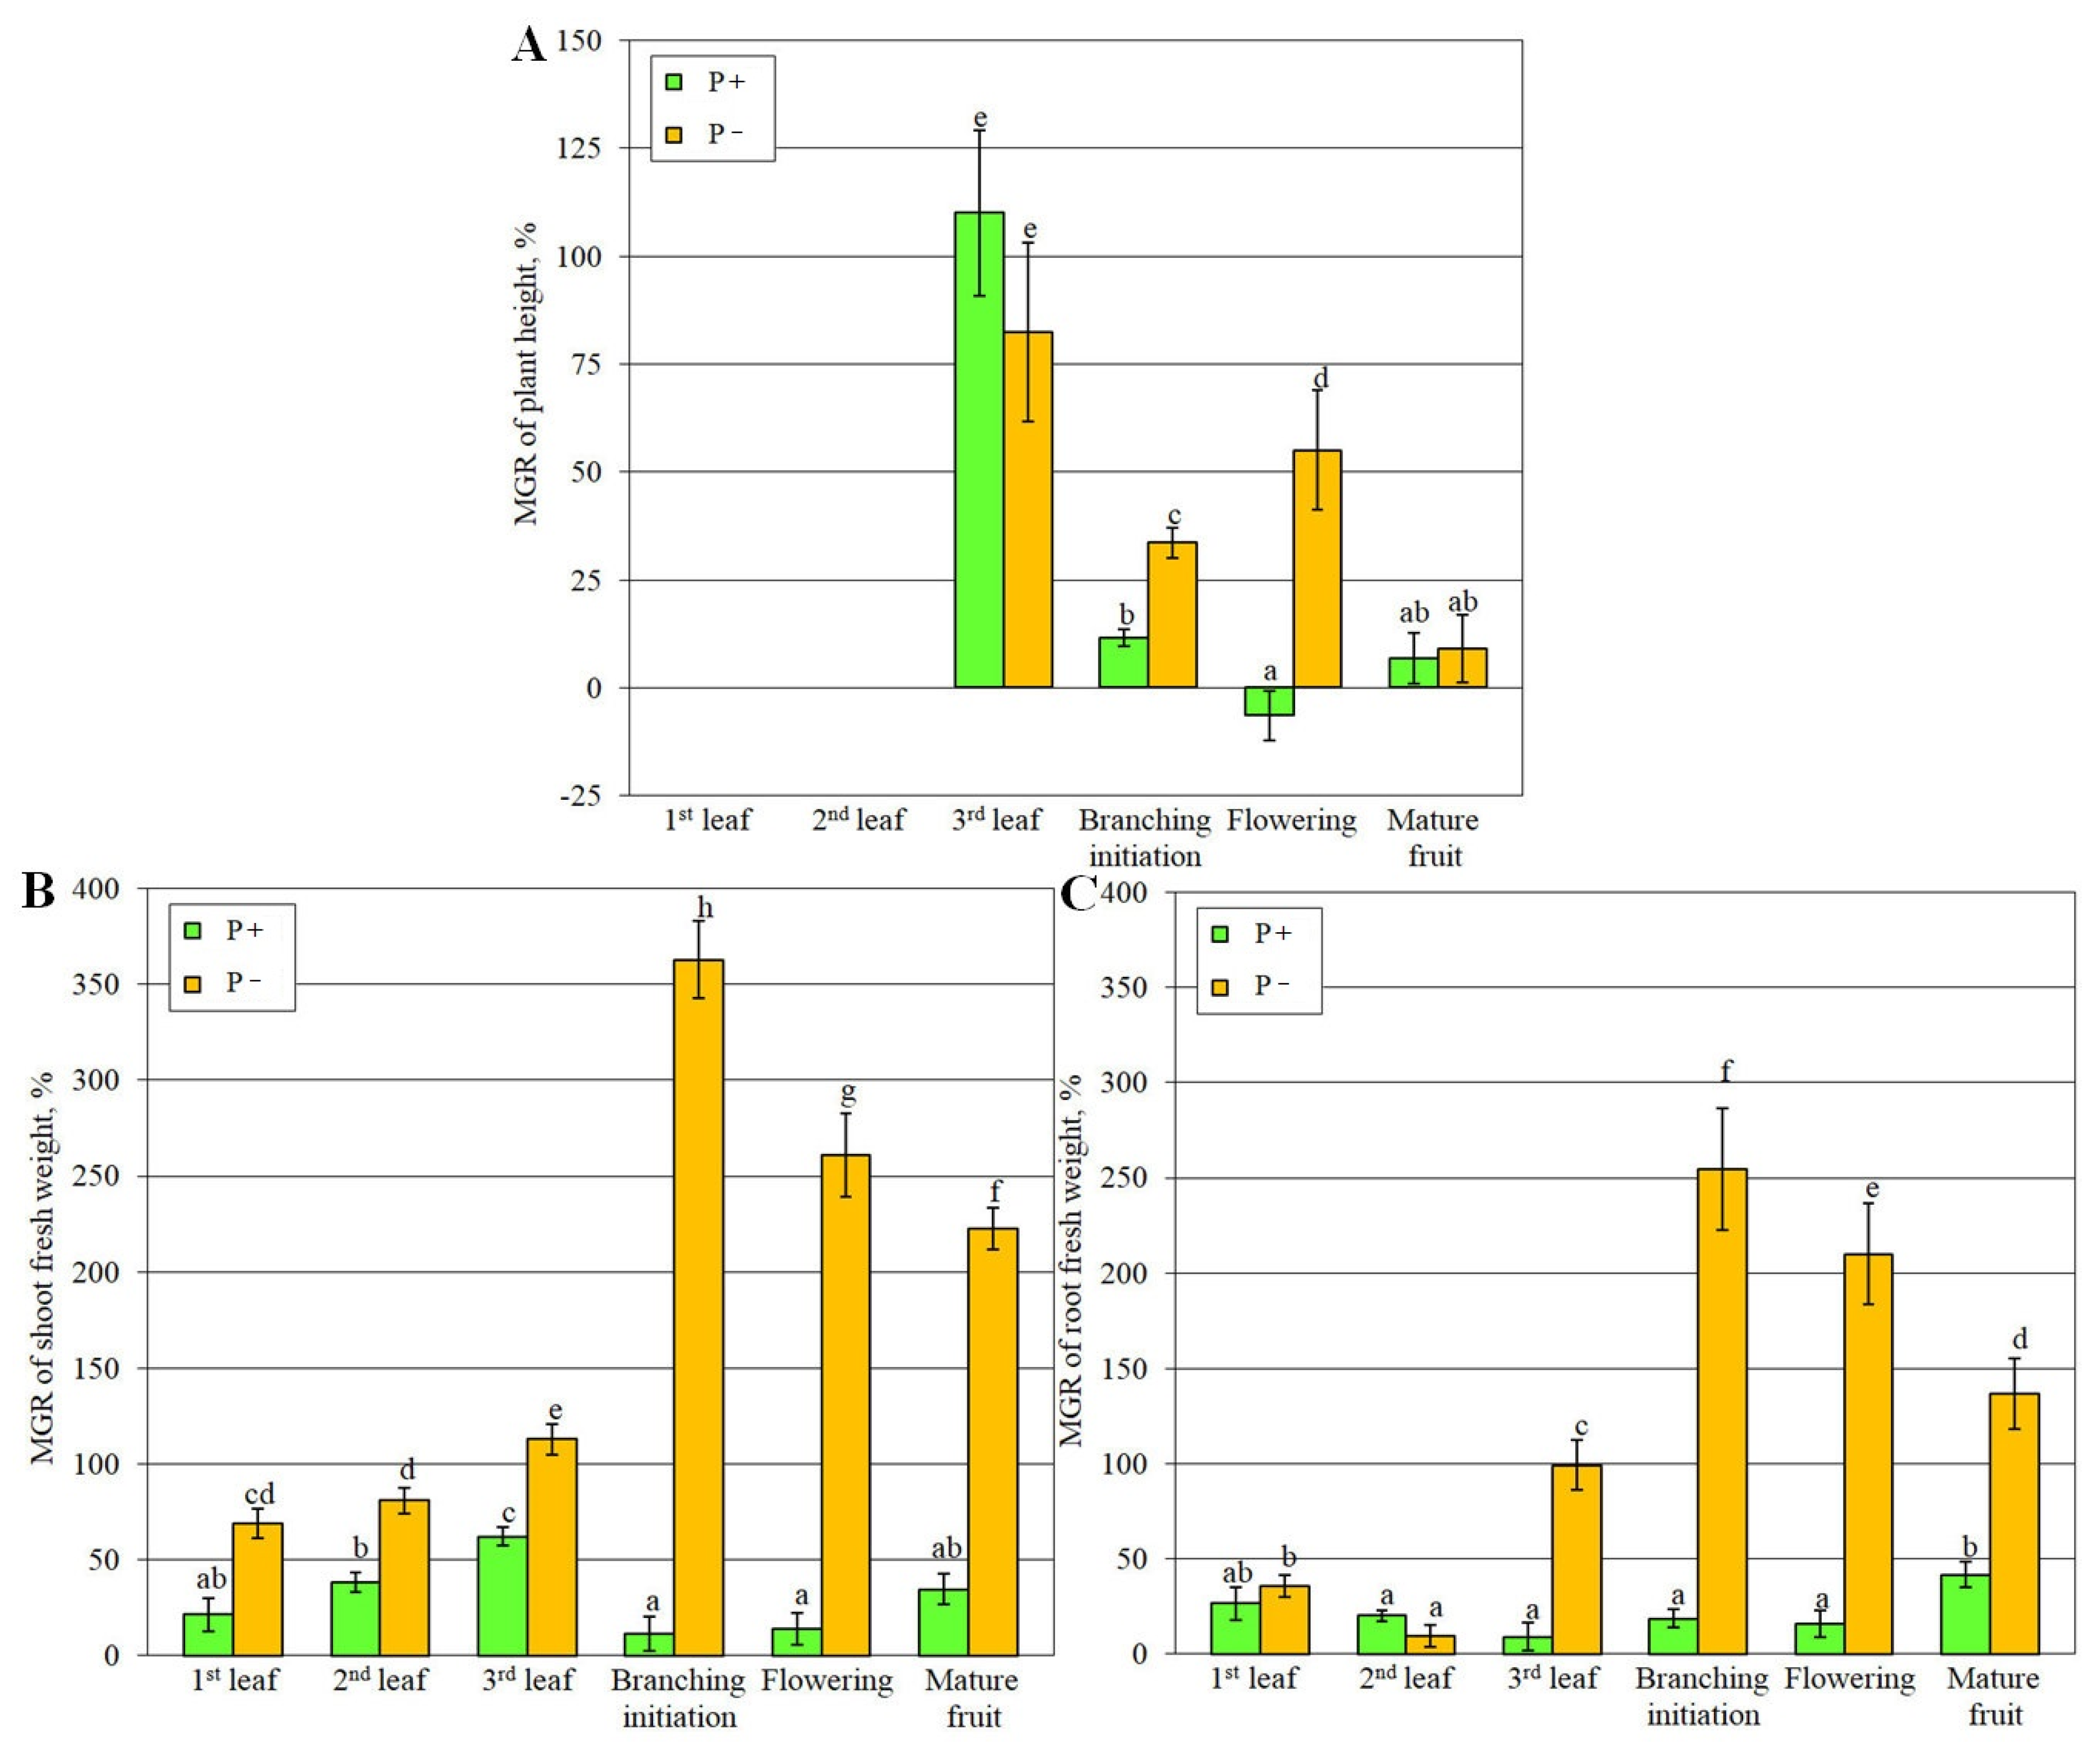
Figure 2.
Mycorrhizal intensity, M (A), abundance of arbuscules, A (B) and abundance of vesicules, B (C) in M. lupulina roots at different development stages. “1st leaf”, etc. – stages of plant development; “a”, “b”, “c” – different letters indicate significant differences within the same mycorrhizal parameter (ANOVA and Tukey’s test; p < 0.05). The average values with standard errors are presented.
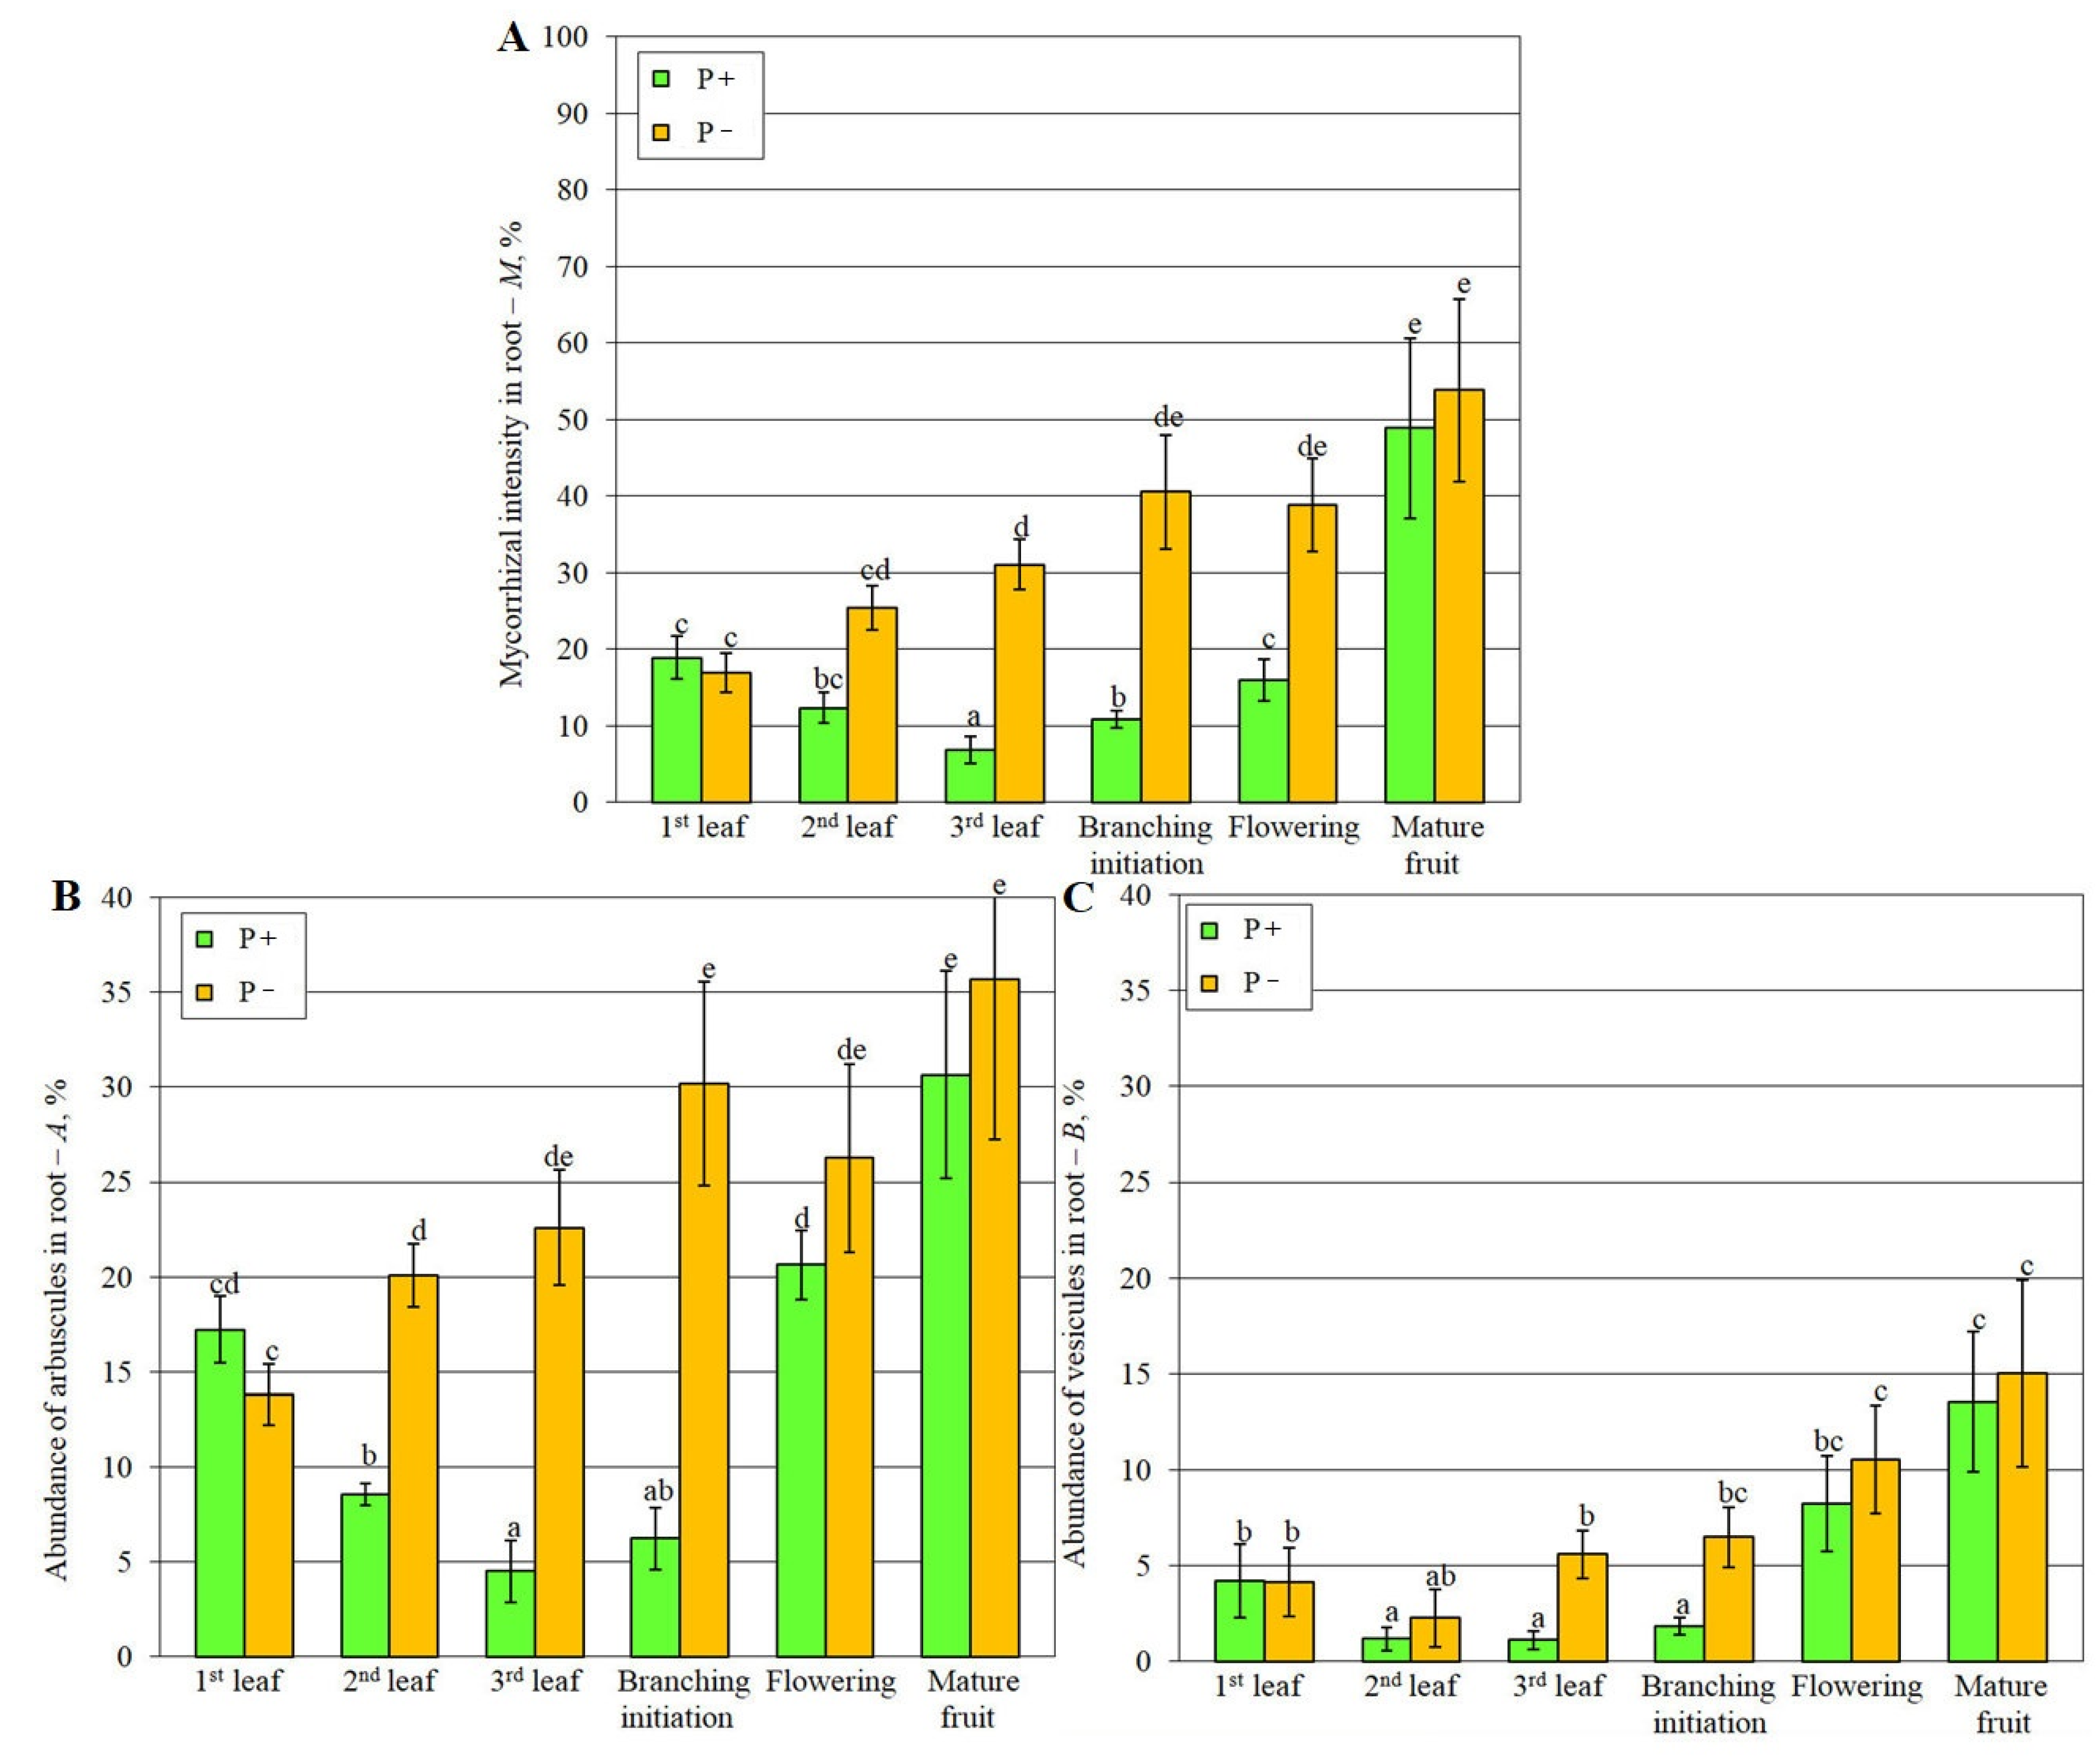
Figure 3.
Differences in the profiles of plant metabolites at different development stages (A) and with different mycorrhization and phosphorus status (B). Graphs of PCA accounts and the result of a decrease in the dimension of MDS. The points correspond to the profiles of metabolites, % is the proportion of variance associated with the main component (PC), ellipses are 90% intervals.
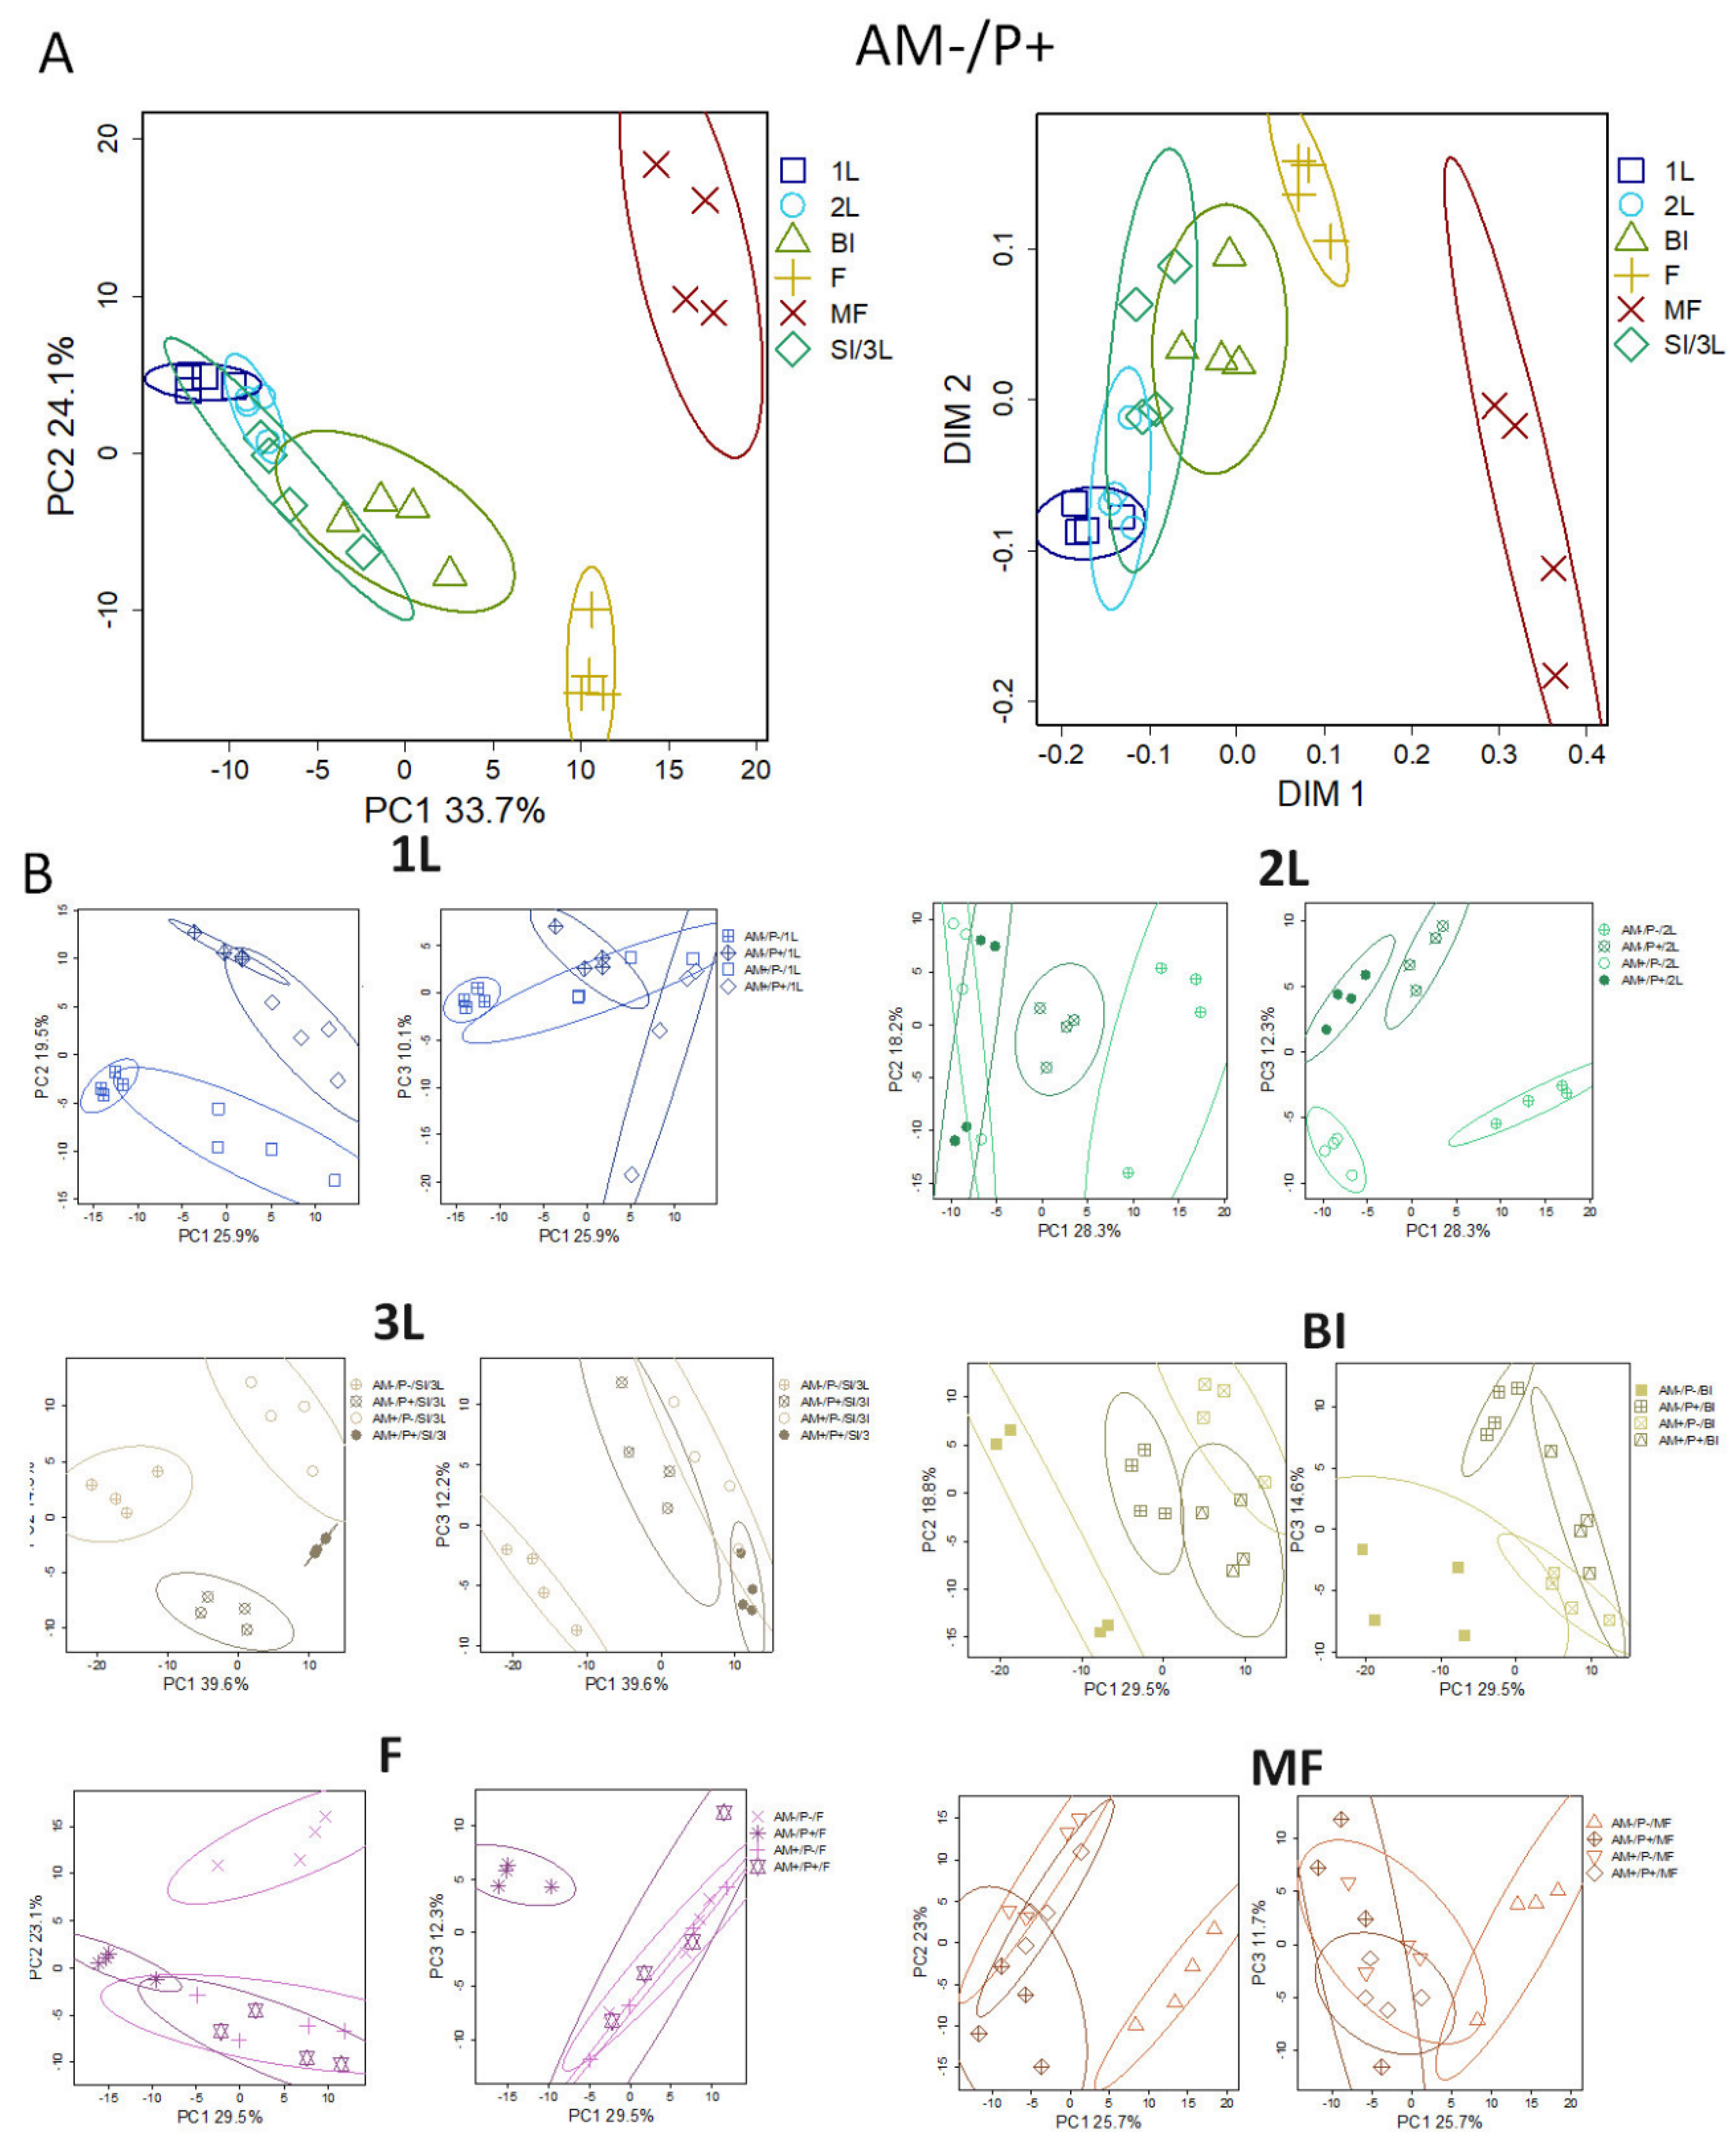
Figure 4.
1st leaf stage (1L). A. Differential accumulation of metabolites. Heat map of the difference between the average values (normalized and logarithmic) of the metabolites content in the roots of plants in AM+P+ (inoculated with AM fungi and with phosphorus treatment), in AM+P- (inoculated with AM fungi and without phosphorus treatment), in AM-P- (without AM fungi inoculation and without phosphorus treatment) and the control variant AM-P+ (without AM fungi inoculation with phosphorus treatment). The metabolites were selected according to VIP>1 predictive components of the OPLS_DA models. The red color corresponds to a higher level relative to AM-P+. B. Enrichment analysis for groups of metabolites.
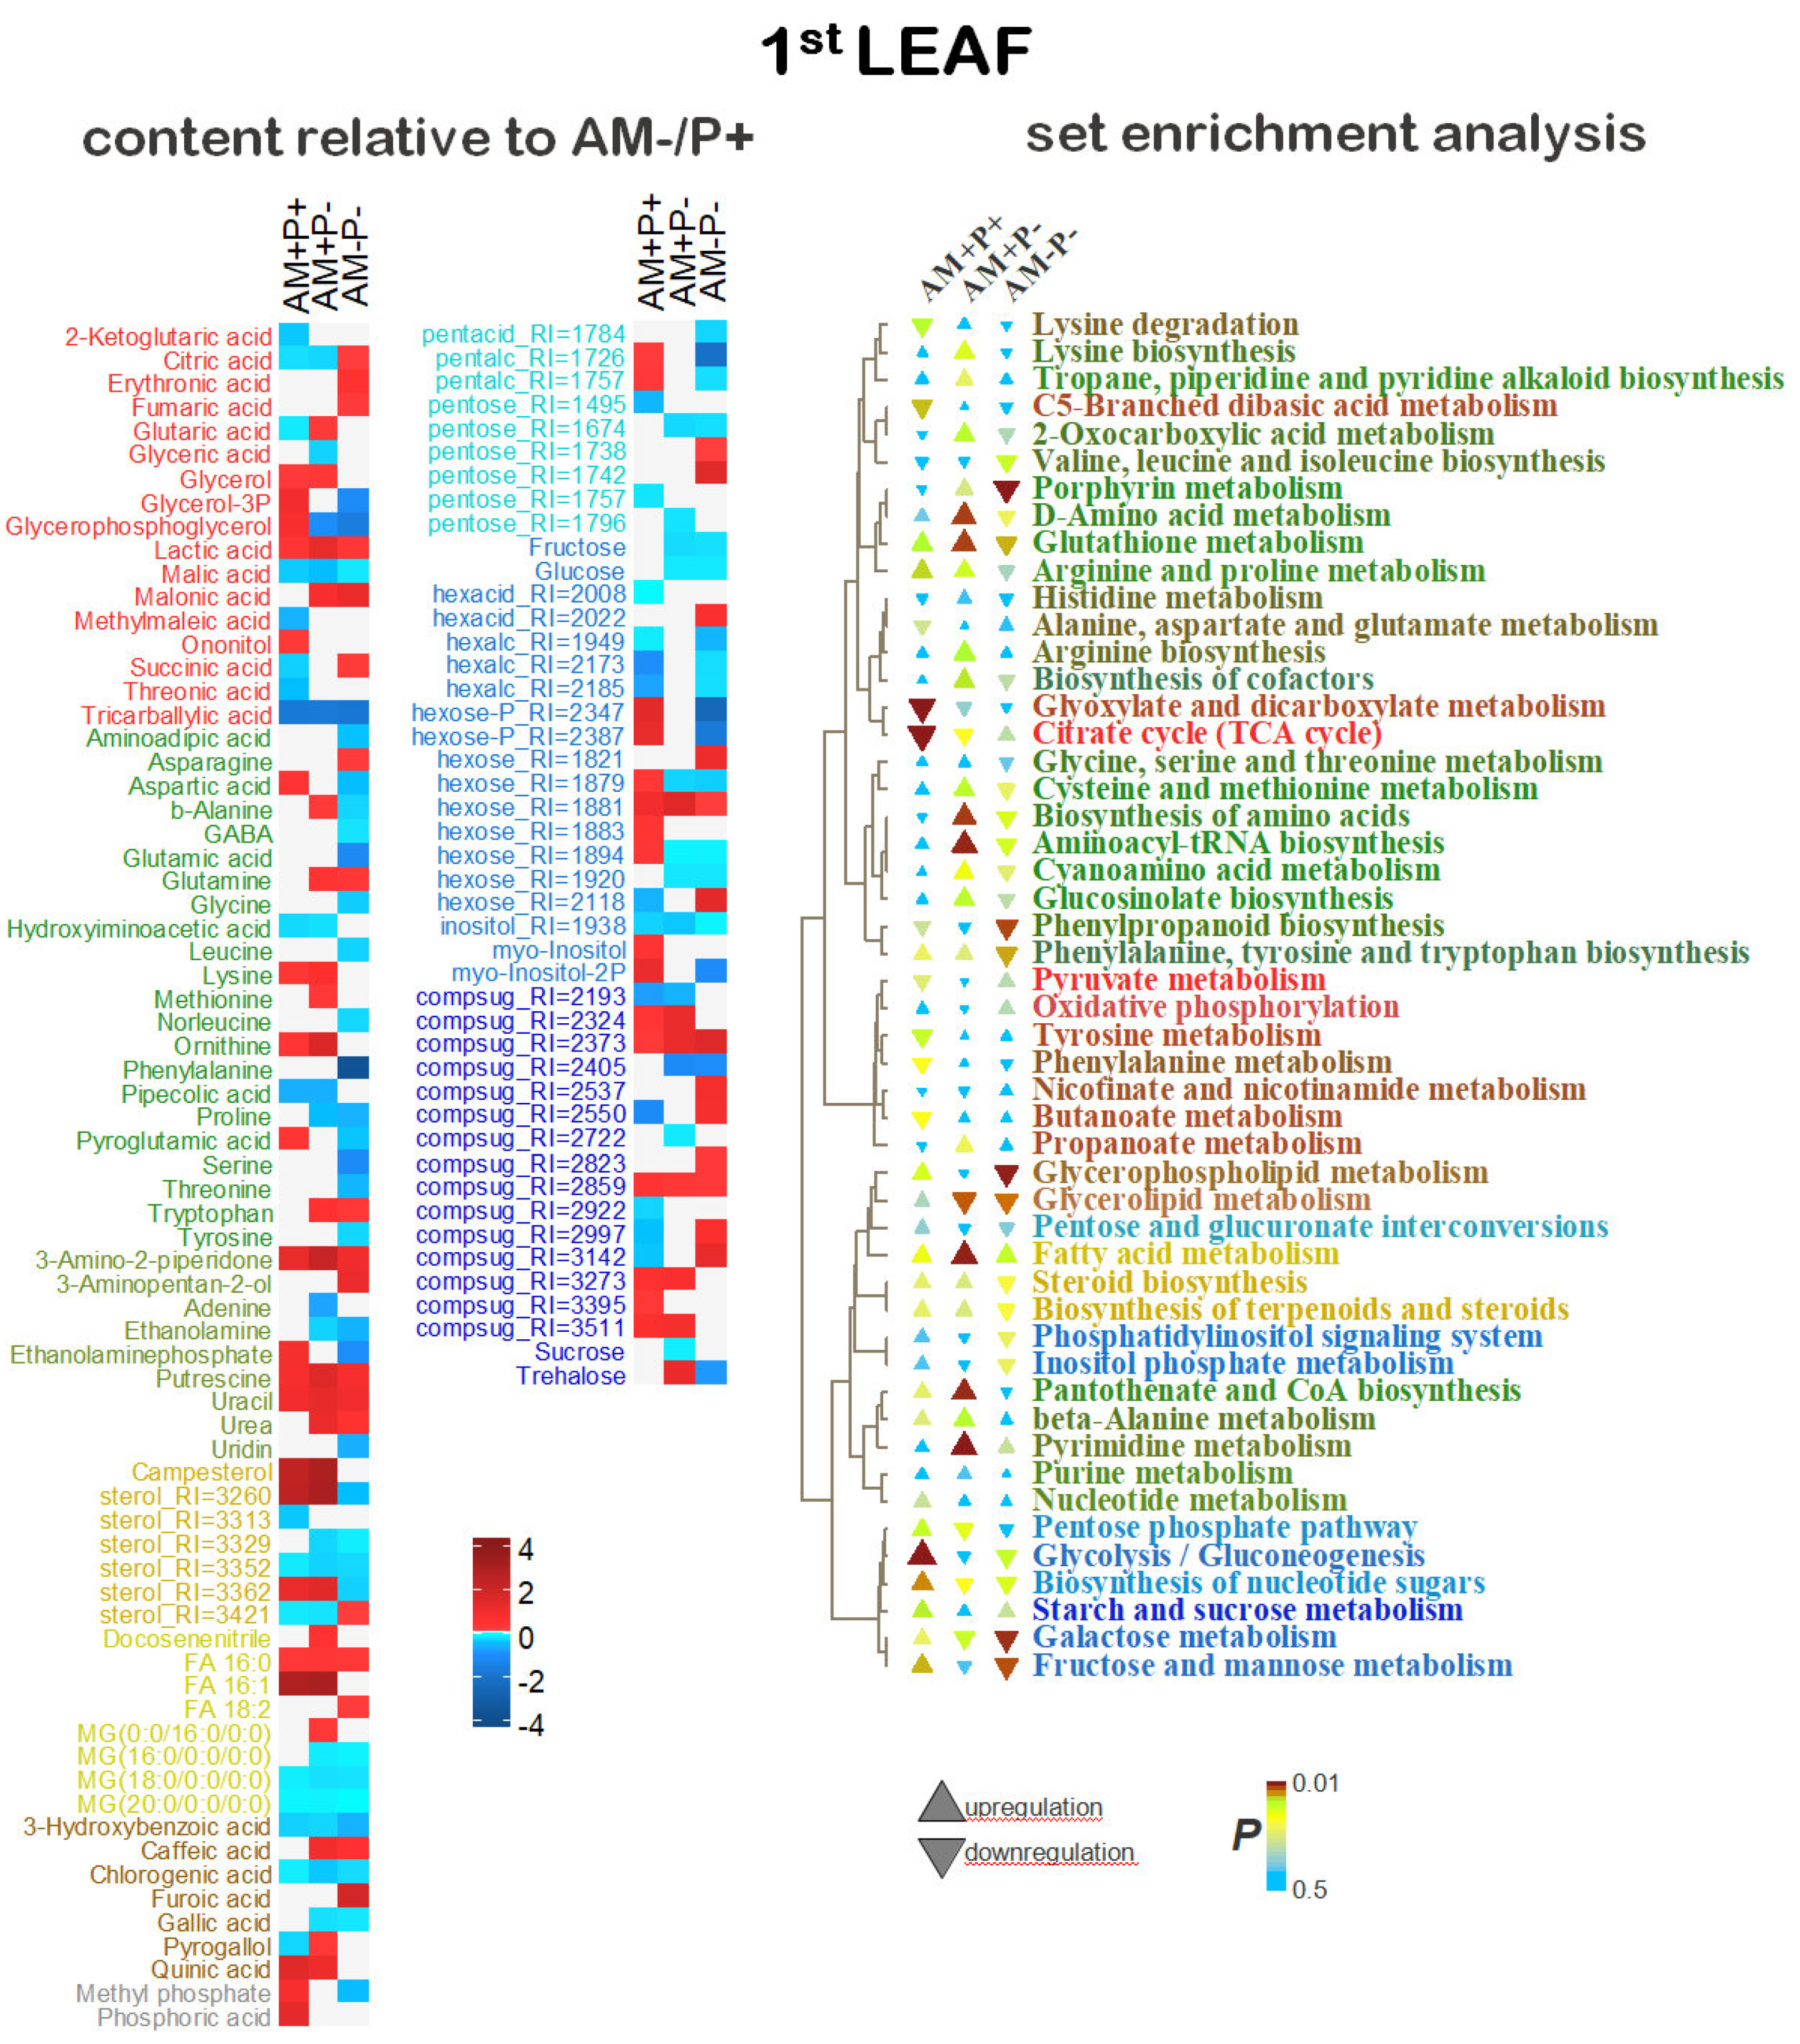
Figure 5.
2nd leaf stage (2L). A. Differential accumulation of metabolites. A heat map of the difference between the average values (normalized and logarithmic) of the content of metabolites in the roots of plants AM+P+, AM+P-, AM-P- and the control AM-P+. The metabolites were selected according to VIP>1 predictive components of the OPLS_DA models. The red color corresponds to a higher level relative to AM-P+. B. Enrichment analysis for groups of metabolites.
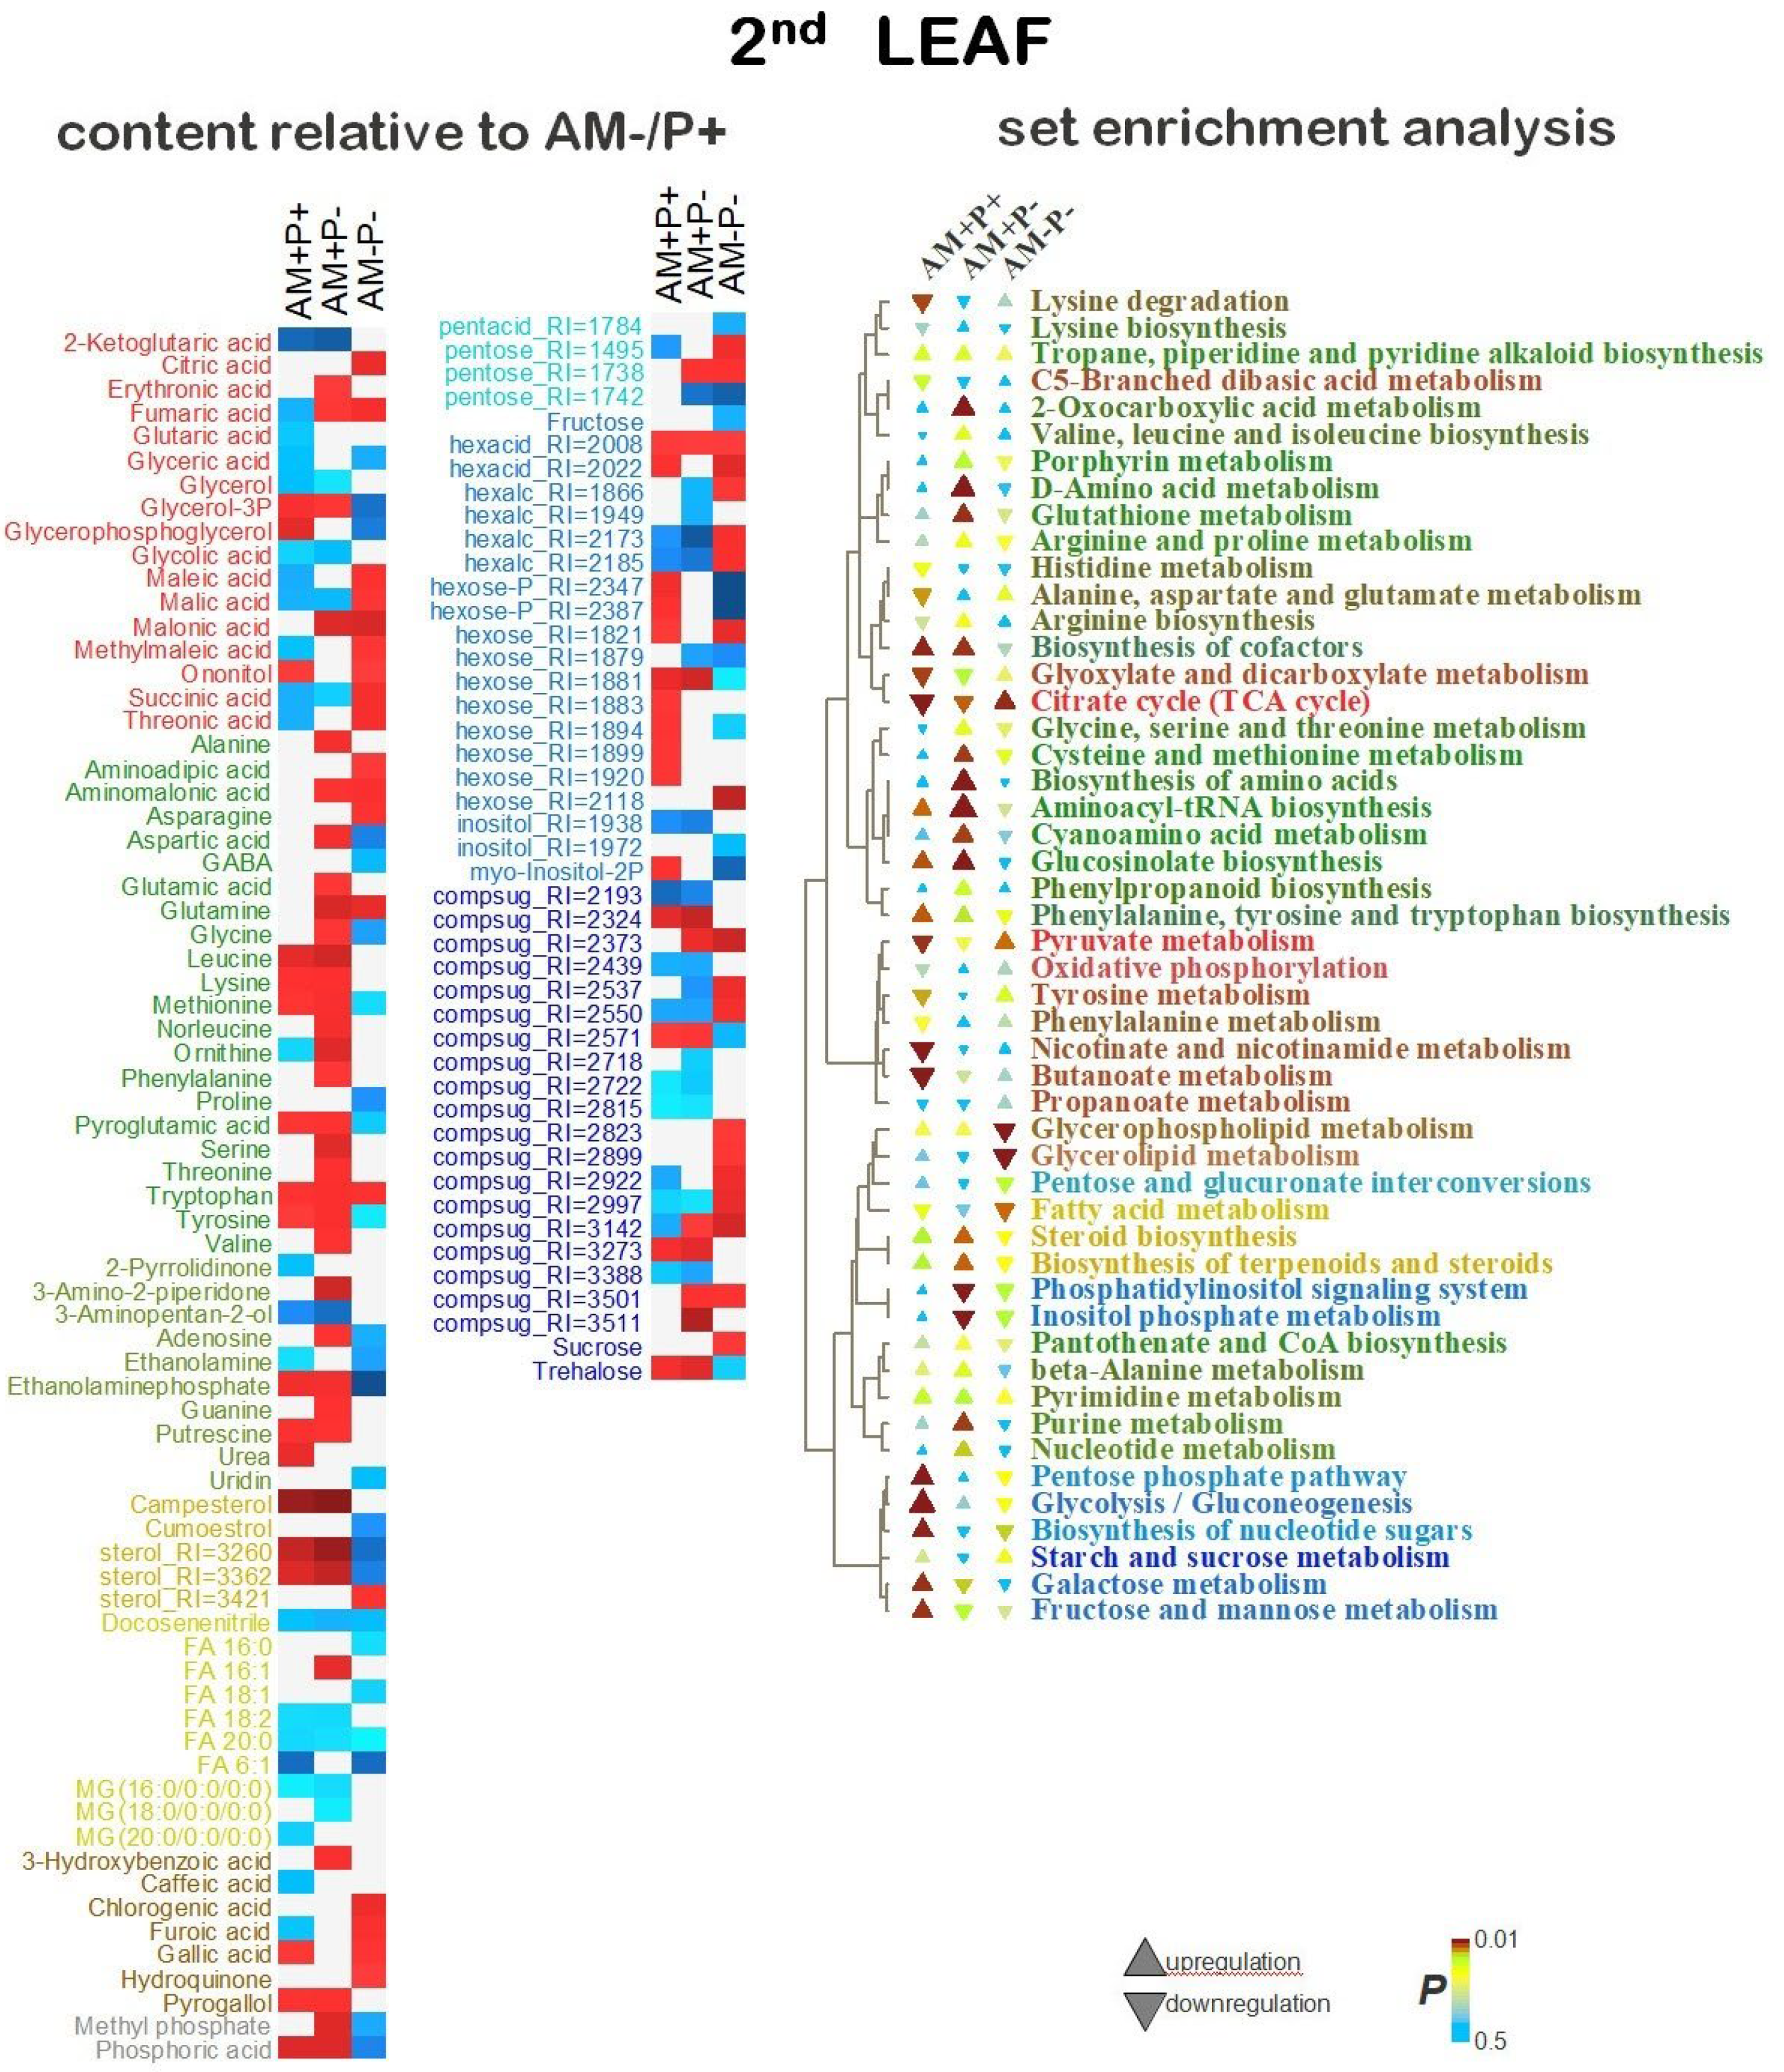
Figure 6.
The stooling initiation and the 3rd leaf (SI/3L) stage. A. Differential accumulation of metabolites. A heat map of the difference between the average values (normalized and logarithmic) of the content of metabolites in the roots of AM+P+, AM+P-, AM-P- and the control AM-P+. The metabolites were selected according to VIP>1 predictive components of the OPLS_DA models. The red color corresponds to a higher level relative to AM-P+. B. Enrichment analysis for groups of metabolites.
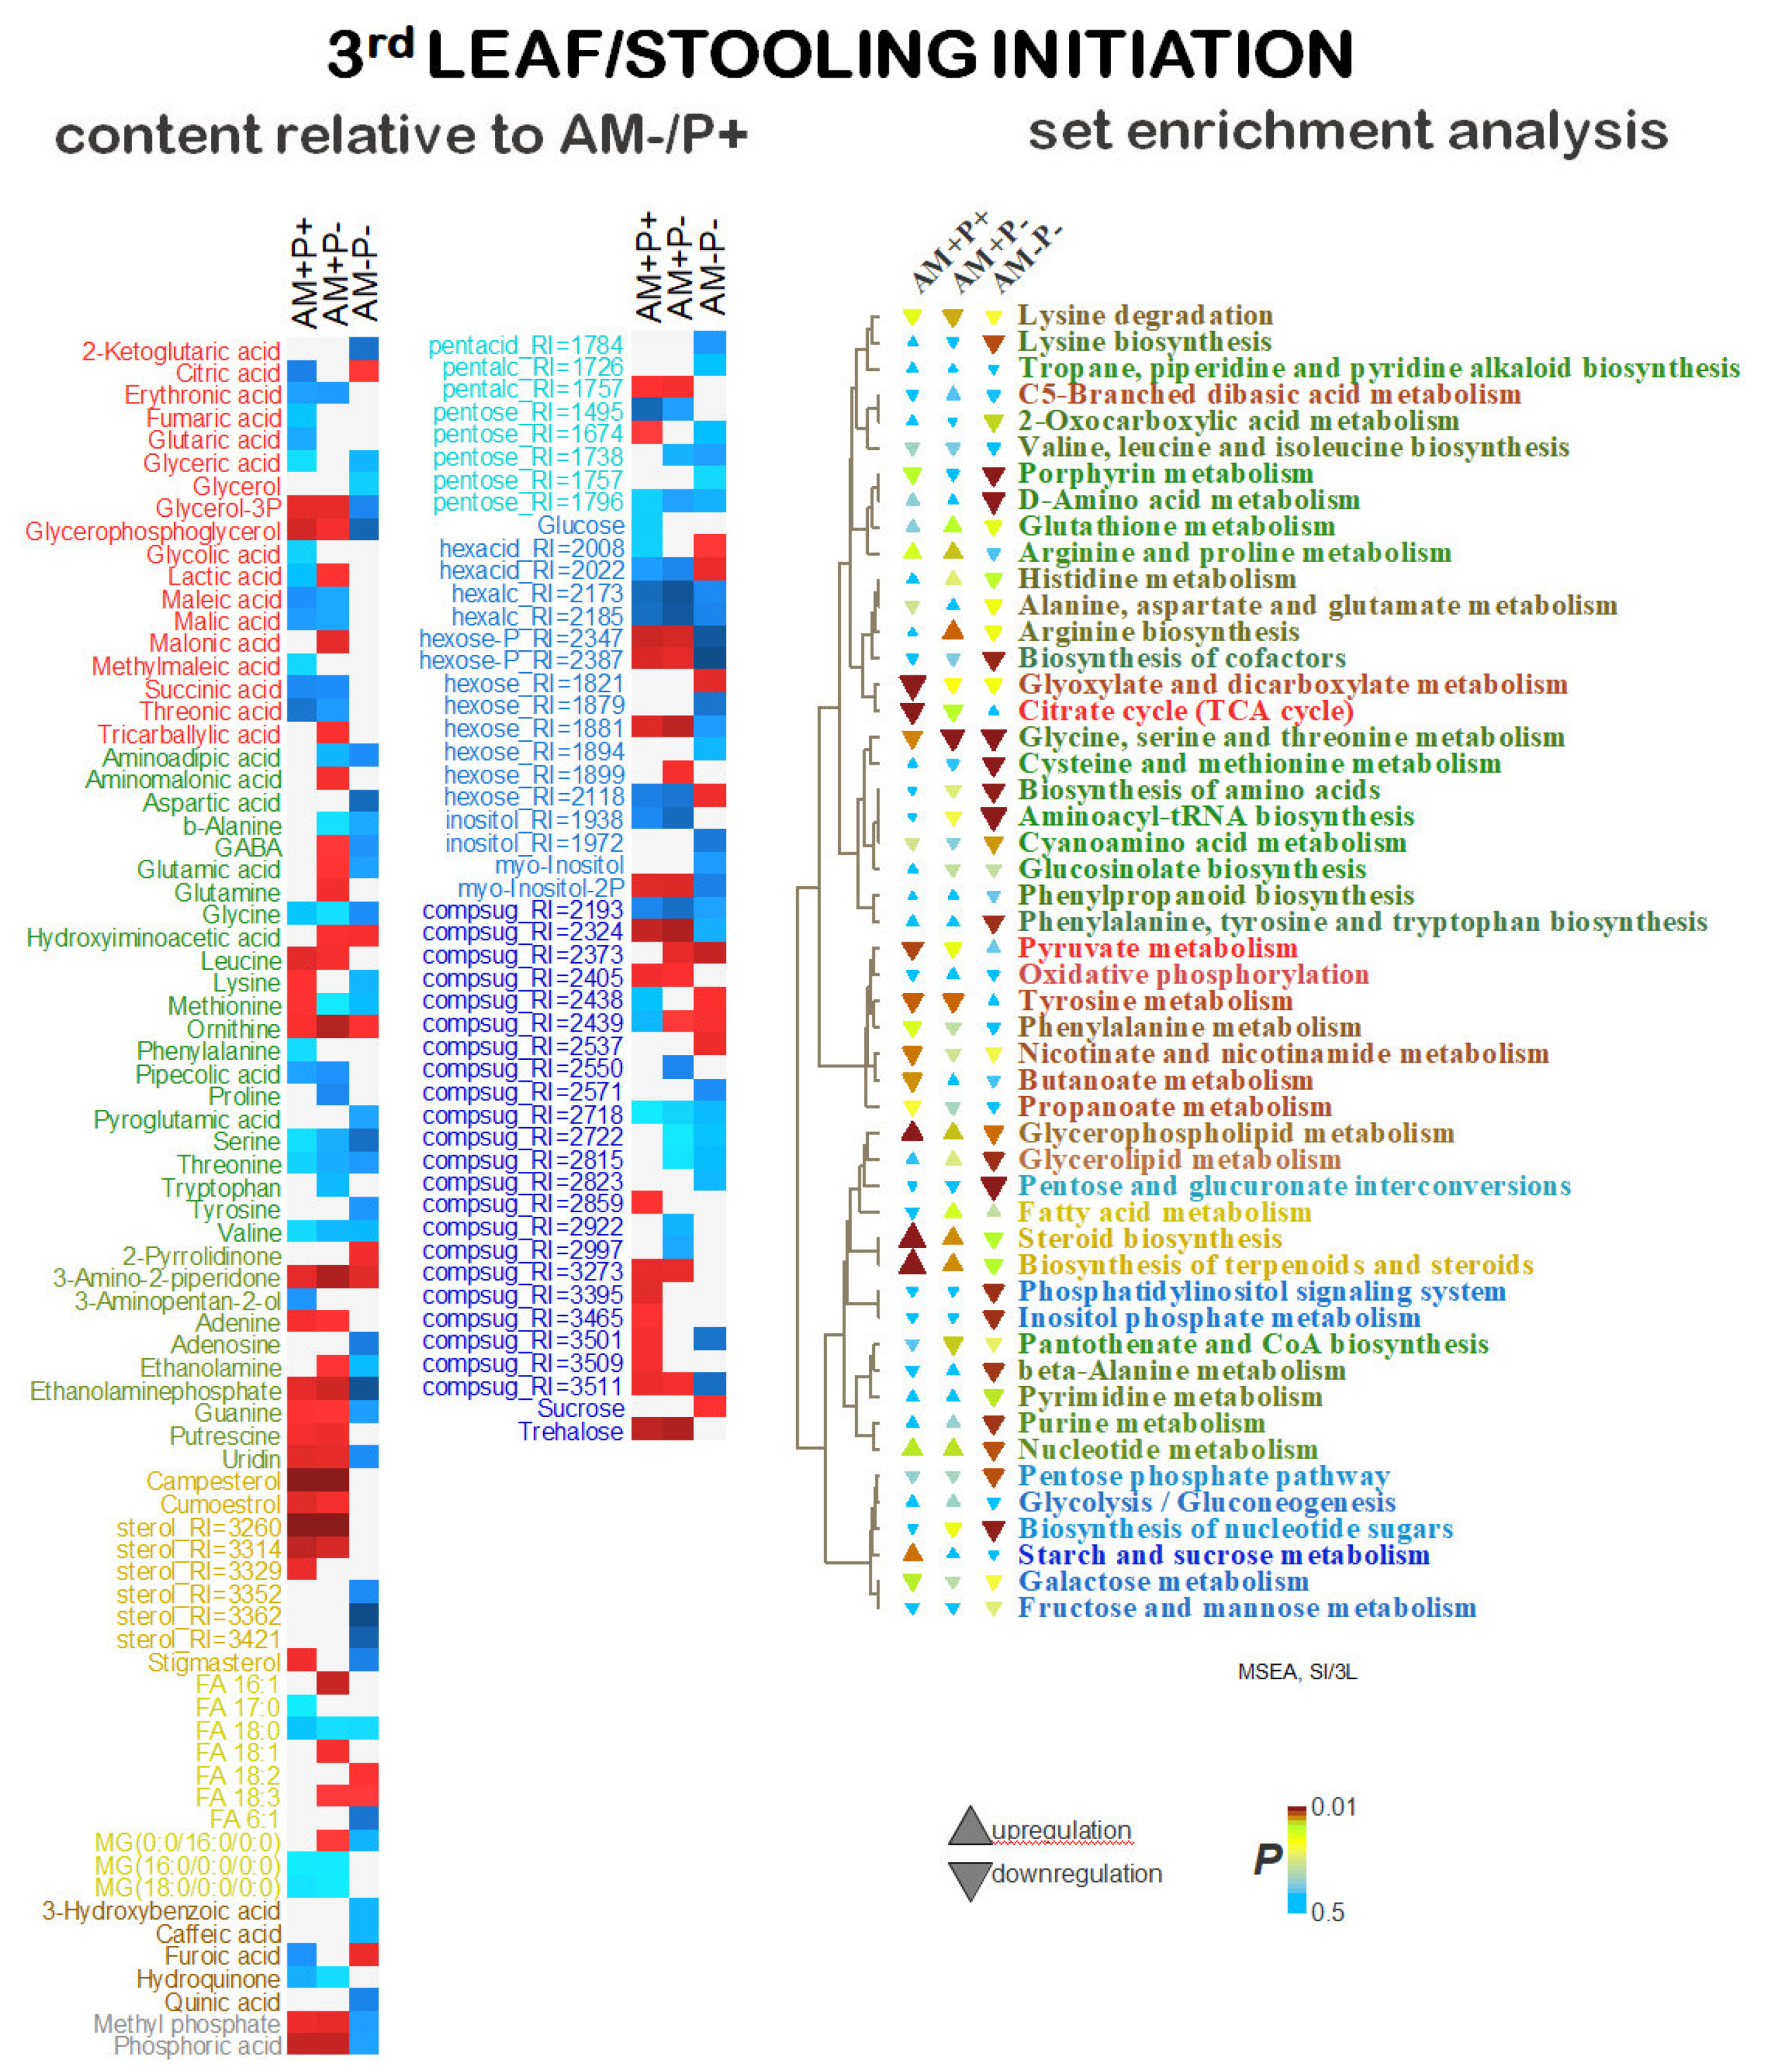
Figure 7.
Branching initiation stage (BI). A. Differential accumulation of metabolites. A heat map of the difference between the average values (normalized and logarithmic) of the metabolites content in the roots of AM+P+, AM+P-, AM-P- and the control AM-P+. The metabolites were selected according to VIP>1 predictive components of the OPLS_DA models. The red color corresponds to a higher level relative to AM-P+. B. Enrichment analysis for groups of metabolites.
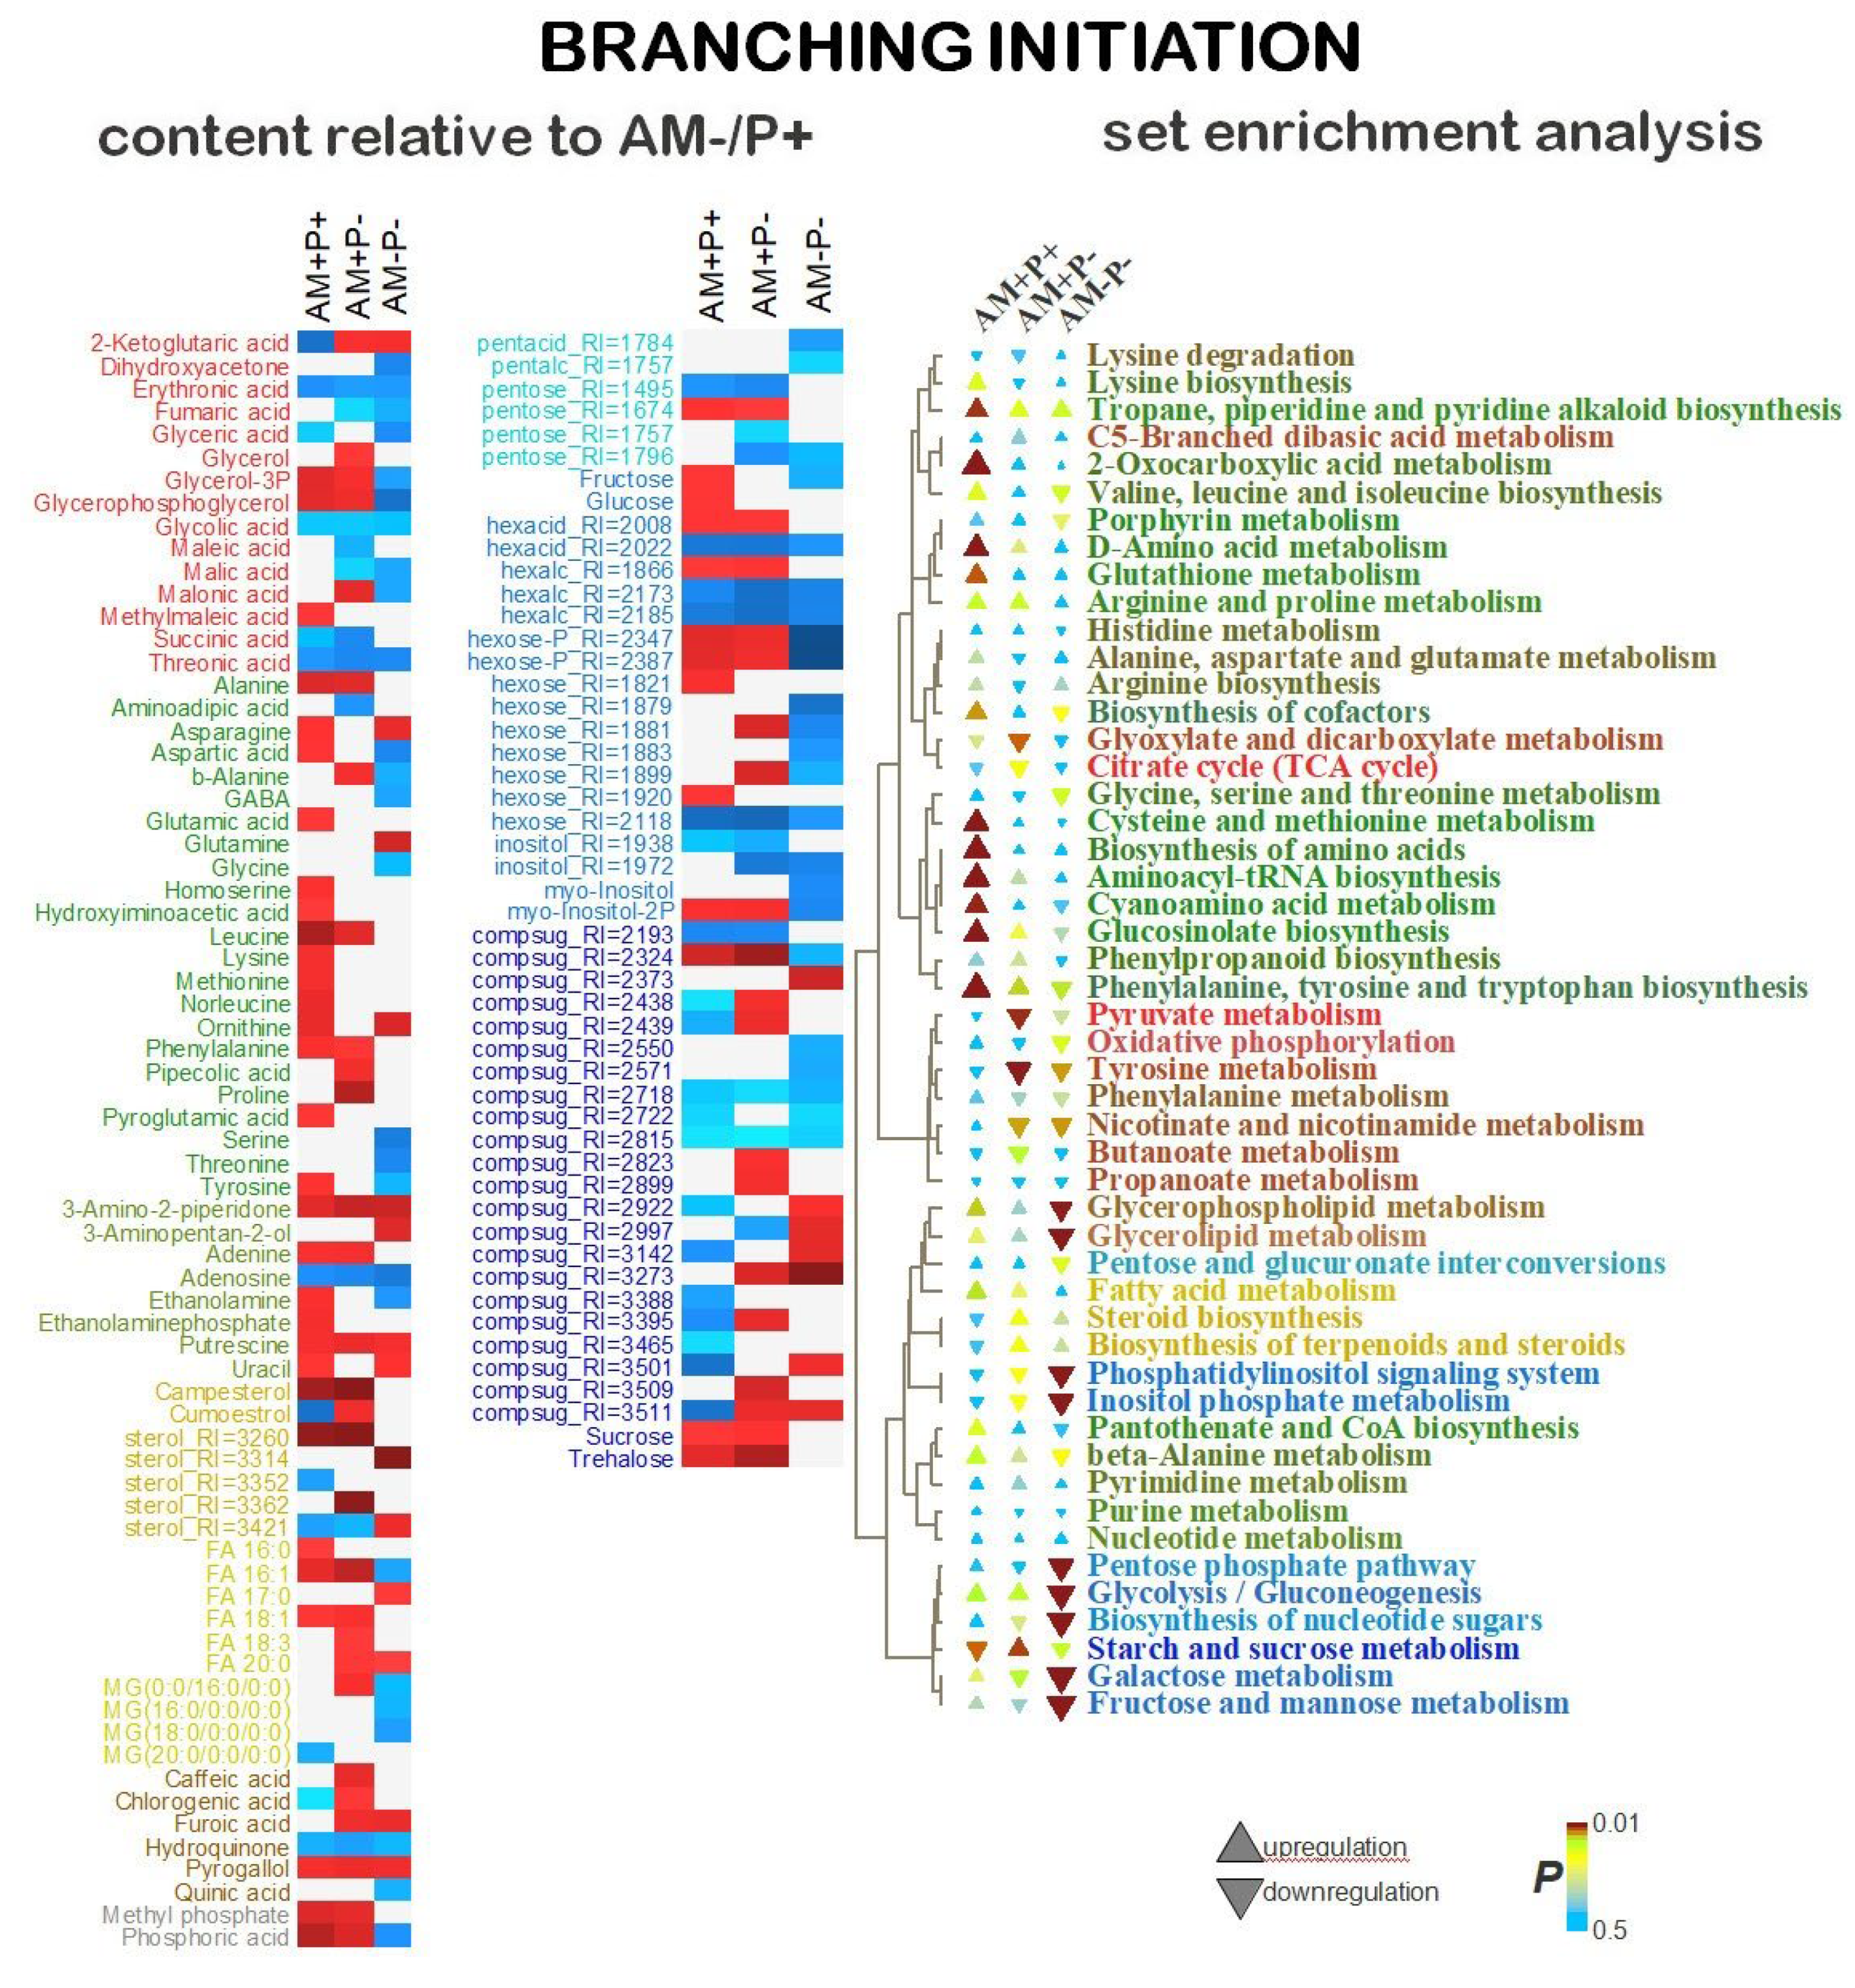
Figure 8.
Flowering stage (F). A. Differential accumulation of metabolites. A heat map of the difference between the average values (normalized and logarithmic) of the content of metabolites in the roots of AM+P+, AM+P-, AM-P- and the control AM-P+. The metabolites were selected according to VIP>1 predictive components of the OPLS_DA models. The red color corresponds to a higher level relative to AM-P+. B. Enrichment analysis for groups of metabolites.
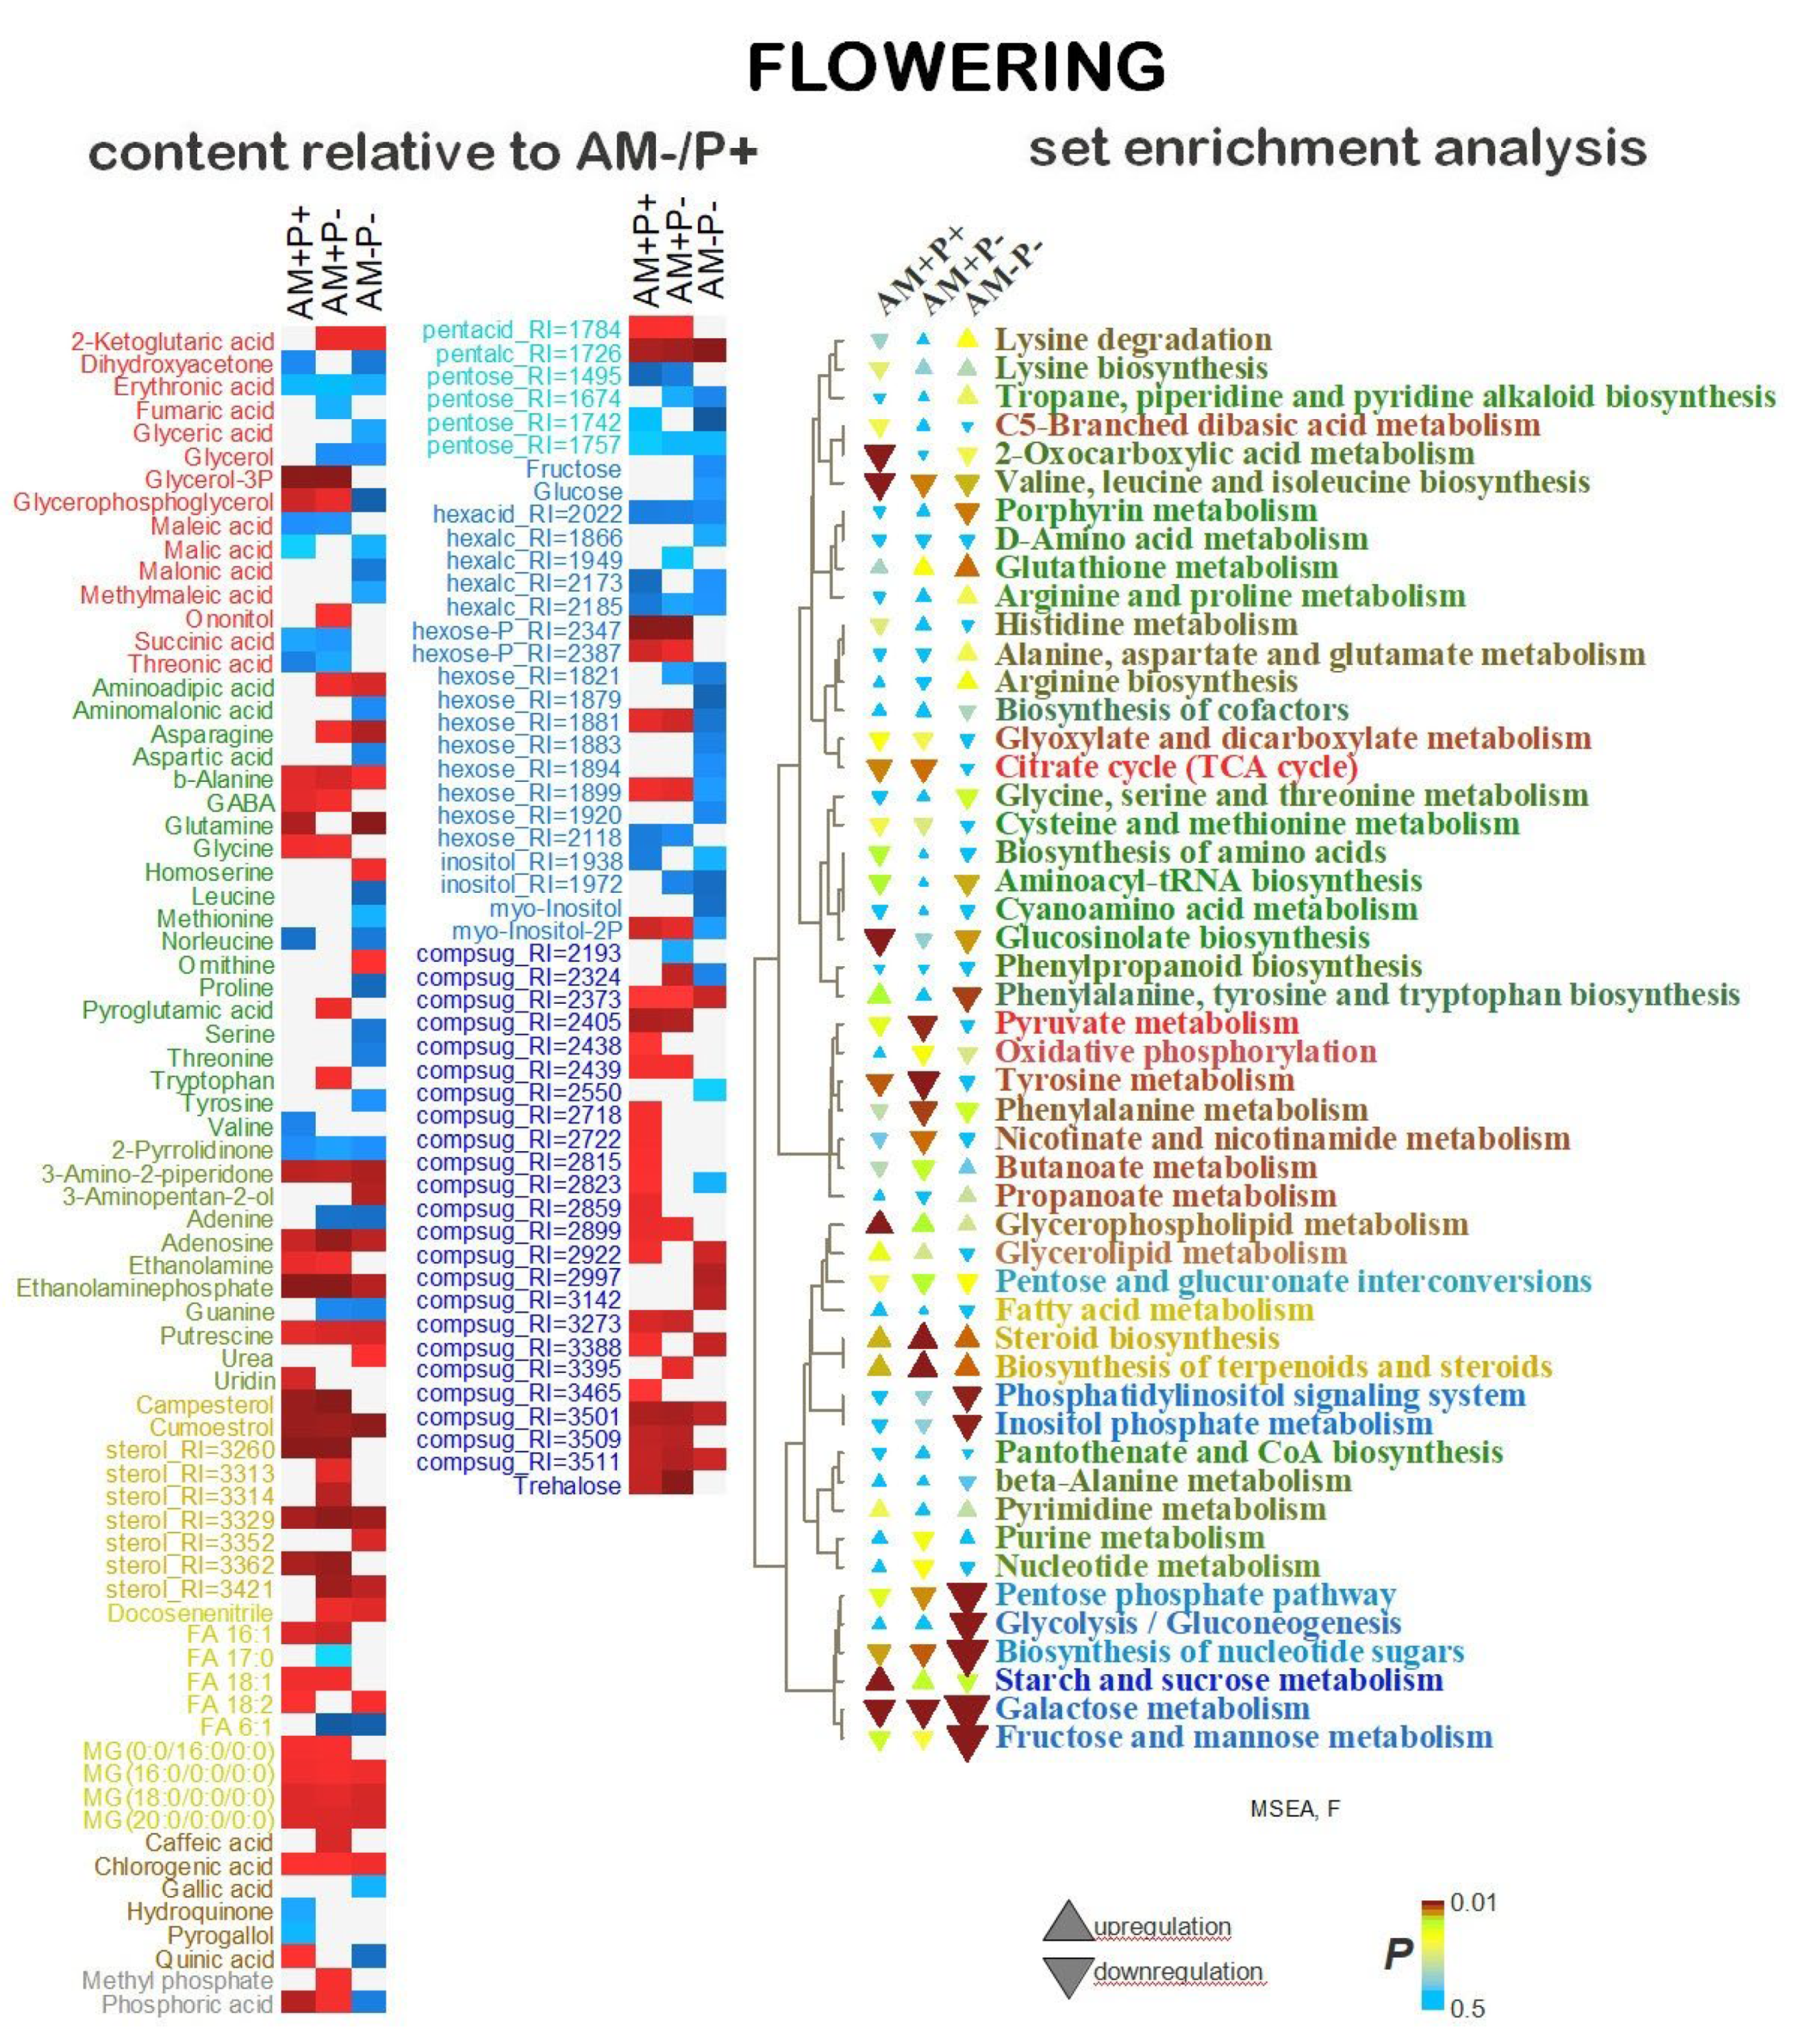
Figure 9.
Mature fruit stage (MF). A. Differential accumulation of metabolites. A heat map of the difference between the average values (normalized and logarithmic) of the content of metabolites in the roots of AM+P+, AM+P-, AM-P- and the control AM-P+. The metabolites were selected according to VIP>1 predictive components of the OPLS_DA models. The red color corresponds to a higher level relative to AM-P+. B. Enrichment analysis for groups of metabolites.
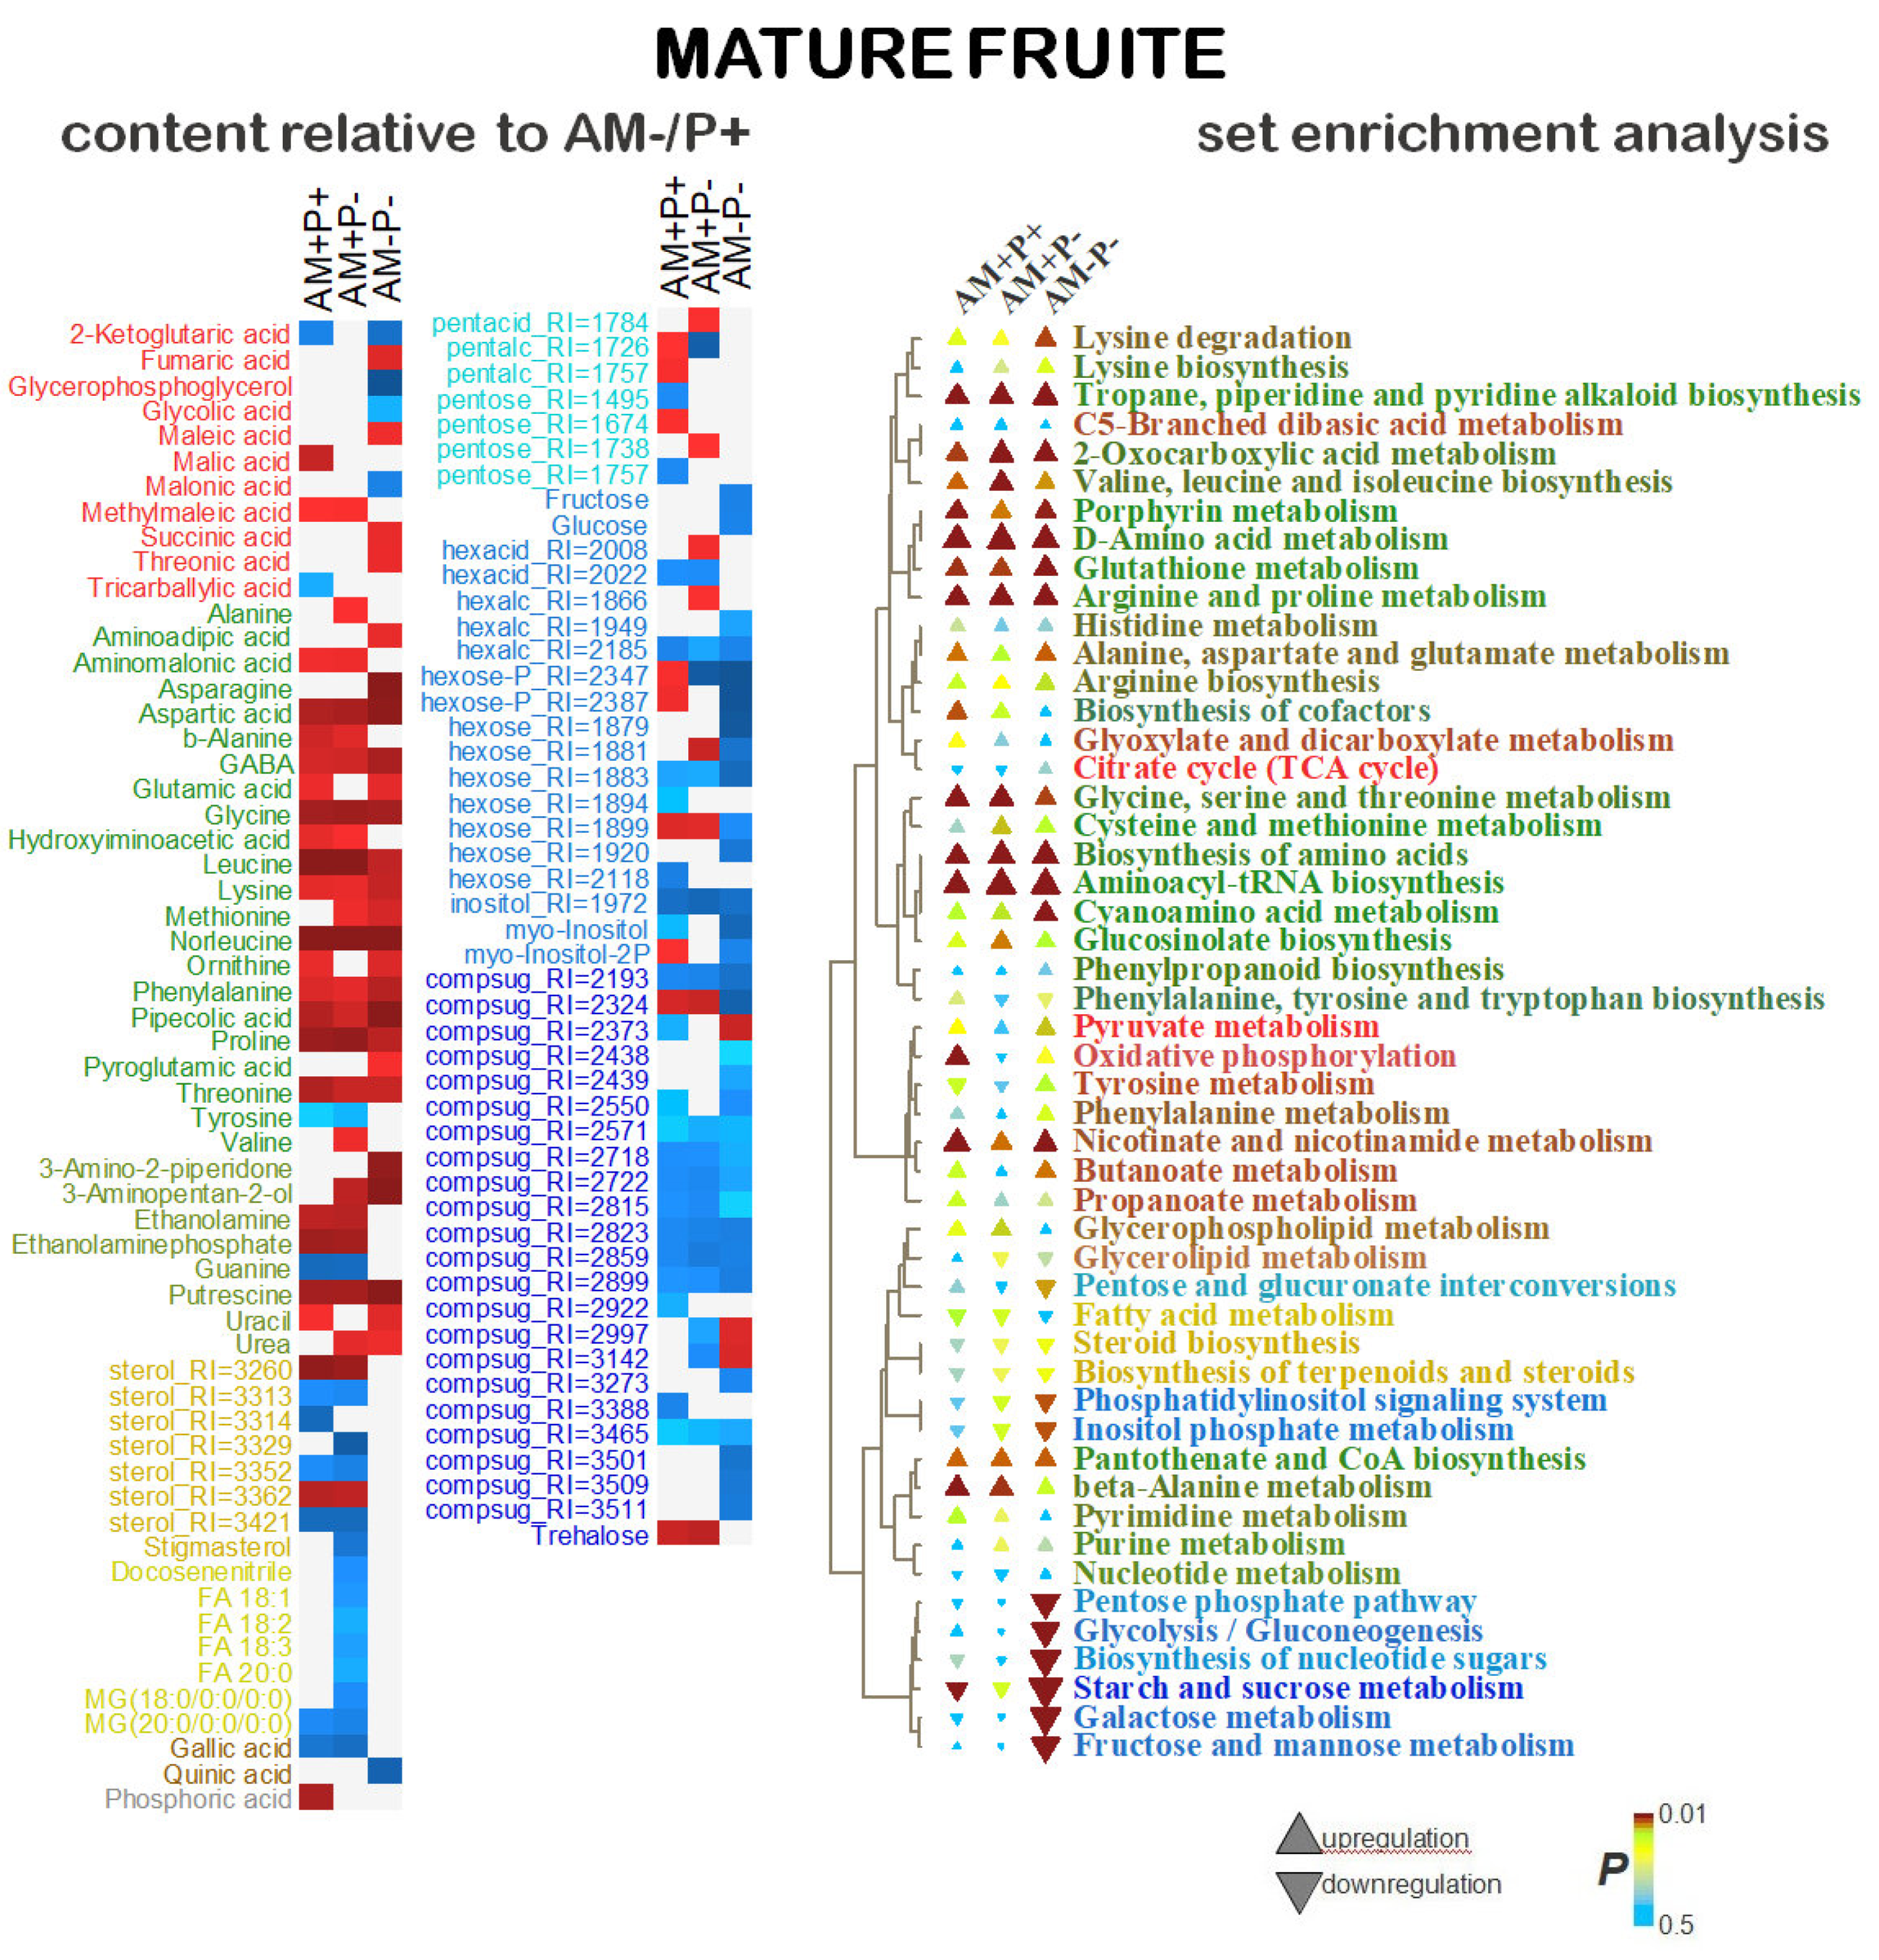
Figure 10.
The effect of micronization and phosphorus on the metabolite content correlations. Maps of metabolites based on strong (r>0.90) correlations of average levels of content at each point of plant development. The nodes correspond to the metabolites, the shape and color reflect the chemical nature of the compound. The edges correspond to correlations (blue – negative correlation, red – positive correlation). Positive relationships tighten the knots. The variants are clustered by similarity of correlations for pairs of metabolites, Spearman’s distance (1-rho).
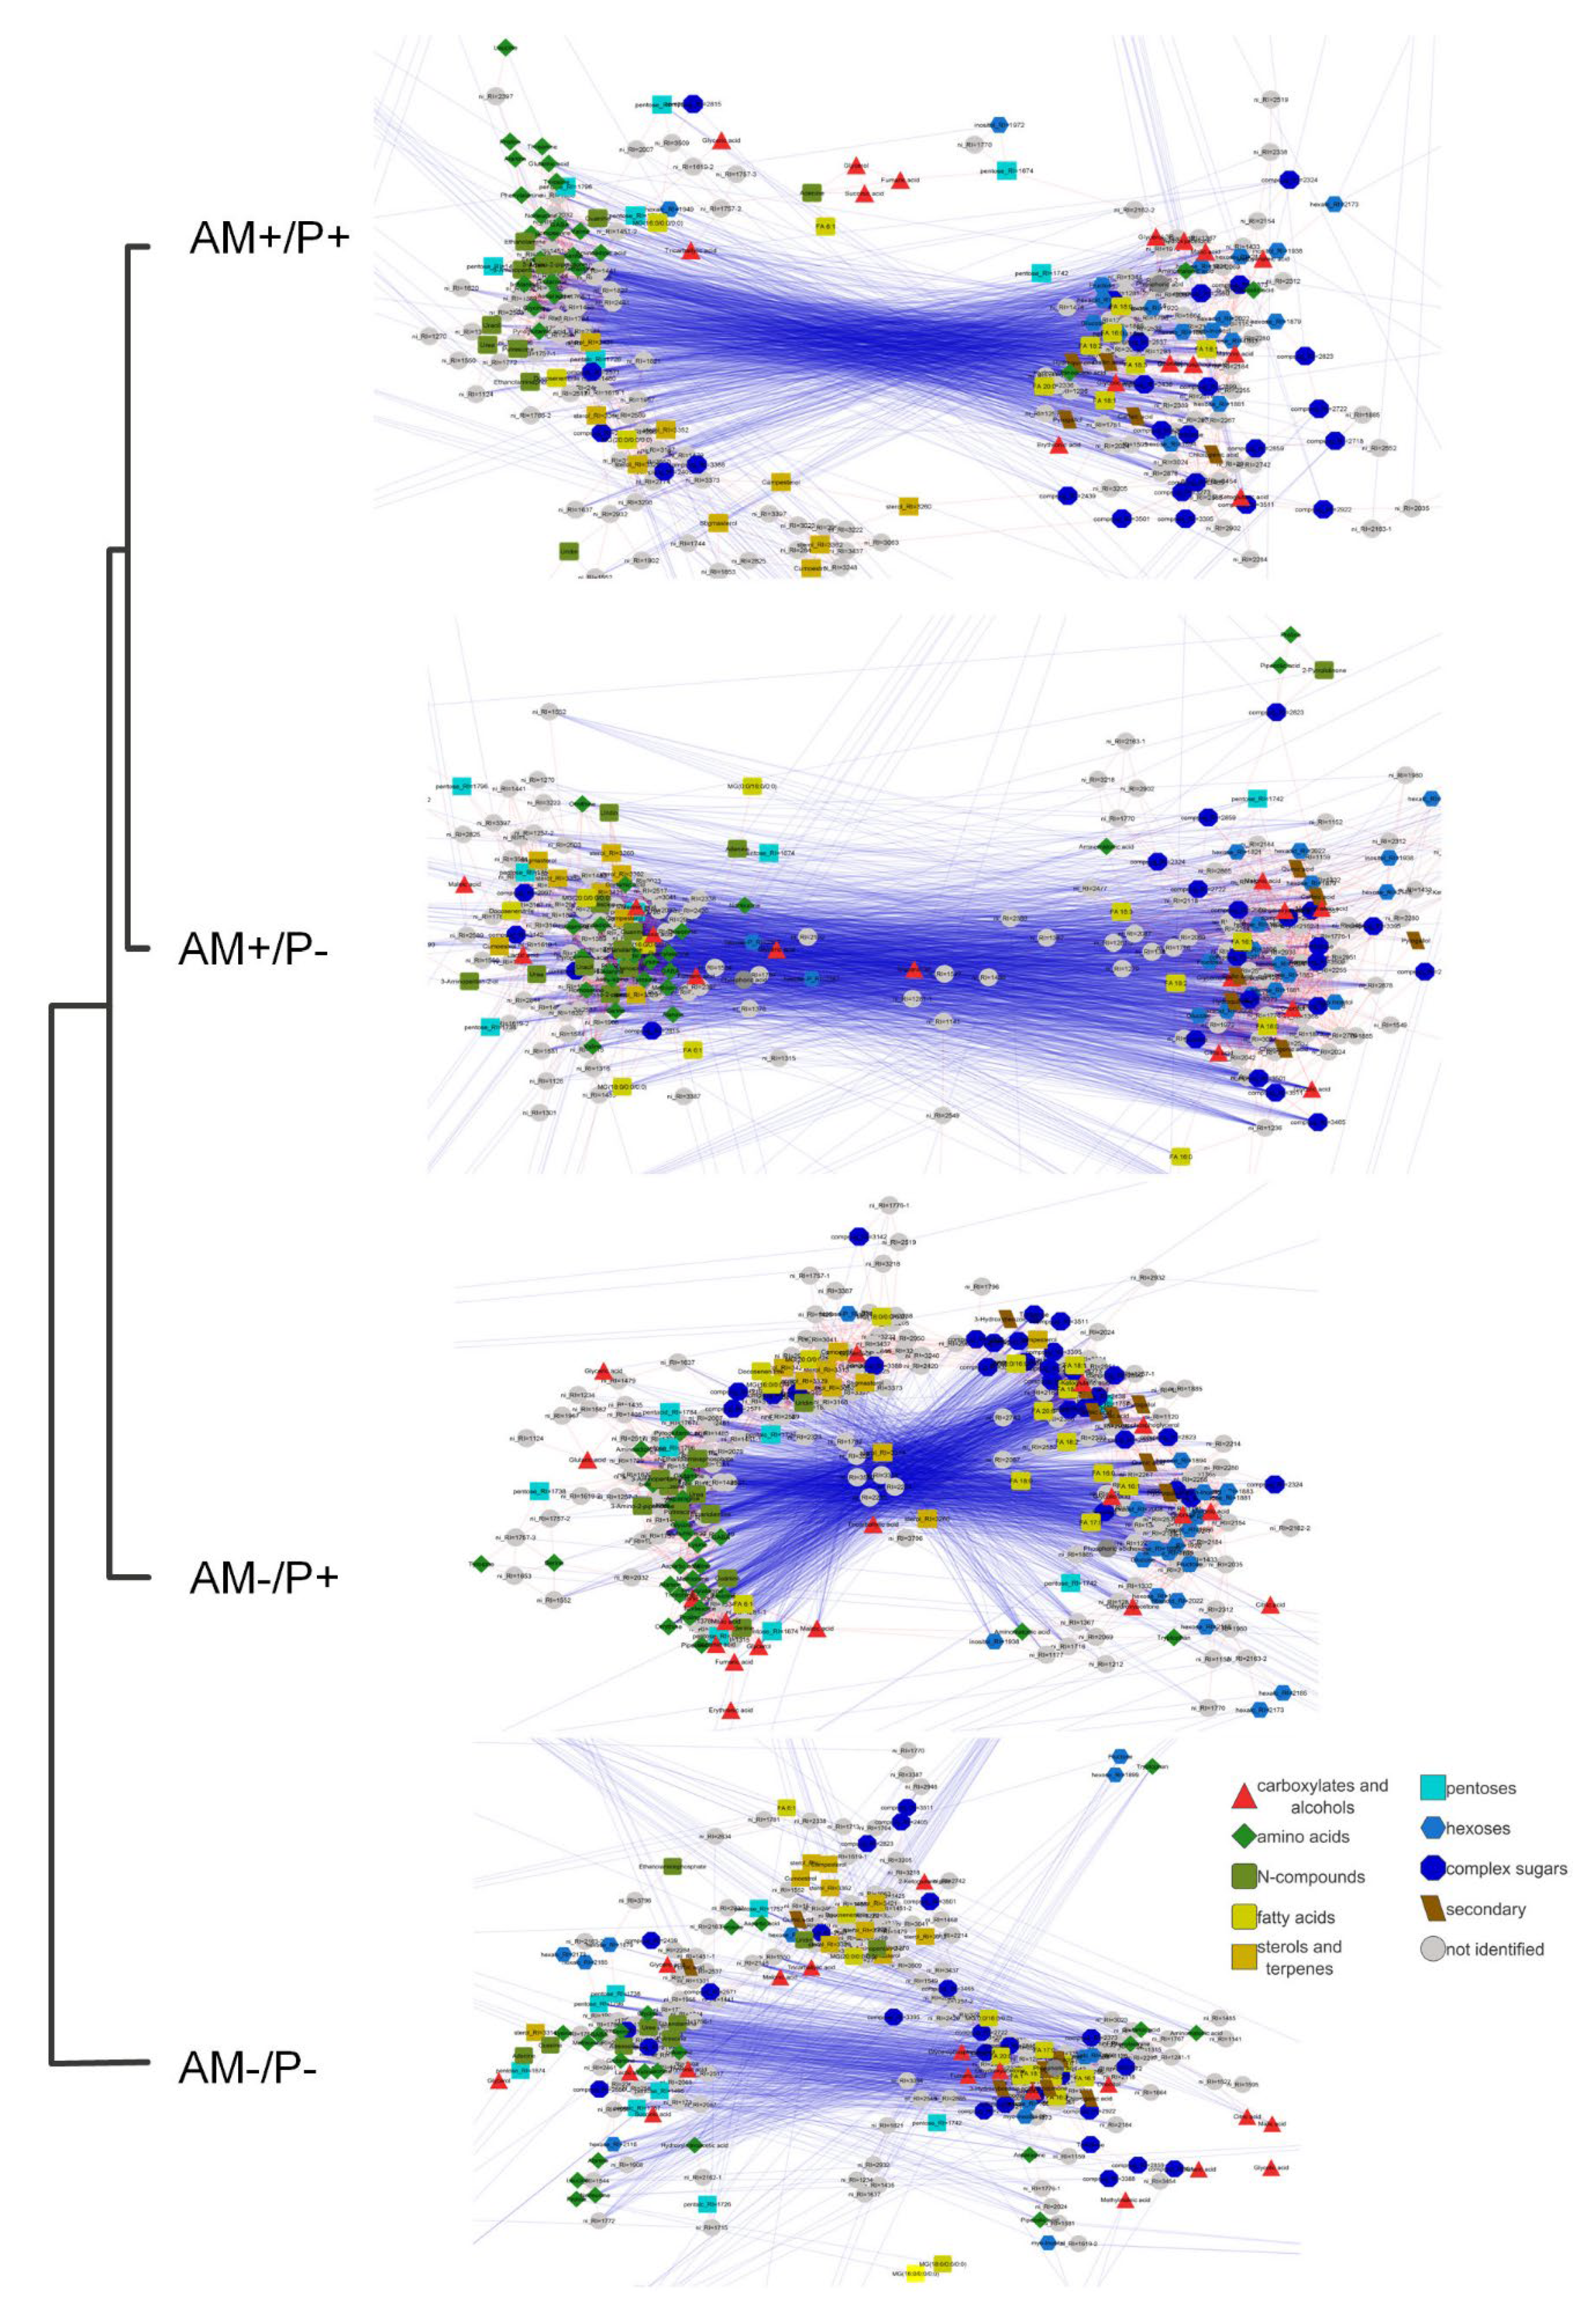
Disclaimer/Publisher’s Note: The statements, opinions and data contained in all publications are solely those of the individual author(s) and contributor(s) and not of MDPI and/or the editor(s). MDPI and/or the editor(s) disclaim responsibility for any injury to people or property resulting from any ideas, methods, instructions or products referred to in the content. |
© 2024 by the authors. Licensee MDPI, Basel, Switzerland. This article is an open access article distributed under the terms and conditions of the Creative Commons Attribution (CC BY) license (http://creativecommons.org/licenses/by/4.0/).
Copyright: This open access article is published under a Creative Commons CC BY 4.0 license, which permit the free download, distribution, and reuse, provided that the author and preprint are cited in any reuse.


