Submitted:
02 December 2024
Posted:
03 December 2024
You are already at the latest version
Abstract
The research of this paper was carried out on the low-temperature (100 ± 2 ◦C) pressure leaching of pyrite and chalcopyrite in their mixture. The resulting mathematical models of chalcopyrite and pyrite dissolution in their mixture, depending on the effect of oxygen pressure, initial concentration of sulfuric acid, concentrations of iron (III) and copper (II) ions and duration are obtained. According to kinetic analysis the oxidation process of chalcopyrite and pyrite proceeds with intra-diffusion limitations. The process is limited by the diffusion of reagents through the solid reaction product layer. According to the SEM and EDX mappings, the surface of chalcopyrite and pyrite particles is passivated by an elemental sulfur film. Analysis of the data allows us to conclude that the oxidation mechanism of chalcopyrite and pyrite in their mixture has changed. This is evidenced by the increase in the activation energy values: from 51.2 up to 59.0 kJ/mol for chalcopyrite and from 50.6 up to 74.6 kJ/mol for pyrite, respectively. The oxidation degree of pyrite in its mixture with chalcopyrite increased significantly from 54.5 up to 80.3% in 0–230 min. The increase in the dissolution degree of pyrite with the addition of chalcopyrite is not associated with an increase in the concentration of copper (II) and iron (III) ions during oxidation, since their effect on the degree of opening of minerals was insignificant, including for the mixture. The positive effect on the oxidation degree of pyrite in its mixture with chalcopyrite can be explained by the formation of an electrochemical bond between the minerals. The positive effect of the chalcopyrite additive is associated with a decrease in elemental sulfur formation on the pyrite surface, which is confirmed by the data of microphotographs and EDX mapping. The elemental sulfur distribution on minerals becomes more uniform with no formation of conglomerates, which also confirms their interaction with each other.
Keywords:
pressure leaching
; pyrite
; chalcopyrite
; sulfuric acid
; pressure oxidation
; sulfide
; elemental sulfur
; electrochemical couple
; kinetic analysis
1. Introduction
The main trend in the development of hydrometallurgical methods is carrying out the process at low temperatures in pressure reactors or even under atmospheric pressure, which allows one to significantly reduce the costs of reagents and energy resources (sulfur oxidation to the elemental form instead of sulfate) and the costs of expensive equipment. However, when elemental sulfur is formed, the problem of passivation of the surface of minerals by reaction products arises, which leads to a sharp decrease in the rate of the process.
Mechanical activation, surfactants, catalysts, etc. are widely used to intensify leaching processes in atmospheric and pressure conditions [1,2,3]. These methods help one to disintegrate the sulfide matrix, reduce the thickness or eliminate the formation of passivating films, which increases the rate and completeness of mineral opening during subsequent leaching with solutions of sulfuric and nitric acids, as well as with their mixtures [4,5,6,7,8,9,10,11].
Catalysts added to intensify the processes of leaching sulfide minerals increase the rate or promote the excitation of chemical reactions. Currently, examples of catalytic acceleration of leaching processes based on the occurrence of oxidation-reduction reactions are also known. E.g., it is shown [12] that iron ions have a catalytic effect during acid leaching of uranium in the presence of oxidizers.
Studies on the oxidation of sulfide minerals in the presence of Fe3+ ions (10 g/L) [13] revealed a significant effect of temperature on the efficiency of oxidation of copper–zinc raw materials. The authors of Refs [13,14] established the catalytic effect of Ag during the leaching of chalcopyrite with a solution of iron (III) sulfate, which made it possible to reduce the leaching time from 2 h to 7 min and increase copper extraction into solution. The unfavorable kinetics of the reaction between chalcopyrite and the oxidizer, iron (III), was due to inhibition at the stage of electron transfer through the layer of elemental sulfur. When a soluble silver salt is added, the rate of the process increases significantly, and the reaction proceeds according to the scheme: CuFeS2+4Ag+=2Ag2S+Cu2++Fe2+ [14].
The introduction of Ag+ ions, Ag2S or a silver-containing concentrate into the pulp significantly accelerates the leaching of copper from chalcopyrite or other sulfide ores [15,16]. It has been shown [17] that Ag2S is a catalyst in CuFeS2 decomposition and an inhibitor in FeS2 decomposition. Ref. [17] describes a technology of hydrometallurgical processing of chalcopyrite concentrates based on two-stage leaching with solutions containing iron (III). In this case, sulfides of non-ferrous metals are mainly leached at the first stage, and the chalcopyrite component is leached at the second one in the presence of Ag (I) ions as a catalyst. Total copper recovery into solution was > 96% with a leaching time of 20 h.
The process can be carried out under atmospheric pressure in the presence of pyrite as a catalyst (the Galvanox process), which forms a galvanic couple with chalcopyrite. It has been shown that 80% copper recovery of leaching at a redox potential of 410 mV relative to the silver chloride electrode can be achieved in 2 h at 85°C, initial concentrations of H2SO4 15 g/L and Fe 5 g/L, pulp density of 7.8%, and a pyrite to chalcopyrite ratio of 2:1 [19]. It is assumed that FeS2 and CuFeS2 form a galvanic couple, where FeS2 acts as an additional surface for the reduction of Fe3+ ions, thus increasing the rate of anodic dissolution of CuFeS2. Later [20,21] it was found that the catalytic effect of adding pyrite strongly depends on the quality of the pyrite itself, and most importantly on its silver content.
It was shown [22] that the presence of Fe3+ and O2 increases the potential of the chalcopyrite electrode by 53%, and the dissolution current density increases by 55 times, and the presence of 42% FeS2 increases the potential by another 14%, and the dissolution current by 2.6 and 2.2 times, respectively, at 0.001 mol/L O2 and 0.05 mol/L Fe (III). An increase in the rate of chalcopyrite leaching in the Galvanox process can be achieved by enhancing the catalytic activity of pyrite after its treatment with silver, presumably due to the formation of argentoyarosite 2AgFe3(SO4)2(OH)6 [23]. Other works by the same researchers [24,25,26] demonstrate the galvanic nature of the significant acceleration of copper leaching from chalcopyrite with a Fe2(SO4)3 solution under atmospheric pressure, which explains the positive effect of small silver additives in the form of silver-treated pyrite. According to the proposed mechanism, silver binds the released sulfur in Ag2S and allows electrons to pass from chalcopyrite to pyrite, accelerating the leaching process due to the reduction of iron (III) to iron (II) in the sulfate solution. In the absence of silver, the sulfur layer interrupts the electrical contact between pyrite and chalcopyrite.
Japanese researchers [27] have established that the process of chalcopyrite leaching with sulfuric acid solutions (0.011 M) is determined by the oxidation-reduction potential of the system, which depends on the ratio of Fe(II)/Fe(III) ions in the solution. Active chalcopyrite dissolution has been shown to occur at a redox potential of the system <0.7 V. It has been shown [28] that the efficiency of leaching chalcopyrite ores with sulfuric acid solution is significantly increased by adding not only iron (III) sulfate as an oxidizer, but also iron (II) sulfate, especially with oxygen bubbling.
A mechanism for chalcopyrite leaching with dissolved oxygen and/or iron (III) ions in sulfuric acid solutions containing copper (II) ions was proposed [29]. It has been established that chalcopyrite is first reduced to Cu2S by iron (II) ions in the presence of Cu (II) ions, followed by oxidation of Cu2S to Cu2+ ions and elemental sulfur by dissolved oxygen and/or Fe3+. The intermediate compound Cu2S is more easily oxidized than chalcopyrite, which facilitates more complete copper extraction. It has been established [30] that adding iron (II) ions to an iron (III) solution increases copper extraction by 1.54 times, and three times more copper passes into solution also containing Cu(II) ions compared to a solution containing only iron (III) ions.
According to the above, there is still no consensus regarding the mechanism of action of various catalysts upon the electrochemical dissolution of metals from sulfides and their mutual influence on each other. In addition, most studies have been aimed at studying chalcopyrite dissolution in iron sulfate solutions. Most of the research was aimed at dissolving chalcopyrite in the presence of pyrite under atmospheric conditions. The behavior of these minerals at higher temperatures under pressure conditions is poorly understood.
Thus, the vector of advanced scientific research in the field of refractory sulfide raw material opening is aimed at improving hydrometallurgical processes. Of greatest interest are the technologies of soft pressure and atmospheric opening. The use of these methods will reduce the consumption of energy and material resources.
2. Materials and Methods
2.1. Analysis
Chemical analysis of the original minerals and the resulting solid dissolution products was carried out using an ARL Advant’X 4200 wave-dispersive spectrometer (Thermo Fisher Scientific Inc., Waltham, MA, USA). Phase analysis was performed on an XRD 7000 Maxima diffractometer (Shimadzu Corp., Tokyo, Japan).
Granulometric analysis was performed by laser diffraction on an Analysette 22 Nanotec Plus (FRITSCH GmbH, Idar-Oberstein, Germany).
Chemical analysis of the obtained solutions was performed by inductively coupled plasma mass spectrometry (ICP-MS) on an Elan 9000 (PerkinElmer Inc., Waltham, MA, USA).
Scanning electron microscopy (SEM) was performed using a JSM-6390LV microscope (JEOL Ltd., Tokyo, Japan) equipped with a module for energy-dispersive X-ray spectroscopy analysis (EDX).
Experimental data were processed to obtain regression equations and Pareto diagrams using the Statgraphics Centurion Software Version 18 (Statgraphics Technologies, Inc., USA).
2.2. Materials and Reagents
The main raw materials were natural sulfide minerals chalcopyrite (Vorontsovskoye deposit, Sverdlovsk region, Russian Federation), pyrite was obtained from the Berezovskoye deposit (Sverdlovsk region, Russian federation). Their X-ray diffraction patterns are shown in Figure 2. All the minerals used were crushed and sieved on laboratory sieves, and the working fraction with a size of 80% of the class ≤40 μm was collected after sieving. The granulometric composition of the minerals is shown in Figure 1. The chemical composition of the minerals used is presented in Table 1. All other reagents used were of analytical purity.
All reagents used in this work were of analytical purity. Solutions were prepared from Fe2(SO4)3·9H2O, H2SO4 and CuSO4·5H2O dissolved in deionized water.
2.3. Equipment and Experimental Procedure
Laboratory experiments on pressure leaching were carried out on a titanium reactor with a volume of 1.0 L (Parr Instrument, Moline, IL, USA), with the possibility of feeding, adjusting the oxygen flow rate using a flow meter (Bronkhorst EL-FLOW Prestige and Bronkhorst EL-PRESS Metal-Sealed pressure regulators), temperature control. Mixing was carried out using an overhead stirrer to ensure pulp homogeneity.
Before each experiment, a pulp was prepared from sulfide minerals (20 g) weighed on an analytical balance and a 600 cm3 solution containing H2SO4, Fe (III) and Cu (II) of specified concentrations. The reactor’s filling factor was 0.6. After loading the pulp, the reactor was sealed, the stirrer was started and the pulp was heated up to the required temperature of 100°С. The stirrer rotation speed was maintained at 800 rpm, ensuring a uniform pulp density. When the specified temperature was reached, the reaction gas (oxygen) was supplied and the beginning of the experiment was recorded. Upon completion of the experiment, the oxygen supply was stopped, and the reactor was cooled down to 70°С. The pulp was filtered, and the cake was washed and dried to constant weight. Samples for analysis were taken from liquid and solid products.
2.4. Calculation Method
The dissolution degree of sulphide minerals in the mixture was calculated using the following method:
1.The mass of copper in the concentrate was calculated using Equation (1):
where %Cuconc is the percentage of copper in the concentrate, msample the mass of the sample.
2. The mass of copper in the cake was calculated using Equation (2):
where %Cucake is the percentage of copper in the cake, mcake the mass of the cake.
3. The mass of iron in the concentrate was calculated using Equation (3):
where %Fect is the percentage of iron in the pyrite concentrate, msample the mass of the sample.
4. The mass of iron in the cake was calculated using Equation (4):
where %Fecake is the percentage of iron in the cake, mcake the mass of the cake.
5. The percentage of chalcopyrite oxidation from the concentrate was calculated using Equation (5):
where %Cuconc is the percentage of copper in the concentrate, msample the mass of the sample, %Cucake the percentage of copper in the cake, mcake the mass of the cake.
6. The percentage of pyrite oxidation was calculated using Equation (6):
where %Feкт is the percentage of iron in the concentrate, msample the mass of the sample, %Fecake the percentage of iron in the cake, mcake the mass of the cake.
3. Results and Discussion
3.1. Assessment of the Influence of the Main Parameters on the Low-Temperature Pressure Oxidation of Pyrite and Chalcopyrite in Their Mixture
According to literature data, the catalytic effect of adding pyrite on copper extraction from chalcopyrite is already observed under atmospheric conditions at a temperature of 85°C. The method of mathematical experimental design with an orthogonal central-compositional second-order design was used to study the combined effect of oxygen pressure, initial sulfuric acid concentration, iron (III) ion and copper (II) ion concentrations, and duration on the oxidation of pyrite and chalcopyrite during their combined leaching [31]. The variable parameters were oxygen pressure (X1), initial concentrations of sulfuric acid (X2), iron (III) ion concentration (X3), copper (II) ion concentration (X4), and oxidation duration (X5). The constant leaching parameters were a temperature of 100°C, a liquid:solid ratio of 10:1, and a pyrite:chalcopyrite ratio of 1:1.
Two parameters at five levels were considered as independent variables, their central values (zero levels) were as follows: X1 = 0.5 MPa, X2 = 45 g/L, X3 = 6 g/L, X4 = 4.5 g/L, X5 = 140 min. The experimental data were processed to obtain mathematical models and diagrams using Statgraphics software. The influence of oxygen pressure, initial sulfuric acid concentration, iron (III) ion concentration, copper (II) ion concentration and duration on the oxidation of chalcopyrite and pyrite was assessed using software data and graphical optimization tools [32].
3.1.1. Effect of Parameters on the Oxidation of Chalcopyrite Mixed with Pyrite
Chalcopyrite may interact with sulfuric acid in the presence of oxygen and iron (III) ions according to the following reactions:
2CuFeS2 + 2H2SО4 + 7О2 = 2CuSО4 + Fe2(SО4)3 + S0 + 2H2О, ∆G (100 °C) =−2204.168 kJ/mol
CuFeS2 + H2SО4 + 2,5О2 = CuSО4 + FeSО4 + S0 + H2О, ∆G (100 °C) = −809.056 kJ/mol
CuFeS2 + 2Fe2(SО4)3 = CuSО4 + 5FeSО4 + 2S0, ∆G (100 °C) = −70.752 kJ/mol
CuFeS2 + 4О2 = CuSО4 + FeSО4, ∆G (100 °C) = −1238.377 kJ/mol
4FeSO4 + O2(g) + 2H2SO4 = 2Fe2(SO4)3 + 2H2O, ∆G (100 °C) = −304.494 kJ/mol
According to the presented reactions, the sulfide sulfur of chalcopyrite may be oxidized by oxygen to form elemental sulfur and sulfate ion (reactions 7–9). Iron (III) ions may also act as an oxidizer, with sulfide sulfur being converted into elemental sulfur (reaction 10), and iron (II) ions interacting with oxygen to form iron (III) ions.
The resulting mathematical model of chalcopyrite dissolution in a mixture with pyrite, depending on the effect of oxygen pressure, initial concentration of sulfuric acid, concentrations of iron (III) and copper (II) ions and duration, can be described by an equation presented below in dimensional scale:
CuFeS2 (%) = 43.05 + 0.41×X1 − 0.01×X2 − 2.80×X3 + 2.40×X4 + 0.0349925×X5 − 0.30×X12 –
0.01×X22 + 0.04×X2X4 + +0.01×X2X5 + 0.16×X32 − 0.61×X42
0.01×X22 + 0.04×X2X4 + +0.01×X2X5 + 0.16×X32 − 0.61×X42
The statistical significance of each coefficient of the equation was assessed by comparing the mean square against the experimental error estimate. According to the data obtained, the coefficients of X12, X1X2, X1X3, X3X4, X52, X4X5, X3X5, X1X5, X1X4 and X2X3 are statistically insignificant and therefore excluded from the general equation.
Figure 3 shows the relationship between the actual values of the arsenic precipitation degree and those predicted by the model. The reliability of the selected model (Equation (1)2) was confirmed due to the close values of the predicted and actual data.
Figure 4 shows the response surfaces predicted by the model for the degree of chalcopyrite dissolution, depending on the oxygen pressure, the initial concentration of sulfuric acid, the concentrations of iron (III) and copper (II) ions and the duration. When changing one of the parameters, the others were fixed at the average value in the selected range.
Analysis of the obtained results demonstrates that all parameters varied in the selected range have a statistically significant effect on the process of chalcopyrite dissolution in its mixture with pyrite.
According to the data presented in Figure 4a, an increase in oxygen pressure from 0.2 up to 0.8 MPa has an insignificant effect on the dissolution of chalcopyrite in its mixture with pyrite. Over 240 min of oxidation, the chalcopyrite dissolution degree increases from 53% to 56% with an increase in oxygen pressure from 0.2 MPa up to 0.8 MPa.
As can be seen from Figure 4b, the positive effect of increasing the initial concentration of sulfuric acid is maintained throughout the process. With an increase in the initial acid concentration from 20 g/L up to 70 g/L, the chalcopyrite dissolution degree increases from 49% to 59% in 240 min.
Similarly, the initial concentration of copper (II) ions also has a positive effect on oxidation (Figure 4c). Its increase from 1 g/L up to 3 g/L contributes to an increase in the chalcopyrite dissolution degree from 51% to 54% in 240 min.
The increase in the concentration of iron (III) ions has a negative effect on chalcopyrite oxidation throughout the process (Figure 4d). An increase in their concentration from 2 up to 10 g/L leads to a decrease in the chalcopyrite dissolution degree from 60 to 56% in 240 min.
The negative effect of increasing the initial concentration of iron (III) ions is possibly due to an increase in the oxidation state of sulfide sulfur to elemental sulfur, which in turn shields the surface of chalcopyrite [33].
3.1.2. Effect of Parameters on the Oxidation of Pyrite Mixed with Chalcopyrite
Pyrite interaction with sulfuric acid in the presence of oxygen and iron (III) ions may occur according to the following reactions:
1.25FeS2 + H2SO4 + O2 = 1.25FeSO4 + 2.25S0 + H2O, ∆G (100 °C) = −368.076 kJ/mol
FeS2 + 3.5O2 + H2O = FeSO4 + H2SO4, ∆G (100 °C) = −1075.317 kJ/mol
1.75FeS2 + Fe2(SO4)3 + H2SO4 = 3.75FeSO4 + 3.75S0 + H2O, ∆G (100 °C) = −192.382 kJ/mol
2FeS2 + 4.5O2(g) + H2SO4 = Fe2(SO4)3 + 2S + H2O, ∆G (100 °C) = −1435.262 kJ/mol
4FeSO4 + O2(g) + 2H2SO4 = 2Fe2(SO4)3 + 2H2O, ∆G (100 °C) = −304.494 kJ/mol
According to the presented reactions, pyrite sulfide sulfur may be oxidized by oxygen to form elemental sulfur and sulfate ion (reactions 13 and 14). Iron (III) ions may also act as an oxidizer, with sulfide sulfur passing into an elemental state (reaction 15), and iron (II) ions interacting with oxygen to form iron (III) ions (reaction 17).
The mathematical model describing pyrite dissolution in its mixture with chalcopyrite depending on the influence of oxygen pressure, the initial concentration of sulfuric acid, the concentrations of iron (III) and copper (II) ions, as well as the duration of the process, can be represented by the following equation:
FeS2 (%) = 40.10 − 0.68×X1 + 0.20×X2 + 2.59×X3 + 0.98×X4 + 0.02×X5 + 0.01×X1X5 − 0.01×X22
+ 0.03×X2X4 + +0.01×X2X5 − 0.12×X32 − 0.29×X42 − 0.01×X52
+ 0.03×X2X4 + +0.01×X2X5 − 0.12×X32 − 0.29×X42 − 0.01×X52
The statistical significance of each coefficient of the equation was assessed by comparing the mean square against the experimental error estimate. According to the data obtained, the coefficients of X12, X1X2, X1X3, X1X4, X3X4, X2X3, X3X5 and X4X5 were statistically insignificant; therefore, they were excluded from the general equation.
Figure 5 illustrates the correlation between the actual indicators of the pyrite dissolution degree and the values predicted by the model. The closeness of the predicted and actual data confirms the reliability of the selected model (Equation (18)).
Figure 6 shows the response surfaces predicted by the obtained model for the pyrite dissolution degree, depending on the oxygen pressure, the initial concentration of sulfuric acid, the concentration of iron (III) and copper (II) ions and duration. When changing one of the parameters, the others were fixed at the average value inside the range selected.
Analysis of the results shows that all the parameters that varied in the selected range have a statistically significant positive effect on the pyrite dissolution process in the mixture with chalcopyrite.
Increasing the oxygen pressure from 0.2 up to 0.8 MPa has the most significant positive effect on pyrite dissolution in its mixture with chalcopyrite (Figure 6a). This positive effect was observed throughout the entire process of pressure low-temperature oxidation. With an increase in oxygen pressure from 0.2 MPa up to 0.8 MPa, the dissolution of pyrite during 240 min of the process increases from 62% to 78%.
The initial concentration of sulfuric acid also has a noticeable positive effect on the dissolution of pyrite in its mixture with chalcopyrite (Figure 6b). When the initial concentration of acid increases from 20 g/L up to 70 g/L, the pyrite dissolution degree increases from 64% to 71% over the same period of 240 min. The positive effect of sulfuric acid is probably due to the reduction in the formation of iron hydroxides and oxides on the surface of pyrite particles. These compounds may shield the mineral surface, hindering access for reagents [34].
Iron (III) ions also have a slight positive effect on the oxidation of pyrite in its mixture with chalcopyrite throughout the oxidation process. When the concentration of iron (III) ions increases from 2 up to 7 g/L, the pyrite dissolution degree increases from 67% to 69% in 240 min. A subsequent increase in concentration up to 10 g/L has almost no additional effect (Figure 6c).
The initial concentration of copper (II) ions demonstrates a minor but statistically significant positive effect on the pyrite dissolution process in a mixture with chalcopyrite throughout the oxidation period (Figure 6d). With an increase in the concentration of copper (II) ions from 1 up to 2 g/L, an increase in the pyrite dissolution degree is observed from 74.9% to 78.5% in 240 min. A further increase in the concentration up to 3 g/L has virtually no effect on the result.
Unlike chalcopyrite dissolution, the oxidation degree of pyrite in the mixture increases significantly. Under the conditions t = 100°C, PO2 = 0.8 MPa, [H2SO4] = 50 g/L, [Cu2+] = 3 g/L, [Fe3+] = 7 g/L, duration 240 min, the oxidation degree of pyrite in its mixture with chalcopyrite is 80.3%, while the chalcopyrite dissolution under these conditions reaches 56.4%.
3.2. Kinetic Analysis of the Dissolution of Sulfide Minerals
Since chalcopyrite and pyrite dissolution may proceed with the formation of an insoluble product (elemental sulfur) on the particle surface, their dissolution may occur in the diffusion region; the reaction rate on the surface may also be the rate-limiting stage, due to the insignificant effect of oxygen pressure on chalcopyrite dissolution.
The contracting core model (SCM) is used to describe the kinetics of heterogeneous reactions, which assumes that the interaction of a substance with an external reagent goes on the surface of a particle only. The reaction zone gradually moves into the particle, leaving behind the converted product and the particle’s inert part. The particle core containing the active, unreacted component gradually decreases during the reaction. This model assumes that the process rate is limited either by the diffusion of the reagent to the surface through the diffusion layer, or diffusion through the product layer (film diffusion through the surface layer of a decreasing sphere), or the chemical reaction for particles of constant or decreasing size. Thus, the SCM not only determines which region the process proceeds in, due to the ability to determine the main kinetic characteristics, but also shows the mechanism of the process. The slowest stage with the greatest resistance is rate-limiting, and its intensification allows for an increase in the efficiency of leaching.
To determine the reaction mode and calculate the kinetic characteristics of pyrite and chalcopyrite dissolution, the contracting core model (SCM) was used as in our previous researches [35,36]. Table 2 shows the main equations describing the SCM stages.
3.2.1. Kinetic Analysis of Chalcopyrite and Pyrite Dissolution During Low-Temperature Pressure Leaching without Mixing
The effect of temperature on the process of low-temperature pressure oxidation of chalcopyrite and pyrite separately from each other is shown in Figure 7.
According to Figure 7a, temperature has a significant effect on chalcopyrite dissolution over the entire studied time range. At 110℃, up to 59.2% of chalcopyrite is oxidized in 230 min of the process. A decrease in temperature down to 60℃ leads to a decrease in the dissolution degree down to 20.2% over a similar duration.
An increase in the leaching duration from 20 up to 240 min contributes to an increase in the chalcopyrite dissolution degree, and the positive effect of temperature is preserved over the entire time range of oxidation.
Based on the data in Figure 7b, temperature significantly affects the process of pyrite dissolution over the entire studied time interval. E.g., at a temperature of 110°C, the pyrite oxidation degree reaches 57.9% after 230 min. A decrease in temperature down to 60°C reduces the dissolution degree to 20.5% over the same period of time.
Increasing the leaching time from 20 up to 240 min increases the pyrite dissolution degree, while the positive effect of increasing the temperature is preserved at all oxidation time stages.
Table 3 provides the correlation coefficients (R2) obtained when modeling the process of chalcopyrite and pyrite leaching separately from each other with sulfuric acid solutions using the SCM equations.
According to the data provided, Equation (1) describes the obtained dependences better than all others and has the highest correlation coefficients (R2) for the studied temperatures, which confirms that chalcopyrite and pyrite oxidation occurs in the intra-diffusion region. The process is limited by the diffusion of reagents through the solid reaction product layer.
To calculate the activation energy, graphs of the dependence of ln kc vs. 1/T were plotted, where kc is the angular coefficient obtained from Figure 8a,c. The coefficient a calculated when constructing the straight line y=ax+b in these coordinates determines the slope of the curve. According to Equation (20) derived from the Arrhenius law, the apparent activation energy was estimated from the slope of the straight line, which was 51.2 kJ/mol for chalcopyrite and 50.6 kJ/mol for pyrite, respectively.
lnkc = lnA – Ea/RT
Taking into account all the slope coefficients kc, the dependence of lnkc on 1/T was plotted and the apparent activation energy was calculated. As a result, an empirical partial order for oxygen pressure of 0.272 for pyrite and 0.075 for chalcopyrite, respectively, was obtained. These low empirical partial orders for oxygen pressure also confirm the internal diffusion limitations during the oxidation processes of pyrite and chalcopyrite (Figure 9). Based on the values of the empirical partial orders, it can be concluded that oxygen pressure has virtually no effect on chalcopyrite dissolution, unlike pyrite, which may indicate the formation of a denser film of products on the surface of its particles and, as a consequence, more serious internal diffusion limitations.
Also, when plotting graphs of the dependences of ln kc vs. ln(Cu)/ln(Fe)/ln(H2SO4), empirical partial orders for the initial concentration of copper (II) and iron (III) ions, and sulfuric acid were calculated for chalcopyrite and pyrite, where kc is the slope calculated in a similar way. As a result, empirical partial orders 0.14, 0.12, and −0.31 were obtained for chalcopyrite by the initial concentration of copper (II) ions, iron (III) ions, and sulfuric acid, respectively. The negative effect of increasing the initial concentration of sulfuric acid, according to literature data, is associated with an increase in the oxidation state of chalcopyrite sulfide sulfur to elemental one (reaction 7) and screening of the surface of its particles [30,34,35].
Similarly, the empirical partial orders for the initial concentration of copper (II) and iron (III) ions, and sulfuric acid were calculated for pyrite, which were 0.13, 0.14, and 0.27, respectively.
By substituting the Arrhenius equation into Equation (1), which describes the diffusion of reagents through the product layer, Equation can be obtained:
where n is the empirical partial order for the component.
1−3×(1−x)2/3 + 2×(1−x) = ko×Po2n×СCun×СFen×СH2SO4ne−Ea/RT×t,
According to the previously obtained results, the following generalized equations can be derived for low-temperature pressure oxidation of chalcopyrite and pyrite (Equations (21) and (22), respectively):
1−3×(1−x)2/3 + 2×(1−x) = ko×Po20.075×СCu0.136×СFe0.119×СH2SO4−0.313×e−51188/RT×t
1−3×(1−x)2/3 + 2×(1−x) = ko×Po20.272×СCu0.128×СFe0.137×СH2SO40.265×e−50553/RT×t
Then, graphs were plotted for all temperatures, initial concentrations of copper (II) and iron (III), sulfuric acid, which made it possible to estimate a fixed slope for chalcopyrite and pyrite a = 0.134·105 and 0.142·105, respectively. The values of a obtained by the graphical method and the corresponding value of the correlation coefficient R2 are shown in Figure 10. The obtained value of the coefficient a corresponds to k0.
According to the data obtained from Figure 10, the general kinetic equations for chalcopyrite and pyrite have the following form (Eqs 23 and 24, respectively):
1−3×(1−x)2/3 + 2×(1−x) = 0,134×105×Po20.075×СCu0.136×СFe0.119×СH2SO4−0.313×e−51188/RT×t
1−3×(1−x)2/3 + 2×(1−x) = 0,142×105×Po20.272×СCu0.128×СFe0.137×СH2SO40.265×e−50553/RT×t
According to the data provided, the oxidation process of chalcopyrite and pyrite proceeds with intra-diffusion limitations. The process is limited by the diffusion of reagents through the solid reaction product layer. During low-temperature pressure oxidation, the surface of chalcopyrite and pyrite particles is passivated by an elemental sulfur film according to reactions 7, 14, thereby limiting the access of reagents to the reaction zone, which is also confirmed by other researchers [28,30,34]. The low empirical partial orders for oxygen pressure also confirm intra-diffusion limitations during the oxidation processes of pyrite and chalcopyrite. The negative effect of increasing the initial concentration of sulfuric acid on chalcopyrite oxidation, according to literature data, is associated with an increase in the oxidation degree of sulfide sulfur to elemental one (reaction 8) and screening of the surface of its particles [30].
3.2.2. Kinetic Analysis of Chalcopyrite and Pyrite Dissolution During Low-Temperature Pressure Leaching in a 1:1 Mixture
The effect of temperature on the process of low-temperature pressure oxidation of chalcopyrite and pyrite in a 1:1 mixture is shown in Figure 11.
Based on the data presented in Figure 11a, it can be concluded that temperature has a significant effect on the process of chalcopyrite dissolution throughout the time range studied. At a temperature of 110℃, up to 50.6% of chalcopyrite is oxidized in 230 min of the process. A decrease in temperature down to 60℃ leads to a decrease in the mineral dissolution degree down to 17.4% over a similar period of time.
Increasing the leaching time from 20 up to 240 min increases the chalcopyrite dissolution degree, while the positive effect of temperature is maintained throughout the entire oxidation time range.
According to the data presented in Figure 11b, temperature has a significant effect on the process of pyrite dissolution during the time interval studied. E.g., at a temperature of 110°C, the pyrite oxidation degree reaches 78.5% after 230 min. Reducing the temperature down to 60°C reduces the dissolution degree down to 23.6% over the same period of time.
Increasing the duration of the leaching process from 20 up to 240 min leads to an increase in the pyrite dissolution degree. Increasing the temperature has a positive effect at all time stages of oxidation.
The correlation coefficients (R2) obtained while modeling the process of chalcopyrite and pyrite leaching in a mixture with copper sulfate solutions using the SCM equations are given in Table 4.
Based on the data presented, it can be concluded that Equation (1) most accurately describes the obtained dependences and has the highest correlation coefficients (R²) for the studied temperatures. This confirms that chalcopyrite and pyrite oxidation proceeds in the region of internal diffusion. The process is limited by the diffusion of reagents through the solid reaction product layer.
To calculate the activation energy, graphs were plotted for the dependence of the natural logarithm of the slope kc on the inverse temperature T, similar to the previous calculations.
The apparent activation energy was determined graphically (Figure 12). It was 59.0 kJ/mol for chalcopyrite and 74.6 kJ/mol for pyrite, respectively.
Figure 13 shows the results of calculating the empirical partial orders for oxygen pressure. The following values were obtained: 0.330 for pyrite and 0.059 for chalcopyrite, respectively. These low empirical partial orders for oxygen pressure confirm intra-diffusion limitations during the oxidation of pyrite and chalcopyrite (Figure 13). Based on the values of the empirical partial orders, it can be concluded that oxygen pressure has almost no effect on the dissolution of chalcopyrite, unlike pyrite. This may indicate the formation of a denser film of products on the surface of chalcopyrite particles and, as a consequence, more serious intra-diffusion limitations.
Empirical partial orders for low-temperature pressure leaching of chalcopyrite and pyrite in a 1:1 mixture were calculated by the initial concentration of copper (II) and iron (III) ions, and sulfuric acid. As a result, for chalcopyrite, empirical partial orders of 0.30, −0.17 and 0.36 were obtained for the initial concentration of copper (II) and iron (III) ions, and sulfuric acid, respectively. Unlike chalcopyrite monosulfide oxidation, in a mixture with pyrite, an increase in the initial concentration of iron (III) ions has a negative effect, which is possibly due to an increase in the oxidation state of sulfide sulfur to elemental one, which, in turn, screens the chalcopyrite surface of [33].
The empirical partial orders for the initial concentration of copper (II) and iron (III) ions, and sulfuric acid were calculated for pyrite by the same method. The obtained values were 0.13, 0.14, and 0.27, respectively.
The empirical partial orders for the initial concentration of copper (II) and iron (III) ions, and sulfuric acid were calculated for pyrite in a similar way, which were 0.13, 0.14, and 0.27, respectively.
To derive generalized kinetic equations, the coefficients ko were determined graphically, similarly as described earlier. Graphs were plotted for all temperatures, initial concentrations of copper (II) and iron (III) ions, and sulfuric acid. The values of a obtained graphically and the corresponding value of the correlation coefficient R2 are shown in Figure 14.
According to the data in Figure 14, the general kinetic equations for chalcopyrite and pyrite have the following form (Equations 25 and 26, respectively):.
1−3×(1−x)2/3 + 2×(1−x) = 0.231×10⁵×Po20.059×СCu0.300×СFe−0.178×СH2SO40.356×e−59002/RT×t
1−3×(1−x)2/3 + 2×(1−x) = 0.133×10⁵×Po20.272×СCu0.128×СFe0.137×СH2SO40.265×e−74580/RT×t
According to the data provided, the oxidation process of chalcopyrite and pyrite in a 1:1 mixture proceeds with internal diffusion limitations. The process is limited by the diffusion of reagents through the solid reaction product layer. During low-temperature pressure oxidation, the surface of chalcopyrite and pyrite particles is passivated by a film of elemental sulfur according to reactions 7,13, thereby limiting the access of reagents to the reaction zone, which is also confirmed by other researchers [34].
The initial concentration of sulfuric acid in the process of chalcopyrite dissolution not in the mixture had a pronounced negative effect with an empirical reaction partial order of −0.313. Addition of pyrite in a ratio of 1:1 contributed to a change in the empirical partial order to a positive one 0.356. The change in the nature of the influence of the initial concentration of sulfuric acid on the behavior of chalcopyrite upon the addition of pyrite indicates their interaction in the mixture and a change in the oxidation mechanism.
When dissolving chalcopyrite monosulfide, an increase in the initial concentration of iron (III) ions had a positive effect with an empirical partial order of 0.12. When adding pyrite in a ratio of 1:1, an increase in the concentration of iron (III) ions has a negative effect, and the empirical partial order changes to −0.18, which is possibly associated with an increase in the oxidation state of sulfide sulfur to elemental sulfur, screening the chalcopyrite surface [30].
In the case of pyrite, an increase in the initial concentrations of copper (II) and iron (III) ions, and sulfuric acid had a positive effect on pyrite dissolution both in a mixture with chalcopyrite and without its addition.
Analysis of the data allows us to conclude that the oxidation mechanism of chalcopyrite and pyrite in their mixture has changed. This is evidenced by the increase in the activation energy values: from 51.2 up to 59.0 kJ/mol for chalcopyrite and from 50.6 up to 74.6 kJ/mol for pyrite, respectively. This indicates an increase in the effect of temperature on the oxidation process of minerals in their 1:1 mixture. This effect is especially noticeable for pyrite, namely: with the addition of chalcopyrite, the activation energy increases by 24 kJ/mol and reaches a value of 74.6 kJ/mol. The greatest positive effect of temperature was observed in the initial period of the mineral oxidation process: during the first 30 minutes (Figs 7 and 11). The change in the nature of the curves for pyrite was more pronounced. For chalcopyrite, the addition of pyrite had a noticeable effect only in the first 30 minutes of dissolution. After this, the graphs almost reach a plateau, whereas during the oxidation of an individual sulfide, the dissolution degree increases throughout the process. The total dissolution degree of chalcopyrite in its mixture with pyrite decreases over the entire temperature range in 230 min.
3.3. Analysis of the Cakes from Low-Temperature Pressure Dissolution of Chalcopyrite and Pyrite
X-ray phase analysis of the cakes after low-temperature pressure oxidation of chalcopyrite and pyrite and their mixture in a 1:1 ratio are shown in Figure 15.
According to the data presented in Figure 15, all cakes contain under-oxidized minerals and elemental sulfur. Its content in the cakes is 24.8 % for chalcopyrite, 11.3 % for pyrite and 19.2 % for their mixture. It can also be noted that the pyrite peaks in the X-ray diffraction pattern of the leaching cake of the mineral mixture have a much lower intensity than the chalcopyrite peaks.
Micrographs and EDX mapping for the low-temperature oxidation cakes of chalcopyrite, pyrite and their mixture in a 1:1 ratio are shown in Figure 16. They were obtained at t = 100°C, PO2 = 0.8 MPa, [H2SO4] = 50 g/L, [Cu2+] = 3 g/L, [Fe3+] = 10 g/L, and duration 230 min.
According to the data presented in Figure 16a,d, after low-temperature pressure leaching, chalcopyrite particles are characterized by both smooth and loose, non-uniform surfaces. In Figure 16d, the red zones correspond to the distribution of sulfur, the green zones correspond to iron, and the yellow zones correspond to copper (Figure 16g,j,m). Chalcopyrite is represented by a combination of these zones. The presence of elemental sulfur is also noticeable as bright red growths on the chalcopyrite surface Figure 16d. The distribution of sulfur on the chalcopyrite surface is non-uniform and leads to the formation of conglomerates.
According to the data presented in Figure 16 b,e, pyrite particles after low-temperature pressure leaching have both a smooth and a loose, non-uniform surface. Small conglomerates were found on the surface of rectangular particles (Figure 16 b,e). In Figure 16 e,h,k the red zones correspond to the distribution of sulfur, and the green zones correspond to iron. A mixture of these zones means pyrite. It is evident from Figure 16e that elemental sulfur covers the surface of pyrite as bright red growths. This is especially noticeable on particles with a developed surface. Small particles consist almost entirely of elemental sulfur. On large grains with a smooth surface, elemental sulfur is formed in uneven areas.
From Figure 16 c,f it is clear that the cake is represented by two types of particles with different shapes. The first type, pyrite, has a smooth surface in places with pits and caverns, eaten away during the oxidation reaction (Figure 16 c,f). The second type, chalcopyrite, is represented by particles with a non-uniform surface with pronounced defects which inclusions of various shapes have formed on (Figure 16 c,f). At the same time, unlike the dissolution of individual minerals, there are no conglomerates on the surface of the particles (Figure 16 c,f). Elemental sulfur was distributed more evenly in the case of leaching of a mixture of pyrite and chalcopyrite. The red zones in correspond to the distribution of sulfur, the green zones are responsible for iron, the yellow ones for copper (Figure 16 i,l,n).
Micrographs of the cakes after low-temperature pressure oxidation of individual minerals and their mixture in a 1:1 ratio with composition determination points are shown in Figure 17, the element contents are presented in Table 5.
When oxidizing chalcopyrite not in a mixture, elemental sulfur conglomerates were also found on its surface (Figure 17a,d). The total content of elemental sulfur on the surface is 7.4 – 73.6 % (Figure 17c point 2,3, рисунoк 17f point 4). When oxidizing chalcopyrite in its mixture with pyrite, its surface contains np conglomerates, but has pronounced defects and inclusions of various shapes. Elemental sulfur is also evenly distributed over all particles, and its total content decreases up to 5.1-9.4 % (Figure 17c point 2,3, Figure 17f point 4).
The obtained data show that during low-temperature pressure leaching of pyrite not in a mixture, elemental sulfur conglomerates are formed on the surface of the particles. The total content of elemental sulfur on its surface is 2.3-72.6 % (Figure 17 b,e). When pyrite is oxidized in its mixture with chalcopyrite, its surface contains no conglomerates. Elemental sulfur is distributed evenly over all particles and its total content decreases down to 0.1 – 1.9 % (Figure 17c point 1,4, Figure 17f point 1 - 3).
According to the data obtained from our kinetic analysis of low-temperature pressure oxidation of chalcopyrite and pyrite, it can be concluded that the increase in the dissolution degree of pyrite with the addition of chalcopyrite is not associated with an increase in the concentration of copper (II) and iron (III) ions during oxidation, since their effect on the degree of opening of minerals was insignificant, including for the mixture. The obtained empirical partial orders confirm this, their values almost do not change during oxidation in a mixture or separately.
According to literature data, pyrite may form galvanic bonds with other sulfides exhibiting semiconductor properties. It is an effective source of an alternative surface for oxidation reactions in electrochemical contact. Its oxidation occurs almost without the formation of elemental sulfur, especially in the initial period of the process [37].
The positive effect on the oxidation degree of pyrite in its mixture with chalcopyrite can be explained by the formation of an electrochemical bond between the minerals. This phenomenon is widely described by other researchers. When an electrochemical pair is formed between pyrite and chalcopyrite in the presence of strong oxidizers (oxygen, iron (III) ions), dissolution is limited by the transfer of electrons through the passivating film between the minerals [38], therefore, unlike the Galvanox™ process, pyrite is also oxidized under low-temperature pressure oxidation conditions[39].
This theory is confirmed by the change in the oxidation mechanism of chalcopyrite and pyrite in their mixture. This is indicated by the increase in the activation energy values during oxidation of minerals in the mixture: from 51.2 up to 59.0 kJ/mol for chalcopyrite and from 50.6 up to 74.6 kJ/mol for pyrite. This means that the effect of temperature increases during oxidation of minerals in the mixture, which is observed in the initial period of the process, during the first 30 minutes (Figs 7 and 11). In this case, the change in the nature of the curves is more pronounced for pyrite. For chalcopyrite, the addition of pyrite has a positive effect in the first 30 minutes of dissolution only, and then it has a negative effect, since the curves almost reach a plateau, whereas during oxidation of individual sulfides, the dissolution degree increases during the entire duration. The total oxidation degree of chalcopyrite in the mixture decreases for the entire temperature range over 230 min.
The presence of such a bond is also indicated by the change in the effect of the initial concentration of sulfuric acid and iron (III) ions on the oxidation state of chalcopyrite in its mixture with pyrite, which follows from the obtained values of empirical partial orders.
The positive effect of the chalcopyrite additive is associated with a decrease in elemental sulfur formation on the pyrite surface, which is confirmed by the data of microphotographs and EDX mapping. The elemental sulfur content decreases up to 5.1-9.4 % on the chalcopyrite surface, while for pyrite its content decreases up to 0.1 – 1.9 %. The elemental sulfur distribution on minerals becomes more uniform with no formation of conglomerates, which also confirms their interaction with each other.
In the initial period, pyrite and chalcopyrite oxidation occurs at the maximum rate. Then chalcopyrite dissolution slows down sharply due to the passivation of its surface with elemental sulfur. The oxidation rate of pyrite also begins to slow down, but not as sharply as in the case of oxidation with no addition of chalcopyrite. During this period, its surface also begins to be passivated with elemental sulfur.
4. Conclusions
In this study, we conducted experiments on the low-temperature pressure oxidation of pyrite and chalcopyrite in their mixture. The resulting mathematical model of chalcopyrite and pyrite dissolution in their mixture, depending on the effect of oxygen pressure, initial concentration of sulfuric acid, concentrations of iron (III) and copper (II) ions and duration are obtained.
The series of experiments on chalcopyrite dissolution in mixture showed that increasing the oxygen pressure from 0.2 to 0.8 MPa had a minimal effect on chalcopyrite dissolution, while an increase in the initial concentration of sulfuric acid from 20 g/L up to 70 g/L had a significant positive effect. The increase in the concentration of iron (III) ions has a negative effect on chalcopyrite oxidation throughout the process.
Increasing the oxygen pressure from 0.2 up to 0.8 MPa has the most significant positive effect on pyrite dissolution in its mixture with chalcopyrite. This positive effect was observed throughout the entire process of pressure low-temperature oxidation. With an increase in oxygen pressure from 0.2 MPa up to 0.8 MPa, the dissolution of pyrite during 240 min of the process increases from 62% to 78%. In the case of pyrite, an increase in the initial concentrations of copper (II) and iron (III) ions, and sulfuric acid had a positive effect on pyrite dissolution.
According to the data obtained from our kinetic analysis of low-temperature pressure oxidation of chalcopyrite and pyrite, it can be concluded that the increase in the dissolution degree of pyrite with the addition of chalcopyrite is not associated with an increase in the concentration of copper (II) and iron (III) ions during oxidation, since their effect on the degree of opening of minerals was insignificant, including for the mixture. The obtained empirical partial orders confirm this, their values almost do not change during oxidation in a mixture or separately.
The positive effect on the oxidation degree of pyrite in its mixture with chalcopyrite can be explained by the formation of an electrochemical bond between the minerals. This theory is confirmed by the change in the oxidation mechanism of chalcopyrite and pyrite in their mixture. This is indicated by the increase in the activation energy values during oxidation of minerals in the mixture: from 51.2 up to 59.0 kJ/mol for chalcopyrite and from 50.6 up to 74.6 kJ/mol for pyrite. The presence of such a bond is also indicated by the change in the effect of the initial concentration of sulfuric acid and iron (III) ions on the oxidation state of chalcopyrite in its mixture with pyrite, which follows from the obtained values of empirical partial orders.
The positive effect of the chalcopyrite additive is associated with a decrease in elemental sulfur formation on the pyrite surface, which is confirmed by the data of microphotographs and EDX mapping. The elemental sulfur distribution on minerals becomes more uniform with no formation of conglomerates, which also confirms their interaction with each other.
Author Contributions
Conceptualization, K.K. and M.T.; methodology, M.T.; validation, M.T.; formal analysis, M.T.; investigation, K.K. and M.T.; resources, D.R.; data curation, K.K., D.R. and M.T.; writing—original draft preparation, K.K. and M.T.; writing—review and editing, K.K., D.R. and M.T.; visualization K.K.; supervision, K.K.; project administration, M.T.; funding acquisition, K.K. All authors have read and agreed to the published version of the manuscript.
Funding
This work was funded by the Russian Science Foundation Project, No. 23-29-00744.
Institutional Review Board Statement
Not applicable.
Informed Consent Statement
Not applicable.
Data Availability Statement
The original contributions presented in the study are included in the article, further inquiries can be directed to the corresponding author.
Conflicts of Interest
The authors declare no conflicts of interest.
References
- Shoppert, A.; Loginova, I.; Napol’skikh, J.; Valeev, D. High-Selective Extraction of Scandium (Sc) from Bauxite Residue (Red Mud) by Acid Leaching with MgSO4. Materials 2022, 15, 1343. [CrossRef]
- Shoppert, A.; Valeev, D.; Loginova, I.; Pankratov, D. Low-Temperature Treatment of Boehmitic Bauxite Using the Bayer Reductive Method with the Formation of High-Iron Magnetite Concentrate. Materials 2023, 16, 4678. [CrossRef]
- Valeev, D.; Kunilova, I.; Shoppert, A.; Salazar-Concha, C.; Kondratiev, A. High-pressure HCl leaching of coal ash to extract Al into a chloride solution with further use as a coagulant for water treatment, Journal of Cleaner Production 2020, 276, 123206. [CrossRef]
- Lauri R., Jari A., Olof F. Pressure oxidation of pyrite-arsenopyrite refractory gold concentrate. Physicochemical Problems of Mineral Processing, 2013, 49(1), 101−109. [CrossRef]
- Conner-Mills K., Anderson С. Pressure Oxidation of Enargite Concentrates Containing Gold and Silver. Extraction 2018. The Minerals, Metals & Materials Series. Springer 2018, 1645–1659. [CrossRef]
- Gok O.; Anderson G.; Cicekli G.; Cocen I. Leaching kinetics of copper from chalcopyrite concentrate in nitrous-sulfuric acid. Physicochemical Problems of Mineral Processing 2014, 50, 399–413. [CrossRef]
- Kocan F., Hicsonmez U. Leaching kinetics of celestite in nitric acid solutions. International Journal of Minerals, Metallurgy, and Materials 2019, 26, 11–20. [CrossRef]
- Rusanen L, Aromaa J, Forsen O. Pressure oxidation of pyrite-arsenopyrite refractory gold concentrate. Physicochemical Problems of Mineral Processing 2013, 49(1), 101-109. [CrossRef]
- Li K.; Chen J.; Zou D.; Liu T.; Li D. Kinetics of nitric acid leaching of cerium from oxidation roasted Baotou mixed rare earth concentrate. Journal of Rare Earths 2019, 37, 198–204. [CrossRef]
- Kritskii, A.; Celep, O.; Yazici, E.; Deveci, H.; Naboichenko S. Hydrothermal treatment of sphalerite and pyrite particles with CuSO4 solution. Minerals Engineering 2022, 180, 107507. [CrossRef]
- Anderson C., Twidwell L. Hydrometallurgical processing of gold-bearing copper enargite concentrates. Canadian Metallurgical Quarterly 2008, 47: 337–346. [CrossRef]
- Wang, P.; Tan, K.; Li, Y.; Liu, Z.; Li, C.; Tan, W.; Tian, Y.; Huang, W. Effect of Pyrite on the Leaching Kinetics of Pitchblende in the Process of Acid In Situ Leaching of Uranium. Minerals 2022, 12, 570. [CrossRef]
- Fomchenko, N. V.; Muravyov, M. I. Effect of sulfide mineral content in copper-zinc concentrates on the rate of leaching of non-ferrous metals by biogenic ferric iron. Hydrometallurgy 2019, 185, 82-87. [CrossRef]
- Córdoba, E.M.; Muñoz, J.A.; Blázquez, M.L.; González, F.; Ballester, A. Leaching of chalcopyrite with ferric ion. Part I: General aspects. Hydrometallurgy 2008, 93(3–4), 81-87. [CrossRef]
- Richman, C. I. Chalcopyrite leaching with silver salts; Properties of Ag2S film. Abstract 130th Annual International Meeting and Exhibition of TMS 2001, 11, 58.
- Yuehua, H., Guanzhou Q., Jan W., Dianzuo W. The effect of silver-bearing catalysts on bioleaching of chalcopyrite. Hydrometallurgy 2002, 64(2), 81‒88. [CrossRef]
- Hu, Y.; Wang, J.; Qui, G.; Wang, D. Influences of silver sulfide on the bioleaching of chalcopyrite, pyrite and chalcopyrite-containing ore. Journal of Central South University of Technology 2002, 9(1), 11-15. [CrossRef]
- Carranza, F.; Iglesias, N.; Mazuelos, A.; Palencia, I.; Romero R. Treatment of copper concentrates containing chalcopyrite and nonferrous sulphides by the BRISA process. Hydrometallurgy 2004, 71(3‒4), 413-420. [CrossRef]
- Koleini, S. V. Javad; Aghazadeh, V.; Sandstrom, A. Acidic sulphate leaching of chalcopyrite concentrates in presence of pyrite. Mineral Ingeneering 2011, 24(5), 381-386. [CrossRef]
- Ahonen, L.; Touvinen, O. Catalytic effects of silver in the microbiological leaching of finely ground chalcopyrite-containing ore materials in shake flasks. Hydrometallurgy, 1990, 24, 219–236. [CrossRef]
- Romero R., Palencia I., Carranza F. Silver catalyzed IBES process: Application to a Spanish copper–zinc sulphide concentrate part 3. Selection of the operational parameters for a continuous pilot plant. Hydrometallurgy 1998, 49, 75–86. [CrossRef]
- Majuste, D.; Ciminelli, V.S.T.; Osseo-Asare, K.; Dantas, M.S.S. Quantitative assessment of the effect of pyrite inclusions on chalcopyrite electrochemistry under oxidizing conditions. Hydrometallurgy 2012, 113-114, 167-176. [CrossRef]
- Nazari, G.; Dixon, D. G.; Dreizinger, D. B. Enhancing the kinetics of chalcopyrite leaching in the GalvanoxTM process. Hydrometallurgy 2011, 105(3-4), 251-258. [CrossRef]
- Nazari, G.; Dixon, D. G.; Dreizinger, D. B. The role of galena associated with silver-enhanced pyrite in the linetics of chalcopyrite leaching during the GalvanoxTM process. Hydrometallurgy 2012, 111-112, 35-45. [CrossRef]
- Nazari, G.; Dixon, D. G.; Dreizinger, D. B. The mechanism of chalcopyrite leaching in the presence of silverenhanced pyrite in the GalvanoxTM process. Hydrometallurgy 2012, 113-114, 122-130. [CrossRef]
- Nazari, G.; Dixon, D. G.; Dreizinger, D. B. The role of silver-enhanced pyrite in enhancing the electrical conductivity of sulfur product layer during chalcopyrite leaching in the GalvanoxTM process. Hydrometallurgy 2012. 113-114, 177-184. [CrossRef]
- Hiroyoshi, N.; Kitagawa, H.; Tsunekawa, M. Effect of solution composition on the optimum redox potential for chalcopyrite leaching in sulfuric acid solutions. Hydrometallurgy 2008, 91(1-4), 144-149. [CrossRef]
- Hiroyoshi, N.; Hirota, M.; Hirajima, T.; Tsunekawa, M. A case of ferrous sulfate addition enhancing chalcopyrite leaching. Hydrometallurgy 1997, 47(1), 37-45. [CrossRef]
- Hiroyoshi, N.; Miki, H.; Hirajima, T.; Tsunekawa, M. A model for ferrous-promoted leaching. Hydrometallurgy 2000, 57(1), 31-38. [CrossRef]
- Hiroyoshi, N.; Miki, H.; Hirajima, T.; Tsunekawa, M. Enhancement of chalcopyrite leaching by ferrous ions in acidic ferric sulfate solutions. Hydrometallurgy 2001, 60(3), 185-197. [CrossRef]
- Grebneva, A.A.; Subbotina, I.L.; Timofeev, K.L.; Maltsev, G.I. Development of Technology of Arsenic Removal from Acidic Waste Solutions in the Form of Arsenic Trisulfide. KnE Materials Science / IV Congress “Fundamental Research and Applied Developing of Recycling and Utilization Processes of Technogenic Formations” 2020, pp. 209–213. [CrossRef]
- Liu, J.; Wen, S.M.; Liu, D.; Lv, M.Y. Response surface methodology for optimization of copper leaching from a low-grade flotation middling. Miner. Metall. Proc. 2011, 28, 139–145. [CrossRef]
- Nnanwube I., Udeaja J., Onukwuli O., Ugonabo V., Uwaleke C. Modelling and optimisation of zinc recovery from sphalerite using response surface methodology. Maejo International Journal of Science and Technology 2020, 14, 283-292.
- Chandra A., Gerson A. The mechanisms of pyrite oxidation and leaching: A fundamental perspective. Surface Science Reports, 2010, 65, 293-315. [CrossRef]
- Karimov, K.A.; Rogozhnikov, D.A.; Kuzas, E.A.; Shoppert, A.A. Leaching Kinetics of Arsenic Sulfide-Containing Materials by Copper Sulfate Solution. Metals 2020, 10, 7. [CrossRef]
- Rogozhnikov, D.; Karimov, K.; Shoppert, A.; Dizer, O.; Naboichenko, S. Kinetics and mechanism of arsenopyrite leaching in nitric acid solutions in the presence of pyrite and Fe(III) ions. Hydrometallurgy 2021, 199, 105525. [CrossRef]
- Dixon, D. G., Mayne, D. D., Baxter, K. G. GalvanoxTM – A novel galvanically-assisted atmospheric leaching technology for copper concentrates. Canadian Metallurgical Quarterly 2008, 47(3), 327–336. [CrossRef]
- Dizer O., Rogozhnikov D., Karimov K., Kuzas E., Suntsov A. Nitric Acid Dissolution of Tennantite, Chalcopyrite and Sphalerite in the Presence of Fe (III) Ions and FeS2. Materials 2022, 15(4), 1545. [CrossRef]
- Karimov, K.; Tretiak, M.; Rogozhnikov, D.; Dizer, O. The Dissolution Behavior of Pyrite and Chalcopyrite During Low-Temperature Pressure Oxidation: Chalcopyrite Influence on Pyrite Oxidation. Materials 2024, 17, 5132. [CrossRef]
Figure 1.
X-ray diffraction pattern of phase composition; a – chalcopyrite; b – pyrite.
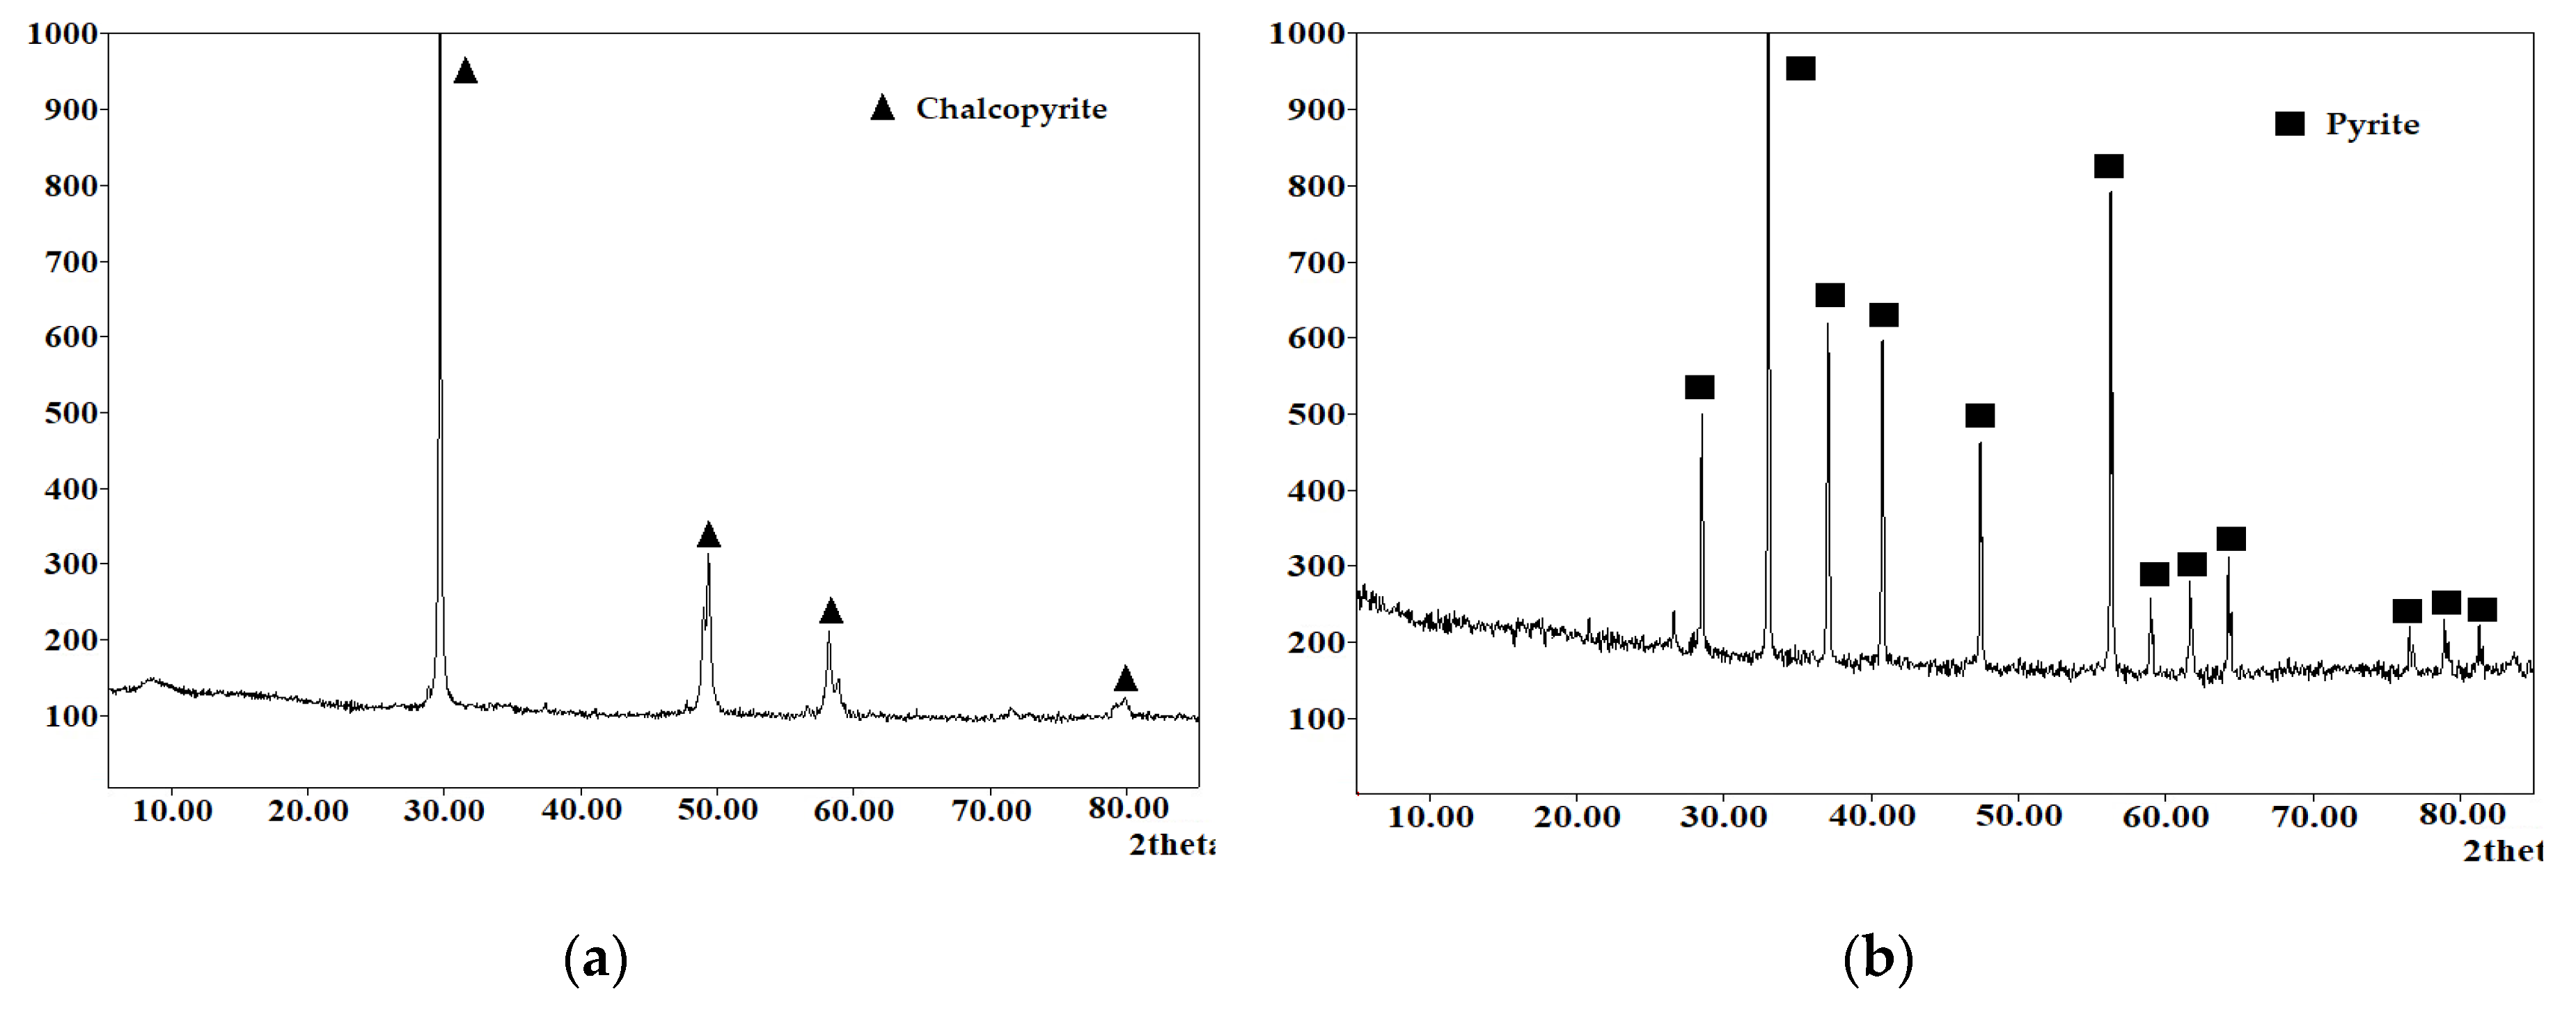
Figure 2.
Particle size distribution of sulfide minerals; a – chalcopyrite; b – pyrite.
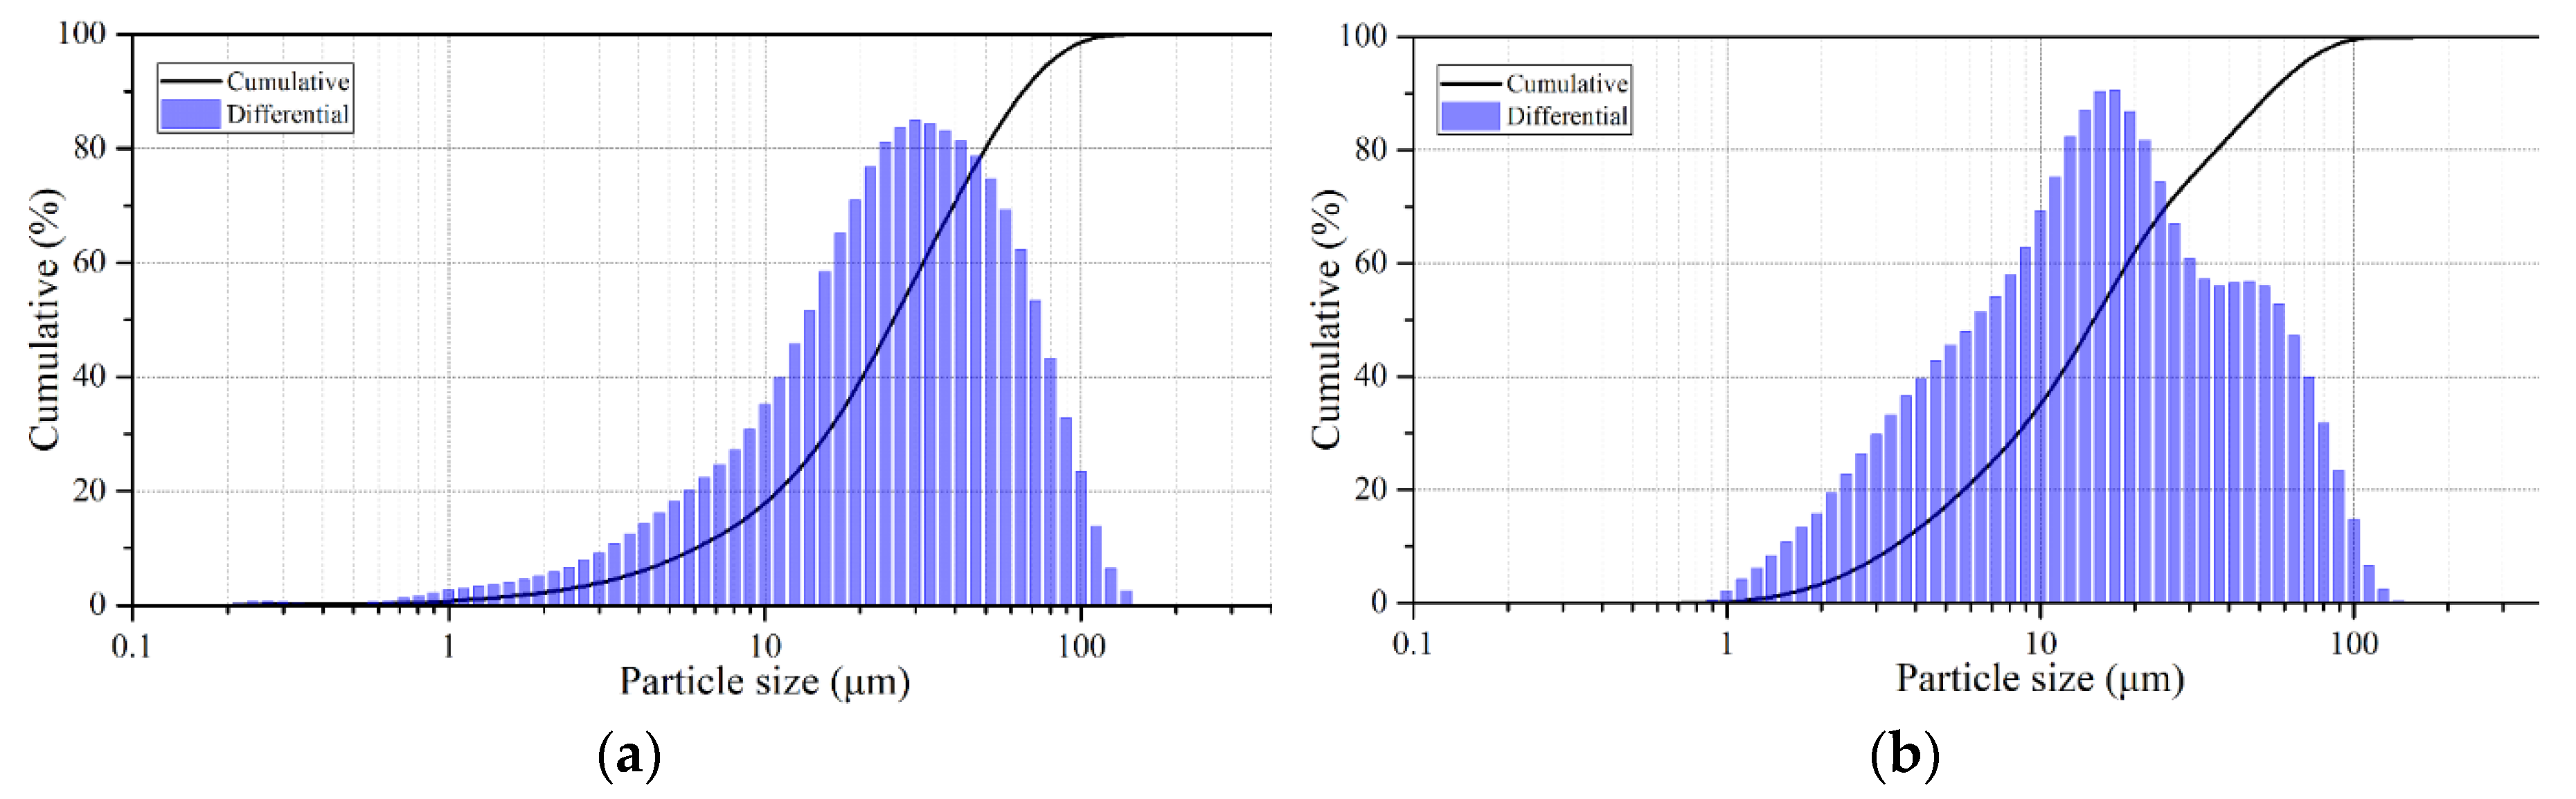
Figure 3.
Actual and predicted values of the degree of chalcopyrite dissolution in a mixture with pyrite.
Figure 3.
Actual and predicted values of the degree of chalcopyrite dissolution in a mixture with pyrite.
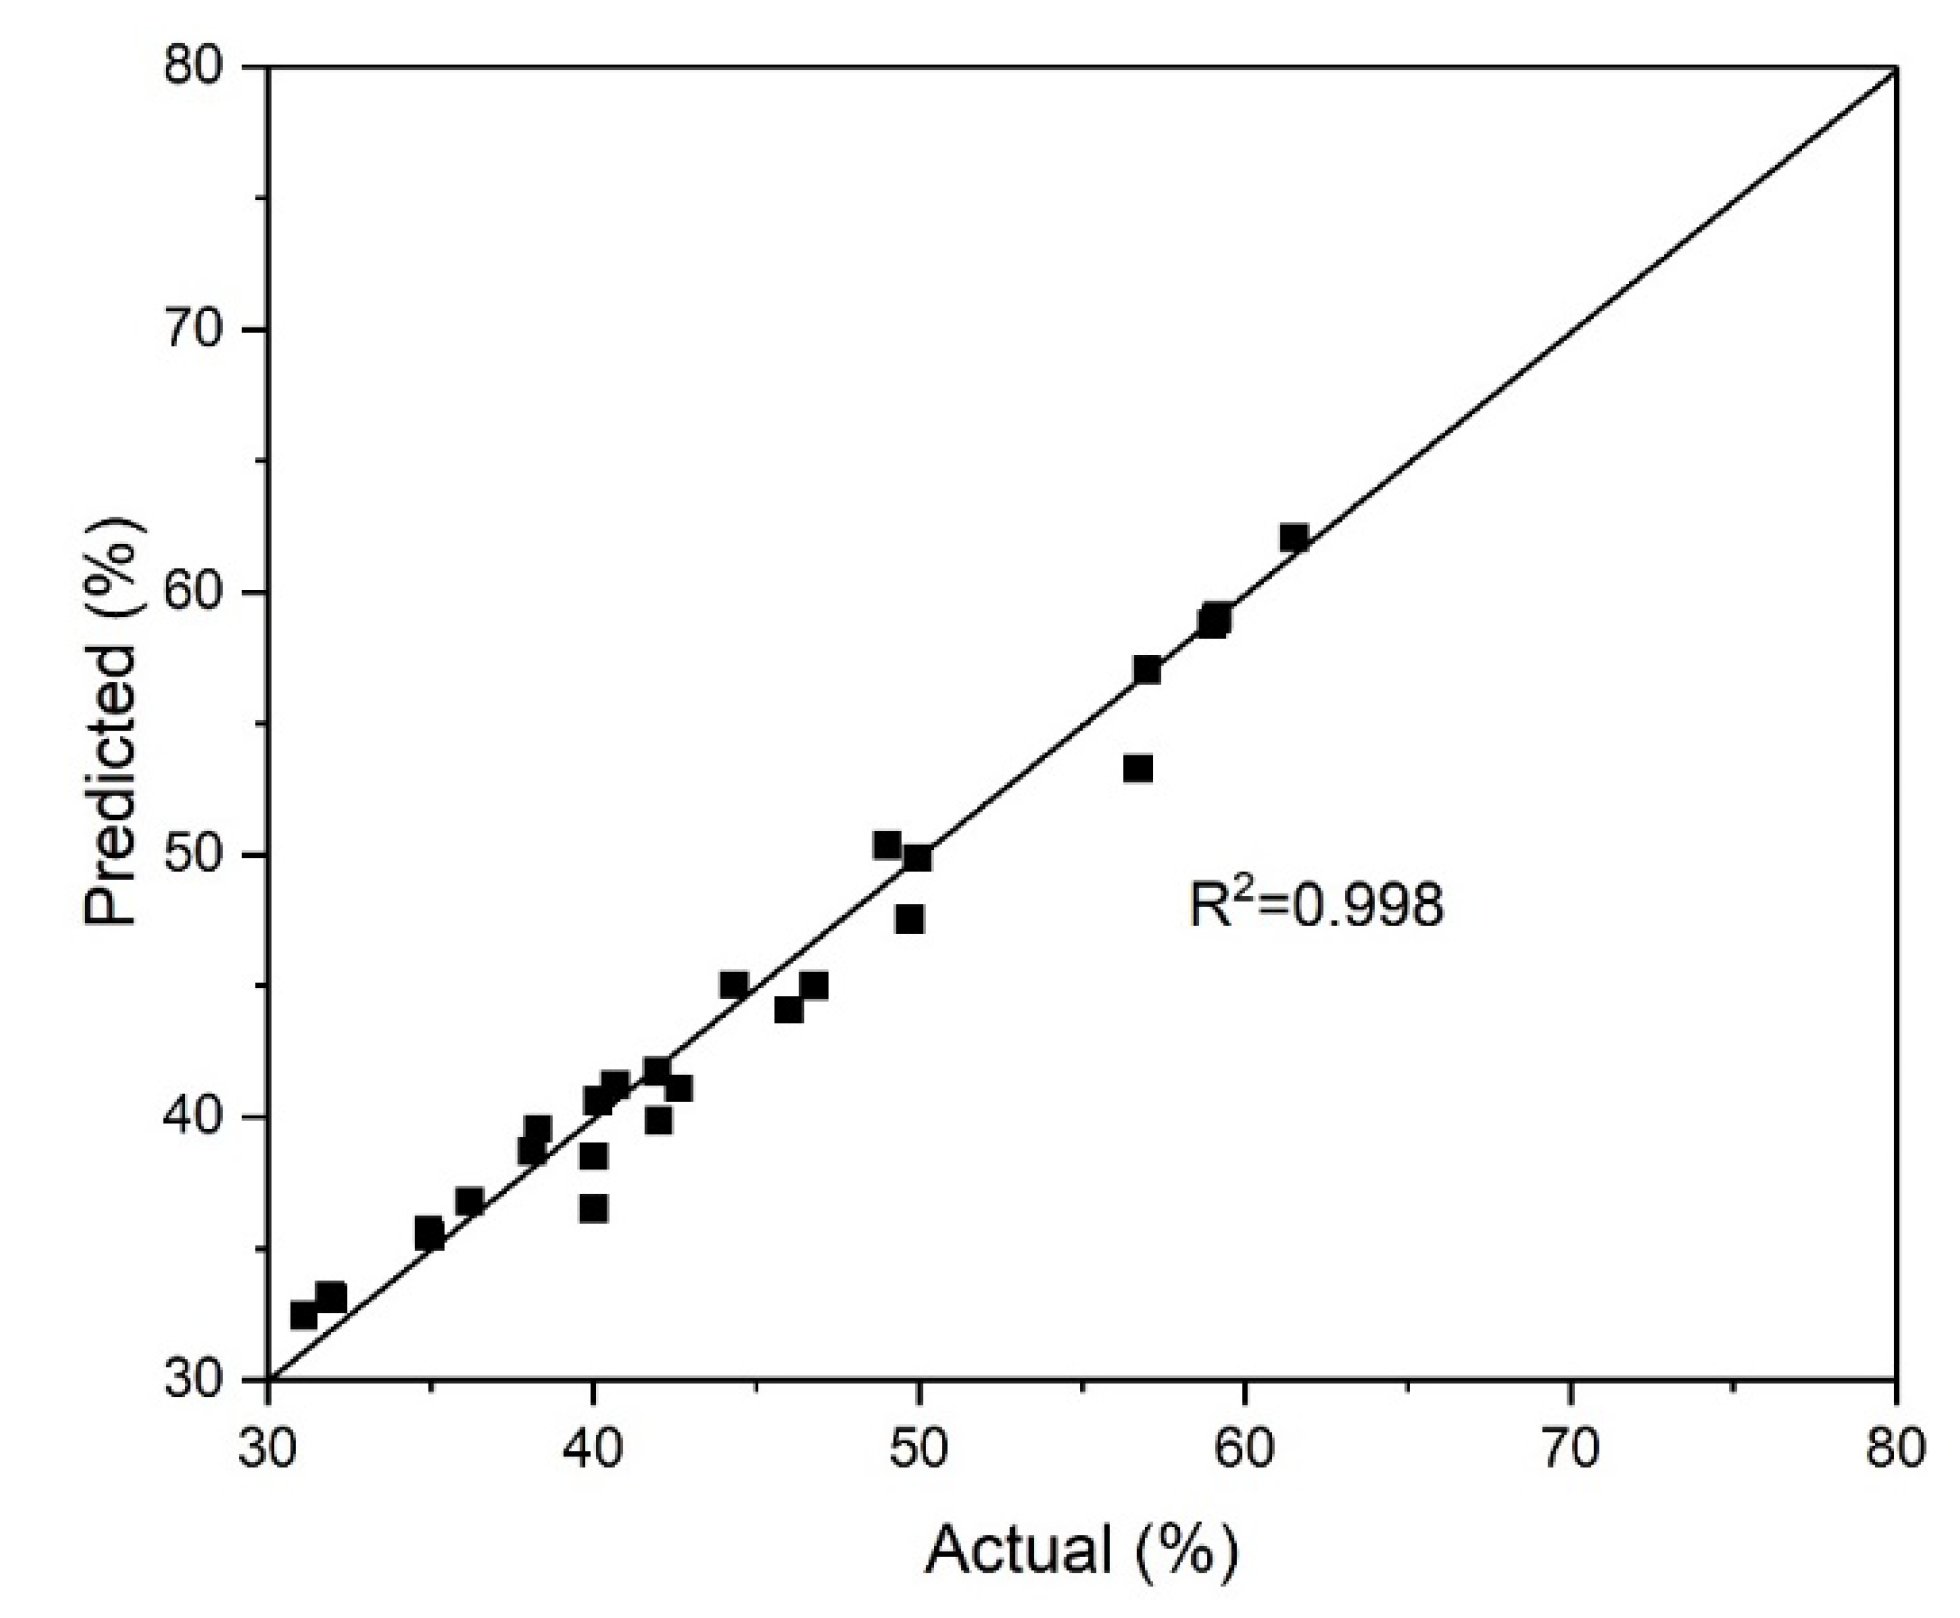
Figure 4.
Dependence of the chalcopyrite dissolution degree on the duration and oxygen pressure (a), initial concentration of sulfuric acid (b), iron (III) ion concentration (c), and copper (II) ion concentration (d).
Figure 4.
Dependence of the chalcopyrite dissolution degree on the duration and oxygen pressure (a), initial concentration of sulfuric acid (b), iron (III) ion concentration (c), and copper (II) ion concentration (d).
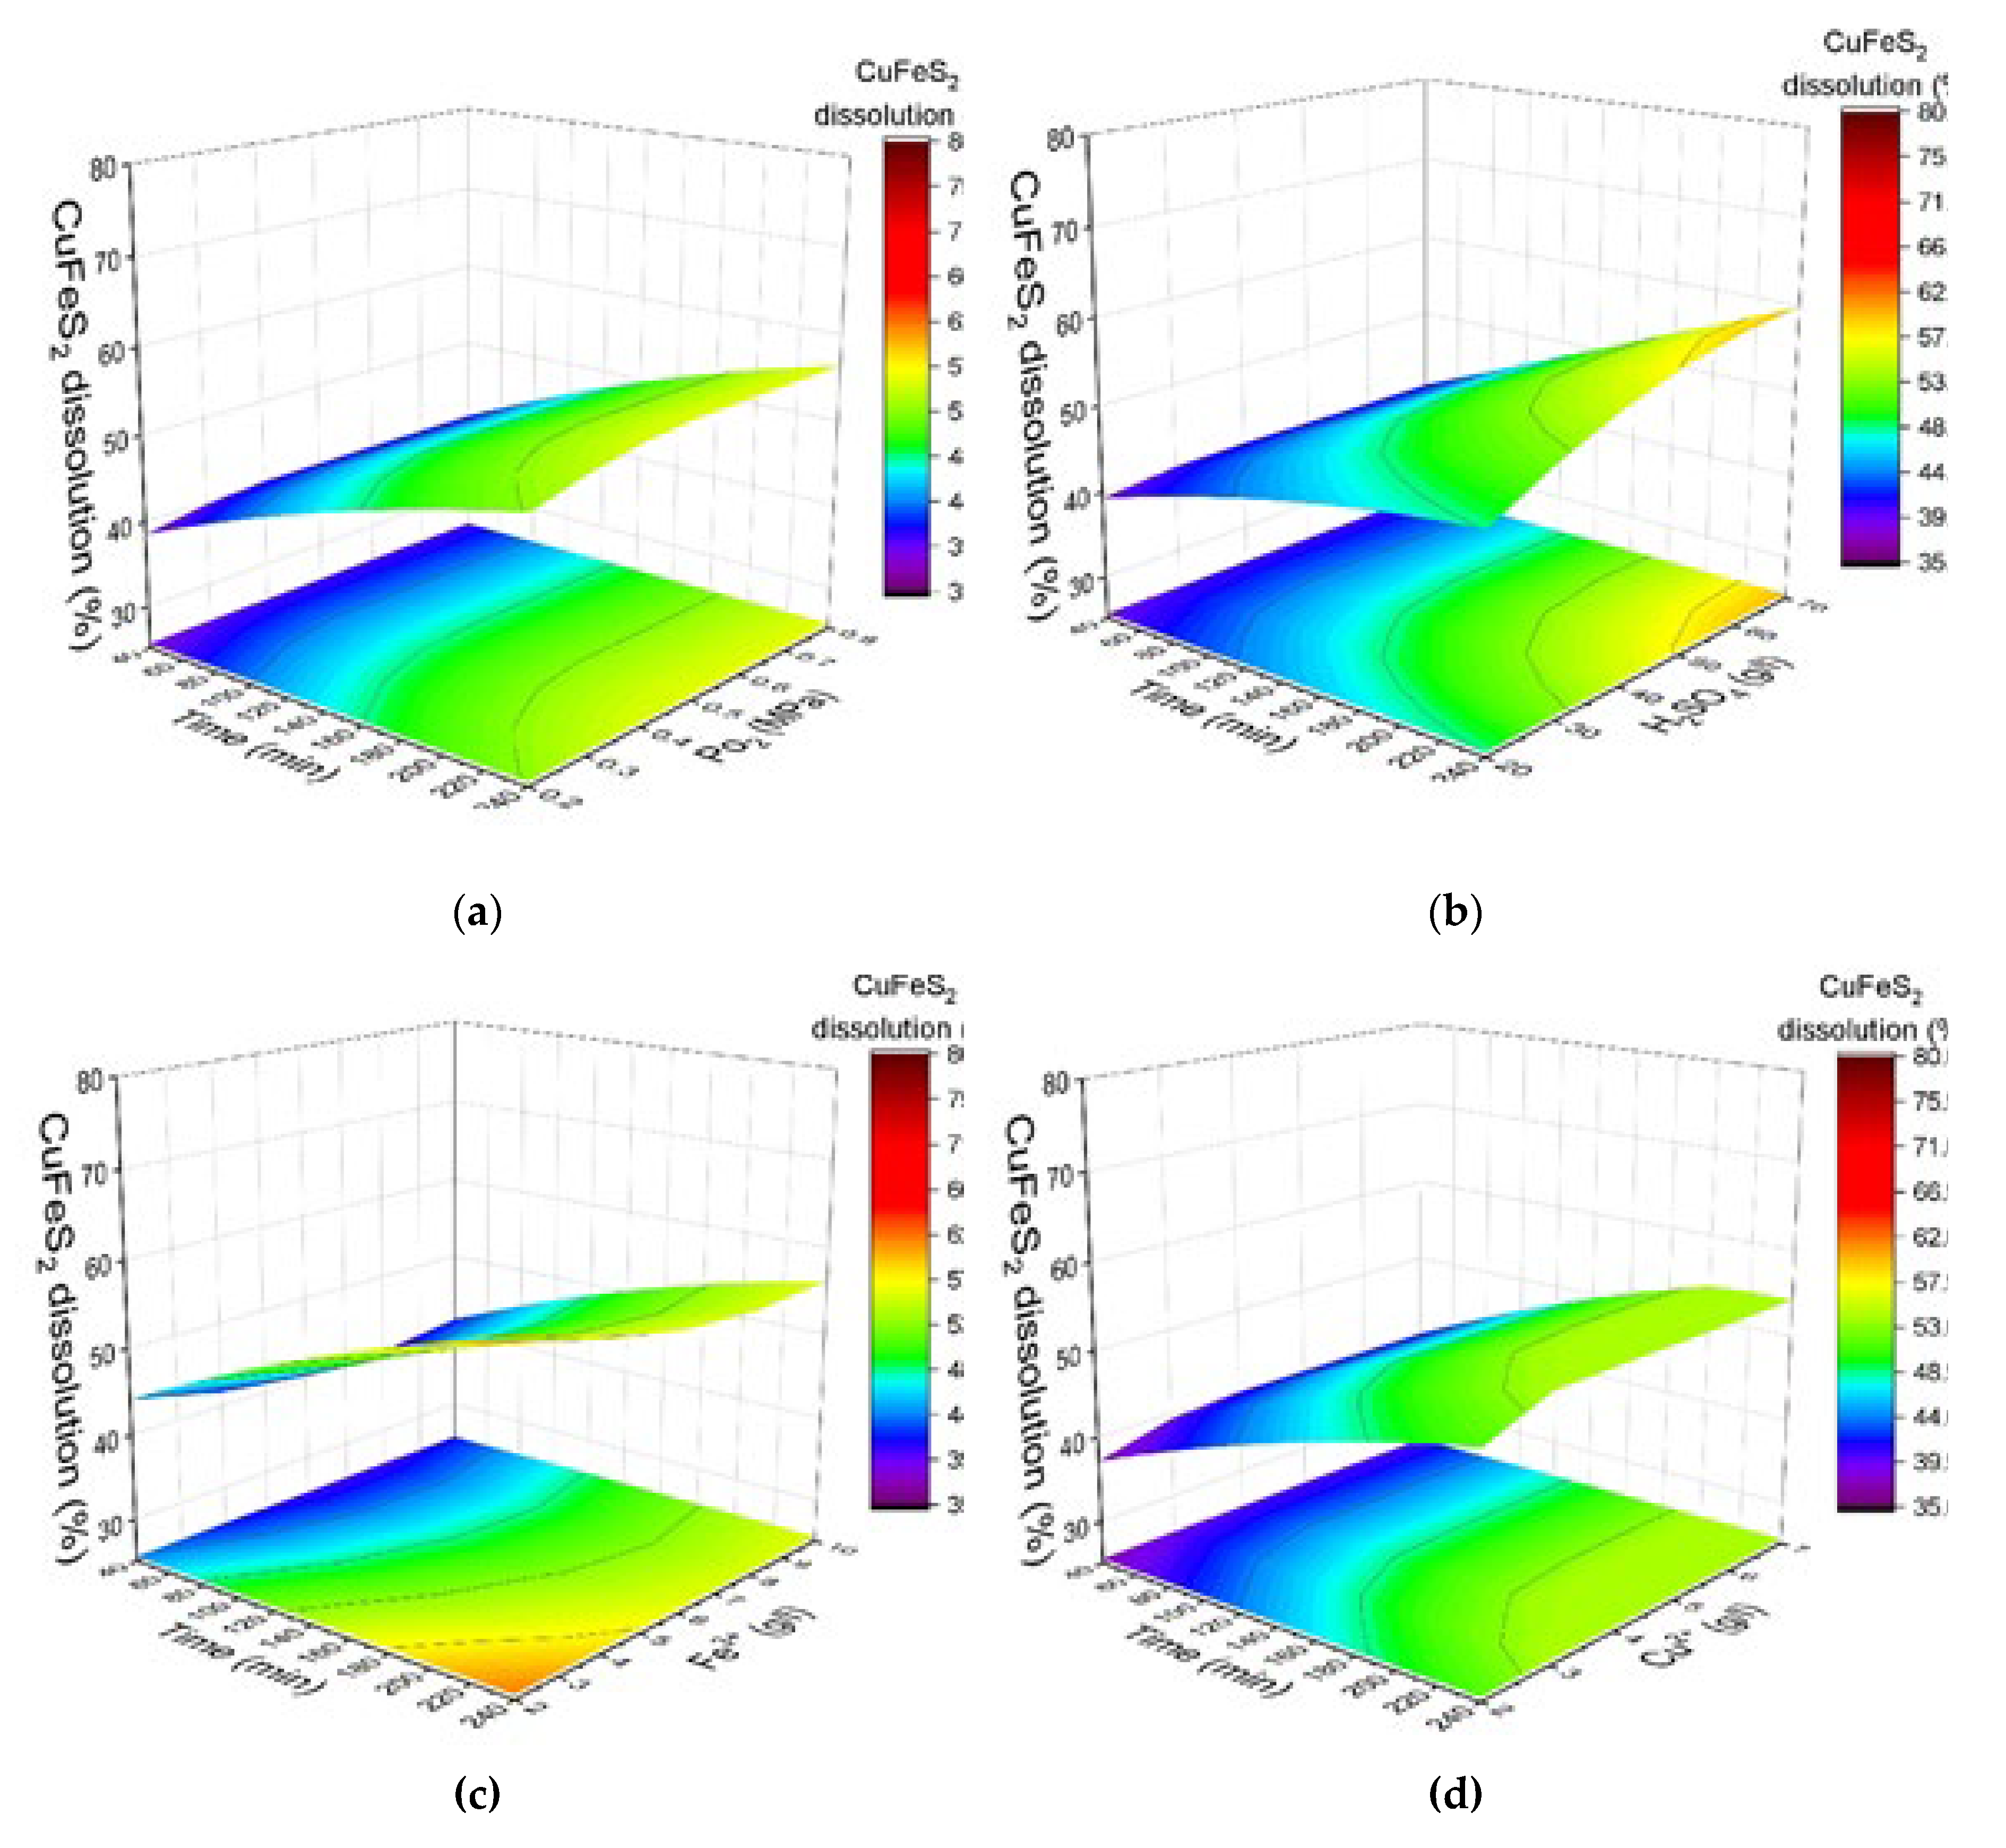
Figure 5.
Actual and predicted values of the pyrite dissolution degree in its mixture with chalcopyrite.
Figure 5.
Actual and predicted values of the pyrite dissolution degree in its mixture with chalcopyrite.
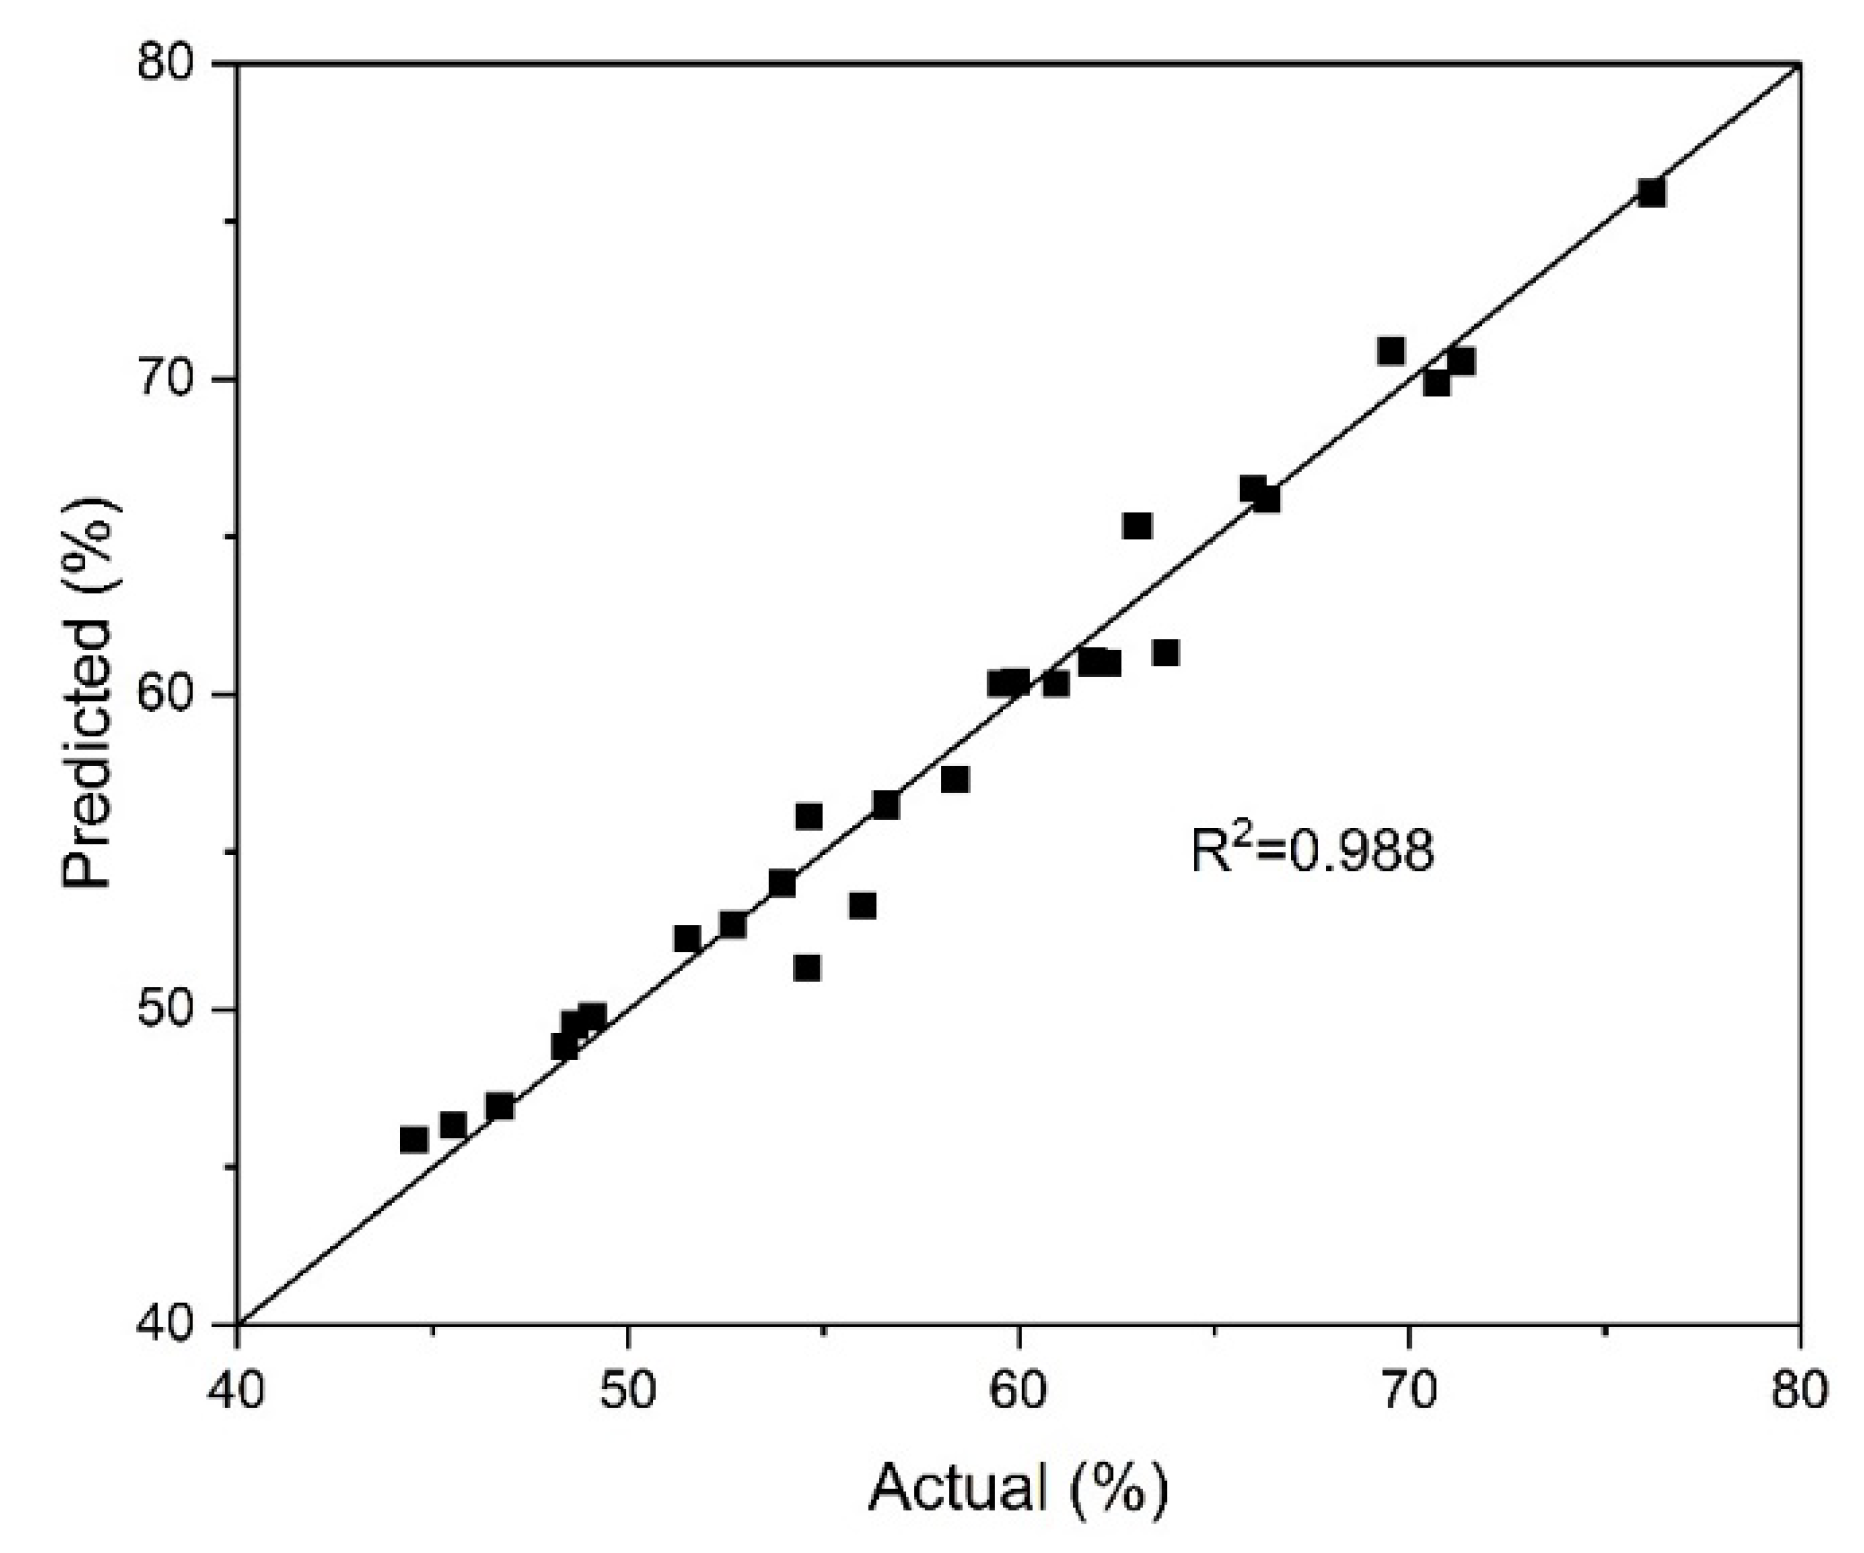
Figure 6.
Dependence of the pyrite dissolution degree on duration and oxygen pressure (a), initial concentration of sulfuric acid (b), concentrations of iron (III) (c) and copper (II) ions (d).
Figure 6.
Dependence of the pyrite dissolution degree on duration and oxygen pressure (a), initial concentration of sulfuric acid (b), concentrations of iron (III) (c) and copper (II) ions (d).
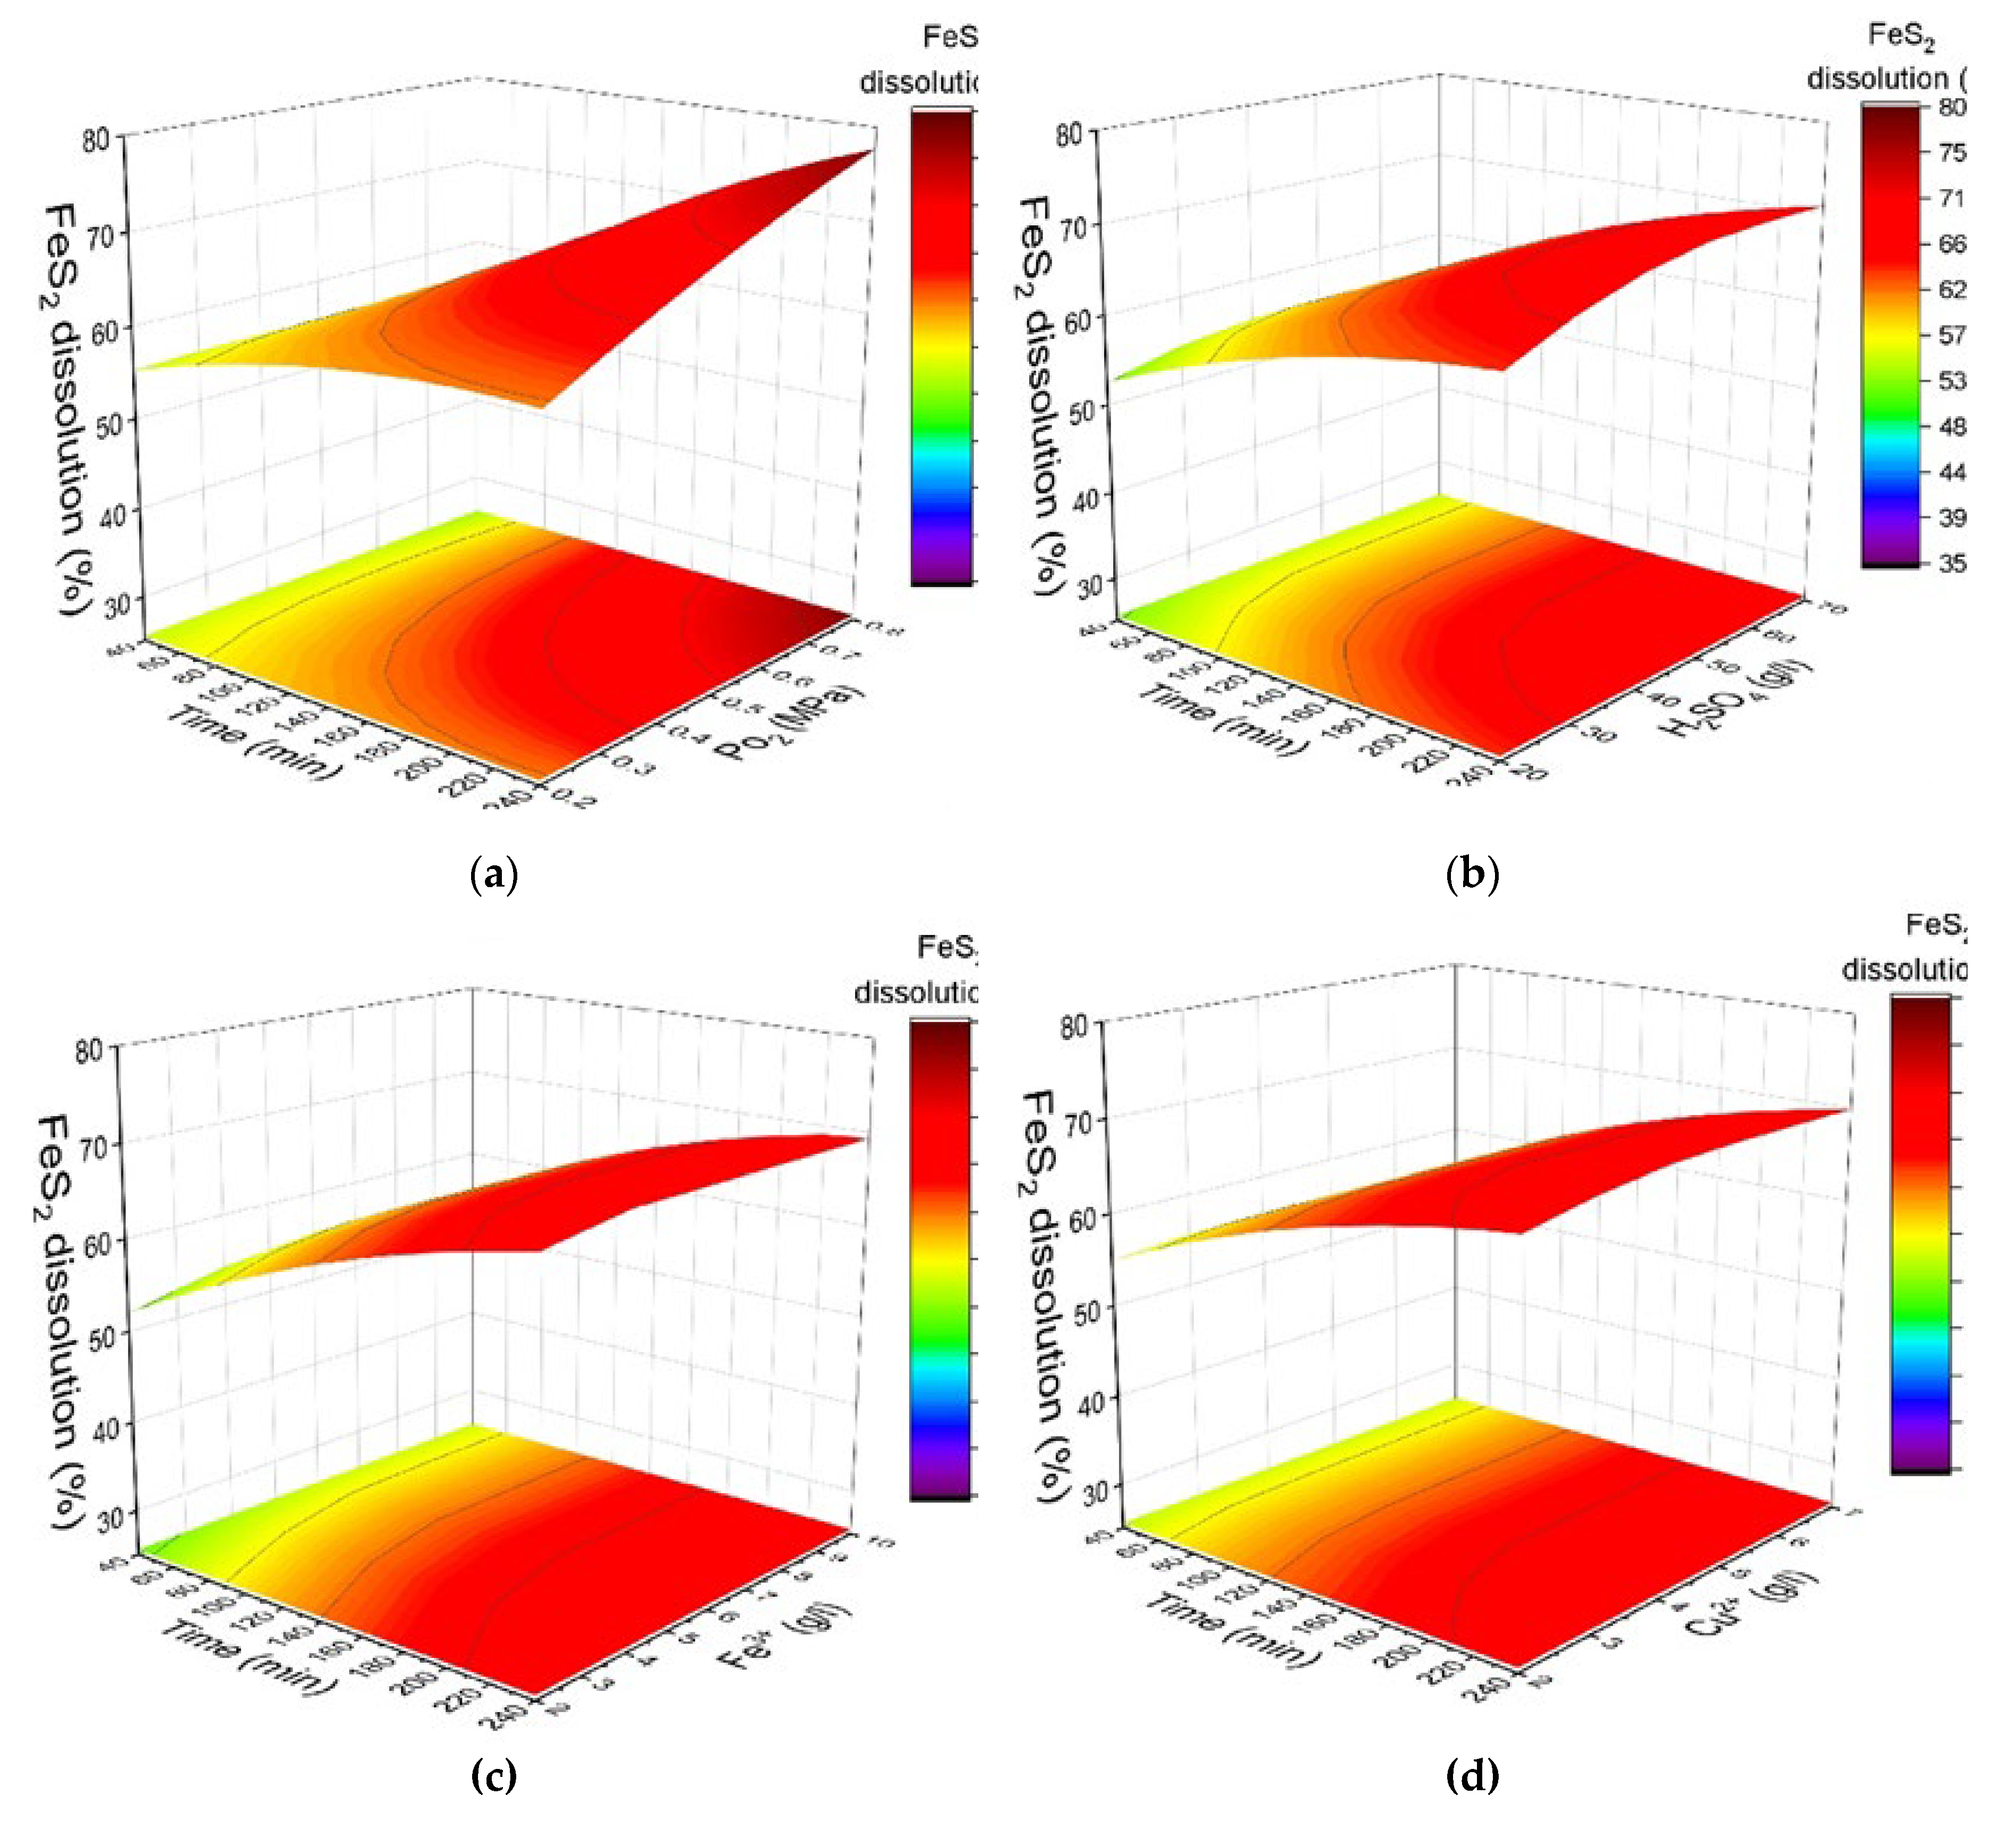
Figure 7.
Temperature dependence of the dissolution degree of chalcopyrite (a) and pyrite (b).
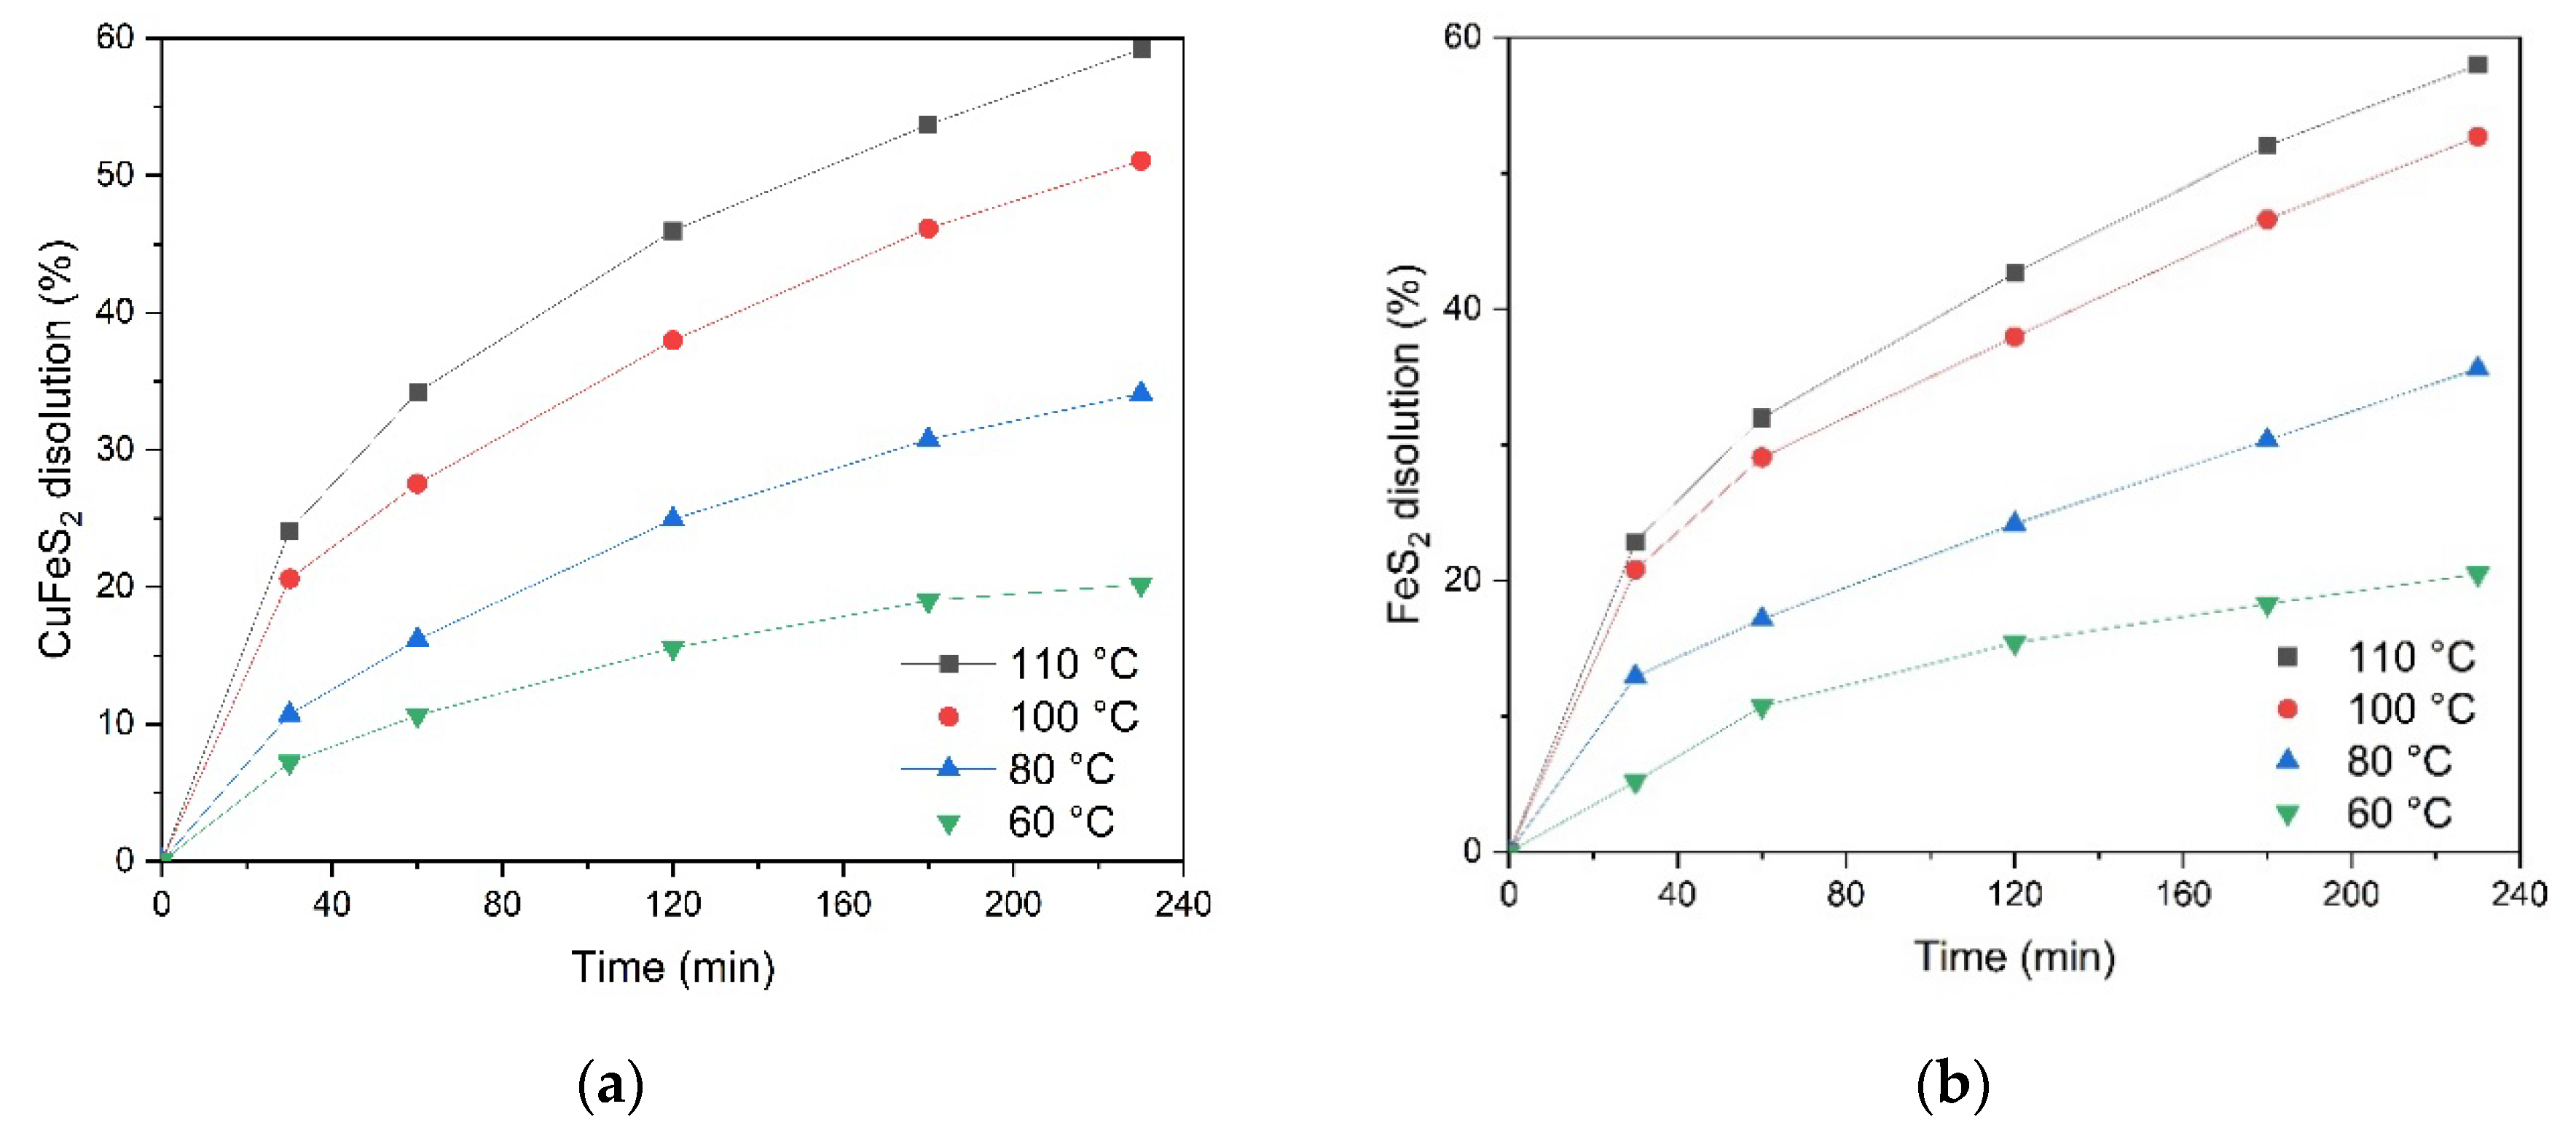
Figure 8.
Calculation of the slope kc for chalcopyrite (a) and pyrite (c) depending on temperature, graphical determination of the activation energy for chalcopyrite (b) and pyrite (d).
Figure 8.
Calculation of the slope kc for chalcopyrite (a) and pyrite (c) depending on temperature, graphical determination of the activation energy for chalcopyrite (b) and pyrite (d).
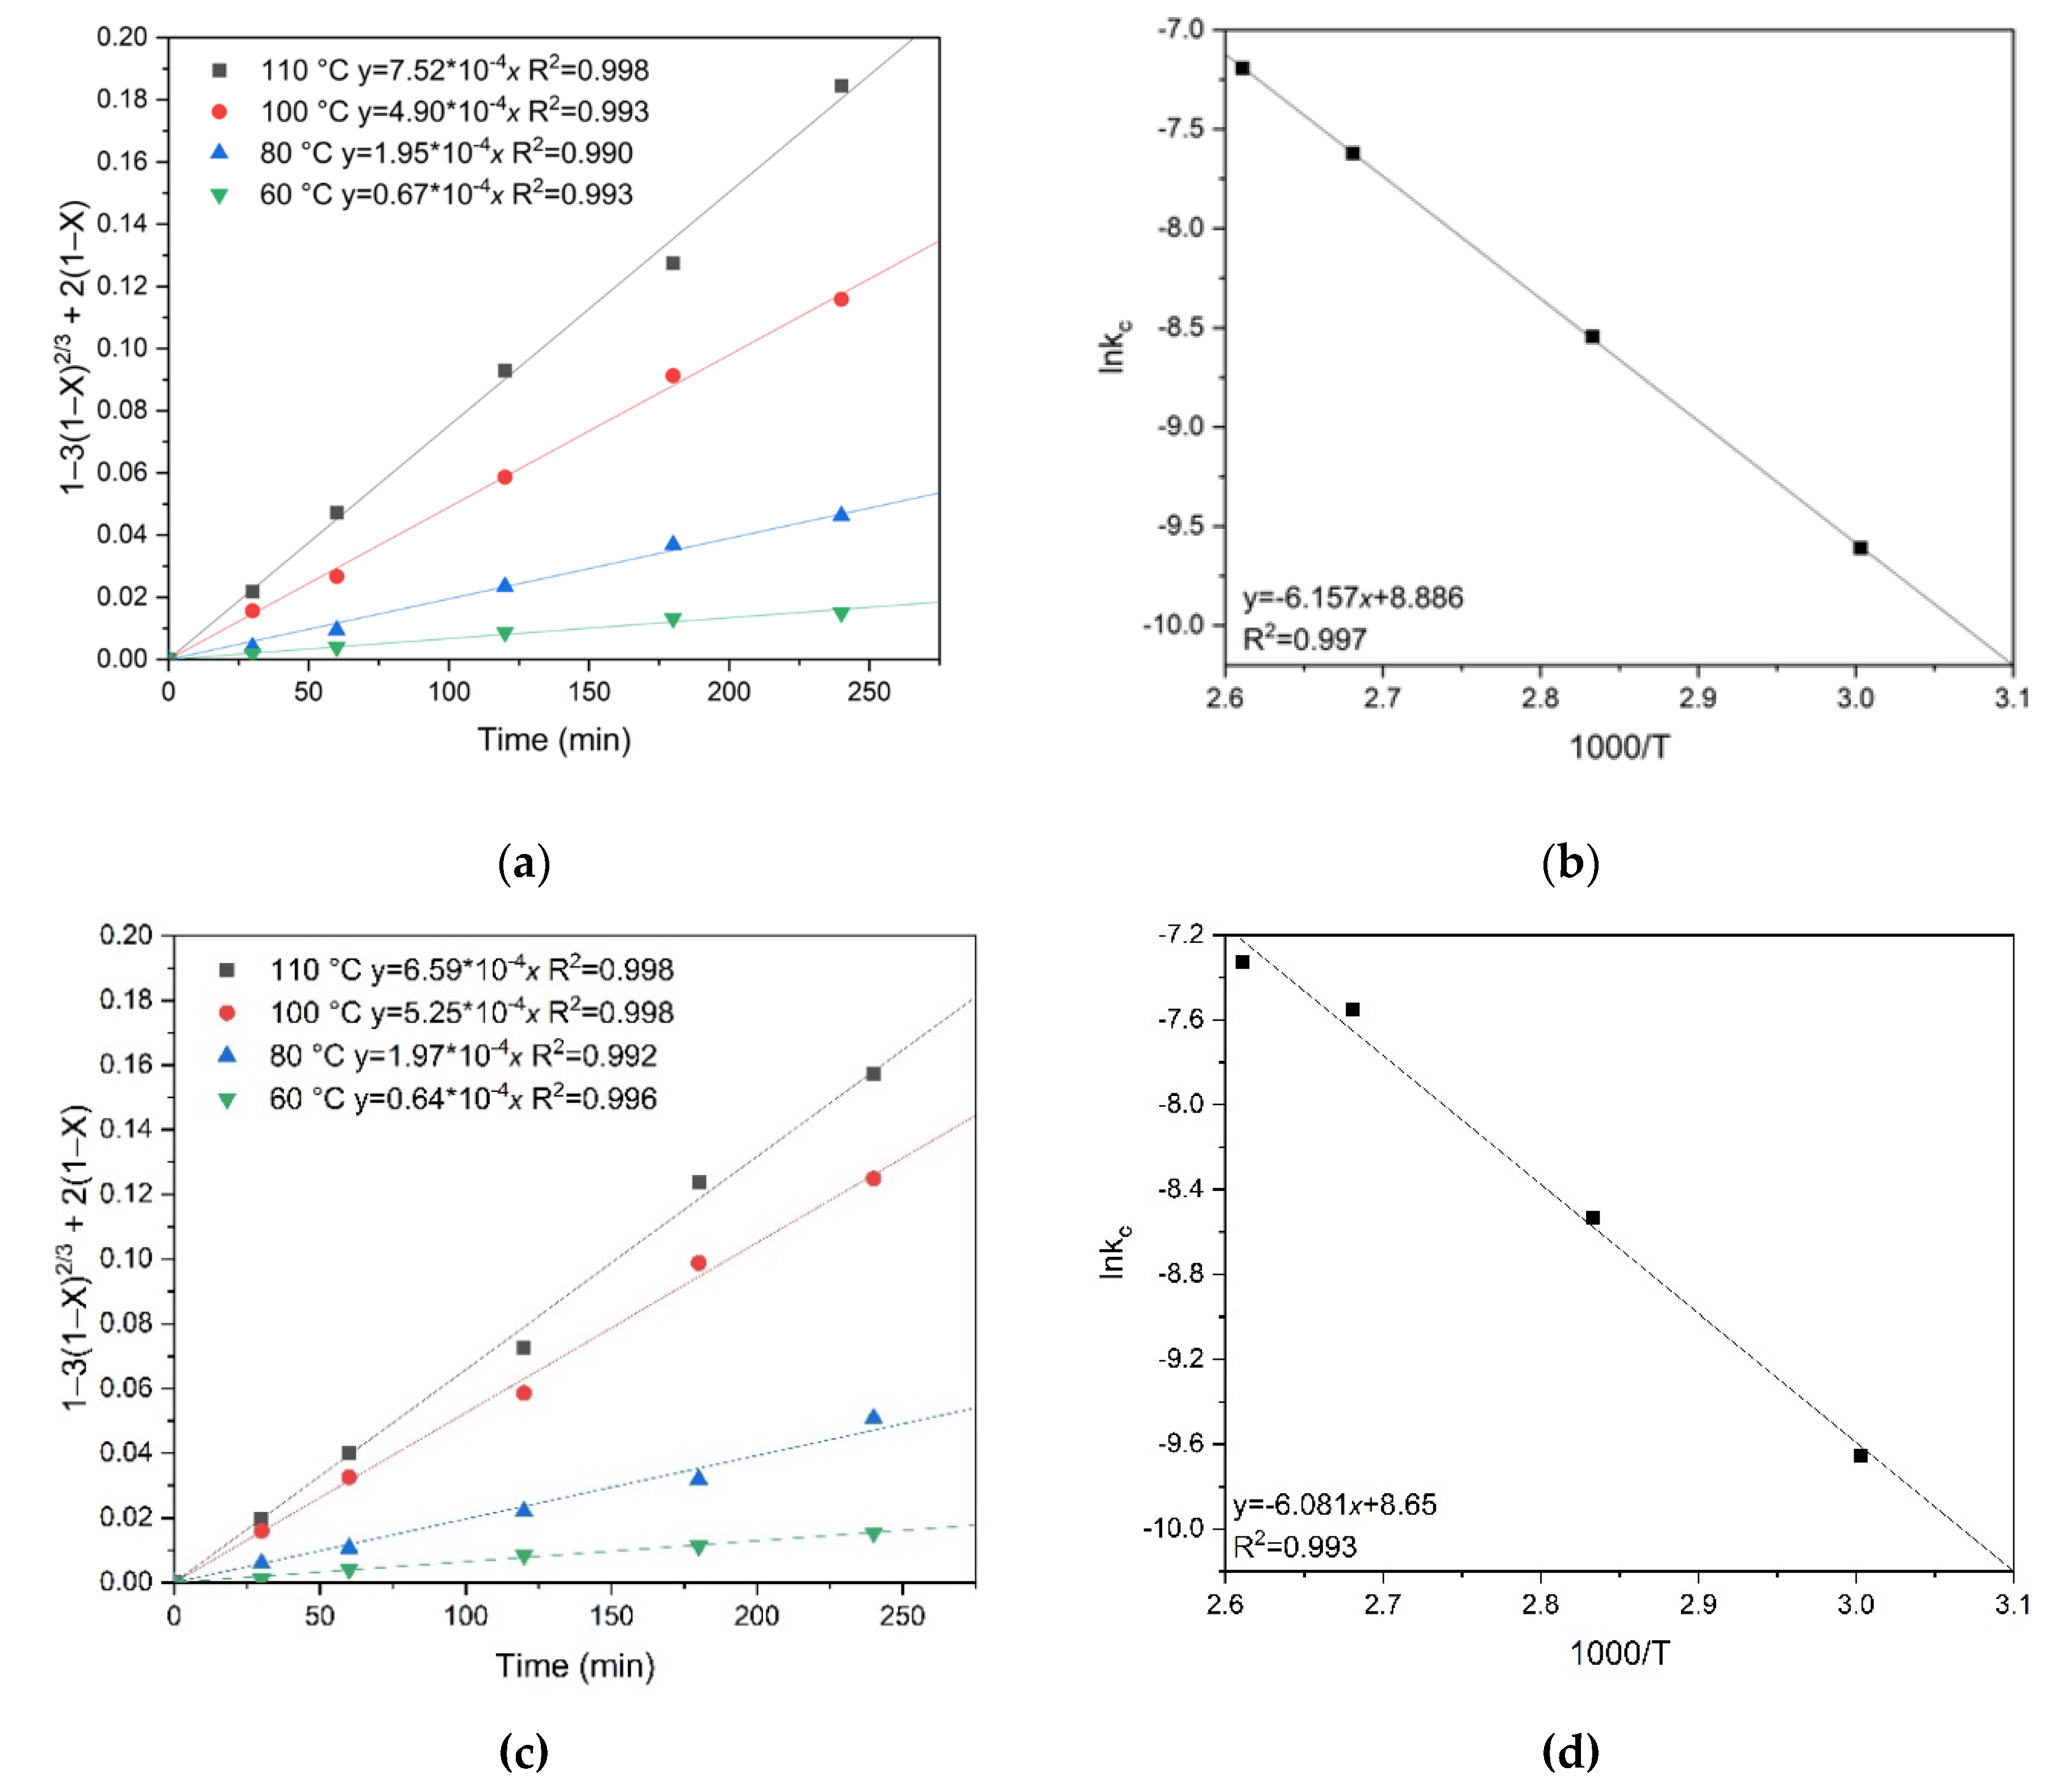
Figure 9.
Calculation of the slope kc for chalcopyrite (a) and pyrite (c) depending on oxygen pressure, graphical determination of the empirical partial order for oxygen pressure for chalcopyrite (b) and pyrite (d).
Figure 9.
Calculation of the slope kc for chalcopyrite (a) and pyrite (c) depending on oxygen pressure, graphical determination of the empirical partial order for oxygen pressure for chalcopyrite (b) and pyrite (d).
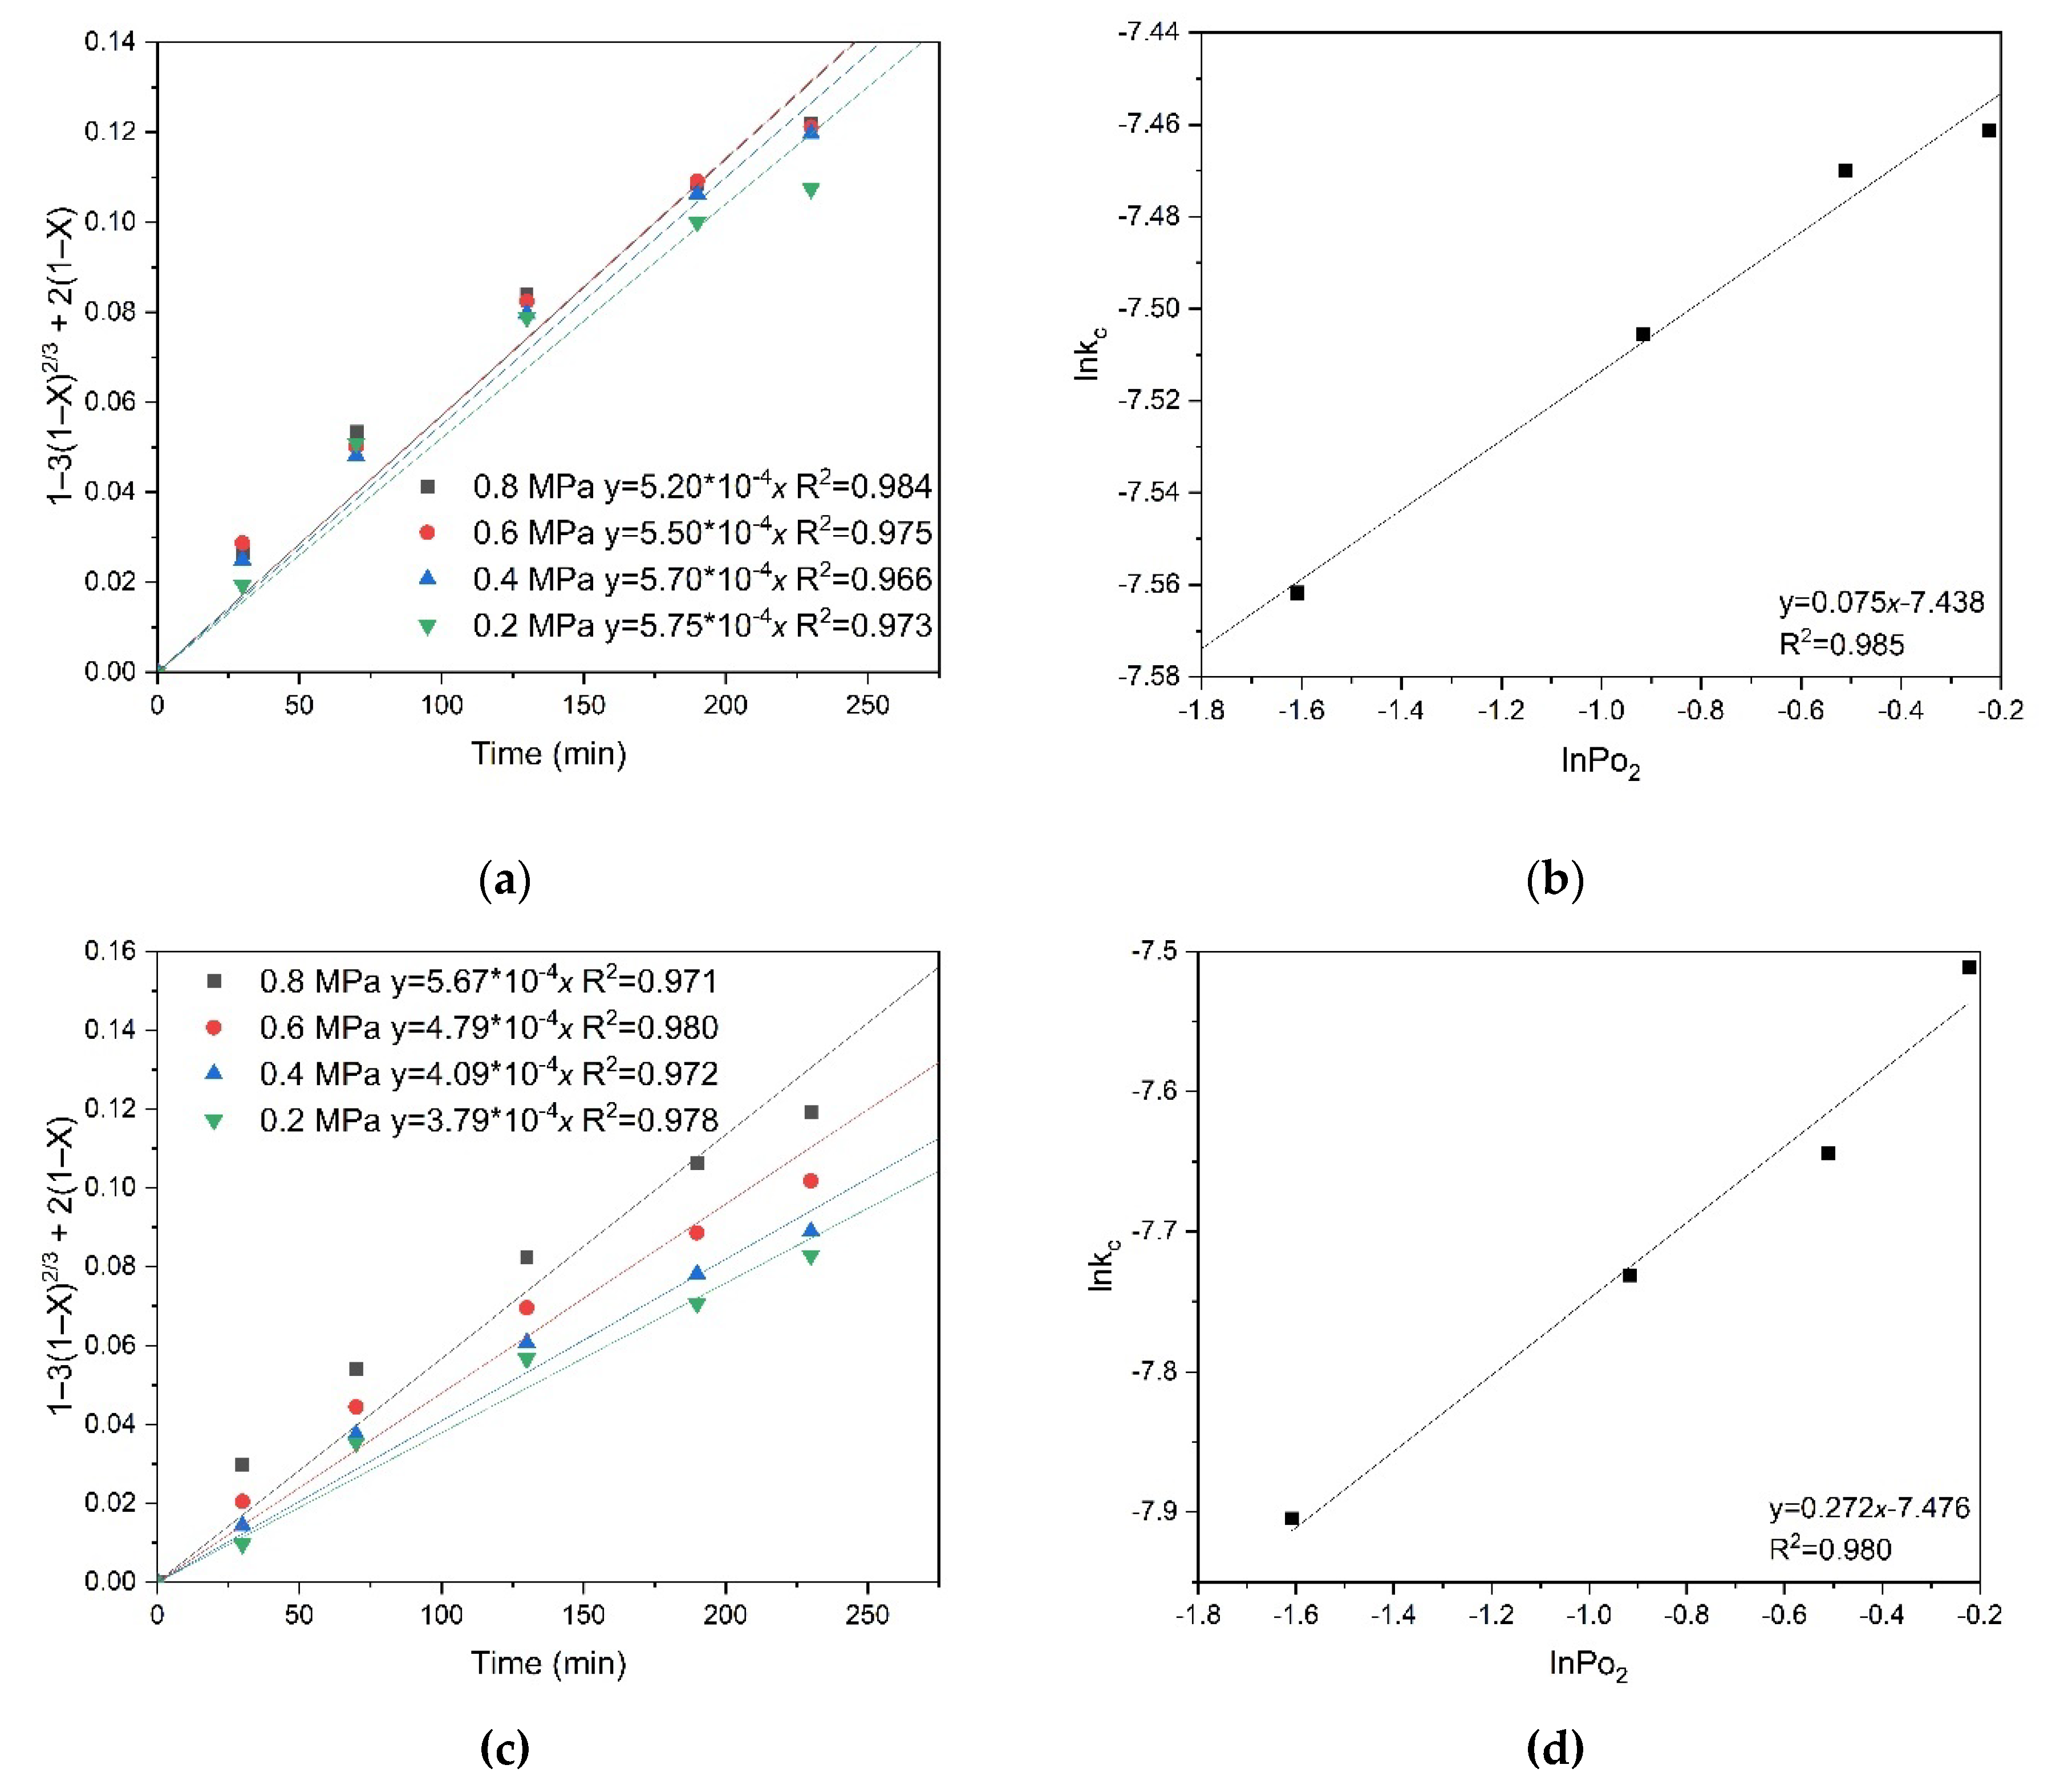
Figure 10.
Graph to estimate k0 for chalcopyrite (a) and pyrite (b).
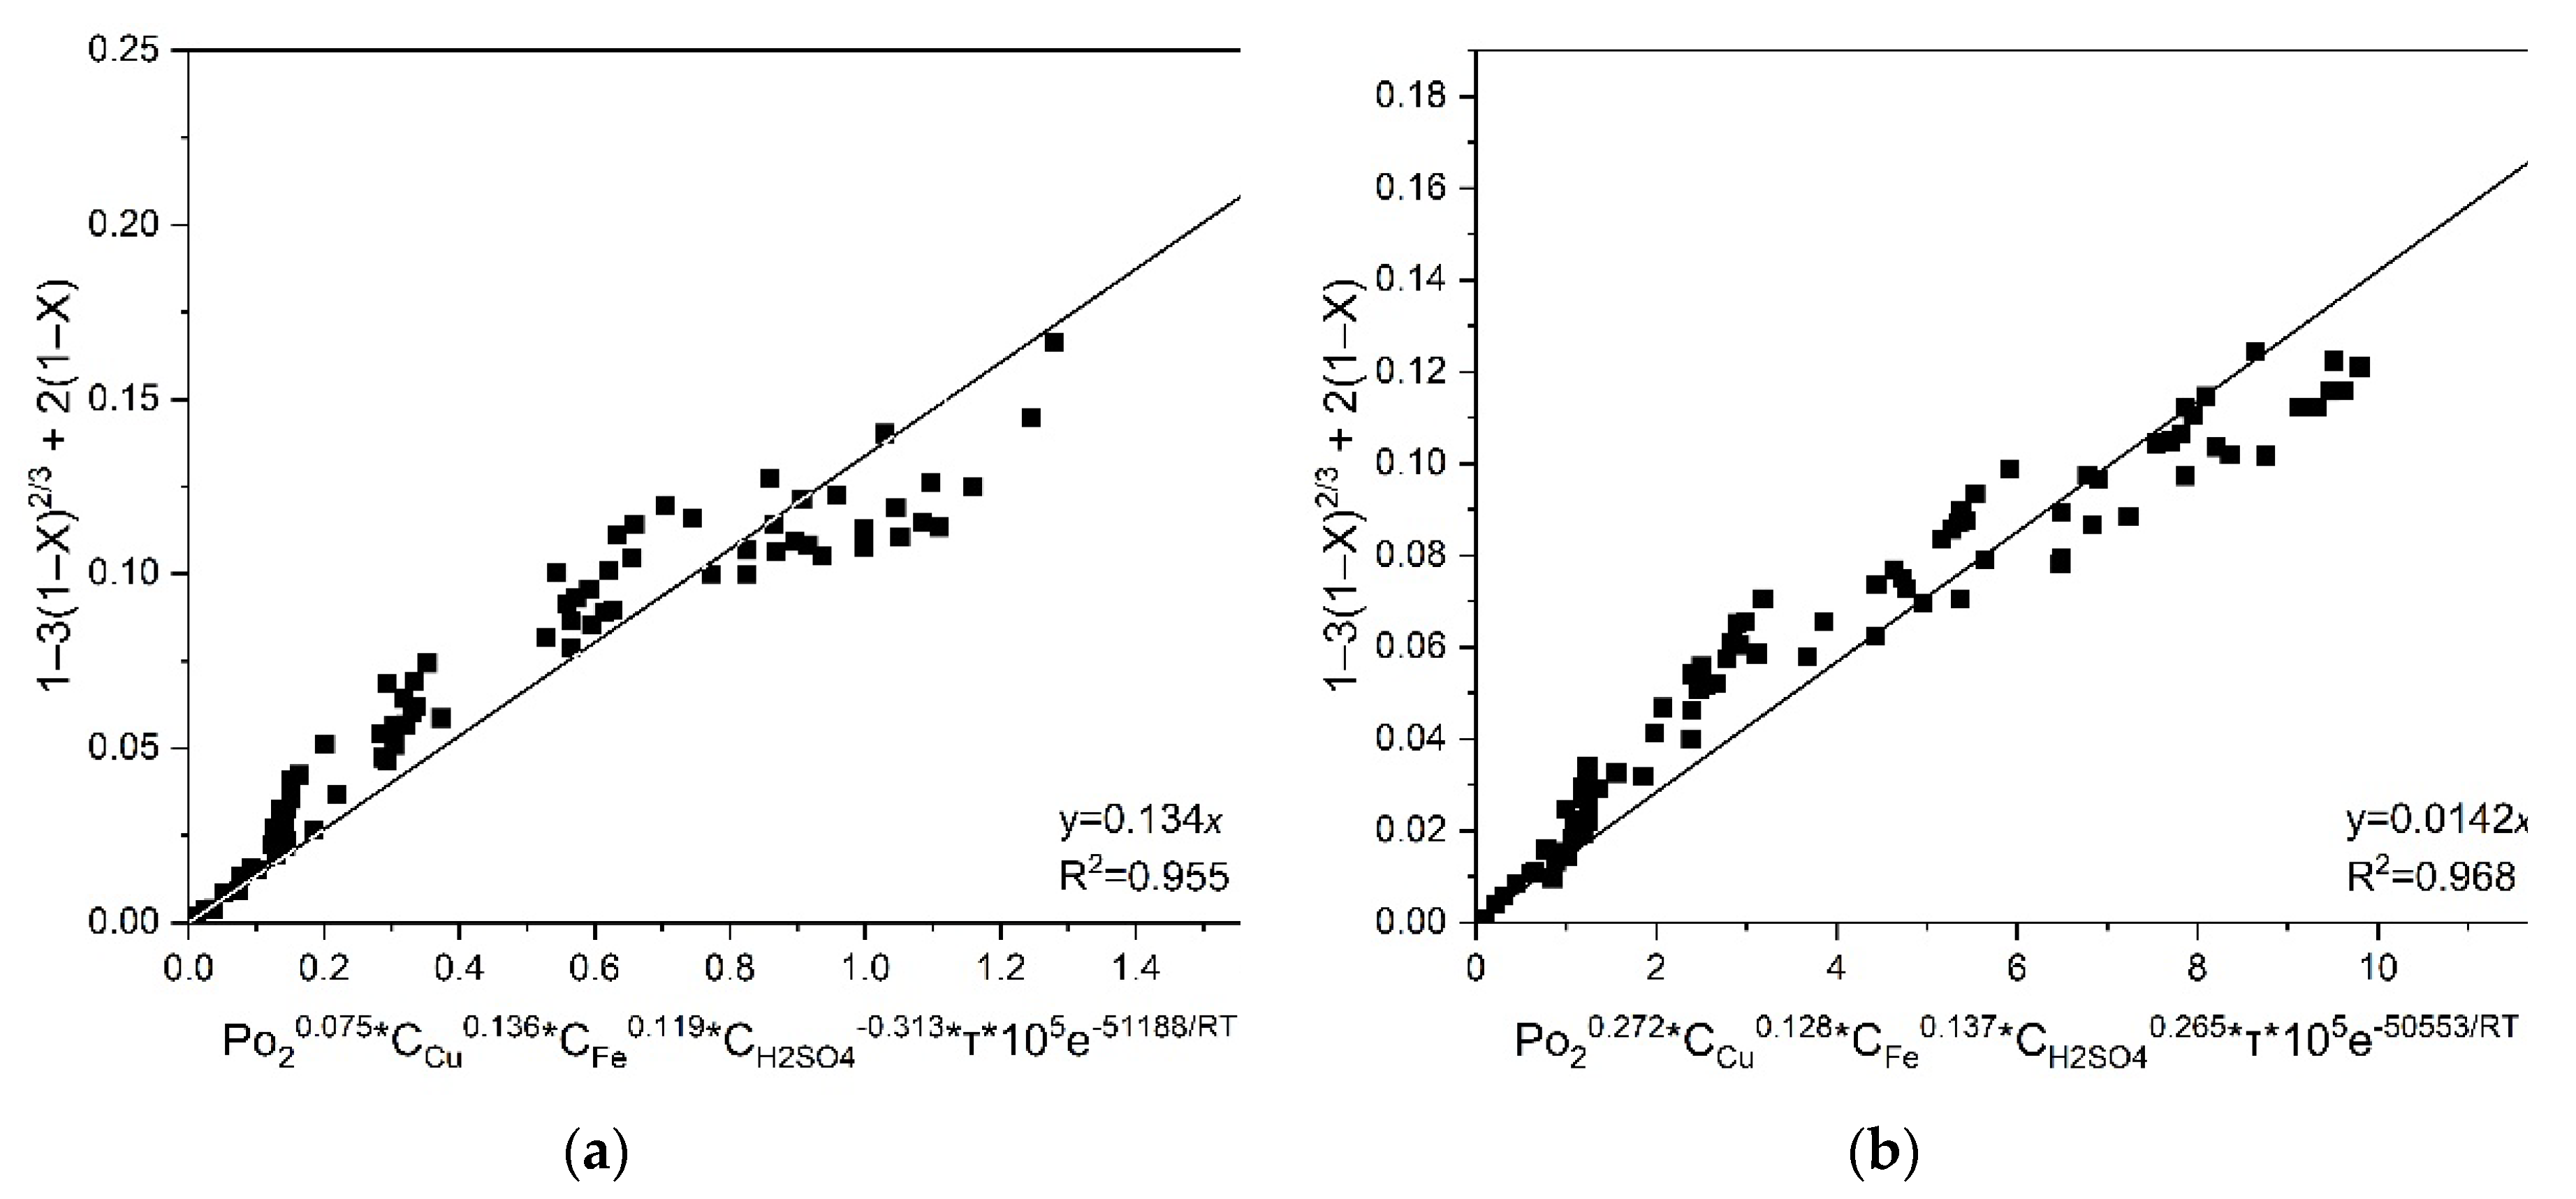
Figure 11.
Temperature dependence of the dissolution degree of chalcopyrite (a) and pyrite (b).
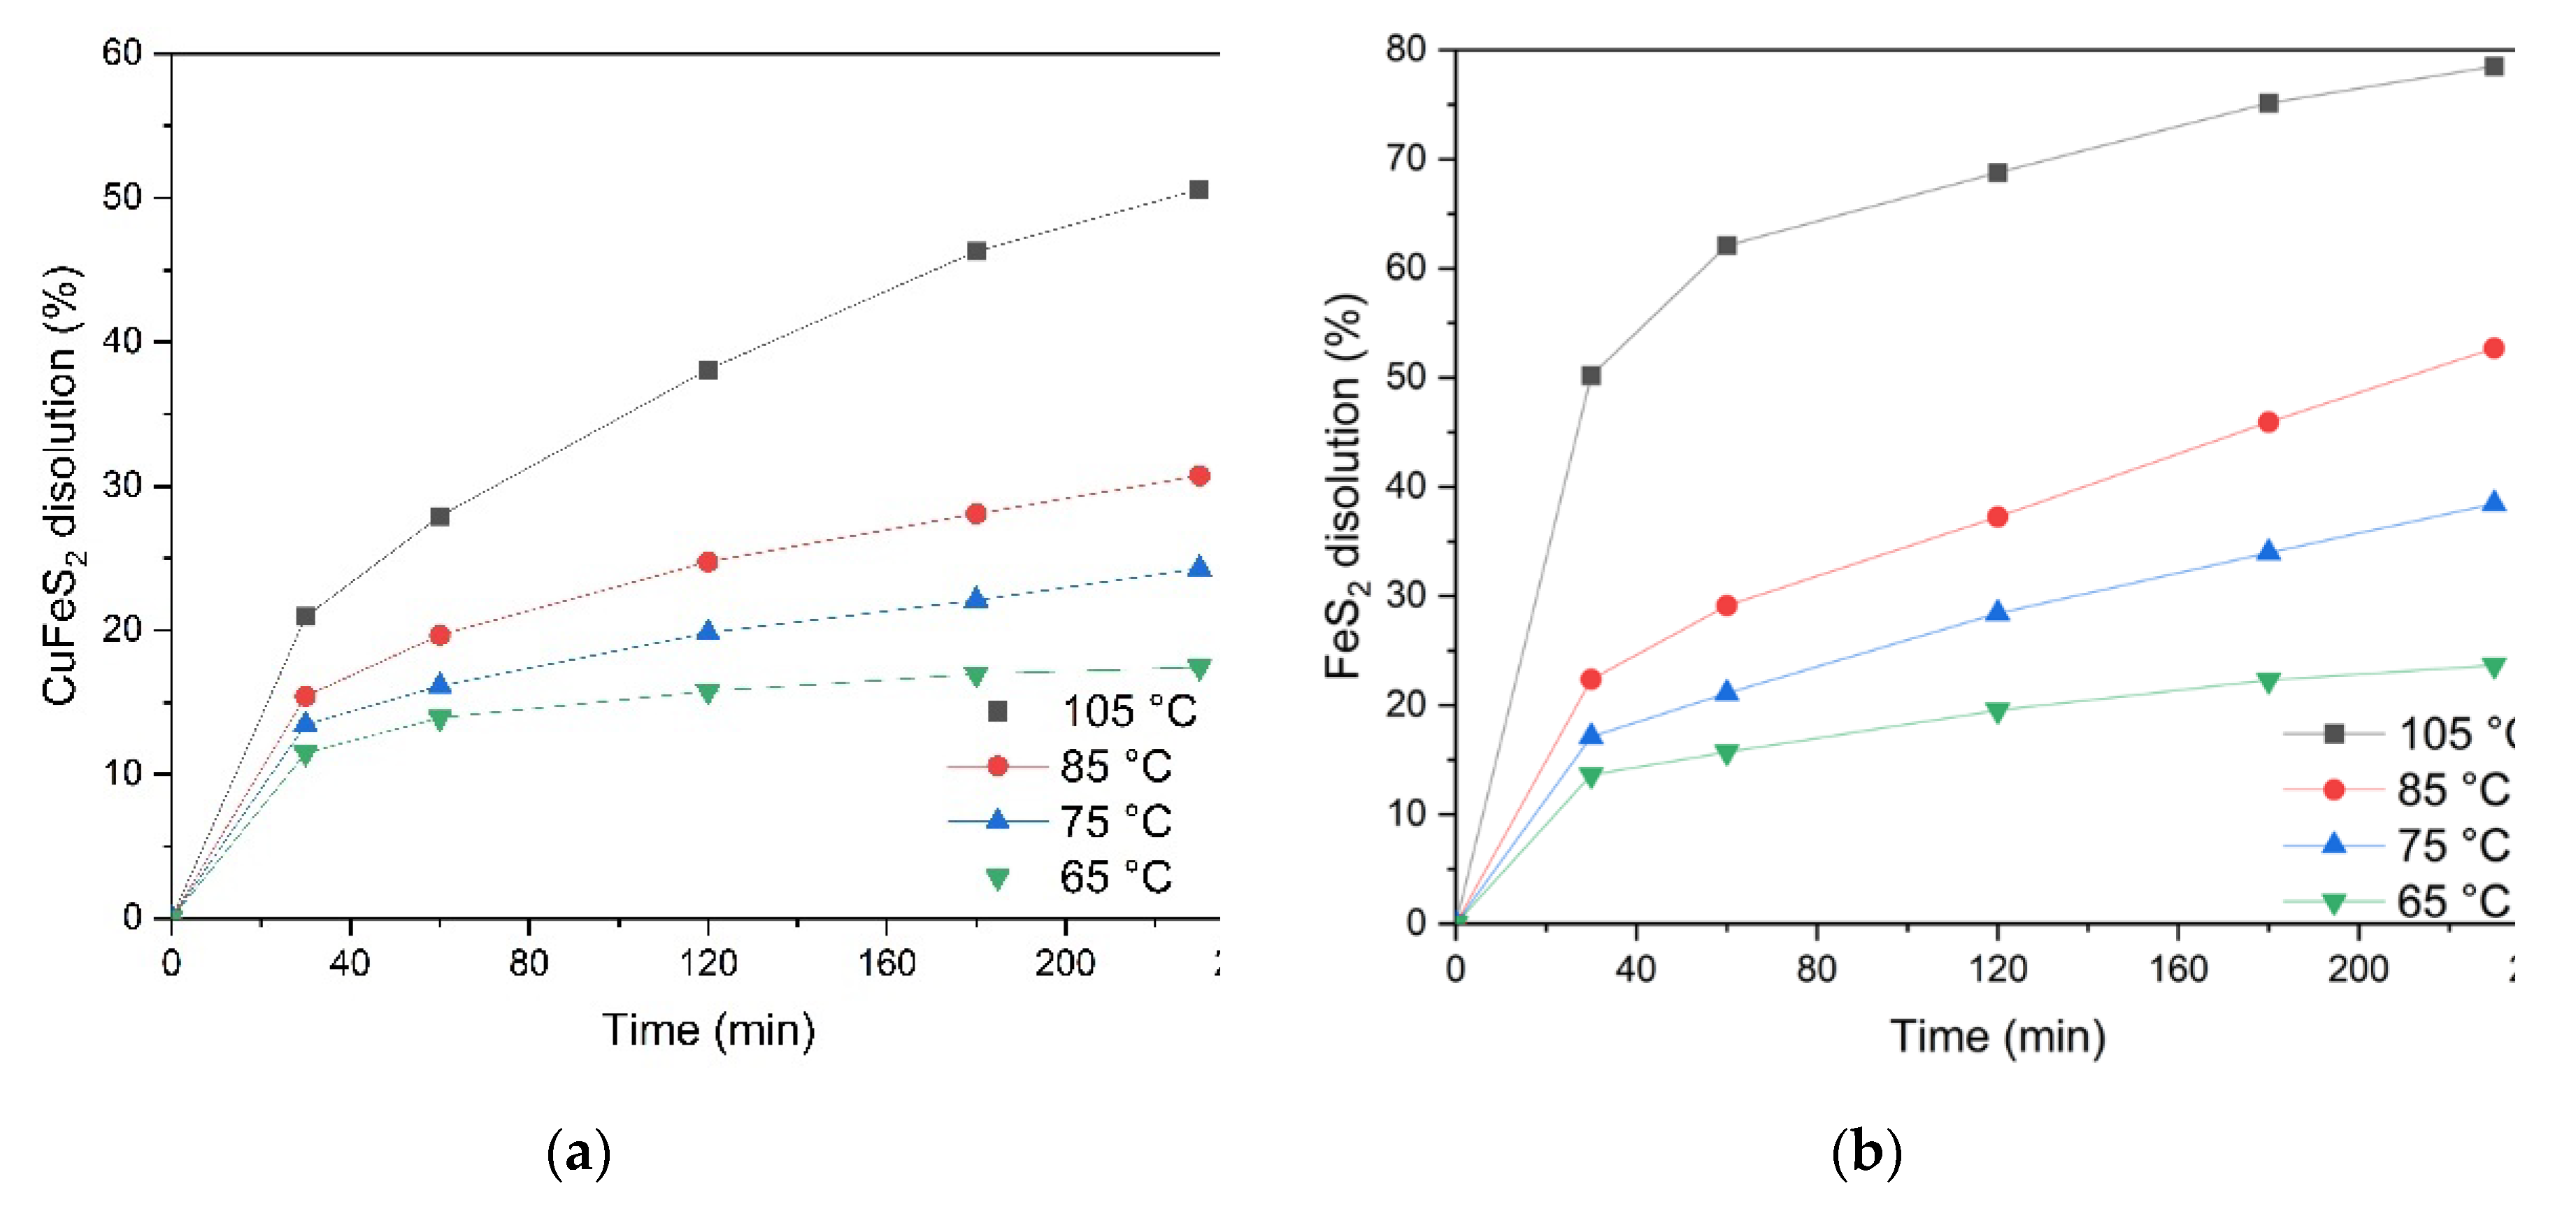
Figure 12.
Calculation of the slope kc for chalcopyrite (a) and pyrite (c) depending on temperature, graphical estimation of activation energy for chalcopyrite (b) and pyrite (d).
Figure 12.
Calculation of the slope kc for chalcopyrite (a) and pyrite (c) depending on temperature, graphical estimation of activation energy for chalcopyrite (b) and pyrite (d).
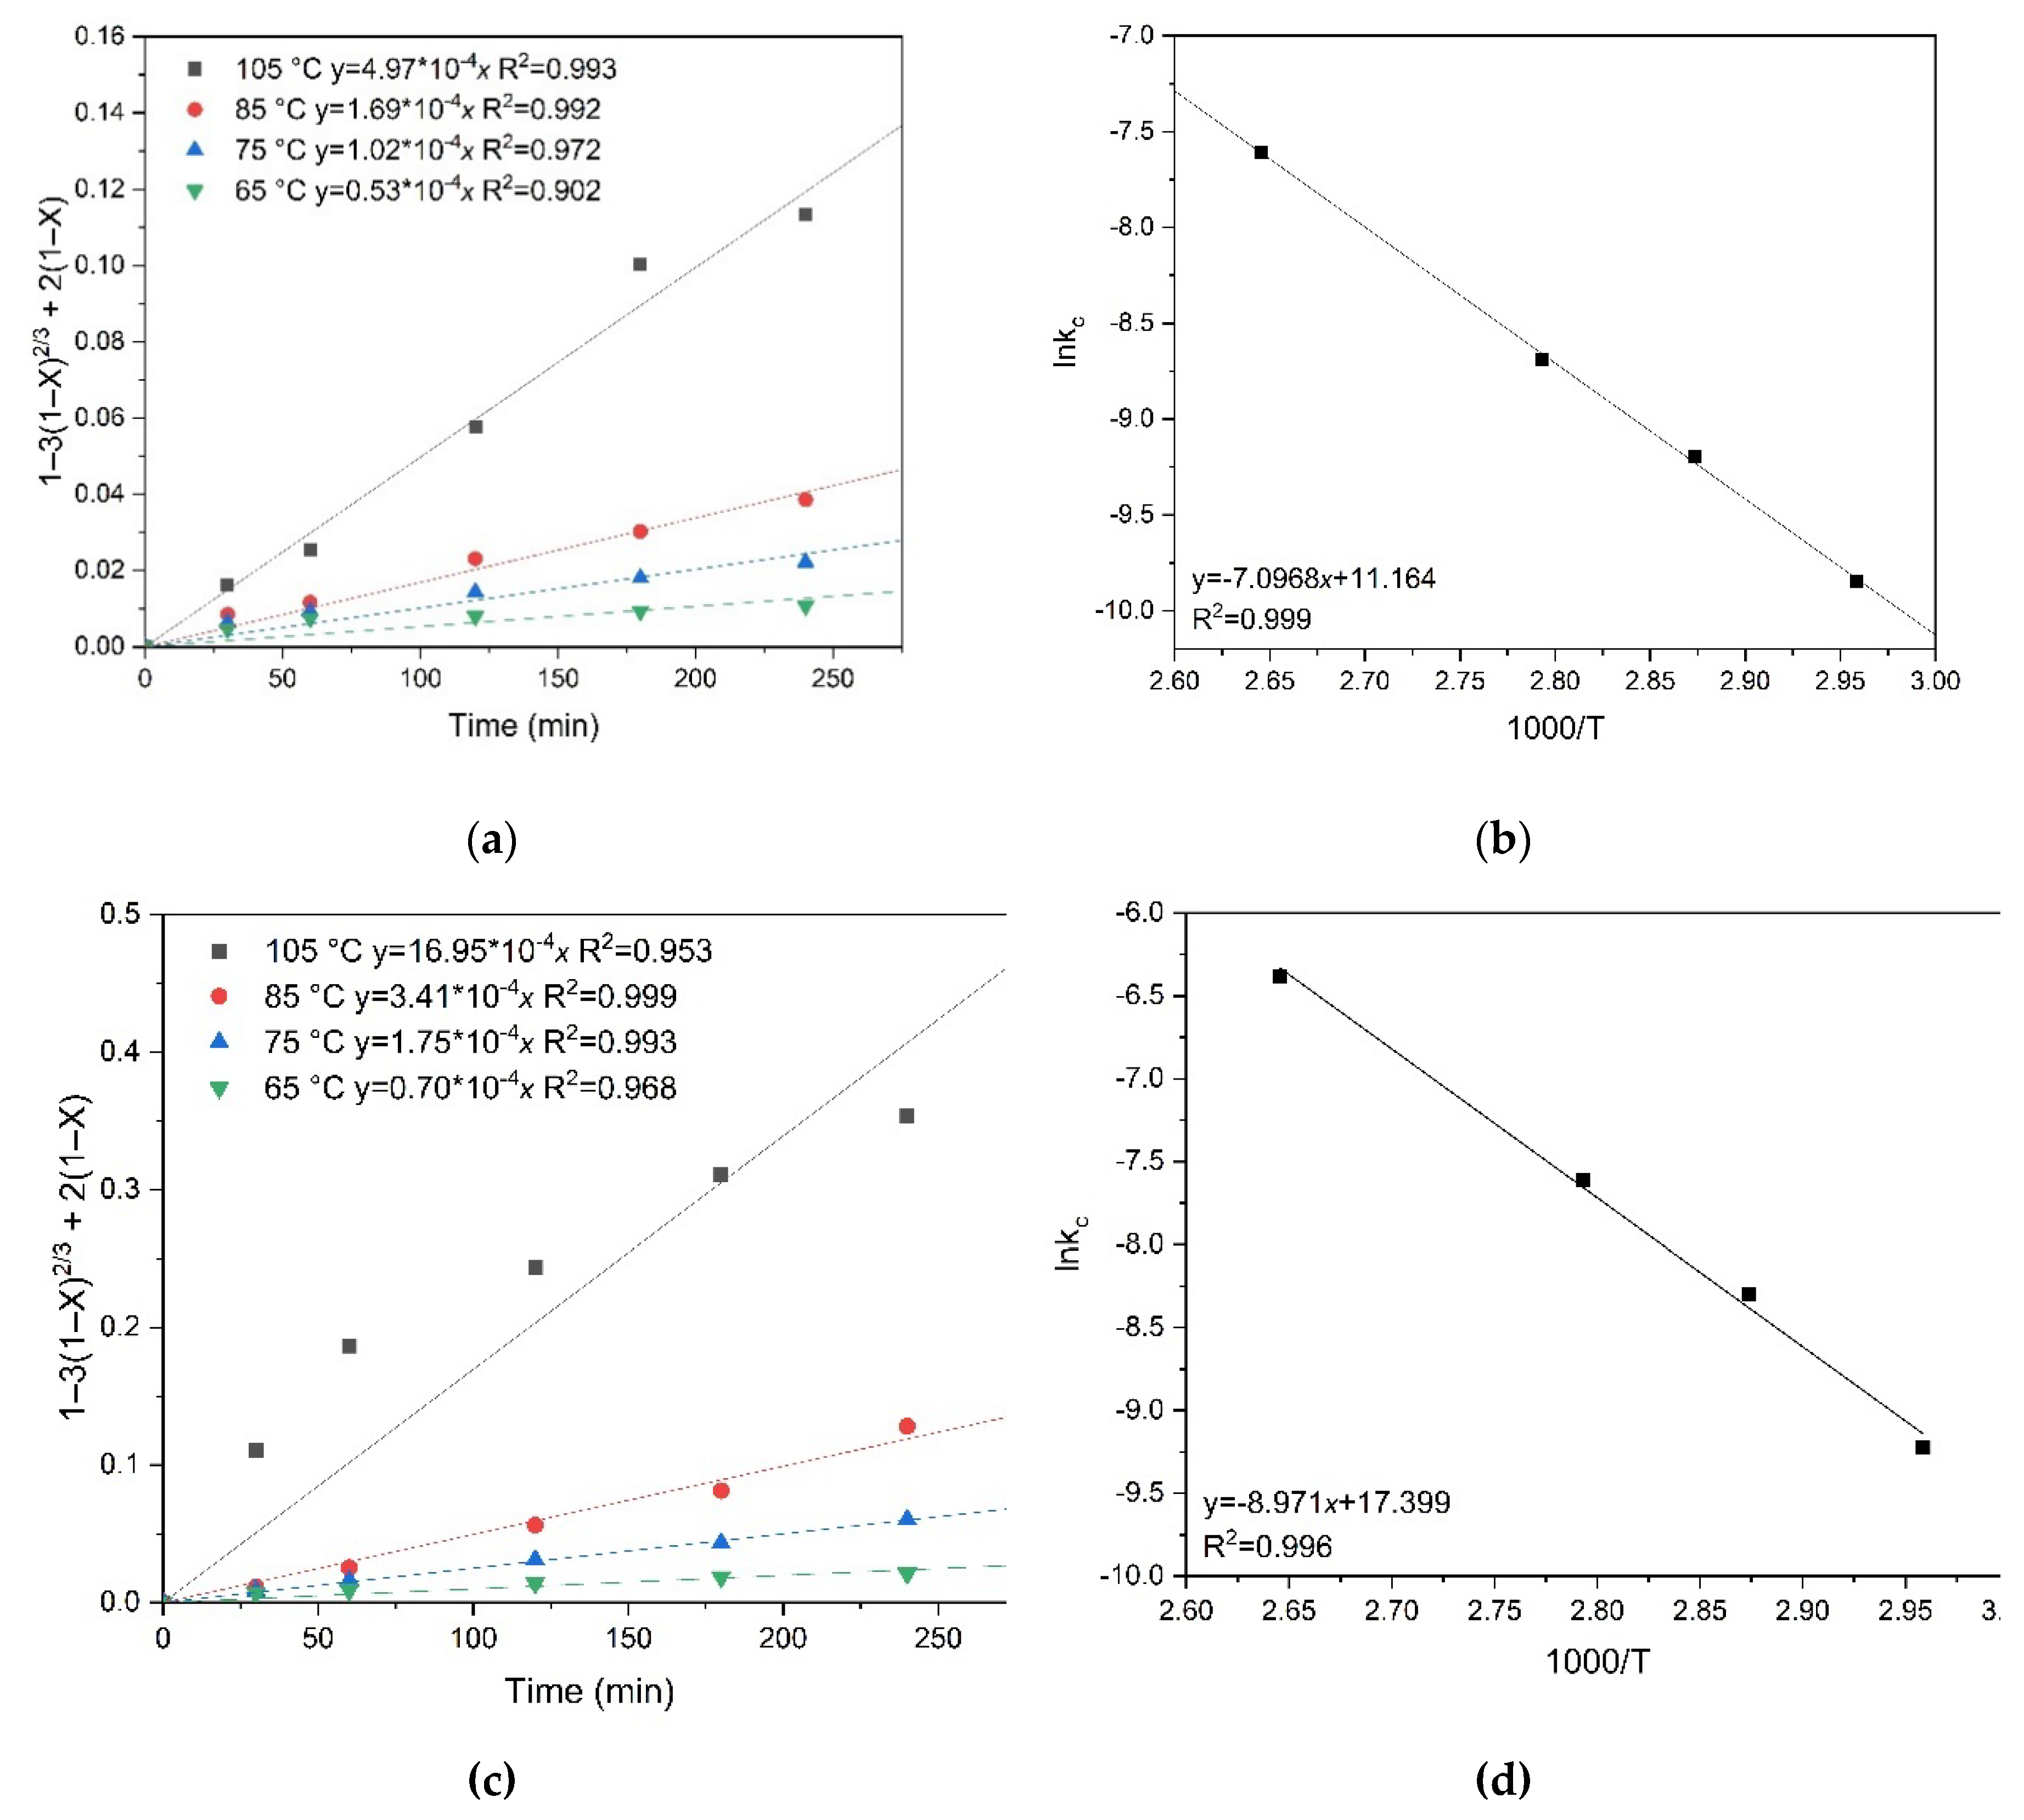
Figure 13.
Calculation of the slope kc for chalcopyrite (a) and pyrite (c) depending on the oxygen pressure, graphical estimation of the empirical partial order for oxygen pressure for chalcopyrite (b) and pyrite (d).
Figure 13.
Calculation of the slope kc for chalcopyrite (a) and pyrite (c) depending on the oxygen pressure, graphical estimation of the empirical partial order for oxygen pressure for chalcopyrite (b) and pyrite (d).
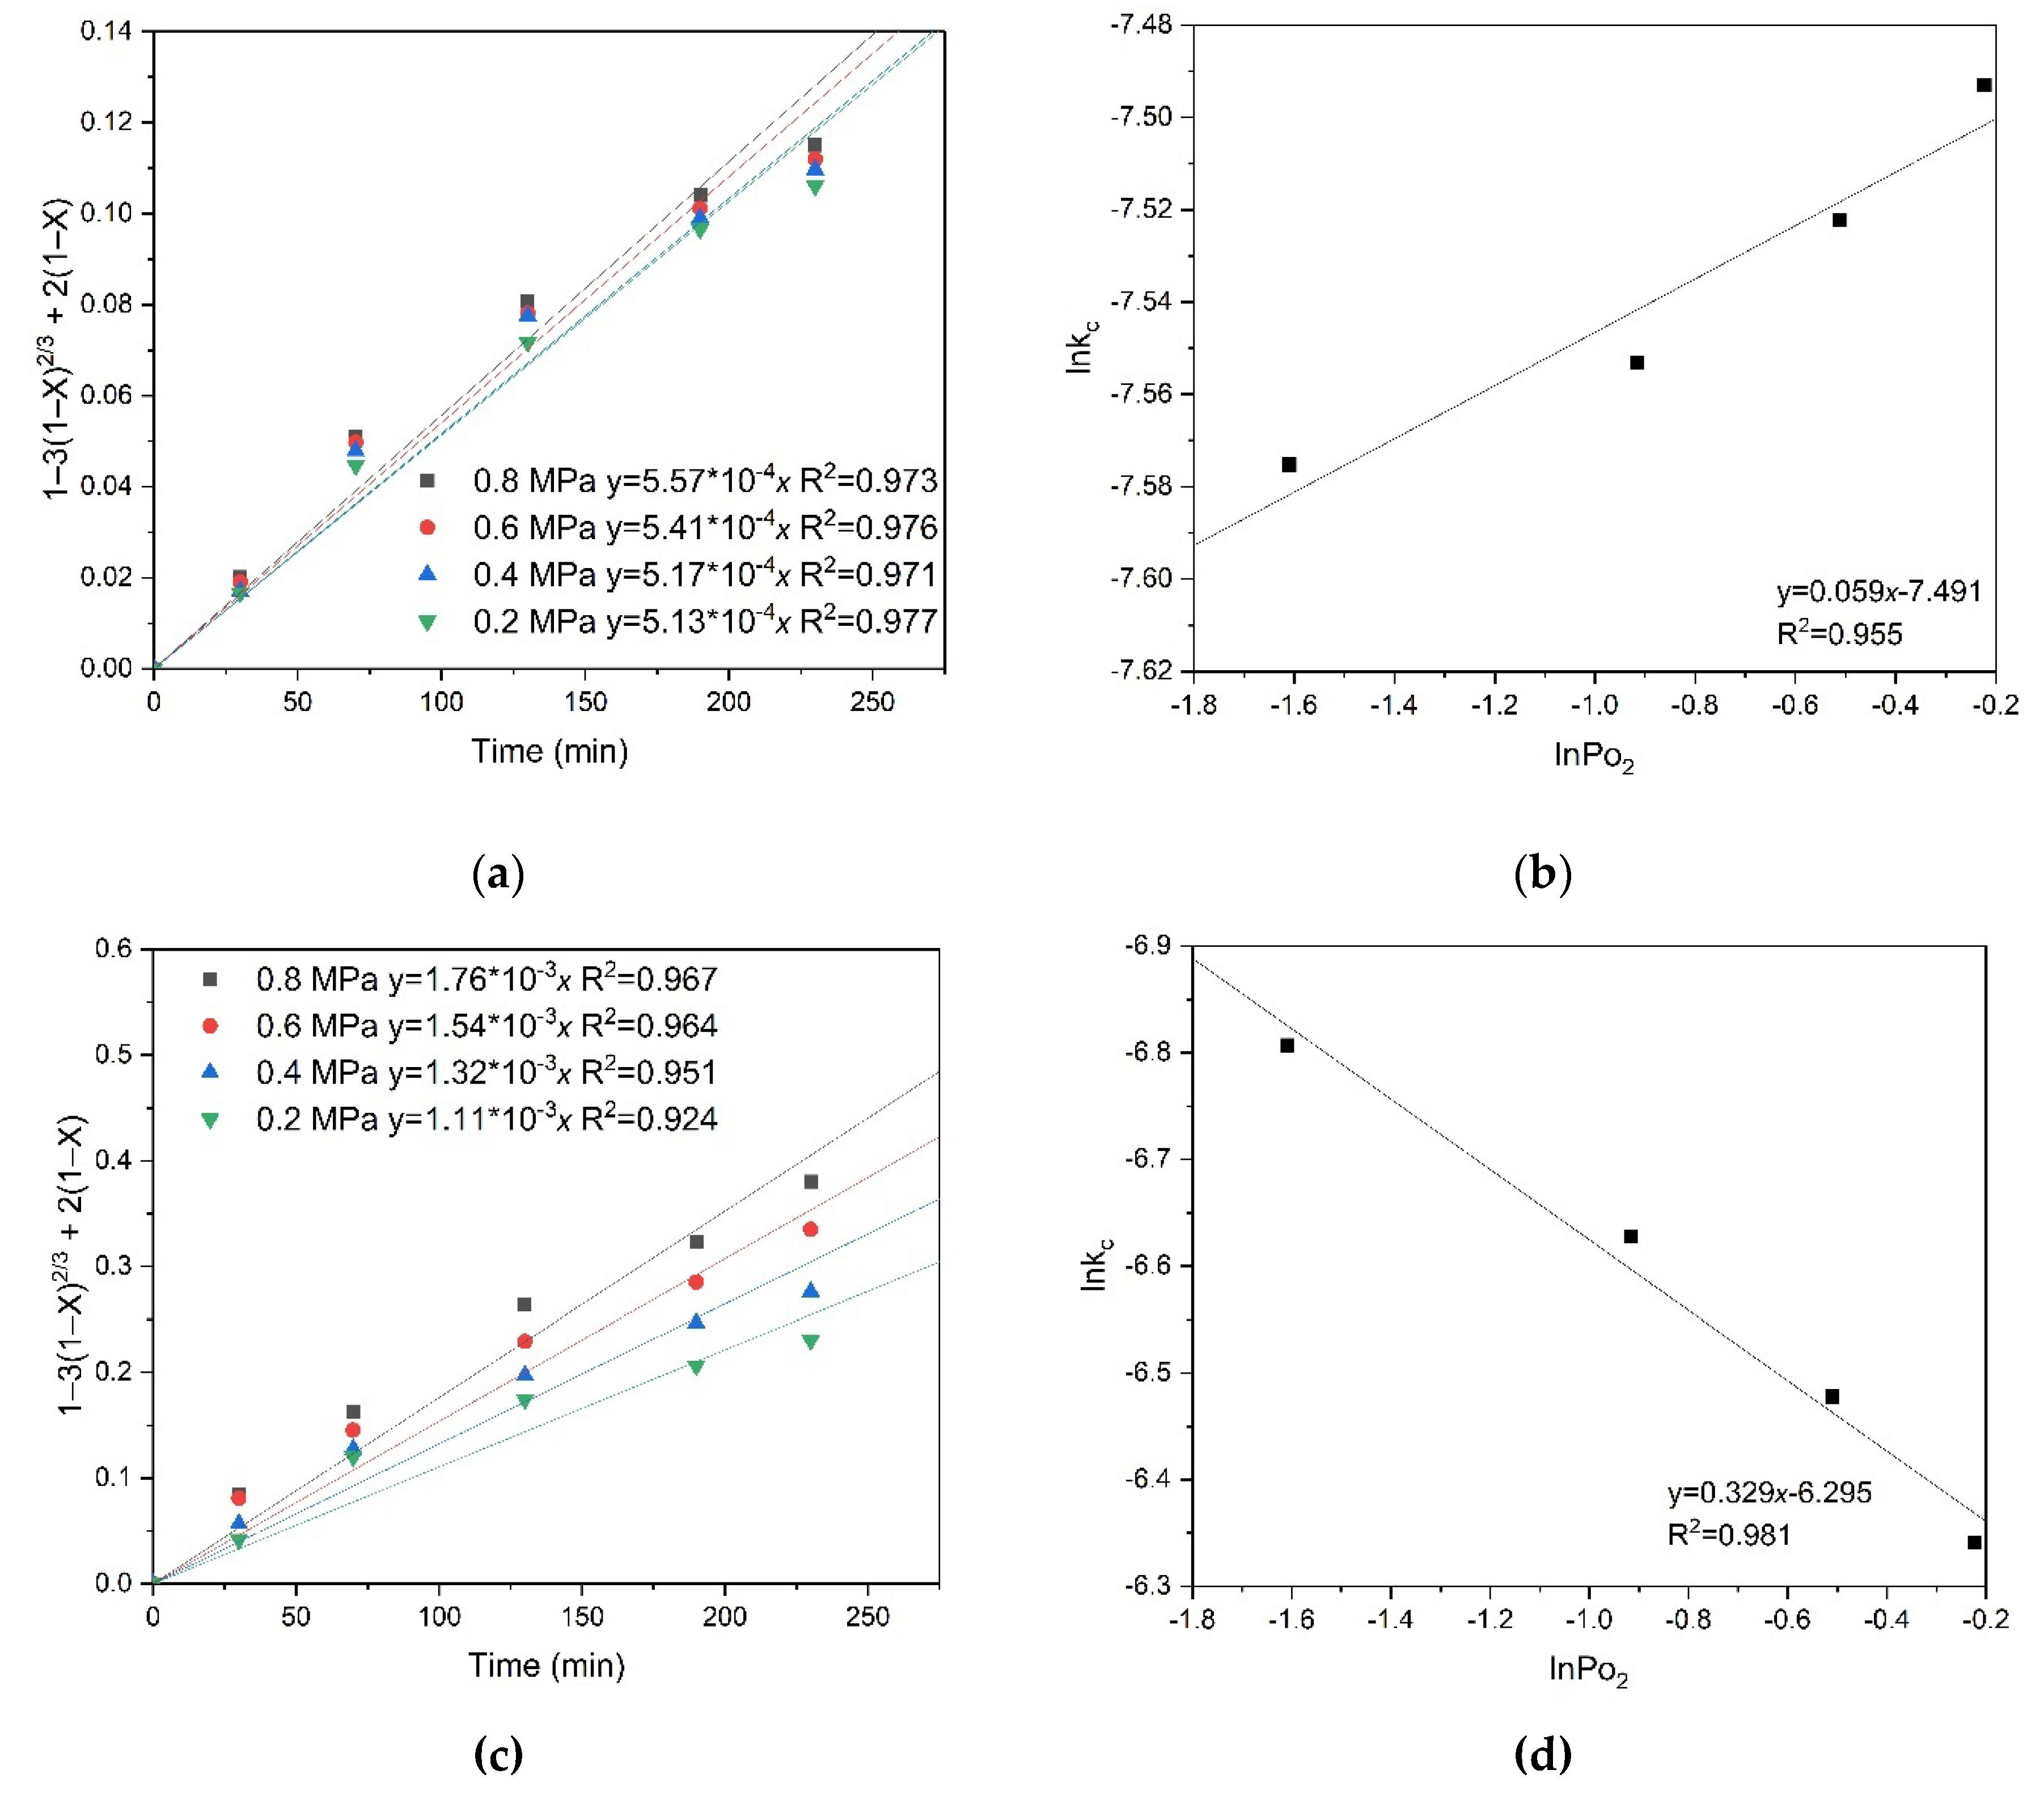
Figure 14.
Graph to estimate k0 for chalcopyrite (a) and pyrite (b).
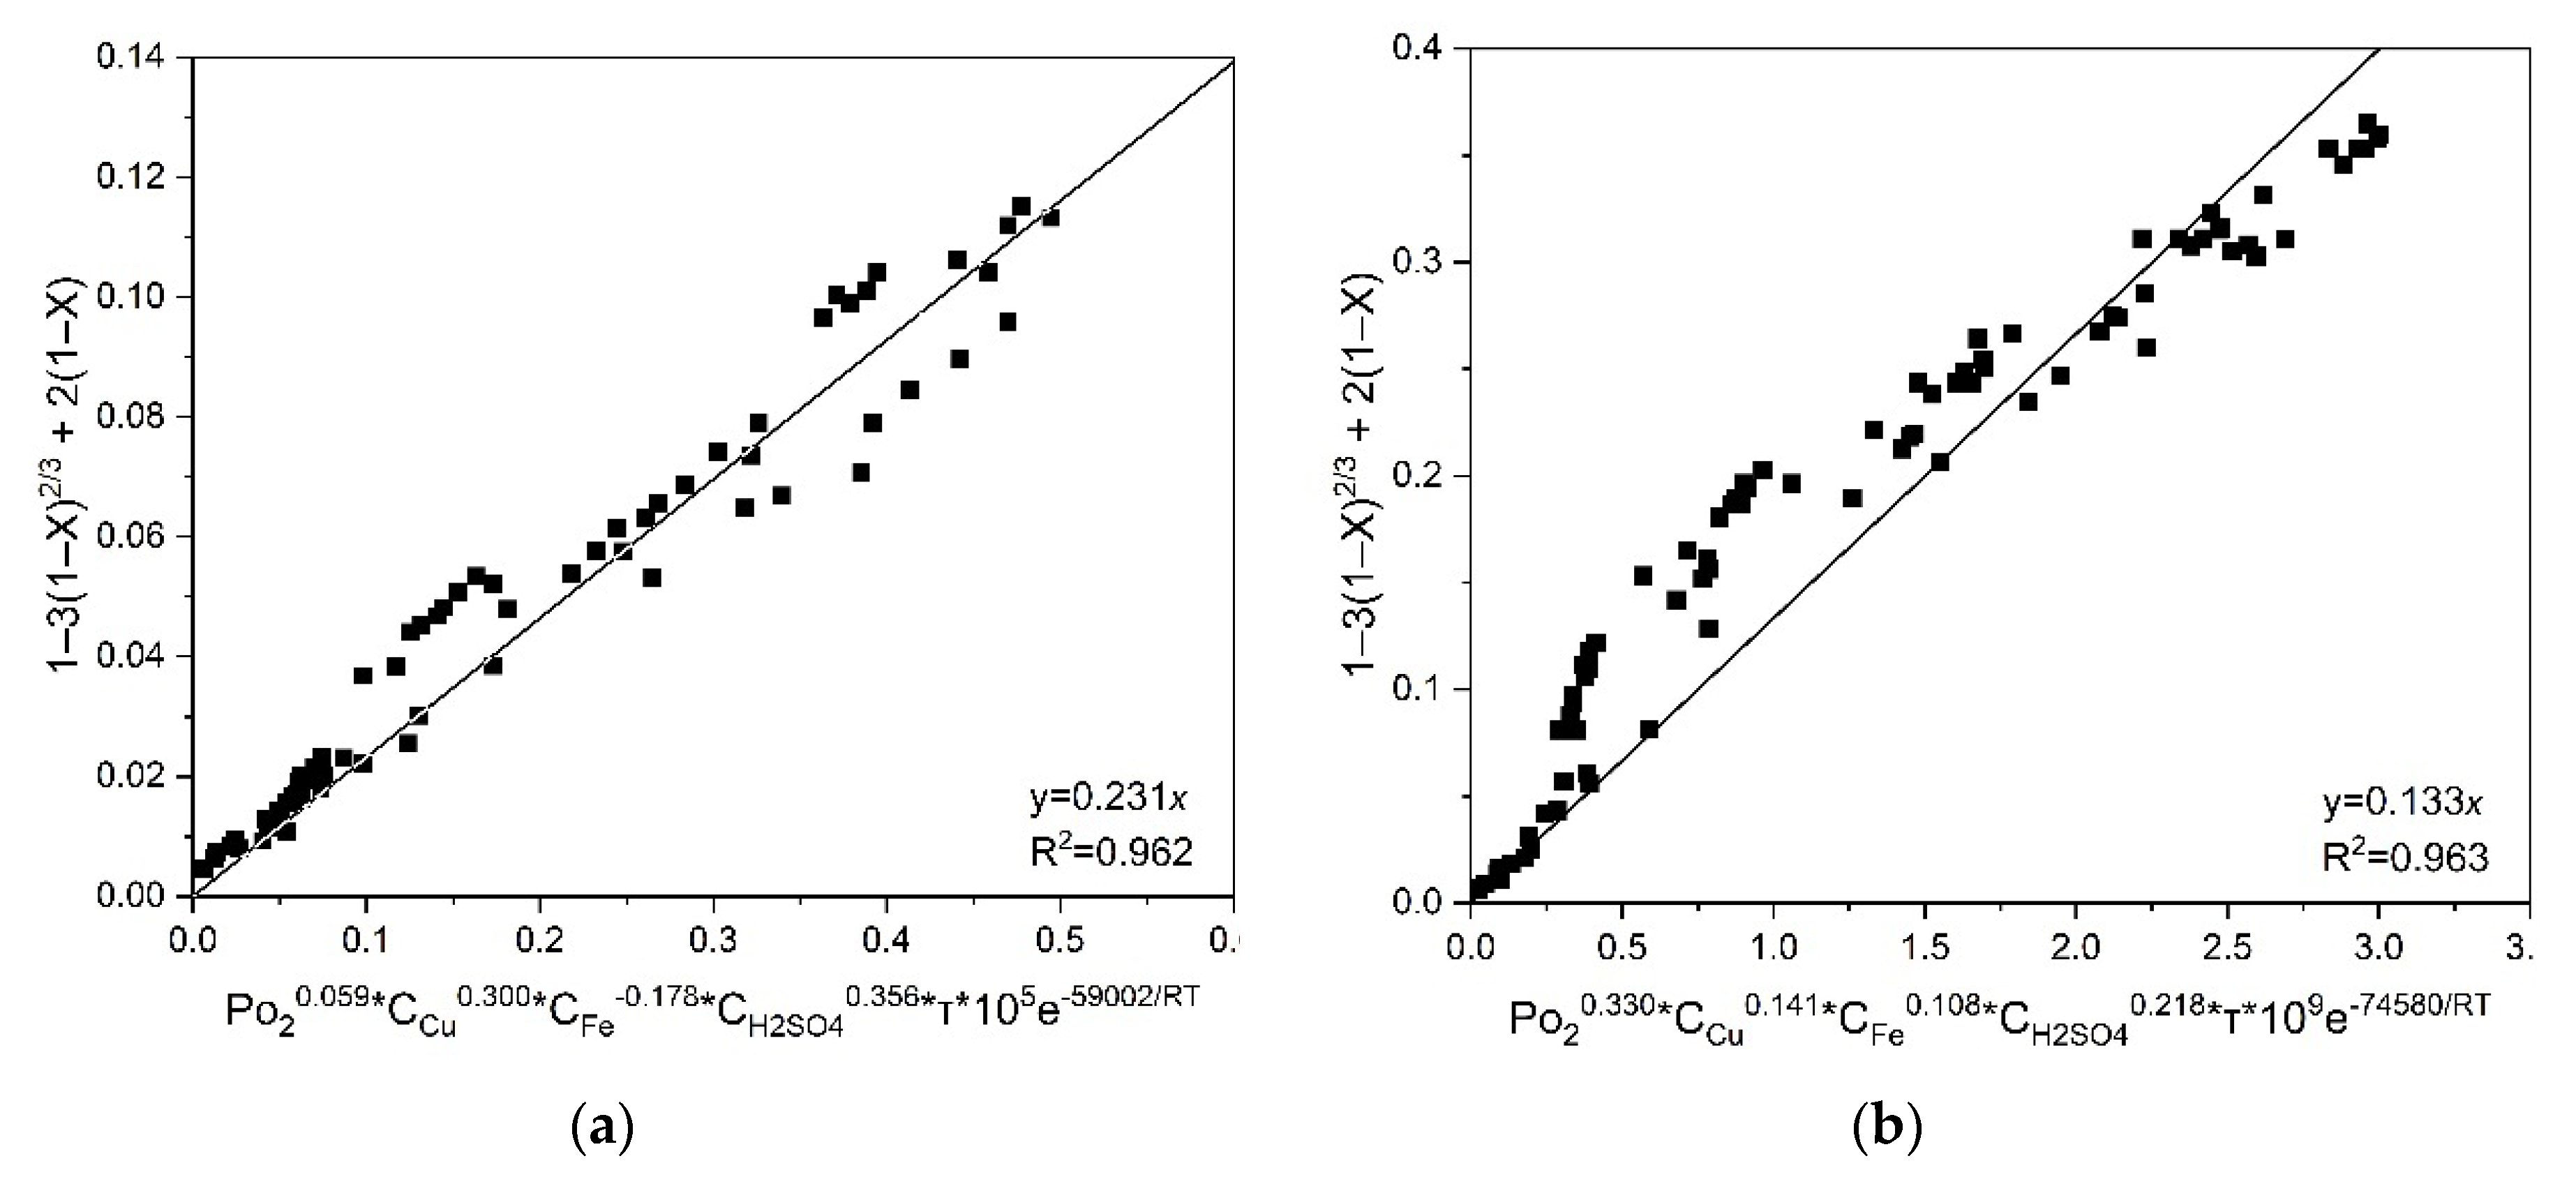
Figure 15.
X-ray diffraction pattern of the cakes from low-temperature pressure oxidation of pyrite, chalcopyrite and their mixture in a ratio of 1:1 (t = 100°C, PO2 = 0.8 MPa, [H2SO4] = 50 g/L, [Cu2+] = 3 g/L, [Fe3+] = 10 g/L, and duration 230 min).
Figure 15.
X-ray diffraction pattern of the cakes from low-temperature pressure oxidation of pyrite, chalcopyrite and their mixture in a ratio of 1:1 (t = 100°C, PO2 = 0.8 MPa, [H2SO4] = 50 g/L, [Cu2+] = 3 g/L, [Fe3+] = 10 g/L, and duration 230 min).
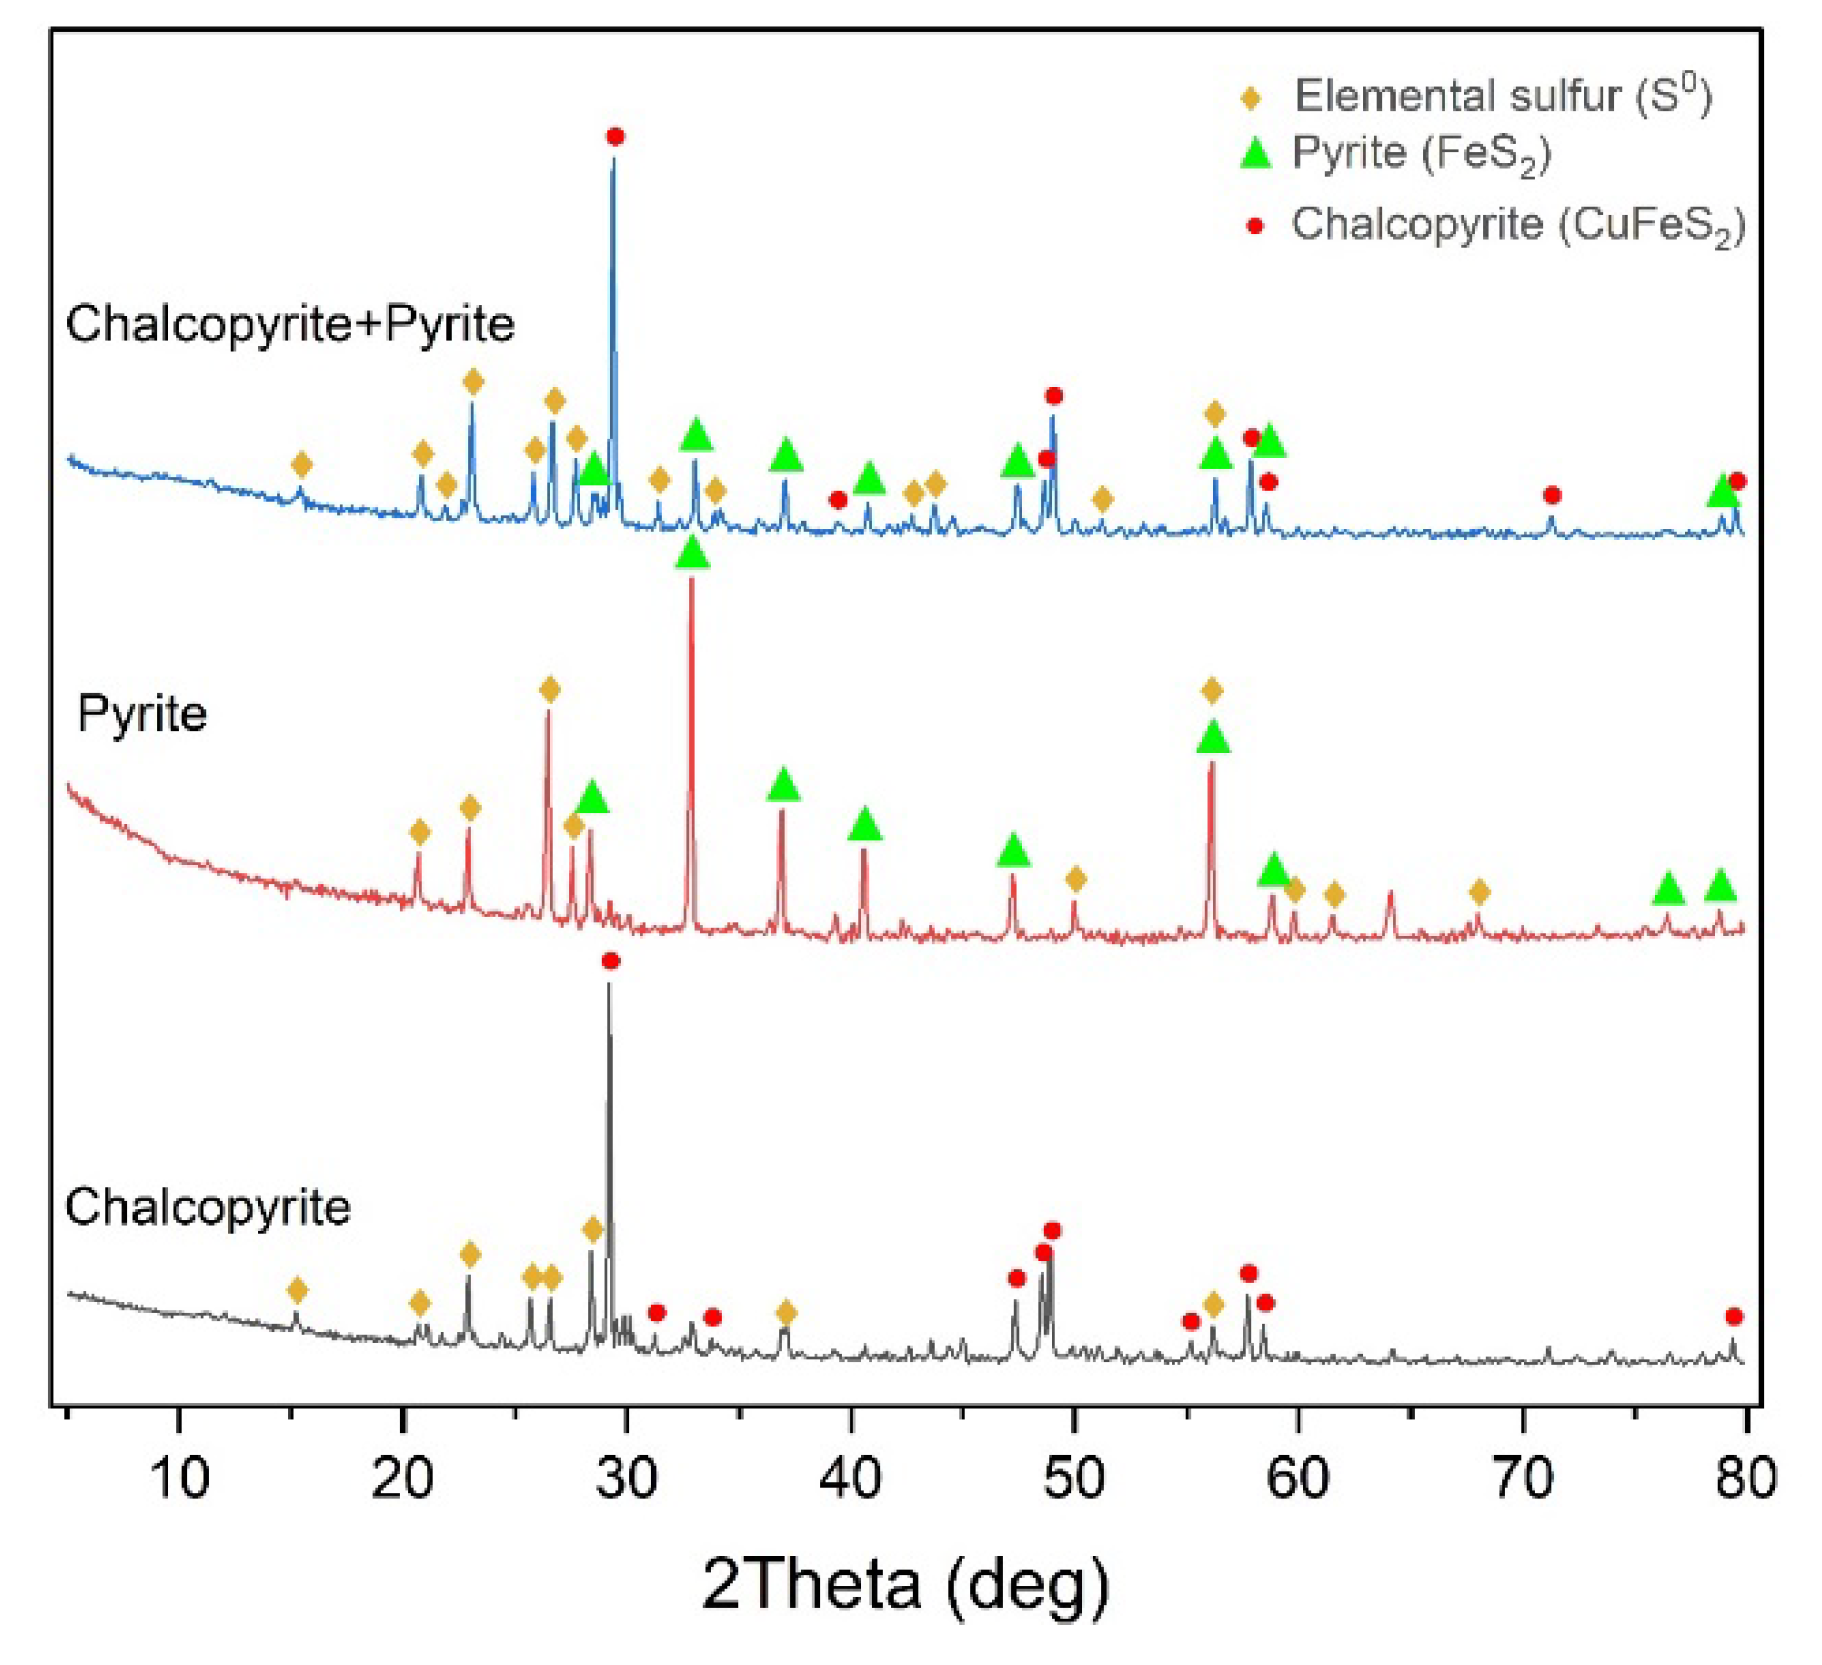
Figure 16.
SEM images of oxidation cake particles (a,b,c) and combined EDS mapping (d,e,f) for sulfur (g,h,i), iron (j,k,l) and copper (m,n).
Figure 16.
SEM images of oxidation cake particles (a,b,c) and combined EDS mapping (d,e,f) for sulfur (g,h,i), iron (j,k,l) and copper (m,n).
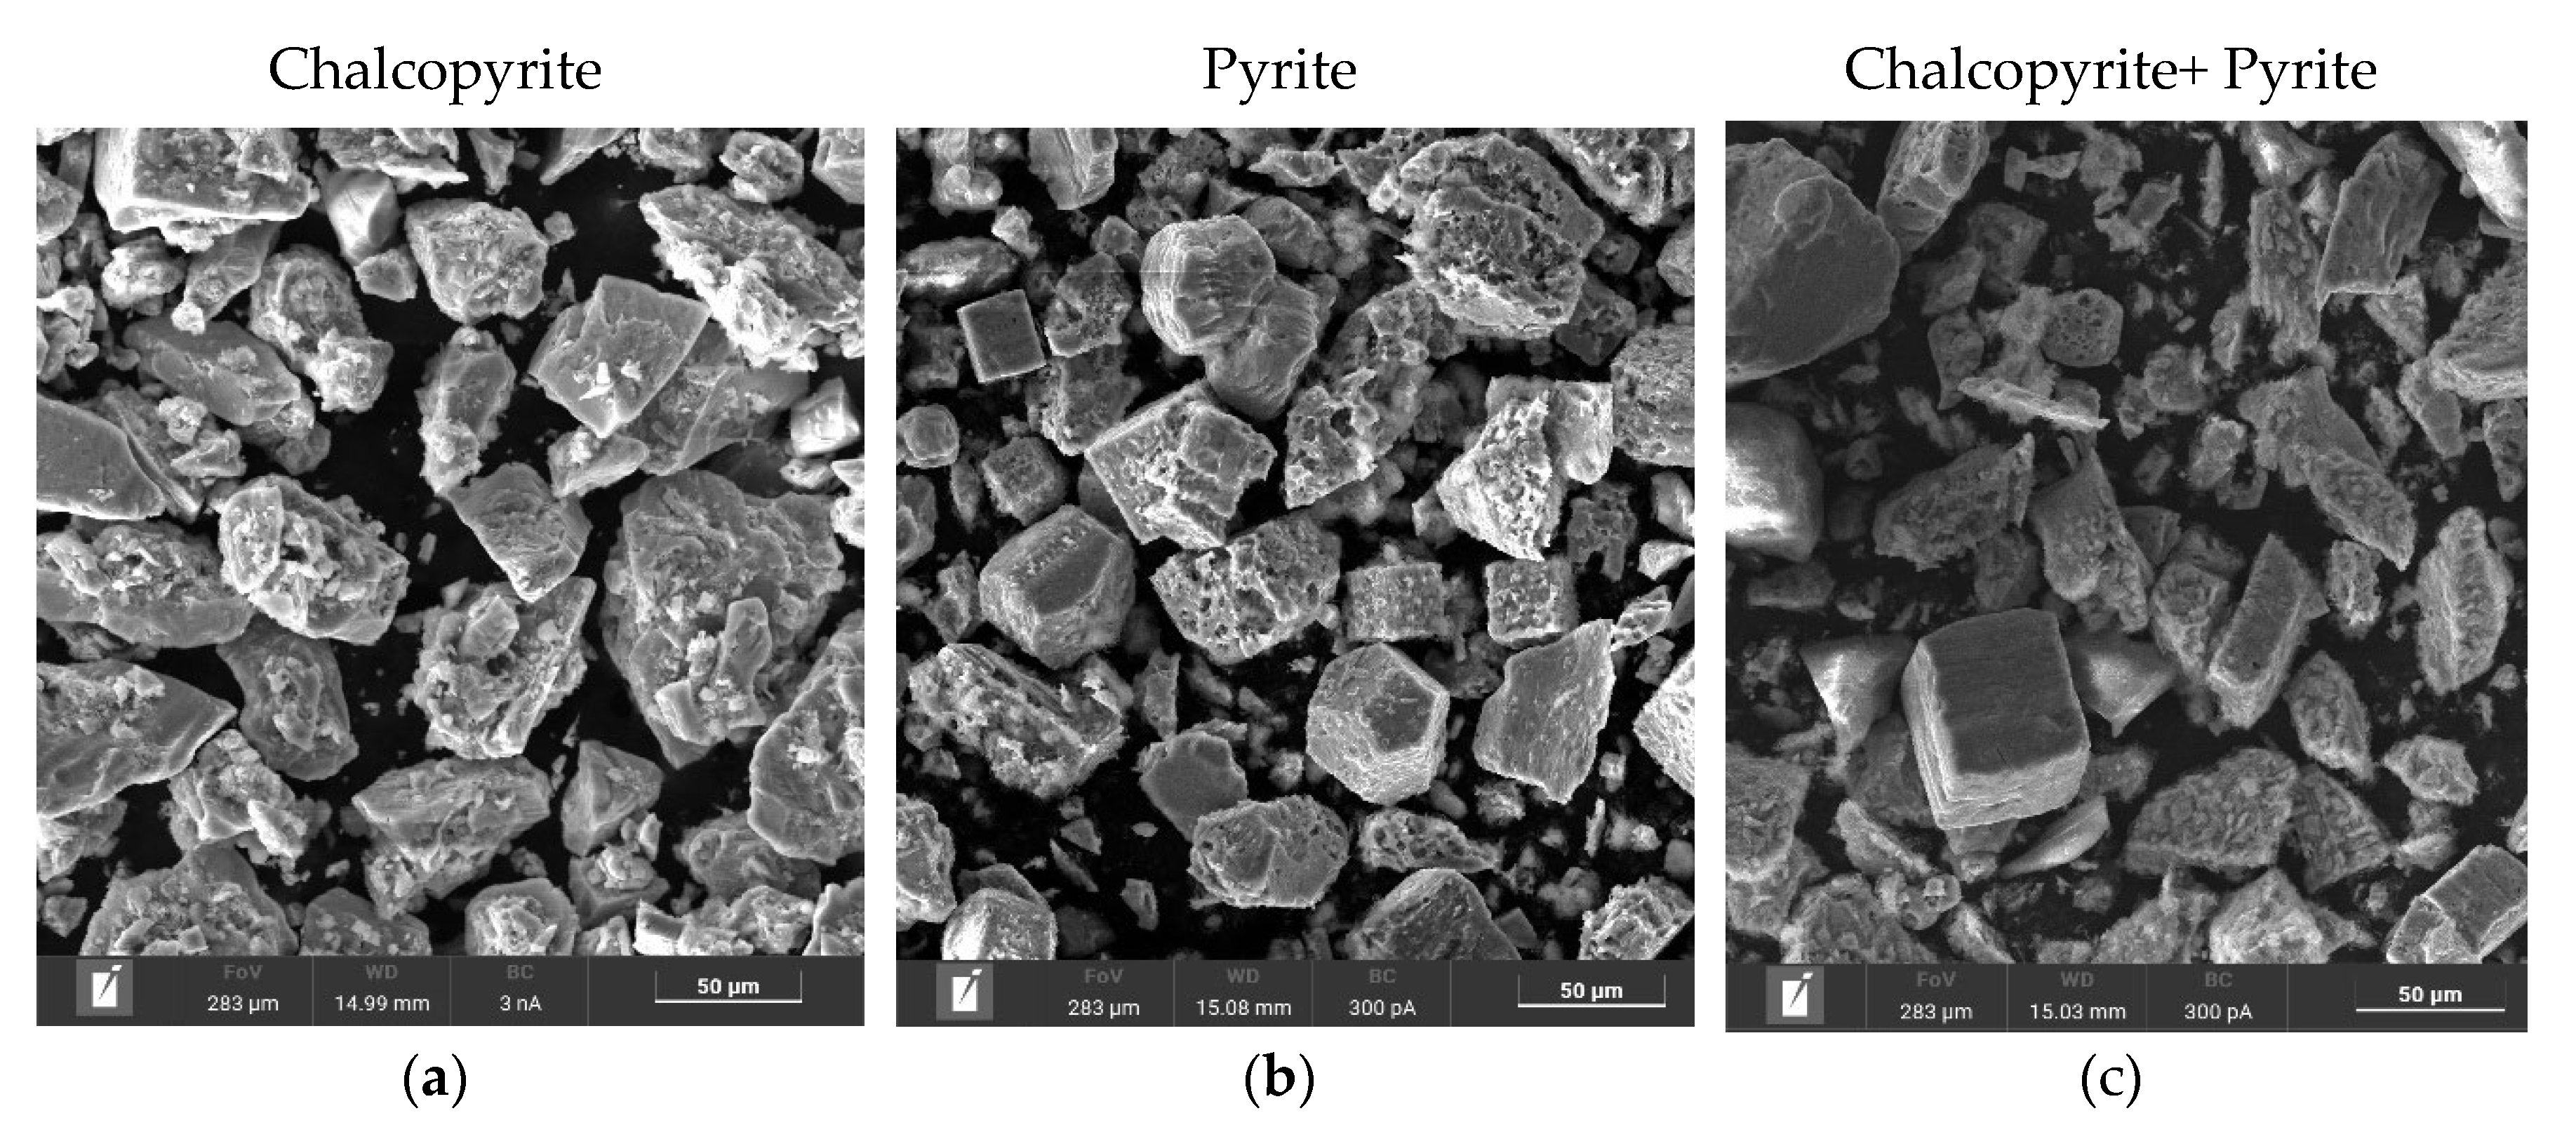
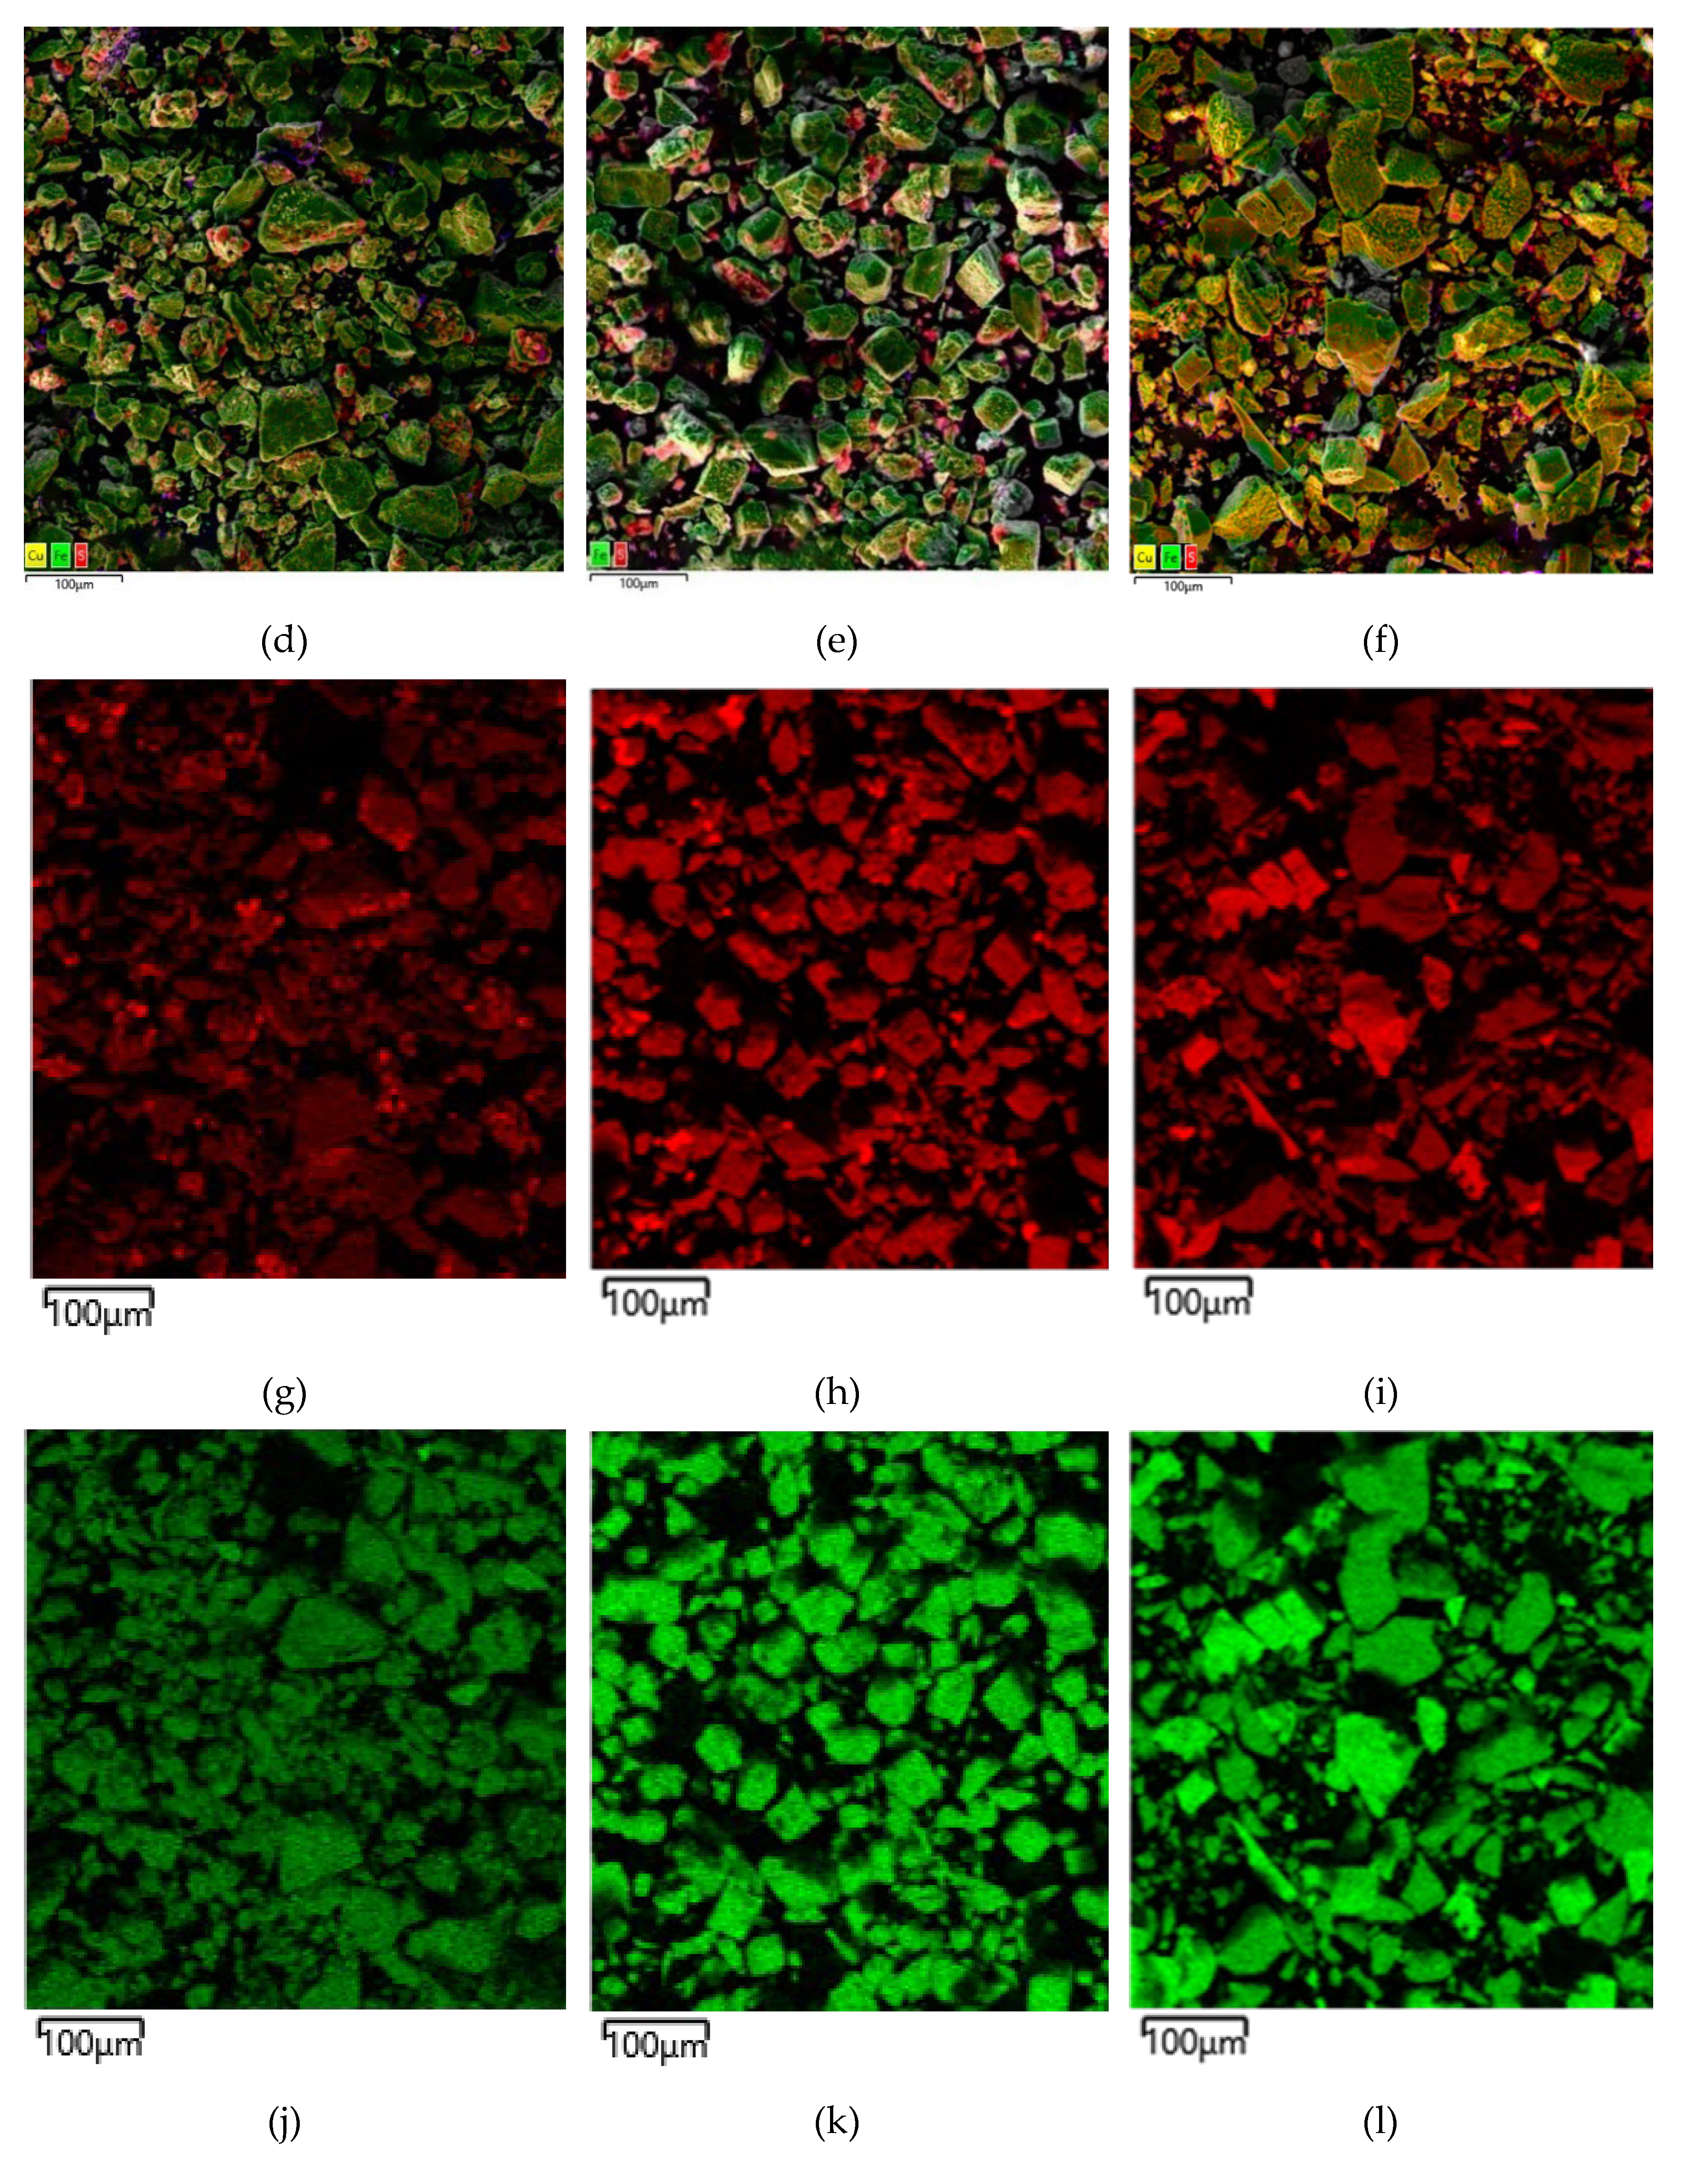
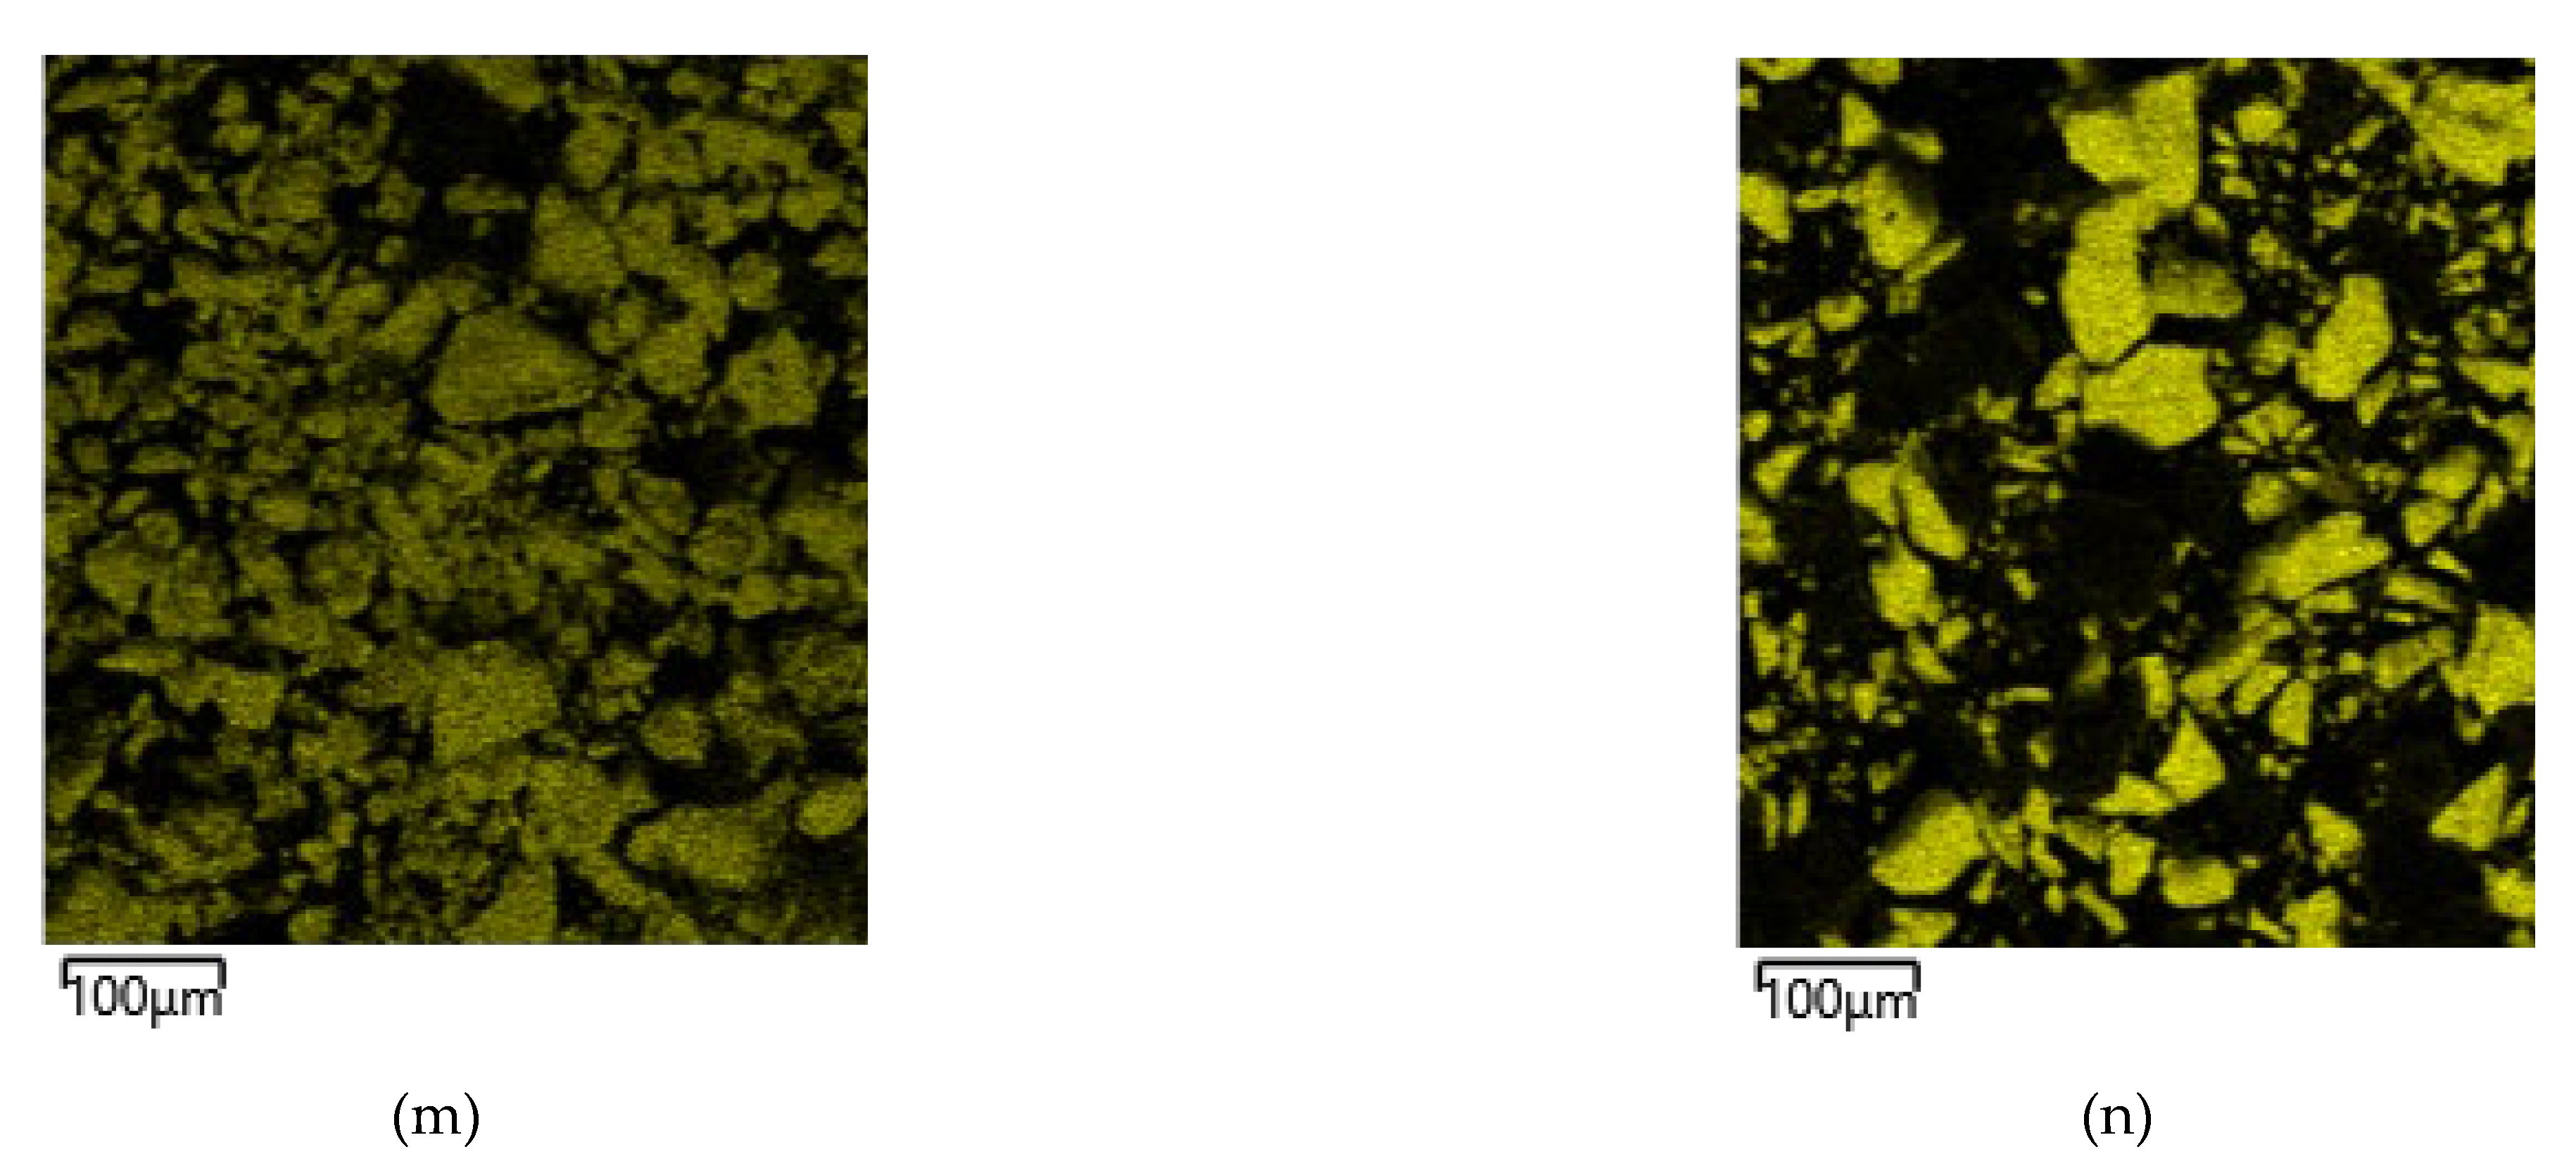
Figure 17.
Micrographs of the cakes after low-temperature pressure oxidation of chalcopyrite, pyrite and their mixture with composition determination points.
Figure 17.
Micrographs of the cakes after low-temperature pressure oxidation of chalcopyrite, pyrite and their mixture with composition determination points.
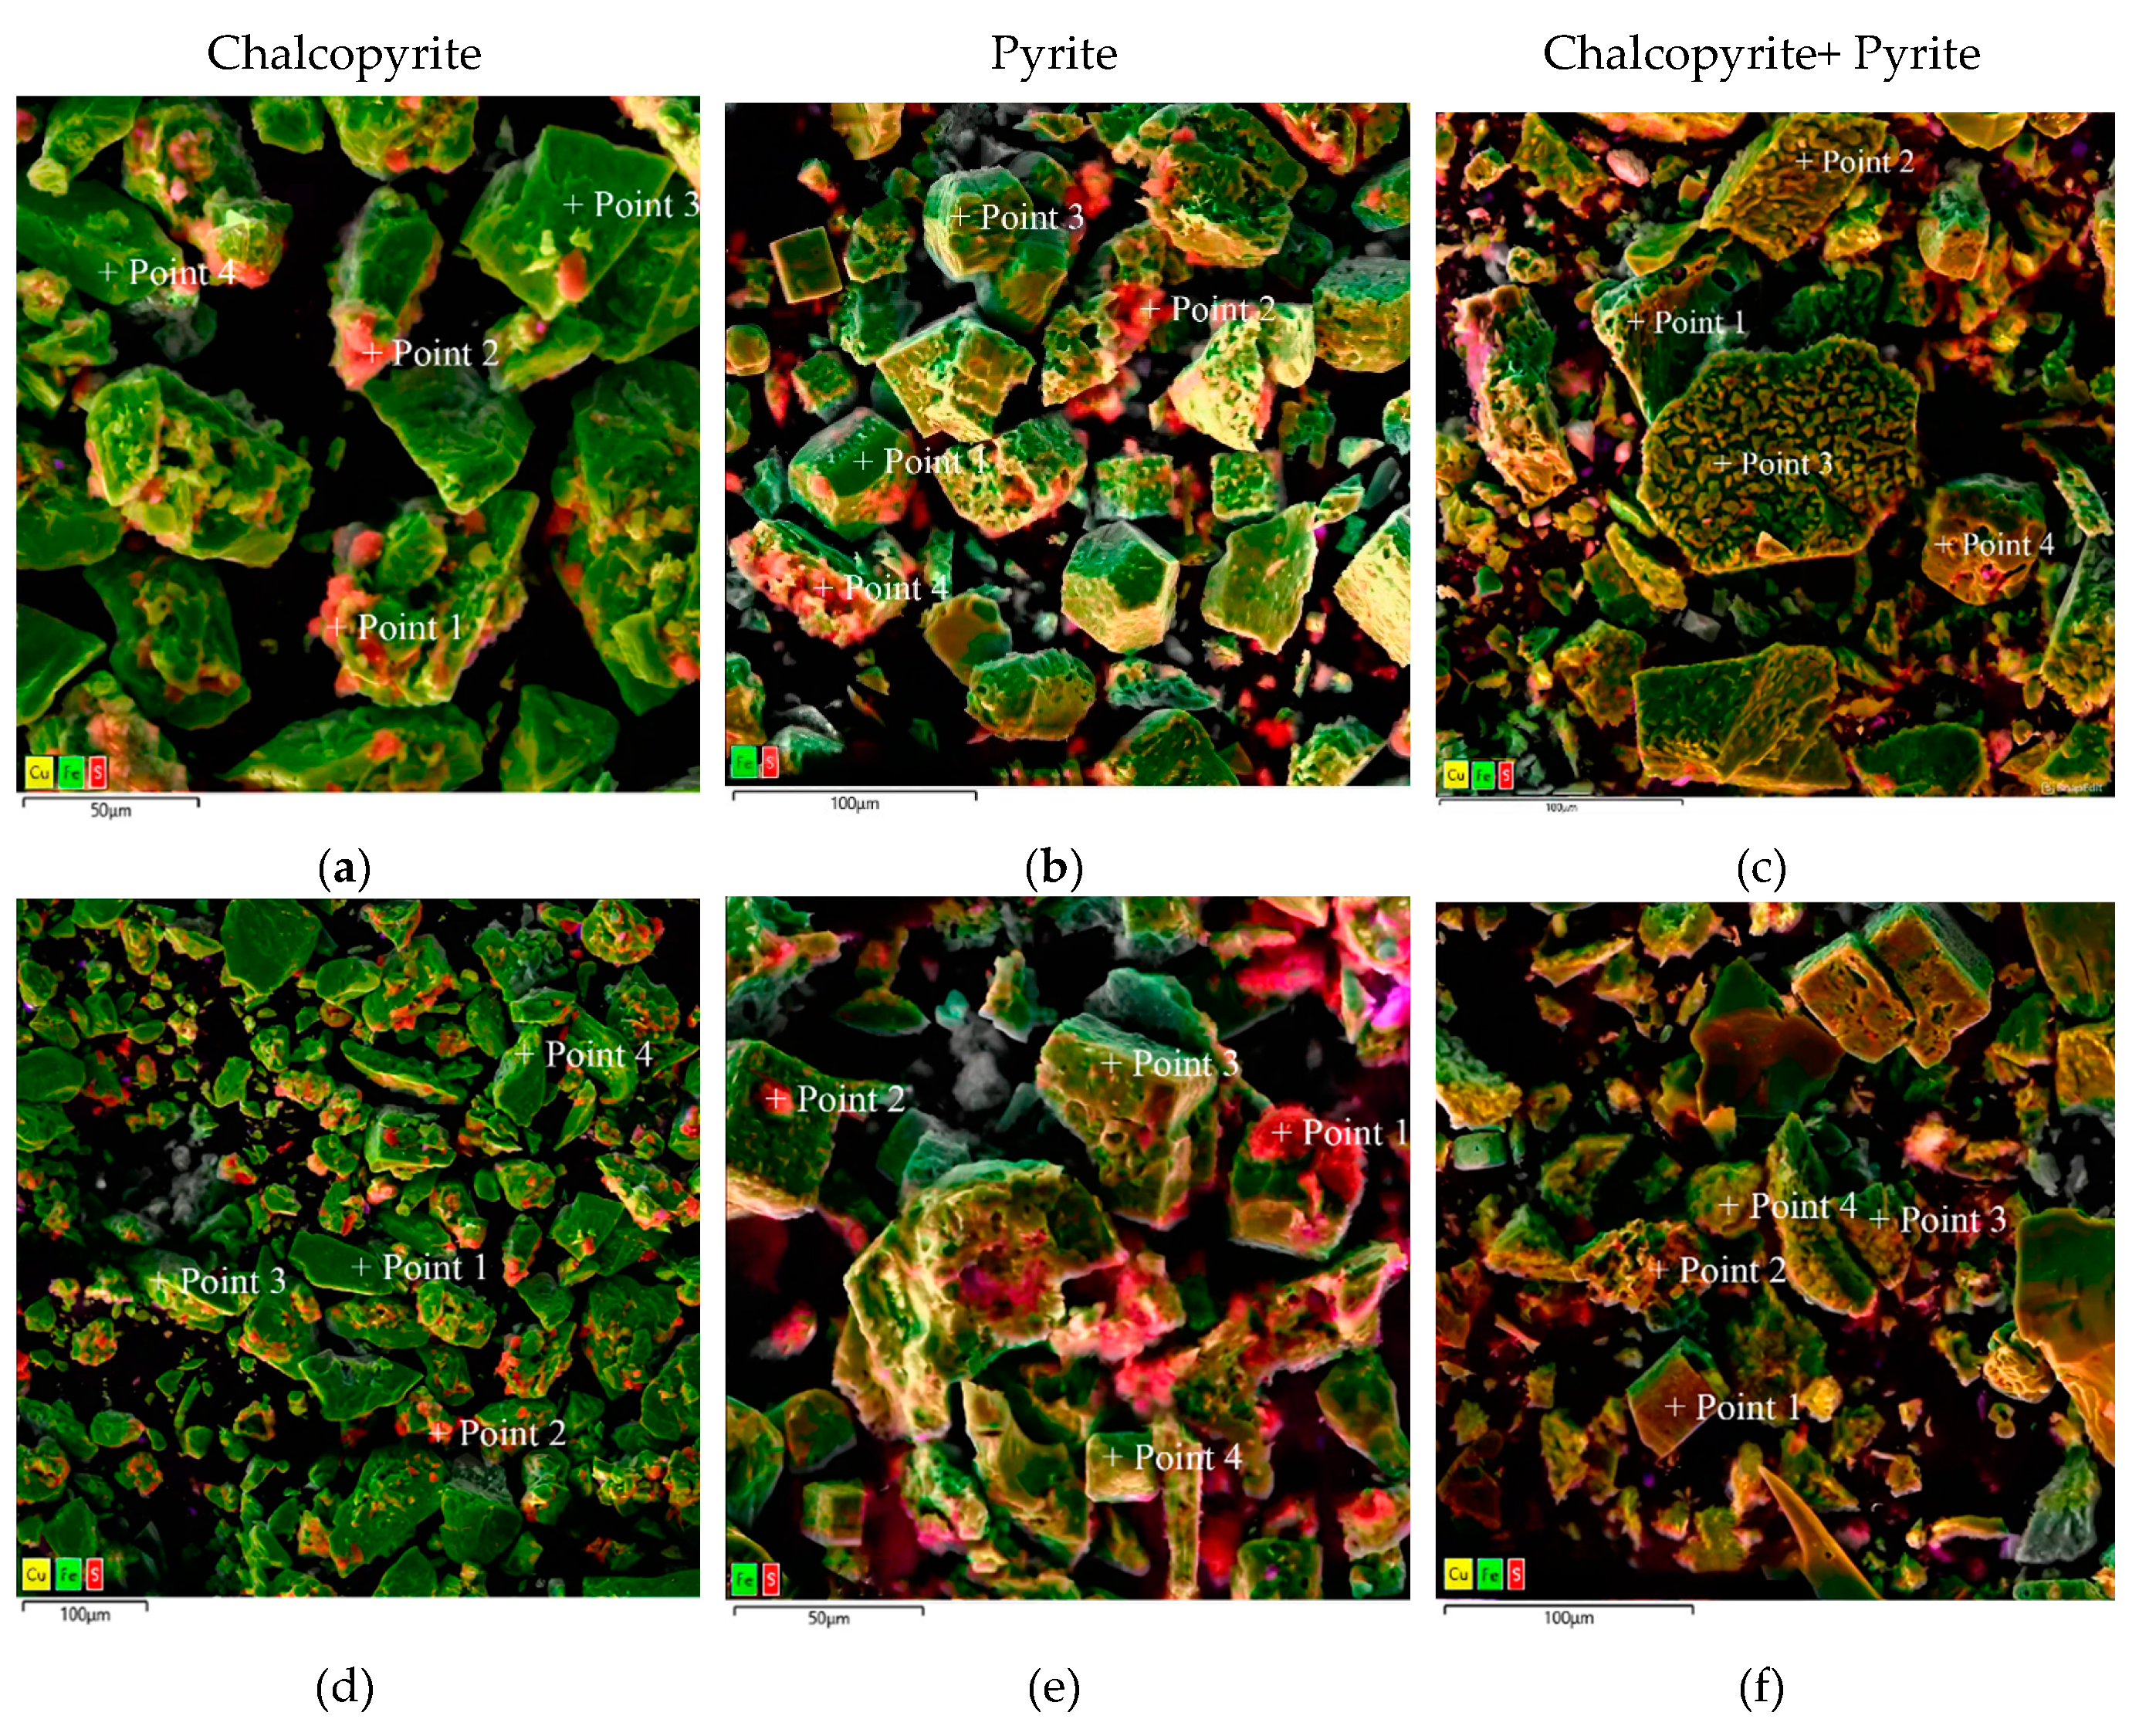

Table 1.
The chemical composition of the minerals used.
| Material | Content/wt.% | |||
| Cu | Fe | S | Others | |
| CuFeS2 | 33.4 | 32.0 | 33.6 | 1.0 |
| FeS2 | 44.1 | 50.8 | 5.1 | |
Table 2.
SCM equations.
| # | Limiting step | Equation |
|---|---|---|
| 1 | Diffusion through the product layer (sp) | 1 − 3(1 − X)2/3 + 2(1 − X) |
| 2 | Diffusion through the product layer (pp) | X2 |
| 3 | Diffusion through the product layer (cp) | X + (1 − X)ln(1 − X) |
| 4 | Diffusion through the liquid film (sp) | X |
| 5 | Surface chemical reactions (cp) | 1 − (1 − X)1/2 |
| 6 | Surface chemical reactions (sp) | 1 − (1 − X)1/3 |
| 7 | Diffusion through the product layer, Interfacial limiting step (new model) | 1/3ln(1 – X) + [(1 – X)−1/3 – 1] |
p – spherical particles, pp – prismatic particles, cp – conus particles.
Table 3.
Correlation coefficients of the SCM equations for modeling chalcopyrite and pyrite dissolution separately from each other.
Table 3.
Correlation coefficients of the SCM equations for modeling chalcopyrite and pyrite dissolution separately from each other.
| # | Equation | R2 | |||
|---|---|---|---|---|---|
| 60 oC | 80 oC | 100 oC | 110 oC | ||
| CuFeS2 | |||||
| 1 | 1 − 3(1 − X)2/3 + 2(1 − X) | 0.993 | 0.990 | 0.993 | 0.998 |
| 2 | X2 | 0.929 | 0.925 | 0.936 | 0.956 |
| 3 | X + (1 − X)ln(1 − X) | 0.948 | 0.945 | 0.953 | 0.949 |
| 4 | X | 0.932 | 0.939 | 0.928 | 0.941 |
| 5 | 1 − (1 − X)1/2 | 0.952 | 0.953 | 0.965 | 0.947 |
| 6 | 1 − (1 − X)1/3 | 0.958 | 0.938 | 0.968 | 0.938 |
| FeS2 | |||||
| 1 | 1 − 3(1 − X)2/3 + 2(1 − X) | 0.996 | 0.992 | 0.998 | 0.998 |
| 2 | X2 | 0.930 | 0.915 | 0.936 | 0.961 |
| 3 | X + (1 − X)ln(1 − X) | 0.948 | 0.905 | 0.923 | 0.975 |
| 4 | X | 0.937 | 0.937 | 0.952 | 0.954 |
| 5 | 1 − (1 − X)1/2 | 0.948 | 0.950 | 0.942 | 0.945 |
| 6 | 1 − (1 − X)1/3 | 0.959 | 0.963 | 0.957 | 0.960 |
Table 4.
Correlation coefficients of the SCM equations for modeling chalcopyrite and pyrite dissolution in a 1:1 mixture.
Table 4.
Correlation coefficients of the SCM equations for modeling chalcopyrite and pyrite dissolution in a 1:1 mixture.
| # | Equation | R2 | |||
|---|---|---|---|---|---|
| 65 oC | 75 oC | 85 oC | 105 oC | ||
| CuFeS2 | |||||
| 1 | 1 − 3(1 − X)2/3 + 2(1 − X) | 0.902 | 0.972 | 0.992 | 0.993 |
| 2 | X2 | 0.888 | 0.968 | 0.957 | 0.956 |
| 3 | X + (1 − X)ln(1 − X) | 0.841 | 0.941 | 0.971 | 0.964 |
| 4 | X | 0.827 | 0.911 | 0.883 | 0.938 |
| 5 | 1 − (1 − X)1/2 | 0.830 | 0.920 | 0.889 | 0.953 |
| 6 | 1 − (1 − X)1/3 | 0.957 | 0.891 | 0.923 | 0.831 |
| FeS2 | |||||
| 1 | 1 − 3(1 − X)2/3 + 2(1 − X) | 0.968 | 0.993 | 0.999 | 0.953 |
| 2 | X2 | 0.923 | 0.933 | 0.916 | 0.919 |
| 3 | X + (1 − X)ln(1 − X) | 0.948 | 0.905 | 0.936 | 0.944 |
| 4 | X | 0.879 | 0.936 | 0.922 | 0.842 |
| 5 | 1 − (1 − X)1/2 | 0.886 | 0.969 | 0.921 | 0.876 |
| 6 | 1 − (1 − X)1/3 | 0.888 | 0.953 | 0.943 | 0.887 |
Table 5.
Element contents at the composition determination points.
| Element | Fe | Cu | Ssulfide | S0 | Other | Total |
|---|---|---|---|---|---|---|
| Figure 17a. Point 1 | 14.8 | 13.6 | 13.7 | 54.5 | 3.4 | 100.0 |
| Figure 17a. Point 2 | 5.6 | 5.0 | 5.0 | 73.6 | 10.8 | 100.0 |
| Figure 17a. Point 3 | 26.4 | 27.8 | 28.0 | 7.2 | 10.6 | 100.0 |
| Figure 17a. Point 4 | 28.9 | 31.7 | 31.9 | 7.4 | 0.1 | 100.0 |
| Figure 17d. Point 1 | 28.0 | 30.5 | 30.7 | 7.4 | 3.4 | 100.0 |
| Figure 17d. Point 2 | 15.3 | 14.9 | 15.0 | 39.4 | 15.4 | 100.0 |
| Figure 17d. Point 3 | 25.4 | 26.4 | 26.6 | 8.7 | 12.9 | 100.0 |
| Figure 17d. Point 4 | 25.0 | 26.0 | 26.2 | 7.3 | 15.5 | 100.0 |
| Figure 17b. Point 1 | 43.9 | - | 50.3 | 3.1 | 2.7 | 100.0 |
| Figure 17b. Point 2 | 17.1 | - | 19.6 | 51.4 | 11.9 | 100.0 |
| Figure 17b. Point 3 | 38.6 | - | 44.2 | 4.7 | 12.5 | 100.0 |
| Figure 17b. Point 4 | 8.5 | - | 9.7 | 72.6 | 9.2 | 100.0 |
| Figure 17e. Point 1 | 14.1 | - | 16.2 | 59.0 | 10.7 | 100.0 |
| Figure 17e. Point 2 | 19.5 | - | 22.3 | 47.2 | 11.0 | 100.0 |
| Figure 17e. Point 3 | 40.4 | - | 46.3 | 2.3 | 11.0 | 100.0 |
| Figure 17e. Point 4 | 40.2 | - | 46.1 | 3.7 | 10.0 | 100.0 |
| Figure 17c. Point 1 | 41.3 | - | 47.3 | 0.1 | 11.3 | 100.0 |
| Figure 17c. Point 2 | 27.1 | 29.1 | 29.3 | 5.1 | 9.4 | 100.0 |
| Figure 17c. Point 3 | 25.8 | 27.7 | 27.9 | 9.4 | 9.2 | 100.0 |
| Figure 17c. Point 4 | 41.6 | - | 47.7 | 0.1 | 10.6 | 100.0 |
| Figure 17f. Point 1 | 44.5 | - | 51.0 | 0.6 | 3.9 | 100.0 |
| Figure 17f. Point 2 | 43.7 | - | 50.1 | 1.9 | 4.3 | 100.0 |
| Figure 17f. Point 3 | 40.1 | - | 46.0 | 0.1 | 13.8 | 100.0 |
| Figure 17f. Point 4 | 27.3 | 29.1 | 29.3 | 5.9 | 8.4 | 100.0 |
Disclaimer/Publisher’s Note: The statements, opinions and data contained in all publications are solely those of the individual author(s) and contributor(s) and not of MDPI and/or the editor(s). MDPI and/or the editor(s) disclaim responsibility for any injury to people or property resulting from any ideas, methods, instructions or products referred to in the content. |
© 2024 by the authors. Licensee MDPI, Basel, Switzerland. This article is an open access article distributed under the terms and conditions of the Creative Commons Attribution (CC BY) license (http://creativecommons.org/licenses/by/4.0/).
Copyright: This open access article is published under a Creative Commons CC BY 4.0 license, which permit the free download, distribution, and reuse, provided that the author and preprint are cited in any reuse.


