Submitted:
02 December 2024
Posted:
03 December 2024
You are already at the latest version
Abstract
Hepatocellular carcinoma (HCC) is a leading cause of cancer-related mortality worldwide. Long non-coding RNAs (lncRNAs) have emerged as critical regulators of HCC progression. Despite significant advancements, the precise mechanisms through which lncRNAs modulate gene expression in HCC remain incompletely understood, necessitating further investigation. Through analysis of differentially expressed (DE) genes in HCC and normal tissues from The Cancer Genome Atlas (TCGA), we identified the lncRNA KCNQ1OT1/miR-335-5p/cell division cycle 7 (CDC7) axis as a pivotal regulatory axis in HCC. Functional studies revealed that KCNQ1OT1 improves CDC7 expression by acting as a competitive endogenous RNA (ceRNA) that sponges miR-335-5p, thereby promoting HCC proliferation and migration. Overexpression of miR-335-5p counteracted the inhibitory effects of KCNQ1OT1 knockdown on HCC malignant behaviors, while CDC7 upregulation enhanced proliferation and migration. Notably, we demonstrated that hepatitis B virus (HBV) and its core protein (HBc) induce KCNQ1OT1 expression, thereby activating the KCNQ1OT1/miR-335-5p/CDC7 axis to drive HCC progression. Furthermore, these findings highlight a critical mechanistic link between HBV infection and HCC malignancy, mediated by the KCNQ1OT1/miR-335-5p/CDC7 axis. Targeting this axis may represent a promising therapeutic strategy for HCC, particularly in HBV-positive patients.
Keywords:
HCC
; lncRNA KCNQ1OT1
; miR-335-5p
; CDC7
; HBc
1. Introduction
Hepatocellular carcinoma (HCC) is known as the most common primary liver cancer, accounting for over 90 % of cases, with an increasing prevalence worldwide[1]. Despite this, the mechanisms underlying HCC progression still remains unclear[2,3,4,5]. Long non-coding RNAs (lncRNAs) are a class of RNA molecules > 200 nucleotides in length that do not encode proteins[6,7]. Increasing evidence suggests that mutations and dysregulation of lncRNAs affect various aspects of genome function and critical biological processes[8]. In many malignancies, lncRNAs are dysregulated and interact with a multitude of RNAs and proteins, influencing cancer progression[9,10,11]. Typically, lncRNAs function as competing endogenous RNAs (ceRNAs), competitively binding with miRNAs to decrease miRNAs regulation of their target mRNAs, as observed in HCC[12]. However, the regulatory mechanisms of lncRNA-dependent gene expression in HCC require in-depth exploration to develop promising therapeutic targets and methods.
Utilizing sample data form The Cancer Genome Atlas (TCGA) database, we analyzed differentially expressed (DE) lncRNAs involved in HCC tumorigenesis, with a particular focus on the lncRNA KCNQ1 overlapping transcript 1 (KCNQ1OT1) /miR-335-5p/cell division cycle 7 (CDC7) axis. Recent studies have indicated that overexpression of KCNQ1OT1 interacts with several tumor suppressor miRNAs (including miR-148a-3p, miR-149, miR-146a-5p, miR-506, miR-504, miR-424-3p, miR-136-3, miR-139-5p, miR-223-3p and miR-375-3p) to enhance HCC progression and is associated with poor prognosis in patients[13,14,15]. Additionally, miR-335-5p has been identified to negatively regulate critical pathways involved in the transport and utilization of essential compounds that are crucial for the rapid proliferation of HCC cells[16]. Research indicates that extracellular vesicles containing miR-335-5p have the potential to decrease HCC growth and invasion both in vitro and in vivo[17]. Notably, the role of KCNQ1OT1 in targeting miR-335-5p has not been documented.
The CDC7 protein plays a pivotal role in initiating DNA replication, S-phase checkpoints, and M-phase completion[18]. In cancer cells, the absence of CDC7 leads to defects in S-phase progression, resulting in p53-independent apoptotic cell death[19]. CDC7 forms a complex with dumbbell former 4 (DBF4) to create DBF4-dependent kinase (DDK), which is crucial for tumor cell survival[20]. Highly expressed in HCC, CDC7 is significantly correlated with the survival rate of HCC patients[21]. Nevertheless, studies on the association between miR-335-5p and CDC7 remain inconclusive.
In this study, we found that KCNQ1OT1 increased the expression of CDC7 by acting as a ceRNA to attract miR-335-5p, thereby promoting the proliferation and migration of HCC cells. Primary risk factors for HCC include chronic infection with hepatitis B virus (HBV) or hepatitis C virus (HCV), consumption of aflatoxin-contaminated foods, excessive alcohol intake, and obesity. Chronic HBV infection is a major contributor to HCC in high-risk areas[22]. Based on this, our results showed that HBV and its encoded protein HBc significantly enhanced the expression of KCNQ1OT1 and CDC7 while reducing the expression of miR-335-5p. This study provides new insights into the regulatory mechanisms of HBV infection in liver cancer progression. Therefore, the KCNQ1OT1/miR-335-5p/CDC7 axis may be a promising therapeutic target in patients with HBV-related primary liver cancer.
2. Results
2.1. Significant genes in HCC included KCNQ1OT1, miR-335-5p, and CDC7
To explore the roles of crucial genes in HCC progression, we conducted DE gene analyses on RNA sequencing data of 374 tumor tissues and 50 normal tissues obtained from TCGA database. Our analysis identified 1,433 upregulated and 859 downregulated DE genes in the tumor samples. Specifically, we found that 136 lncRNAs, 128 miRNAs, and 2,028 mRNAs were upregulated, while 104 lncRNAs, 107 miRNAs, and 1,222 mRNAs were downregulated. Volcano plots and heatmaps displayed the expression patterns of these dysregulated lncRNAs, miRNAs, and mRNAs (Figure 1A-C and Supplementary Figure S1A-C). To investigate the biological functions of these DE genes and the potential pathways, GO annotation (Supplementary Figure S1D), and KEGG enrichment analyses were performed for mRNAs to explore possible regulatory mechanisms. Our findings reveal that the cell cycle and DNA replication signaling pathways, which are closely related to the pathophysiological processes of HCC, are among the most significantly enriched pathways (Figure 1D).
A roadmap for the screening and validating the key functional axis is shown in Figure 2. Using the ENCORI/starBase database, we predicted the interaction network of DE genes and constructed a ceRNA regulatory network comprising 3 lncRNAs, 12 miRNAs, and 21 mRNAs (Figure 1E). Notably, the KCNQ1OT1/miR-335-5p/CDC7 axis stands out as having a unique regulatory role in this network. Evidence shows that CDC7 plays a critical role in the cell cycle and DNA replication pathways[18]. To assess the clinical relevance of this axis, we generated a Kaplan-Meier survival curve using the GEPIA 2 database, which showed that patients with high expression levels of KCNQ1OT1 and CDC7 had a poor prognosis (Figure 1F,G). Expression analyses conducted using the UALCAN database further confirmed that both KCNQ1OT1 and CDC7 were expressed at significantly higher levels in tumor tissues compared to normal tissues (Supplementary Figure S1E,G), while miR-335-5p exhibited reduced expression in HCC specimens (Supplementary Figure S1F). Additionally, expression levels were closely associated with tumor malignancy grade (Figure 1H-J). These data indicate that the KCNQ1OT1/miR-335-5p/CDC7 axis is both functionally significant and clinically relevant in HCC.
2.2. KCNQ1OT1 promotes malignant progression of HCC by inhibiting miR-335-5p
To investigate the interaction between KCNQ1OT1 and miR-335-5p, we designed three siRNA sequences targeting different sites on KCNQ1OT1 and selected the most effective one, si-KCNQ1OT1-1714 (Supplementary Figure S2A). After knockdown of KCNQ1OT1 in SMMC-7721 cells, the level of miR-335-5p significantly increased (Figure 3A). Using the target prediction tool RNAhybrid, we identified binding sites for miR-335-5p on KCNQ1OT1. Consequently, we constructed WT and MUT KCNQ1OT1 plasmids; both the predicted binding sequence and the corresponding mutant sequence displayed in Figure 3B. Luciferase reporter assay indicated that the miR-335-5p mimic significantly suppressed the luciferase activity of WT-KCNQ1OT1, but not that of MUT-KCNQ1OT1, compared to the control mimic in SMMC-7721 cells. These results demonstrate that KCNQ1OT1 directly binds to and negatively regulates miR-335-5p in HCC cells (Figure 3C).
Subsequently, CCK-8 and colony formation assays confirmed that KCNQ1OT1 knockdown inhibited HCC proliferation, whereas the wound healing assay demonstrated an inhibitory effect of KCNQ1OT1 knockdown on HCC migration. Furthermore, the effect of KCNQ1OT1 on the proliferation and migration in SMMC-7721 cells was counteracted by miR-335-5p inhibitors (Figure 3D-F). Therefore, KCNQ1OT1 promote the proliferation and migration of HCC cells by negatively regulating miR-335-5p.
2.3. MiR-335-5p inhibits HCC proliferation and migration
Given that KCNQ1OT1 may function by inhibiting miR-335-5p, we further investigated the biological role of miR-335-5p. HCC cells were transfected with miR-NC or miR-335-5p mimics, or co-transfected with miR-335-5p mimics and inhibitors. Our results indicated that miR-335-5p overexpression inhibited HCC cell proliferation and migration, an effect that was reversed by miR-335-5p inhibitors (Figure 4A-C). Conversely, miR-335-5p inhibitors markedly enhanced cell proliferation and migration (Figure 4D-F). Hence, the above results confirm that miR-335-5p suppresses HCC progression.
2.4. CDC7 is a critical target of miR-335-5p to promote HCC progression
To verify whether CDC7 is a functional target of miR-335-5p, we initially combined RNAhybrid prediction analysis with a dual-luciferase reporter gene assay (Figure 5A). The results showed that the miR-335-5p mimic inhibited the luciferase activity of WT-CDC7, while having no influence on MUT-CDC7 (Figure 5B). This indicates that the 3'-UTR of CDC7 binds to miR-335-5p. We subsequently treated SMMC-7721 cells with miR-335-5p mimics, leading to a significant increase in miR-335-5p levels and a notable decrease in CDC7 mRNA and protein levels. In combining with miR-335-5p inhibitor treatment, we successfully rescued the expression of miR-335-5p (Figure 5C,D) and alleviated its suppressive effect on CDC7 in SMMC-7721 cells (Figure 5E,F).
2.5. KCNQ1OT1 promotes HCC progression through the miR-335-5p/CDC7 axis
As previously reported, ceRNAs can competitively bind to and sequester miRNAs, preventing miRNA-induced degradation or suppression of their target mRNAs.[23] To clarify whether KCNQ1OT1 regulates HCC progression via the miR-335-5p/CDC7 axis, we transfected miR-335-5p inhibitors into KCNQ1OT1 knockdown HCC cells. RT-qPCR, WB and immunofluorescence assays showed that CDC7 expression at both the mRNA and protein levels was inhibited by KCNQ1OT1 knockdown but was significantly reversed by miR-335-5p inhibitors (Figure 6A,B). Additionally, immunohistochemistry results showed that CDC7 expression in HCC tissues was significantly higher than that in adjacent normal tissues (ANT) (Figure 6C). This finding further confirms that abnormal CDC7 expression in HCC cells is a significant factor influencing HCC progression.
To investigate the specific mechanisms by which CDC7 affects biological processes in HCC cells, we first selected the most potent siRNA sequence for CDC7 knockdown (Supplementary Figure S2B) and verified the efficiency of the CDC7 overexpression plasmid and CDC7-selective inhibitor XL413[24] (Supplementary Figure S2C-E). In SMMC-7721 cells, CDC7 knockdown significantly suppressed proliferation and migration (Figure 6D-F). Moreover, XL413 effectively reversed the enhanced proliferation and migration induced by CDC7 overexpression in these cells (Figure 6G-I). Our data suggest that KCNQ1OT1 regulates CDC7 expression and promotes the malignant progression of HCC by inhibiting miR-335-5p.
2.6. Regulatory effect of KCNQ1OT1/miR-335-5p on CDC7 is induced by HBc
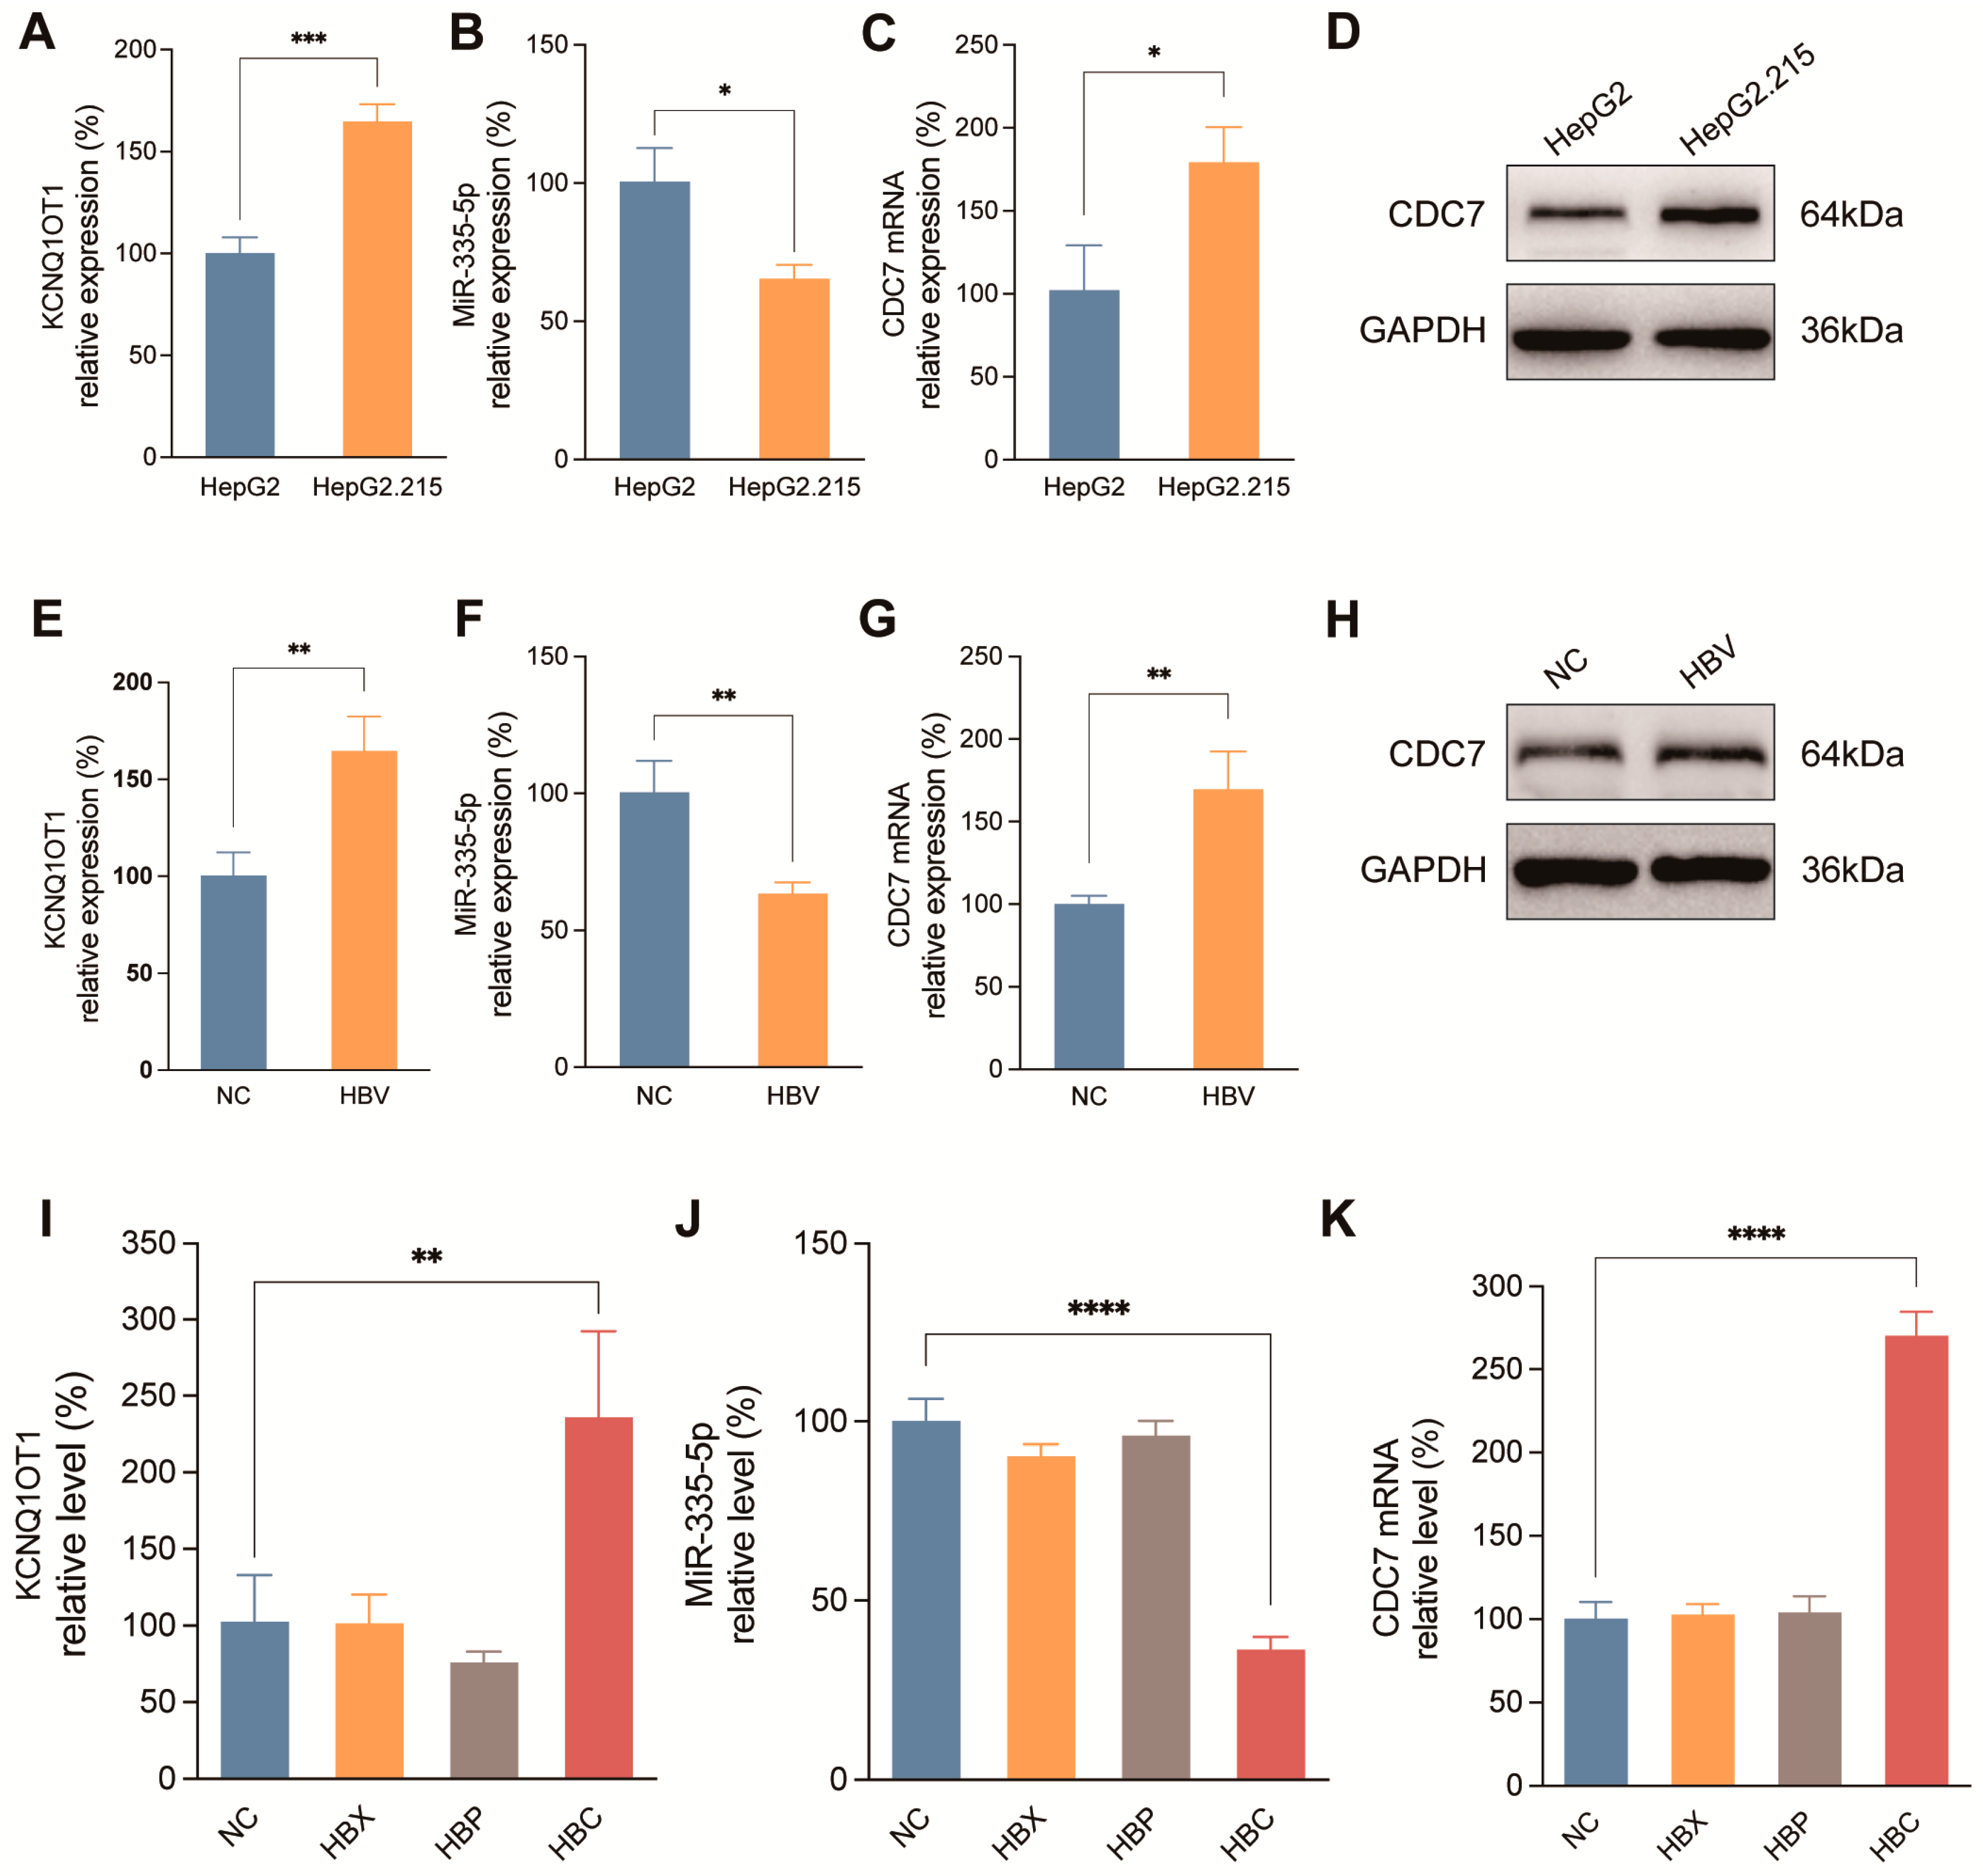
To deeply explore the correlation between the KCNQ1OT1/miR-335-5p/CDC7 axis and HBV-related HCC, we compared the expression levels of this axis in HepG2 and HepG2.215 cells. In HepG2.215 cells, KCNQ1OT1 and CDC7 expression was significantly elevated, while miR-335-5p level was notably reduced compared to HepG2 cells (Figure 7A-D). Moreover, after transfection with a 1.3-fold HBV whole genome plasmid, SMMC-7721 cells showed a significant increase in the expression of KCNQ1OT1 and CDC7, accompanied by a decrease in miR-335-5p levels (Figure 7E-H). Our research demonstrates that HBV consistently elevates KCNQ1OT1 expression and reduces miR-335-5p levels, upregulating CDC7 regardless of whether HBV viruses or complete genome plasmids are introduced stably or transiently. This suggests that HBV may significantly regulate the KCNQ1OT1/miR-335-5p/CDC7 axis.
Studies have shown that HBV-encoded proteins are involved in various intracellular signaling pathways and play important roles in HBV-related HCC[2,25,26]. To identify the specific HBV-encoded proteins responsible for activating this signaling axis, we transiently transfected SMMC-7721 cells with HBx, HBp, and HBc recombinant plasmids for 48 h. Results indicated that HBc transfection substantially increased KCNQ1OT1 and CDC7 expression while decreasing miR-335-5p levels compared to the other HBV proteins (Figure 7I-K). Consequently, the KCNQ1OT1/miR-335-5p/CDC7 axis may serve as a potential therapeutic target for HCC, offering new treatment options for patients with HBV-related HCC.
3. Discussion
HCC is the most prevalent form of primary liver cancer and the fourth leading cause of cancer-related mortality globally[1]. Despite significant efforts, our understanding of the specific mechanisms underlying HCC progression remains limited. HBV infection, a major risk factor, affects the expression and function of specific genes, contributing to liver disorders[26]. The complex alterations caused by HBV are considered primary contributors to malignant progression and poor prognosis in HCC patients[2]. Thus, investigating the mechanisms of HBV-mediated HCC is a focal point for future research.
Viral persistence in HBV infection arises from the virus's ability to evade the host immune system and establish covalently closed circular double-stranded DNA (cccDNA) in the nucleus of infected cells[3]. As a transcriptional template for HBV, cccDNA encodes four overlapping open reading frames (ORFs), producing proteins including HBV core/capsid protein (HBc), HBeAg, envelope proteins (S, M, and L), nonstructural X protein (HBx), and P protein (HBp). Current evidence suggests that HBx plays a pathogenetic role in HBV-induced malignant transformation[4,5]. The HBc protein, encoded by the C ORF, is involved in nearly every stage of the HBV life cycle, including genome release, capsid assembly and transport, reverse transcription, and RNA metabolism[27,28,29]. Emerging evidence indicates that HBc promotes malignant progression of HCC through various mechanisms, including epigenetic alterations (e.g., miRNA), cellular metabolic disorders, and resistance to apoptosis[2]. HBc has been reported to repress the expression of the p53 tumor suppressor gene in HCC synergistically with HBx[30]. Furthermore, HBc facilitates HCC metastasis via the miR-382-5p/DLC-1 axis and may inhibit TRAIL-induced hepatocyte apoptosis by obstructing DR5 expression, contributing to chronic hepatitis and HCC development[31,32]. However, previous studies have primarily focused on HBx’s role in HBV malignant transformation. In this study, we demonstrate that HBc induces the KCNQ1OT1/miR-335-5p/CDC7 axis and promotes malignant HCC progression, enhancing our understanding of HBV-related HCC.
Growing evidence indicates that lncRNAs play a wide range of roles in chromatin modification, transcription, and post-transcriptional regulation, acting as signals, decoys, guides, scaffolds, and ceRNAs. Recent studies suggest that lncRNA-miRNA interactions are crucial regulators in various biological processes and carcinogenesis in HCC[33]. lncRNAs typically interact with miRNAs as molecular sponges, modulating miRNAs binding to target mRNAs[33]. For instance, the highly expressed lncRNA NEAT1 functions as a ceRNA, attracting miR-362-3p to indirectly upregulate MIOX expression, promoting ferroptosis in HCC cells[34]. Mechanistic studies reveal that lncRNA MIAT exerts an oncogenic function in HCC by sponging miR-22-3p to upregulate SIRT1 expression[35]. MFI2-AS1 facilitates HCC progression through a positive feedback loop involving the MFI2-AS1/miR-134/FOXM1 axis[36]. In this study, we constructed the lncRNA-miRNA-mRNA network and found that KCNQ1OT1 plays an essential role in HCC progression through interactions with miR-335-5p, subsequently regulating CDC7 signaling. Furthermore, our research demonstrates that the abnormal expression of this axis in HCC is regulated by HBc, which may be a significant contributor.
KCNQ1OT1, located on chromosome 11p15.5 and spanning 91 kb[37], is highly expressed in various malignancies and is associated with tumor growth, lymph node metastasis, survival cycle, and recurrence rate[38]. Increasing evidence suggests that KCNQ1OT1 expression is significantly higher in HCC tissues and cell lines compared to adjacent non-carcinoma tissues and normal cell lines[39,40]. Cheng et al. discovered that KCNQ1OT1 acts as a molecular sponge for miR-149, regulating S1PR1 expression and influencing HCC invasion and migration[39]. Additionally, KCNQ1OT1 regulates cyclin-dependent kinase 16 (CDK16) expression, mediating HCC progression as a ceRNA for miR-504[41]. Dysregulation of the KCNQ1OT1/miR-148a-3p/IGF1R axis also contributes to HCC[42].
Previous studies show that miR-335-5p negatively regulates rapid HCC cell proliferation, and extracellular vesicles carrying this miRNA can reduce cancer growth and invasion[16,17]. Moreover, miR-335-5p plays a role in the process by which circ_0064288 and circ_0009910 promote ROCK1 expression, facilitating HCC cell growth and migration[43,44]. Our research shows for the first time that KCNQ1OT1 inhibits miR-335-5p to regulate CDC7 expression.
CDC7, a highly conserved serine-threonine kinase, initiates DNA replication and is activated through its interaction with regulatory subunit DBF4[45]. Cancer cells exhibit heightened replicative stress and may be especially sensitive to CDC7 inhibition[45]. Elevated CDC7 expression is well recognized in a wide range of cancers (including HCC, breast cancer, and colon cancer), and is strongly associated with tumor malignancy, invasiveness, and poor prognosis[46,47,48]. One study indicates that combining CDC7 inhibition with ATR-CHK1 inhibition probably shows striking synergy in suppressing HCC cell proliferation[18]. Similarly, the synergistic inhibition of CDC7 and cyclin-dependent kinase 9 (CDK9) enhances the antitumor efficacy of 5-fluorouracil (5-FU) in suppressing HCC cells[49]. These studies demonstrate that CDC7 plays an integral role in HCC treatment; however, the specific mechanisms by which HBc modulates CDC7 activation and promotes HCC progression require further investigation.
In this study, we aimed to elucidate the specific mechanisms by which lncRNAs contribute to HBV-related HCC progression. Key findings indicate that HBc enhances KCNQ1OT1 expression, which suppresses miR-335-5p, leading to CDC7 upregulation. We verified that HBc plays a pivotal role in promoting malignant progression in HCC by modulating the KCNQ1OT1/miR-335-5p/CDC7 signaling axis. Our findings provide novel insights into the roles of KCNQ1OT1 and CDC7, potentially aiding in the exploration of treatments for HBV-related HCC. Future studies should aim to develop specific inhibitors for this axis and assess their efficacy in clinical settings, potentially improving outcomes for patients with HBV-related HCC.
4. Materials and Methods
4.1. TCGA data collection and ceRNA network construction
A total of 374 HCC tissue samples and 50 normal tissue samples were downloaded from TCGA database (https://portal.gdc.cancer.gov/). The DESeq2 package was used to identify DE genes. The GDCRNATools package was utilized to classify these genes into the lncRNA, miRNA, and mRNA categories. The RNA interaction network and binding sites were predicted using the ENCORI/starBase database (v2.0, https://rnasysu.com/encori/) and the RNAhybrid software (https://bibiserv.cebitec.uni-bielefeld.de/rnahybrid). The final lncRNA-miRNA-mRNA regulatory network was visualized using the Cytoscape software (http://cytoscape.github.io/). Volcano plots and heatmaps were generated using the ggplot2 package. Genome Ontology (GO) annotation and Kyoto Encyclopedia of Genes and Genomes (KEGG) enrichment analyses for DE mRNAs were conducted using the clusterProfiler package[50]. The GEPIA 2 database (http://gepia2.cancer-pku.cn/#index) was used for survival analysis, and the UALCAN database (https://ualcan.path.uab.edu/index.html) was used for the expression analysis of DE RNAs.
4.2. Cell culture and transfection
Human HCC cell lines, HepG2 and HepG2.215 (stably transfected HBV virus HepG2 cells), were purchased from iCell Bioscience (China). All cells in this study were cultured in high glucose DMEM (Gibco, USA) supplemented with 10 % FBS (Gibco, USA), 100 μg/mL penicillin and 100 U/mL streptomycin (Gibco, USA). For cell transfection, cells were inoculated in plates and incubated for 16-24 h. When the cell density to reach 60-70 %, siRNA, miRNA mimics, miRNA inhibitors, or plasmids were transfected into cells by using Lipofectamine 2000 (Thermo, USA).
The sequences of si-NC, si-KCNQ1OT1, si-CDC7, miR-NC, miR-335-5p mimics, miR-335-5p inhibitors, and NC inhibitors were designed and synthesized by GenePharma (China). Si-NC served as a negative control for si-KCNQ1OT1 and si-CDC7. MiR-NC functioned as a negative control for miR-335-5p mimics, while NC inhibitors served as the negative control for miR-335-5p inhibitors. Plasmids were obtained from MiaoLing Bio (China), including pcDNA3.1-CDC7 (oe-CDC7) and negative control (oe-NC), HBV 1.3-mer WT replicon and its negative control pGEM-4Z, HBx-pmCherry, HBp-pmCherry, HBc-pmCherry and negative control (NC). All the related sequences are listed in Supplementary Table S1.
4.3. Luciferase reporter assay
The sequences containing the mutated site were inserted into the luciferase reporter gene vector pmirGLO, and mutant vectors MUT-KCNQ1OT1 and MUT-CDC7 were constructed. SMMC-7721 cells were transfected with WT-KCNQ1OT1, MUT-KCNQ1OT1, WT-CDC7, or MUT-CDC7 in combination with miR-355-5p mimics or miR-NC. After 48 h of incubation, the relative luciferase activity in each group measured. The Dual Luciferase Reporter Gene Assay System (Beyotime, China) was used to measure luciferase activity.
4.4. Quantitative real-time polymerase chain reaction (qRT-PCR)
Total RNA was extracted from cultured cells using TRIzol reagent (Thermo, USA) according to the manufacturer’s instructions. High-quality total RNA was reverse-transcribed using the Prime Script™ RT Master Mix Kit (TaKaRa, China). Then qRT-PCR was performed using TB Green® Premix Ex Taq™ II (TaKaRa, China). Relative expression was calculated using the 2−ΔΔCT method and transcript levels were normalized to GAPDH mRNA expression levels. Reverse transcription of miRNA was performed using the miRNA 1st strand cDNA synthesis kit (Stem-loop) (Accurate Biology, China). QPCR was performed with the same kit as above, and the relative expression of miRNAs was normalized to U6. The primer sequences are listed in Supplementary Table S2.
4.5. CCK-8 assay
After transfection, 5×10³ cells per well were seeded into 96-well plates and incubated for 0, 24, 48, 72, and 96 h. Before testing, 10 μL of CCK-8 reagent (Dojindo, Japan) was added to the each well and cells were incubated for 3 h at 37 °C. Subsequently, the light absorbance at 450 nm was measured. Cell proliferation ability in different groups was analyzed using the CCK-8 assay, according to the manufacturer’s protocol.
4.6. Cell colony formation assay
Different groups of transfected HCC cells were seeded in six-well plates at 1000 cells per well. After 2 weeks, 4 % paraformaldehyde was used to fix cell colonies, then, fixed colonies were stained with crystal violet for 10-30 min. After staining, the plates were washed with distilled water and air-dried. Colonies were counted for statistical analysis.
4.7. Wound healing assay
The transfected cells were distributed in a 6-well plate and allowed to grow until reaching 80 %-90 % confluence. Scratches were created in the cell monolayer with 10 µL sterilized pipette tips. By capturing images, the width of the scratched area was measured at 0, 24, and 48 h. Image J software was used to analyze the migration distance.
4.8. Western blotting (WB)
Cells were lysed in RIPA buffer (Thermo, USA) supplemented with PMSF Protease Inhibitor (Thermo, USA). Protein concentrations were measured using the BCA protein quantification kit (Beyotime, China). Equal amounts of protein extract were loaded onto gels for SDS-PAGE. The proteins were transferred to a PVDF membrane (Millipore, USA), blocked with 5 % non-fat milk for 2 h at 37 °C. The membrane was incubated with indicated primary antibodies at 4 °C overnight, including anti-CDC7 (Abcam, #ab229187, 1:1000) and anti-GAPDH (ZSGB-BIO, #TA-08, 1:1000). Subsequently, secondary antibody against mouse (ZSGB-BIO, #ZB-2305, 1:1000) or rabbit (ZSGB-BIO, #ZB-2301, 1:1000) was incubated for 1 h at room temperate. After washing with TBST, the membranes were visualized using ECL Chemiluminescent Substrate (Thermo, USA). Data were obtained and calculated using Image Lab and ImageJ software. All blots including all replicates with clear membrane edges were provided in Supplementary Figure S3-S9.
4.9. Immunofluorescence
Cells were seeded on coverslips and grown until reaching 50 %-60 % confluence. Next, cells were fixed with 4 % paraformaldehyde for 15 min and incubated with 0.5 % Triton X-100 for 20 min. After blocking with 5 % BSA for 45 min and incubating with anti-CDC7 (Cell Signaling Technology, #3603S, 1:100) overnight at 4 ℃, cells were then incubated with secondary fluorescence-conjugated anti-rabbit IgG H&L (Alexa Fluor® 594) (Abcam, #ab150080, 1:1000) and subsequently counterstained with DAPI (Beyotime, #P0131, China). Images were captured using a confocal laser-scanning microscope (ZEISS LSM880, Germany).
4.10. Immunohistochemistry
HCC tissue samples and adjacent normal tissue samples were post fixed in 4 % paraformaldehyde and prepared as 4-μm-thick sections in PBS. The slides were then placed in an oven, baked at a temperature of 60 °C for a duration of 1 h. Afterward, they were deparaffinized, and rehydrated. Heat mediated antigen retrieval was performed in Tris-EDTA buffer (pH 9.0) in a microwave oven. After cooling to room temperature, endogenous peroxidase activity was inhibited by incubating the sections with 3 % hydrogen peroxide for 15 min. Next, the sections were permeabilized in 0.5 % Triton X-100 for 20 min and blocked in 5 % BSA for 1 h. And then sections were incubated overnight at 4 °C with anti-CDC7 (Abcam, #ab229187, 1:100). After washing with PBS, each section was incubated with a mouse anti-rabbit IgG-HRP (Santa Cruz, #sc-2357, 1:1000) secondary antibody for 45 min. Each section was washed with PBST and developed with DAB solution for 5 min. Sections were restained with hematoxylin and then fixed on slides. CDC7 expression was analyzed using ImageJ software.
4.11. Statistical analysis
All statistical analyses were performed using the GraphPad Prism software (version 10.0). Each experiment was repeated at least thrice. Student's t-test was applied to compare differences between two groups, and one-way analysis of variance (ANOVA) was used for comparisons among the different groups.
Supplementary Materials
The following supporting information can be downloaded at: www.mdpi.com/xxx/s1.
Author Contributions
Conceptualization, X.K. and Ya.L.; methodology, X.Y.; software, J.Q. and K.Y.; validation, X.K., Ya.L. and X.Y.; formal analysis, Z.L., Y.W. and W.L.; investigation, Yu.L., Yi.L. and Y.Z.; resources, C.B. and A.Z.; data curation, X.K.; writing—original draft preparation, X.K.; writing—review and editing, X.K. and A.Z.; visualization, X.K., Ya.L. and X.Y.; supervision, C.B. and A.Z.; project administration, C.B. and A.Z.; funding acquisition, A.Z. All authors have read and agreed to the published version of the manuscript.
Funding
This research was funded by the National Natural Science Foundation of China (No.82072267), Futian Healthcare Research Project (No.FTWS013), and Sun Yat-Sen Eighth Affiliated Hospital Clinical Research Program (No.ZDBY-IIT-202304-055).
Institutional Review Board Statement
The study was conducted in accordance with the Declaration of Helsinki, and approved by the Ethics Committee of the Eighth Affiliated Hospital of Sun Yet-sen University (Shenzhen, China) (Protocol code: ZB-KYIRB-AF/SC-06/01.0; Approval date: August 2022).
Informed Consent Statement
Written informed consent has been obtained from the patients to publish this paper.
Data Availability Statement
All supporting data are included within the article, and all the data generated in this article are available from the corresponding authors on reasonable request.
Acknowledgments
We would like to thank Dr. Dequan Yang, The Eighth Affiliated Hospital, Sun Yat-sen University, for providing SMMC-7721 cells.
Conflicts of Interest
The authors declare no conflicts of interest.
References
- Hepatocellular Carcinoma. Nat Rev Dis Primers 2021, 7, 7. [CrossRef]
- Lefeuvre, C.; Le Guillou-Guillemette, H.; Ducancelle, A. A Pleiotropic Role of the Hepatitis B Virus Core Protein in Hepatocarcinogenesis. Int J Mol Sci 2021, 22, 13651. [Google Scholar] [CrossRef]
- Diab, A.; Foca, A.; Zoulim, F.; Durantel, D.; Andrisani, O. The Diverse Functions of the Hepatitis B Core/Capsid Protein (HBc) in the Viral Life Cycle: Implications for the Development of HBc-Targeting Antivirals. Antiviral Res 2018, 149, 211–220. [Google Scholar] [CrossRef] [PubMed]
- Bouchard, M.J.; Schneider, R.J. The Enigmatic X Gene of Hepatitis B Virus. J Virol 2004, 78, 12725–12734. [Google Scholar] [CrossRef]
- Chaturvedi, V.K.; Singh, A.; Dubey, S.K.; Hetta, H.F.; John, J.; Singh, M.P. Molecular Mechanistic Insight of Hepatitis B Virus Mediated Hepatocellular Carcinoma. Microb Pathog 2019, 128, 184–194. [Google Scholar] [CrossRef]
- Cui, M.; Xiao, Z.; Wang, Y.; Zheng, M.; Song, T.; Cai, X.; Sun, B.; Ye, L.; Zhang, X. Long Noncoding RNA HULC Modulates Abnormal Lipid Metabolism in Hepatoma Cells through an miR-9-Mediated RXRA Signaling Pathway. Cancer Res 2015, 75, 846–857. [Google Scholar] [CrossRef]
- Spizzo, R.; Almeida, M.I.; Colombatti, A.; Calin, G.A. Long Non-Coding RNAs and Cancer: A New Frontier of Translational Research? Oncogene 2012, 31, 4577–4587. [Google Scholar] [CrossRef]
- Singh, D.; Assaraf, Y.G.; Gacche, R.N. Long Non-Coding RNA Mediated Drug Resistance in Breast Cancer. Drug Resist Updat 2022, 63, 100851. [Google Scholar] [CrossRef]
- Bhan, A.; Soleimani, M.; Mandal, S.S. Long Noncoding RNA and Cancer: A New Paradigm. Cancer Res 2017, 77, 3965–3981. [Google Scholar] [CrossRef]
- Fan, J.; Xu, Y.; Wen, X.; Ge, S.; Jia, R.; Zhang, H.; Fan, X. A Cohesin-Mediated Intrachromosomal Loop Drives Oncogenic ROR lncRNA to Accelerate Tumorigenesis. Mol Ther 2019, 27, 2182–2194. [Google Scholar] [CrossRef]
- Chen, C.; Luo, Y.; He, W.; Zhao, Y.; Kong, Y.; Liu, H.; Zhong, G.; Li, Y.; Li, J.; Huang, J.; et al. Exosomal Long Noncoding RNA LNMAT2 Promotes Lymphatic Metastasis in Bladder Cancer. J Clin Invest 2020, 130, 404–421. [Google Scholar] [CrossRef]
- L, S.; L, P.; Y, T.; L, K.; Pp, P. A ceRNA Hypothesis: The Rosetta Stone of a Hidden RNA Language? Cell 2011, 146. [Google Scholar] [CrossRef]
- Majumdar, S.; Chakraborty, A.; Das, S.; Gorain, M.; Chatterjee, S.; Dey, I.; Bhowmik, S.; Ghosh, S.; Banerjee, S.; Ahammed, S.M.; et al. Sponging of Five Tumour Suppressor miRNAs by lncRNA-KCNQ1OT1 Activates BMPR1A/BMPR1B-ACVR2A/ACVR2B Signalling and Promotes Chemoresistance in Hepatocellular Carcinoma. Cell Death Discov 2024, 10, 274. [Google Scholar] [CrossRef]
- Zhan, K.; Pan, H.; Zhou, Z.; Tang, W.; Ye, Z.; Huang, S.; Luo, L. Biological Role of Long Non-Coding RNA KCNQ1OT1 in Cancer Progression. Biomed Pharmacother 2023, 169, 115876. [Google Scholar] [CrossRef]
- Wan, J.; Huang, M.; Zhao, H.; Wang, C.; Zhao, X.; Jiang, X.; Bian, S.; He, Y.; Gao, Y. A Novel Tetranucleotide Repeat Polymorphism within KCNQ1OT1 Confers Risk for Hepatocellular Carcinoma. DNA Cell Biol 2013, 32, 628–634. [Google Scholar] [CrossRef]
- Mukherjee, A.; Acharya, P.B.; Singh, A.; Kuppusamy Selvam, M. Identification of Therapeutic miRNAs from the Arsenic Induced Gene Expression Profile of Hepatocellular Carcinoma. Chem Biol Drug Des 2023, 101, 1027–1041. [Google Scholar] [CrossRef]
- Wang, F.; Li, L.; Piontek, K.; Sakaguchi, M.; Selaru, F.M. Exosome miR-335 as a Novel Therapeutic Strategy in Hepatocellular Carcinoma. Hepatology 2018, 67, 940–954. [Google Scholar] [CrossRef]
- Guo, Y.; Wang, J.; Benedict, B.; Yang, C.; van Gemert, F.; Ma, X.; Gao, D.; Wang, H.; Zhang, S.; Lieftink, C.; et al. Targeting CDC7 Potentiates ATR-CHK1 Signaling Inhibition through Induction of DNA Replication Stress in Liver Cancer. Genome Med 2021, 13, 166. [Google Scholar] [CrossRef]
- Montagnoli, A.; Moll, J.; Colotta, F. Targeting Cell Division Cycle 7 Kinase: A New Approach for Cancer Therapy. Clin Cancer Res 2010, 16, 4503–4508. [Google Scholar] [CrossRef]
- Wang, M.; Qiu, Z.-H.; Wang, Y.-Z.; Lian, B.; Bai, J.-K.; Zhou, Y.-J.; Ji, H.-J. Analysis of the Expression and Prognostic Significance of DDK Complex in Hepatocarcinoma. BMC Cancer 2023, 23, 19. [Google Scholar] [CrossRef]
- Zhuang, L.; Yang, Z.; Meng, Z. Upregulation of BUB1B, CCNB1, CDC7, CDC20, and MCM3 in Tumor Tissues Predicted Worse Overall Survival and Disease-Free Survival in Hepatocellular Carcinoma Patients. Biomed Res Int 2018, 2018, 7897346. [Google Scholar] [CrossRef]
- Sung, H.; Ferlay, J.; Siegel, R.L.; Laversanne, M.; Soerjomataram, I.; Jemal, A.; Bray, F. Global Cancer Statistics 2020: GLOBOCAN Estimates of Incidence and Mortality Worldwide for 36 Cancers in 185 Countries. CA: a cancer journal for clinicians 2021, 71, 209–249. [Google Scholar] [CrossRef]
- Xu, J.; Xu, J.; Liu, X.; Jiang, J. The Role of lncRNA-Mediated ceRNA Regulatory Networks in Pancreatic Cancer. Cell Death Discov 2022, 8, 287. [Google Scholar] [CrossRef]
- Koltun, E.S.; Tsuhako, A.L.; Brown, D.S.; Aay, N.; Arcalas, A.; Chan, V.; Du, H.; Engst, S.; Ferguson, K.; Franzini, M.; et al. Discovery of XL413, a Potent and Selective CDC7 Inhibitor. Bioorg Med Chem Lett 2012, 22, 3727–3731. [Google Scholar] [CrossRef] [PubMed]
- Chen, W.; Jiang, J.; Gong, L.; Shu, Z.; Xiang, D.; Zhang, X.; Bi, K.; Diao, H. Hepatitis B Virus P Protein Initiates Glycolytic Bypass in HBV-Related Hepatocellular Carcinoma via a FOXO3/miRNA-30b-5p/MINPP1 Axis. J Exp Clin Cancer Res 2021, 40, 1. [Google Scholar] [CrossRef]
- Xu, C.; Zhou, W.; Wang, Y.; Qiao, L. Hepatitis B Virus-Induced Hepatocellular Carcinoma. Cancer Lett 2014, 345, 216–222. [Google Scholar] [CrossRef]
- Basagoudanavar, S.H.; Perlman, D.H.; Hu, J. Regulation of Hepadnavirus Reverse Transcription by Dynamic Nucleocapsid Phosphorylation. J Virol 2007, 81, 1641–1649. [Google Scholar] [CrossRef]
- Rabe, B.; Vlachou, A.; Panté, N.; Helenius, A.; Kann, M. Nuclear Import of Hepatitis B Virus Capsids and Release of the Viral Genome. Proc Natl Acad Sci U S A 2003, 100, 9849–9854. [Google Scholar] [CrossRef] [PubMed]
- Zlotnick, A.; Venkatakrishnan, B.; Tan, Z.; Lewellyn, E.; Turner, W.; Francis, S. Core Protein: A Pleiotropic Keystone in the HBV Lifecycle. Antiviral Res 2015, 121, 82–93. [Google Scholar] [CrossRef]
- Kwon, J.A.; Rho, H.M. Transcriptional Repression of the Human P53 Gene by Hepatitis B Viral Core Protein (HBc) in Human Liver Cells. Biol Chem 2003, 384, 203–212. [Google Scholar] [CrossRef] [PubMed]
- Du, J.; Liang, X.; Liu, Y.; Qu, Z.; Gao, L.; Han, L.; Liu, S.; Cui, M.; Shi, Y.; Zhang, Z.; et al. Hepatitis B Virus Core Protein Inhibits TRAIL-Induced Apoptosis of Hepatocytes by Blocking DR5 Expression. Cell Death Differ 2009, 16, 219–229. [Google Scholar] [CrossRef] [PubMed]
- Du, J.; Bai, F.; Zhao, P.; Li, X.; Li, X.; Gao, L.; Ma, C.; Liang, X. Hepatitis B Core Protein Promotes Liver Cancer Metastasis through miR-382-5p/DLC-1 Axis. Biochim Biophys Acta Mol Cell Res 2018, 1865, 1–11. [Google Scholar] [CrossRef] [PubMed]
- Huang, Z.; Zhou, J.-K.; Peng, Y.; He, W.; Huang, C. The Role of Long Noncoding RNAs in Hepatocellular Carcinoma. Mol Cancer 2020, 19, 77. [Google Scholar] [CrossRef] [PubMed]
- Zhang, Y.; Luo, M.; Cui, X.; O’Connell, D.; Yang, Y. Long Noncoding RNA NEAT1 Promotes Ferroptosis by Modulating the miR-362-3p/MIOX Axis as a ceRNA. Cell Death Differ 2022, 29, 1850–1863. [Google Scholar] [CrossRef]
- Zhao, L.; Hu, K.; Cao, J.; Wang, P.; Li, J.; Zeng, K.; He, X.; Tu, P.-F.; Tong, T.; Han, L. lncRNA Miat Functions as a ceRNA to Upregulate Sirt1 by Sponging miR-22-3p in HCC Cellular Senescence. Aging (Albany NY) 2019, 11, 7098–7122. [Google Scholar] [CrossRef] [PubMed]
- Wei, Y.; Wang, Z.; Zong, Y.; Deng, D.; Chen, P.; Lu, J. LncRNA MFI2-AS1 Promotes HCC Progression and Metastasis by Acting as a Competing Endogenous RNA of miR-134 to Upregulate FOXM1 Expression. Biomed Pharmacother 2020, 125, 109890. [Google Scholar] [CrossRef]
- Xia, F.; Wang, Y.; Xue, M.; Zhu, L.; Jia, D.; Shi, Y.; Gao, Y.; Li, L.; Li, Y.; Chen, S.; et al. LncRNA KCNQ1OT1: Molecular Mechanisms and Pathogenic Roles in Human Diseases. Genes Dis 2022, 9, 1556–1565. [Google Scholar] [CrossRef]
- Zhan, K.; Pan, H.; Zhou, Z.; Tang, W.; Ye, Z.; Huang, S.; Luo, L. Biological Role of Long Non-Coding RNA KCNQ1OT1 in Cancer Progression. Biomed Pharmacother 2023, 169, 115876. [Google Scholar] [CrossRef]
- Jl, C.; Dj, L.; My, L.; Yj, P.; Xj, Z.; L, L.; Xy, L.; Ah, F. LncRNA KCNQ1OT1 Regulates the Invasion and Migration of Hepatocellular Carcinoma by Acting on S1PR1 through miR-149. Cancer gene therapy 2021, 28. [Google Scholar] [CrossRef]
- Zhang, N.; Li, X.S.; Zhang, Y.; Cheng, S.F.; Du, J.X.; Liu, J.P. Long Noncoding RNA KCNQ1OT1 Promotes Cell Motility in Hepatocellular Carcinoma by Regulating miR-506-3p/FOXQ1. J Biol Regul Homeost Agents 2020, 34, 943–952. [Google Scholar] [CrossRef]
- Li, C.; Miao, R.; Zhang, J.; Qu, K.; Liu, C. Long Non-Coding RNA KCNQ1OT1 Mediates the Growth of Hepatocellular Carcinoma by Functioning as a Competing Endogenous RNA of miR-504. Int J Oncol 2018, 52, 1603–1612. [Google Scholar] [CrossRef]
- Xu, G.; Zhu, Y.; Liu, H.; Liu, Y.; Zhang, X. Long Non-Coding RNA KCNQ1OT1 Promotes Progression of Hepatocellular Carcinoma by miR-148a-3p/IGF1R Axis. Technol Cancer Res Treat 2020, 19, 1533033820980117. [Google Scholar] [CrossRef]
- Li, H.-W.; Liu, J. Circ_0009910 Promotes Proliferation and Metastasis of Hepatocellular Carcinoma Cells through miR-335-5p/ROCK1 Axis. Eur Rev Med Pharmacol Sci 2020, 24, 1725–1735. [Google Scholar] [CrossRef] [PubMed]
- Nie, Y.; Zhu, X.; Bu, N.; Jiang, Y.; Su, Y.; Pan, K.; Li, S. Circ_0064288 Acts as an Oncogene of Hepatocellular Carcinoma Cells by Inhibiting miR-335-5p Expression and Promoting ROCK1 Expression. BMC Cancer 2022, 22, 265. [Google Scholar] [CrossRef] [PubMed]
- Suski, J.M.; Ratnayeke, N.; Braun, M.; Zhang, T.; Strmiska, V.; Michowski, W.; Can, G.; Simoneau, A.; Snioch, K.; Cup, M.; et al. CDC7-Independent G1/S Transition Revealed by Targeted Protein Degradation. Nature 2022, 605, 357–365. [Google Scholar] [CrossRef] [PubMed]
- Wang, C.; Vegna, S.; Jin, H.; Benedict, B.; Lieftink, C.; Ramirez, C.; de Oliveira, R.L.; Morris, B.; Gadiot, J.; Wang, W.; et al. Inducing and Exploiting Vulnerabilities for the Treatment of Liver Cancer. Nature 2019, 574, 268–272. [Google Scholar] [CrossRef] [PubMed]
- Rodriguez-Acebes, S.; Proctor, I.; Loddo, M.; Wollenschlaeger, A.; Rashid, M.; Falzon, M.; Prevost, A.T.; Sainsbury, R.; Stoeber, K.; Williams, G.H. Targeting DNA Replication before It Starts: Cdc7 as a Therapeutic Target in P53-Mutant Breast Cancers. Am J Pathol 2010, 177, 2034–2045. [Google Scholar] [CrossRef] [PubMed]
- Bonte, D.; Lindvall, C.; Liu, H.; Dykema, K.; Furge, K.; Weinreich, M. Cdc7-Dbf4 Kinase Overexpression in Multiple Cancers and Tumor Cell Lines Is Correlated with P53 Inactivation. Neoplasia 2008, 10, 920–931. [Google Scholar] [CrossRef]
- Li, W.; Zhao, X.-L.; Shang, S.-Q.; Shen, H.-Q.; Chen, X. Dual Inhibition of Cdc7 and Cdk9 by PHA-767491 Suppresses Hepatocarcinoma Synergistically with 5-Fluorouracil. Curr Cancer Drug Targets 2015, 15, 196–204. [Google Scholar] [CrossRef]
- Yu, G.; Wang, L.-G.; Han, Y.; He, Q.-Y. clusterProfiler: An R Package for Comparing Biological Themes among Gene Clusters. OMICS 2012, 16, 284–287. [Google Scholar] [CrossRef] [PubMed]
Figure 1.
Construction of DE lncRNA-miRNA-mRNA regulatory network for HCC. Volcano plots of DE lncRNAs (A), miRNAs (B), and mRNAs (C) in HCC and normal tissues from the TCGA database. Red dots: upregulated (log2FC > 0.5, FDR < 0.05); green dots: downregulated (log2FC < -0.5, FDR < 0.05). FC, fold change. FDR, false discovery rate. (D) Top 10 KEGG enrichment terms for DE mRNAs. (E) Visualization of the ceRNA network for DE lncRNA-miRNA-mRNA using the Cytoscape. LncRNA: rectangles; miRNA: ellipses; mRNA: diamonds. Kaplan-Meier survival curves for KCNQ1OT1 (F) and CDC7 (G) expression using GEPIA 2 (p < 0.05). Analyses of KCNQ1OT1 (H), miR-335 (I), and CDC7 (J) expression in different tumor grades using UALCAN. Grade 1: well-differentiated; Grade 2: moderately differentiated; Grade 3: poorly differentiated; Grade 4: undifferentiated.
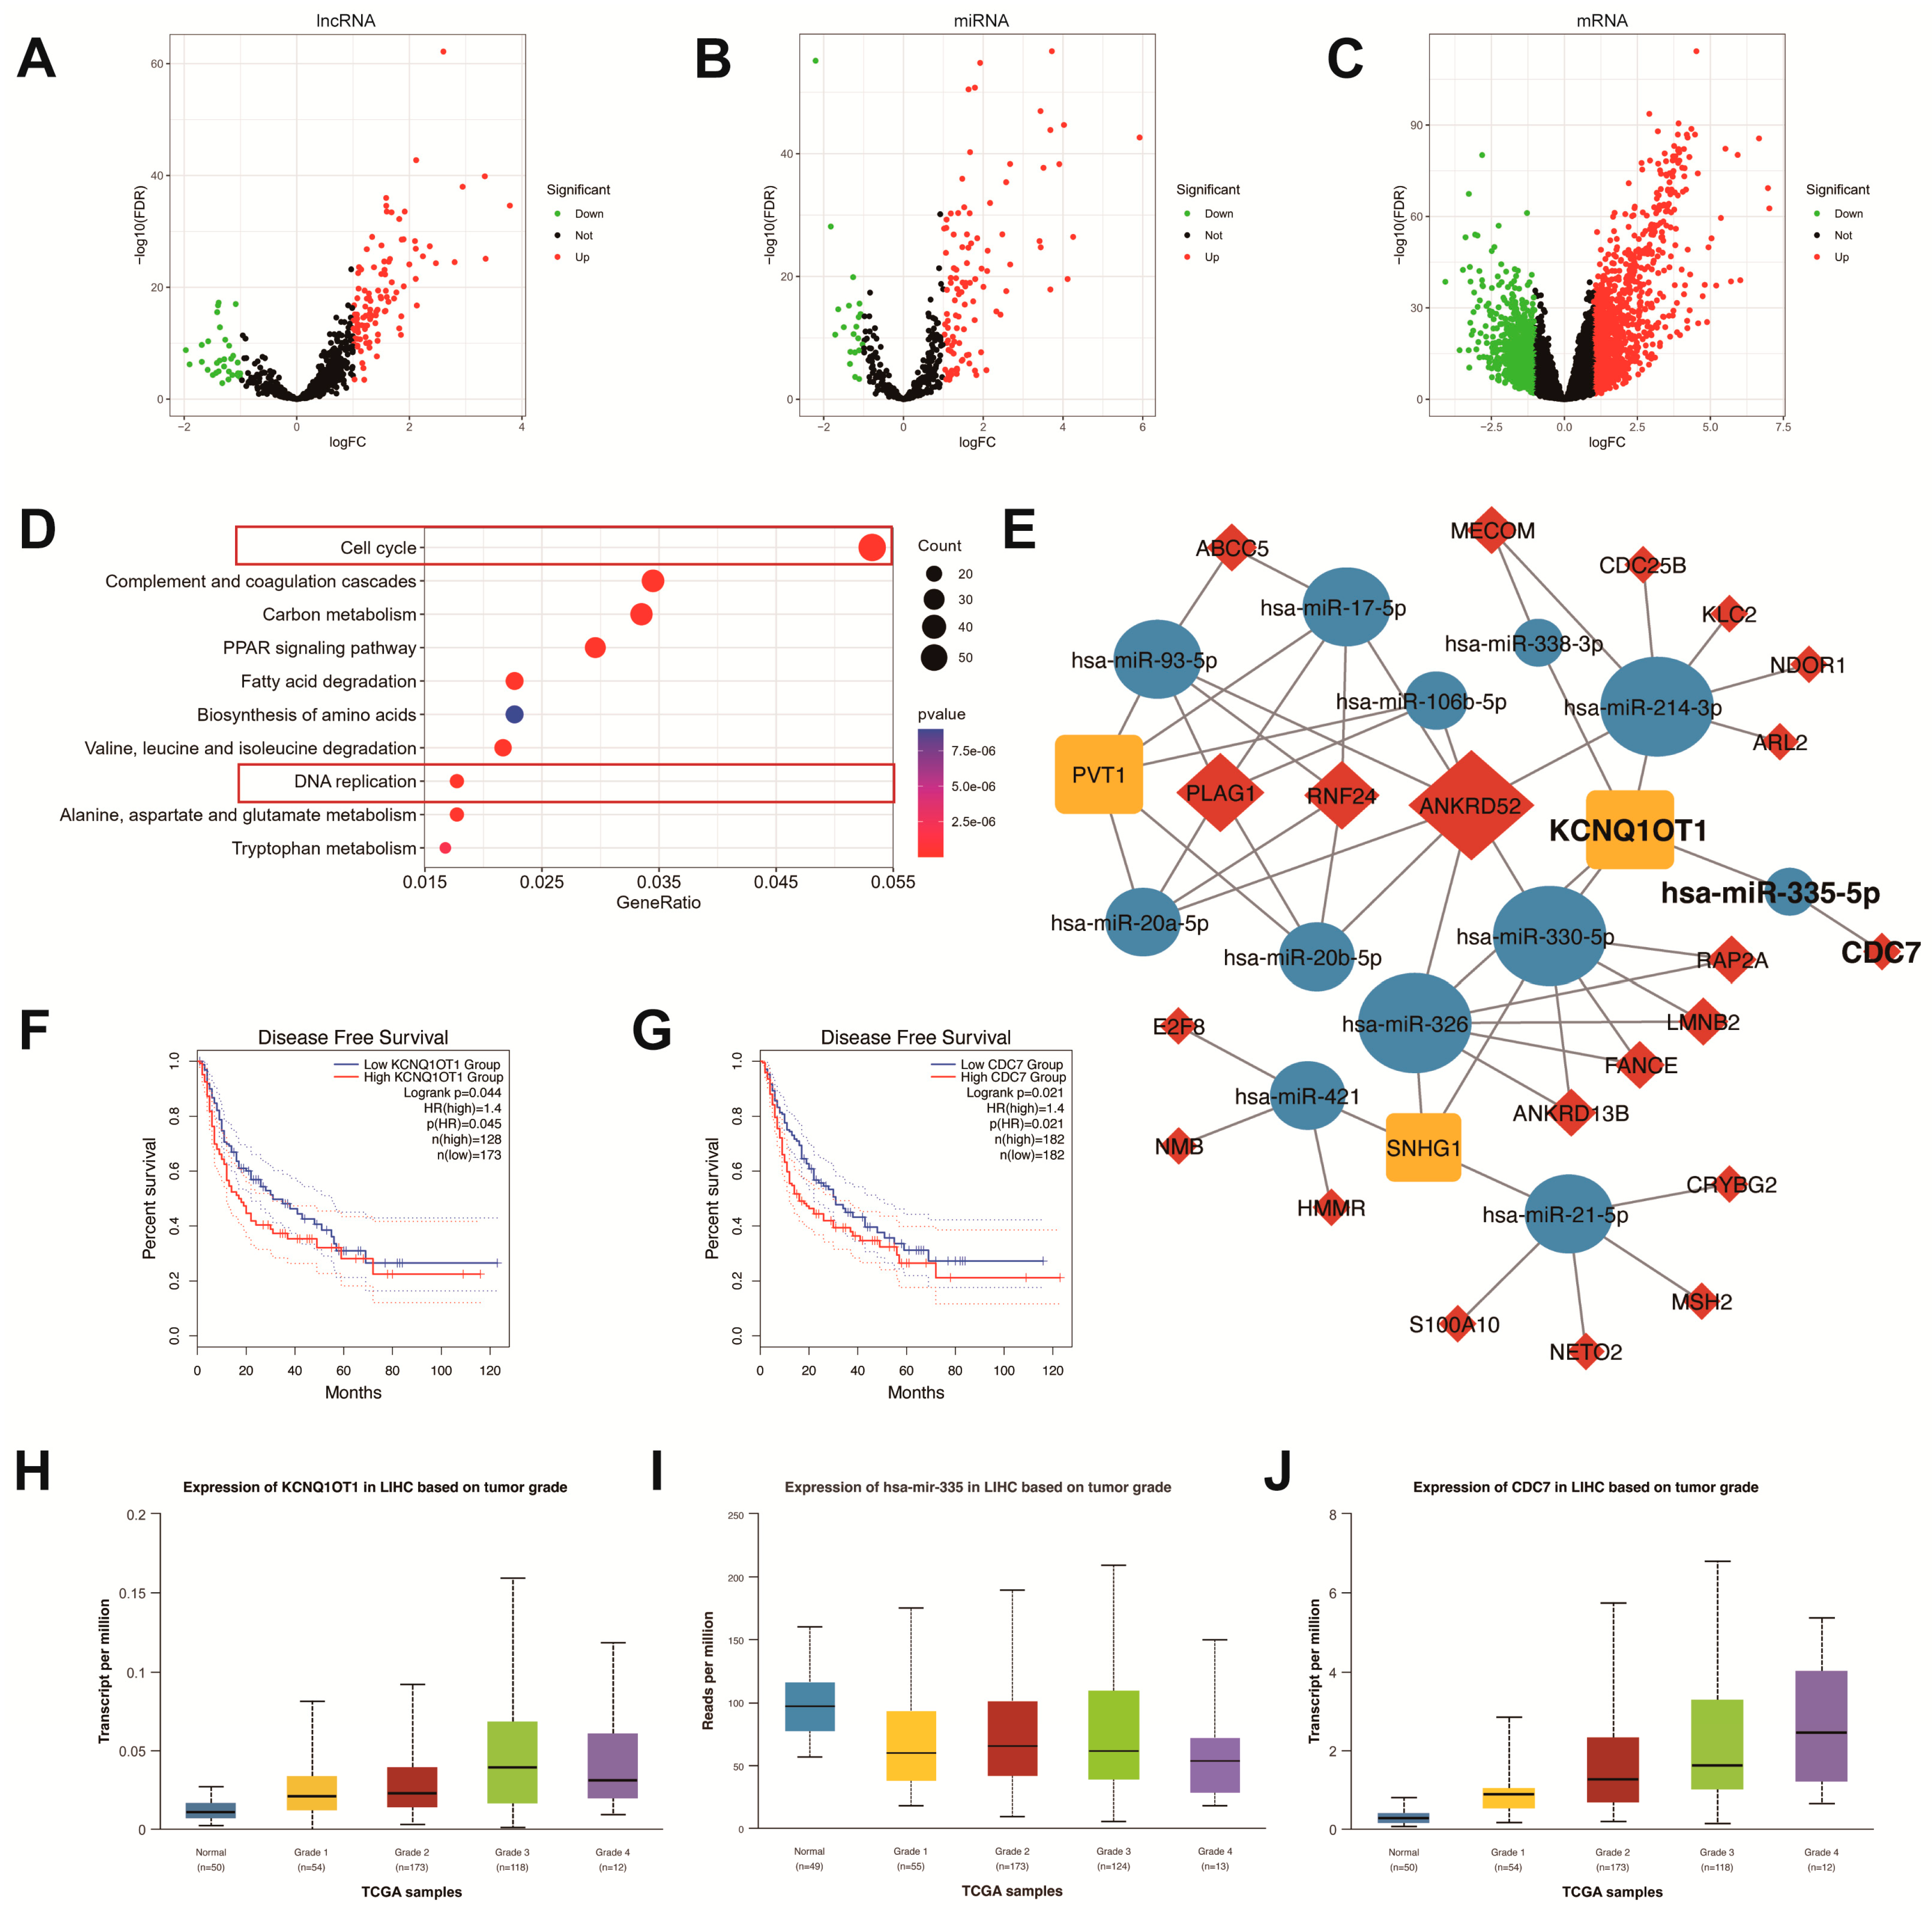
Figure 1.
Roadmap of lncRNA-miRNA-mRNA regulatory axis construction and validation.
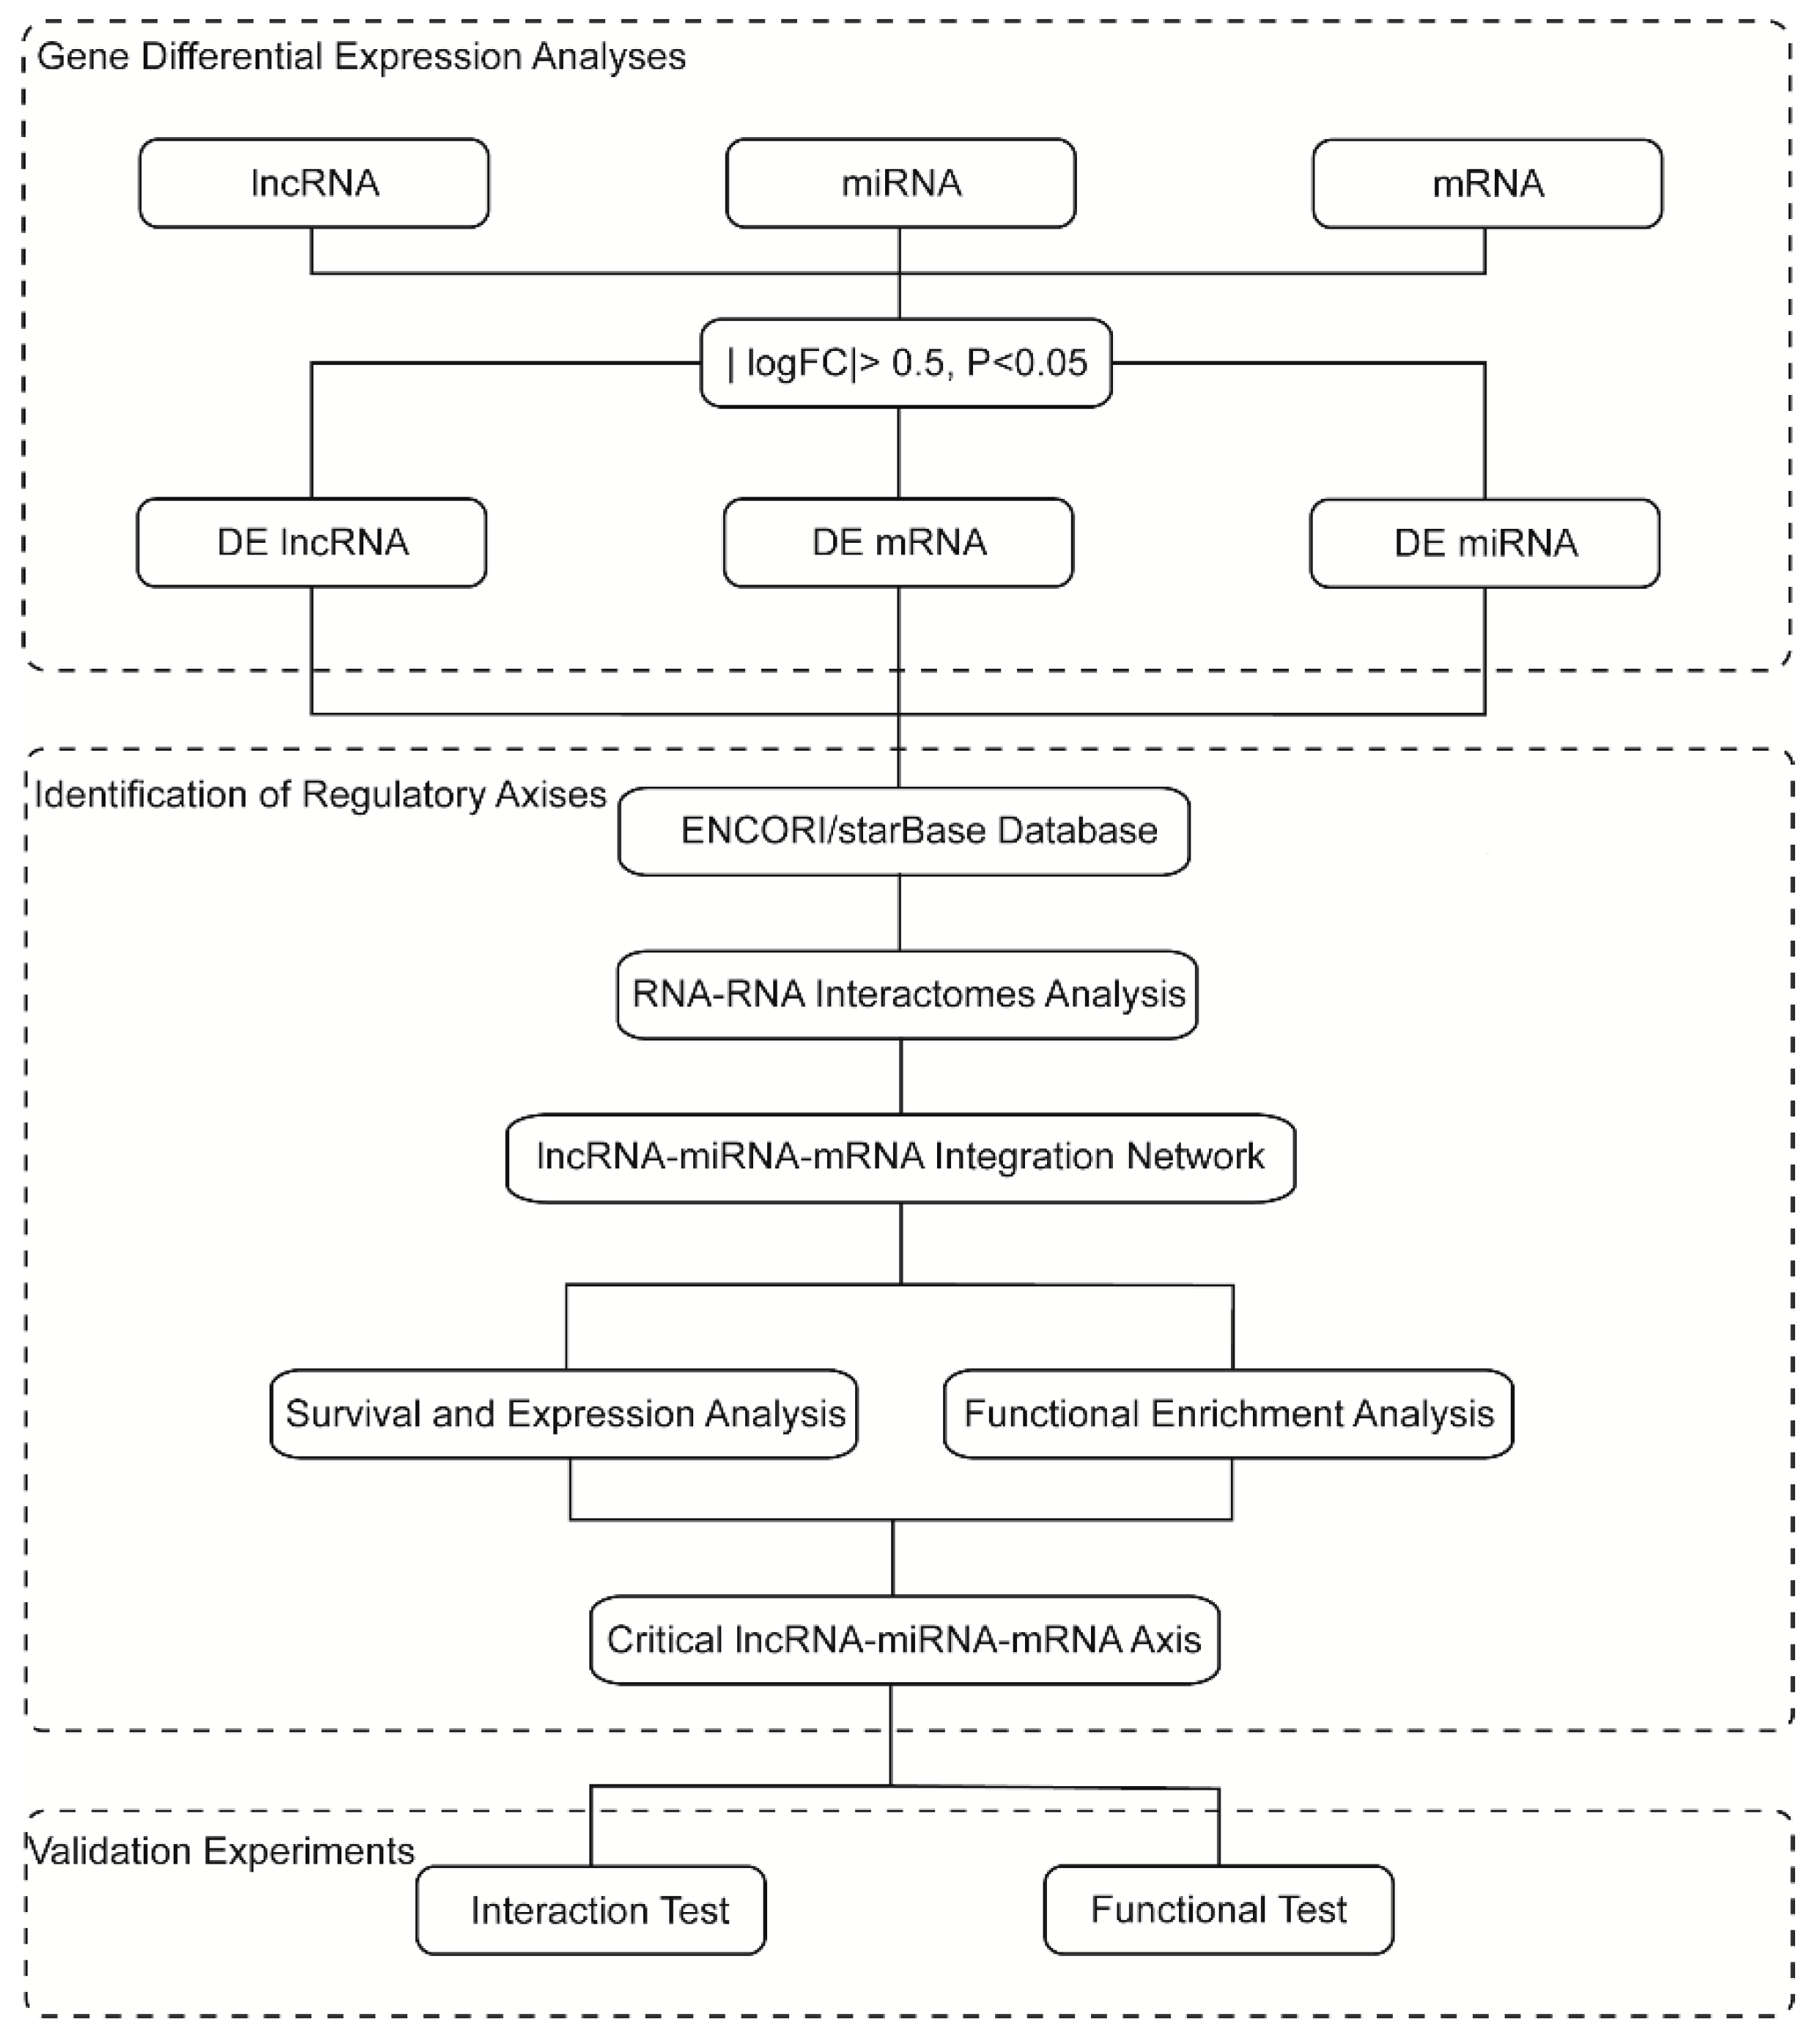
Figure 3.
KCNQ1OT1 promotes proliferation and migration of HCC cells by negatively regulating miR-335-5p. (A) The expression of miR-335-5p in SMMC-7721 cells after KCNQ1OT1 knockdown by RT-qPCR. (B) The binding sites of KCNQ1OT1 to miR-335-5p predicted by RNAhybrid. mfe: minimum free energy. (C) Luciferase reporter assay was used to verify the targeted binding effect between miR-335-5p and WT-KCNQ1OT1 or MUT-KCNQ1OT1 in SMMC-7721 cells. (D) CCK-8 assay of SMMC-7721 cells transfected with si-NC, si-KCNQ1OT1, or co-transfected with si-KCNQ1OT1 and miR-335-5p inhibitors. *p: si-KCNQ1OT1 vs. si-NC; #p: si-KCNQ1OT1 and miR-335-5p inhibitors vs. si-KCNQ1OT1. Colony formation assay (E) and wound healing assay (F) of SMMC-7721 cells transfected with si-NC, si-KCNQ1OT1, or co-transfected with si-KCNQ1OT1 and miR-335-5p inhibitors. *p<0.05, ***p < 0.001, ****p < 0.0001, ## p < 0.01, #### p <0.0001.
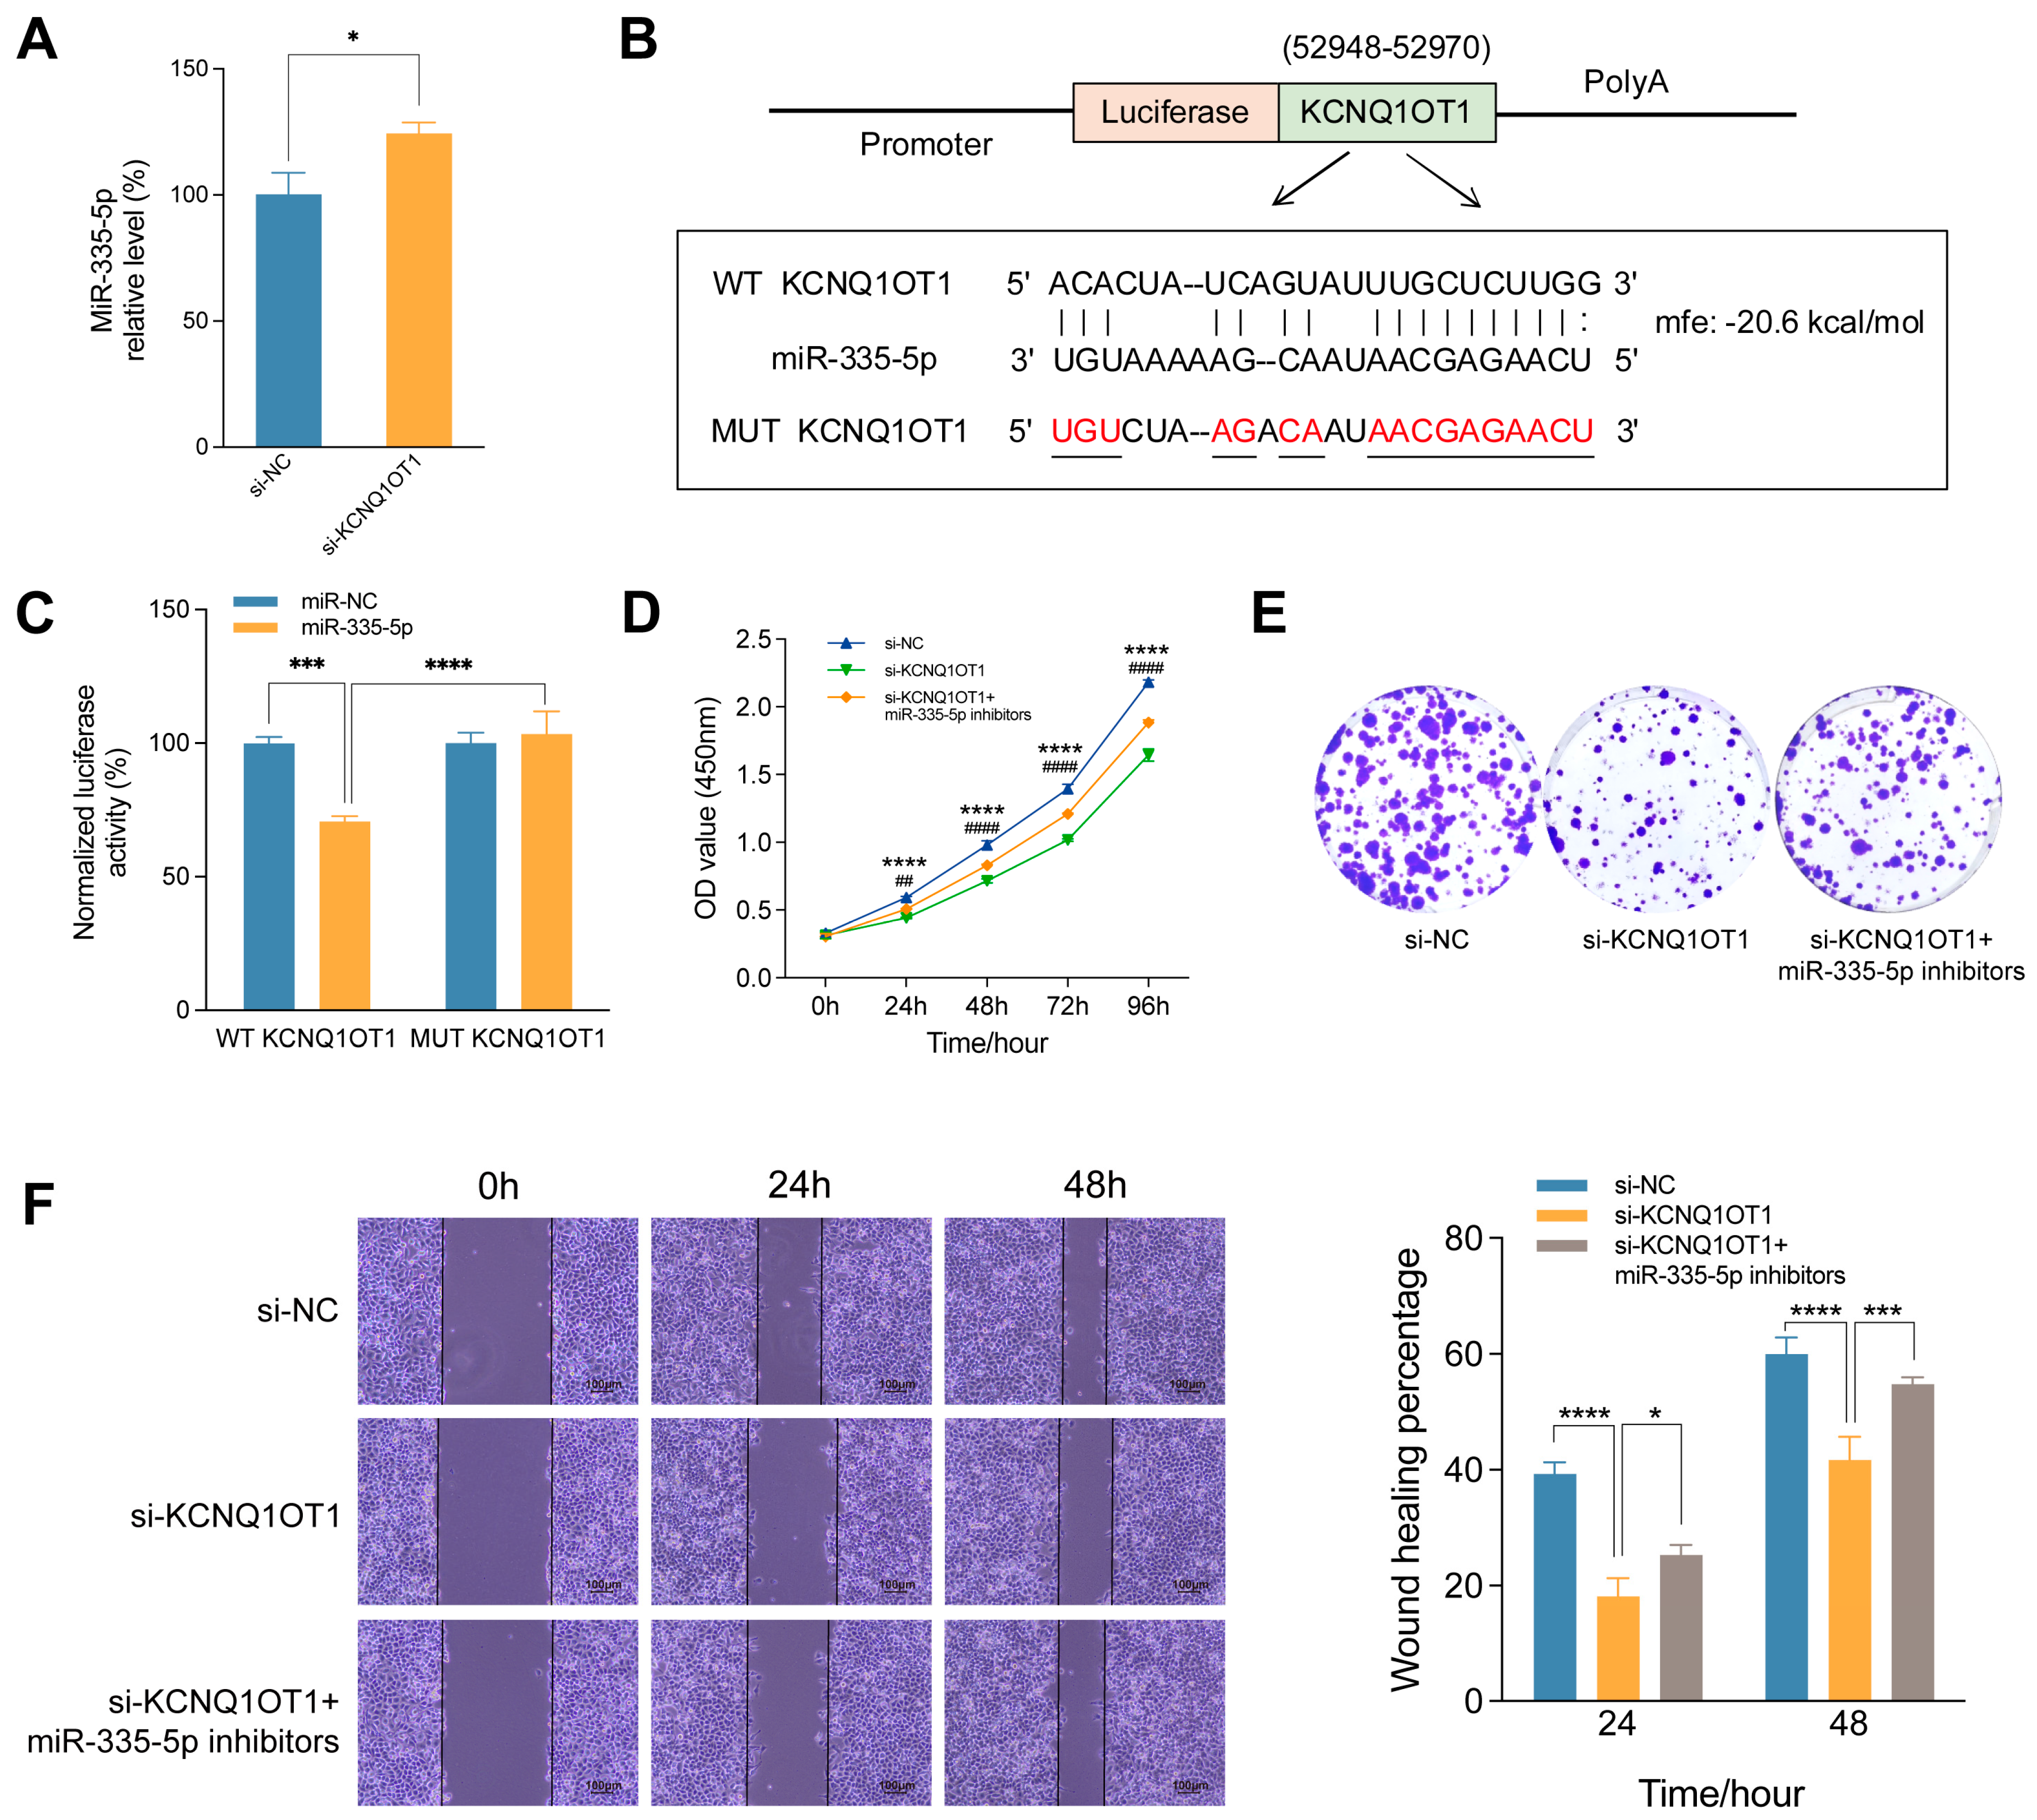
Figure 4.
MiR-335-5p inhibits proliferation and migration of HCC cells. CCK-8 assay (A), cell colony formation assay (B), and wound healing assay (C) of SMMC-7721 cells transfected with miR-NC, miR-335-5p mimics or co-transfected with miR-335-5p mimics and inhibitors. *p: miR-335-5p mimics vs. miR-NC; #p: miR-335-5p mimics and inhibitors vs. miR-335-5p mimics. CCK-8 assay (D), cell colony formation assay (E), and wound healing assay (F) of SMMC-7721 cells transfected with miR-NC and miR-335-5p inhibitors. **p < 0.01, ****p < 0.0001, #p < 0.05, ###p < 0.001, ####p <0.0001.
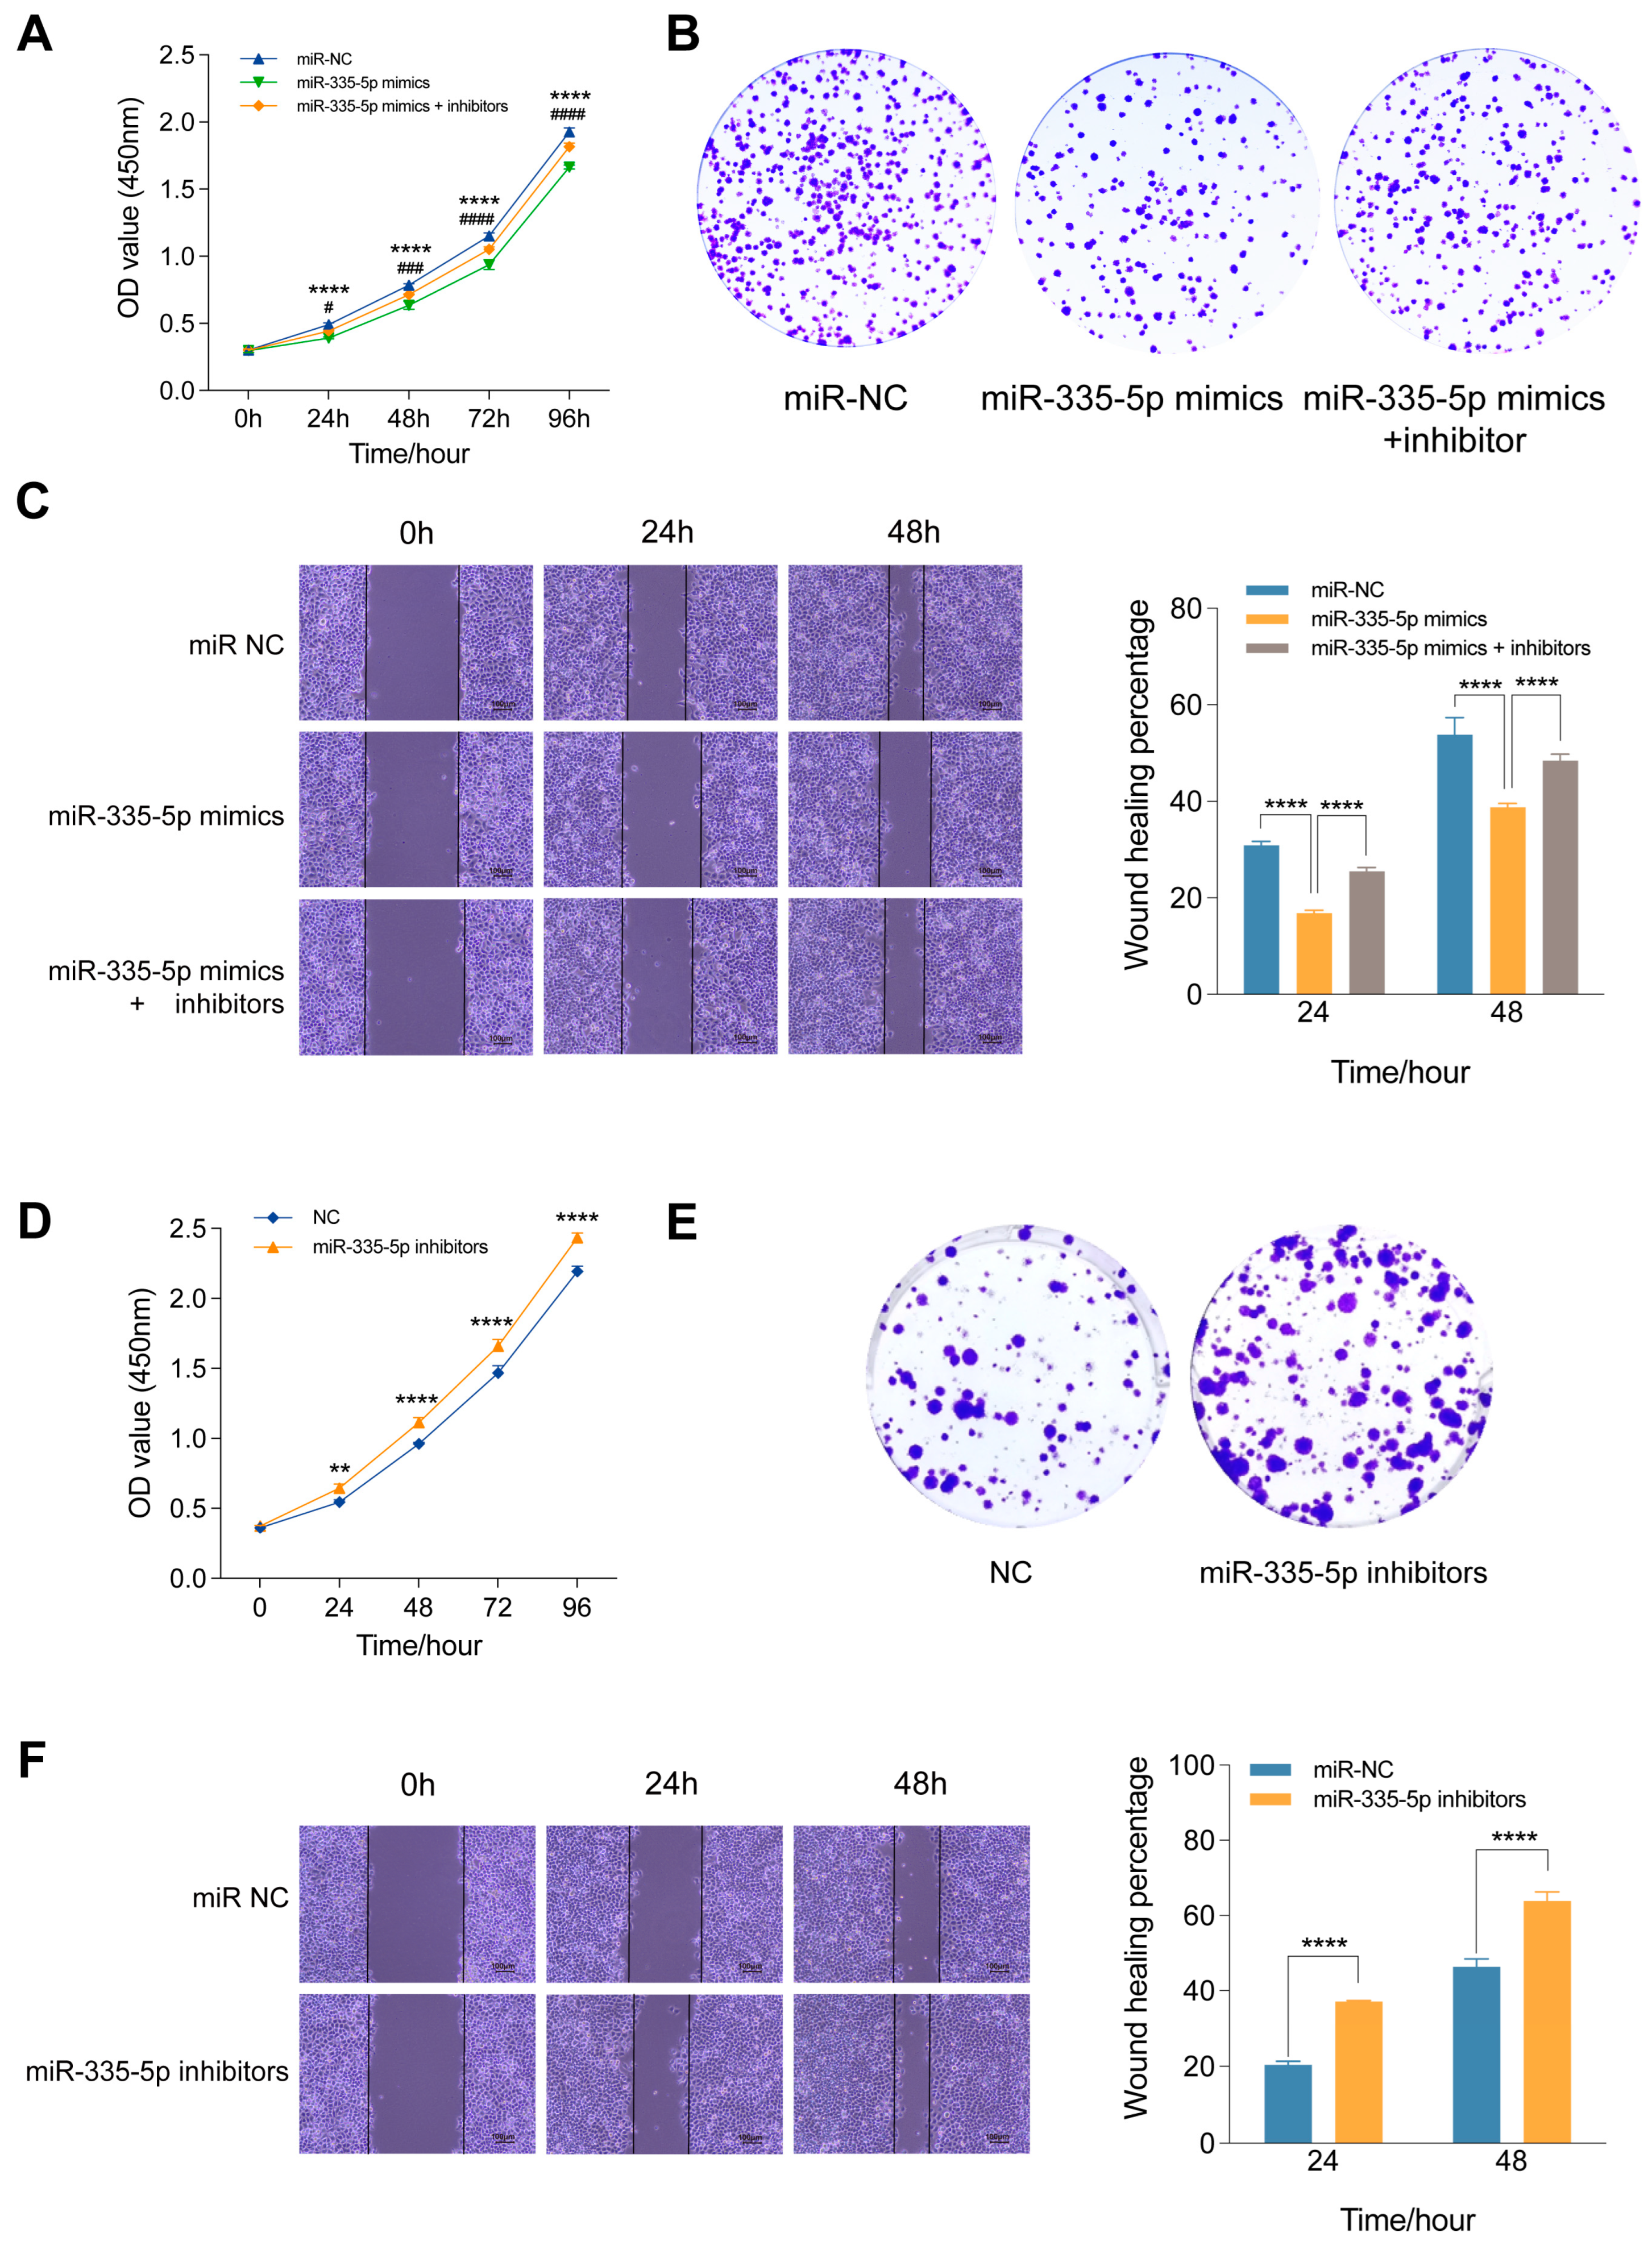
Figure 5.
The expression of CDC7 was regulated by miR-335-5p negatively. (A) The binding sites of miR-335-5p to CDC7 predicted by RNAhybrid. (B) Luciferase reporter assay was used to verify the targeted binding effect between miR-335-5p and WT-CDC7 or MUT-CDC7 in SMMC-7721 cells. (C)The expression of miR-335-5p in SMMC-7721 cells transfected with miR-335-5p mimics or co-transfected with miR-335-5p mimics and inhibitors using RT-qPCR analysis. (D) The expression of miR-335-5p in SMMC-7721 cells transfected with miR-335-5p inhibitors using RT-qPCR analysis. The RT-qPCR (E), WB (F), and immunofluorescence assay (G) of CDC7 level in SMMC-7721 cells transfected with miR-335-5p mimics or co-transfected with miR-335-5p mimics and inhibitors. The RT-qPCR (H), WB (I), and immunofluorescence assay (J) of CDC7 level in SMMC-7721 cells transfected with miR-335-5p inhibitors. **p<0.01, ***p < 0.001, ****p < 0.0001.
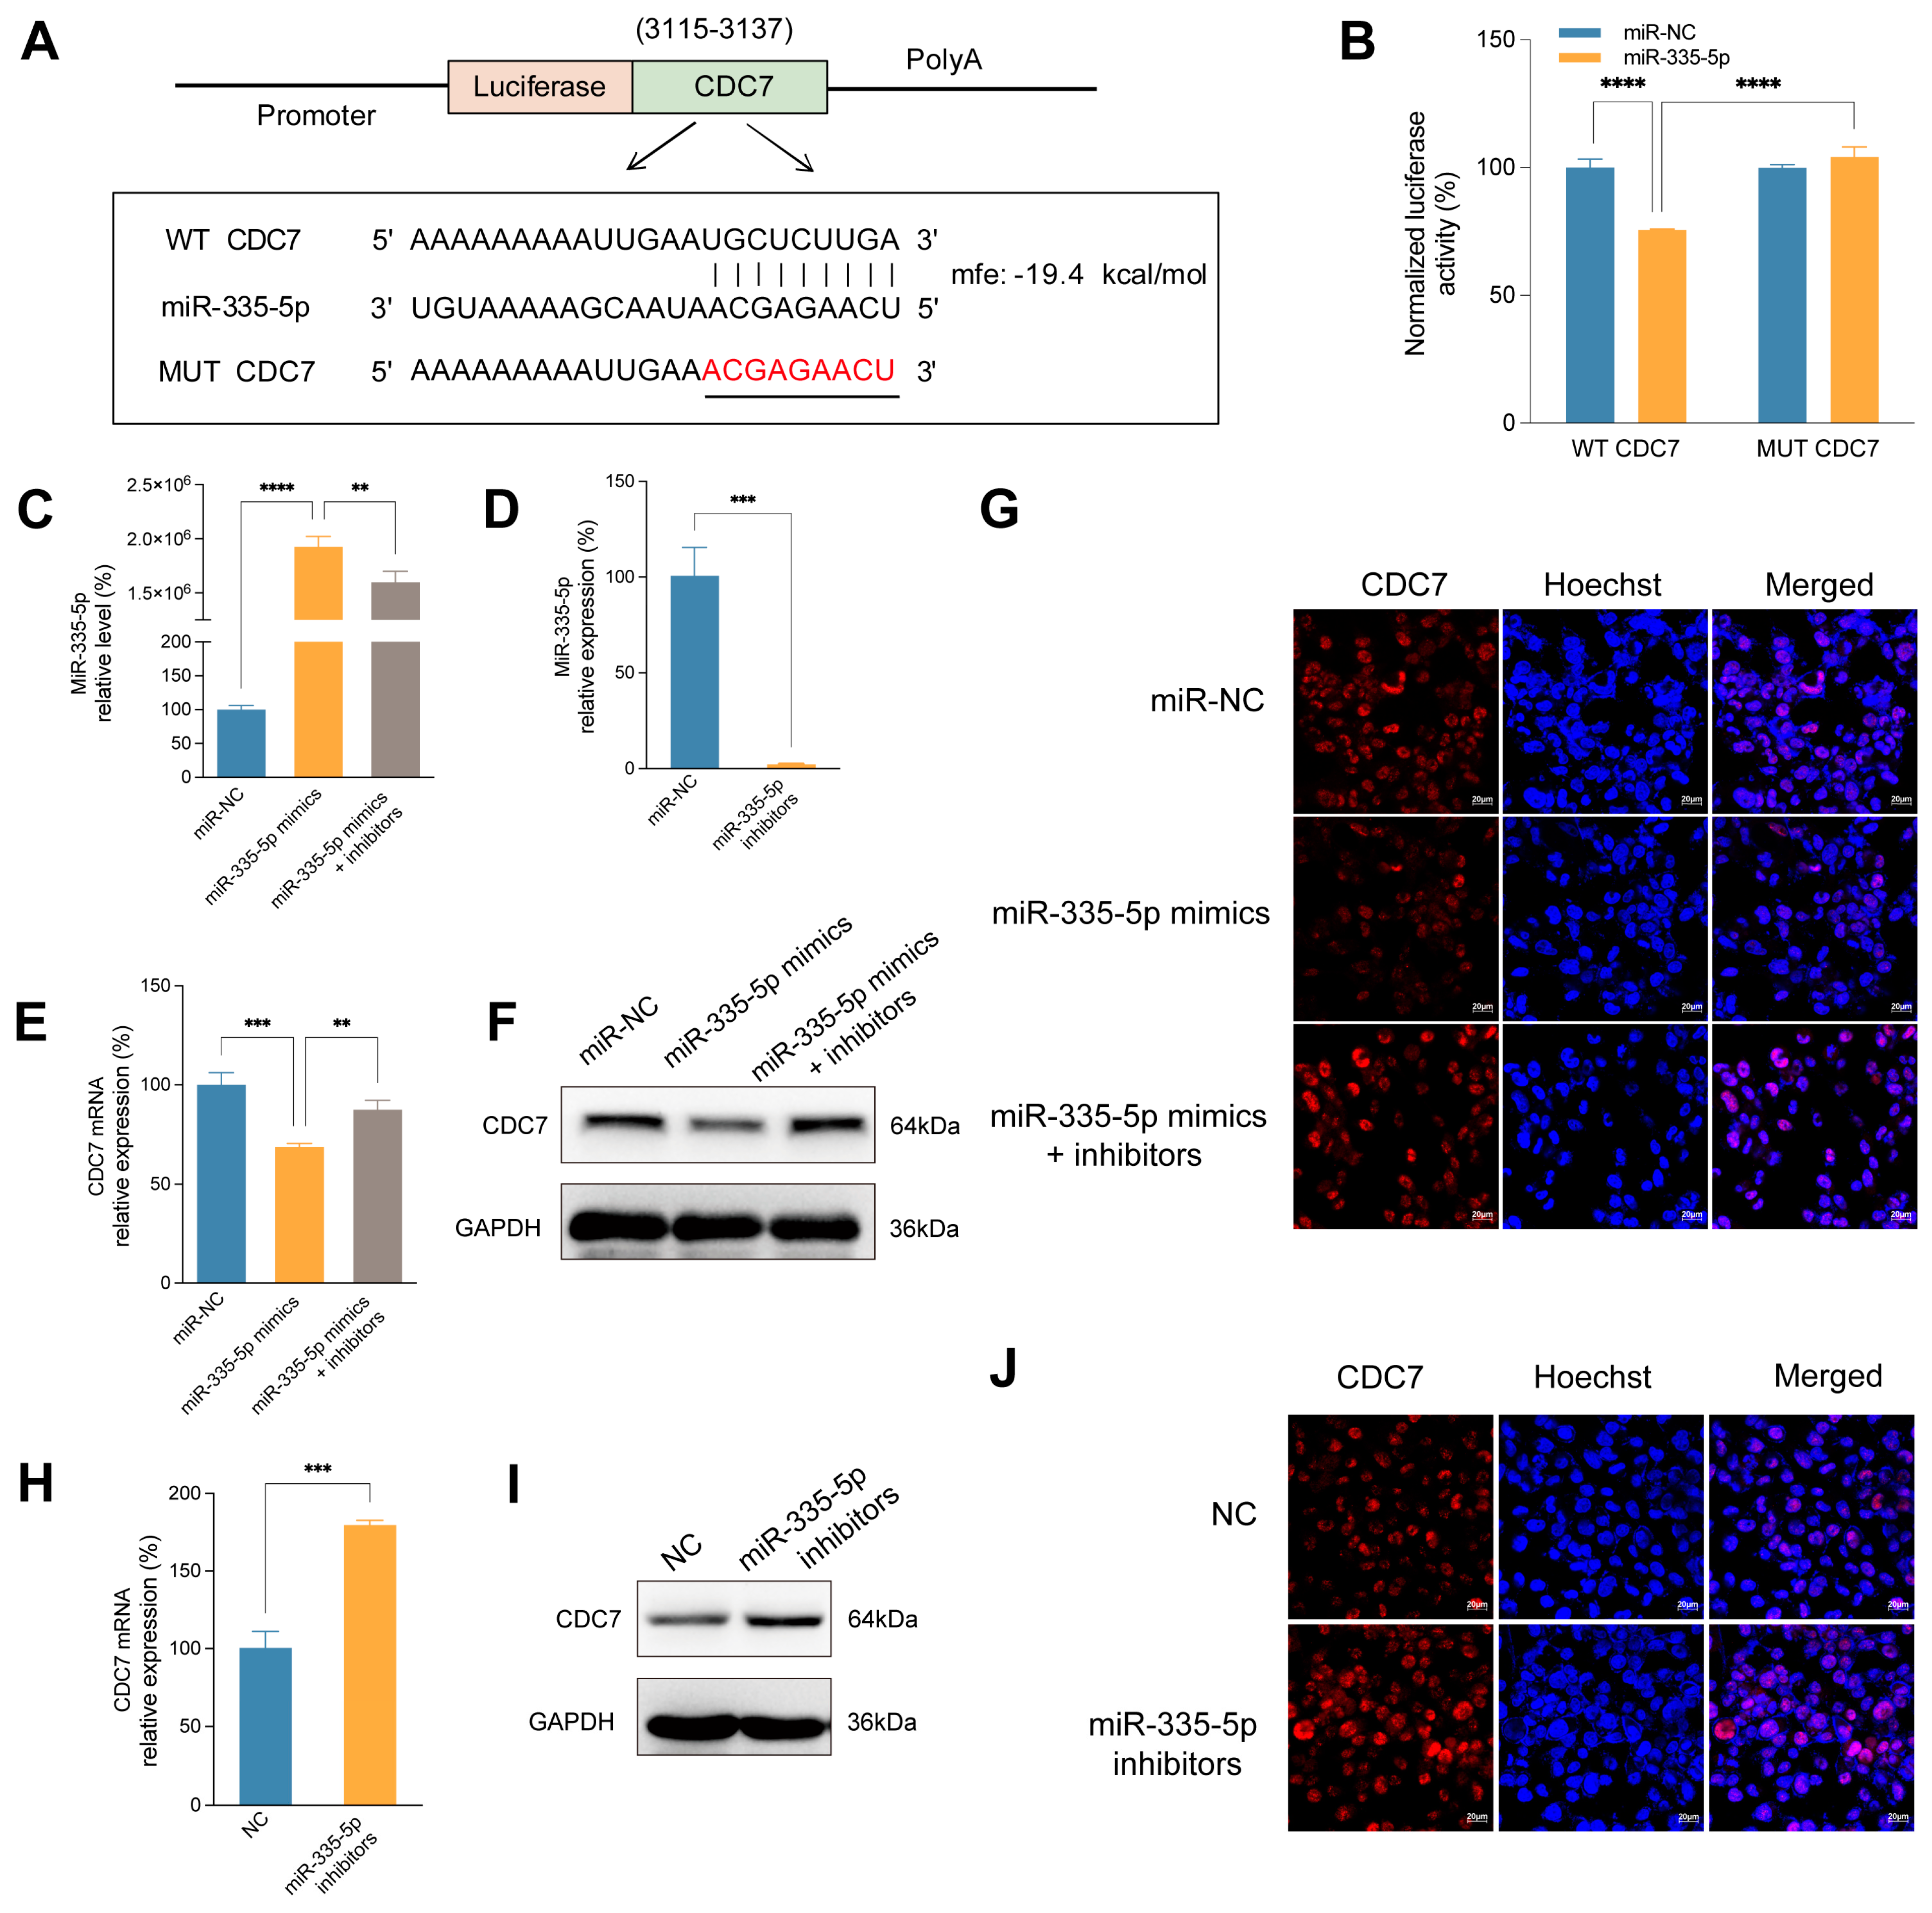
Figure 6.
KCNQ1OT1/miR-335-5p/CDC7 axis mediates proliferation and migration of HCC cells. RT-qPCR, WB (A), and immunofluorescence assay (B) of CDC7 expression in SMMC-7721 cells transfected with si-NC, si-KCNQ1OT1 or co-transfected with si-KCNQ1OT1 and miR-335-5p inhibitors. (C) Immunohistochemistry of CDC7 expression in HCC tissues and adjacent normal tissues (ANT). CCK-8 assay (D), cell colony formation assay (E), and wound healing assay (F) of SMMC-7721 cells after CDC7 knockdown. CCK-8 assay (G), cell colony formation assay (H), and wound healing assay (I) of SMMC-7721 cells transfected with oe-NC, oe-CDC7, or co-transfected with oe-CDC7 and XL413. *p: oe-CDC7 vs. oe-NC; #p: co-transfection with oe-CDC7 and XL413 vs. oe-CDC7. **p < 0.01, ****p < 0.0001, ####p <0.0001.
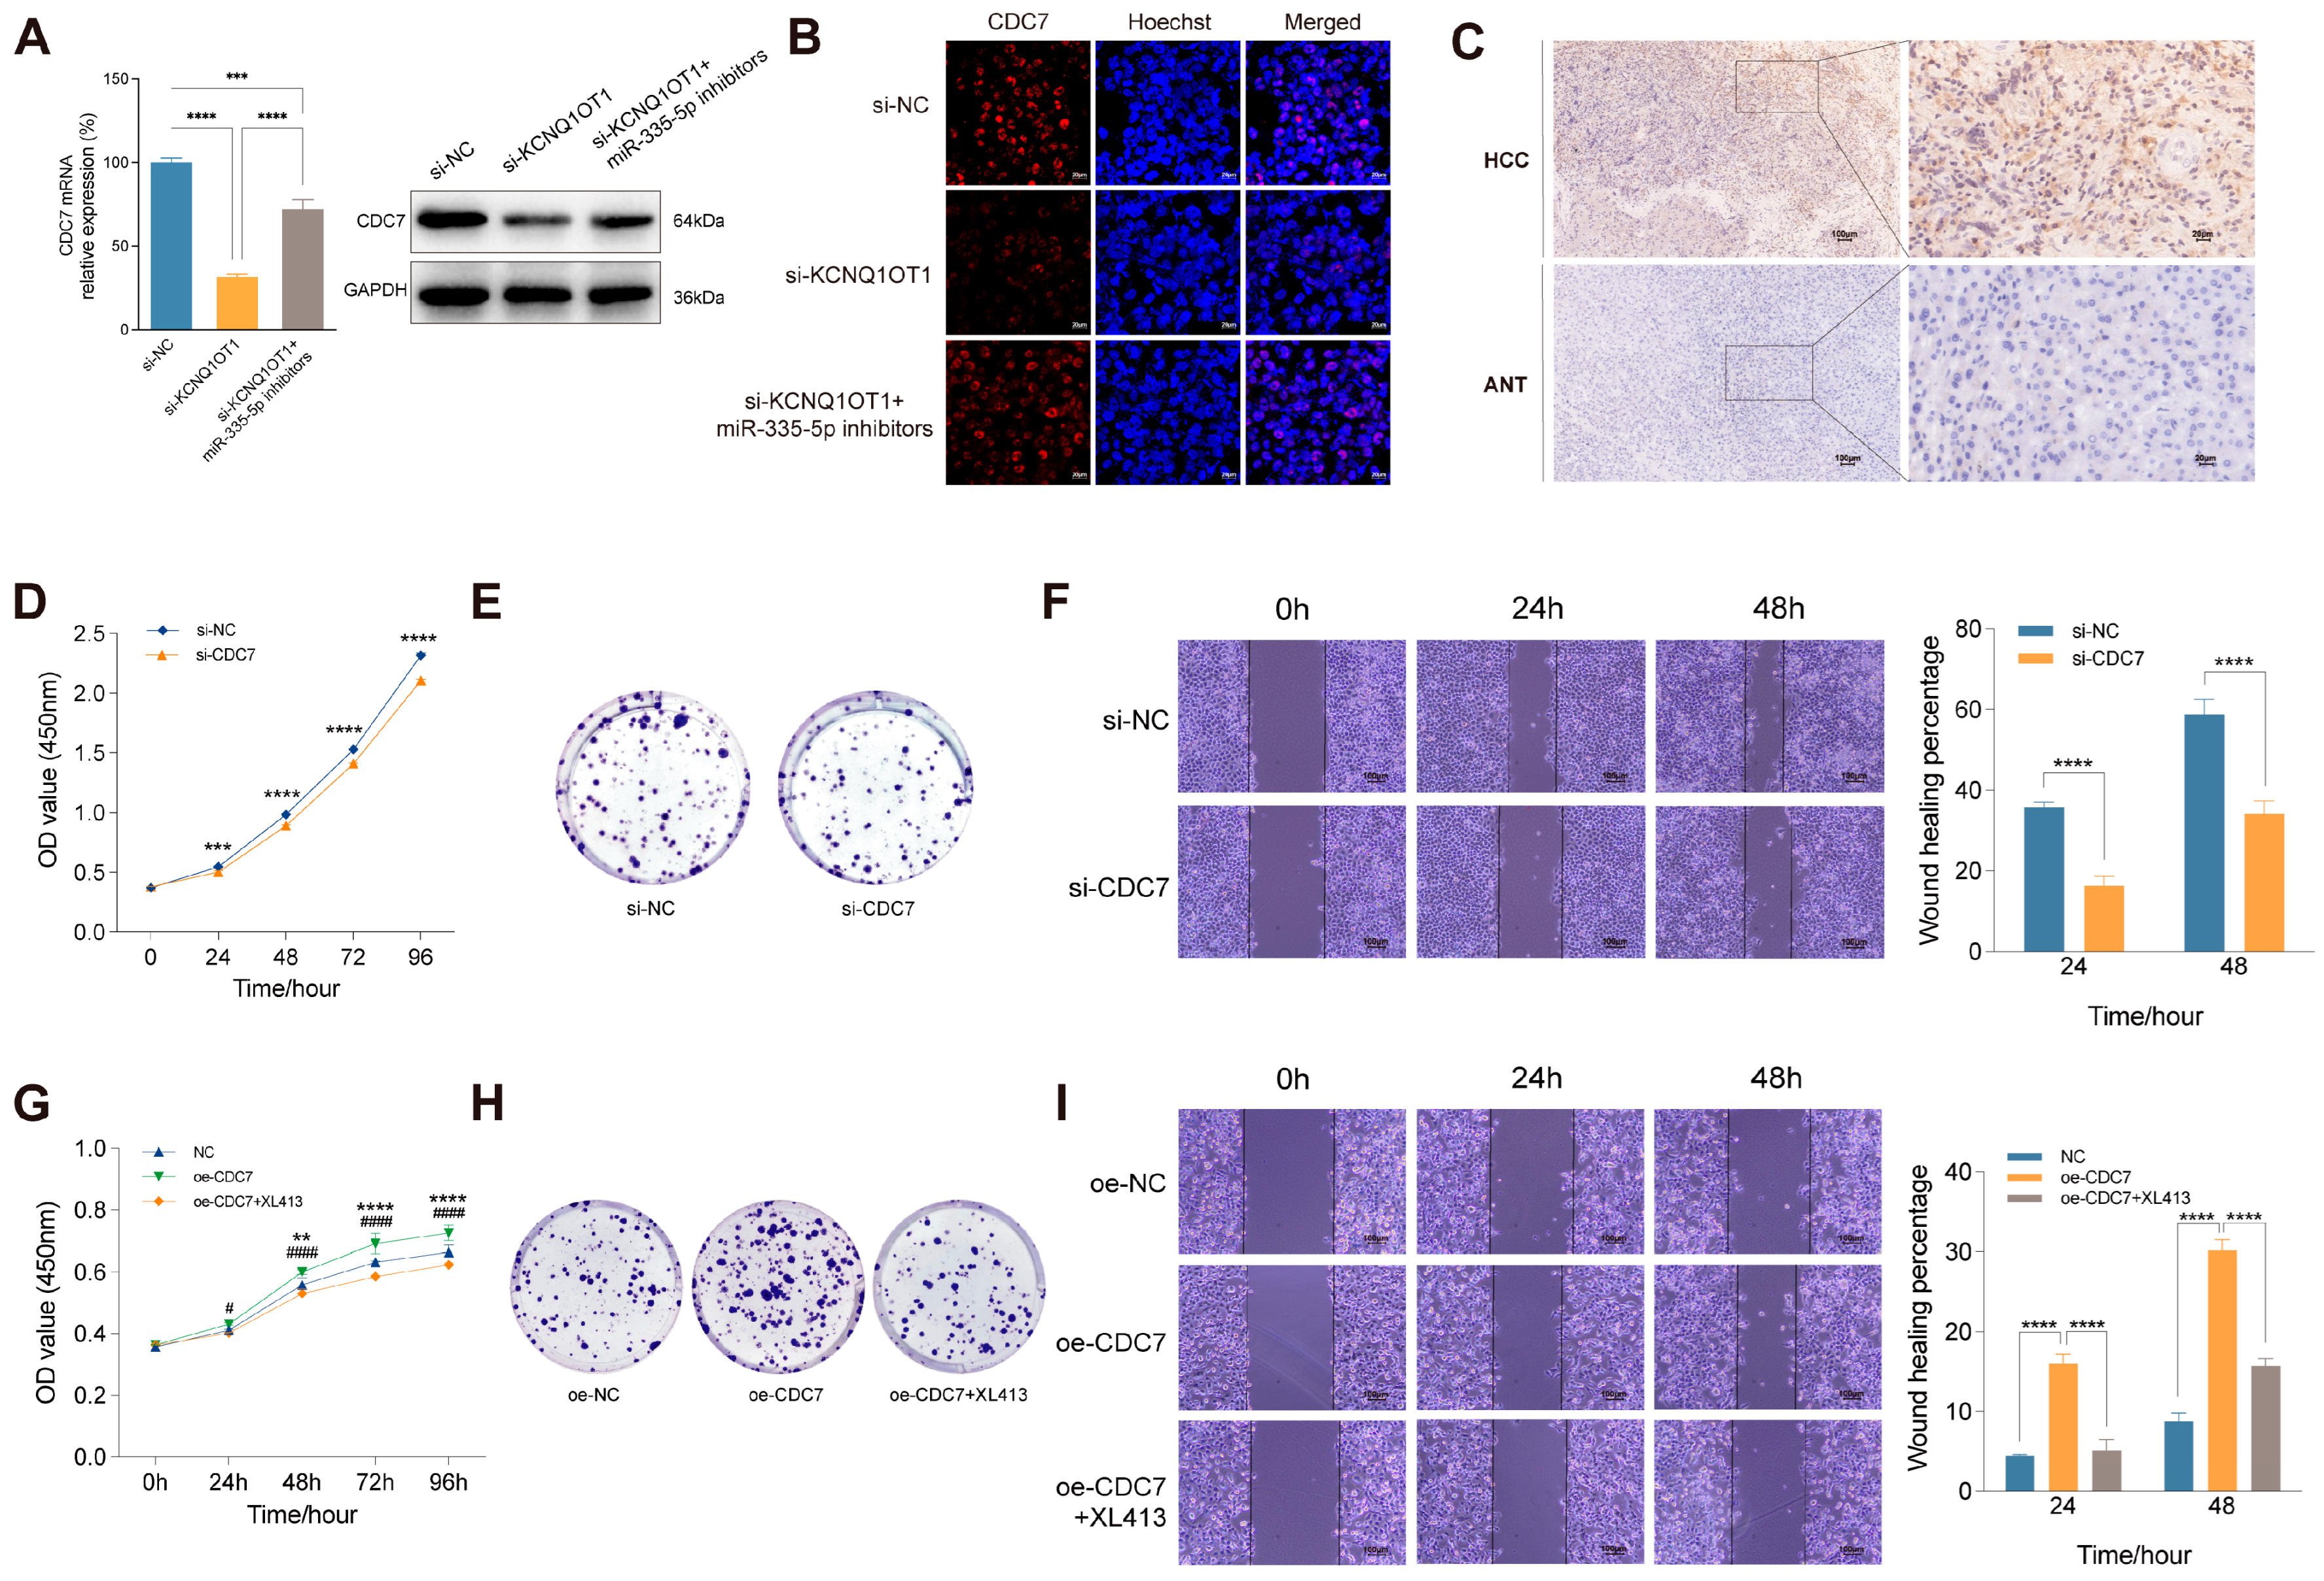
Figure 7.
Regulatory effect of HBV and its encoded proteins on the KCNQ1OT1/miR-335-5p/CDC7 axis. RNA levels of KCNQ1OT1 (A), miR-335-5p (B) and CDC7 (C) in HepG2 and HepG2.215 cells. (D) WB of CDC7 protein expression in HepG2 and HepG2.215 cells. RNA levels of KCNQ1OT1 (E), miR-335-5p (F) and CDC7 (G) in SMMC-7721 cells transfected with a 1.3-fold HBV whole genome plasmid. (H) WB of CDC7 protein expression in SMMC-7721 cells transfected with a 1.3-fold HBV whole genome plasmid. Expression of KCNQ1OT1 (I), miR-335-5p (J) and CDC7 (K) in SMMC-7721 cells transfected with NC, HBx, HBp, and HBc recombinant plasmids. *p < 0.05, **p < 0.01, ***p < 0.001, ****p < 0.0001.
Disclaimer/Publisher’s Note: The statements, opinions and data contained in all publications are solely those of the individual author(s) and contributor(s) and not of MDPI and/or the editor(s). MDPI and/or the editor(s) disclaim responsibility for any injury to people or property resulting from any ideas, methods, instructions or products referred to in the content. |
© 2024 by the authors. Licensee MDPI, Basel, Switzerland. This article is an open access article distributed under the terms and conditions of the Creative Commons Attribution (CC BY) license (http://creativecommons.org/licenses/by/4.0/).
Copyright: This open access article is published under a Creative Commons CC BY 4.0 license, which permit the free download, distribution, and reuse, provided that the author and preprint are cited in any reuse.


