
Submitted:
30 November 2024
Posted:
02 December 2024
You are already at the latest version
Abstract
Using polylactic acid (PLA) filament as the printing material for fused deposition modeling (FDM), and tensile and bending strength as optimization indexes, the influence of four process parameters, printing speed, layer thickness, nozzle temperature, and raster angle, on mechanical properties of PLA specimens in FDM are investigated by orthogonal experiments. The mechanical responses of the printed specimens are explored through tensile and three-point bending tests. Range analysis method is used to investigate the effects of various process parameters on mechanical properties. The optimal combination of printing parameters is obtained through comprehensive evaluation method and comprehensive scoring method, and the correctness of the results is experimentally verified. The optimal process parameters are h=0.1mm, t=210 ℃, v=40 mm/s, and θ= 45°/-45°, and the corresponding tensile strength and bending strength are 26.34MPa and 41.54MPa, respectively.
Keywords:
PLA
; fused deposition modeling
; process parameters
; mechanical properties
; orthogonal experiment
1. Introduction
Additive manufacturing, also known as 3D printing, has significant advantages in manufacturing complex structural materials [1]. As one of them, fused deposition modeling (FDM) has been widely used in aerospace, automotive, construction, medical and other fields [2,3,4,5] due to its high molding efficiency, simple operation, low pollution, easy material acquisition, and low cost of printing equipment and consumables. Polylactic acid (PLA), as the mainstream material of FDM technology, has advantages such as strong plasticity, high elastic modulus and good biodegradability [6]. The quality and performance of PLA printed products have received widespread attention. At present, the factors that constrain the development of PLA-FDM, in addition to product structure, material properties, and molding equipment, are also urgent issues that need to be addressed regarding the impact of various process parameters in the molding process on the performance of printed products.
In FDM, process parameters such as printing speed, layer thickness, nozzle temperature, and printing path have a significant impact on mechanical properties [7]. Therefore, scholars have conducted extensive research on this. The sample printed with smaller layer thickness has a lower porosity and improved mechanical strength [8]. Spišák et al. [9,10] showed that optimizing different scanning paths is beneficial for improving the tensile strength of products in the main force direction. According to the theory of thermal diffusion, an appropriately high temperature is helpful to the diffusion of molecular chains between polymers. Subsequently, during the cooling process, the curling of molecular chains causes entanglement of interlayer molecular chains, enhancing the bonding force between polymers and increasing their tensile strength [11]. The printing speed affects the interlayer cooling time. When the printing speed is high, the interlayer cooling time is short. When the printing speed is sufficient, the bonding effect between layers is enhanced, which is conducive to improving the mechanical properties of the product [12,13].
FDM is a process of multiple parameters interacting and influencing each other. In recent years, most research on FDM process parameters has mainly focused on the effects of single parameters such as printing direction [14], filling mode [15], printing speed and extrusion temperature [16], annealing treatment time and temperature [17,18] on mechanical properties. There is relatively little research on the comprehensive effects of multiple parameter changes on mechanical properties [19]. Therefore, it is necessary to comprehensively evaluate the mechanical properties of printed materials under the joint action of multiple parameters, and screen the optimal parameter combination of printed materials under the joint evaluation of multiple indicators.
For the FDM of PLA filament, this article takes the tensile and bending strength of the specimens as optimization indicators, selects four process parameters that affect the mechanical properties of printed parts to design orthogonal experiments, and uses range analysis, comprehensive evaluation method, and comprehensive scoring method to optimize the best forming process parameters, achieving quality improvement of FDM parts.
2. FDM Principle and Process Parameters
The schematic diagram of the preparation and printing process of PLA-FDM is shown in Figure 1.
In preparation stage: first, according to the experimental requirements and standards, the three-dimensional models of tensile and bending test specimens are designed in modeling software (such as SolidWorks used in this article). Second, the models are imported into slicing software (such as Ultimaker Cura used in this article) in STL format, and then the printing parameters are set and the slicing work is completed. Third, generate G code and import it into the FDM printer.
In printing process: the PLA filament enters the nozzle under the push of two driving rollers, and is molten and extruded under the action of heater at the printing temperature. Then, according to the predetermined trajectory of each layer, the printing work is carried out at the printing speed until the whole specimen is formed. The process parameters that affect the mechanical properties of printed parts mainly include printing speed, layer thickness, nozzle temperature, raster angle, printing spacing, printing track, etc [20].
In order to explore the influence of various process parameters on the mechanical properties of FDM printed parts, this paper studied the effects of printing speed, layer thickness, nozzle temperature and raster angle on the tensile and bending properties of PLA-FDM specimens based on orthogonal experiments. Each parameter is defined as follows:
a. Printing speed(v). The movement speed of the printer nozzle.
b. Layer thickness(h). The thickness of each layer of stacked material.
c. Nozzle temperature (t). The pre-set nozzle temperature, and the heater is used to keep this temperature constant during the printing process.
d. Raster angle(θ): The angle between the filament stacking path and the contour reference.
3. Experimental
3.1. Preparation of PLA Specimens
The PLA filament (from Shenzhen Aurora Technology Co.,Ltd.) is printed by a commercial 3D printing machine (from Aurora™). The other printing parameters used in this paper are listed in Table 1.
3.2. Experimental Design
Four FDM parameters, including layer thickness (A), nozzle temperature (B), printing speed (C), and raster angle (D), are chosen to investigate on the mechanical properties of PLA printed parts, and the orthogonal test array L9(34) is designed. The four parameters, three levels, and their values are shown in Table 2.
3.3. Mechanical Properties Test
Tensile and bending strength of various samples are conducted using Microcomputer controlled electronic universal testing machine (TEM104C, Shenzhen Wance Testing Machine Co., Ltd.), as shown in Figure 2. The experimental process follows ISO527-1:2012 and ISO178:2010, respectively. And the PLA specimens after tension and bending are shown in Figure 3.
4. Results and Discussion
4.1. Orthogonal Experimental Results
In this paper, nine groups of comparative tests are conducted according to the orthogonal experiments of L9(34). Each group conducted five experiments, and the average value is taken as the experimental result for subsequent analysis. As shown in Table 3, there is a significant difference in tensile and bending strength among the experimental groups under different parameter combinations.
4.2. Comprehensive Evaluation of Orthogonal Experimental Results
The steps for calculating and analyzing the results of orthogonal experiments are as follows:
- Calculate Ki: Ki is the sum of the indexes for the same level. Taking parameter A in the tensile strength index experiment as an example.
- Calculate ki: ki is the average values of each parameter at the same level, that is, .
- Calculate R: , is the range to measure the variation of the experimental values.
Draw parameter-index trend graph: Taking the parameter level as the X-axis and the average value ki as the Y-axis, the relationship between mechanical properties and different levels of each parameter can be visually displayed and analyzed, as shown in Figure 4.
According to the R-value, we can determine the influence orders of the various factors, and according to the factor-index trend graph, we can obtain the optimal combination of process parameters for each index. Then the results for each index are listed in Table 4. We can see that, for tensile strength, the order of influence of the four parameters is C>B>D>A, and the optimal parameter combination is A1B2C1D1. And for bending strength, the influence order is A>D>C>B, and the optimum parameter combination is A1B1C3D1. Meanwhile, from the experimental results, the impact mechanism of the four process parameters on the mechanical properties of PLA-FDM parts can be summarized as follows:
Layer thickness. The trend graph in Figure 4 shows that as the layer thickness increases, both the tensile strength and bending strength of the test samples decrease. The reason is that the increase in layer thickness leads to an increase in interlayer porosity. Meanwhile, for parts of the same height, an increase in layer thickness means a decrease in the number of layers, which reduces the internal filaments used to resist external forces. The above two reasons jointly lead to the weakening of the mechanical properties of the parts. Therefore, A1 (h=0.1mm) is chosen as the optimal level.
Nozzle temperature. Compared with other parameters, the nozzle temperature has relatively small effect on overall mechanical properties of PLA specimens. An appropriately high temperature can enhance the PLA melt fluidity, which is conducive to the full diffusion and fusion of molecular chains, forming a good interface between printed filaments. However, excessively high nozzle temperatures can easily lead to strong resin fluidity, even decomposition and vaporization, which is not conducive to printing. Usually, the reasonable range for 3D printing nozzle temperature is between the glass transition temperature and thermal decomposition temperature of the PLA materials. Thus, B2 (t=210℃) can be choice as the optimal level.
Printing speed. From the trend graph, we can see that as the printing speed increases, the tensile strength decreases and the bending strength increases, with opposite trends. Overall, when the speed increases from 20 to 40 mm/s, the tensile strength decreases very little, but the bending strength increases a lot. However, when the speed increases from 40 to 60 mm/s, the bending strength increases very little, but the tensile strength decreases more. Therefore, choosing 40 mm/s is more appropriate. This is because when the speed increases to a certain stage, the fluidity of PLA resin is good, and when adjacent molten filaments come into contact with each other, the interface temperature and bonding performance are good. If the printing speed is too high, the effective contact time between filaments decreases, resulting in a deterioration of their bonding strength.
Raster angle: The raster angle represents the angle between the movement directions of the molten filaments in each layer during the printing process. When angle changes, only the stacking angles of adjacent layers filaments are different, but the density of the internal "fiber bundles" in the sample does not change. When the material sample is subjected to stress, the filaments are oriented to resist fracture along external forces. From trend graph, D1(θ=45/–45°) should be selected as the optimal level.
In summary, the optimal process parameter combination is A1B2C2D1, which is h=0.1mm, t=210 ℃, v=40 mm/s, and θ= 45/-45 °.
4.3. Comprehensive Scoring of Orthogonal Experimental Results
The comprehensive scoring method is to determine the proportion of different indicators based on their different importance during the experimental process, convert multi indicator experimental results into single indicator experimental results, and then optimize the experimental results based on the analysis of single indicators. This article uses formulas (1) and (2) to calculate the membership and comprehensive scores of tensile strength and bending strength.
Here,U-Membership degree of each index, 0≤U≤1;
-Membership degree of tensile strength;
-Membership degree of bending strength;
A-Index value;
- Maximum index value;
- Minimum index value;
T-Comprehensive score;
Considering the overall performance of mechanical properties, the weights for tensile and bending strength are both taken as 0.5. The analysis results of the comprehensive scoring method are shown in Table 5 and Table 6.
Analysis shows that the optimal parameter for the comprehensive scoring method is also A1B2C2D1, which is consistent with the comprehensive balance method. This further verifies the rationality and correctness of the comprehensive balance method and comprehensive scoring method based on orthogonal experiments. Due to the fact that the optimal parameter combination does not belong to one of the 9 orthogonal table experiments, experimental validation is required, and the validation results are shown in Table 7.
From Table 7, it can be seen that compared with the results in the orthogonal experimental table mentioned earlier, both indexes of the optimal parameter combination have significantly improved, proving the correctness of the optimal printing parameter combination.
5. Conclusions
PLA is one of the most widely used polymers in FDM. This article investigates the influence of process parameters such as printing speed, layer thickness, nozzle temperature, and raster angle on the mechanical properties of PLA printed parts in FDM based on orthogonal experiments.
Orthogonal experiments are designed for the indexes of tensile and bending strength. Through range analysis, the influence order of process parameters that affect tensile and bending strength is determined as follows: raster angle, layer thickness, printing speed, and nozzle temperature. The influence laws of different parameters are obtained, with layer thickness and raster angle having the same influence laws on the two indexes, and the impact of printing speed and nozzle temperature is completely opposite.
The optimal process parameter combination can be determined as A1B2C2D1 through comprehensive evaluation method and comprehensive scoring method, which is h=0.1mm, t=210 ℃, v=40 mm/s, and θ= 45/-45 °. At this point, the tensile strength is 26.34MPa, the bending strength is 41.54MPa, and the mechanical properties are significantly improved.
Acknowledgments
This work was supported by the College Student Innovation and Entrepreneurship Training Program Project and Key Lab. of Manufacturing Equipment of Shaanxi Province, (Grant No.JXZZZB-2022-05).
References
- Panda Sunil Kumar, Rath Kali Charan, Mishra Sujit, Khang Alex. Revolutionizing product development: The growing importance of 3D printing technology[J]. Materials Today: Proceedings, 2023, 1-8. [CrossRef]
- Shahrubudin N, Chuan L T, Ramlan R. An overview on 3D printing technology: technological, materials, and applications[J]. Procedia Manufacturing, 2019, 35:1286-1296. [CrossRef]
- Cano-Vicent A, Tambuwala M M, Hassan S S, et al. Fused deposition modelling: Current status, methodology, applications and future prospects[J]. Additive Manufacturing, 2021(47): 1-19. [CrossRef]
- Attaran, Mohsen. The rise of 3-D printing: The advantages of additive manufacturing over traditional manufacturing[J]. Business Horizons, 2017,60(5): 677-688. [CrossRef]
- Yang Yuan, Yang Bo, Chang Zhengping, Duan Jihao, Chen Weihua. Research status of and prospects for 3D printing for continuous fiber-reinforced thermoplastic composites[J]. Polymers, 2023, 15(3653):1-17. [CrossRef]
- Shady Farah, Daniel G. Anderson, Robert Langer. Physical and mechanical properties of PLA, and their functions in widespread applications-A comprehensive review[J].Advanced Drug Delivery Reviews, 2016, 107: 367-392. [CrossRef]
- Popescu Diana, Zapciu Aurelian, Amza Catalin, Baciu Florin, Marinescu Rodica. FDM process parameters influence over the mechanical properties of polymer specimens: A review[J]. Polymer Testing, 2018, 69, 157-166. [CrossRef]
- Rankouhi B, Javadpour S, Delfanian F, et al. Failure analysis and mechanical characterization of 3D printed ABS with respect to layer thickness and orientation[J]. Journal of Failure Analysis and Prevention, 2016, 16: 467-481. [CrossRef]
- Spišák, Emil, Ivan Gajdoš, Ján Slota. Optimization of FDM prototypes mechanical properties with path generation strategy[J]. Applied Mechanics and Materials, 2014, 474: 273-278. [CrossRef]
- Han, Wenbiao, Mohsen A. Jafari, Kian Seyed. Process speeding up via deposition planning in fused deposition-based layered manufacturing processes[J]. Rapid Prototyping Journal, 2003, 9(4): 212-218. [CrossRef]
- Sanatgar, Razieh Hashemi, Christine Campagne, Vincent Nierstrasz. Investigation of the adhesion properties of direct 3D printing of polymers and nanocomposites on textiles: Effect of FDM printing process parameters[J]. Applied Surface Science, 2017, 403: 551-563. [CrossRef]
- Faes Matthias, Eleonora Ferraris, David Moens. Influence of inter-layer cooling time on the quasi-static properties of ABS components produced via fused deposition modelling[J]. Procedia Cirp, 2016, 42: 748-753. [CrossRef]
- Sun Q, Rizvi G M, Bellehumeur C T, et al. Effect of processing conditions on the bonding quality of FDM polymer filaments[J]. Rapid Prototyping Journal, 2008, 14(2): 72-80. [CrossRef]
- Afrose Mst Faujiya, Masood S H, Iovenitti Pio, Nikzad Mostafa, Sbarski Igor. Effects of part build orientations on fatigue behaviour of FDM-processed PLA material[J]. Progress in Additive Manufacturing, 2016, 1: 21-28. [CrossRef]
- Akhoundi, Behnam, Amir H. Behravesh. Effect of filling pattern on the tensile and flexural mechanical properties of FDM 3D printed products[J]. Experimental Mechanics, 2019, 59: 883-897. [CrossRef]
- Ansari Anis A, Kamil M. Effect of print speed and extrusion temperature on properties of 3D printed PLA using fused deposition modeling process[J]. Materials Today: Proceedings, 2021, 45: 5462-5468. [CrossRef]
- Niranjan, Y C, Krishnapillai S, Velmurugan R, et al. Effect of Annealing Time and Temperature on Dynamic Mechanical Properties of FDM Printed PLA[J]. Composite Materials for Extreme Loading: Proceedings of the Indo-Korean workshop on Multi Functional Materials for Extreme Loading. Springer Singapore, 2022.
- Wang Shuheng, Ma Yongbin, Deng Zicheng, et al. Effects of fused deposition modeling process parameters on tensile, dynamic mechanical properties of 3D printed polylactic acid materials[J]. Polymer testing, 2020,86(1): 1-8. [CrossRef]
- Huang Bai, Meng Shuna, He Hui, et al. Study of processing parameters in fused deposition modeling based on mechanical properties of acrylonitrile-butadiene-styrene filament[J]. Polymer Engineering & Science, 2019, 59: 120-128. [CrossRef]
- Algarni Mohammed, Ghazali Sami. Comparative study of the sensitivity of PLA, ABS, PEEK, and PETG’s mechanical properties to FDM printing process parameters[J]. Crystals, 2021, 11(995): 1-21. [CrossRef]
Figure 1.
Schematic diagram of preparation and printing process for PLA-FDM.
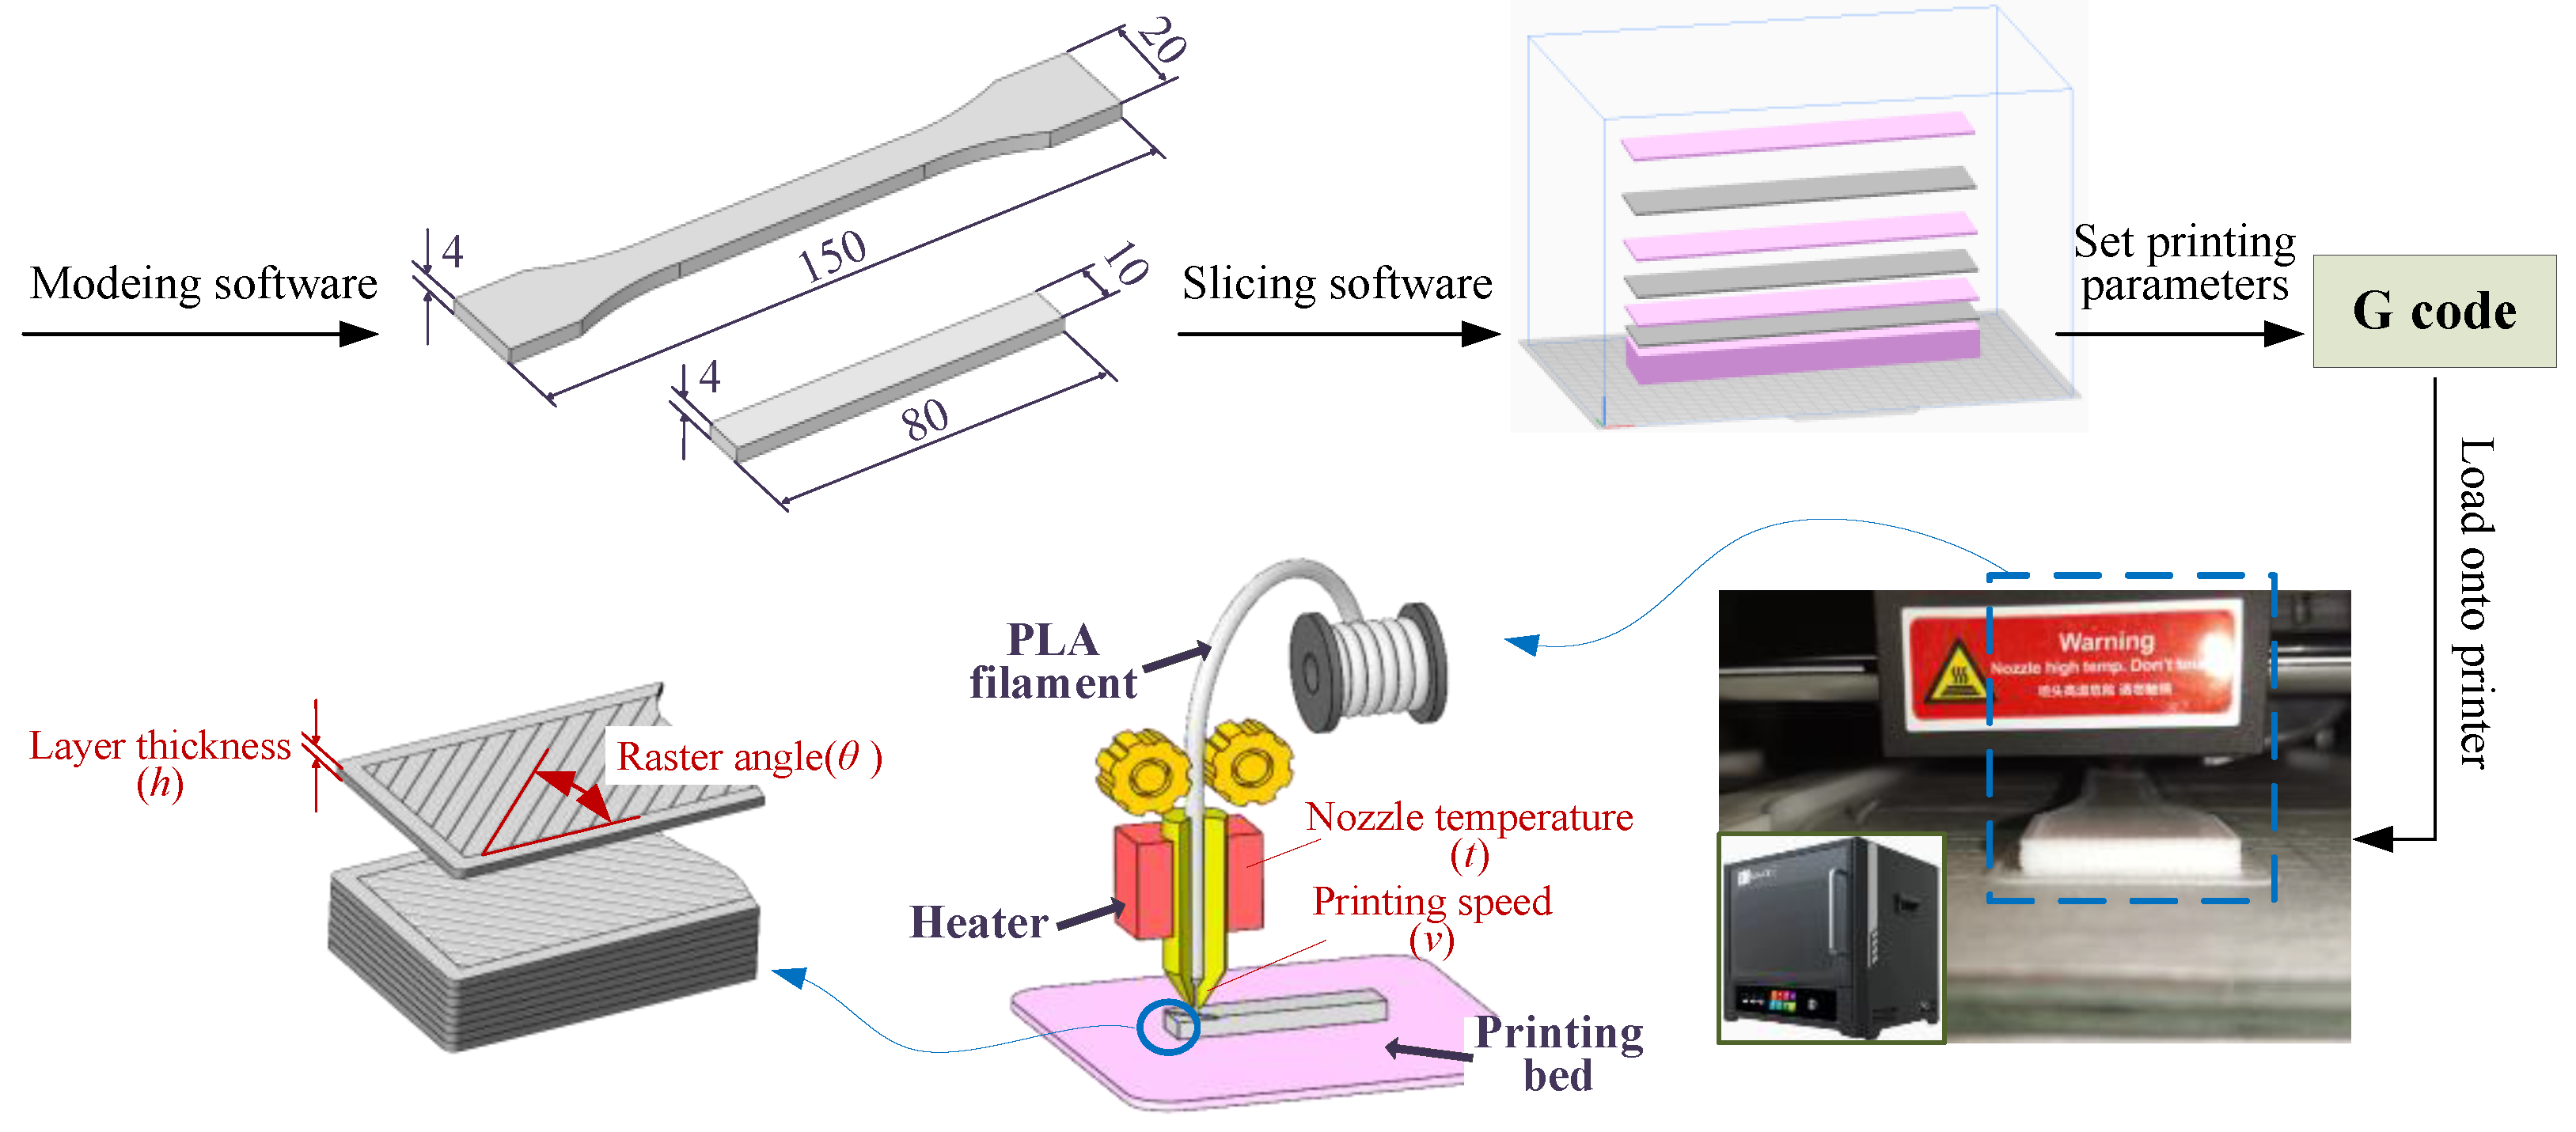
Figure 2.
The tensile and bending tests.
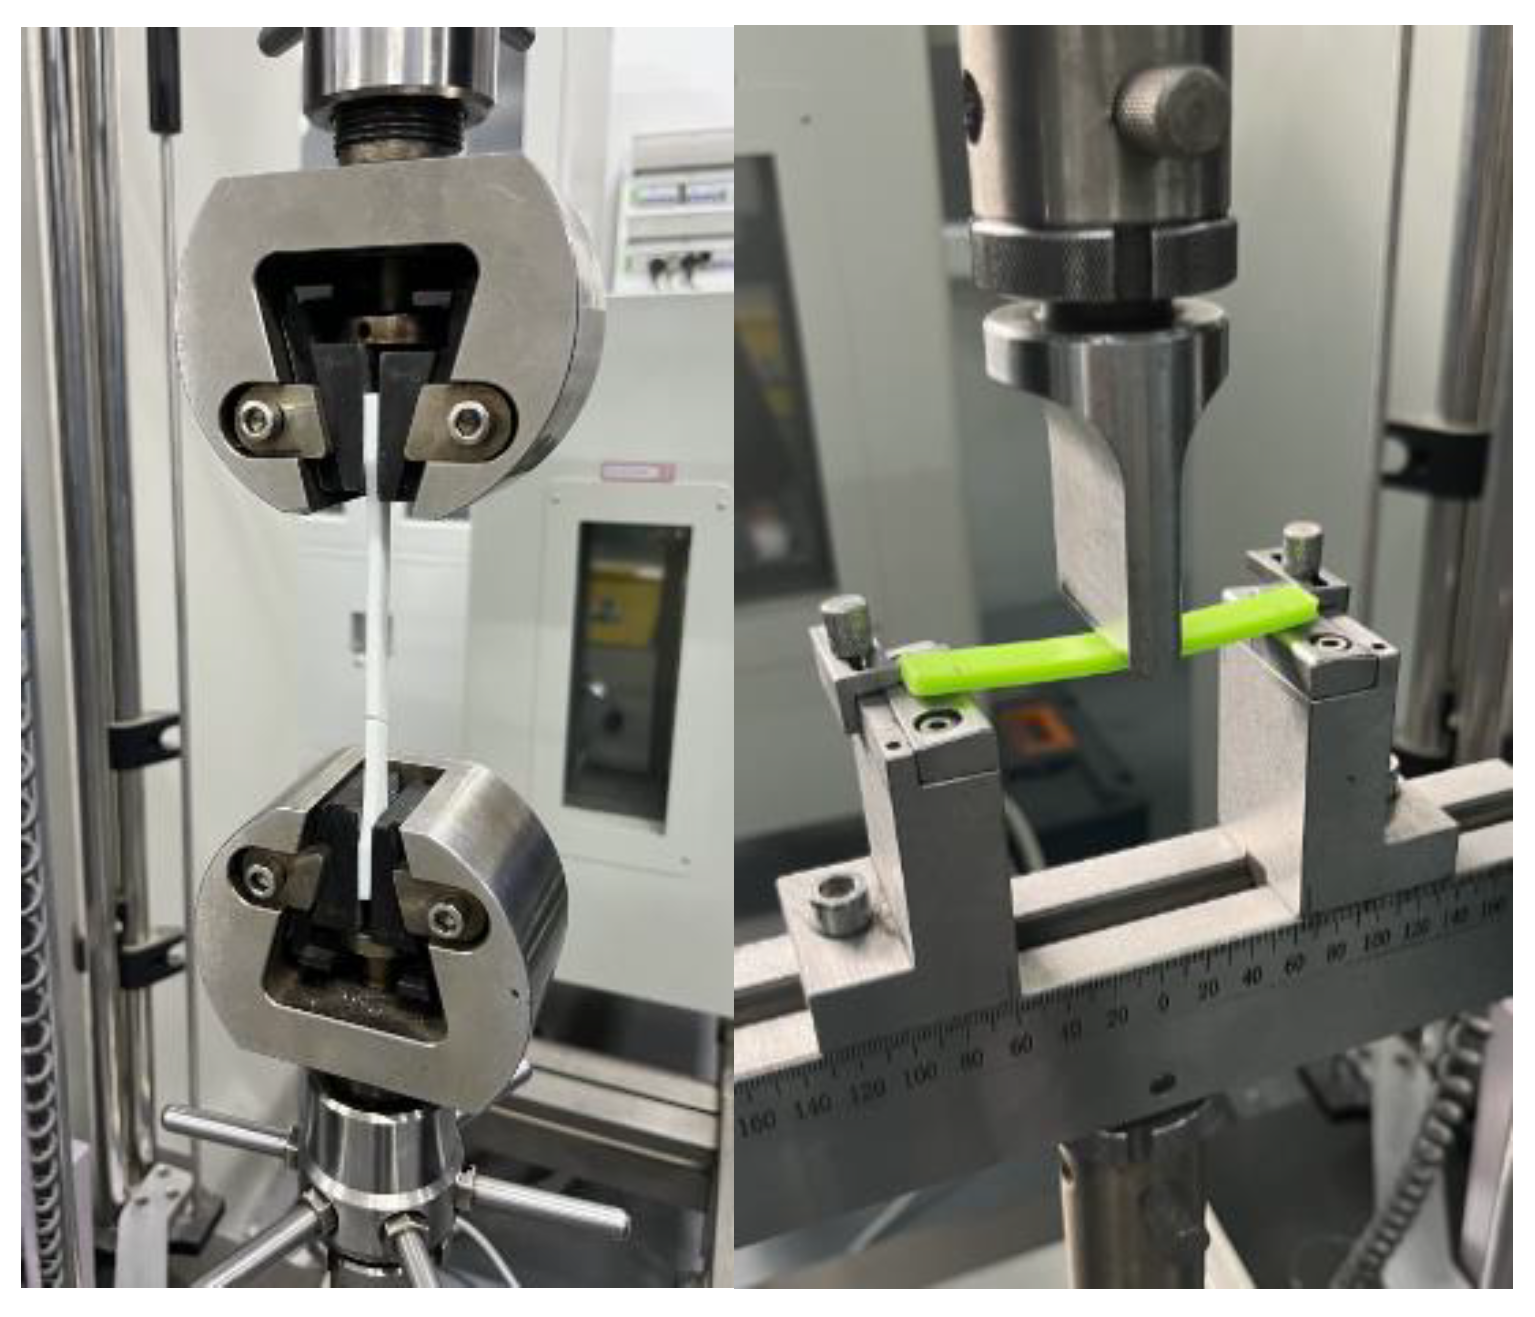
Figure 3.
PLA specimens after tension and bending.
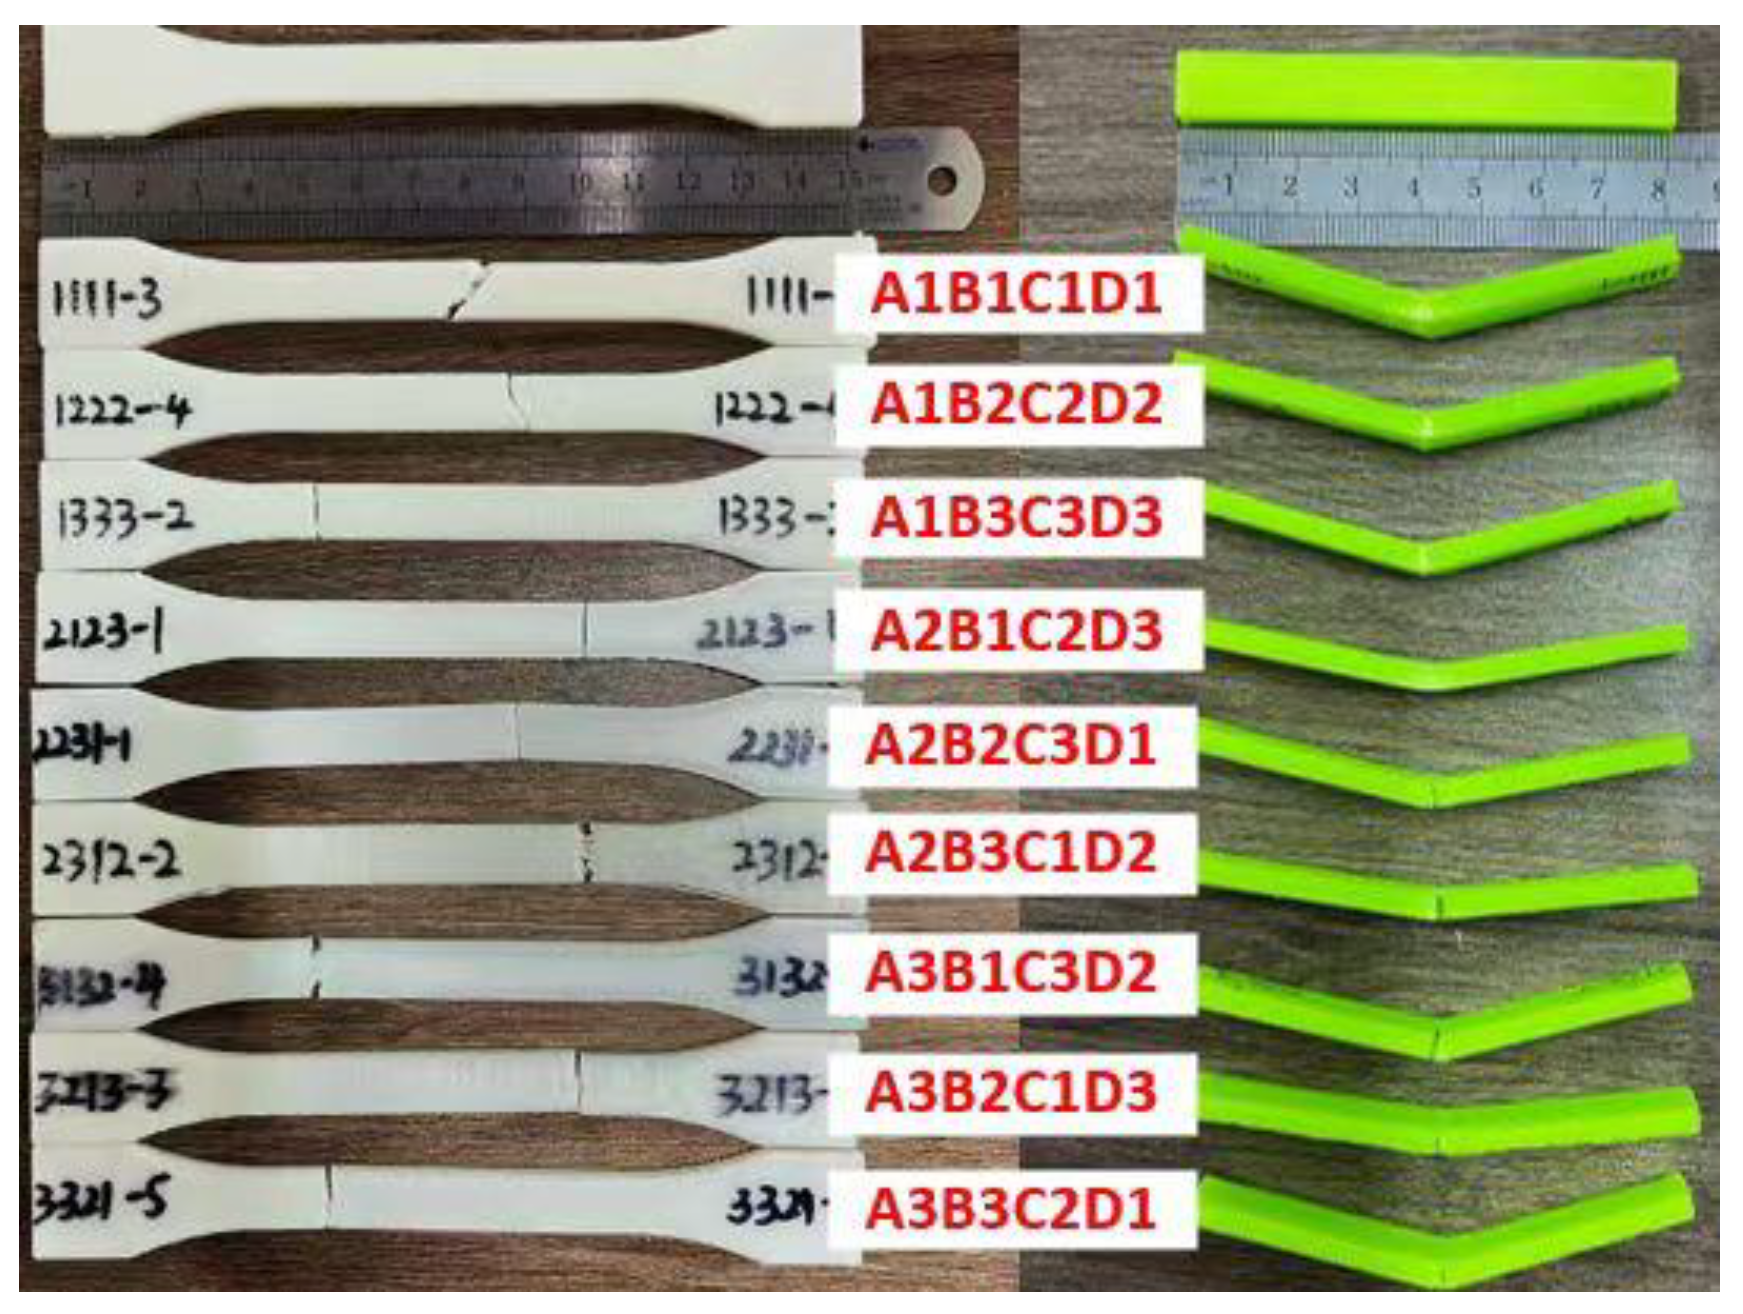
Figure 4.
Trend graph between properties indexes and parameters levels.
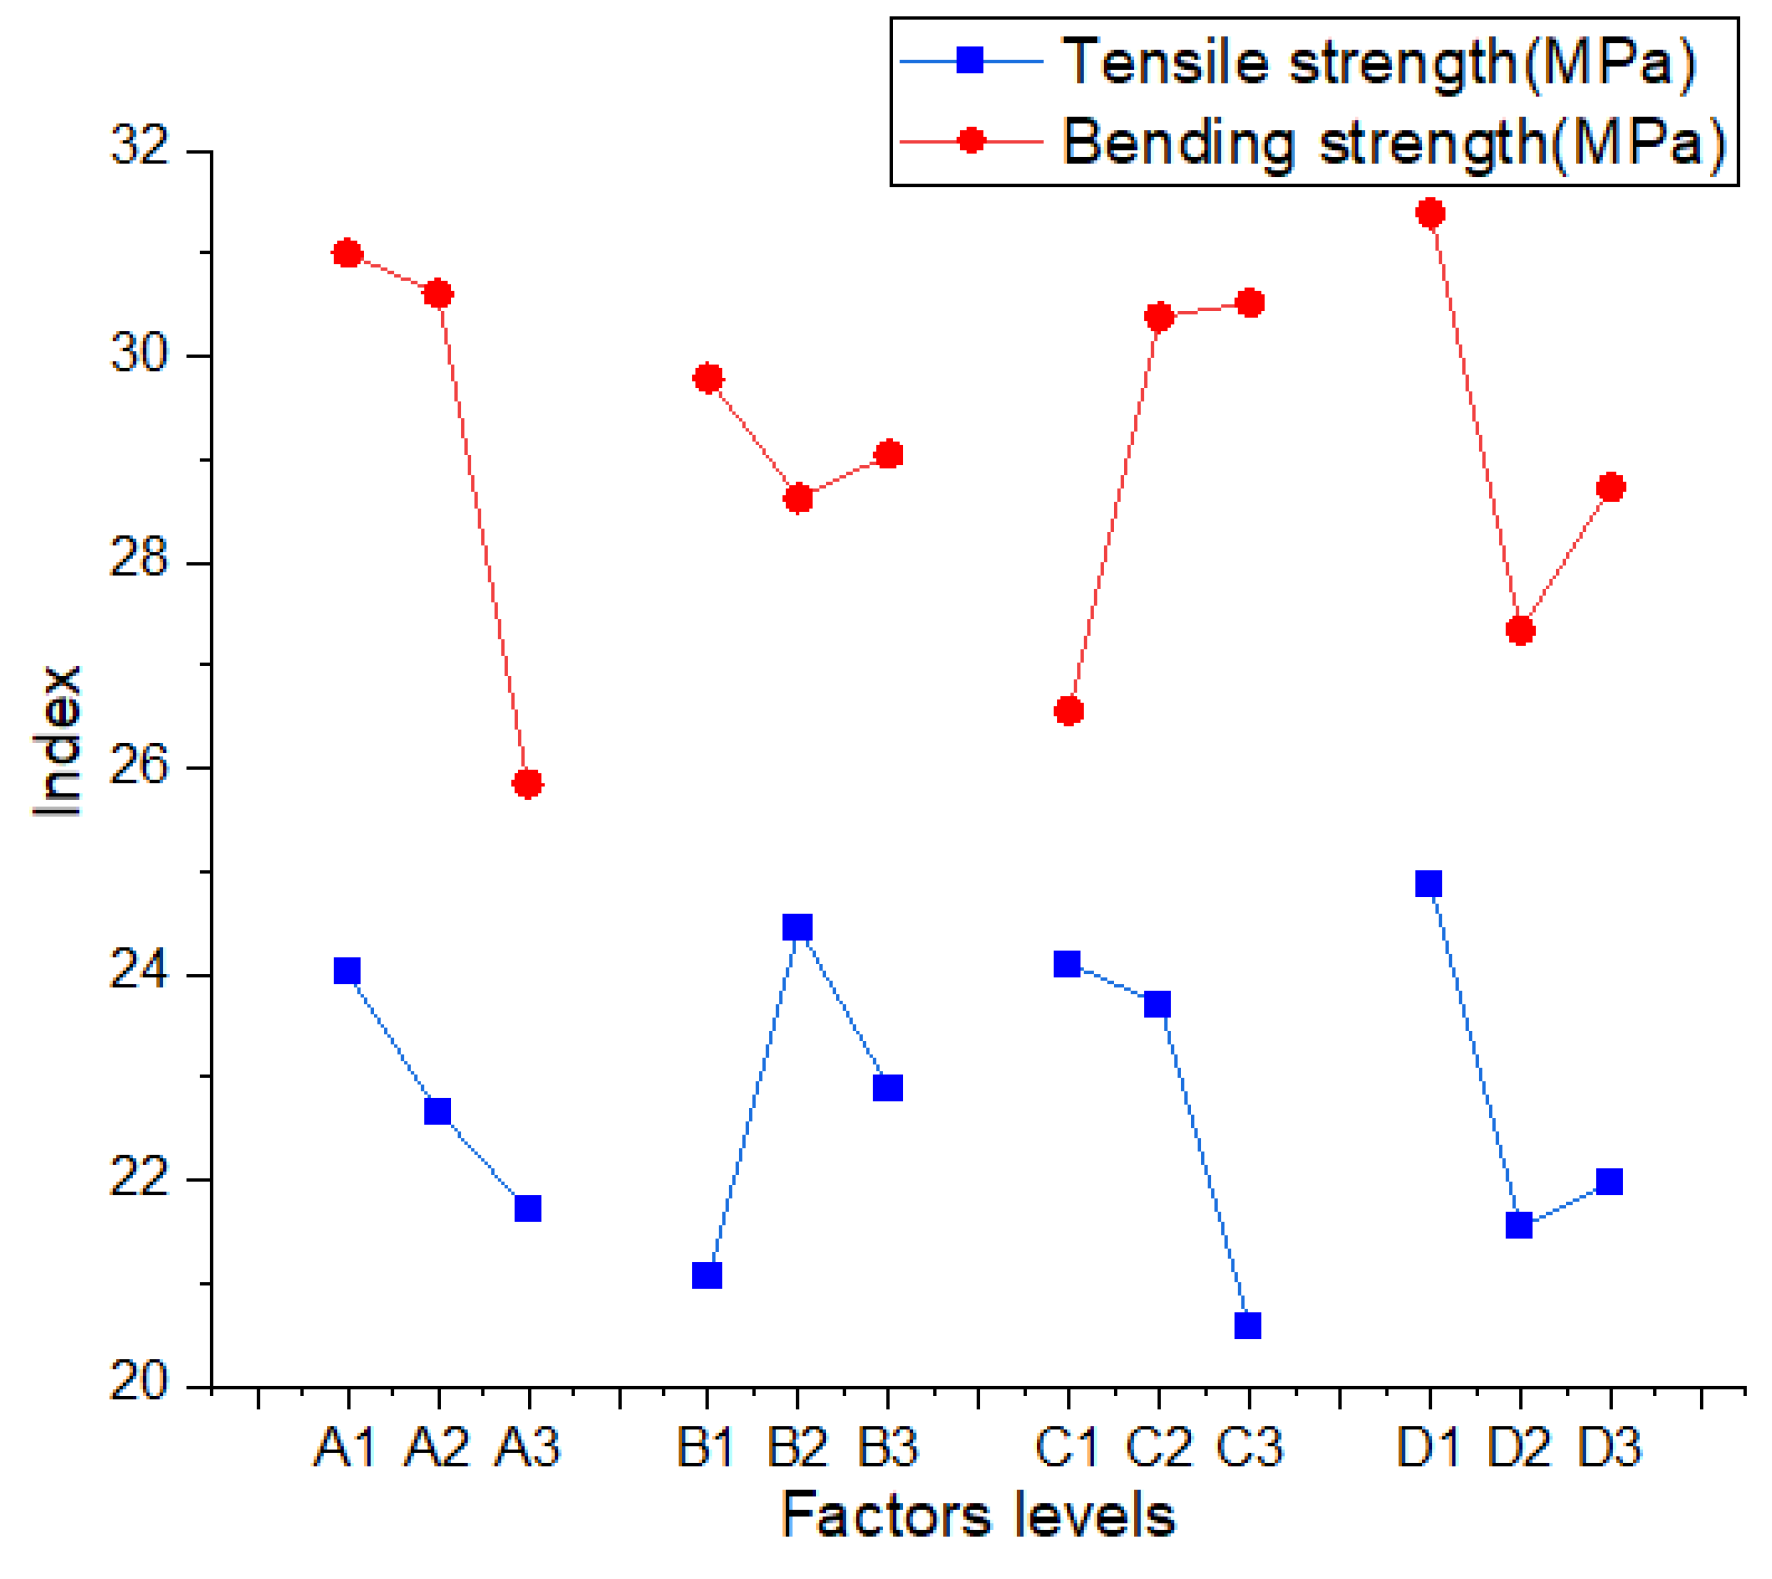

Table 1.
Fixed FDM process parameters.
| FDM parameters | Values | |
| PLA parameters | Filament diameter(mm) | 1.75 |
| Density(kg/m3) | 1250 | |
| FDM process parameters | Nozzle diameter(mm) | 0.4 |
| Filling rate(%) | 100 | |
| Printing bed temperature(°C) | 70 |
Table 2.
Four parameters and three levels in orthogonal experiment.
| FDM parameter | Number | Level 1 | Level 2 | Level 3 |
| Layer thickness (mm) | A | 0.1 | 0.2 | 0.3 |
| Nozzle temperature (℃) | B | 190 | 210 | 230 |
| Printing speed (mm/s) | C | 20 | 40 | 60 |
| Raster angle (°) | D | 45/–45 | 30/–60 | 0/90 |
Table 3.
Orthogonal experimental results.
| Test number | Parameter | Index | |||||
| A | B | C | D | Tensile strength (MPa) | bending strength (MPa) | ||
| Test 1 | 1 | 1 | 1 | 1 | 25.65 | 31.27 | |
| Test 2 | 1 | 2 | 2 | 2 | 25.33 | 29.88 | |
| Test 3 | 1 | 3 | 3 | 3 | 21.05 | 31.83 | |
| Test 4 | 2 | 1 | 2 | 3 | 21.01 | 32.06 | |
| Test 5 | 2 | 2 | 3 | 1 | 24.17 | 33.68 | |
| Test 6 | 2 | 3 | 1 | 2 | 22.82 | 26.1 | |
| Test 7 | 3 | 1 | 3 | 2 | 16.5 | 26.03 | |
| Test 8 | 3 | 2 | 1 | 3 | 23.85 | 22.31 | |
| Test 9 | 3 | 3 | 2 | 1 | 24.79 | 29.21 | |
Table 4.
Analysis results of the orthogonal experiments.
| Properties | A | B | C | D | |
| Tensile strength | K1 | 72.03 | 63.15 | 72.31 | 74.61 |
| K2 | 68 | 73.35 | 71.13 | 64.65 | |
| K3 | 65.14 | 68.67 | 61.72 | 65.91 | |
| k1 | 24.01 | 21.05 | 24.1 | 24.87 | |
| k2 | 22.67 | 24.45 | 23.71 | 21.55 | |
| k3 | 21.71 | 22.89 | 20.57 | 21.97 | |
| R | 2.3 | 3.4 | 3.53 | 3.32 | |
| Order | C>B>D>A | ||||
| Optimal combination | A1B2C1D1 | ||||
| Bending strength | K1 | 92.99 | 89.36 | 79.68 | 94.16 |
| K2 | 91.84 | 85.87 | 91.14 | 82.02 | |
| K3 | 77.55 | 87.14 | 91.55 | 86.2 | |
| k1 | 31 | 29.79 | 26.56 | 31.39 | |
| k2 | 30.61 | 28.62 | 30.38 | 27.34 | |
| k3 | 25.85 | 29.05 | 30.52 | 28.73 | |
| R | 5.15 | 1.16 | 3.96 | 4.05 | |
| Order | A>D>C>B | ||||
| Optimal combination | A1B1C3D1 | ||||
Table 5.
Comprehensive score.
| Test number | Tensile strength (MPa) | Bending strength (MPa) | T | ||
| Test 1 | 25.65 | 31.27 | 1 | 0.79 | 0.89 |
| Test 2 | 25.33 | 29.88 | 0.97 | 0.67 | 0.82 |
| Test 3 | 21.05 | 31.83 | 0.5 | 0.84 | 0.67 |
| Test 4 | 21.01 | 32.06 | 0.49 | 0.86 | 0.68 |
| Test 5 | 24.17 | 33.68 | 0.84 | 1 | 0.92 |
| Test 6 | 22.82 | 26.1 | 0.69 | 0.33 | 0.51 |
| Test 7 | 16.5 | 26.03 | 0 | 0.33 | 0.16 |
| Test 8 | 23.85 | 22.31 | 0.8 | 0 | 0.4 |
| Test 9 | 24.79 | 29.21 | 0.91 | 0.61 | 0.76 |
Table 6.
Comprehensive scoring analysis results.
| A | B | C | D | |
| K1 | 2.38 | 1.73 | 1.81 | 2.57 |
| K2 | 2.11 | 2.14 | 2.25 | 1.49 |
| K3 | 1.32 | 1.94 | 1.75 | 1.74 |
| k1 | 0.79 | 0.58 | 0.6 | 0.86 |
| k2 | 0.7 | 0.71 | 0.75 | 0.5 |
| k3 | 0.44 | 0.65 | 0.58 | 0.58 |
| R | 0.35 | 0.13 | 0.17 | 0.36 |
| Order | D>A>C>B | |||
| Optimal combination | A1B2C2D1 | |||
Table 7.
Experimental verification of optimal parameters combination.
| Optimal combination | Tensile strength (MPa) | Bending strength (MPa) |
| A1B2C2D1 | 26.34 | 41.54 |
Disclaimer/Publisher’s Note: The statements, opinions and data contained in all publications are solely those of the individual author(s) and contributor(s) and not of MDPI and/or the editor(s). MDPI and/or the editor(s) disclaim responsibility for any injury to people or property resulting from any ideas, methods, instructions or products referred to in the content. |
© 2024 by the authors. Licensee MDPI, Basel, Switzerland. This article is an open access article distributed under the terms and conditions of the Creative Commons Attribution (CC BY) license (http://creativecommons.org/licenses/by/4.0/).
Copyright: This open access article is published under a Creative Commons CC BY 4.0 license, which permit the free download, distribution, and reuse, provided that the author and preprint are cited in any reuse.


