
Submitted:
30 November 2024
Posted:
02 December 2024
You are already at the latest version
Abstract
Background/Objectives: Bicuspid aortic valve (BAV) is a prevalent congenital heart defect that continues to present a significant challenge in the management of paediatric patients. The assessment of left ventricle systolic function is typically conducted through the measurement of the left ventricular ejection fraction. Currently, left ventricle global longitudinal strain (LV GLS) is regarded as a more sensitive indicator, enabling the quantitative assessment of global and segmental ventricular function through the determination of myocardial deformation. Methods: A prospective study was conducted between 10 January 2023 and 10 January 2024 in a tertiary paediatric cardiology referral centre. The study enrolled children aged 6 to 17 years with BAV who were undergoing periodic evaluation, as well as a control group. The primary objective is to analyse the systolic function (global and segmental LV) using the classical method (LV EF) and speckle tracking echocardiography (STE). Results: The study group comprised 73 patients with a mean age of 13 years, with a male predominance. The control group comprised 55 patients. The phenotype IB with aortic regurgitation (AR) was the most prevalent. The results of the STE evaluation in the control group demonstrate mean GLS values between -22.1% and -22.8%. A comparison of the BAV group and the control group revealed a significant difference in GLS for the apical four-chamber view (p = 0.022).
Keywords:
bicuspid aortic valve
; speckle tracking
; left ventricle function
; coarctation of the aorta
; aortic stenosis
; aortic regurgitation
; aortopathy
1. Introduction
The bicuspid aortic valve (BAV) is a common congenital heart defect that remains challenging to treat in childhood. It can either be undetected or associated with a range of other conditions, including aortic stenosis (AS), aortic regurgitation (AR), coarctation of the aorta (CoA), aortic dilatation, or other congenital heart defects. The progression of these pathologies is variable, and the results published in the literature are still incomplete [1]. BAV may remain asymptomatic, except in the presence of ductal obstructive lesions (severe AS associated with BAV, CoAo, etc.). It is a common occurrence for patients with a BAV to experience a deterioration in the functionality of their aortic valve, along with the development of significant aortopathies. In over 50% of cases where this condition is present, surgical intervention is required within 25 years of diagnosis [2,3]. In contrast to the tricuspid aortic valve, BAV have been observed to induce an abnormal, turbulent flow pattern accompanied by elevated tissue stresses. This phenomenon is particularly concentrated in the abnormally large cusps and at the raphe [4,5].
In the context of aortic regurgitation (AR), this phenomenon results in left ventricular (LV) volume overload as a consequence of the regurgitant flow from the aorta into the LV. This is caused by incomplete aortic valve closure during diastole. AR results in progressive myocardial injury through a number of complex mechanisms, including volume overload of the LV, increased afterload, and myocardial ischaemia. In the event that the compensatory mechanisms for these myocardial injury factors prove inadequate, cardiac failure will ensue, with an unfavourable prognosis. It is therefore recommended that surgical intervention be considered when significant LV enlargement and/or systolic dysfunction are observed in severe aortic regurgitation, in order to prevent the development of symptomatic cardiac failure [6].
It is established that a hyperdynamic state occurs in patients with a bicuspid aortic valve and aortic stenosis. This must be considered when making a clinical decision regarding the optimal timing of treatment. It is therefore important to analyse the contractile function of the LV. It seems that the longitudinal subendocardial fibres are the first to be impacted by exposure to pressure overload. Consequently, the earliest changes in these fibres are recorded long before alterations in the shortening or ejection fraction become apparent [7].
The LV myocardium is characterised by a complex architecture, comprising circumferential fibres in the midwall layer and longitudinal fibres in the endocardial and epicardial layers. Secondarily, this results in inhomogeneous and complex contraction patterns, with permanent changes in myofibre orientation. These changes are observed from right-handed helices in the subendocardium to left-handed helices in the subepicardium. Deformation of the LV was observed to occur in the form of radial thickening, as well as longitudinal and circumferential shortening. Left ventricular ejection fraction (LVEF) represents the standard method for assessing left ventricular systolic function in both adults and children. At present, LV global longitudinal strain (GLS) is regarded as a more sensitive indicator. LV GLS enables a quantitative assessment of global and segmental ventricular function by determining/measuring myocardial deformation, independent of ventricular geometry and angle. It is possible for GLS to be reduced prior to a decline in LV EF being observed. In order to utilise GLS for the assessment of LV function in paediatrics, it is essential to be aware of the typical range of normal values [8,9].
It is also essential to consider the impact of "physiological variation," which encompasses patient demographic data (age, gender, and clinical factors such as heart rate, blood pressure, and body surface area weight), equipment and technique variables (software, frame rate, and heart rate), and other factors [10,11].
With regard to the evaluation of myocardial dysfunction in children, a number of meta-analyses have been conducted with the objective of establishing a threshold. One such meta-analysis is that conducted by Philip T. Levy and colleagues on the normality of LV deformation in paediatric patients. The objective of the authors was to define a range of normal measures of LV deformation. To this end, they collated data from all studies that reported values for cohorts of paediatric patients deemed to be in a normal state or under control. Accordingly, the mean GLS LV was set at -20.2% (95% CI, -19.5% to -20.8%) in healthy children. In a separate meta-analysis, Jashari et al. determined that the mean normal GLS values ranged from -12.9 to -26.5 (mean, -20.5; 95% CI, -20.0 to -21.0) [12,13].
The findings of multiple studies conducted on adult patients with a BAV and associated AS and/or AR, respectively with or without ascending aorta dilatation, have demonstrated that GLS is an independent predictor of long-term adverse outcomes in patients presenting with minimal symptoms and a preserved EF [14,15].
Although this assessment method is becoming increasingly important for evaluating cardiac dysfunction in children, there is currently a paucity of data on the efficacy of these novel parameters, necessitating further investigation.
2. Materials and Methods
A prospective observational analytic study was conducted between 10 January 2023 and 10 January 2024 at a tertiary paediatric cardiology referral centre. The study enrolled children aged 6 to 17 years old with previously known BAV who were undergoing periodic evaluation. Furthermore, a control group of healthy children, matched for anthropometric data, was included in the study.
The exclusion criteria included age below five years, genetic syndromes, metabolic disorders, oncological diagnoses, hepatic diseases, and chronic illnesses of the respiratory or renal systems.
2.2. Cardiac Ultrasound Evaluation
All echocardiograms were conducted using a Philips-EPIQ CVx 3D nSIGHT Plus ultrasound device (Philips, United States of America, Andover, Massachusetts). The acquired images were stored in digital imaging and communications in medicine (DICOM) format and subsequently analysed offline. The aortic valve phenotype was determined by analysing parasternal short-axis sections. The valve phenotype was classified according to the number of raphes and the spatial configuration of the cusps. The currently available standard terminology was used, based on the most recently published data for BAV [16]. The parasternal long axis view was employed to calculate z scores, perpendicular to the long axis of the aorta, utilising the inner edge technique (aortic annulus, aortic root, sinotubular junction [STJ], and ascending aorta [1 cm distal to the STJ]) [16,17]. In each case, the value of the diameter was obtained by calculating the mean of the diameters measured in three consecutive beats. Furthermore, a Z-score was calculated by correlating body surface area with aortic annulus, aortic root, STJ and ascending aorta using the Cantinotti formula [17,18].The diagnosis of AS was based on the measurement of the peak and mean pressure gradients (calculated using the simplified Bernoulli equation) using continuous wave Doppler ultrasound. The classification of AR was as follows: absent/none, moderate and severe.
The suprasternal view was employed to observe the aortic arch, its branches, and the descending aorta, with a view to determining whether CoAo was present or absent.
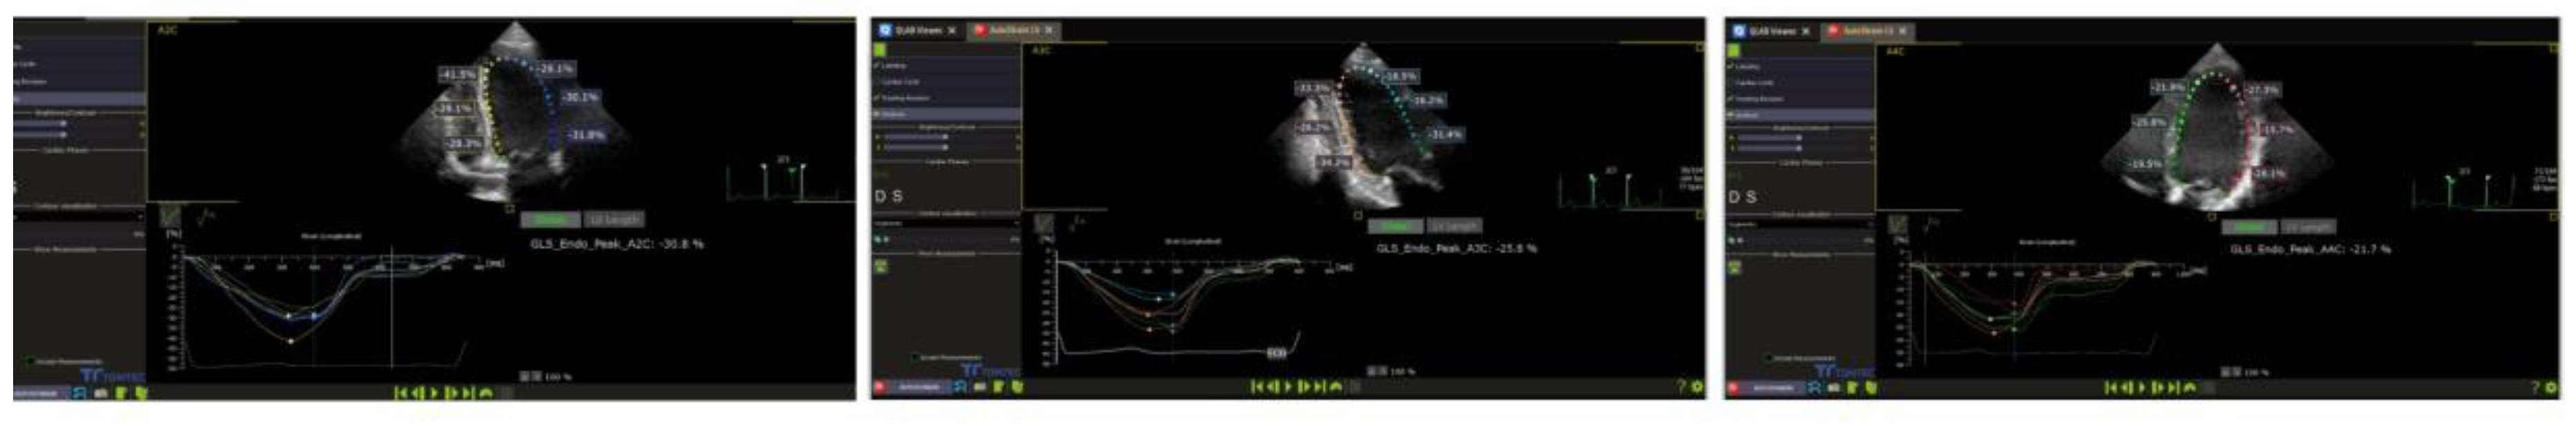
LV systolic function was evaluated in accordance with the current guidelines for systolic function analysis. Ejection fraction (EF) was calculated using the Teicholz formula in the absence of an asynchrony sign and the modified Simpson method (2D apical four-chamber). The 2D speckle tracking method was subsequently analysed offline using the left ventricular autostrain functions of the Philips QLAB 15 software (figure1). A two-dimensional evaluation, typical for the apical 4, 2 and 2 chamber view (2D speckle tracking echocardiography - STE), within a frame rate of over 70 Hz, was employed to analyse GLS and left ventricular segmental strain. This was done as the interventricular septum and walls were divided into three segments (inferior ventricular - IV basal, IV medial, IV apical; left ventricular - LV basal, LV medial, LV apical). The aforementioned parameters were then compared between the two study groups [17]– poza strain.
Figure 1.
Representative example of left ventricular global longitudinal strain from the study sample.
Figure 1.
Representative example of left ventricular global longitudinal strain from the study sample.
2.1. Statistical Analysis
The statistical analysis was conducted using the R statistical computing platform [19], and graphical representations were generated with the matplotlib Python library for data visualisation. Categorical data were presented as a number and percentage, while continuous parametric data were expressed as mean ± standard deviation, and non-parametric continuous data as median (interquartile range). The assumption of normality was evaluated through the implementation of the Kolmogorov-Smirnov test. Comparisons of central tendency were conducted using t-tests for parametric data and Mann-Whitney tests for non-parametric data. In instances where multiple groups were involved, a one-way ANOVA was employed for parametric data, with post-hoc Tukey tests subsequently conducted. For non-parametric data, a Kruskal-Wallis test was utilised, with Dunn's test employed for post-hoc analysis. Frequency comparisons were performed using variations of the Chi-square test. A significance level of α = 0.05 was considered for all analyses.
2.4. Ethics
The research was conducted in accordance with the principles set forth in the Declaration of Helsinki. Prior to inclusion in the study, the research team obtained a signed informed consent form from at least one of the legal tutors of each child. The research protocol was approved by the Ethics Committee of the Târgu Mureș Emergency Institute for Cardiovascular Diseases and Transplantation (approval no. 8902/20.12.2022) and by that of the George Emil Palade University of Medicine, Pharmacy, Science, and Technology of Târgu Mureș (approv. no.2034/26.01.2023).
2.2. Objectives
The primary objective of this study was to analyse the systolic function (global and segmental LV) by the classical method (LV EF) and by speckle tracking in order to quantify the degree of LV dysfunction in the BAV and control groups. The objective was to analyse the capacity of the aforementioned factors to discriminate between groups and their relation with the degree of valvular regurgitation, aortic stenosis, aortopathy and coarctation of the aorta. The objective of this review is to enhance comprehension of the contributions of global longitudinal strain (GLS) to the evaluation and management of patients with BAV in clinical practice.
2.3. Definitions
FE – was calculated using the Teicholz formula (in the absence of an asynchrony sign, short axis) and the modified Simpson method (2D aA4C -apical four-chamber).
LV systolic LV dysfunction, based on 2D speckle tracking echocardiography, was defined as an LVGLS value of less than -20.2%, which is consistent with the 2016 meta-analysis by Levy and colleagues [17].
The aortic bicuspid phenotypes were classified as follows: fused BAV (1A-right-left cusp fusion, 1B-right non-cusp fusion, 1C-left non-cusp fusion and indeterminate phenotypes); 2-sinus BAV (laterolateral and anteroposterior phenotypes); and partial-fusion BAV and/or mild BAV forms (small raphe, single phenotype) [20].
Aortic stenosis was classified in accordance with the recommendations set forth in the guideline as follows: mild (mean gradient < 20 mm Hg and peak velocity < 3 m/s), moderate (mean gradient between 20-40 mm Hg), and severe (mean gradient > 40 mm Hg and peak valve velocity > 4 m/s) [20,21].
The classification of AR was based on the ratio of jet width to annular diameter, which was assessed in the parasternal long-axis view. Additionally, the presence of descending aortic regurgitation was determined through colour Doppler imaging. Furthermore, left ventricular dimensions were evaluated, categorised as mild-normal, moderate-normal, dilated, or severe-dilated. Finally, the jet deceleration rate was considered, with values of CW (PHT pressure half-time, ms) categorised as slow (less than 500), moderate (between 500 and 200), or severe (less than 200) [20,22].
Aortopathy is defined, by convention, as the presence of an aortic root and/or ascending aorta dilatation with a Z score greater than two standard deviations (SD) [23].
Pro-BNP it considered normal at a cut off less than 178 ng/L for children with age between 1-19 years[24].
3. Results
The descriptive data and comparison of baseline characteristics are presented in Table 1.
The study group comprised 73 patients with a mean age of 13 years, with a male predominance (Figure 2).
No significant differences were identified between the BAV and control groups with regard to age, weight, body surface area or cardiac blood pressure. The results of the serum biomarker analysis for cardiac dysfunction (pro-BNP) demonstrated no changes indicative of dysfunction (mean values were 13.80 ng/L, compared to the reference cut-off of 178 ng/L).
With regard to the analysis of the BAV phenotype, the results indicate that 53.42% of the patients exhibited type IB, followed by phenotype O, IA, IC or II in 32.87%, 6.8%, 4.1 and 2.7% of cases, respectively (see Figure 3).
An additional element of analysis was the classification of the valvulopathy (insufficiency or regurgitation) in the BAV group. As illustrated in Table 2, the findings indicate that 68.49% of BAV cases exhibited mild aortic regurgitation.
With regard to the presence of aortic dilatation (aortopathy), the results of our study indicate that the study group (BAV group) exhibited significantly higher absolute values for aortic root and ascending aorta size than the control group (see Table 3).
The primary objective of the study was to quantify the degree of global and/or segmental VS dysfunction. The results demonstrated that the global contractile function, as quantified by EF and fractional shortening (FS), was comparable to that of the control group, with a mean value of 67%. This indicates that no global contractile dysfunction was identified (see Table 1).
The results of the STE evaluation in the control group indicate mean GLS values ranging from -22.1% to -22.8% for the global evaluation and from -18.6% to -29.15% for the segmental evaluation (Table 4).
A comparison of the BAV group and the control group revealed a significant difference in GLS for the A4C (p = 0.022). Moreover, the regional longitudinal strain was found to be significantly lower in the BAV group in the inferior segment (p = 0.04, -17.13%) and apical anteromedial (p = 0.03, -16.03%) from the A4C view, as well as in the anterior segment (p = 0.02, -22.73%). The results are presented in Table 5.
The potential influence of gender on the degree of segmental dysfunction in the study group was also investigated, with no statistically significant differences identified (Table 6).
The degree of segmental dysfunction by STE was analysed between the control group and the BAV group, which was divided into the following subgroups: Statistically significant results were observed in the comparisons between BAV and AR, BAV and AS, BAV and CoAo, and BAV and aortopathy (see Table 7).
To gain further insights from the data obtained, a post hoc analysis was conducted between the GLS A4C values of the lower SIV and anteromedial SIV segments, respectively, and the GLS A2C of the anteromedial SIV segment. This analysis was conducted between the control and BAV groups, which were divided according to their associated pathologies. The results of this analysis are presented in Table 8.
A comparison of GLS values by bicuspid phenotype was conducted in the BAV group, yet no statistically significant results were yielded. In contrast, the results of the segmental evaluation yielded statistically significant outcomes (Table 9).
A post-hoc analysis of the data set revealed the presence of statistically significant data between the mean values observed in the infero-lateral segment of the IVS in A3C, OLL, and IA phenotype with p-values of 0.02, IA and IB with p-values of 0.05, and IA and IC with p-values of 0.05 (Table 10).
With regard to the antero-medial segment of the IVS from A3C incidence, no statistically significant data were obtained.
4. Discussion
In addition to an increased prevalence in the general population, BAV is an important contributor to paediatric morbidity due to the presence of coexisting valvulopathy-aortopathy complexes, including aortic stenosis/insufficiency and/or aortic dilatation, which manifest at different stages of childhood and are less frequently associated with infective endocarditis [20,25,26,27]. As has been demonstrated in the majority of studies conducted in both paediatric and adult pathology, bicuspid aortic valve is the most prevalent in males. This finding is supported by the results of our study. The mean age of the subjects in the study was 13 years, with no significant difference between the two groups. In patients with BAV, stress overload on both leaflets, particularly at the site of fusion, is a factor in the accelerated degeneration of the valve [27].
The morphology of the valve may serve as an indicator of potential issues related to stenosis, insufficiency, or both. In a comprehensive multicentre retrospective study (MIBAVA Consortium) encompassing over 2000 children with BAV (mean age 10.2 years), the most prevalent morphology was identified as IA fusion (65.7%), followed by IB fusion (32.9%) [27]. The IB phenotype was identified as the most prevalent, occurring in both patients with aortic stenosis/insufficiency and those with coarctation of the aorta. Some studies have demonstrated that paediatric patients with left heart obstructive lesions are more frequently observed to present a right-to-left (R-L) cusp fusion [20,27]. Additionally, the MIBAVA Consortium study revealed that R-L fusion was associated with aortic coarctation, whereas R-N fusion was associated with the development of valve dysfunction, including stenosis and/or regurgitation. In the present study, the most frequently observed valve dysfunction was mild aortic regurgitation. The morphology of BAV is an important factor that could directly influence the dilatation of the aorta. It has been demonstrated in previous studies that the IB phenotype is most often associated with dilatation of the ascending aorta and is usually associated with aortic insufficiency. This was also demonstrated in the present study, in which 30 patients had aortopathy, of whom 14 had the IB phenotype. The literature reports indicate that the IB phenotype is associated with a poorer prognosis in terms of the progression of valvular lesions (As/AR), which is a crucial consideration in the follow-up of paediatric patients with BAV [28]. The Z-scores of children with BAV appear to be higher at the site of the annulus, sinus valsalva, sinutubular junction and ascending aorta [29]. The present study revealed statistically significant differences between the absolute size and Z-scores of the aortic annulus, sinus valsalva, sinotubular junction and ascending aorta. Proximal ascending aortic dilatation is a common finding in paediatric and adolescent patients with BAV, occurring in approximately 50% of cases. It is hypothesised that haemodynamic and genetic factors may explain the link with aortic disease. The MIBAVA Consortium study demonstrated a correlation between R-N fusion and an enlarged aorta, indicating a potential genetic influence. In other instances, haemodynamic factors appear to be implicated, with aortic regurgitation linked to wider sinotubular junction diameters [27,30]. Aortic dilatation appears to progress at a relatively slow rate during childhood. In a recent series [31], the low progression was also confirmed in infancy and adolescence, which are characterised by high somatic growth. The mean increase in the aortic root and ascending aorta was 1.00 mm per year. The prevalence and progression of aortic dilatation are less frequent in BAV associated with aortic coarctation than in isolated BAV. Furthermore, the presence of AR has been associated with larger proximal ascending aortic diameters [17].
With regard to bicuspid aortic valve associated with a valvular lesion, studies have demonstrated that valvular lesions (severe/moderate stenosis or severe/moderate regurgitation) in childhood may serve as an important predictor of aortopathy and its progression. The risk of developing significant aortic dilatation in early adulthood was found to be ninefold higher in patients presenting with both mild stenosis and regurgitation. This indicates that haemodynamic factors exert a significant influence [32].Given the distinctive aortic morphology, the use of specific aortic nomograms for children and adolescents with BAV may prove beneficial in monitoring this progression [27,28].
In relation to the primary objective of the study, speckle analysis of the degree of segmental dysfunction represents a valuable tool for the early detection of subclinical dysfunction in the LV, extending beyond the limitations associated with reference values based on age group, gender, and the experience of the investigator. The data from the literature highlight the significance of this parameter in a range of congenital and acquired heart diseases in children [33,34]. The analysis of healthy children revealed that the GLS values of the left ventricle ranged from -19.95% to -24.00 (mean: -22.10%), values that were comparable to those obtained in the meta-analysis conducted by Levy et al. and Jashari et al. The mean values of left ventricular deformation, as determined by segmental speckle evaluation, were as follows: basal (-18.85, -21.50 and -27.60), mid-basal (-22.92, -25.77 and -23.8) and apical (-24.72, -24.7 and -22.62). The mean GLS of the A4C was -20.49% for the BAV group, with a mean EF of 67%.
The assessment of segmental VS deformity revealed statistically significant differences between the two groups at the segmental level, specifically in the basal and medial anterolateral segments in A4C and the antero-medial segment in A2C. In an analysis of aortic strain in adults with BAV, Carlos et al. demonstrated that LV-GLS was reduced, indicating subclinical impaired LV contraction. This finding is consistent with the results of previous studies that have demonstrated alterations in LV mechanics in BAV patients, with a reduction in longitudinal, circumferential, and radial strains, even in the presence of mild valvular disease or in the absence of AS, AR, or aortopathy [35]. Impaired GLS is more common in cases of valvular dysfunction and is linked to the risk of aortic valve replacement, even in BAV patients [27,36]. The results of our study indicate that individuals with AS exhibit reduced GLS values. Previous research has demonstrated that AS is associated with diminished values of the inferoseptal or anteroseptal wall of the LV base and the midportion of the LV. These findings are consistent with those of the present study. The observed reductions in GLS are attributed to ischemia and lesions, as evidenced by 2D strain analysis [36]. Myocardial fibrosis is an early phenomenon in the natural history of AS, impairing both diastolic and systolic function. It provides a substrate for ventricular arrhythmias and plays a role in the progression to heart failure and sudden cardiac death. These observations indicate that the current echocardiographic assessment of LV function using LVEF alone is insufficient. The development of new parameters for the detection of subtle myocardial impairment is therefore required in order to improve risk stratification and outcome prediction in AS patients [37]. In adults, impaired GLS has been observed in asymptomatic patients with severe AS but preserved EF, who are at an elevated risk of developing symptoms and requiring surgical intervention [27,38]. There is mounting evidence to suggest that GLS has a prognostic role in asymptomatic patients with AS. The American Society of Echocardiography has acknowledged the additional value of LV GLS over traditional LVEF measurements and has recommended its clinical use in patients [38,39].
It is becoming increasingly recognised as a means of guiding the management of valvular heart disease. In AR, the longitudinal orientation of myocardial fibres in the subendocardial layer results in decreased longitudinal contraction, which is an early indicator of LV dysfunction [40]. In patients with asymptomatic moderate aortic regurgitation and preserved ejection fraction, reduced global longitudinal strain is associated with an increased risk of mortality in those who did not undergo aortic surgery.
It is noteworthy that the cohort of patients with coarctation and BAV exhibited lower GLS values. Of the patients with CoAo, nine had undergone surgical treatment, while two were not yet indicated for surgical or interventional treatment. In a prospective study of adults with aortic coarctation who had undergone surgical treatment, Myrthe E. Menting and colleagues observed that LV GLS values were lower compared with the control group (-17.1% +/- 2.3 vs. -20.2% +/- 1.6, p < 0.001) [41].
Further investigation is required to determine whether reduced LV GLS in the paediatric population with BAV ultimately results in clinical heart failure and can identify patients with subclinical heart failure. Additionally, the potential of early detection to reduce morbidity warrants further study. Therefore, GLS may assist in risk stratification, enabling the identification of the optimal timing for treatment (surgical or interventional) [27].
5. Limitations
It is important to note that our study is subject to several limitations. Firstly, it was conducted at a single centre with a relatively small sample size. The study cohort comprised children with an average age of 13 years. However, the period of the newborn and infant was not analysed. The investigation did not extend to the measurement of circumferential and radial strain of the LV for comparison. A further limitation of the study was the lack of evaluation of intra-observer reproducibility. A further limitation is the heterogeneous distribution of subjects in relation to age. Despite the absence of a significant correlation between age values and longitudinal strain measurements, future studies should re-examine the reproducibility feature and reference intervals according to age groups.
The study is further limited by the lack of standardization, the use of Z scores to analyse aortopathy, which may result in changes to reference values, and the limitations of 2D imaging in terms of image quality, artefacts, image dropout and frame rate.
Further long-term, multicentre, multi-arm studies with larger groups are required in these areas. The present study was merely observational in nature and thus warrants comparison with a meta-analysis.
6. Conclusions
Despite the normal values of EF and FS observed in the global LV function analysis of patients with BAV, the strain analysis revealed significantly reduced values in the inferior segment and in the apical four-chamber view, as well as in the anterior segment.
In BAV associated with CoAo, GLS LV values demonstrated significantly reduced values, which were statistically significant in comparison with the other BAV groups (stenosis/insufficiency) and implicit in comparison with the control group.
The most prevalent phenotype was IB, which was observed in conjunction with mild aortic regurgitation.
Author Contributions
A.F. conceptualized the study and was involved in data curation, together with L.G., D.T., C.Ș., S.E.G.-R., C.G, M.C and F.C.A.-A.; A.F., S.G.-R., C.G, F.C.A-A were involved in database creation and design; S.E.G.R, C.G carried out the statistical analysis,; A.F., S.E.G.R, C.G and M.C drafted the initial version of the manuscript; Correction and final checks were performed by A.F., D.T, L.G. and C.Ș. All authors have read and agreed to the published version of the manuscript.
Funding
This research was funded by the University of Medicine, Pharmacy, Science and Technology ‘’George Emil Palade’’ of Târgu Mureș Research, grant number 163/1/10.01.2023.
Institutional Review Board Statement
The research protocol was approved by the Ethics Committee of the Târgu Mureș Emergency Institute for Cardiovascular Diseases and Transplantation (approval no. 8902/20.12.2022) and by the one of the George Emil Palade University of Medicine, Pharmacy, Science, and Technology of Târgu Mureș (approval no. 2034/26.01.2023).
Informed Consent Statement
Written informed consent was obtained from the legal tutor/tutors of the patients prior to inclusion in the study.
Data Availability Statement
The original contributions presented in the study are included in the article; further inquiries can be directed to the corresponding author.
Conflicts of Interest
The authors declare no conflicts of interest.
References
- Zhang Y, Xiong T-Y, Sondergard L, Mylotte D, Piazza N, Prendergast B and Chen M (2023) Editorial: Bicuspid aortic valve: from pathophysiological mechanisms, imaging diagnosis to clinical treatment methods. Front. Cardiovasc. Med. 10:1193544. [CrossRef]
- C. Basso, An echocardiographic survey of primary school children for bicuspid aortic valve, Am J Cardiol, 2004; S.C. Siu et al., Bicuspid aortic valve disease,J Am Coll Cardiol, 2010.
- Richard Emmett Frye, Benjamin Ittleman et. al.Left ventricular strain in pediatric patients with bicuspid aortic valves and aortopathy,Progress in Pediatric Cardiology,Volume 69,2023,101636,ISSN 1058-9813. https://www.sciencedirect.com/science/article/pii/S1058981323000243. [CrossRef]
- Mathieu P, Bossé Y, Huggins GS, Della Corte A, Pibarot P, Michelena HI, Limongelli G, Boulanger MC, Evangelista A, Bédard E, Citro R, Body SC, Nemer M, Schoen FJ. The pathology and pathobiology of bicuspid aortic valve: State of the art and novel research perspectives. J Pathol Clin Res. 2015 Jun 24;1(4):195-206. [CrossRef] [PubMed]
- Henry, Matthew et al.Flow Dynamics in Children With Bicuspid Aortic Valve: A Blood Speckle Tracking Study,Ultrasound in Medicine and Biology, Volume 49, Issue 11, 2354 - 2360.
- Ghiragosian C, Harpa M, Puscas A, Balau R, Al-Hussein H, Ghiragosian-Rusu SE, Avram C, Baba DF, Neagoe R, Suciu H. Histidine-Tryptophan-Ketoglutarate Cardioplegia Yields Different Results in Aortic Valve Surgery Depending on Patient Gender: A Pilot Study. Cureus. 2024 Aug 21;16(8):e67372. [CrossRef] [PubMed]
- Anastasiou V., Daios S., Bazmpan M.A Shifting from Left Ventricular Ejection Fraction to Strain Imaging in Aortic Stenosis. Diagnostics 2023, 13, 1756. [CrossRef]
- J. Van der Ende, Clara A. Vázquez Antona, et al.,Left Ventricular Longitudinal Strain Measured by Speckle Tracking as a Predictor of the Decrease in Left Ventricular Deformation in Children with Congenital Stenosis of the Aorta or Coarctation of the Aorta,Ultrasound in Medicine & Biology,Volume 39, Issue 7,2013,1207-1214,ISSN 0301-5629.
- Cheung YF. Echocardiographic strain imaging: what do paediatric cardiologists need to know? Pediatr Med 2022;5:38. [CrossRef]
- Levy PT, Machefsky A, Sanchez AA, et al. Reference Ranges of Left Ventricular Strain Measures by Two-Dimensional Speckle-Tracking Echocardiography in Children: A Systematic Review and Meta-Analysis. J Am Soc Echocardiogr 2016;29:209-225.e6.
- Jashari H, Rydberg A, Ibrahimi P, Bajraktari G, Kryeziu L, Jashari F, Henein MY. Normal ranges of left ventricular strain in children: a meta-analysis. Cardiovasc Ultrasound. 2015 Aug 7;13:37. [CrossRef] [PubMed]
- Peyman Naji, MD, Shailee Shah, MD, Lars G. Svensson, Incremental Prognostic Use of Left Ventricular Global Longitudinal Strain in Asymptomatic/Minimally Symptomatic Patients With Severe Bioprosthetic Aortic Stenosis Undergoing Redo Aortic Valve Replacement Circulation: Cardiovascular ImagingVolume 10, Issue 6, June 2017. [CrossRef]
- Richard Emmett Frye, Benjamin Ittleman et. al.Left ventricular strain in pediatric patients with bicuspid aortic valves and aortopathy,Progress in Pediatric Cardiology,Volume 69,2023,101636,ISSN 1058-9813. https://www.sciencedirect.com/science/article/pii/S1058981323000243. [CrossRef]
- Michelena, H.I.; Della Corte, A.; Evangelista, A.; Maleszewski, J.J.; Enriquez-Sarano, M.; Bax, J.J.; Otto, C.M.; Schäfers, H.-J. Speaking a Common Language: Introduction to a Standard Terminology for the Bicuspid Aortic Valve and Its Aortopathy. Prog. Cardiovasc. Dis. 2020, 63, 419–424. [Google Scholar] [CrossRef] [PubMed]
- Leo Lopez, Daniel L. Saurers et. Colab.,Guidelines for Performing a Comprehensive Pediatric Transthoracic Echocardiogram: Recommendations From the American Society of Echocardiography,Journal of the American Society of Echocardiography,Volume 37, Issue 2,2024,Pages 119-170,ISSN 0894-7317. [CrossRef]
- Cantinotti, M.; Giordano, R.; Scalese, M.; Murzi, B.; Assanta, N.; Spadoni, I.; Maura, C.; Marco, M.; Molinaro, S.; Kutty, S.; et al. Nomograms for Two-Dimensional Echocardiography Derived Valvular and Arterial Dimensions in Caucasian Children. J. Cardiol. 2017, 69, 208–215. [Google Scholar] [CrossRef] [PubMed]
- R Core Team (2024). R: A language and environment for statistical computing. R Foundation for Statistical Computing, Vienna, Austria. URL: https://www.R-project.org/.
- Făgărășan, A.m Săsăran, M.O. et. al. Circulating Matrix Metalloproteinases for Prediction of Aortic Dilatation in Children with Bicuspid Aortic Valve: A Single-Center, Observational Study. Int. J. Mol. Sci. 2024, 25, 10538. [CrossRef]
- Baumgartner, H.; Hung, J.; Bermejo, J.; Chambers, J.B.; Evangelista, A.; Griffin, B.P.; Iung, B.; Otto, C.M.; Pellikka, P.A.; Quiñones, M.; et al. Echocardiographic Assessment of Valve Stenosis: EAE/ASE Recommendations for Clinical Practice. J. Am. Soc. Echocardiogr. 2009, 22, 1–23, quiz 101. [Google Scholar] [CrossRef] [PubMed]
- Vahanian, A.; Beyersdorf, F.; Praz, F.; Milojevic, M.; Baldus, S.; Bauersachs, J.; Capodanno, D.; Conradi, L.; De Bonis, M.; De Paulis, R.; et al. 2021 ESC/EACTS Guidelines for the Management of Valvular Heart Disease: Developed by the Task Force for the Management of Valvular Heart Disease of the European Society of Cardiology (ESC) and the European Association for Cardio-Thoracic Surgery (EACTS). Eur. Heart J. 2022, 43, 561–632. [Google Scholar] [CrossRef] [PubMed]
- Anuhya, V. Pulapaka, Heather M. Giacone, Protecting Young Hearts: Sports Clearance for Young Patients at Risk for Sudden Cardiac Death, Current Pediatrics Reports, 13, 1, (111), (2024). [CrossRef]
- Senekovič Kojc, T.; Marčun Varda, N. Novel Biomarkers of Heart Failure in Pediatrics. Children 2022, 9, 740. [Google Scholar] [CrossRef] [PubMed]
- Jonathan J. Kusner et al.,The Natural History of Bicuspid Aortic Valve Disease,Structural Heart,Volume 7, Issue 2,2023,100119,ISSN 2474-8706. [CrossRef]
- Hjertaas JJ, Einarsen E, Gerdts E, et al. Impact of aortic valve stenosis on myocardial deformation in different left ventricular levels: A three-dimensional speckle tracking echocardiography study. Echocardiography. 2023; 40: 1028–1039. [CrossRef]
- Spaziani G, Girolami F, Arcieri L, Calabri GB, Porcedda G, Di Filippo C, Surace FC, Pozzi M, Favilli S. Bicuspid Aortic Valve in Children and Adolescents: A Comprehensive Review. Diagnostics (Basel). 2022 Jul 20;12(7):1751. [CrossRef] [PubMed]
- Ward, R. M. , Marsh, J. M., Gossett, J. M., Rettiganti, M. R., and Collins, R. N. (2018). Impact of bicuspid aortic valve morphology on aortic valve disease and aortic dilation in pediatric patients. Pediatr. Cardiol. 39, 509–517. [CrossRef]
- Liu Tianshu , Xie Mingxing et al. Bicuspid Aortic Valve: An Update in Morphology, Genetics, Biomarker, Complications, Imaging Diagnosis and Treatment.Frontiers in Physiology,9,2019,https://www.frontiersin.org/journals/physiology/articles/10.3389/fphys.2018.01921. [CrossRef]
- Verma, S., and Siu, S. C. (2014). Aortic dilatation in patients with bicuspid aortic valve. N. Engl. J. Med. 370, 1920–1929. [CrossRef]
- Yamauchi, M.S.W. , Puchalski M.D., Weng H.T., Pinto N.M., Etheridge S.P., Presson A.P., Tani L.Y., Minich L.L., Williams R.V. Disease progression and variation in clinical practice for isolated bicuspid aortic valve in children. Congenit. Heart Dis. 2018;13:432–439. [CrossRef]
- Blais, S. , Meloche-Dumas L., Fournier A., Dallaire F., Dahdah N. Long-term risk factors for dilatation of the proximal aorta in a large cohort of children with bicuspid aortic valve. Circ. Cardiovasc. Imaging. 2020;13:e009675. [CrossRef]
- Jashari H, Rydberg A, Ibrahimi P, Bajraktari G, Henein MY. Left ventricular response to pressure afterload in children: Aortic stenosis and coarctation: A systematic review of the current evidence Int J Cardiol. 2015;178:203–9.
- Chatterjee, Suman; Mukherjee, Somnath1; Rani, Neha2; Kumar, Prashant3,; Kumar, Prakash3; Sarkar, Achyut4. Assessment of Cardiac Function in Children by Strain Imaging and its Correlation with Conventional Echocardiographic Parameter. Annals of Cardiac Anaesthesia 25(3):p 264-269, Jul–Sep 2022. [CrossRef]
- Carlos, T. , Freitas A.A., Alves P.M., Martins R., Gonçalves L. Aortic strain in bicuspid aortic valve: An analysis. Int. J. Cardiovasc. Imaging. 2021;37:2399–2408. [CrossRef]
- Godlewski K, Dryżek P, Sadurska E et al. (2021) Left ventricular systolic function impairment in children after balloon valvuloplasty for congenital aortic stenosis assessed by 2D speckle tracking echocardiography. PLoS ONE 16(4): e0248862. [CrossRef]
- E. Salcedo, E., & A. Gill, E. (2021). Clinical Applications of Strain Imaging in Aortic Valve Disease. IntechOpen. [CrossRef]
- Alashi, A. , Mentias A., Abdallah A., Feng K., Gillinov A.M., Rodriguez L.L., Johnston D.R., Svensson L.G., Popovic Z., Griffin B.P., et al. Incremental prognostic utility of left ventricular global longitudinal strain in asymptomatic patients with significant chronic aortic regurgitation and preserved left ventricular ejection fraction. JACC Cardiovasc. Imaging. 2018;11:673–682. [CrossRef]
- Lang RM, Badano LP, Mor-Avi V, et al. Recommendations for cardiac chamber quantification by echocardiography in adults: An update from the American Society of Echocardiography and the European Association of Cardiovascular Imaging. Journal of the American Society of Echocardiography. 2015;28:1-39 e14.
- Marigliano, A.-N.; Ortiz, J.-T.; Casas, J.; Evangelista, A. Aortic Regurgitation: From Valvular to Myocardial Dysfunction. J. Clin. Med. 2024, 13, 2929. [Google Scholar] [CrossRef] [PubMed]
- Menting ME, Grootel RWJ, Bosch AE et al (2016) Quantitative assessment of systolic left ventricular function with speckle-tracking echocardiography in adult patients with repaired aortic coarctation. Int J Cardiovasc Imaging. 32(5):777–87.
Figure 2.
Gender distribution of BAV patients.
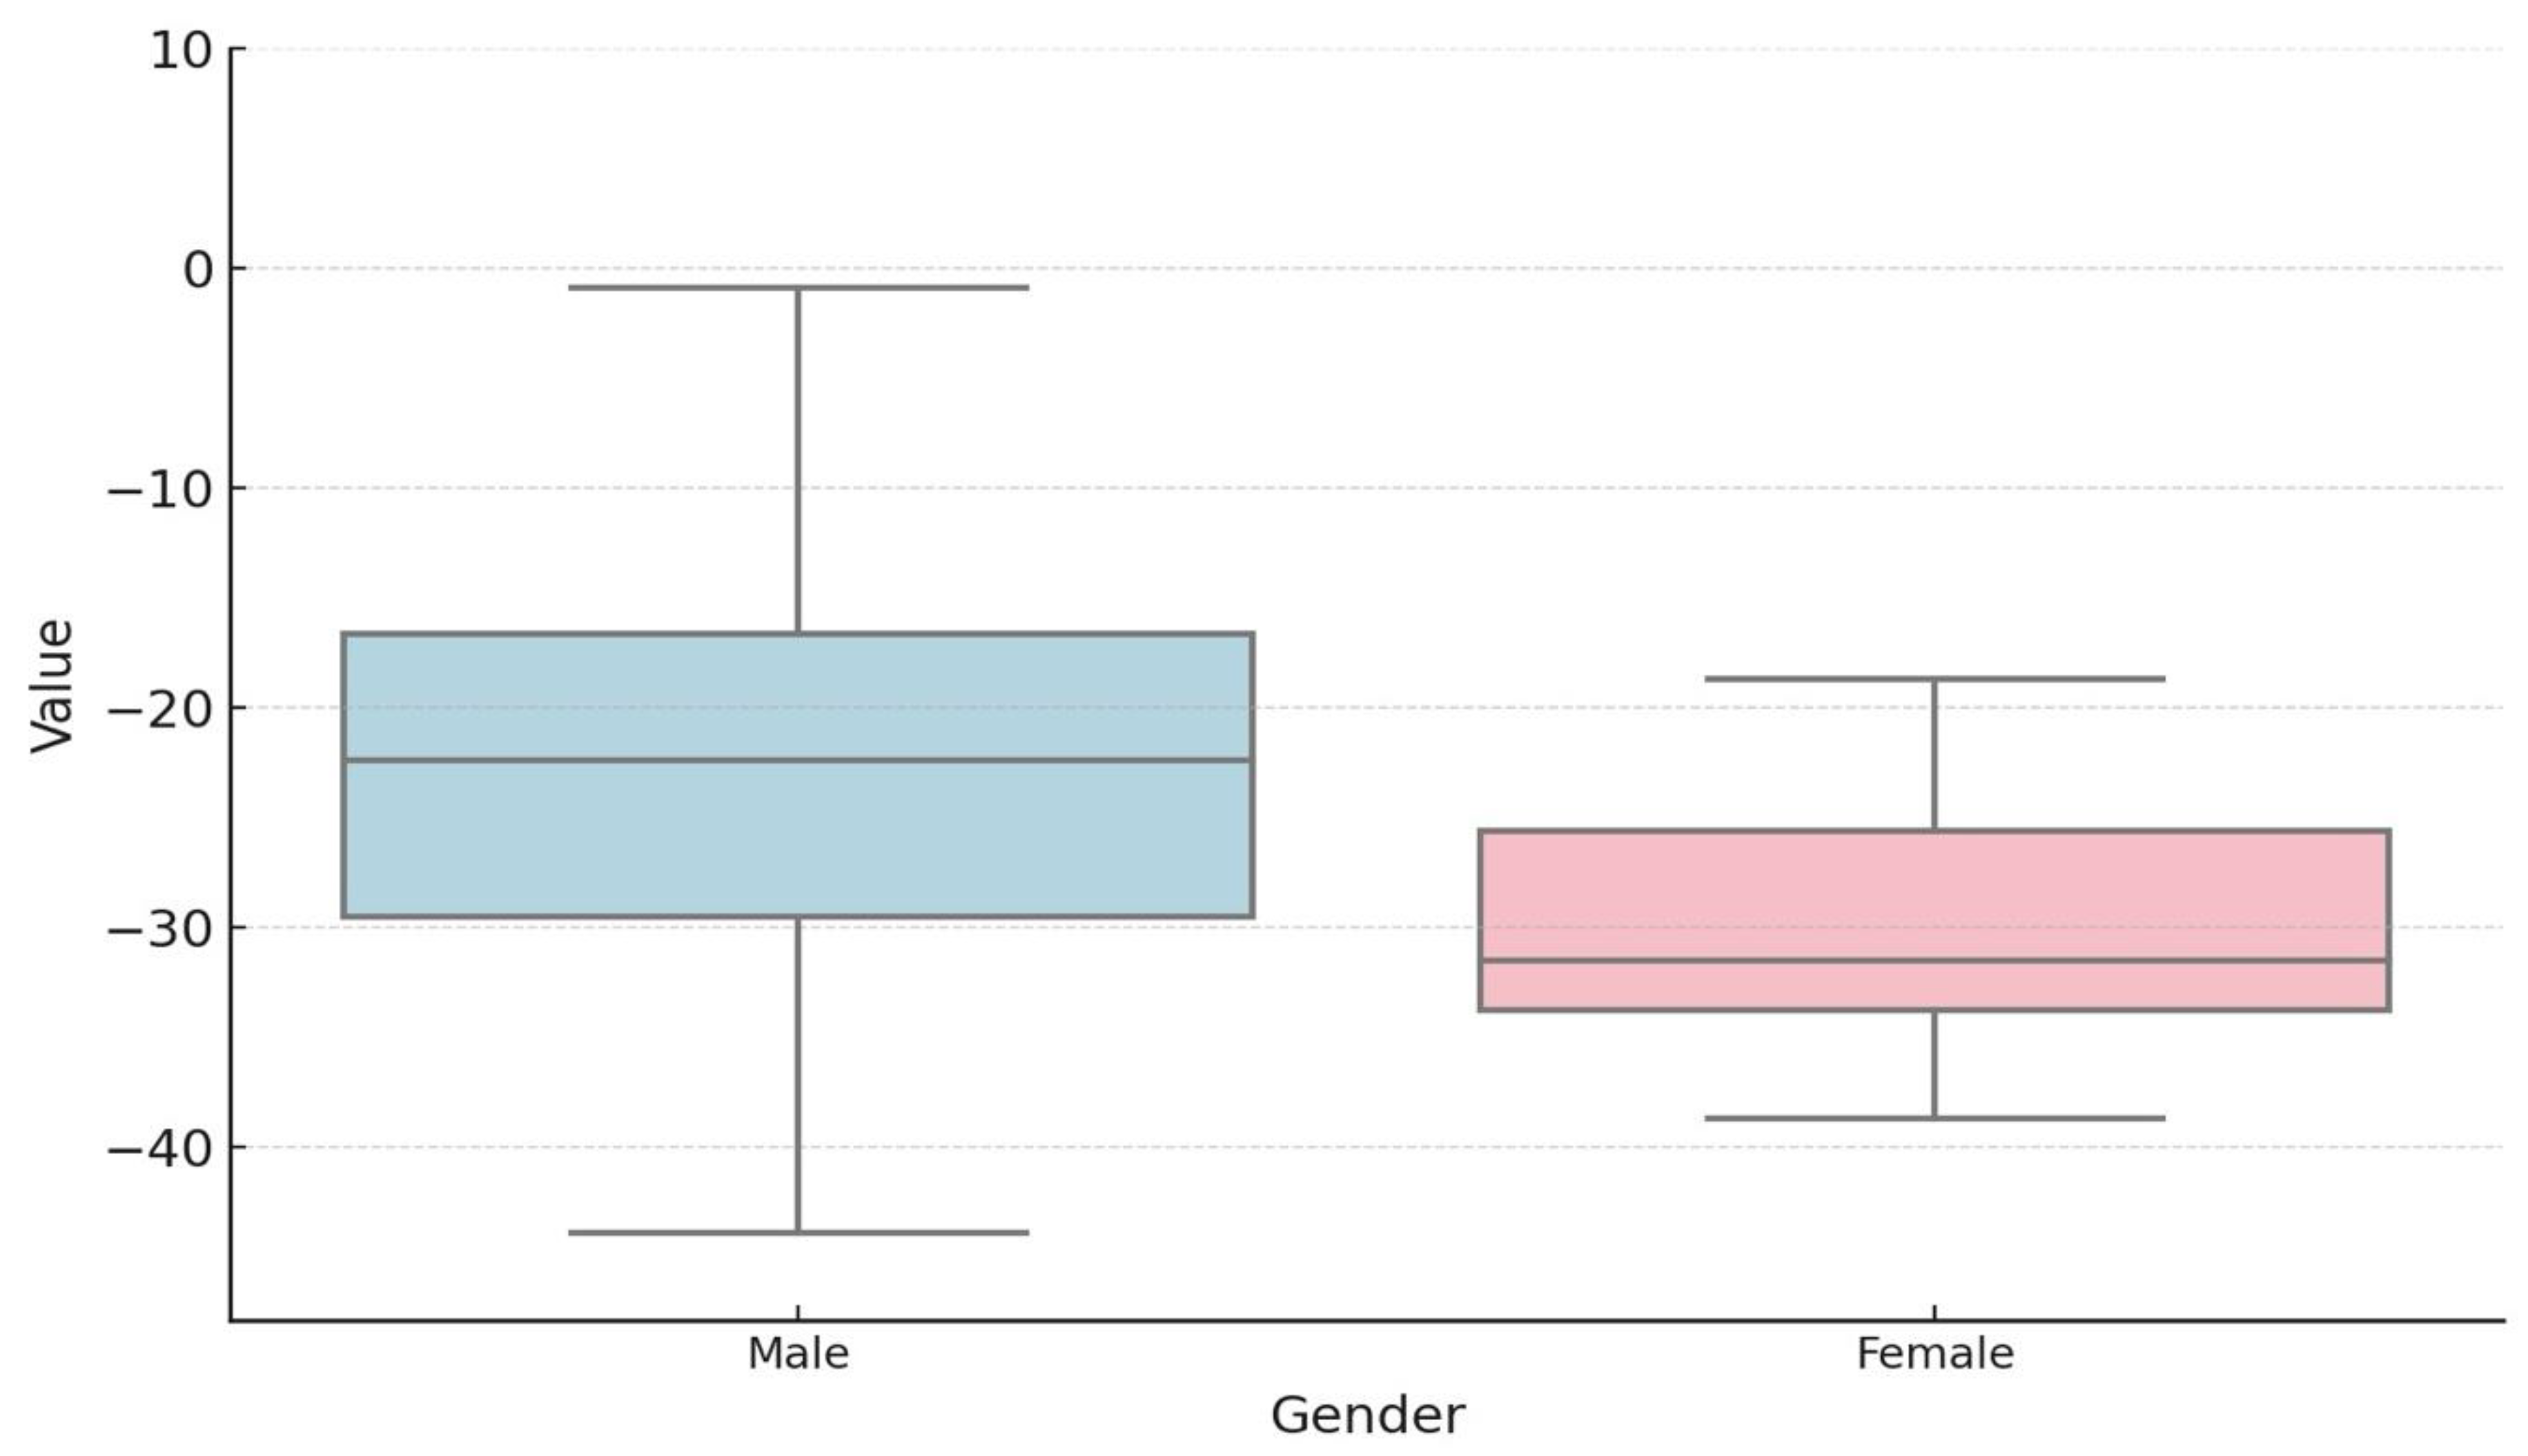
Figure 3.
Frequency distribution of phenotypes in BAV group (BAV – bicuspid aortic valve).
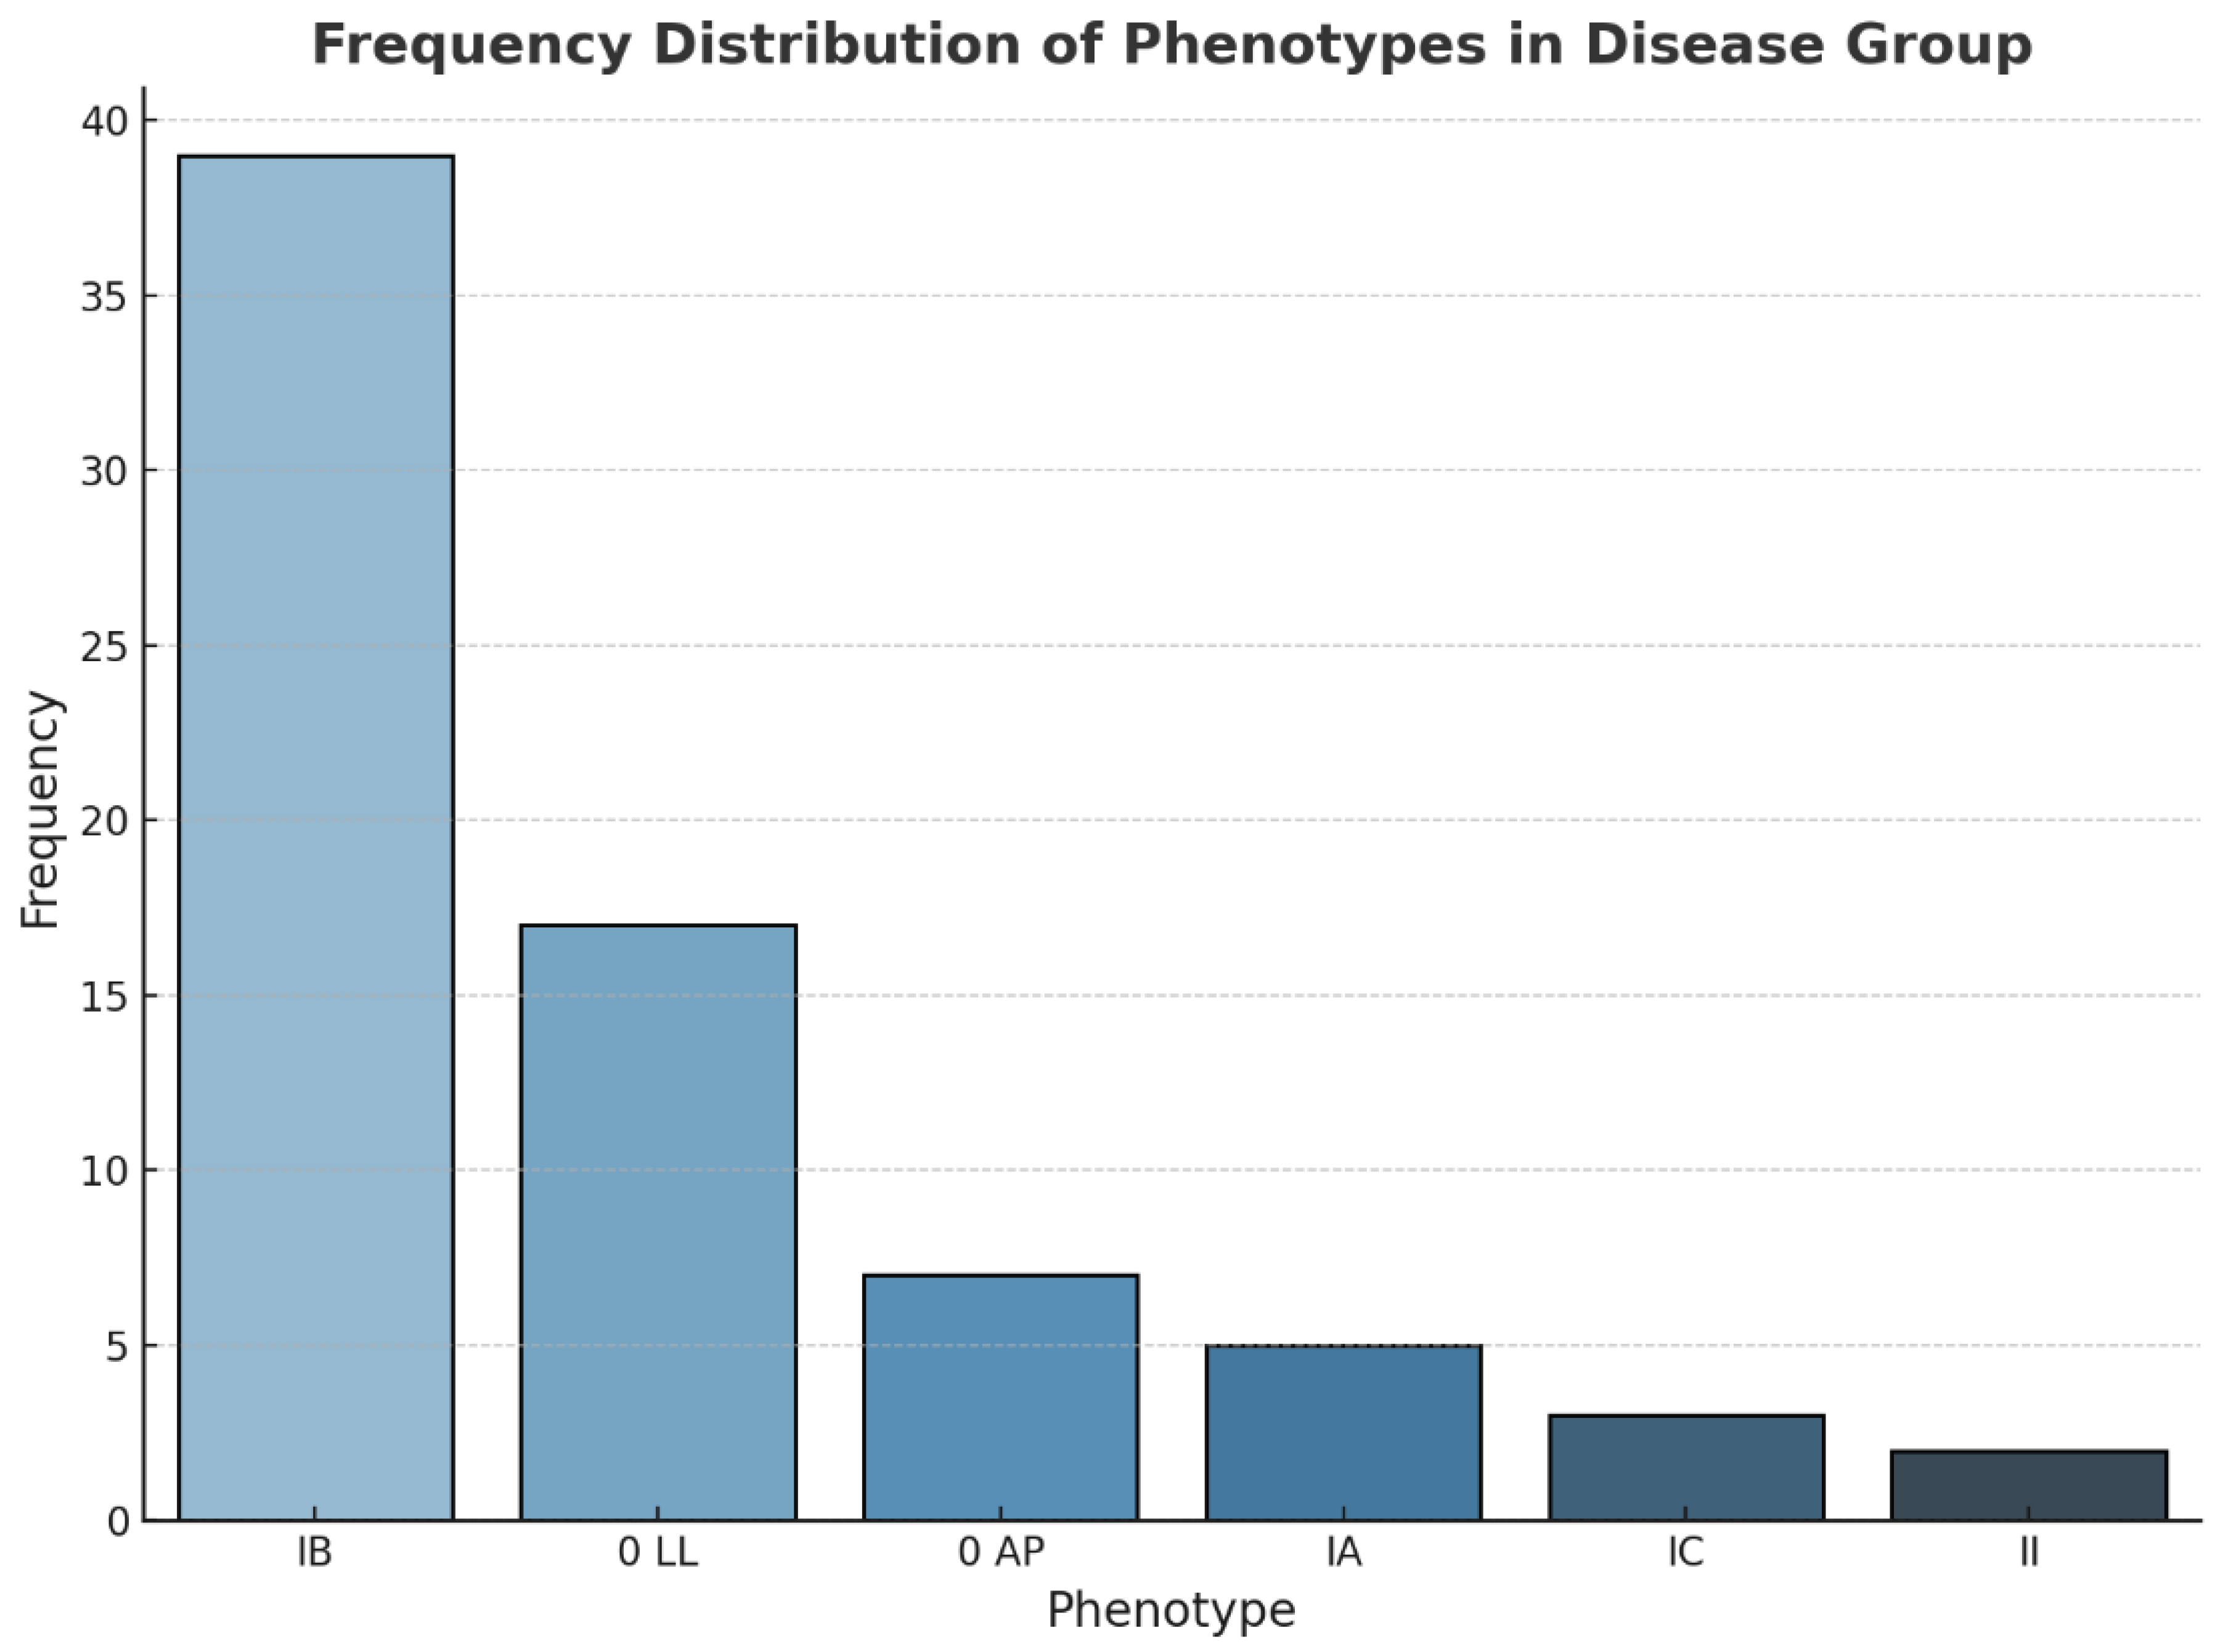

Table 1.
Baseline Characteristics of the study Sample (BSA – body surface area,, BMI – body mass index, BP - blood pressure, HR – heart rate, EF- ejection fraction, ES – shorten fraction ).
Table 1.
Baseline Characteristics of the study Sample (BSA – body surface area,, BMI – body mass index, BP - blood pressure, HR – heart rate, EF- ejection fraction, ES – shorten fraction ).
| Parameter | Control Group (n=54) | BAV group (n=73) | P-value |
| Age(years) | 13.00 (10.00-15.00) | 13.00 (9.50-16.00) | 0.928 |
| Weight (kg) | 45.50 (36.50-57.75) | 53.00 (32.50-66.00) | 0.285 |
| BSA (m2) | 1.41 ± 0.31 | 1.49 ± 0.41 | 0.204 |
| VitaminD (ng/ml) | 26.40 (19.64-35.90) | 30.16 (20.99-54.92) | 0.29 |
| pro-BNP (ng/L) | 10.90 (10.00-20.25) | 13.80 (10.00-21.60) | 0.292 |
| BMI (kg/m2) | 18.98 ± 3.53 | 19.78 ± 4.41 | 0.274 |
| Systolic BP (mmHg) | 110.00 (98.00-120.75) | 111.00 (104.00-121.00) | 0.4 |
| Diastolic BP (mmHg) | 66.50 (60.00-72.00) | 65.00 (60.00-70.00) | 0.65 |
| HR (b/min) | 83.57 ± 13.51 | 77.23 ± 14.39 | 0.017 |
| EF (medie,SD) | 67.29 (7.917) | 66.64 (7.708) | 0.3936 |
| SF (medie,SD) | 38.18 (7.52) | 36.63 (6.799) | 0.1859 |
Table 2.
Frequency distribution of associated pathologies in BAV group (CoAo – coarctation of the aorta, BAV – bicuspid aortic valve, AS- aortic stenosis, Ar- aortic regurgitation).
Table 2.
Frequency distribution of associated pathologies in BAV group (CoAo – coarctation of the aorta, BAV – bicuspid aortic valve, AS- aortic stenosis, Ar- aortic regurgitation).
| Pathology | BAV group(n=73) |
|---|---|
| Unoperated CoAo, n (%) | 2 (2.74) |
| Operated CoAo, n (%) | 9 (12.33) |
| Mild AS, n (%) | 22 (30.14) |
| Moderated AS, n (%) | 8 (10.96) |
| Severe AS, n (%) | 8 (10.96) |
| Mild AR, n (%) | 50 (68.49) |
| Moderated AR, n (%) | 11 (15.07) |
| Severe AR, n (%) | 2 (2.74) |
| Aortopathy, n (%) | 30 (41.10) |
Table 3.
Comparation between absolute size and Z-Score of aortic annulus, sinus of Valsalva, sino-tubular jonction and ascendin aorta of BAV group and control group (BAV – bicuspid aortic valve).
Table 3.
Comparation between absolute size and Z-Score of aortic annulus, sinus of Valsalva, sino-tubular jonction and ascendin aorta of BAV group and control group (BAV – bicuspid aortic valve).
| Parameters | BAV group (n=73) | Group control (n=55) | P value |
|---|---|---|---|
| Aortic valve annulus (mm) (medie,SD) | 22.22 (4.35) | 23.45 (27.83) | 0.0010** |
| Aortic valve annulus Z-score (medie,SD) | 1.67 (1.47) | 3.13 (19.30) | <0.0001** |
| Sinus of Valsalva (mm) (medie,SD) | 25.56 (5.62) | 26.83 (31.36) | 0.0023** |
| Sinus of Valsalva Z-score (medie,SD) | 0.521 (1.729) | -0.648 (1.207) | 0.0001* |
| Sino-tubular junction (mm) (medie,SD) | 23.41 (6.714) | 20.08 (6.007) | 0.0065** |
| Sino-tubular junction Z-score (medie,SD) | 1.735 (1.531) | 0.605 (0.994) | <0.0001** |
| Ascending aorta (mm) (medie,SD) | 30.95 (26.41) | 18.50 (7.927) | <0.0001** |
| Ascending aorta Z-score (medie,SD) | 1.881 (1.992) | -0.437 (1.097) | <0.0001** |
*Student t test; ** Mann-Whitney U test.
Table 4.
Results of global and segmental longitudinal strain in control group ( Abbreviations: BIS – basal inferoseptal, MIS – mid-inferoseptal, AIS – apical inferoseptal, AAL – apical anterolateral, MAL- mid-anterolateral, BAL – basal anterolateral, BI – basal inferior, MI -mid-inferior, AI- apical inferior, AA – apical anterior, MA – mid-anterior, BA – basal anterior, BIL – basal inferolateral,MIL – mid-inferolateral, AIL – apical inferolateral, AAs- apical anteroseptal, MAS – mid-anteroseptal, BAS- basal anteroseptal.
| Parameters | Control Group (n=55) |
|---|---|
| GLS A4C (medie,SD) | -21.25 (7.17) |
| BIS (medie,SD) | -19.46 (6.82) |
| MIS (medie,SD) | -22.92 (5.04) |
| AIS (medie,SD) | -24.72 (7.20) |
| AAL (medie,SD) | -21.53 (7.23) |
| MAL (medie,SD) | -19.48 (6.70) |
| BAL (medie,SD) | -27.80 (8.49) |
| GLS A2C (medie,SD) | -21.52 (9.07) |
| BI (medie,SD) | -22.13 (8.14) |
| MI (medie,SD) | -25.77 (5.89) |
| AI (medie,SD) | -24.94 (7.19) |
| AA (medie,SD) | -18.60 (9.23) |
| MA (medie,SD) | -21.15 (5.18) |
| BA (medie,SD) | -29.15 (8.42) |
| GLSA3C (medie,SD) | -22.73 (4.01) |
| BIL (medie,SD) | -27.52 (12.44) |
| MIL (medie,SD) | -22.40 (7.87) |
| AIL (medie,SD) | -22.86 (10.92) |
| AAS (medie,SD) | -22.62 (10.41) |
| MAS (medie,SD) | -21.63 (7.53) |
| BAS (medie,SD) | -19.79 (10.42) |
*Student t test; ** Mann-Whitney U test.
Table 5.
Correlations GLS between BAV group and control group ( Abbreviations: BIS – basal inferoseptal, MIS – mid-inferoseptal, AIS – apical inferoseptal, AAL – apical anterolateral, MAL- mid-anterolateral, BAL – basal anterolateral, BI – basal inferior, MI -mid-inferior, AI- apical inferior, AA – apical anterior, MA – mid-anterior, BA – basal anterior, BIL – basal inferolateral,MIL – mid-inferolateral, AIL – apical inferolateral, AAs- apical anteroseptal, MAS – mid-anteroseptal, BAS- basal anteroseptal).
| Parameter | BAV group (n=73) | Control Group (n=55) | P |
| GLS A4C (medie,SD) | -20.49 (4.89) | -21.25 (7.17) | 0.0229** |
| BIS (medie,SD) | -17.13 (8.21) | -19.46 (6.82) | 0.0430** |
| MIS (medie,SD) | -21.69 (6.52) | -22.92 (5.04) | 0.3220* |
| AIS (medie,SD) | -25.24 (9.55) | -24.72 (7.20) | 0.7700* |
| AAL (medie,SD) | -21.49 (9.08) | -21.53 (7.23) | 0.9819* |
| MAL (medie,SD) | -16.03 (8.45) | -19.48 (6.70) | 0.0336* |
| BAL (medie,SD) | -25.56 (12.24) | -27.80 (8.49) | 0.4213** |
| GLS A2C (medie,SD) | -21.65 (4.96) | -21.52 (9.07) | 0.2907** |
| BI (medie,SD) | -18.79 (8.64) | -22.13 (8.14) | 0.0742** |
| MI (medie,SD) | -24.92 (7.17) | -25.77 (5.89) | 0.5700* |
| AI (medie,SD) | -28.03 (8.05) | -24.94 (7.19) | 0.0678* |
| AA (medie,SD) | -20.23 (8.70) | -18.60 (9.23) | 0.4010* |
| MA (medie,SD) | -17.60 (9.09) | -21.15 (5.18) | 0.0407** |
| BA (medie,SD) | -22.73 (12.69) | -29.15 (8.42) | 0.0231** |
| GLSA3C (medie,SD) | -21.80 (5.24) | -22.73 (4.01) | 0.3078** |
| BIL (medie,SD) | -26.64 (11.71) | -27.52 (12.44) | 0.7342* |
| MIL (medie,SD) | -20.46 (9.26) | -22.40 (7.87) | 0.3154* |
| AIL (medie,SD) | -24.09 (8.68) | -22.86 (10.92) | 0.5515* |
| AAS (medie,SD) | -24.28 (11.73) | -22.62 (10.41) | 0.5041* |
| MAS (medie,SD) | -19.79 (7.47) | -21.63 (7.53) | 0.3730** |
| BAS (medie,SD) | -17.07 (8.97) | -19.79 (10.42) | 0.1891* |
*Student t test; ** Mann-Whitney U test.
Table 6.
Correlation of GLS values according to patient gender in the BAV group (Abbreviations: BIS – basal inferoseptal, MIS – mid-inferoseptal, AIS – apical inferoseptal, AAL – apical anterolateral, MAL- mid-anterolateral, BAL – basal anterolateral, BI – basal inferior, MI -mid-inferior, AI- apical inferior, AA – apical anterior, MA – mid-anterior, BA – basal anterior, BIL – basal inferolateral,MIL – mid-inferolateral, AIL – apical inferolateral, AAs- apical anteroseptal, MAS – mid-anteroseptal, BAS- basal anteroseptal).
| Parameter | Male (n=55) | Female (n=18) | P-value |
|---|---|---|---|
| GLS A4C (medie,SD) | -20.10 ± 5.27 | -21.60 ± 3.66 | 0.193 |
| BIS (medie,SD) | -14.65 (-19.73--11.12) | -18.25 (-21.72--16.02) | 0.016 |
| MIS (medie,SD) | -21.14 ± 6.87 | -23.29 ± 5.42 | 0.185 |
| AIS (medie,SD) | -26.28 ± 10.15 | -22.22 ± 7.30 | 0.075 |
| AAL (medie,SD) | -22.71 ± 9.15 | -17.97 ± 8.41 | 0.052 |
| MAL (medie,SD) | -15.19 ± 8.07 | -18.46 ± 9.48 | 0.202 |
| BAL (medie,SD) | -24.15 ± 11.87 | -29.66 ± 13.06 | 0.126 |
| GLS A2C (medie,SD) | -21.18 ± 4.90 | -23.01 ± 5.15 | 0.201 |
| BI (medie,SD) | -16.55 (-22.25--12.95) | -20.40 (-26.08--18.52) | 0.061 |
| MI (medie,SD) | -25.03 ± 7.35 | -24.62 ± 7.04 | 0.837 |
| AI (medie,SD) | -28.28 ± 8.34 | -27.30 ± 7.60 | 0.648 |
| AA (medie,SD) | -20.61 ± 9.15 | -19.16 ± 7.68 | 0.516 |
| MA (medie,SD) | -17.90 (-22.07--13.45) | -18.80 (-24.12--17.35) | 0.183 |
| BA (medie,SD) | -22.40 (-29.52--16.65) | -31.55 (-33.80--25.62) | 0.019 |
| GLSA3C (medie,SD) | -21.91 ± 5.18 | -21.48 ± 5.67 | 0.78 |
| BIL (medie,SD) | -26.87 ± 12.07 | -25.97 ± 11.25 | 0.777 |
| MIL (medie,SD) | -17.75 (-25.68--14.47) | -22.25 (-25.03--17.65) | 0.323 |
| AIL (medie,SD) | -24.32 ± 8.61 | -23.43 ± 9.35 | 0.725 |
| AAS (medie,SD) | -24.55 ± 10.86 | -23.49 ± 14.54 | 0.78 |
| MAS (medie,SD) | -19.40 (-24.10--15.45) | -19.85 (-21.03--17.48) | 0.995 |
| BAS (medie,SD) | -16.66 ± 8.42 | -18.27 ± 10.82 | 0.571 |
Table 7.
Comparison of the GLS values between the control group and the BAV group according to the associated pathology (Abbreviations: BIS – basal inferoseptal, MIS – mid-inferoseptal, AIS – apical inferoseptal, AAL – apical anterolateral, MAL- mid-anterolateral, BAL – basal anterolateral, BI – basal inferior, MI -mid-inferior, AI- apical inferior, AA – apical anterior, MA – mid-anterior, BA – basal anterior, BIL – basal inferolateral,MIL – mid-inferolateral, AIL – apical inferolateral, AAs- apical anteroseptal, MAS – mid-anteroseptal, BAS- basal anteroseptal).
| Parameter | Grup 1 – Control Group (n=54) | Grup 2 - AS (n=38) | Grup 3 - CoAo (n=11) | Grup 4 - Aop(n=30) | Grup 5 - AR(n=61) | P-value |
|---|---|---|---|---|---|---|
| GLS A4C (medie,SD) | -22.10 (-24.00--19.95) | -19.85 (-21.75--17.43) | -17.90 (-21.40--16.25) | -20.90 (-22.35--17.40) | -20.90 (-23.55--17.85) | 0.1 |
| BIS (medie,SD) | -18.85 (-23.58--15.57) | -15.15 (-19.02--11.12) | -15.00 (-17.95--13.40) | -13.70 (-18.25--9.90) | -16.20 (-20.20--11.60) | 0.022 |
| MIS (medie,SD) | -22.92 ± 5.10 | -21.84 ± 6.87 | -21.17 ± 7.96 | -21.37 ± 7.25 | -21.98 ± 6.35 | 0.874 |
| AIS (medie,SD) | -24.72 ± 7.30 | -24.59 ± 8.42 | -27.76 ± 10.68 | -24.75 ± 10.63 | -25.74 ± 10.13 | 0.854 |
| AAL (medie,SD) | -21.53 ± 7.33 | -21.67 ± 9.09 | -23.98 ± 9.19 | -22.89 ± 9.66 | -21.93 ± 9.45 | 0.917 |
| MAL (medie,SD) | -19.48 ± 6.79 | -14.97 ± 8.55 | -10.32 ± 3.87 | -16.35 ± 9.88 | -16.64 ± 8.75 | 0.018 |
| BAL (medie,SD) | -26.95 (-30.80--21.73) | -26.15 (-34.08--18.57) | -21.80 (-31.90--6.50) | -26.80 (-33.15--20.75) | -26.60 (-34.45--18.20) | 0.792 |
| GLS A2C (medie,SD) | -22.10 (-25.65--19.70) | -20.75 (-24.32--18.75) | -19.70 (-22.10--18.90) | -21.80 (-25.20--19.00) | -21.90 (-25.20--19.00) | 0.368 |
| BI (medie,SD) | -21.50 (-25.40--16.35) | -18.40 (-21.55--12.78) | -16.00 (-22.00--11.85) | -18.30 (-22.25--13.10) | -19.10 (-23.75--13.60) | 0.217 |
| MI (medie,SD) | -25.77 ± 5.99 | -24.25 ± 7.16 | -22.79 ± 7.27 | -25.50 ± 8.20 | -25.82 ± 6.92 | 0.622 |
| AI (medie,SD) | -24.70 (-27.25--22.15) | -27.05 (-31.10--21.53) | -27.10 (-33.40--23.20) | -27.80 (-33.20--22.70) | -27.80 (-34.05--23.05) | 0.213 |
| AA (medie,SD) | -18.60 ± 9.38 | -18.96 ± 7.70 | -17.52 ± 4.89 | -21.03 ± 7.31 | -20.57 ± 8.68 | 0.559 |
| MA (medie,SD) | -21.20 (-24.30--16.95) | -17.55 (-20.35--13.45) | -17.50 (-21.50--14.85) | -17.50 (-20.90--12.00) | -18.00 (-23.05--15.75) | 0.039 |
| BA (medie,SD) | -29.15 ± 8.56 | -24.34 ± 9.50 | -23.53 ± 7.70 | -24.71 ± 9.14 | -24.61 ± 9.33 | 0.152 |
| GLSA3C (medie,SD) | -22.80 (-24.35--20.40) | -20.15 (-23.88--16.88) | -20.20 (-21.70--17.05) | -22.00 (-24.75--18.45) | -21.40 (-26.05--18.70) | 0.286 |
| BIL (medie,SD) | -27.52 ± 12.64 | -25.22 ± 11.87 | -25.39 ± 11.83 | -25.24 ± 12.93 | -26.76 ± 12.08 | 0.921 |
| MIL (medie,SD) | -23.80 (-27.60--17.90) | -18.15 (-25.00--13.68) | -19.50 (-27.90--17.10) | -16.60 (-25.15--11.60) | -21.70 (-25.75--15.15) | 0.288 |
| AIL (medie,SD) | -22.86 ± 11.10 | -23.34 ± 9.21 | -17.95 ± 7.74 | -24.16 ± 8.63 | -24.19 ± 9.00 | 0.355 |
| AAS (medie,SD) | -22.62 ± 10.58 | -23.59 ± 12.27 | -24.35 ± 13.61 | -28.31 ± 11.29 | -24.79 ± 11.77 | 0.427 |
| MAS (medie,SD) | -21.00 (-24.60--15.30) | -18.90 (-21.77--15.50) | -20.50 (-21.30--12.70) | -19.70 (-25.30--17.15) | -19.70 (-24.60--17.10) | 0.587 |
| BAS (medie,SD) | -21.10 (-26.65--13.45) | -15.15 (-19.93--10.20) | -13.20 (-16.90--9.65) | -13.70 (-19.15--9.85) | -16.80 (-21.45--10.80) | 0.198 |
Table 8.
Post-hoc analysis between control and BAV groups according to the associated pathology (A4C – apical four chmaber view, A2c – apical two chmaber view, BIS - basal inferoseptal , MAL - MAL- mid-anterolateral , MA - MA – mid-anterior).
Table 8.
Post-hoc analysis between control and BAV groups according to the associated pathology (A4C – apical four chmaber view, A2c – apical two chmaber view, BIS - basal inferoseptal , MAL - MAL- mid-anterolateral , MA - MA – mid-anterior).
| Post-hoc analysis | |
| BIS A4C – (Mann-Whitney U) | P-value |
| Group 1 – Control group vs Group 2 - AS | 0.014 |
| Group 1 - Control group vs Group 3 - CoAo | 0.058 |
| Group 1 - Control group vs Group 4 - Aortopathy | 0.003 |
| Group 1 - Control group vs Group 5 – AR | 0.043 |
| Group 2 - AS vs Group 3 - CoAo | 0.95 |
| Group 2 – AS vs Group 4 - Aortopathy | 0.445 |
| Group 2 - AS vs Group 5 - AR | 0.427 |
| Group 3 - CoAo vs Group 4 - Aortopathy | 0.499 |
| Group 3 - CoAo vs Group 5 - AR | 0.617 |
| Group 4 – Aortopathy vs Group 5 - AR | 0.117 |
| MAL A2C (Mann-Whitney U) | |
| Group 1 - Control group vs Group 2 - AS | 0.007 |
| Group 1 - Control group vs Group 3 - CoAo | 0.067 |
| Group 1 - Control group vs Group 4 - Aortopathy | 0.008 |
| Group 1 - Control group vs Group 5 - AR | 0.082 |
| Group 2 – AS vs Group 3 - CoAo | 0.92 |
| Group 2 - AS vs Group 4 - Aortopathy | 0.77 |
| Group 2 - AS vs Group 5 - AR | 0.247 |
| Group 3 - CoAo vs Group 4 - Aortopathy | 0.949 |
| Group 3 - CoAo vs Group 5 - AR | 0.401 |
| Group 4 - Aortopathy vs Group 5 - AR | 0.191 |
| MAL A4C (test Tukey HSD) | |
| Group 1 - Control group vs Group 2 - AS | 0.137 |
| Group 1 - Control group vs Group 3 - CoAo | 0.013 |
| Group 1 - Control group vs Group 4 - Aortopathy | 0.563 |
| Group 1 - Control group vs Group 5 – AR | 0.468 |
| Group 2 – AS vs Group 3 - Coarctatie de Aorta | 0.013 |
| Group 2 – AS vs Group 4 - Aortopatie | 0.563 |
| Group 2 – AS vs Group 5 - AR | 0.468 |
| Group 3 – CoAo vs Group 4 - Aortopathy | 0.563 |
| Group 3 – CoAo vs Group 5 – AR | 0.468 |
| Group 4 – Aortopathy vs Group 5 – AR | 0.468 |
Table 9.
Comparison of the GLS values between the control group and the BAV group according to the phenotype (Abbreviations: BIS – basal inferoseptal, MIS – mid-inferoseptal, AIS – apical inferoseptal, AAL – apical anterolateral, MAL- mid-anterolateral, BAL – basal anterolateral, BI – basal inferior, MI -mid-inferior, AI- apical inferior, AA – apical anterior, MA – mid-anterior, BA – basal anterior, BIL – basal inferolateral,MIL – mid-inferolateral, AIL – apical inferolateral, AAs- apical anteroseptal, MAS – mid-anteroseptal, BAS- basal anteroseptal).
| Parametru | 0 AP | 0 LL | IA | IB | IC | P-value |
| GLS A4C (medie,SD) | -17.51 ± 5.95 | -19.46 ± 2.63 | -17.70 ± 6.25 | -21.48 ± 5.21 | -20.87 ± 3.10 | 0.245 |
| BIS (medie,SD) | -13.70 (-20.45--10.95) | -15.50 (-18.50--11.12) | -16.55 (-21.70--11.88) | -17.40 (-20.25--11.97) | -18.20 (-24.80--16.25) | 0.43 |
| MIS (medie,SD) | -21.63 ± 8.47 | -22.82 ± 6.51 | -18.05 ± 7.32 | -21.43 ± 6.53 | -20.07 ± 2.27 | 0.483 |
| AIS (medie,SD) | -22.27 ± 12.65 | -25.11 ± 5.13 | -19.98 ± 13.05 | -26.51 ± 10.33 | -23.17 ± 6.93 | 0.982 |
| AAL (medie,SD) | -23.83 ± 10.38 | -19.23 ± 6.85 | -20.80 ± 7.82 | -22.07 ± 10.41 | -21.57 ± 5.42 | 0.869 |
| MAL (medie,SD) | -11.50 (-17.00--9.25) | -14.30 (-18.88--9.02) | -13.30 (-16.20--9.90) | -16.55 (-21.98--9.38) | -18.00 (-19.85--15.60) | 0.65 |
| BAL (medie,SD) | -21.29 ± 12.53 | -24.74 ± 12.18 | -19.45 ± 15.80 | -26.91 ± 12.64 | -25.30 ± 6.38 | 0.679 |
| GLS A2C (medie,SD) | -18.44 ± 4.42 | -21.09 ± 6.54 | -20.15 ± 3.81 | -22.88 ± 4.38 | -17.77 ± 0.97 | 0.077 |
| BI (medie,SD) | -19.90 ± 15.21 | -16.94 ± 7.82 | -20.73 ± 4.30 | -19.25 ± 8.34 | -18.67 ± 4.03 | 0.804 |
| MI (medie,SD) | -21.80 (-24.80--20.40) | -26.15 (-30.65--16.85) | -21.40 (-22.88--19.38) | -25.05 (-28.95--21.77) | -25.30 (-27.05--21.65) | 0.699 |
| AI (medie,SD) | -30.10 (-34.40--24.45) | -24.95 (-29.23--20.53) | -24.55 (-28.93--21.78) | -29.85 (-35.20--22.85) | -20.00 (-22.80--17.35) | 0.209 |
| AA (medie,SD) | -26.00 ± 12.49 | -17.72 ± 5.75 | -17.15 ± 7.19 | -21.60 ± 8.32 | -6.97 ± 7.22 | 0.081 |
| MA (medie,SD) | -16.20 (-20.95--11.55) | -17.30 (-22.73--12.72) | -19.25 (-22.77--15.55) | -18.00 (-23.73--16.85) | -17.80 (-18.70--11.20) | 0.861 |
| BA (medie,SD) | -19.90 (-27.10--15.70) | -28.25 (-31.85--14.97) | -21.05 (-26.57--15.12) | -24.35 (-31.70--18.85) | -17.50 (-27.30--17.10) | 0.923 |
| GLSA3C (medie,SD) | -22.17 ± 2.88 | -22.20 ± 6.28 | -18.30 ± 1.56 | -21.77 ± 5.26 | -21.27 ± 8.22 | 0.566 |
| BIL (medie,SD) | -35.39 ± 14.87 | -30.04 ± 11.91 | -24.07 ± 4.36 | -23.62 ± 10.89 | -22.17 ± 7.93 | 0.155 |
| MIL (medie,SD) | -19.20 (-22.55--12.35) | -23.90 (-28.68--16.98) | -12.65 (-15.82--9.18) | -18.20 (-25.67--15.30) | -22.60 (-26.30--22.15) | 0.044 |
| AIL (medie,SD) | -22.37 ± 8.11 | -25.08 ± 9.02 | -22.75 ± 4.06 | -23.72 ± 9.15 | -26.40 ± 13.08 | 0.907 |
| AAS (medie,SD) | -23.57 ± 10.99 | -24.25 ± 15.40 | -22.12 ± 7.22 | -23.93 ± 10.16 | -27.03 ± 21.77 | 0.941 |
| MAS (medie,SD) | -15.39 ± 8.39 | -19.33 ± 7.83 | -15.43 ± 4.29 | -21.12 ± 6.95 | -14.17 ± 4.37 | 0.043 |
| BAS (medie,SD) | -9.13 ± 6.74 | -15.43 ± 9.45 | -13.70 ± 4.50 | -19.34 ± 9.28 | -18.77 ± 4.35 | 0.08 |
Table 10.
Post-hoc analysis of the bav group according to phenotype (Abbreviations: A3C- apical tree chamber view,MIL – mid-inferolateral, MAS – mid-anteroseptal).
Table 10.
Post-hoc analysis of the bav group according to phenotype (Abbreviations: A3C- apical tree chamber view,MIL – mid-inferolateral, MAS – mid-anteroseptal).
| GLS A3CMIL | P-value | GLS A3C MAS | P-value | ||
| 0 AP vs 0 LL | 0.154 | 0 AP vs 0 LL | 0.181 | ||
| 0 AP vs IA | 0.315 | 0 AP vs IA | 0.776 | ||
| 0 AP vs IB | 0.481 | 0 AP vs IB | 0.103 | ||
| 0 AP vs IC | 0.183 | 0 AP vs IC | 0.833 | ||
| 0 LL vs IA | 0.029 | 0 LL vs IA | 0.143 | ||
| 0 LL vs IB | 0.229 | 0 LL vs IB | 0.589 | ||
| 0 LL vs IC | 0.875 | 0 LL vs IC | 0.146 | ||
| IA vs IB | 0.051 | IA vs IB | 0.099 | ||
| IA vs IC | 0.057 | IA vs IC | 0.858 | ||
| IB vs IC | 0.317 | IB vs IC | 0.068 |
Disclaimer/Publisher’s Note: The statements, opinions and data contained in all publications are solely those of the individual author(s) and contributor(s) and not of MDPI and/or the editor(s). MDPI and/or the editor(s) disclaim responsibility for any injury to people or property resulting from any ideas, methods, instructions or products referred to in the content. |
© 2024 by the authors. Licensee MDPI, Basel, Switzerland. This article is an open access article distributed under the terms and conditions of the Creative Commons Attribution (CC BY) license (http://creativecommons.org/licenses/by/4.0/).
Copyright: This open access article is published under a Creative Commons CC BY 4.0 license, which permit the free download, distribution, and reuse, provided that the author and preprint are cited in any reuse.


