
Submitted:
29 November 2024
Posted:
02 December 2024
You are already at the latest version
Abstract
Foam stabilization is fundamental in the production of foamed concrete, widely used in civil construction due to its applications in thermal insulation and structural weight reduction, both of which contribute to the energy efficiency of buildings. The foam acts as an air-entraining agent, providing the concrete with low density and enhanced thermal and acoustic properties. Recently, magnetite extracted from acid mine drainage (AMD) has been studied as a foam-stabilizing agent in foamed concrete, offering a sustainable solution for the use of coal tailings. Due to its magnetic properties, magnetite has proven effective in improving foam stability, ensuring a more uniform distribution of air bubbles within the concrete mix. The aim of this study was to produce foamed concrete (FC) using magnetite as a stabilizer for foam generated by mixing water with amide 90. The study also evaluated combinations with two types of cement (CP II Z and CP V ARI) and varying amounts of sand. The results showed that increasing the amount of magnetite led to a reduction in mechanical strength (both compressive and flexural tensile strength), as well as in dry and saturated density and thermal conductivity. Meanwhile, porosity and water absorption increased. The properties of the foamed concretes ranged as follows: compressive strength from 0.62 MPa to 7.33 MPa, porosity from 31.8% to 75.6%, and thermal conductivity from 0.54 W/mK to 0.17 W/mK.
Keywords:
magnetite
; acid mine drainage
; foam stabilization
; foamed concrete
1. Introduction
Cellular foamed concrete (CCE) has low density, a high strength-to-density ratio, and low thermal conductivity, making it suitable for both aggressive environments and fire-resistant applications [1]. CCE is a variant of lightweight cellular concrete (LCC), composed of cementitious binders, supplementary components, and air-entraining agents [2]. Its classification as lightweight concrete is due to its reduced density, which ranges from 300 to 1900 kg/m³, with air voids dispersed by the action of a foaming agent.
The application of foamed concrete varies according to its density: at around 400 kg/m³, it is used for wall cladding, sealing blocks, and thermal insulation; at around 600 kg/m³, it is employed in non-structural elements; and in the 1200–1950 kg/m³ range, it can serve a structural role [3]. Additionally, foamed concrete is used in various applications, including sealing fire escape routes, acoustic insulation, road sub-bases, trench restoration, soil stabilization, and damping barriers at airports [4].
The physical structure of the foam during curing is an important element in foamed concrete, as it directly impacts the size and distribution of microbubbles within the cement paste, which in turn defines its physical and mechanical behavior [5]. The formation of the foam structure primarily occurs during the process of incorporating air into the foaming agent, which “traps” the air microbubbles, significantly increasing the volume of the mixture. Various studies have investigated the effects of synthetic and protein-based foaming agents on the properties of foamed concrete, revealing that protein-based foaming agents result in materials with superior mechanical characteristics compared to synthetic foaming agents [6].
The stability of the foam is one of the most important parameters for its incorporation into mortar. Its two-phase nature (liquid-gas), consisting of a film of foaming agents that traps the incorporated air, is somewhat fragile and susceptible to coalescence during the mixing stage of the mortar [7,8,9]. To mitigate the tendency for bubbles to coalesce, nanoparticles of alumina, silica, graphene, and other materials have been tested. These nanoparticles adsorb to the surface of the film, resulting in a three-phase solid-liquid-gas foam that reinforces the integrity of the film, making it more difficult for the bubbles to merge, thus reducing coalescence and maintaining the gas and liquid phases [10].
The amount of air introduced by the foam can vary widely, ranging from 40% to 80%. The addition of foam reduces the mechanical strength of the material, resulting in a porous cellular matrix with air bubbles ranging from 0.1 to 2.0 mm in diameter. The porosity, density, mechanical strength, and thermal and acoustic insulation properties of foamed cellular concrete are directly correlated with the amount of pores incorporated during the foam generation process [11]. However, the dimensions of the resulting pores are governed by the stability of the foam in its wet phase. Microbubbles are thermodynamically unstable, undergoing continuous coalescence processes during the mortar hardening stage, which effectively decreases the overall free energy of the porous system [12].
The union of microbubbles can generate larger voids, particularly in the interface regions between the material and the external medium, resulting in a material with reduced mechanical integrity. Consequently, the aspect of foam production processes is maintaining the stability of the air bubbles introduced into the initial suspension or liquid medium [13].
The influence of nano magnetite on the characteristics of concrete was examined by Krämer, Kowald, and Trettin [5]. In a study conducted over a period of 300 days in an environment containing chloride and sulfur dioxide, using an impedance spectrometer, the researchers concluded that the addition of 1% iron oxide (Fe₂O₃) to concrete enhanced its durability. Furthermore, it has been found that incorporating iron oxide nanoparticles, in proportions ranging from 0.5% to 2% by weight of cement, leads to improvements in the mechanical properties of foamed concrete [14].
The use of nano magnetite to stabilize the foam used in foamed concrete offers an innovative and sustainable solution, especially considering that nano magnetite is derived from acid mine drainage (AMD), one of the major environmental challenges caused by mining activities. AMD contains toxic compounds, such as iron and sulfur, which can contaminate soil and water sources, making it essential to develop technologies that enable its reuse. In this context, incorporating nano magnetite into foamed concrete production not only helps stabilize the foam, improving its mechanical properties and thermal insulation, but also provides an environmentally sound way to manage mining waste. Furthermore, foamed concrete is widely recognized for its energy efficiency. Due to its low density and high thermal insulation capacity, it reduces energy demand in buildings, enhancing thermal comfort and overall energy efficiency, making it a valuable solution for constructing more sustainable buildings. In this context, the main aim of this study was to evaluate the use of magnetite as a foam-stabilizing agent in the production of foamed concrete.
2. Materials and Methods
Two types of cement were used to prepare the specimens: Portland cement CP II Z and CP V ARI. Table 1 presents the chemical and physical properties of the cements used.
The natural river sand used as aggregate was sourced from Santa Maria, RS, Brazil, and its particle size distribution is shown in the particle size curve in Figure 1. The fineness modulus and apparent density of the natural sand were 1.77 and 1470 kg/m³, respectively.
The water used was of drinking quality and supplied by Companhia Riograndense de Saneamento (CORSAN), Passo Fundo, RS, Brazil. The foam additive, Coconut Fatty Acid Diethanolamide (AMIDA 90%), which is a non-ionic surfactant, was used to generate the foam [7]. The foam was produced using a mechanical agitator with a 1:10 dilution ratio of Amida 90 to water. The density of the pre-formed foam was 0.229 g/cm³. To assess foam stability, nano magnetite was added in proportions of 1%, 2%, 3%, and 4% relative to the mass of the mixture.
2.1. Nano magnetite
Magnetite is an iron oxide spinel (Fe₃O₄) with magnetic properties. It can be obtained through the alkaline precipitation of ferrous solutions (Fe²⁺) or, alternatively, through the alkalization of acid mine drainage (AMD), free of contaminants [15,16]. To obtain AMD with suitable characteristics, an experiment was set up in the laboratory, and the magnetite pigment was produced, following a prototype described by Vigânico [17] and shown in Figure 2(a). This system produced AMD through controlled leaching (percolation and recirculation) in a PVC column 180 mm in diameter and 1000 mm high. A high-density polyethylene tank with a 240 liter capacity was used to store the leachate. The system utilized a submersible pump operating for 8 weeks at 1.2 L/min. These conditions kept the column filled with water and oxygen. The system produced a solution with low pH (< 2.0) and high concentrations of dissolved iron, sulfate, and acidity, along with other metals in smaller quantities. A total of 10 kg of pyrite waste was inserted into the column, producing approximately 6.8 kg of sludge [18].
The pyrite used in this study was sourced from a mining company located in Criciúma, Santa Catarina, Brazil, with a granulometry ranging from 2 to 10 mm in diameter. The pyrite concentrate was obtained from Rio Deserto Company, originating from the mining layer previously characterized by Menezes et al. [19], known as Barro Branco, which contained 62% pyrite (iron disulfide—FeS₂).
The result was an aqueous extract rich in ferrous ions, originating from the natural oxidation of metal sulfide, as described by reactions (1) and (2):
After six weeks of leaching, the DAM was transferred to a reaction tank, where a 50% sodium hydroxide solution was added under constant agitation (Figure 2(b)).
During the addition of sodium hydroxide and stirring, the pH of the solution was adjusted to between 12.5 and 13.5. After thorough mixing (approximately 5 minutes), the solution was left to stand for 48 hours to allow the sludge to convert into an intermediate known as Green Rust, which is essential for producing magnetic sludge [20]. The solid phase was then separated from the liquid phase. After this period, the sludge was filtered through filter paper (with porosity between 26 and 44 μm) supported by a textile mesh to facilitate the separation of the solid and liquid phases. The system was left to stand and filter for 5 days (Figure 2(c)).
The material resulting from this process was black in color, with a pasty consistency and a reaction to the magnetic field (reaction 3):
Regarding the quantities of materials involved in obtaining iron oxide, 115 liters of AMD and 14 kg of 50% sodium hydroxide were used, resulting in the generation of 6.81 kg of sludge. The generated sludge was found to contain a large volume of water, with only 10% solid material.
The samples were characterized in terms of chemical composition using X-ray fluorescence spectrometry (XRF—Figure 3(b)) and X-ray diffractometry (XRD—Figure 3(a)). According to NBR 10004 (ABNT, 2004), the generated sludge is classified as non-inert and non-hazardous, classified as Class II A.
The XRD analysis of the nano magnetite extracted from acid mine drainage (AMD) reveals the presence of several distinct mineral phases. The primary phase identified is magnetite (Fe₃O₄), as indicated by the peak labeled “1” on the graph (Figure 3(a)). Magnetite is a key iron oxide mineral known for its magnetic properties, which are important for its use in various industrial applications, including foam stabilization in concrete. Other mineral phases observed include goethite (FeO₂) and quartz (SiO₂), as marked by labels “2” and “4,” respectively. The presence of carbon disulfide (CS₂), indicated by label “3,” suggests the involvement of sulfur compounds in the composition of the sludge. These minerals, combined, contribute to the unique properties of the nano magnetite.
The XRF analysis (shown in Figure 3(b)) provides a quantitative chemical composition of the extracted material. It shows a high concentration of Fe₂O₃ (70.29%), which is consistent with the presence of magnetite. The XRF also indicates the presence of sulfur (SO₃, 7.33%) and silica (SiO₂, 1.14%), which correspond to the goethite and quartz phases observed in the XRD analysis. Other elements present in trace amounts include calcium (CaO), potassium (K₂O), and zinc (ZnO), which may also influence the properties of the nano magnetite. The LOI (loss on ignition) value of 20.11% reflects the loss of water or volatile compounds upon heating, which is typical for certain minerals like goethite.
This combination of XRD and XRF data provides a comprehensive understanding of the mineralogical and chemical composition of the nano magnetite, which can be used to assess its potential applications, including its role in stabilizing foam for foamed concrete.
2.2. Production Process and Design of Experiments
The foamed concrete production process was divided into two stages. First, the mortar, consisting of cement, sand, and water, was prepared for 5 minutes. Then, the pre-formed foam, with or without the addition of nano magnetite, was incorporated and mixed for an additional 5 minutes until the mixture became homogeneous. Table 2 presents the experimental matrix, which considered variations in the type of cement, the amount of sand, and the amount of magnetite, totaling 30 mixtures with at least three repetitions for each test.
After mixing, the specimens were molded into rectangular shapes measuring 300x40x40 mm (for thermal conductivity), 160x40x40 mm (for flexural tensile strength), and cylindrical shapes with a diameter of 50 mm and a height of 100 mm (for other tests). After 24 hours, the specimens were demolded and cured at room temperature for 24 days. A total of 450 specimens were prepared.
The factors for the experimental design were the type of cement (two levels: CP II Z and CP V ARI), the amount of sand (cement-to-sand ratio, C/A, with three levels: 1:1, 1:0.5, and 1:0), and the amount of magnetite (with five levels: 0%, 1%, 2%, 3%, and 4%). The response variables included porosity (void index), water absorption, dry and saturated densities, compressive strength, flexural tensile strength, and thermal conductivity. The water-to-cement ratio was kept constant to minimize the effects of water, particularly on mechanical strength.
An analysis of variance (ANOVA) was conducted to assess the influence of the factors on the response variables. Factors with p-values equal to or less than 0.05 were considered significant, corresponding to a confidence level of 95% or higher. The percentage contribution of each factor was determined by the sum of the squares. The p-value represents the probability of observing evidence against the null hypothesis, with lower values indicating stronger evidence against the null hypothesis. The F value is a statistical test used to assess the association between a factor and the response variable, with higher values indicating a greater influence of the factor under analysis.
2.3. Characterisation of the Specimens
The compressive strength test was conducted in accordance with standard NBR 5739 [21] using a hydraulic press, model PC200C (Instron, Norwood, MA, USA). The flexural tensile strength tests were performed in accordance with standard NBR 12142 [22] using an EMIC model DL10000 universal press.
Density (dry and saturated), porosity (air void), and water absorption tests were conducted after the specimens had cured for 28 days, following the ASTM C 948-81 [23] and NBR 9778 [24] standards. Pore size was determined using the analysis technique described in the British Standard BS EM 480-11[25] and by other authors [26,27,28]. Two specimens from each sample were prepared: one for the longitudinal section and the other for the transverse section. The specimens were carefully polished to avoid creating new pores that could lead to errors in the measurements. Macrographic images were captured using a microscope, and ImageJ software (National Institutes of Health, Bethesda, MD, USA) was used to process the images.
Thermal conductivity was determined using the surface hot wire technique. This method has been previously validated as a variant of the parallel hot wire method in earlier studies [26,29,30] and is characterized as a direct technique that detects transient temperature. The system consists of two multimeters for measuring electrical current and voltage, two parallelepiped-shaped specimens, a hot wire (0.5 mm diameter Kanthal) connected to a power source, four temperature sensors (NTC—negative temperature coefficient), and a data acquisition system. The temperature sensors were calibrated to operate within the range of 0°C to 100°C [31,32,33].
3. Results and Discussion
3.1. Foam Characterisation
Figure 4 shows the foam produced with different concentrations of magnetite. The first image (0%) displays foam with large, relatively uniform bubbles, suggesting limited foam stability. As the concentration of magnetite increases (1%, 2%, 3%, and 4%), there is a notable change in the structure of the foam. The foam becomes denser, and the bubbles become smaller and more compact, especially at higher concentrations (3% and 4%), indicating increased stability and possibly enhanced mechanical resistance of the foam.
The presence of nano magnetite, when incorporated into the foamed concrete mix, can influence the stability of the foam, helping to form a more robust network of bubbles. This is due to magnetite’s effect on modifying the interaction between particles and enhancing the adhesion on the surface of the bubbles. Higher concentrations of magnetite (such as 3% and 4%) can improve the durability and resistance of foamed concrete, as more stable foam tends to offer better mechanical and thermal insulation properties.
3.2. Porosity
Table 3 presents the analysis of variance for porosity. Based on the values shown, it can be concluded with 95% confidence that the percentage of magnetite (M), cement-to-sand ratio (C/A), and type of cement (TC) significantly influence the amount of pores in the specimens molded from magnetite cellular foamed concrete. The contributions of magnetite (41.7%), cement-to-sand ratio (C/A) (27.8%), and type of cement (13.5%) had the greatest impact.
The results show that the porosity of the specimens is significantly influenced by the cement-to-sand ratio (C/A), the type of cement (TC), and the addition of magnetite. In general, porosity increases with the addition of magnetite. The specimen with a C/A ratio of 1:0 and TC of CP II Z showed the highest porosity values at all magnetite concentrations, reaching 75.6% with 4% magnetite. On the other hand, the specimen with a C/A ratio of 1:1 and TC of CP V ARI had the lowest initial porosity (31.8%), but also showed a progressive increase, reaching 58.9% with 4% magnetite. The influence of the cement-to-sand ratio is evident, as specimens with a higher cement content (C/A = 1:0) showed higher porosity. This can be explained by the greater amount of cementitious material available for hydration reactions and the subsequent formation of a more porous structure. As for the type of cement, CP II Z generally resulted in higher porosity values compared to CP V ARI, possibly due to the presence of additions in CP II Z that affect the material’s microstructure. The addition of magnetite acts as a foam stabilizer, promoting an increase in porosity as its content rises. Thus, the combined factors of composition and magnetite addition play a fundamental role in the porosity behavior of the materials studied.
Figure 5 illustrates the variation in porosity with respect to the magnetite content. It can be observed that the inclusion of magnetite leads to an increase in porosity, with differences in the results depending on the types of cement used. For example, CP II Z cement exhibits higher porosity than CP V ARI cement. Another notable observation is the influence of the cement-to-sand ratio (C/A), where a reduction in this ratio is associated with an increase in porosity values.
An increase in porosity was observed with the addition of magnetite, along with differences in the results based on the type of cement used. CP II Z cement exhibited higher porosity than CP V ARI cement. Another finding relates to the C/A ratio, where a decrease in the ratio results in higher porosity values.
The evaluated values range from 31.8% to 75.6%, with the average porosity increasing as the cement type and cement-to-sand ratio vary, and accumulating according to the percentage of magnetite present.
Figure 6 shows the pores in the cross-sectional images of each mix developed. From these images, the pore distribution was determined. Analyzing the images reveals variations in the porosity of concrete with different proportions of additives and types of cement (CP II Z and CP V ARI). Porosity tends to increase with the addition of magnetite, with pores becoming more visible and larger in samples with higher percentages of magnetite. Pore distribution also varies, with some samples showing a more uniform distribution of pores, while others exhibit a more irregular formation. CP V ARI cement, due to its high initial strength, promotes a more compact pore structure, while CP II Z, with its greater durability, results in a different porosity pattern.
The distribution of pores was also analyzed by cutting the cross-section of the specimens, and the results were obtained using a digital microscope. A cumulative frequency (CF) graph was created in relation to pore diameter to characterize the porosity in the foamed concrete, with the average diameter shown in Figure 7.
Based on the D10, D50, and D90 values, it can be concluded that there was a more efficient distribution of pores in the specimens with higher magnetite content, regardless of the cement-to-sand ratio (C/A). However, as the C/A ratio decreases, a more uniform distribution of pores is observed, especially in the specimens with higher percentages of magnetite. This trend reflects the influence of both the type of cement and the C/A ratio.
Analyzing the cumulative frequency (%) graphs reveals a significant variation in the porosity of foamed concrete. Figure 8 shows the profile of the average pore diameters in relation to the percentage of magnetite (%), including D10 (where 10% of the particles have smaller diameters), D50 (the median diameter, with 50% of the particles below and 50% above this value), and D90 (where 90% of the particles have smaller diameters).
3.3. Compressive Strength
Table 4 presents the analysis of variance (ANOVA) for the compressive strength of the foamed concretes, with 95% confidence.
Figure 9 shows the compressive strength results and their respective standard deviations for the different percentages of magnetite, C/A ratios, and types of cement.
The analysis revealed that the type of cement (TC), the percentage of magnetite (M), and the cement-to-sand ratio (C/A), as well as the interactions between these factors, significantly influenced the compressive strength. The greatest influence was observed in the C/A ratio, which contributed 35.5%, followed by the percentage of magnetite at 26.0%, and the type of cement at 11.8%.
The greater impact observed in the C/A ratio is intrinsically linked to the different formulations tested, with the magnetite content kept constant.
As discussed above, it can be seen that as porosity increases, there is a decrease in strength, indicating a direct relationship between porosity and strength. Therefore, particularly at lower densities, achieving a more uniform distribution of air bubble diameters, along with the reduction of larger bubbles, leads to an increase in the compressive strength of ultralight foamed concretes [34].
3.4. Tensile Flexural Strength
Table 5 presents the results of the analysis of variance (ANOVA) for the tensile flexural strength of the foamed concretes, with a 95% confidence level. The ANOVA revealed the significance of each factor in the material’s performance. The type of cement (TC) was identified as a significant factor, indicating that the cement type substantially impacts the tensile strength, contributing 4.5% to the total variation. The cement/sand ratio (C/A) proved to be even more influential, accounting for 27.5% of the variation, demonstrating that different proportions of cement and sand significantly affect the material’s strength. The percentage of magnetite (M) emerged as the most influential factor, contributing 35.1%, highlighting a strong correlation between the magnetite content and tensile strength. Furthermore, interactions between factors were also significant, with the TC × M (5.8%) and C/A × M (6.3%) interactions standing out, indicating that the combination of these factors affects the material’s properties.
The graph in Figure 10 illustrates that tensile flexural strength varied across the different mixes. The highest strength was observed with a C/A ratio of 1:1 and TC CP II Z, achieving 2.52 MPa with 0% magnetite—an increase of approximately 49% compared to the lowest strength (C/A 1:0, TC CP V ARI, with 4% magnetite). Overall, increasing the percentage of magnetite progressively reduced strength across all combinations analyzed, with this reduction being most pronounced in TC CP V ARI. Additionally, the C/A ratio of 1:1 yielded the best results, demonstrating improved stress distribution and superior performance compared to C/A ratios of 1:0.5 and 1:0. Therefore, the combination of a C/A ratio of 1:1 and TC CP II Z stands out as the most efficient, while increasing the magnetite content negatively impacts flexural tensile strength.
The reduction in flexural tensile strength with an increase in the percentage of magnetite is associated with an increase in porosity. In other words, by increasing the percentage of magnetite in the foam formulation, the number of pores increases, resulting in a reduction in the material’s mechanical strength. On the other hand, the reduction in mechanical strength as the sand content in the mix decreases can be explained by the lower density of the material and the increased coalescence of the bubbles in the foamed concrete. The amount of sand directly influences the viscosity of the cement paste, which can have an impact on the efficiency of bubble encapsulation during the mixing process.
3.5. Dry and Saturated Density
Regarding densities, the ANOVA analysis (Table 6 and Table 7) indicated that both the C/A ratio and the increase in magnetite content significantly influenced the results. The analysis revealed that these factors had a notable impact on density values. As porosity increased, the sample densities decreased. The foam volume remained constant, with variations occurring only in the C/A ratio and magnetite content. When evaluating each mixture individually, it becomes evident that the magnetite content is the most influential factor. As the magnetite content increases, the incorporated bubbles remain intact, likely due to the strengthening of the hydrolipophilic film.
The dry and saturated density graphs (Figure 11 (a-d)) for foamed concretes indicate that, overall, density decreases as the percentage of magnetite increases, regardless of the cement/sand ratio (C/A). For dry density, specimens with C/A = 1:1 exhibit the highest values, with a reduction of approximately 22% when the magnetite content increases from 0% to 4% (1800 kg/m³ to 1400 kg/m³). In contrast, for C/A = 1:0, the dry density is significantly lower, showing a reduction of around 50% (1400 kg/m³ to 700 kg/m³).
A similar trend is observed in saturated density, where C/A = 1:1 presents the highest initial values (2000 kg/m³) and a reduction of up to 30% with 4% magnetite. Conversely, specimens with C/A = 1:0 exhibit considerably lower saturated densities, with reductions proportional to those seen in dry density. Specimens with C/A = 1:0.5 demonstrate intermediate values in both cases, though they also show a progressive decrease in density as the magnetite content increases.
The differences in density among the specimens can be attributed to a combination of factors, including the material composition and internal structure. The reduction in density with increasing magnetite content is linked to its effect on the foam formation process, which leads to greater air incorporation and a lighter cellular structure. Additionally, higher cement/sand ratios (C/A = 1:1) enhance the stability of the concrete matrix, resulting in greater density due to a more uniform distribution of solid particles and a reduced pore volume. Conversely, at C/A = 1:0, the absence of sand decreases matrix compaction, leading to increased porosity and lower densities, particularly as the magnetite content rises.
3.6. Water Absorption
The ANOVA analysis for water absorption, presented in Table 8, reveals that the C/A ratio, the percentage of magnetite, and their interaction significantly influenced the water absorption of the CPs produced, with a 95% confidence level. The C/A ratio was the most influential factor, contributing 47.9% to the variation in water absorption. In contrast, the type of cement (TC) had no significant impact on absorption, proving to be a non-significant factor.
The graph (Figure 12) illustrates the water absorption of foamed concretes as a function of magnetite content, ranging from 0% to 4%, for different cement-to-sand ratios (C/A) and cement types (CP II Z and CP V ARI). The results show that water absorption is highest in specimens with a C/A ratio of 1:0, reaching up to 44.9% for 4% magnetite with CP II Z. In contrast, the lowest absorption values are observed in specimens with a C/A ratio of 1:1, where absorption starts at 8.9% without magnetite and increases to 22.3% with 4% magnetite. The addition of magnetite, particularly at higher levels, tends to increase water absorption, with the effect being more pronounced in compositions with less sand (C/A 1:0). Comparing the extreme values, water absorption increases by up to 36% as magnetite content rises from 0% to 4%, depending on the composition.
The differences in water absorption values can be attributed to the structure and porosity of the materials, which are directly influenced by the C/A ratio and the presence of magnetite. Specimens with a C/A ratio of 1:1 exhibit lower water absorption due to their higher density and a more uniform distribution of the cementitious matrix, resulting in a reduced volume of interconnected pores. In contrast, specimens with a C/A ratio of 1:0 show increased porosity due to the absence of sand, which allows greater water infiltration, particularly at higher magnetite percentages.
3.7. Thermal Conductivity
The ANOVA analysis for thermal conductivity (Table 9) provides valuable insights into the statistical significance and relative contributions of the factors and their interactions. The type of cement (TC) showed no statistical evidence of influence on thermal conductivity (p-value = 0.972). In contrast, the cement/sand ratio (C/A) was highly significant (p-value < 0.001), contributing 47.9% of the total variation and emerging as the most influential factor. The percentage of magnetite (M) also had a significant impact (p-value < 0.001), accounting for 27.1% of the variation.
Among the interactions, the TC × C/A interaction was significant (p-value = 0.006), contributing 2.4% to the variation, while TC × M and TC × C/A × M were not significant, contributing only 0.6% and 1.2%, respectively. The C/A × M interaction, however, was statistically significant (p-value < 0.001) and contributed 8% of the variation. Residual variation (error) accounted for 12.8% of the total.
These findings underscore the importance of optimizing the cement/sand ratio and magnetite content to effectively adjust the thermal conductivity of the material.
Figure 13 presents the thermal conductivity graph as a function of magnetite percentage, considering different cement types and sand proportions.
The results indicate that the thermal conductivity of foamed concretes varies significantly depending on the magnetite content and the cement-to-sand ratio (C/A). For the 1:1 mix (C/A 1:1; TC CP II Z), the initial thermal conductivity (0% magnetite) was 0.54 W/mK, decreasing by approximately 18.5% to 0.44 W/mK at 4% magnetite. In the same mix with CP V ARI cement, the conductivity dropped by about 24%, from 0.50 W/mK to 0.38 W/mK at 4% magnetite.
In mixes with lower sand proportions (C/A 1:0.5 and C/A 1:0), the reductions in thermal conductivity were even more pronounced. For instance, in the C/A 1:0 mix with CP II Z, the initial conductivity of 0.43 W/mK decreased to 0.22 W/mK, representing a reduction of approximately 49%. Overall, specimens with lower sand content exhibited the most substantial reductions in thermal conductivity as the magnetite content increased.
The differences in thermal conductivity among the specimens can be primarily attributed to the number of pores in the foamed concrete. The addition of magnetite, particularly in conjunction with lower sand proportions, increases the porosity of the concrete matrix. As the magnetite concentration rises and the sand content decreases, the concrete structure becomes more porous, leading to a reduction in material density and, consequently, its heat conduction capability. This occurs because the pores act as barriers to heat transfer, creating thermal insulation zones within the concrete matrix. Consequently, mixes with the lowest sand content and highest magnetite levels exhibit the lowest thermal conductivity values, owing to their more porous and less dense structure.
4. Conclusions
This study demonstrated the feasibility of using nano-magnetite extracted from acid mine drainage in the formulation of foamed concrete, highlighting its significant influence on the material’s physical and mechanical properties. The results confirmed that the addition of magnetite, combined with varying cement-to-sand ratios, directly affects foam stability, porosity, density, mechanical strength, and thermal conductivity.
The incorporation of magnetite improved foam stability, resulting in a denser and more homogeneous structure, particularly at concentrations of 3% and 4%, which promoted the formation of a more robust bubble network. This characteristic correlated with higher porosity levels, ranging from 31.8% to 75.6%, depending on the cement-to-sand ratio (C/A) and the type of cement used. The highest porosity was observed in mixtures with C/A = 1:0 and CP II Z cement, while the lowest occurred with C/A = 1:1 and CP V ARI cement, underscoring the critical role of composition in defining the concrete’s microstructure.
From a mechanical perspective, the addition of magnetite exhibited an inverse relationship with compressive and flexural tensile strengths due to the increase in porosity. However, the combination of a C/A ratio of 1:1 with CP II Z cement achieved the best overall performance, balancing porosity and strength. Conversely, mixtures with a lower sand content (C/A = 1:0) demonstrated greater mechanical fragility, reinforcing the structural stability provided by sand.
Regarding density and thermal conductivity, the results confirmed that magnetite significantly reduces these parameters, facilitating the development of ultra-light foamed concretes with enhanced thermal insulation properties. Specifically, mixtures with C/A = 1:0 exhibited the lowest densities and thermal conductivities, emphasizing the material’s potential for thermal insulation applications.
In summary, this study advances the use of waste materials, such as nano magnetite, in civil construction, promoting both sustainability and the functional performance of foamed concrete. Future research should focus on optimizing formulations and evaluating long-term durability to facilitate practical applications and industrial scalability...
Author Contributions
Conceptualization, R.T.L and R.d.A.S.; data curation, R.T.L, M.A.P. and T.L.P; formal analysis, R.T.L., M.A.P. and T.L.P; investigation, M.A.P., T.L.P. and E.C.F.B.F.; methodology, R.T.L. and M.A.P.; project administration, R.T.L.; resources, M.A.P., T.L.P., E.C.F.B.F. and R.T.L.; validation, R.T.L.; visualization, R.d.A.S. and A.N.; writing—original draft preparation, M.A.P., T.L.P. and E.C.F.B.F.; writing—review and editing, R.T.L., R.d.A.S. and A.N. All authors have read and agreed to the published version of the manuscript.
Funding
This research received no external funding.
Institutional Review Board Statement
Not applicable.
Informed Consent Statement
Informed consent was obtained from all subjects involved in the study.
Data Availability Statement
Data are contained within the paper.
Acknowledgments
The authors would like to thank the Fundação Meridional, CAPES, CNPq, and ATITUS Educação for the grant of financial and technical support.
Conflicts of Interest
The authors declare no conflicts of interest.
References
- Zhou, G.; Su, R.K.L. A Review on Durability of Foam Concrete. Buildings 2023, 13, 1880. [Google Scholar] [CrossRef]
- Thienel, K.-C.; Haller, T.; Beuntner, N. Lightweight Concrete—From Basics to Innovations. Materials 2020, 13, 1120. [Google Scholar] [CrossRef]
- Sifan, M.; Nagaratnam, B.; Thamboo, J.; Poologanathan, K.; Corradi, M. Development and Prospectives of Lightweight High Strength Concrete Using Lightweight Aggregates. Constr Build Mater 2023, 362. [Google Scholar] [CrossRef]
- Amran, Y.H.M.; Farzadnia, N.; Ali, A.A.A. Properties and Applications of Foamed Concrete; A Review. Constr Build Mater 2015, 101, 990–1005. [Google Scholar] [CrossRef]
- Krämer, C.; Schauerte, M.; Kowald, T.L.; Trettin, R.H.F. Three-Phase-Foams for Foam Concrete Application. Mater Charact 2015, 102, 173–179. [Google Scholar] [CrossRef]
- Priyatham, B.P.R.V.S.; Lakshmayya, M.T.S.; Chaitanya, D.V.S.R.K. Review on Performance and Sustainability of Foam Concrete. Mater Today Proc 2023. [Google Scholar] [CrossRef]
- Ranjani, I.S.; Ramamurthy, K. Relative Assessment of Density and Stability of Foam Produced with Four Synthetic Surfactants. Materials and Structures/Materiaux et Constructions 2010, 43, 1317–1325. [Google Scholar] [CrossRef]
- Elango, K.S.; Sanfeer, J.; Gopi, R.; Shalini, A.; Saravanakumar, R.; Prabhu, L. Properties of Light Weight Concrete—A State of the Art Review. Mater Today Proc 2021, 46, 4059–4062. [Google Scholar] [CrossRef]
- ASTM Standard Specification for Foaming Agents Used in Making Preformed Foam for Cellular Concrete 1; West Conshohocken, 1999.
- Wang, X.; Huang, J.; Dai, S.; Ma, B.; Jiang, Q. Investigation of Silica Fume as Foam Cell Stabilizer for Foamed Concrete. Constr Build Mater 2020, 237, 117514. [Google Scholar] [CrossRef]
- Grenzel, M.P. dos S.; Grenzel, L.Y. dos S.; Tamiosso, B.S.; Costa, F.B.P. da; Marangon, E. Efeito Da Goma Xantana Como Estabilizador Da Espuma Em Concretos Celulares de Diferentes Densidades. Matéria (Rio de Janeiro) 2023, 28, e20230202. [Google Scholar] [CrossRef]
- Pugh RJ The Stability/Instability of Bubbles and Foams. In Bubble and Foam Chemistry; Cambridge University Press, 2016; pp. 220–268.
- Gencel, O.; Bilir, T.; Bademler, Z.; Ozbakkaloglu, T. A Detailed Review on Foam Concrete Composites: Ingredients, Properties, and Microstructure. Applied Sciences 2022, 12, 5752. [Google Scholar] [CrossRef]
- Mansouri, I.; Nejat, M.; Shahbazi, S.; Karami, A. Effect of Magnetite Nanoparticles (Ferroferric Oxide) on Discrete Concrete Properties. Proceedings of the Institution of Civil Engineers—Construction Materials 2019, 172, 95–102. [Google Scholar] [CrossRef]
- Schwertmann, U.; Cornell, R.M. Iron Oxides in the Laboratory; Second.; Wiley-VCH: Weinheim, 2000; ISBN 3-57229669-7. [Google Scholar]
- Silva, R.A.; Castro, C.D.; Vigânico, E.M.; Petter, C.O.; Schneider, I.A.H. Selective Precipitation/UV Production of Magnetite Particles Obtained from the Iron Recovered from Acid Mine Drainage. Miner Eng 2012, 29. [Google Scholar] [CrossRef]
- Vigânico, E.M.; Colling, A.V.; Silva, R.D.A.; Schneider, I.A.H. Biohydrometallurgical/UV Production of Ferrous Sulphate Heptahydrate Crystals from Pyrite Present in Coal Tailings. Miner Eng 2011, 24. [Google Scholar] [CrossRef]
- Silva, A.; O de, C.C.; de, R.A.; de, G. V Use of Magnetic Iron Oxide from Waste to Prevent Corrosion in Reinforced Concrete. In Proceedings of the International Workshop on Advances in Cleaner Production; 13 th IWACP: Curitiba, November 6, 2024; pp. 1–10. [Google Scholar]
- Menezes, J.C.C.C.; Colling, A.V.; Silva, R.A.S.; Scheneider, I.A.H. Effect of Pyrite Concentration on the Quality of Ferric Sulfate Coagulants Obtained by Leaching from Coal Tailings. Minerals and Metallurgical Processing 2016, 33, 77–81. [Google Scholar] [CrossRef]
- Cornell, R.M.; Schwertmann, U. The Iron Oxides; Structures, Properties, Reactions, Occurrence and Uses; First.; VCH Verlagsgesellschaft mbH: Weinheim, 1996; ISBN 3-527-28576-8. [Google Scholar]
- ABNT NBR 5739—Concreto—Ensaio de Compressão de Corpos de Prova Cilíndricos. Associação Brasileira de Normas Técnicas 2018.
- ABNT NBR 12142—Concreto—Determinação Da Resistência à Tração Na Flexão de Corpos de Prova Prismáticos. Associação Brasileira de Normas Técnicas 2010.
- ASTM C948-81—Standard Test Method for Dry and Wet Bulk Density, Water Absorption, and Apparent Porosity of Thin Sections of Glass-Fiber Reinforced Concrete. American Society for Testing and Materials 2016.
- ABNT NBR 9778—Argamassa e Concreto Endurecidos—Determinação Da Absorção de Água, Índice de Vazios e Massa Específica. Associação Brasileira de Normas Técnicas 2005.
- EN BS 480-11 Admixtures for Concrete, Mortar and Grout-Test Methods-Part 11: Determination of Air Void Characteristics in Hardened Concrete. British Standards Institution 2005.
- Favaretto, P.; Hidalgo, G.; Sampaio, C.; Silva, R.; Lermen, R. Characterization and Use of Construction and Demolition Waste from South of Brazil in the Production of Foamed Concrete Blocks. Applied Sciences 2017, 7, 1090. [Google Scholar] [CrossRef]
- Hilal, A.A.; Thom, N.H.; Dawson, A.R. On Void Structure and Strength of Foamed Concrete Made without/with Additives. Constr Build Mater 2015, 85, 157–164. [Google Scholar] [CrossRef]
- Nambiar, E.K.K.; Ramamurthy, K. Air-void Characterisation of Foam Concrete. Cem Concr Res 2007, 37, 221–230. [Google Scholar] [CrossRef]
- Lermen, R.T.; Favaretto, P.; Silva, R. de A.; Hidalgo, G.E.N.; Tubino, R.M.C.; Tiecher, F. Effect of Additives, Cement Type, and Foam Amount on the Properties of Foamed Concrete Developed with Civil Construction Waste. Applied Sciences 2019, 9, 2998. [Google Scholar] [CrossRef]
- Tittarelli, F.; Giosuè, C.; Mobili, A.; di Perna, C.; Monosi, S. Effect of Using Recycled Instead of Virgin EPS in Lightweight Mortars. Procedia Eng 2016, 161, 660–665. [Google Scholar] [CrossRef]
- Franco, A. An Apparatus for the Routine Measurement of Thermal Conductivity of Materials for Building Application Based on a Transient Hot-Wire Method. Appl Therm Eng 2007, 27, 2495–2504. [Google Scholar] [CrossRef]
- Sacht, H.M.; Rossignolo, Ja.; Santos, Wn. Avaliação Da Condutividade Térmica de Concretos Leves Com Argila Expandida. Matéria (Rio de Janeiro) 2010, 15, 31–39. [Google Scholar] [CrossRef]
- Santos, W.N. dos O Método de Fio Quente: Técnica Em Paralelo e Técnica de Superfície. Cerâmica 2002, 48, 86–91. [Google Scholar] [CrossRef]
- Chung, S.-Y.; Abd Elrahman, M.; Kim, J.-S.; Han, T.-S.; Stephan, D.; Sikora, P. Comparison of Lightweight Aggregate and Foamed Concrete with the Same Density Level Using Image-Based Characterizations. Constr Build Mater 2019, 211, 988–999. [Google Scholar] [CrossRef]
Figure 1.
Sand granulometric curve and areas of use and optimization of sand in mortars according to standard NBR 7211.
Figure 1.
Sand granulometric curve and areas of use and optimization of sand in mortars according to standard NBR 7211.
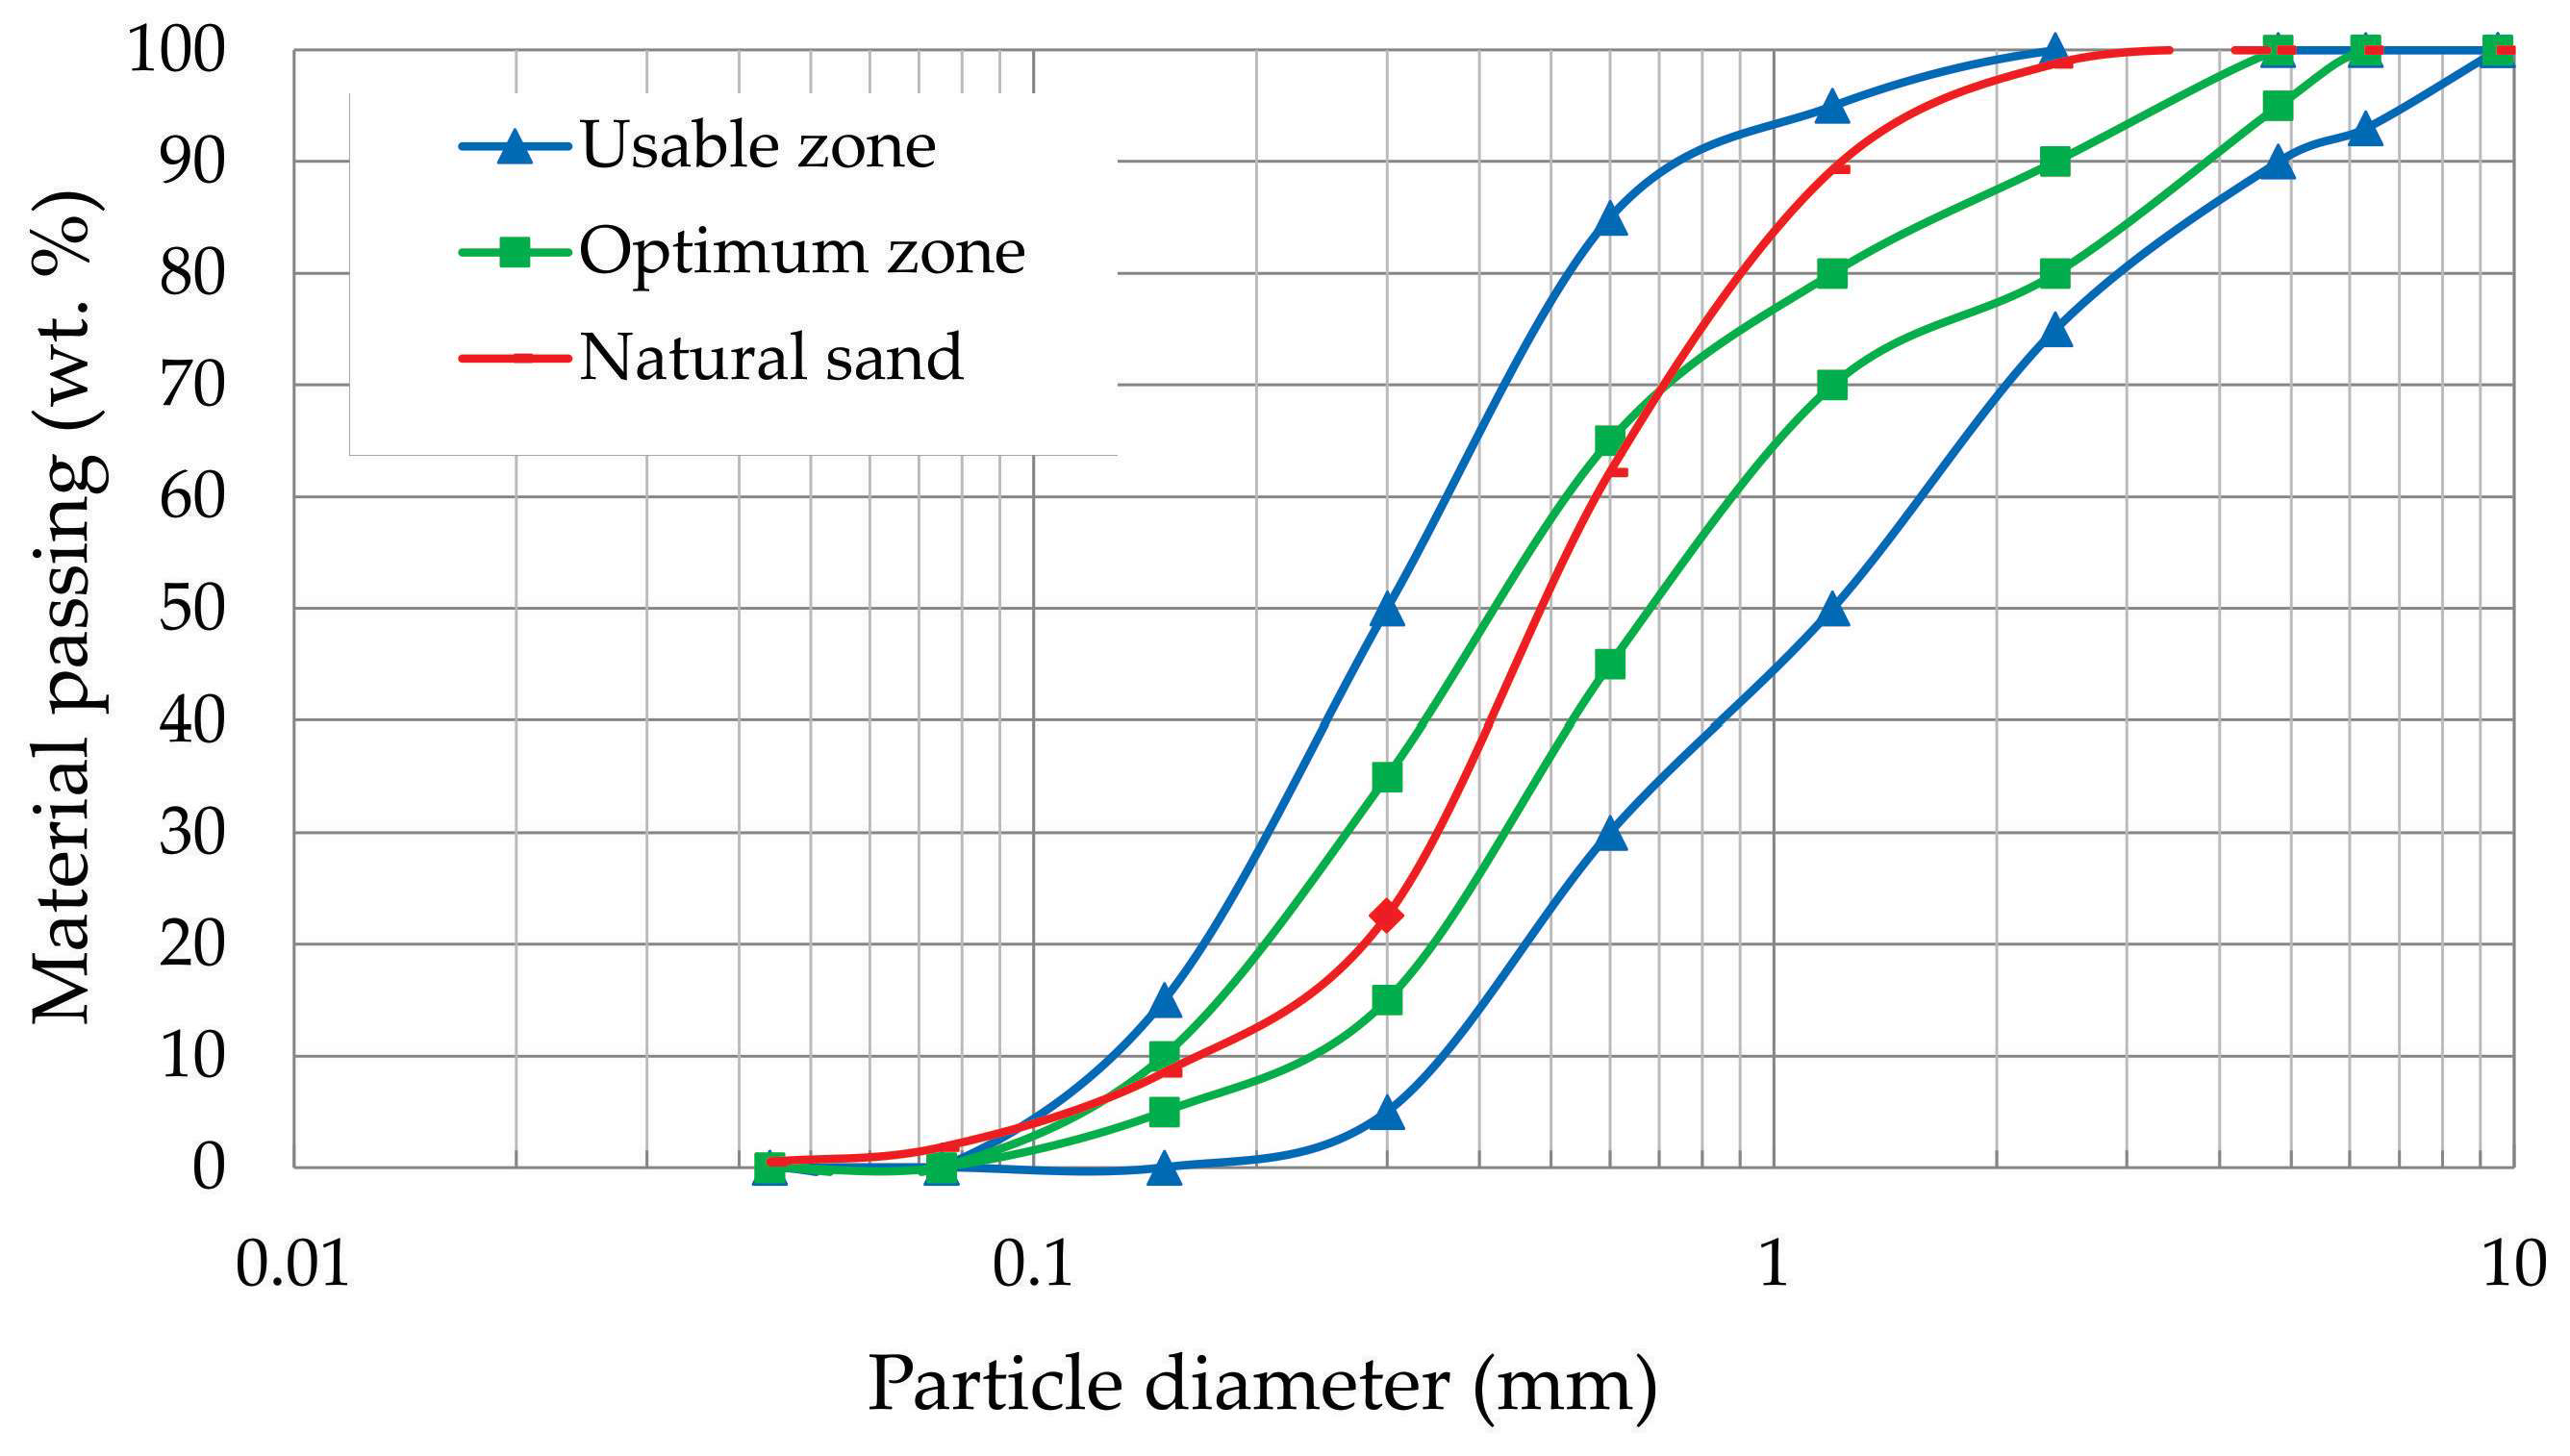
Figure 2.
Obtaining magnetite: (a) Leaching column for dissolving pyrite, (b) Reaction tank, and (c) Filtration process.
Figure 2.
Obtaining magnetite: (a) Leaching column for dissolving pyrite, (b) Reaction tank, and (c) Filtration process.
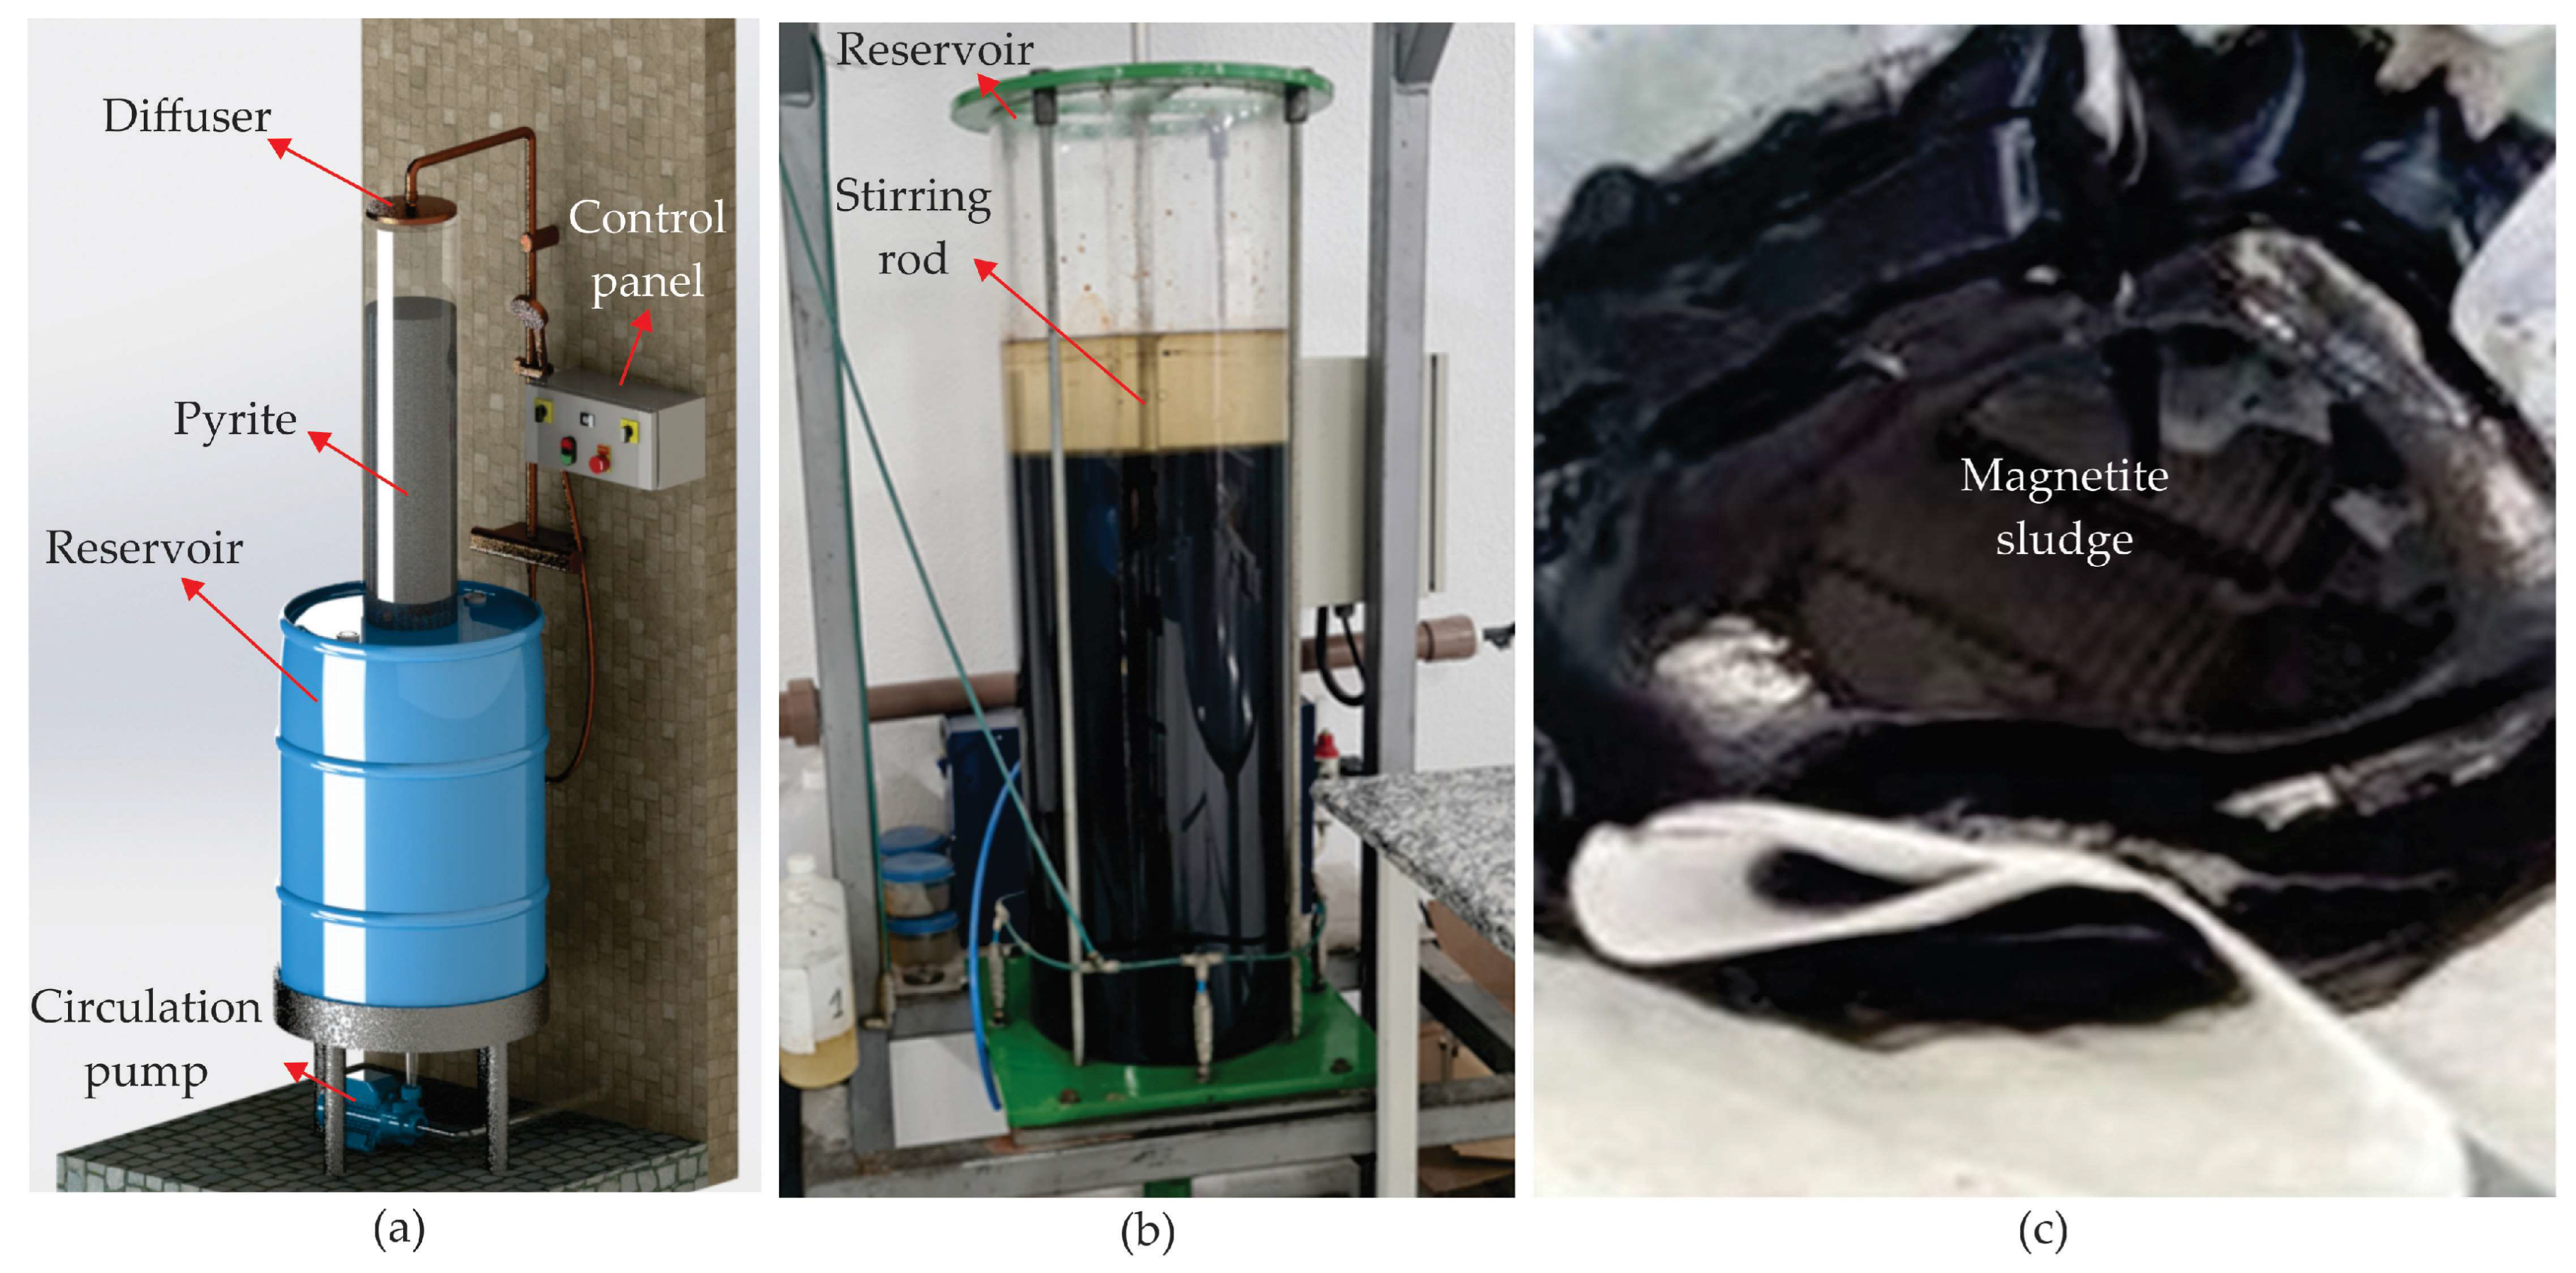
Figure 3.
(a) X-ray diffraction and (b) X-ray fluorescence for the magnetite produced from DAM.
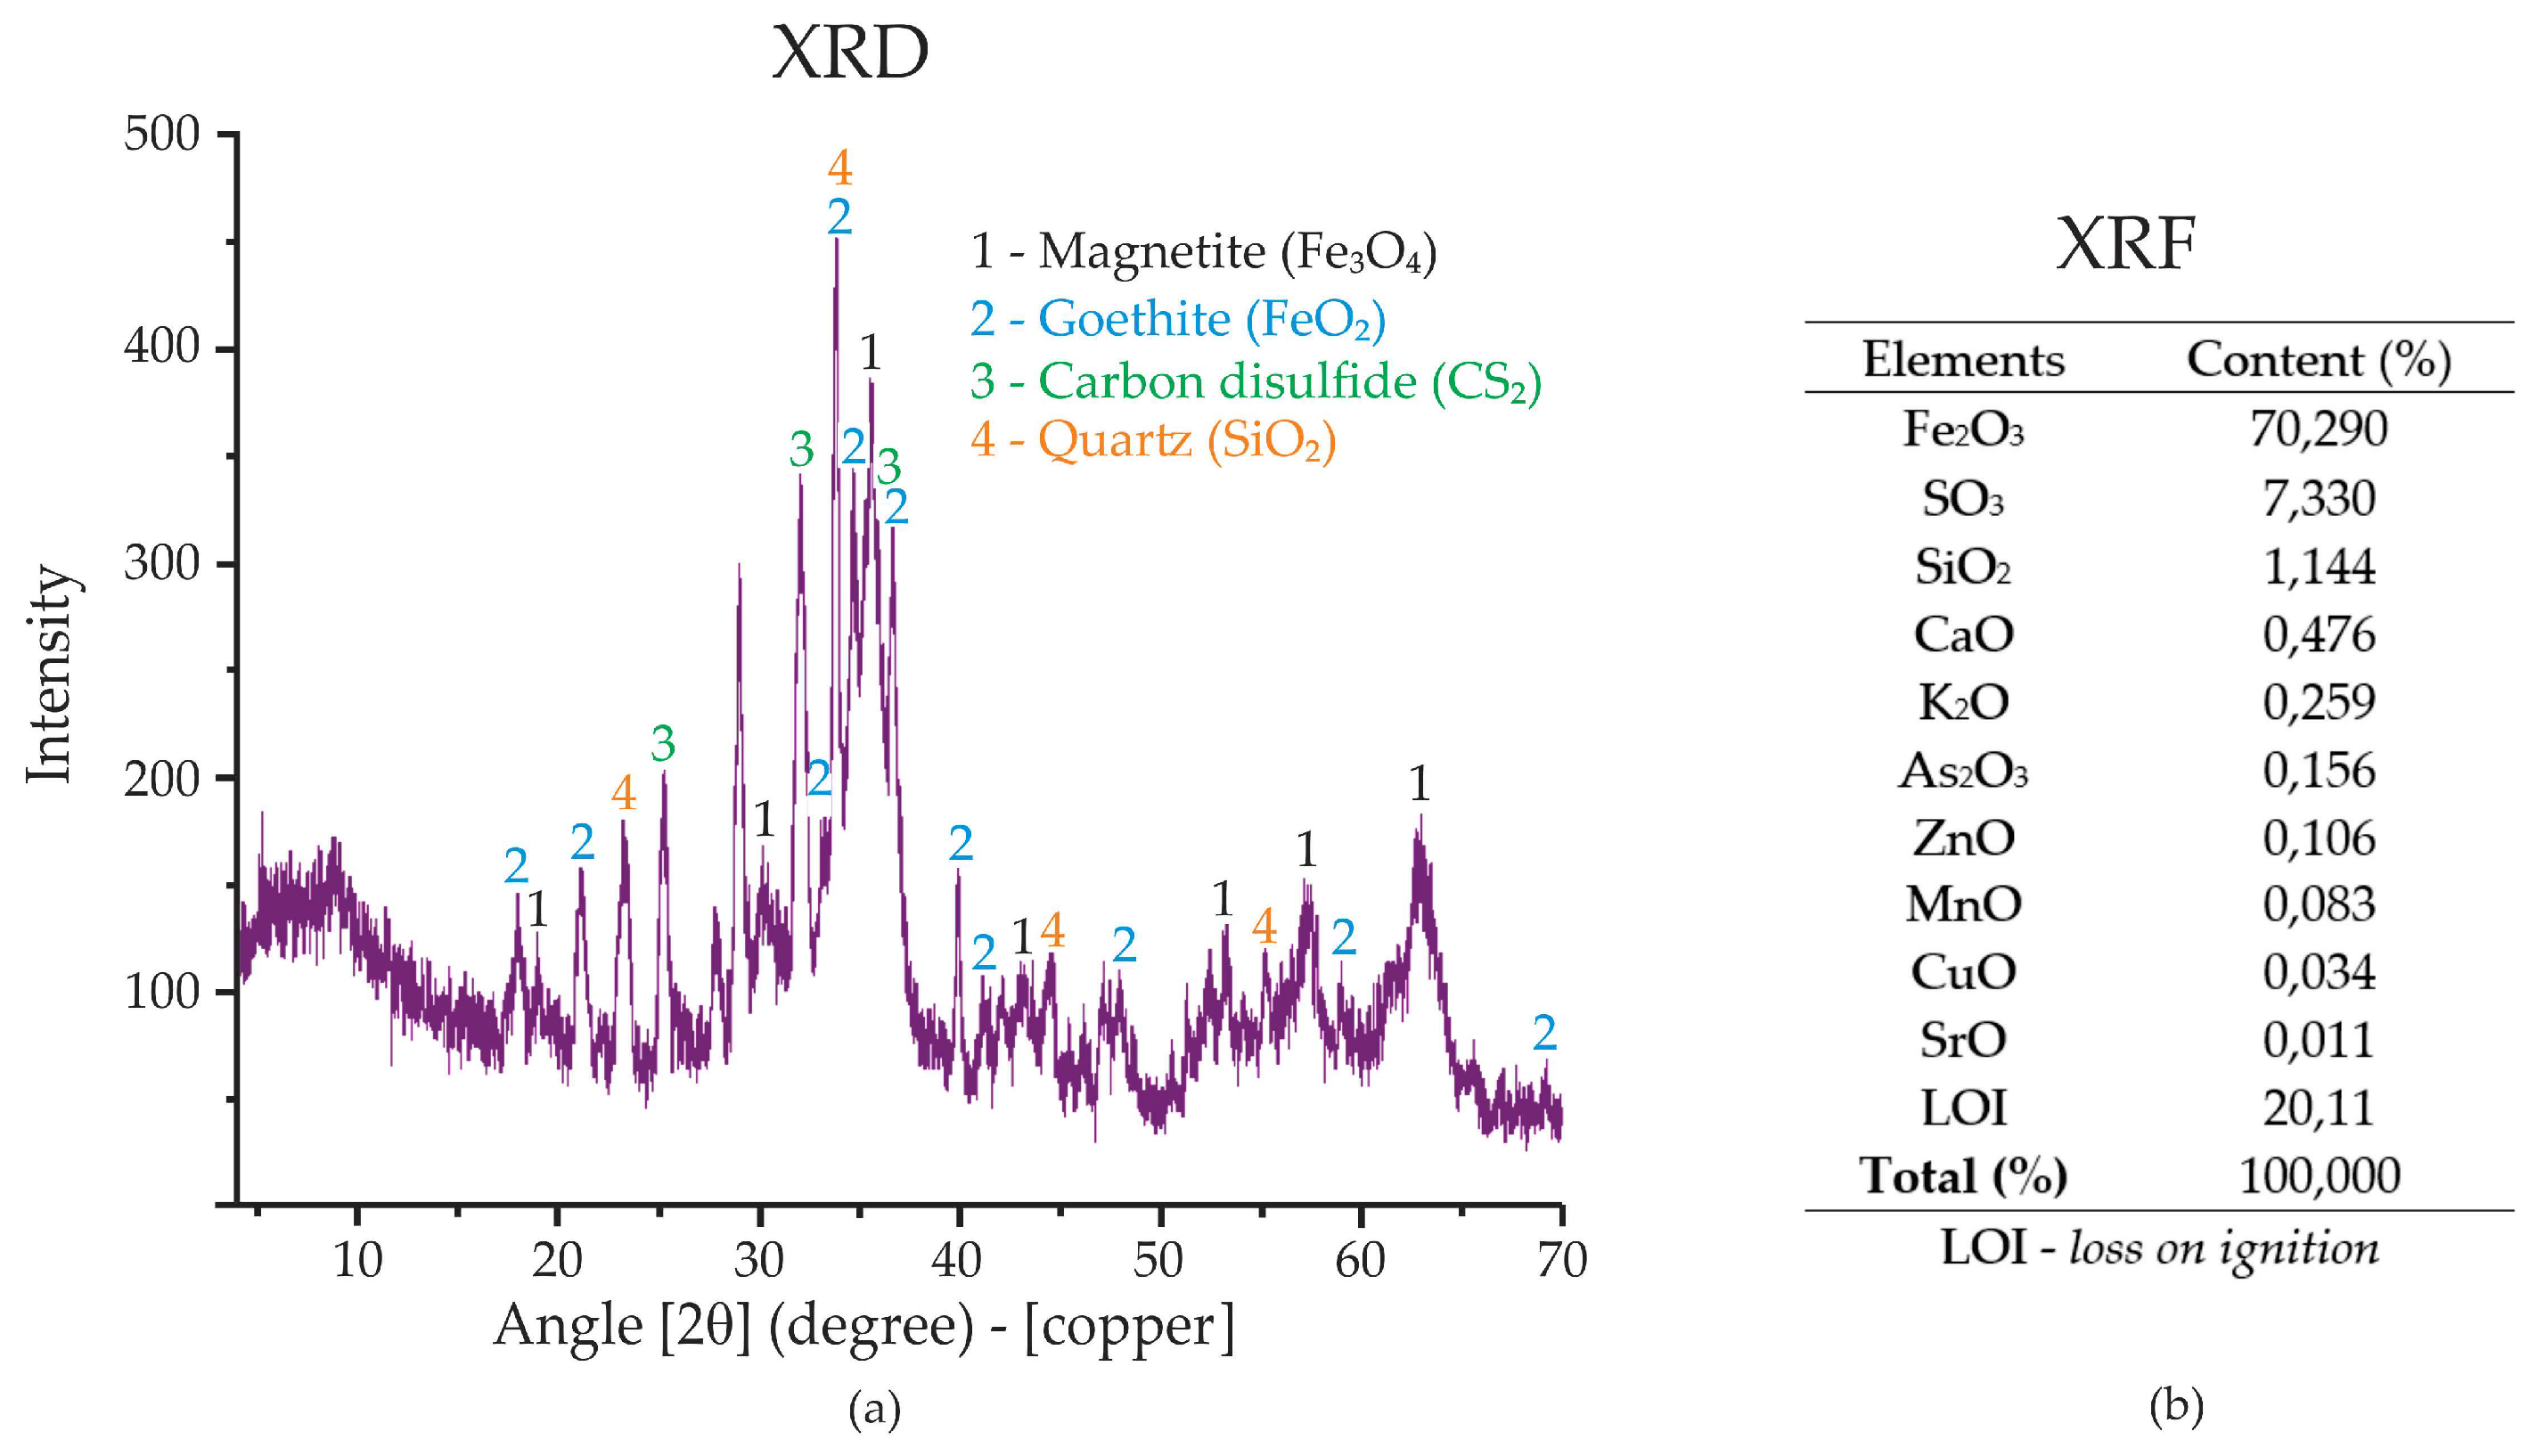
Figure 4.
Foam with different additions of magnetite.
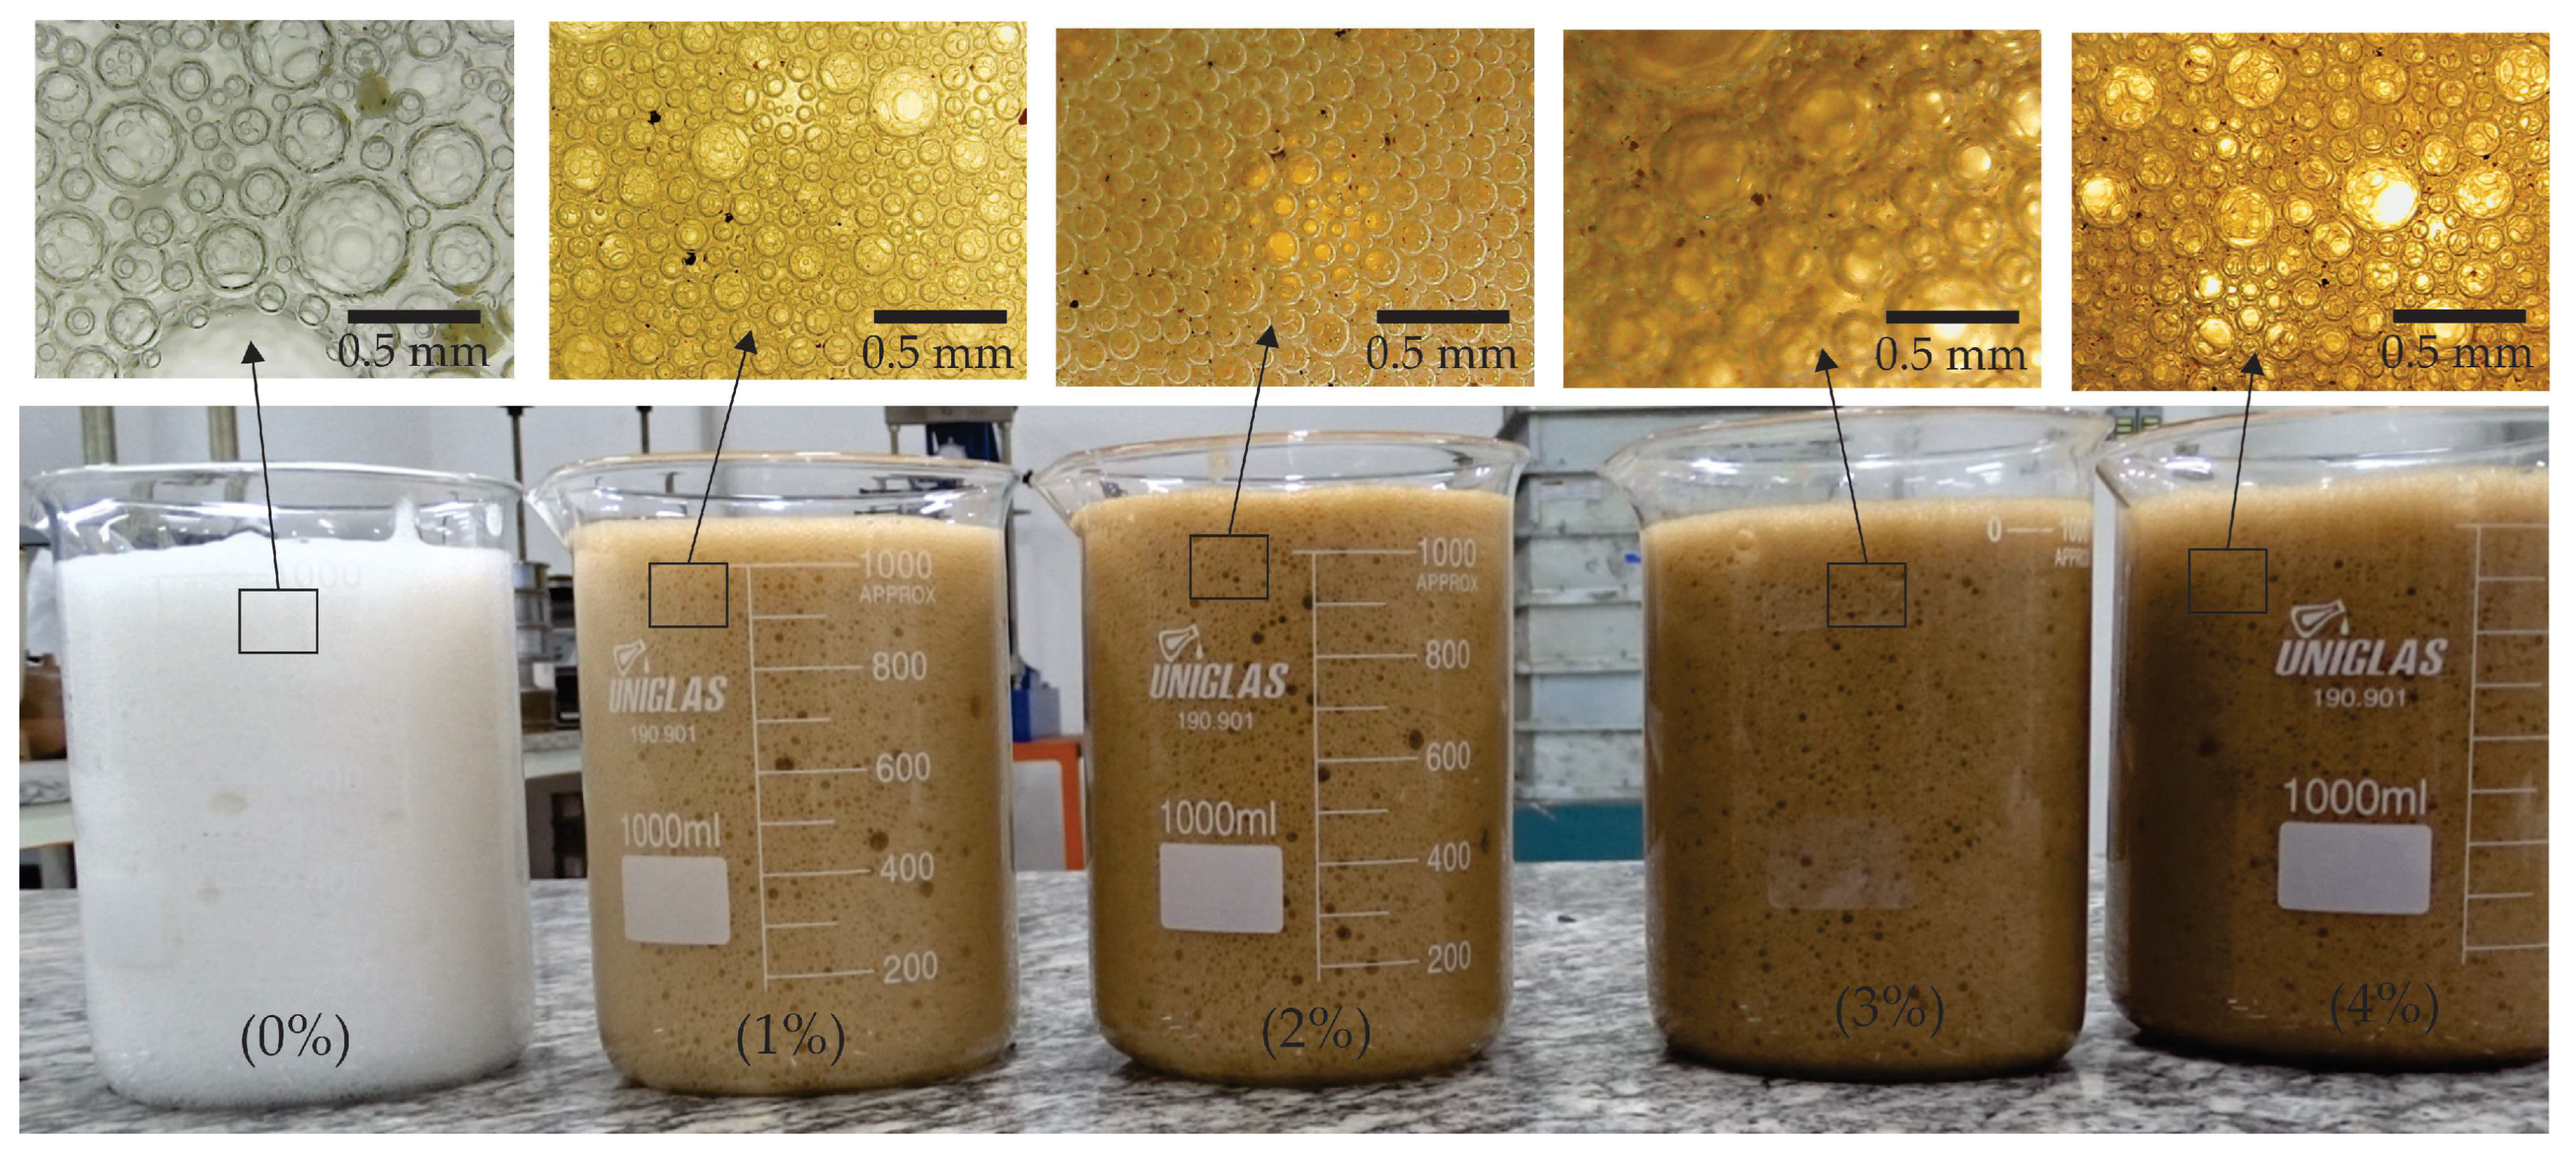
Figure 5.
Graph of porosity as a function of the percentage of magnetite for different types of cement and cement/sand ratio.
Figure 5.
Graph of porosity as a function of the percentage of magnetite for different types of cement and cement/sand ratio.
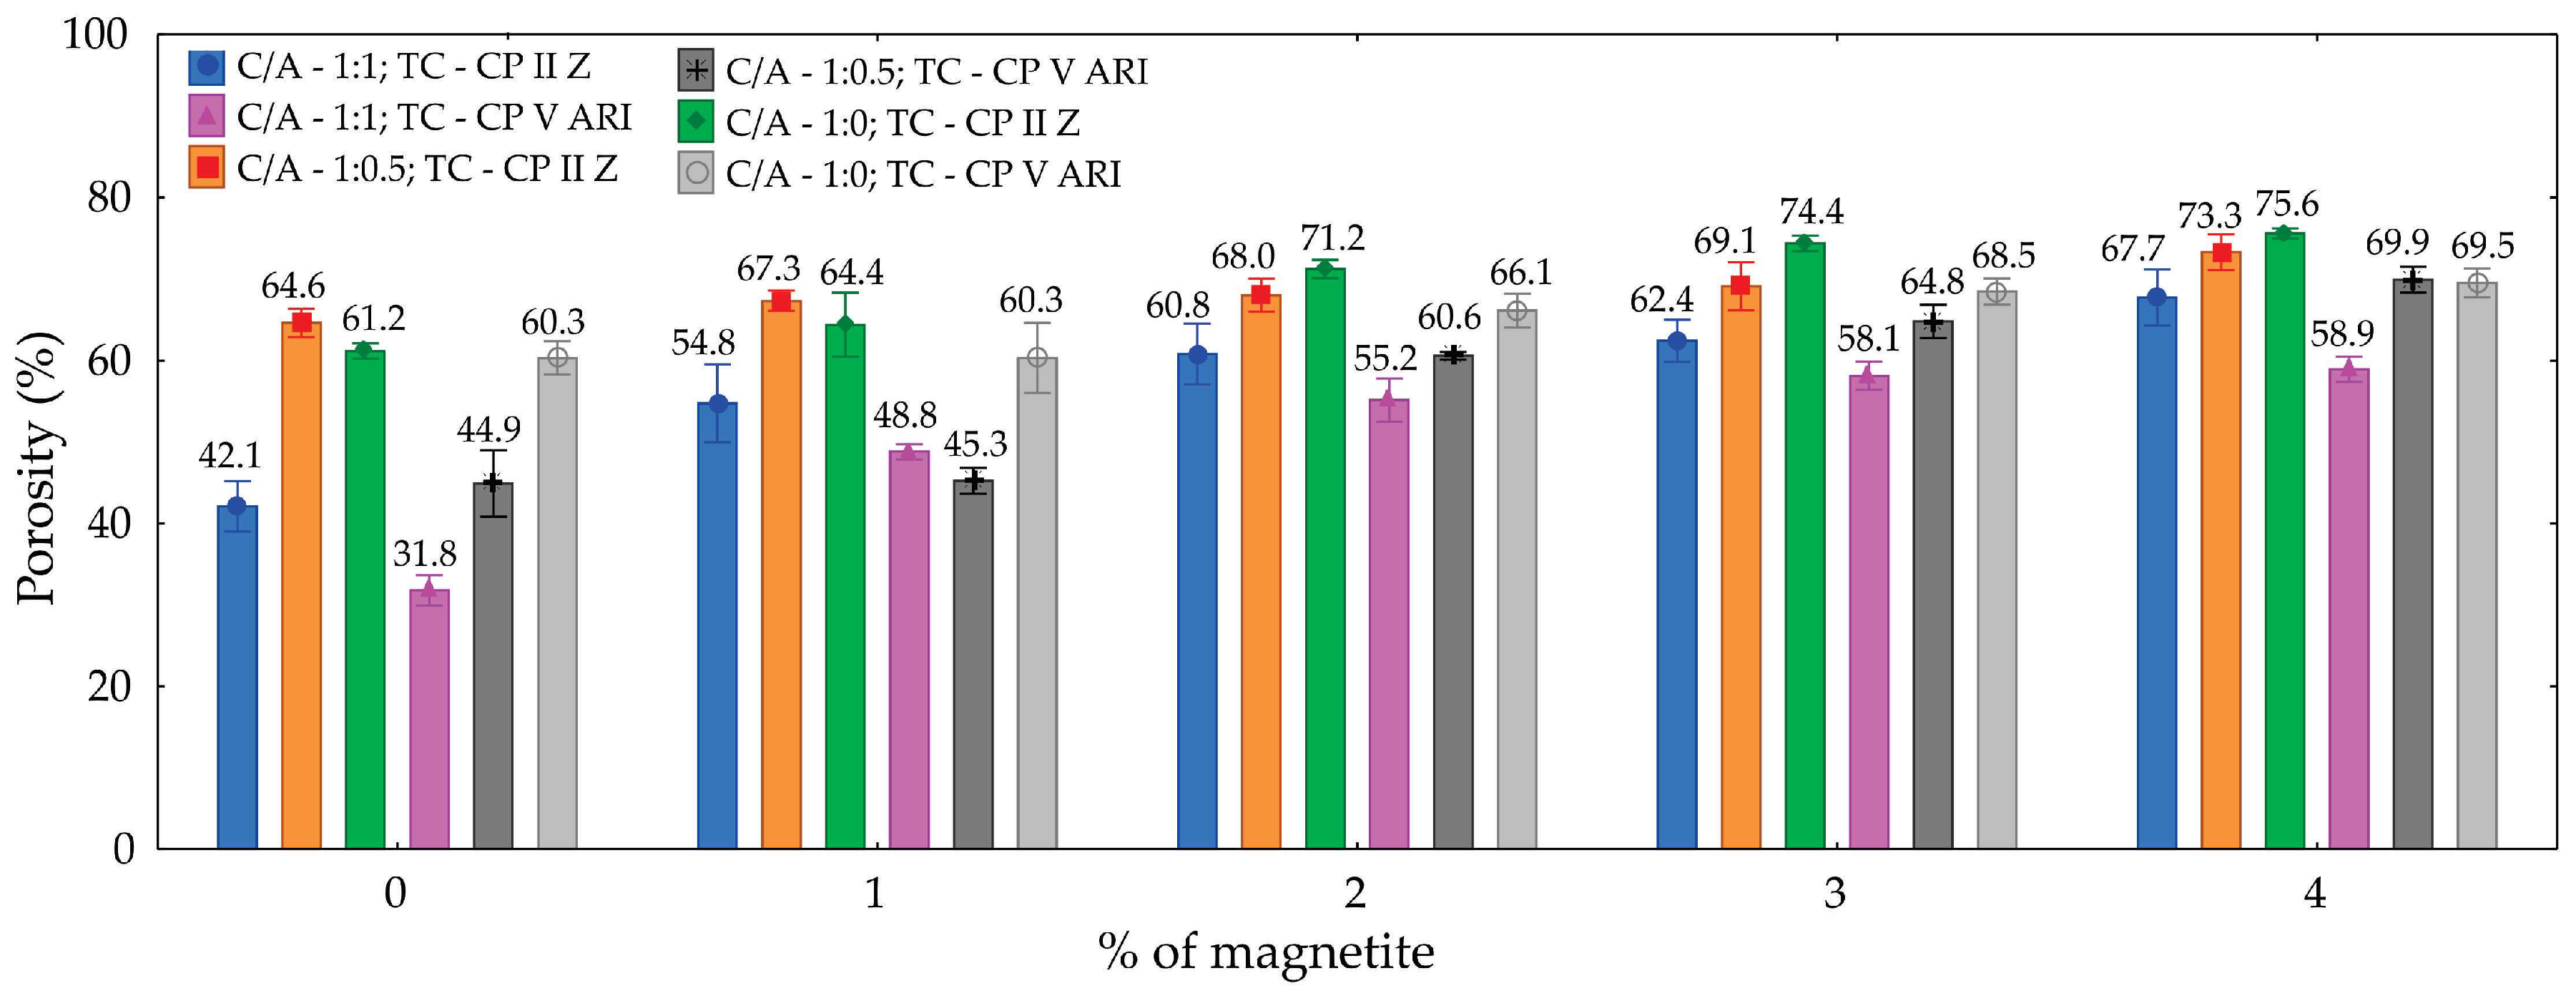
Figure 6.
Images of the cross-section of foamed concrete specimens, highlighting the formation and distribution of pores in different formulations.
Figure 6.
Images of the cross-section of foamed concrete specimens, highlighting the formation and distribution of pores in different formulations.
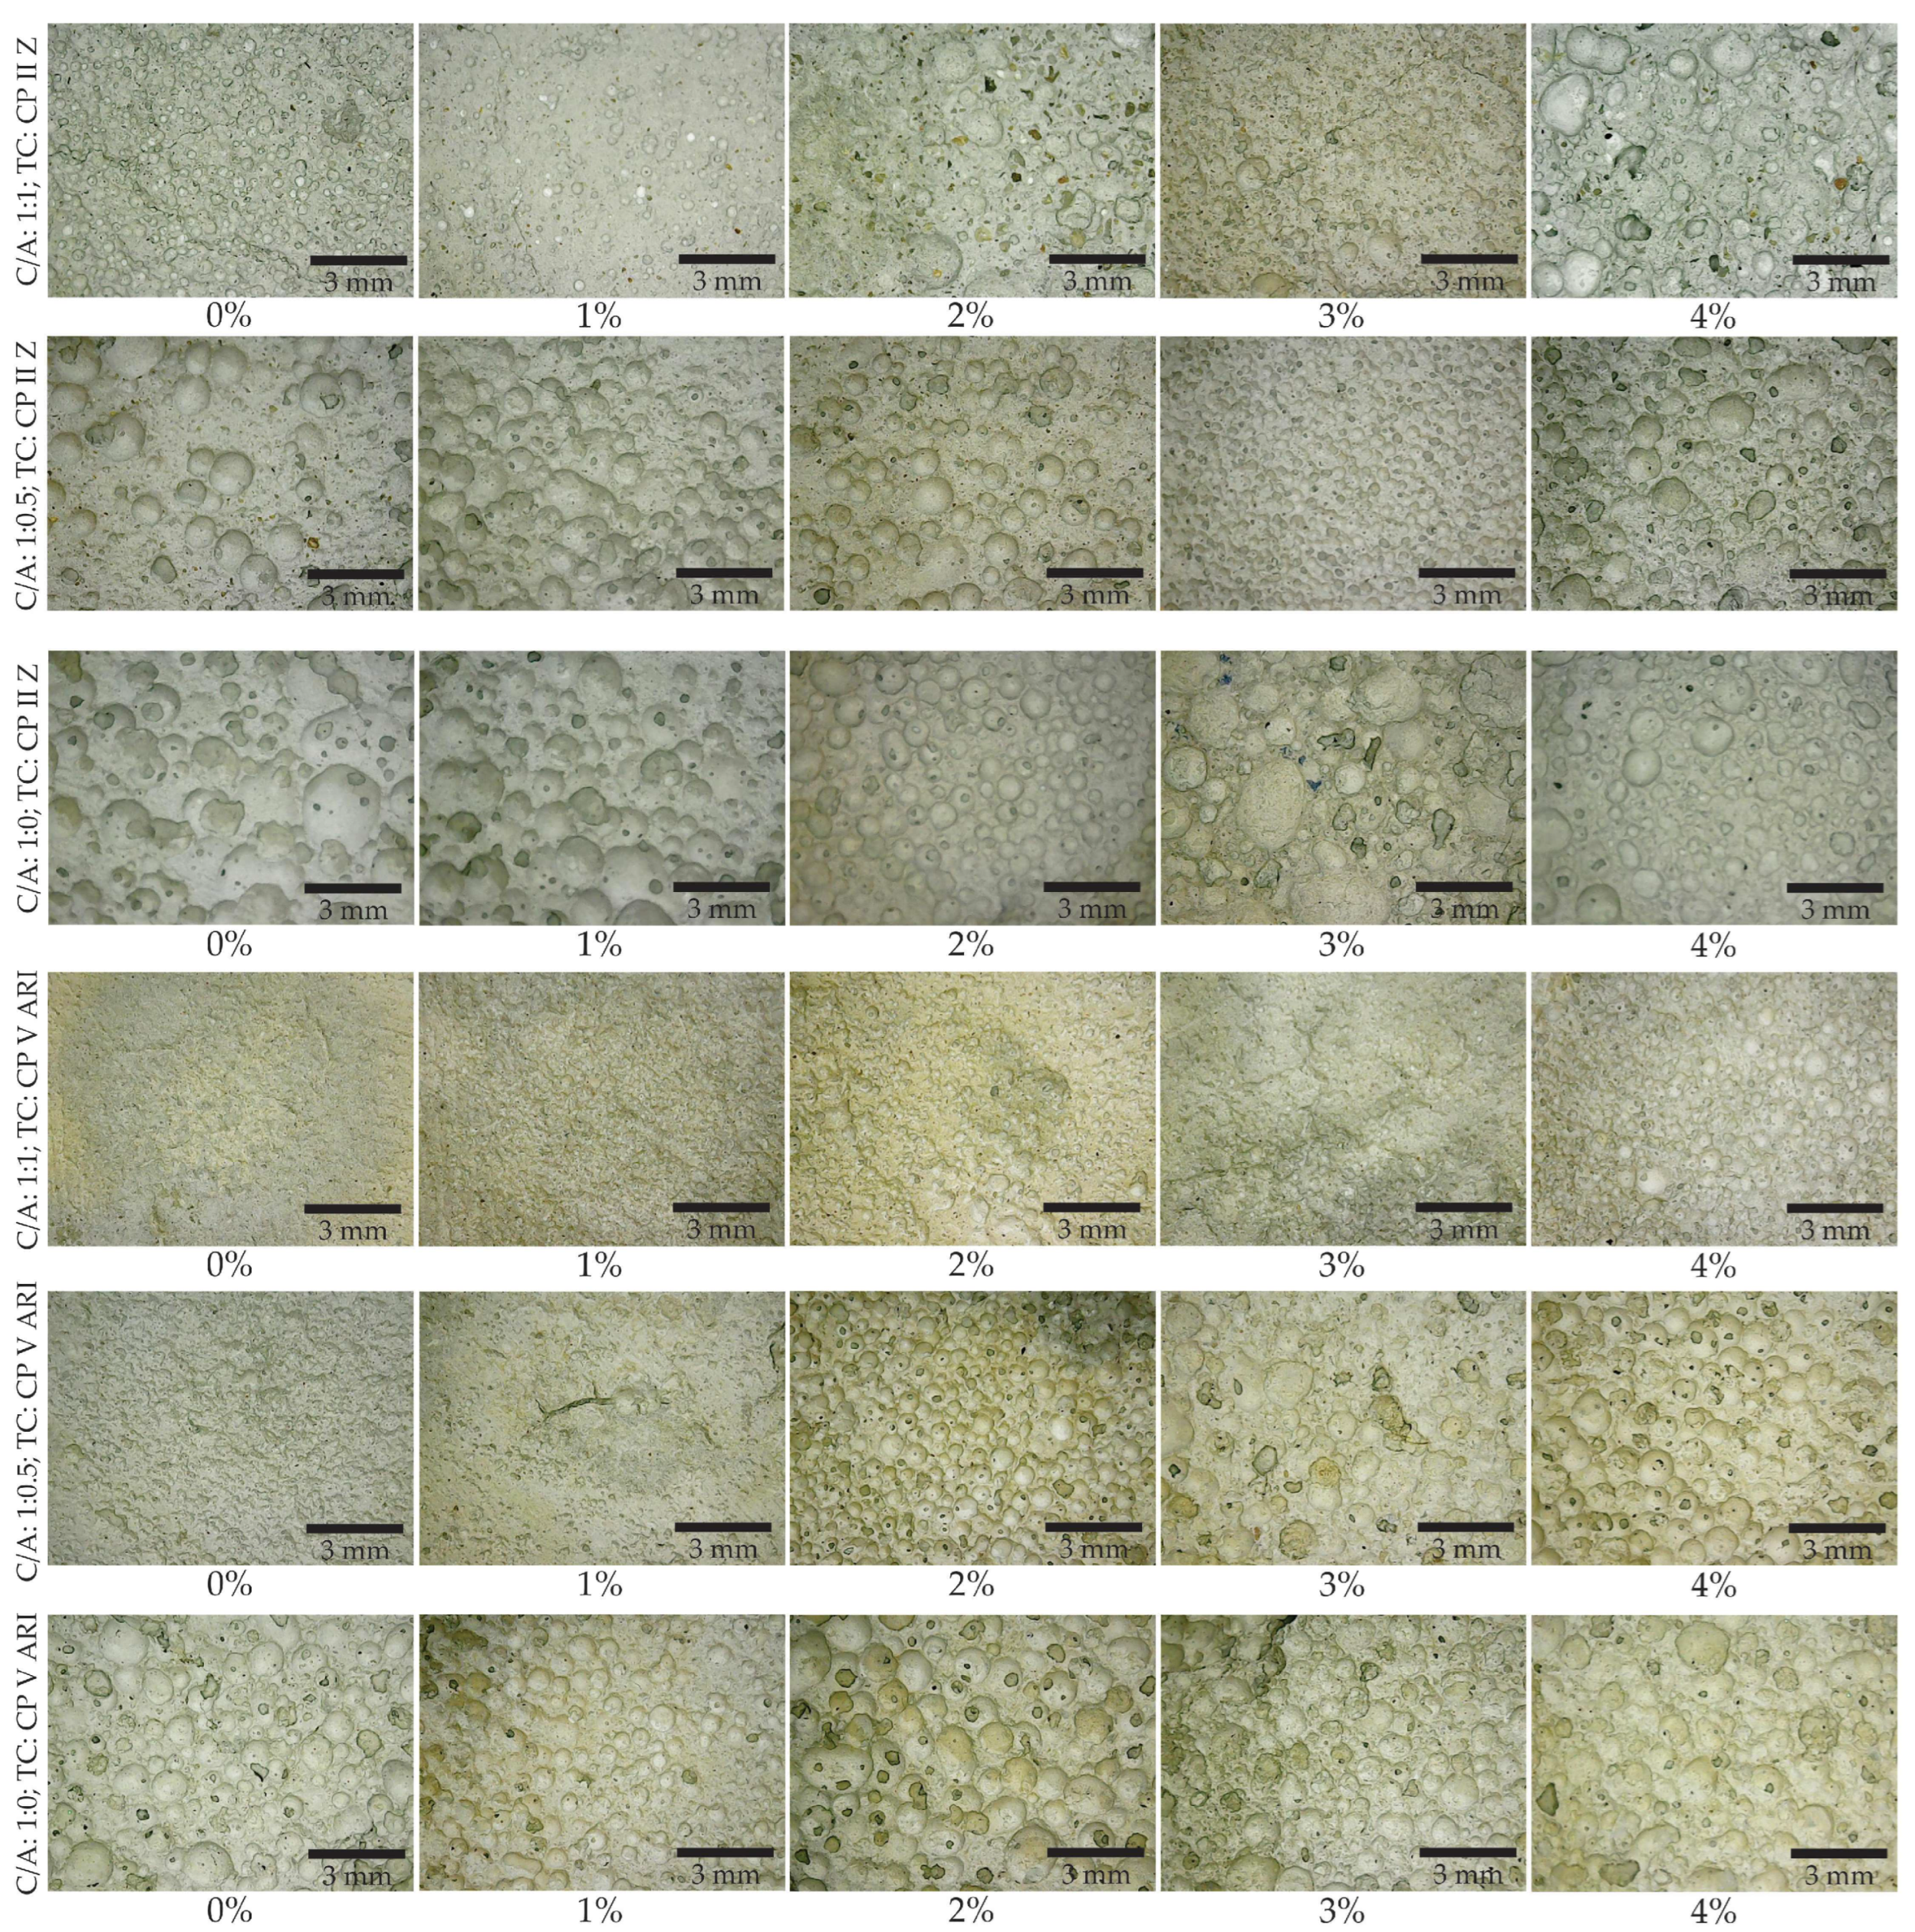
Figure 7.
Cumulative frequency (%) as a function of average pore diameter for different amounts of magnetite. a) C/A 1:1 TC: CPII Z 32-RS; b) C/A 1:0.5 TC: CPII Z 32-RS; c) C/A 1:0 TC: CPII Z 32-RS; d) C/A 1:1 TC: CPV—ARI ; e) C/A 1:0.5 TC: CPV—ARI and f) C/A 1:0 TC: CPV—ARI.
Figure 7.
Cumulative frequency (%) as a function of average pore diameter for different amounts of magnetite. a) C/A 1:1 TC: CPII Z 32-RS; b) C/A 1:0.5 TC: CPII Z 32-RS; c) C/A 1:0 TC: CPII Z 32-RS; d) C/A 1:1 TC: CPV—ARI ; e) C/A 1:0.5 TC: CPV—ARI and f) C/A 1:0 TC: CPV—ARI.
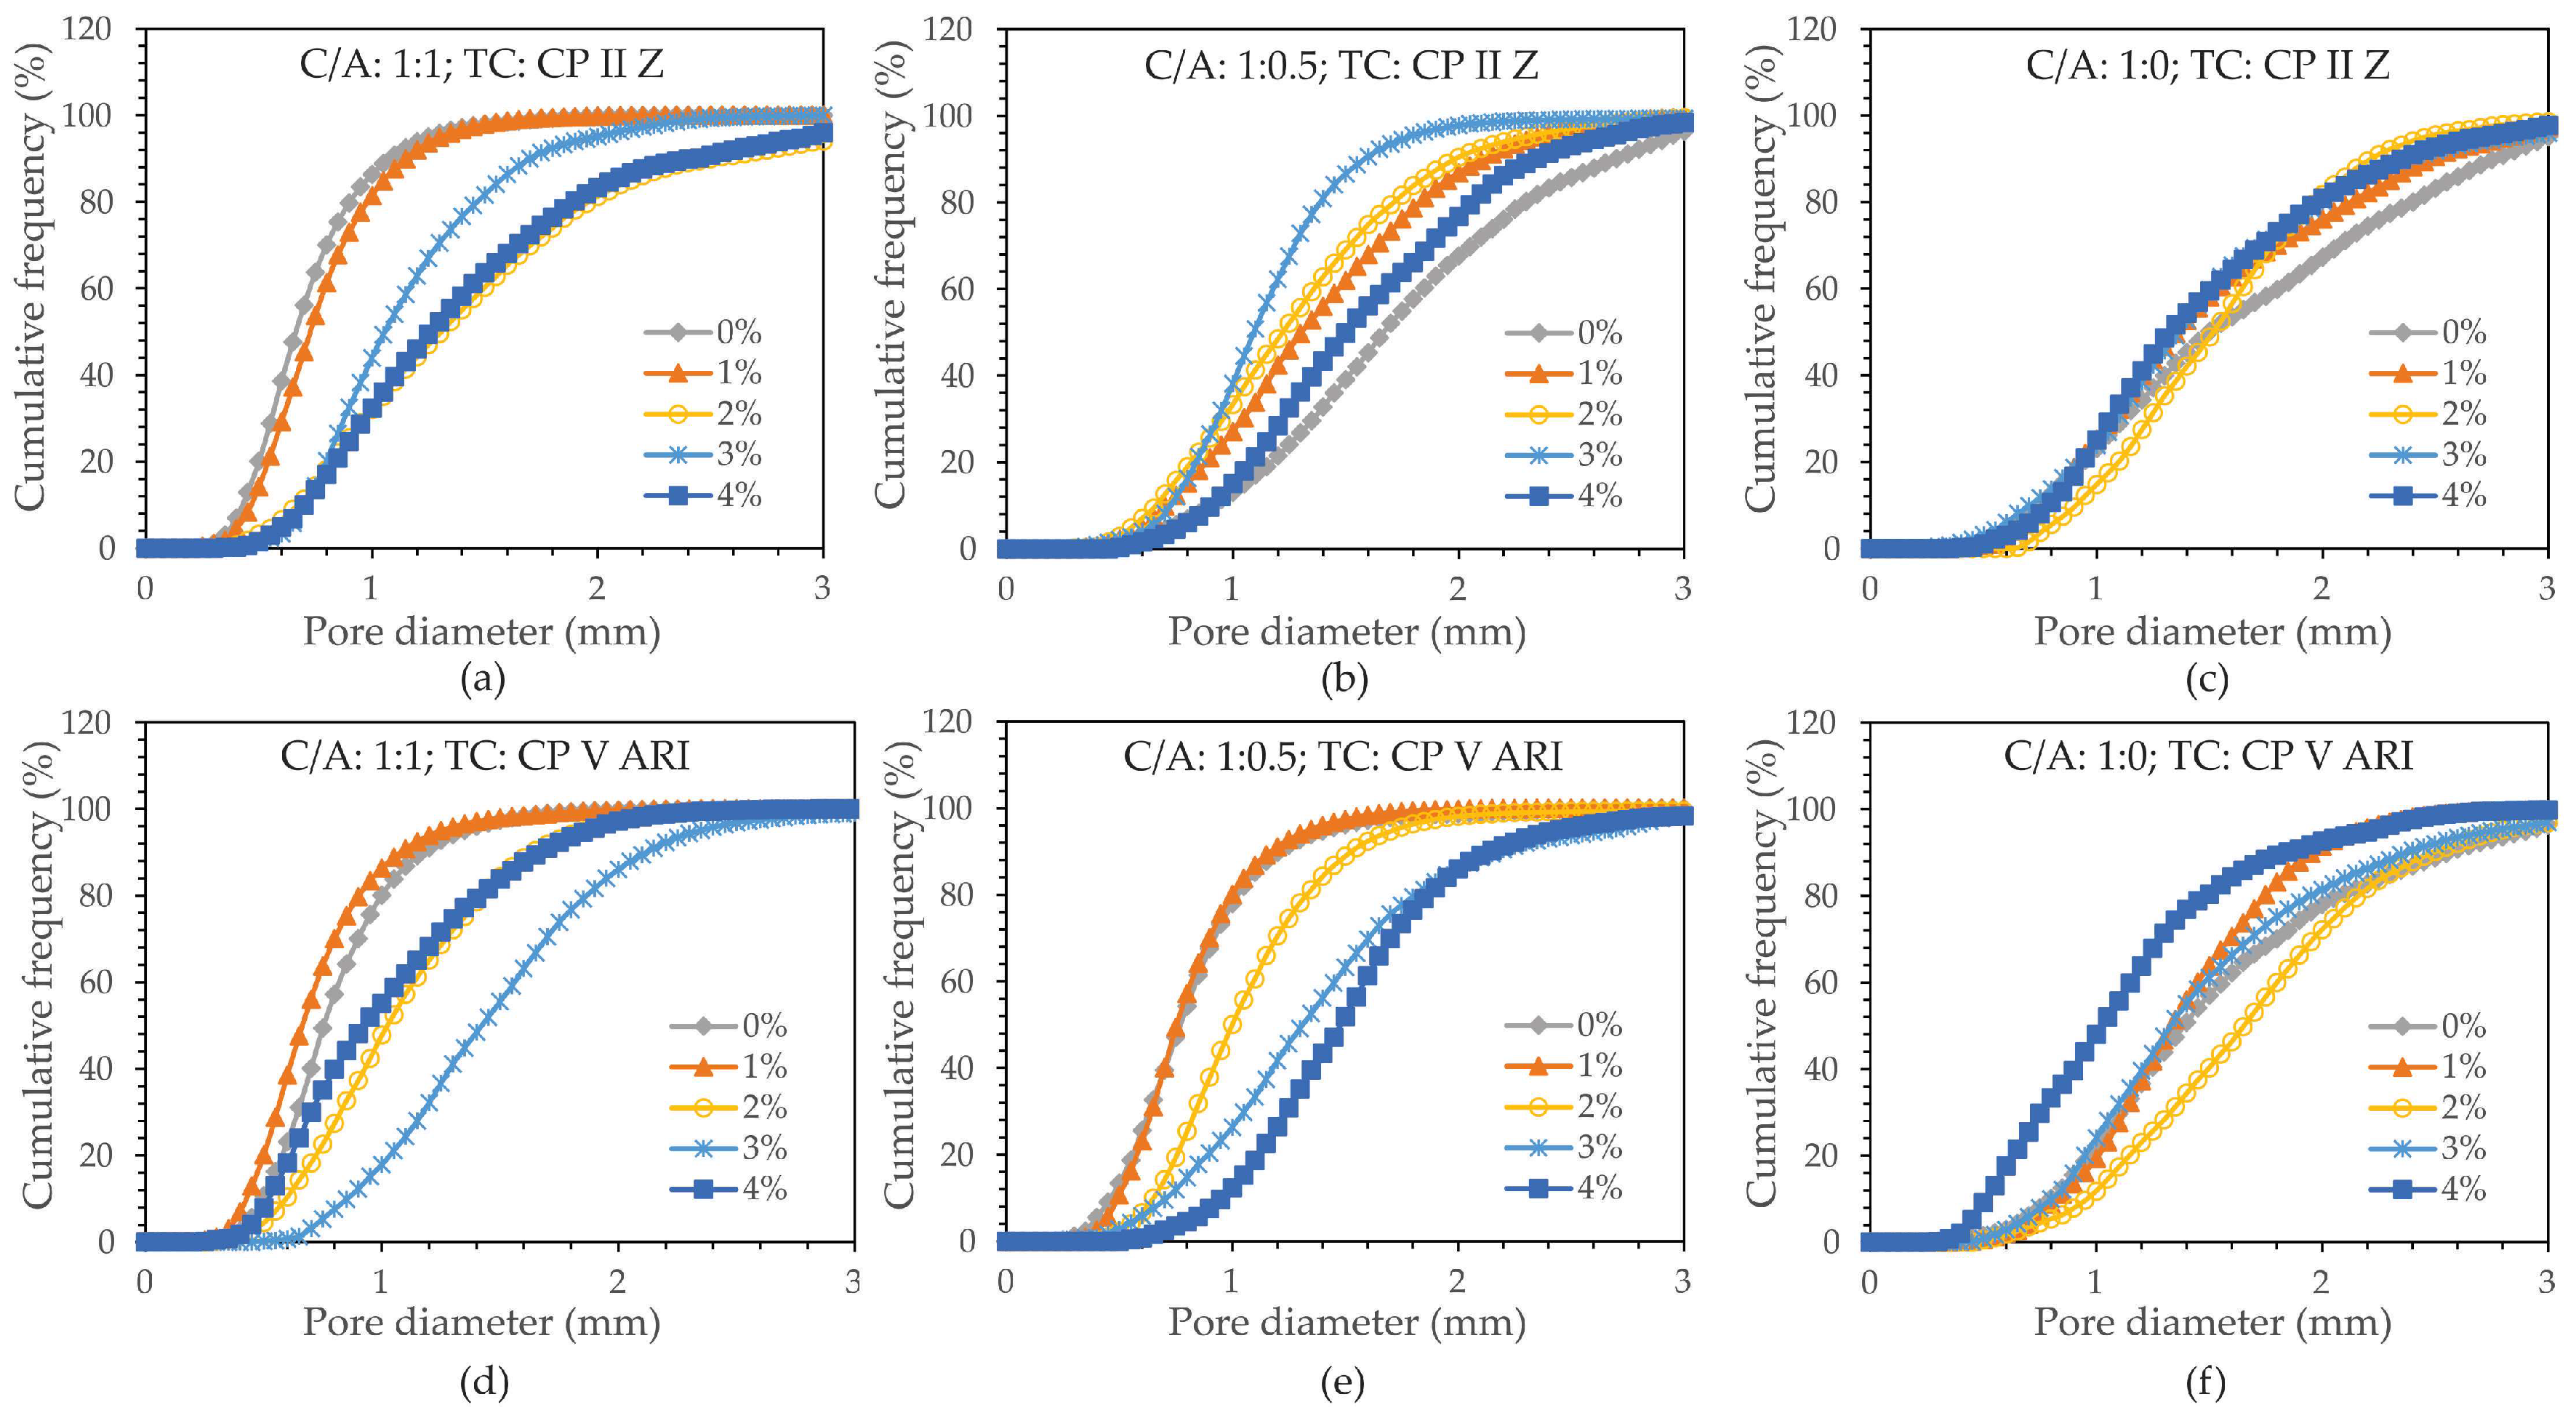
Figure 8.
Average pore diameter (mm).
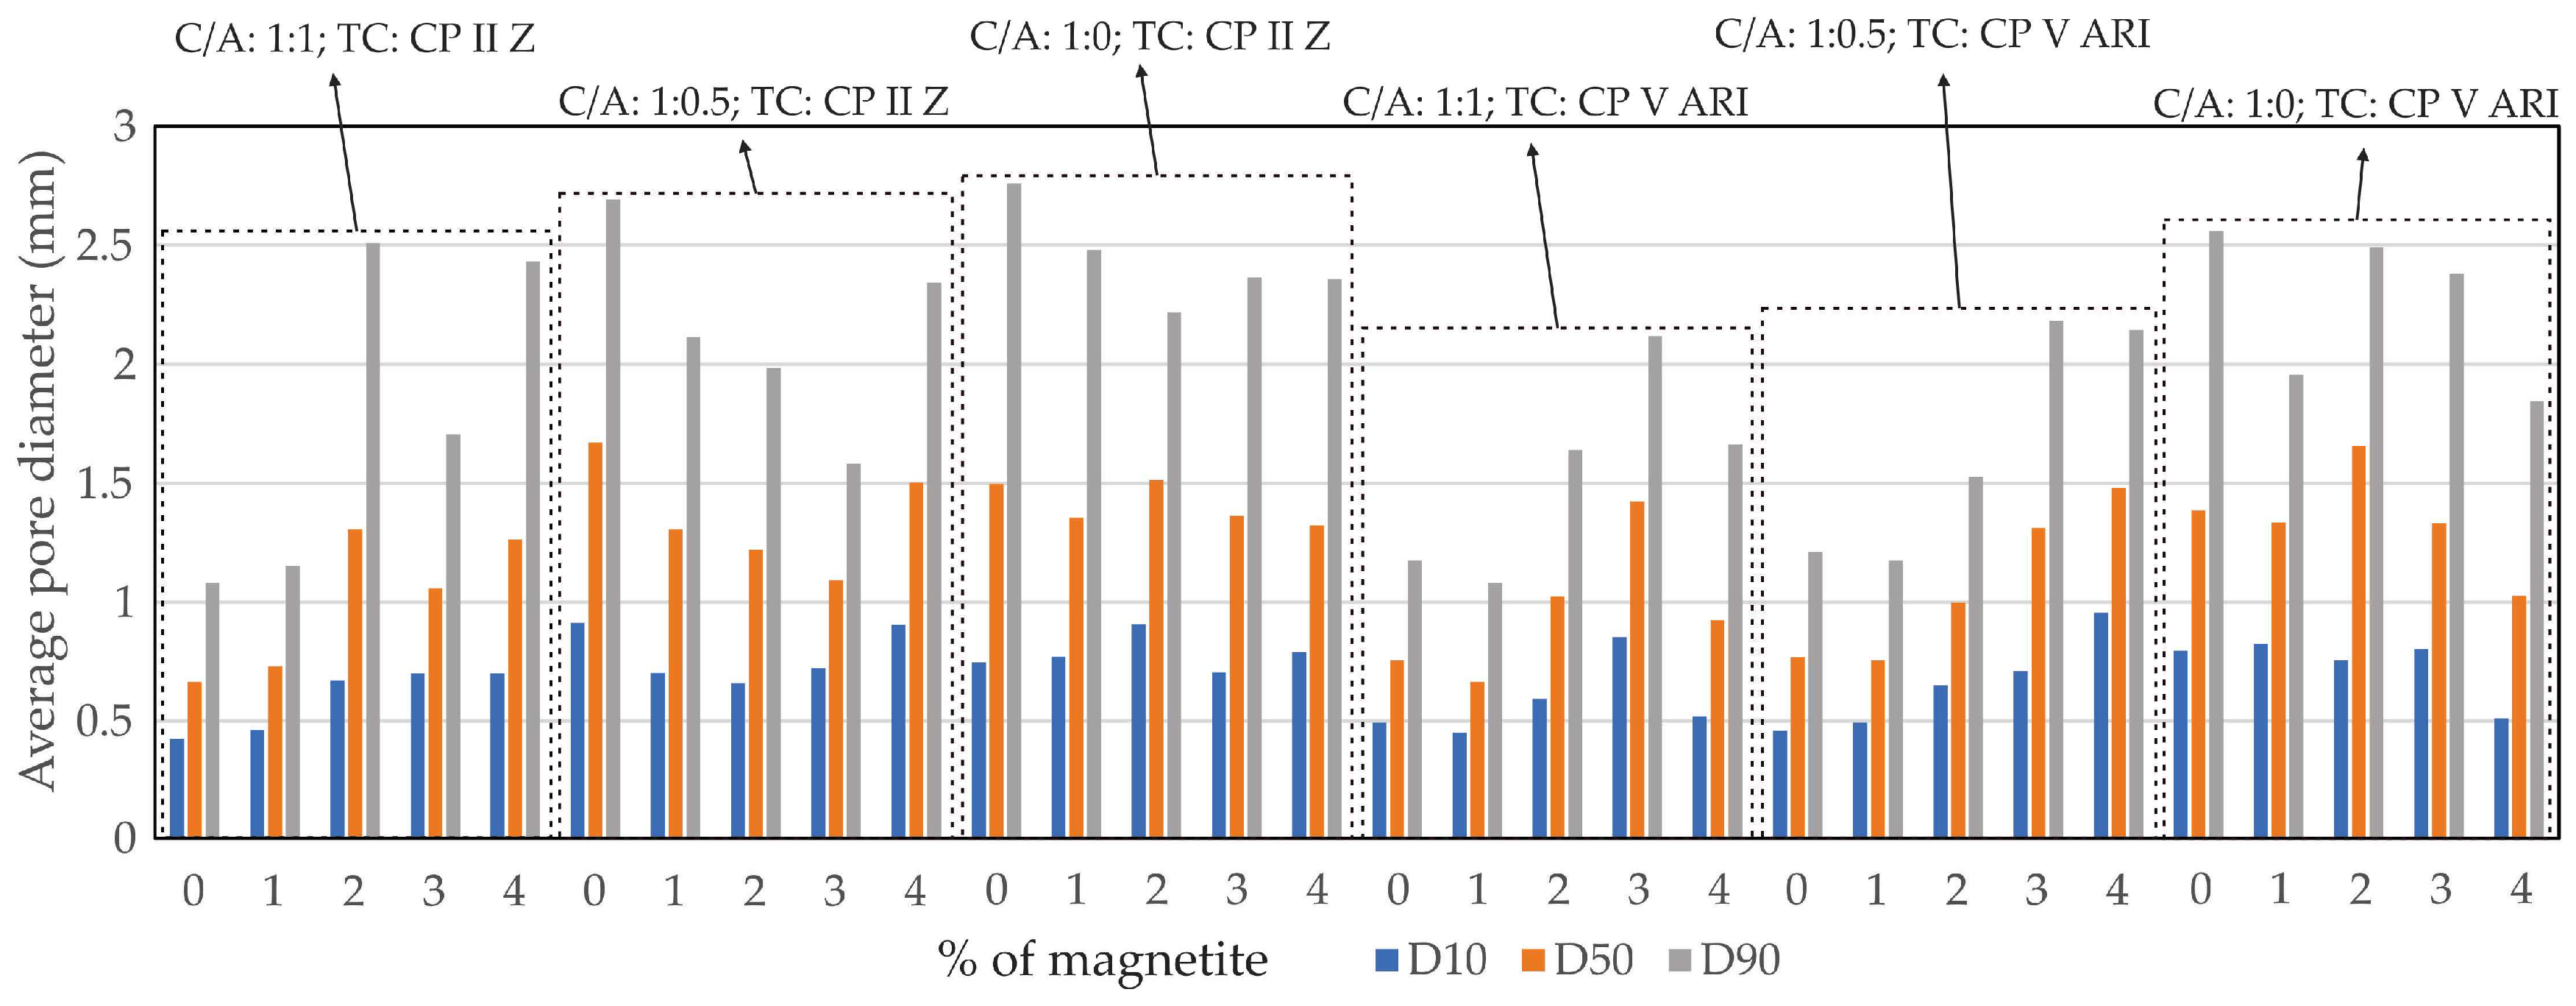
Figure 9.
Graph of compressive strength as a function of the percentage of magnetite for different types of cements and C/A ratio.
Figure 9.
Graph of compressive strength as a function of the percentage of magnetite for different types of cements and C/A ratio.
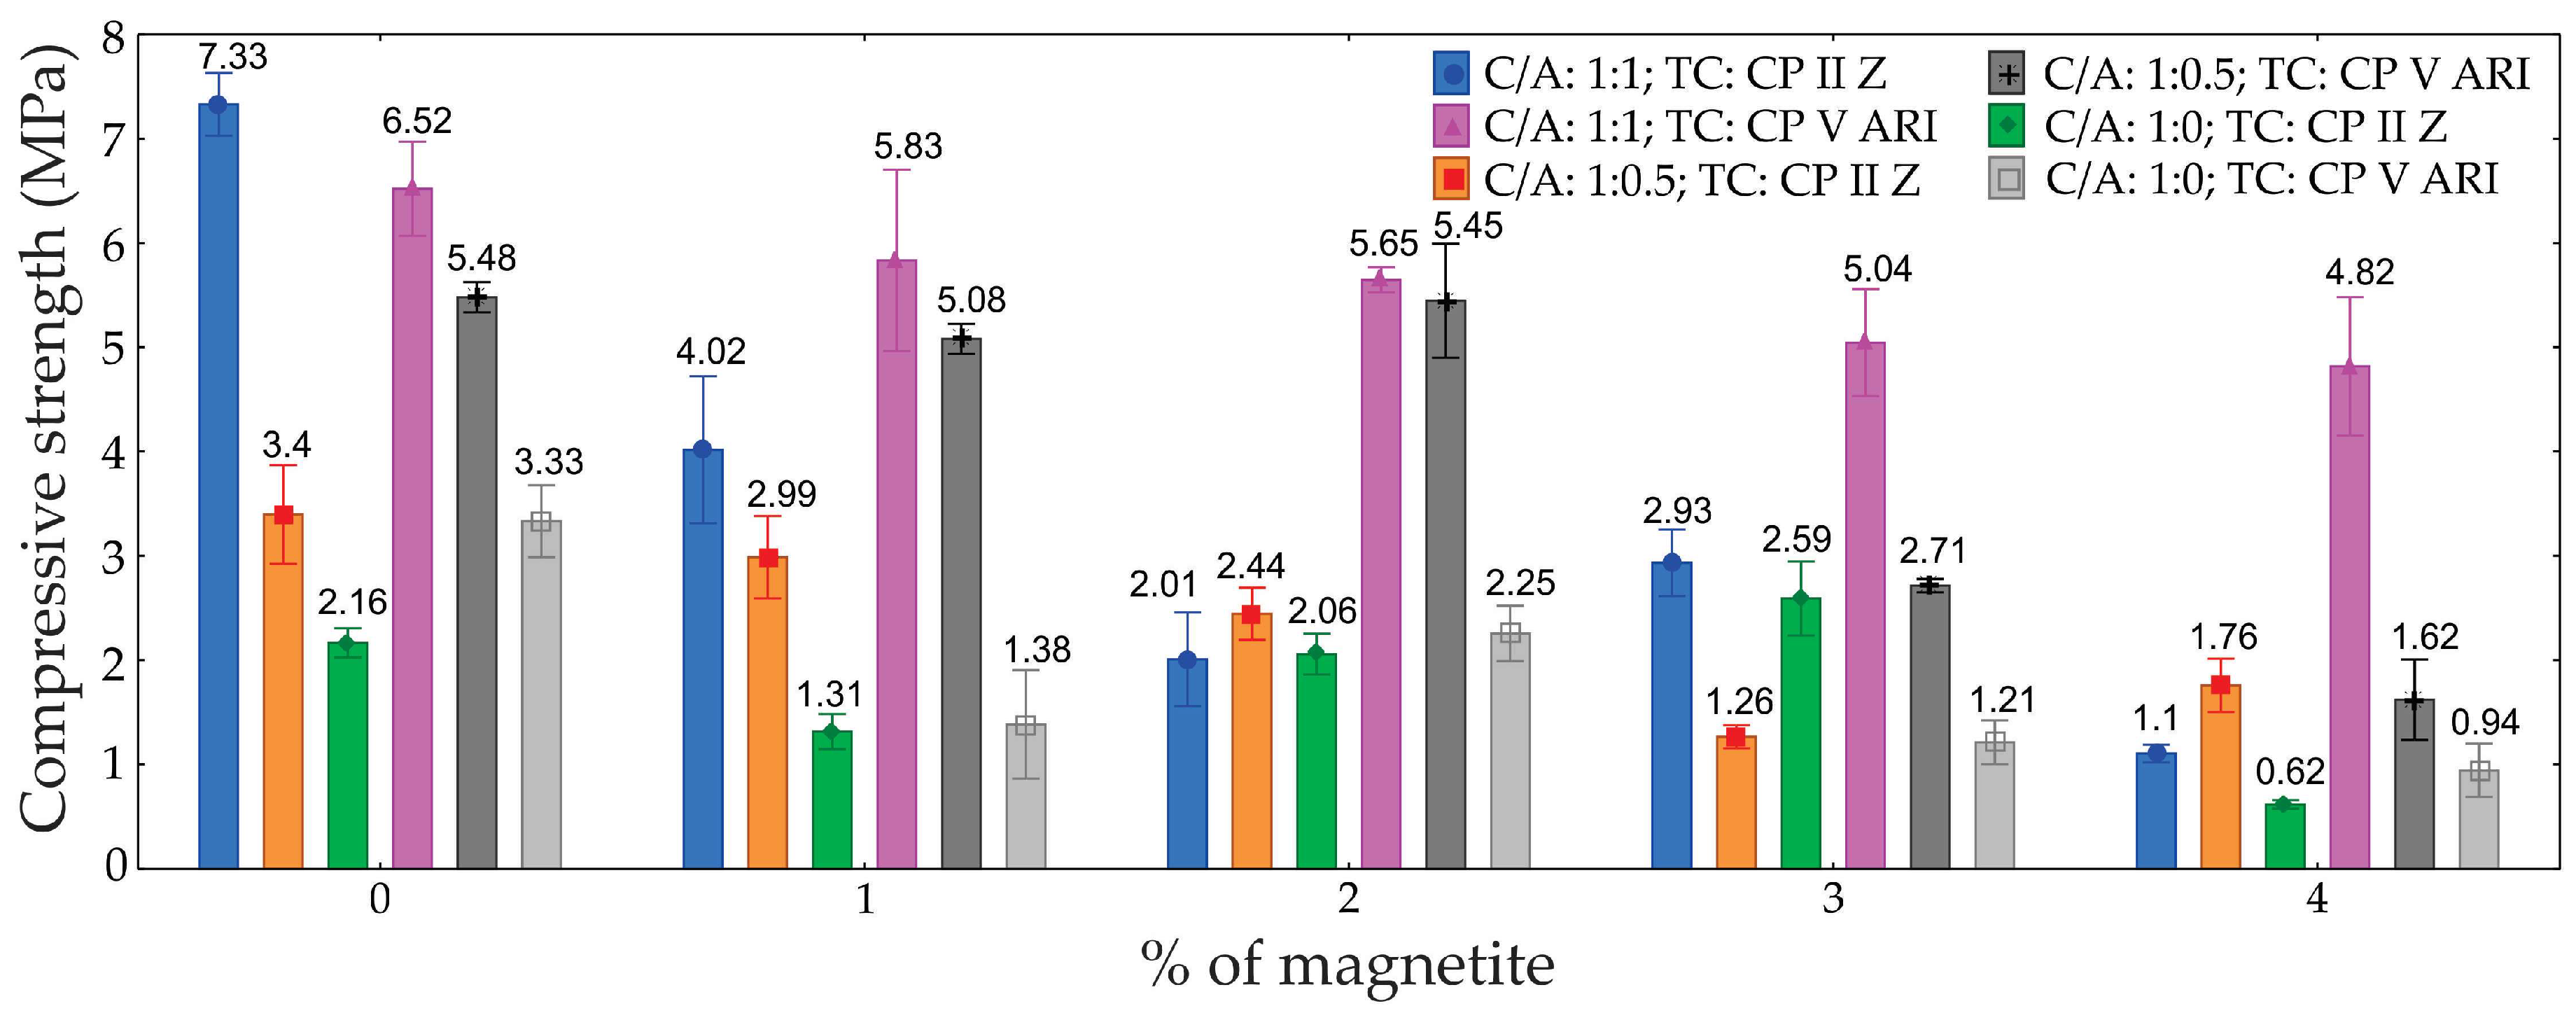
Figure 10.
Graph of tensile flexural strength as a function of the percentage of magnetite for different types of cements and C/A ratio.
Figure 10.
Graph of tensile flexural strength as a function of the percentage of magnetite for different types of cements and C/A ratio.
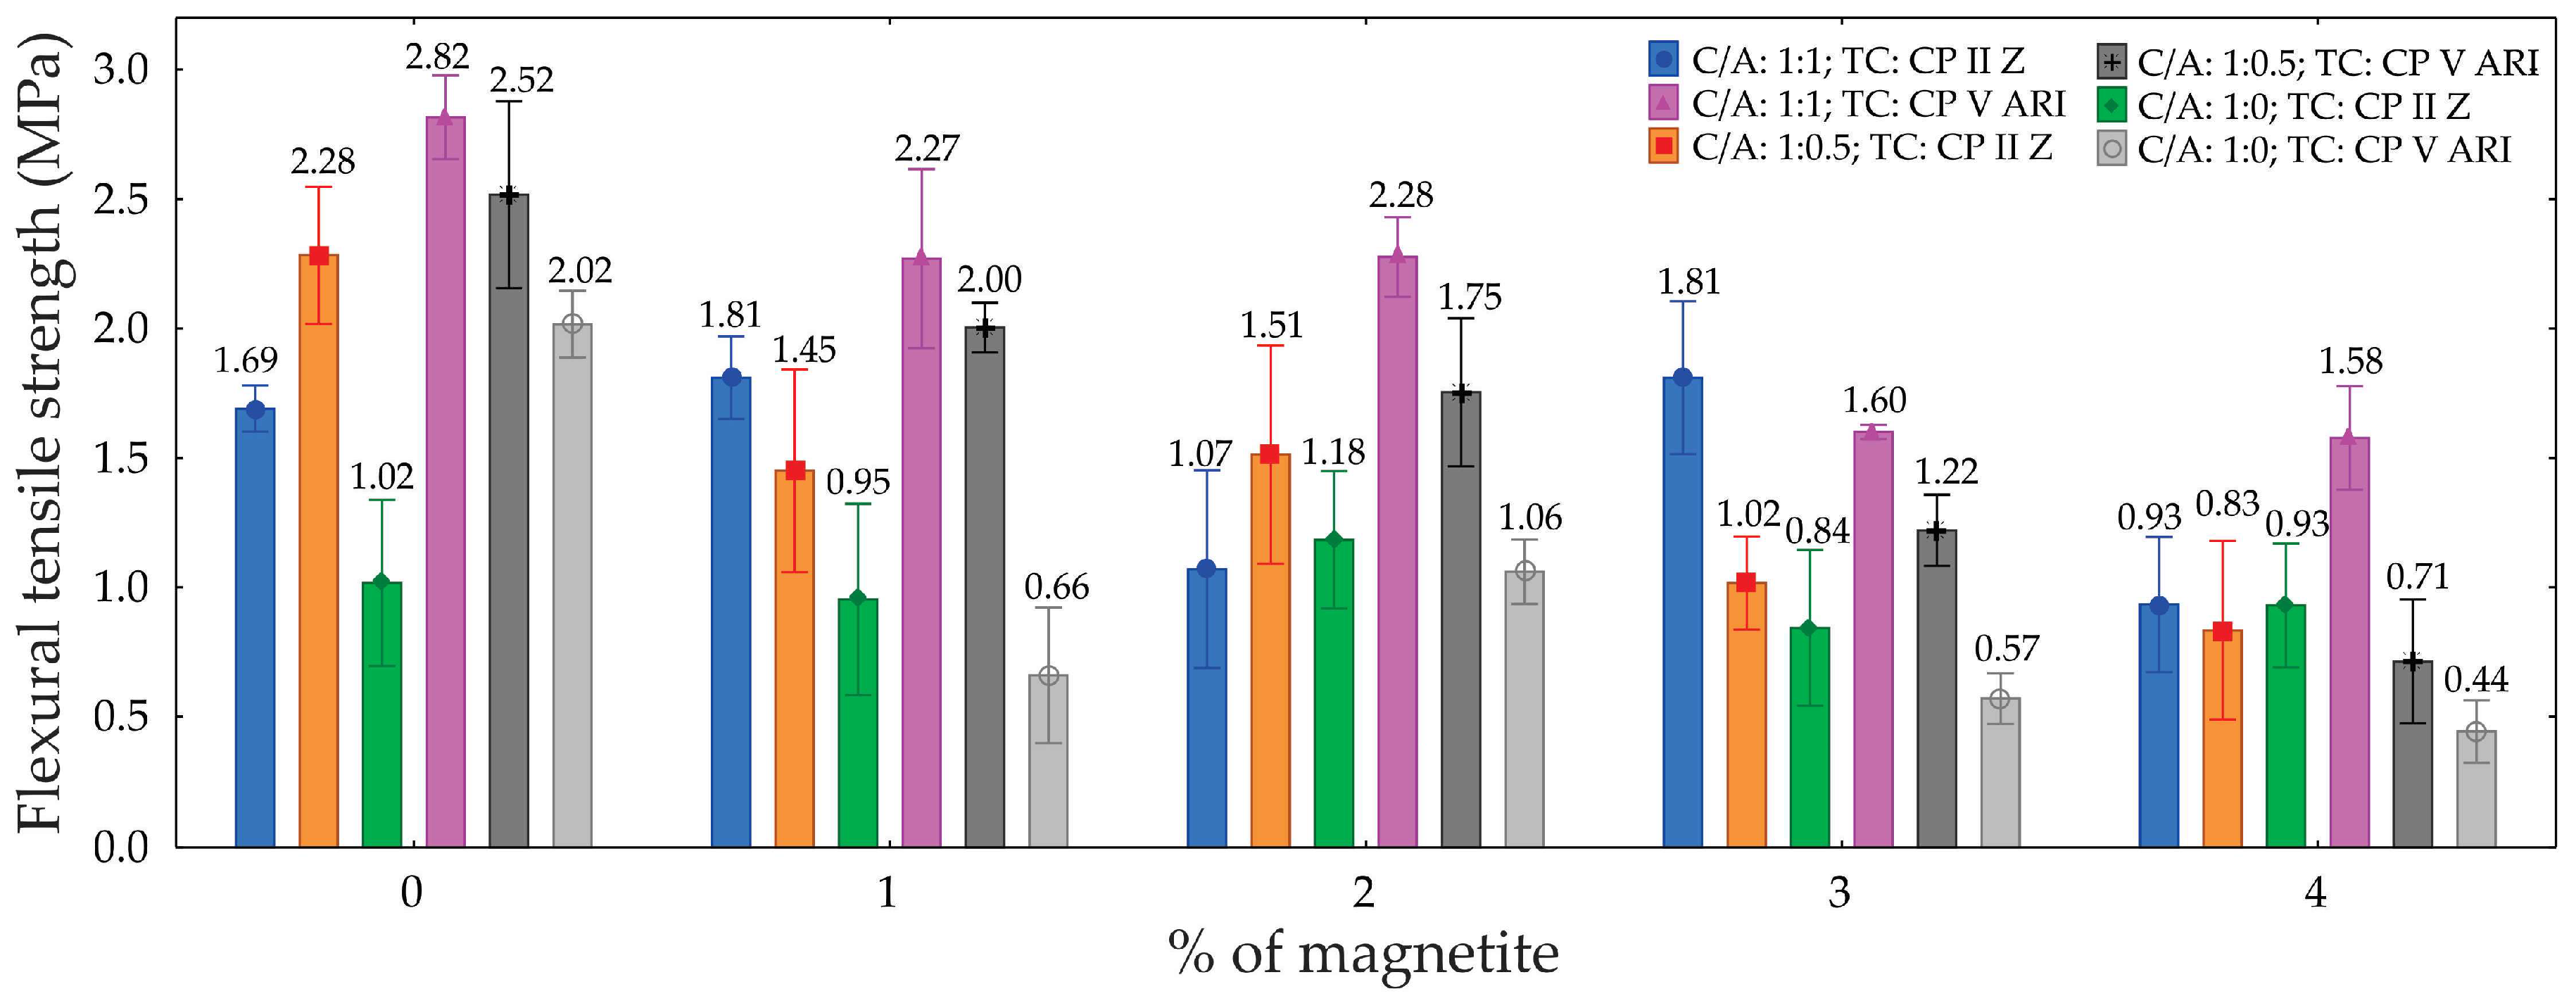
Figure 11.
Dry density graph: (a) CP II Z cement; (b) CP V ARI cement; and saturated density: (c) CP II Z cement; (d) CP V ARI cement.
Figure 11.
Dry density graph: (a) CP II Z cement; (b) CP V ARI cement; and saturated density: (c) CP II Z cement; (d) CP V ARI cement.
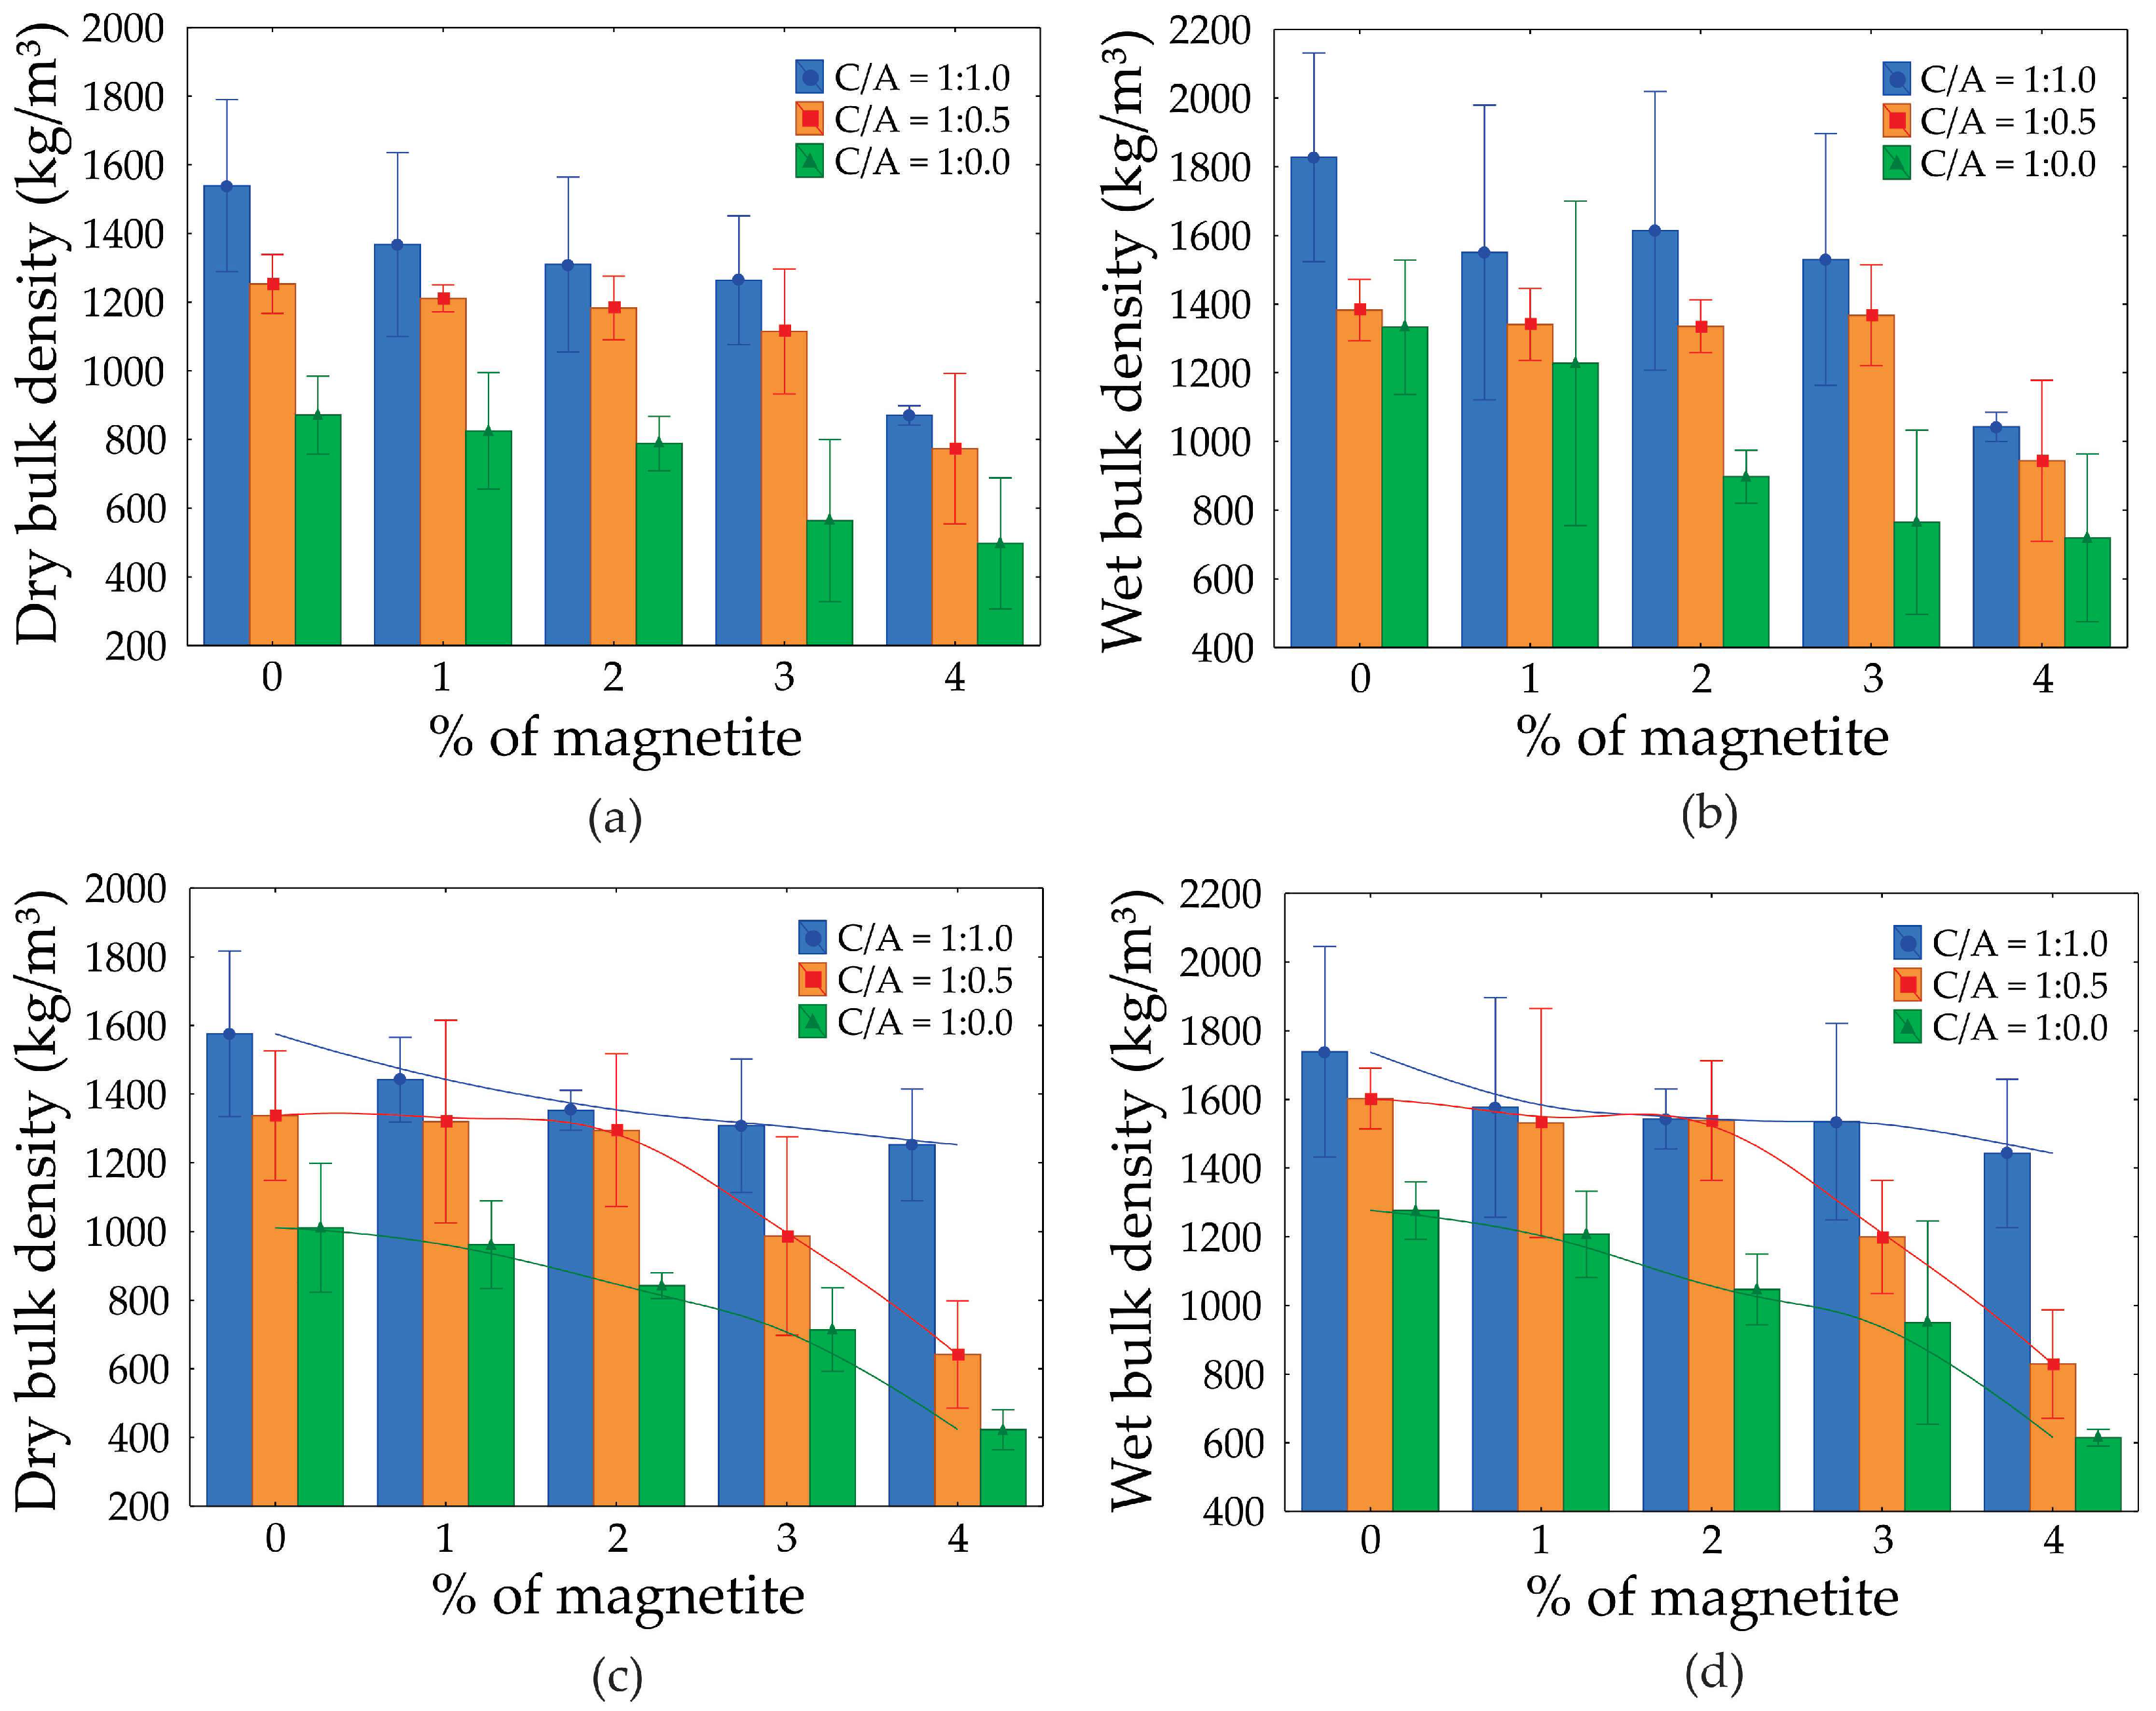
Figure 12.
Graph of water absorption as a function of the percentage of magnetite for different types of cements and C/A ratio.
Figure 12.
Graph of water absorption as a function of the percentage of magnetite for different types of cements and C/A ratio.
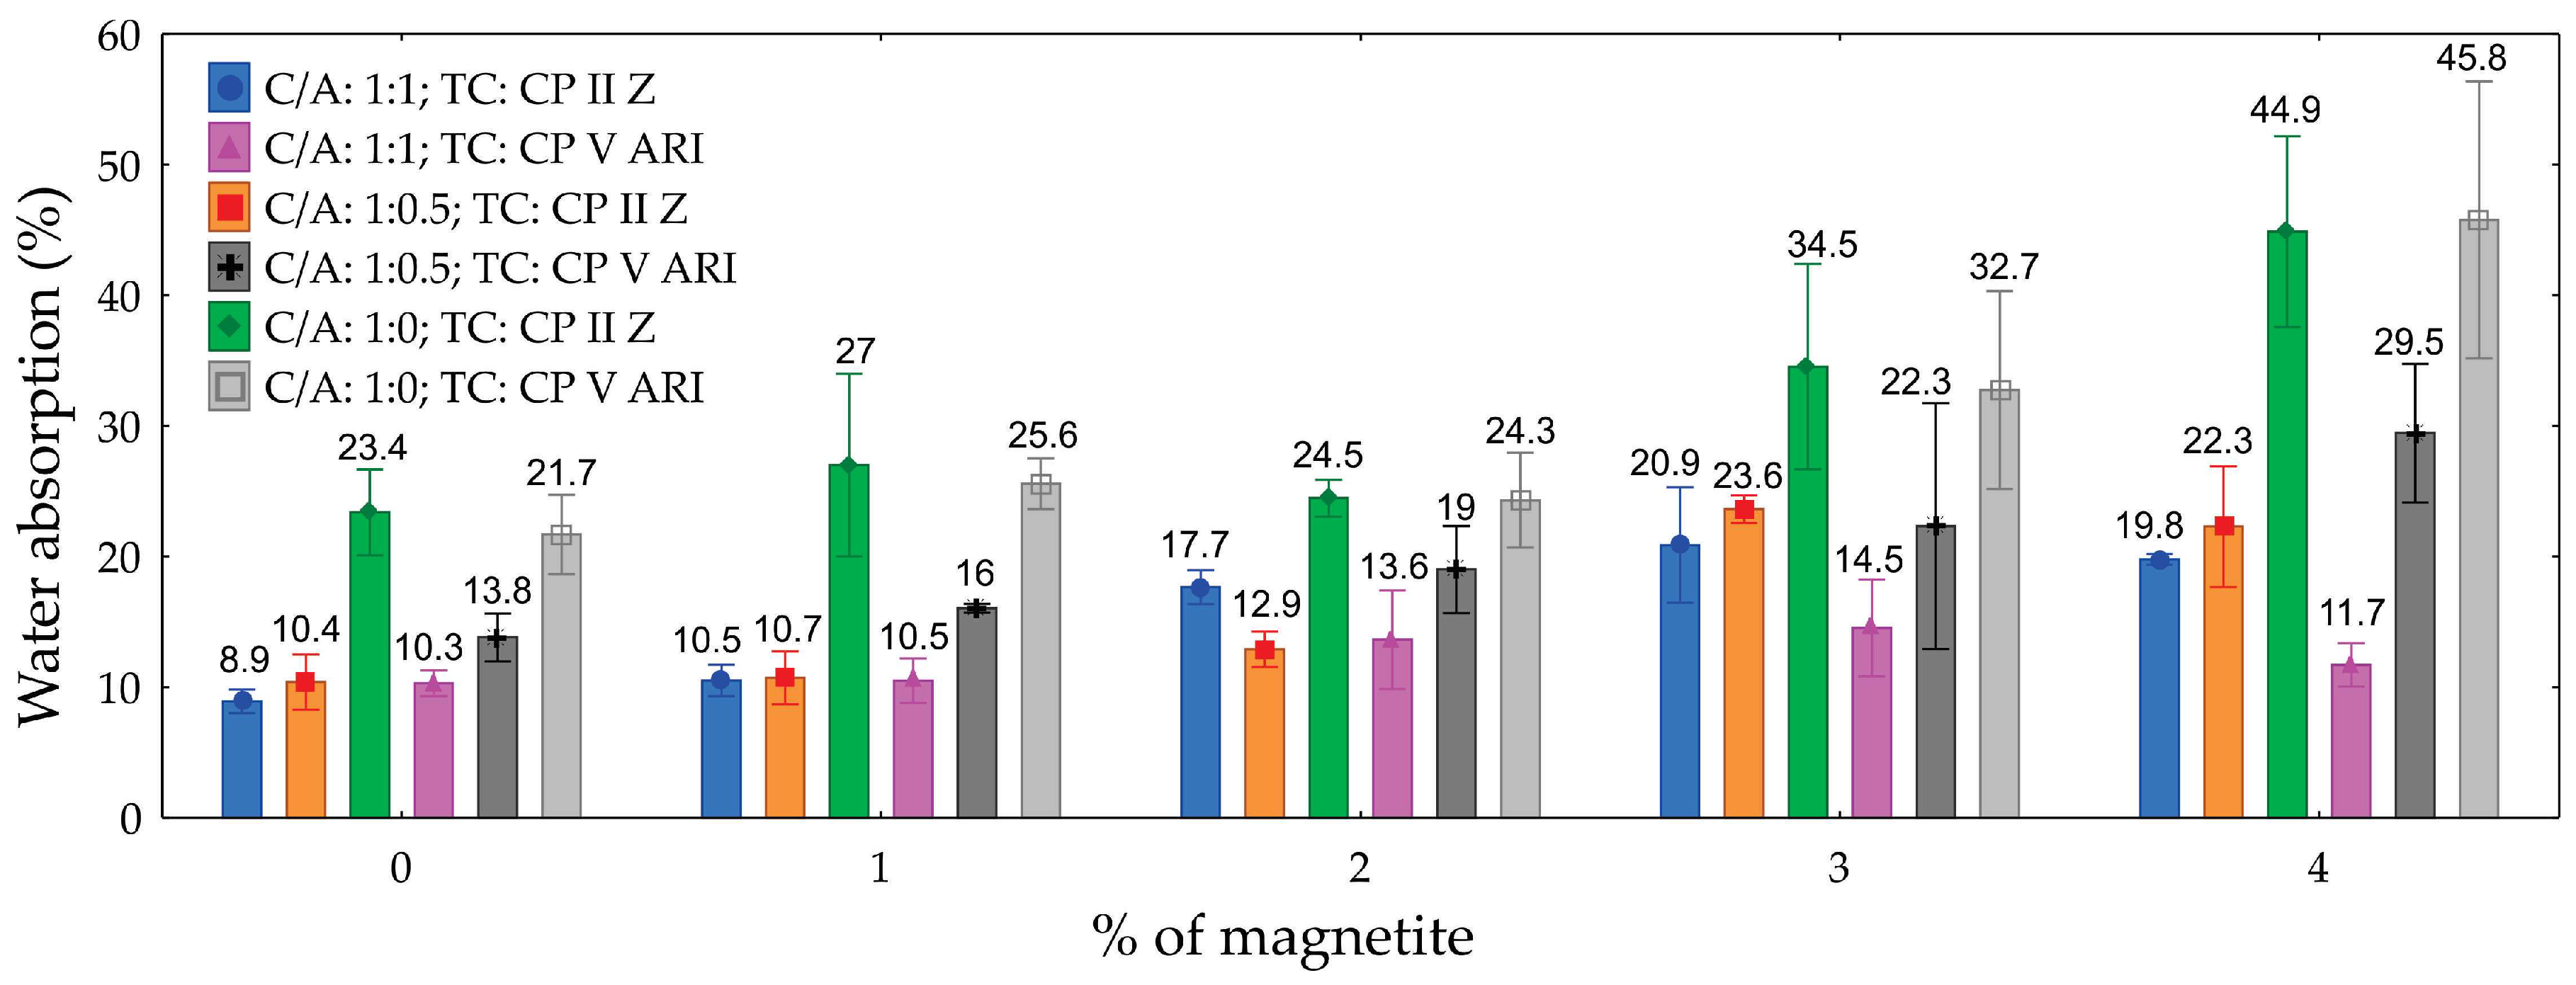
Figure 13.
Thermal conductivity graph.
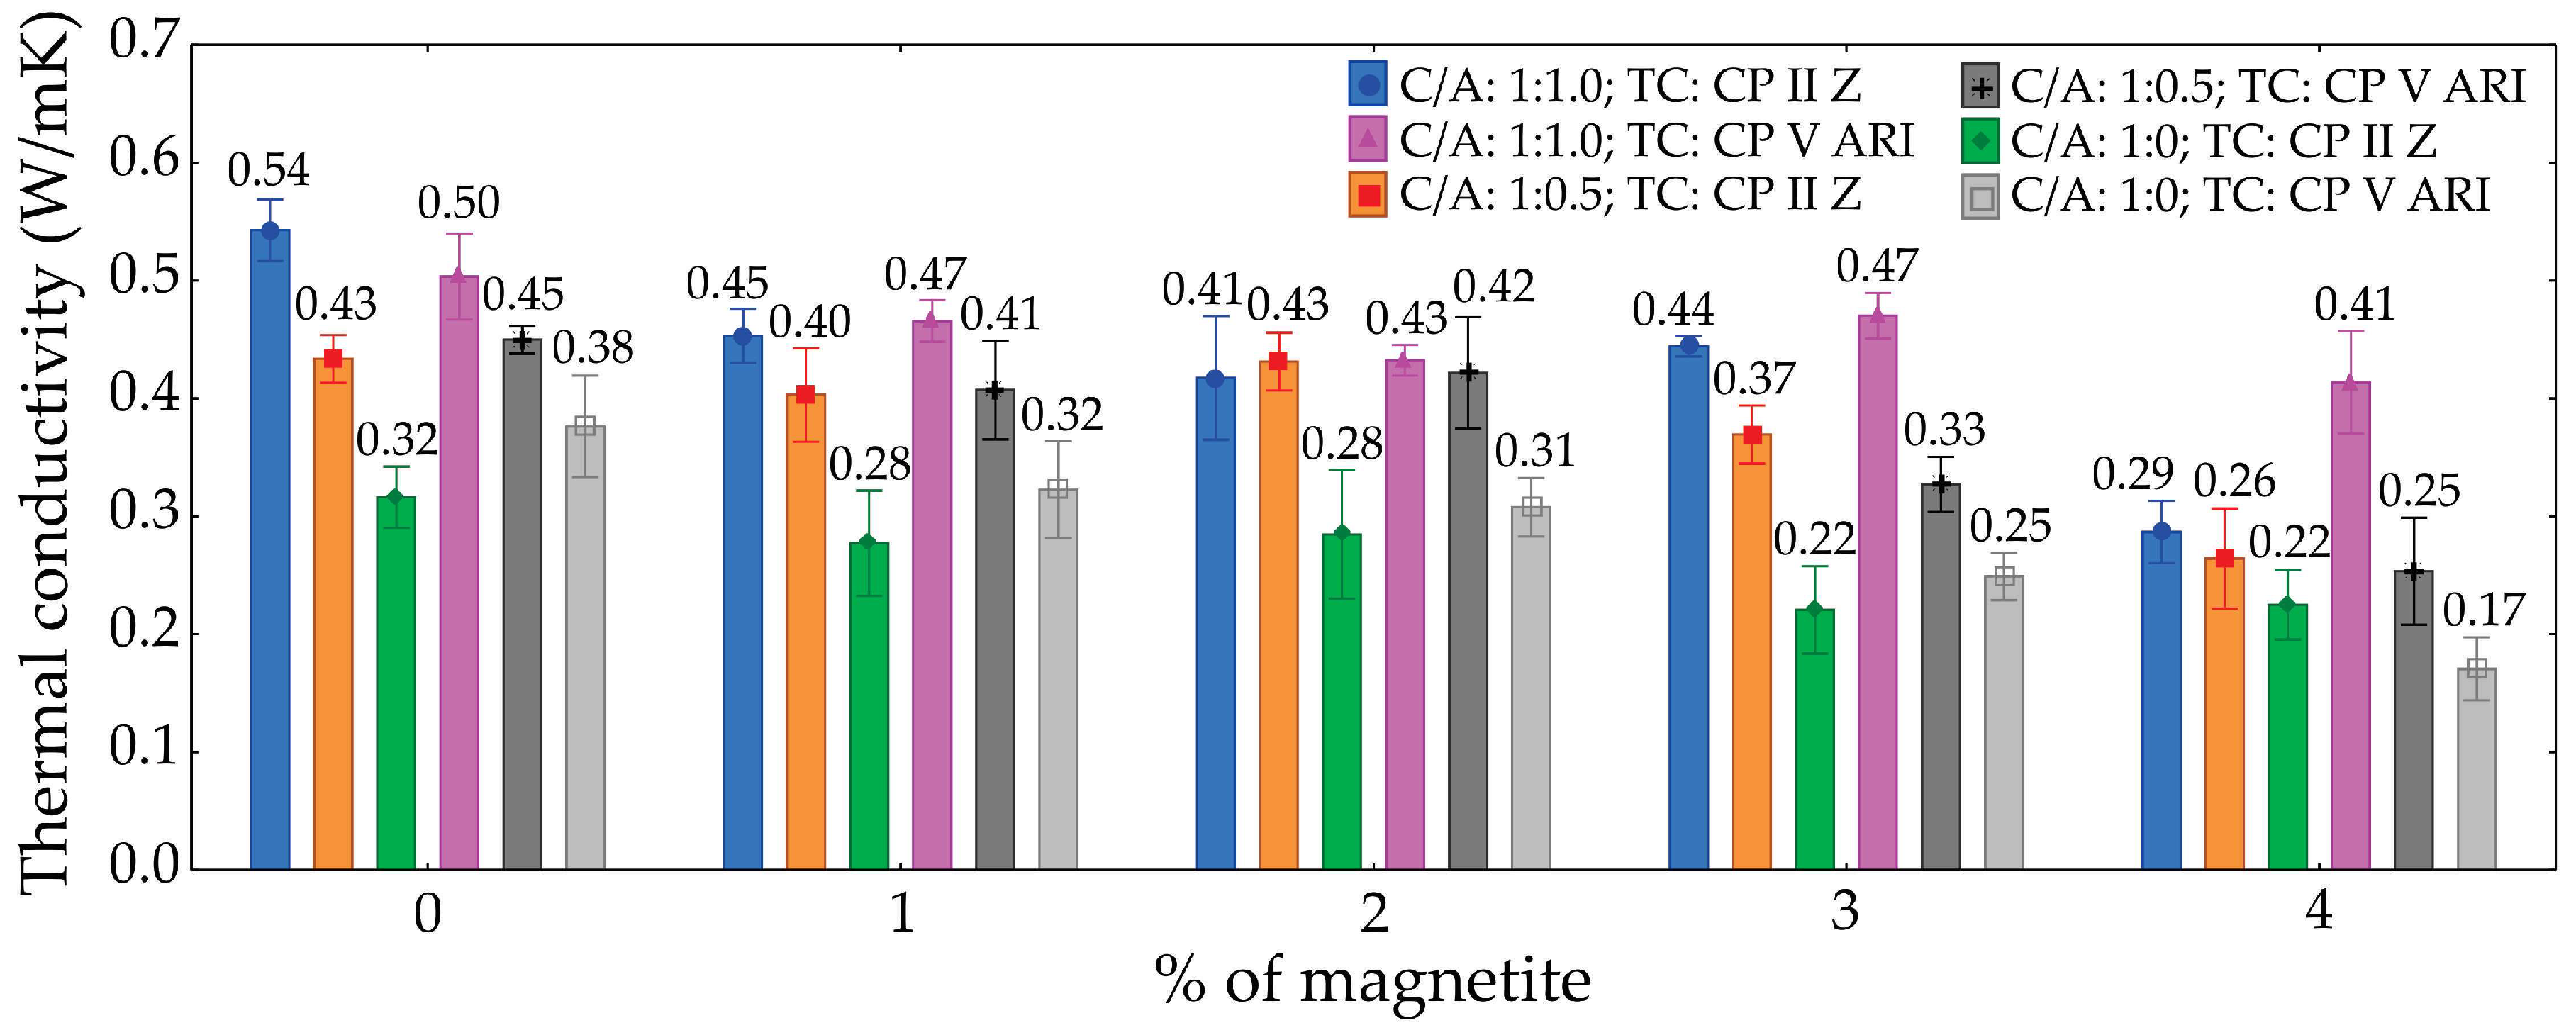

Table 1.
Physical and chemical properties of the cements.
|
Type of cement |
Physical Properties | |||||||||
| Setting time | Blaine cm2 /g |
#200 % |
#325 % |
HE1 % |
D2 g/cm3 |
Compressive strength | ||||
| Initial h:min |
Last h:min |
3 days MPa |
7 days MPa |
28 days MPa |
||||||
| CP II Z | 03:21 | 04:00 | 3.6221 | 2.73 | 12.29 | 27.5 | 3.96 | 26.5± 1.2 | 32.7 ± 1.2 | 41.6 ± 1.0 |
| CP V ARI | 03:29 | 04:16 | 4.411 | 0.07 | 0.33 | 29.9 | 3.09 | 39.5± 1.2 | 45.3 ± 1.2 | 53.8 ± 1.0 |
|
Type of cement |
Chemical properties | |||||||||
| Al2 O %3 | SiO2 % | Fe O23 % | CaO% | MgO % | SO3 % | LOI3 % | CaO % | I.R. %4 | A.E %5 | |
| CP II Z | 6.87 | 22.59 | 3.10 | 53.20 | 3.94 | 2.77 | 5.01 | 0.80 | 12.31 | 0.8 |
| CP V ARI | 4.46 | 19.28 | 3.0 | 61.86 | 2.59 | 2.95 | 3.62 | 0.97 | 0.81 | 0 |
1 HE—Hot expansion;2 D—Density;3 LOI—Loss on ignition;4 I.R. -Insoluble Residue;5 A.E.—Alkaline Equivalent.
Table 2.
Experimental matrix.
| TC | C/A | Cement (g) |
Sand (g) |
Water (g) |
Foam (g) |
Magnetite (g—%) |
A/C ratio |
|---|---|---|---|---|---|---|---|
| CP II Z | 1:1 | 1000 | 1000 | 300 | 500 | 0—0% | 0.79 |
| CP II Z | 1:1 | 1000 | 1000 | 300 | 500 | 5—1% | 0.79 |
| CP II Z | 1:1 | 1000 | 1000 | 300 | 500 | 10—2% | 0.79 |
| CP II Z | 1:1 | 1000 | 1000 | 300 | 500 | 15—3% | 0.79 |
| CP II Z | 1:1 | 1000 | 1000 | 300 | 500 | 20—4% | 0.79 |
| CP II Z | 1:0.5 | 1000 | 500 | 300 | 500 | 0—0% | 0.79 |
| CP II Z | 1:0.5 | 1000 | 500 | 300 | 500 | 5—1% | 0.79 |
| CP II Z | 1:0.5 | 1000 | 500 | 300 | 500 | 10—2% | 0.79 |
| CP II Z | 1:0.5 | 1000 | 500 | 300 | 500 | 15—3% | 0.79 |
| CP II Z | 1:0.5 | 1000 | 500 | 300 | 500 | 20—4% | 0.79 |
| CP II Z | 1:0 | 1000 | 0 | 300 | 500 | 0—0% | 0.79 |
| CP II Z | 1:0 | 1000 | 0 | 300 | 500 | 5—1% | 0.79 |
| CP II Z | 1:0 | 1000 | 0 | 300 | 500 | 10—2% | 0.79 |
| CP II Z | 1:0 | 1000 | 0 | 300 | 500 | 15—3% | 0.79 |
| CP II Z | 1:0 | 1000 | 0 | 300 | 500 | 20—4% | 0.79 |
| CP V ARI | 1:1 | 1000 | 1000 | 300 | 500 | 0—0% | 0.79 |
| CP V ARI | 1:1 | 1000 | 1000 | 300 | 500 | 5—1% | 0.79 |
| CP V ARI | 1:1 | 1000 | 1000 | 300 | 500 | 10—2% | 0.79 |
| CP V ARI | 1:1 | 1000 | 1000 | 300 | 500 | 15—3% | 0.79 |
| CP V ARI | 1:1 | 1000 | 1000 | 300 | 500 | 20—4% | 0.79 |
| CP V ARI | 1:0.5 | 1000 | 500 | 300 | 500 | 0—0% | 0.79 |
| CP V ARI | 1:0.5 | 1000 | 500 | 300 | 500 | 5—1% | 0.79 |
| CP V ARI | 1:0.5 | 1000 | 500 | 300 | 500 | 10—2% | 0.79 |
| CP V ARI | 1:0.5 | 1000 | 500 | 300 | 500 | 15—3% | 0.79 |
| CP V ARI | 1:0.5 | 1000 | 500 | 300 | 500 | 20—4% | 0.79 |
| CP V ARI | 1:0 | 1000 | 0 | 300 | 500 | 0—0% | 0.79 |
| CP V ARI | 1:0 | 1000 | 0 | 300 | 500 | 5—1% | 0.79 |
| CP V ARI | 1:0 | 1000 | 0 | 300 | 500 | 10—2% | 0.79 |
| CP V ARI | 1:0 | 1000 | 0 | 300 | 500 | 15—3% | 0.79 |
| CP V ARI | 1:0 | 1000 | 0 | 300 | 500 | 20—4% | 0.79 |
TC—type of cement; C/A—cement/sand ratio; A/C—water/cement ratio.
Table 3.
ANOVA for porosity.
| Factor | Sum of Squares | Degree of freedom |
Mean Squares | F-Value | P-Value | Contribution (%) |
| Type of cement (TC) | 1294.4 | 1 | 1294.4 | 214.83 | 0.0000 | 13.5 |
| Cement/sand ratio (C/A) | 2661.4 | 2 | 1330.7 | 220.86 | 0.0000 | 27.8 |
| % Magnetite (M) | 3985.8 | 4 | 996.4 | 165.38 | 0.0000 | 41.7 |
| TC x C/A | 186.8 | 2 | 93.4 | 15.50 | 0.0000 | 2.0 |
| TC x M | 130.6 | 4 | 32.7 | 5.42 | 0.0008 | 1.4 |
| C/A x M | 544.9 | 8 | 68.1 | 11.30 | 0.0000 | 5.7 |
| TC x C/A x M | 402.3 | 8 | 50.3 | 8.35 | 0.0000 | 4.2 |
| Error | 361.5 | 60 | 6.0 | 3.8 | ||
| Total | 9567.6 | 100.0 |
Table 4.
ANOVA for compressive strength.
| Factor | Sum of Squares | Degree of freedom |
Mean Squares | F-Value | P-Value | Contribution (%) |
| Type of cement (TC) | 37.4240 | 1 | 37.4240 | 256.440 | 0.0000 | 11.8 |
| Cement/sand ratio (C/A) | 112.5953 | 2 | 56.2976 | 385.767 | 0.0000 | 35.5 |
| % Magnetite (M) | 82.5908 | 4 | 20.6477 | 141.484 | 0.0000 | 26.0 |
| TC x C/A | 17.1470 | 2 | 8.5735 | 58.748 | 0.0000 | 5.4 |
| TC x M | 6.8653 | 4 | 1.7163 | 11.761 | 0.0000 | 2.2 |
| C/A x M | 25.1517 | 8 | 3.1440 | 21.543 | 0.0000 | 7.9 |
| TC x C/A x M | 26.6461 | 8 | 3.3308 | 22.823 | 0.0000 | 8.4 |
| Error | 8.7562 | 60 | 0.1459 | 2.8 | ||
| Total | 317.1765 | 100.0 |
Table 5.
ANOVA for tensile flexural strength.
| Factor | Sum of Squares | Degree of freedom |
Mean Squares | F-Value | P-Value | Contribution (%) |
| Type of cement (TC) | 1.7306 | 1 | 1.7306 | 26.240 | 0.000003 | 4.5 |
| Cement/sand ratio (C/A) | 10.5020 | 2 | 5.2510 | 79.621 | 0.000000 | 27.5 |
| % Magnetite (M) | 13.3836 | 4 | 3.3459 | 50.734 | 0.000000 | 35.1 |
| TC x C/A | 1.7718 | 2 | 0.8859 | 13.433 | 0.000015 | 4.6 |
| TC x M | 2.2289 | 4 | 0.5572 | 8.449 | 0.000018 | 5.8 |
| C/A x M | 2.3995 | 8 | 0.2999 | 4.548 | 0.000231 | 6.3 |
| TC x C/A x M | 2.1913 | 8 | 0.2739 | 4.153 | 0.000535 | 5.7 |
| Error | 3.9570 | 60 | 0.0659 | 10.4 | ||
| Total | 38.1648 | 100.0 |
Table 6.
ANOVA for dry density.
| Factor | Sum of Squares | Degree of freedom |
Mean Squares | F-Value | P-Value | Contribution (%) |
| Type of cement (TC) | 106554 | 1 | 106554 | 20,41 | 0,000030 | 1,2 |
| Cement/sand ratio (C/A) | 5126234 | 2 | 2563117 | 490,90 | 0,000000 | 56,6 |
| % Magnetite (M) | 3024534 | 4 | 756134 | 144,82 | 0,000000 | 33,4 |
| TC x C/A | 44598 | 2 | 22299 | 4,27 | 0,018446 | 0,5 |
| TC x M | 18289 | 4 | 4572 | 0,88 | 0,483935 | 0.2 * |
| C/A x M | 154484 | 8 | 19311 | 3,70 | 0,001438 | 1,7 |
| TC x C/A x M | 267849 | 8 | 33481 | 6,41 | 0,000005 | 3,0 |
| Error | 313274 | 60 | 5221 | 3,5 | ||
| Total | 9055817 | 100,0 |
* Not significant.
Table 7.
ANOVA for saturated density.
| Factor | Sum of Squares | Degree of freedom |
Mean Squares | F-Value | P-Value | Contribution (%) |
| Type of cement (TC) | 57379 | 1 | 57379 | 6,12 | 0,016178 | 0,6 |
| Cement/sand ratio (C/A) | 4340316 | 2 | 2170158 | 231,63 | 0,000000 | 45,6 |
| % Magnetite (M) | 3657906 | 4 | 914476 | 97,61 | 0,000000 | 38,4 |
| TC x C/A | 4879 | 2 | 2440 | 0,26 | 0,771613 | 0.1 * |
| TC x M | 21153 | 4 | 5288 | 0,56 | 0,689367 | 0.2 * |
| C/A x M | 344078 | 8 | 43010 | 4,59 | 0,000211 | 3,6 |
| TC x C/A x M | 535050 | 8 | 66881 | 7,14 | 0,000001 | 5,6 |
| Error | 562146 | 60 | 9369 | 5,9 | ||
| Total | 9522907 | 100,0 |
* Not significant.
Table 8.
ANOVA for water absorption.
| Factor | Sum of Squares | Degree of freedom |
Mean Squares | F-Value | P-Value | Contribution (%) |
| Type of cement (TC) | 0,02 | 1 | 0,02 | 0,001 | 0,972493 | 0.0 * |
| Cement/sand ratio (C/A) | 4465,26 | 2 | 2232,63 | 112,561 | 0,000000 | 47,9 |
| % Magnetite (M) | 2530,48 | 4 | 632,62 | 31,894 | 0,000000 | 27,1 |
| TC x C/A | 221,58 | 2 | 110,79 | 5,586 | 0,005962 | 2,4 |
| TC x M | 58,72 | 4 | 14,68 | 0,740 | 0,568407 | 0.6 * |
| C/A x M | 746,76 | 8 | 93,35 | 4,706 | 0,000165 | 8,0 |
| TC x C/A x M | 114,40 | 8 | 14,30 | 0,721 | 0,672239 | 1.2 * |
| Error | 1190,09 | 60 | 19,83 | 12,8 | ||
| Total | 9327,30 | 100,0 |
* Not significant.
Table 9.
ANOVA for thermal conductivity.
| Factor | Sum of Squares | Degree of freedom |
Mean Squares | F-Value | P-Value | Contribution (%) |
| Type of cement (TC) | 0,02 | 1 | 0,02 | 0,001 | 0,972493 | 0.0 * |
| Cement/sand ratio (C/A) | 4465,26 | 2 | 2232,63 | 112,561 | 0,000000 | 47,9 |
| % Magnetite (M) | 2530,48 | 4 | 632,62 | 31,894 | 0,000000 | 27,1 |
| TC x C/A | 221,58 | 2 | 110,79 | 5,586 | 0,005962 | 2,4 |
| TC x M | 58,72 | 4 | 14,68 | 0,740 | 0,568407 | 0.6 * |
| C/A x M | 746,76 | 8 | 93,35 | 4,706 | 0,000165 | 8,0 |
| TC x C/A x M | 114,40 | 8 | 14,30 | 0,721 | 0,672239 | 1.2 * |
| Error | 1190,09 | 60 | 19,83 | 12,8 | ||
| Total | 9327,30 | 100,0 |
* Not significant.
Disclaimer/Publisher’s Note: The statements, opinions and data contained in all publications are solely those of the individual author(s) and contributor(s) and not of MDPI and/or the editor(s). MDPI and/or the editor(s) disclaim responsibility for any injury to people or property resulting from any ideas, methods, instructions or products referred to in the content. |
© 2024 by the authors. Licensee MDPI, Basel, Switzerland. This article is an open access article distributed under the terms and conditions of the Creative Commons Attribution (CC BY) license (https://creativecommons.org/licenses/by/4.0/).
Copyright: This open access article is published under a Creative Commons CC BY 4.0 license, which permit the free download, distribution, and reuse, provided that the author and preprint are cited in any reuse.


