Submitted:
29 November 2024
Posted:
02 December 2024
You are already at the latest version
Abstract
Climate and geological diversity have been proved to make an important contribution to biodiversity. Volcanic ecosystems often have a long geological history and diverse bedrock, thus shaping a variety of habitats. Understanding the relative importance and role of contemporary climate and geological bedrock environment in volcanic biodiversity still needs further exploration. To address this knowledge gap, we investigated the patterns of plant diversity and phylogenetic structure at the community level in Qiniangshan Mountain, while also explored the relationship between biodiversity and regional environmental factors (e.g., climate and bedrock types). In the Qiniangshan Mountain plant communities, species richness is higher at mid to high elevations. Montane communities exhibit higher species richness compared to coastal communities. There are significant differences in species richness among plant communities on different bedrock, with the highest species richness found on pyroclastic lava. Bedrock, along with climate factors related to energy and precipitation, collectively influence the patterns of species richness in plant communities. The Net Relatedness Index (NRI) of plant communities is influenced by climate factors and aspect, while the Nearest Taxon Index (NTI) is affected by both bedrock and climate factors. The Phylogenetic Diversity Index (PDI) is primarily related to climate factors. Climate and bedrock collectively influence the patterns of species richness and phylogenetic structure within Qiniangshan Mountain’s plant communities. These findings highlight the profound impact of both climate and bedrock on montane vegetation and community biodiversity.
Keywords:
Climatic
; Bedrock
; Plant community
; Species Richness
; Phylogenetic structure
* lsslwb@mail.sysu.edu.cn; fanqiang@mail.sysu.edu.cn
1. Introduction
The biogeographic patterns of mountain biodiversity are influenced by climatic and geological factors across a range of temporal and spatial scales (Maestre et al., 2012; Rahbek et al., 2019a; Hu et al., 2020). Climate is acknowledged as a critical environmental factor affecting biodiversity along latitudinal and elevational gradients (Beggs, 2013; Harrison et al., 2020). Geological diversity contributes to habitat heterogeneity and influences local biodiversity by generating ecological niches (Tukiainen et al., 2017; Ren et al., 2021; Yu and Yang, 2022).
Climate is one of the most significant environmental factors affecting biodiversity pattern. In the study of plant diversity pattern at regional and larger spatial scales, plant diversity is more affected by climate in space and time than by other factors (Harrison et al., 2020). However, on the local spatial scale, the impact of rapid climate change on the diversity of local plant communities is not unique. For example, the study of mountain plant communities in temperate regions of northern Europe shows that climate warming will lead to a longer growing season and higher productivity of species in mountain plant communities, and the species richness of the communities will also increase (Pauli et al., 1994), which may be related to the diffusion of low-altitude species to high altitudes (Engler et al., 2009). However, for the mountainous areas in the Mediterranean region of Europe, climate warming will lead to water shortage, which will significantly reduce the species richness of plant communities (Pauli et al., 2012). Therefore, the response of plant community species diversity to climate factors in different regions may be different. There is a close interdependence between climate variables (e.g., temperature and rainfall) and plants (Beggs, 2013), and it has been proved that regions with warm and humid climate have higher species diversity than regions with cold or dry climate (Kreft and Jetz, 2007; Sommer et al., 2010). Climate change can cause changes in plant community structure. For example, climate warming affects the community composition and distribution of the entire Himalayan region, including alpine meadows and grasslands, wetlands, peatlands and forests (Xu et al., 2009). Geological and geomorphic features can also significantly influence the region's biodiversity. The erosion of mountain bedrock has created complex topographies, offering new ecological niches for a variety of life forms and positioning mountains as hotspots of terrestrial biodiversity (Antonelli et al., 2018a; Badgley et al., 2017; Rahbek et al., 2019b). Among geological factors, the type and abundance of bedrock are intimately connected to species richness and composition at the local level. Bedrock influences plant diversity through its effects on soil chemistry and physical properties, promoting the emergence of endemic plant species within the region (Kruckeberg, 2004; Ott, 2020). Soils originating from the weathering of various bedrock types and local hygrothermal conditions, affect plant species distribution and community composition differentiation, limestone and serpentine are prominent examples of such influences (Clements et al., 2006; Anacker et al., 2010; Sianta et al., 2019). Bedrock influences the mineral nutrient content (e.g., P, Fe and Mg) and water-holding capacity of the regolith by regulating the physical and chemical properties of the soil, which in turn influences plant growth and the composition of vegetation communities (Morford et al., 2011; Jiang et al., 2020). Correspondingly, the heavy metals (e.g., Hg, Pb and Cd) provided by bedrock also inhibit plant growth in communities (Zhang et al., 2015). In addition, higher bedrock fracture density can promote vegetation community formation by providing footholds for root systems of plants and reservoirs for water storage (Graham et al., 2010; Hahm et al., 2014).
Investigating community assembly mechanisms is a pivotal direction for understanding plant responses to current climatic and environmental changes (Mouquet et al., 2012; Yamamichi et al., 2023). Traditional biodiversity studies within communities have tended to concentrate on species diversity, often neglecting the evolutionary historical differences and phylogenetic diversity among species. With the advancement of “community phylogenetics” in recent years, the molecular dating of phylogenetic trees and subsequent biogeographic and diversification statistical analyses have become routine in biodiversity and evolutionary history research (Webb et al., 2002; Cavender-Bares et al., 2009; Antonelli et al., 2018b). Phylogenetic diversity connects the evolutionary history of species with the conservation of functional diversity, reflecting the adaptive capacity of species to environmental changes. By integrating species richness with phylogenetic diversity, studies of plant community biodiversity can more effectively elucidate the patterns of plant diversity and formulate appropriate conservation strategies (Qian et al., 2019; Owen et al., 2019).
The niche theory of community assembly posits that species within a community occupy different niches, with the assembly process primarily driven by environmental filtering and competitive exclusion (Hutchinson, 1959; Vandermeer, 1972; Silvertown, 2004). Based on the niche conservatism theory (e.g., rapid in situ speciation, dispersal limitation), species that are phylogenetically closer tend to have higher ecological similarity. When the phylogenetic structure of a community is clustered, it indicates that environmental filtering is selecting for species with similar niches, thus habitat filtering dominates the community assembly process. Conversely, when the phylogenetic structure is overdispersed, it suggests that competitive exclusion prevents ecologically similar species from coexisting, leading to a community where species are more distantly related, and competitive exclusion drives the assembly process (Wiens et al., 2005). Furthermore, when niches converge (e.g., convergent evolution, random immigration), a clustered phylogenetic structure may indicate that dominant species occupy the primary niches, with competitive exclusion driving the assembly process. On the other hand, a divergent phylogenetic structure under environmental pressure suggests that distantly related species are undergoing convergent evolution, with habitat filtering dominating the assembly process (Allen et al., 2006). The neutral theory of community assembly posits that interactions among species at the individual level are equivalent, and community assembly is a stochastic process of ecological drift (Hubbell, 2005). In studies of phylogenetic community structure, the null model assumes species randomization from the community species pool. Similar to the neutral theory, when phylogenetic distances align with null model results, the community's phylogenetic structure tends to be random, indicating that the assembly process follows the neutral theory. Therefore, by examining the phylogenetic structure of a community, one can validate the niche theory and neutral theory of community assembly, revealing the dominant factors in the assembly process and elucidating the mechanisms of species coexistence within the community.
The complex bedrock landform in Qiniangshan Mountain is derived from the violent volcanic eruption during the Yanshan movement in the past. In order to explore the influence of environmental factors on the species diversity of local volcanic ecosystem, we examined the community species richness and phylogenetic diversity patterns of 75 plant communities in Qiniangshan Mountain. Our goals were to: (i) reveal the diversity pattern of plant communities; (ii) estimate the effect of environmental factors on species richness and phylogenetic structure of plant communities.
2. Materials and Methods
2.1. Study Area
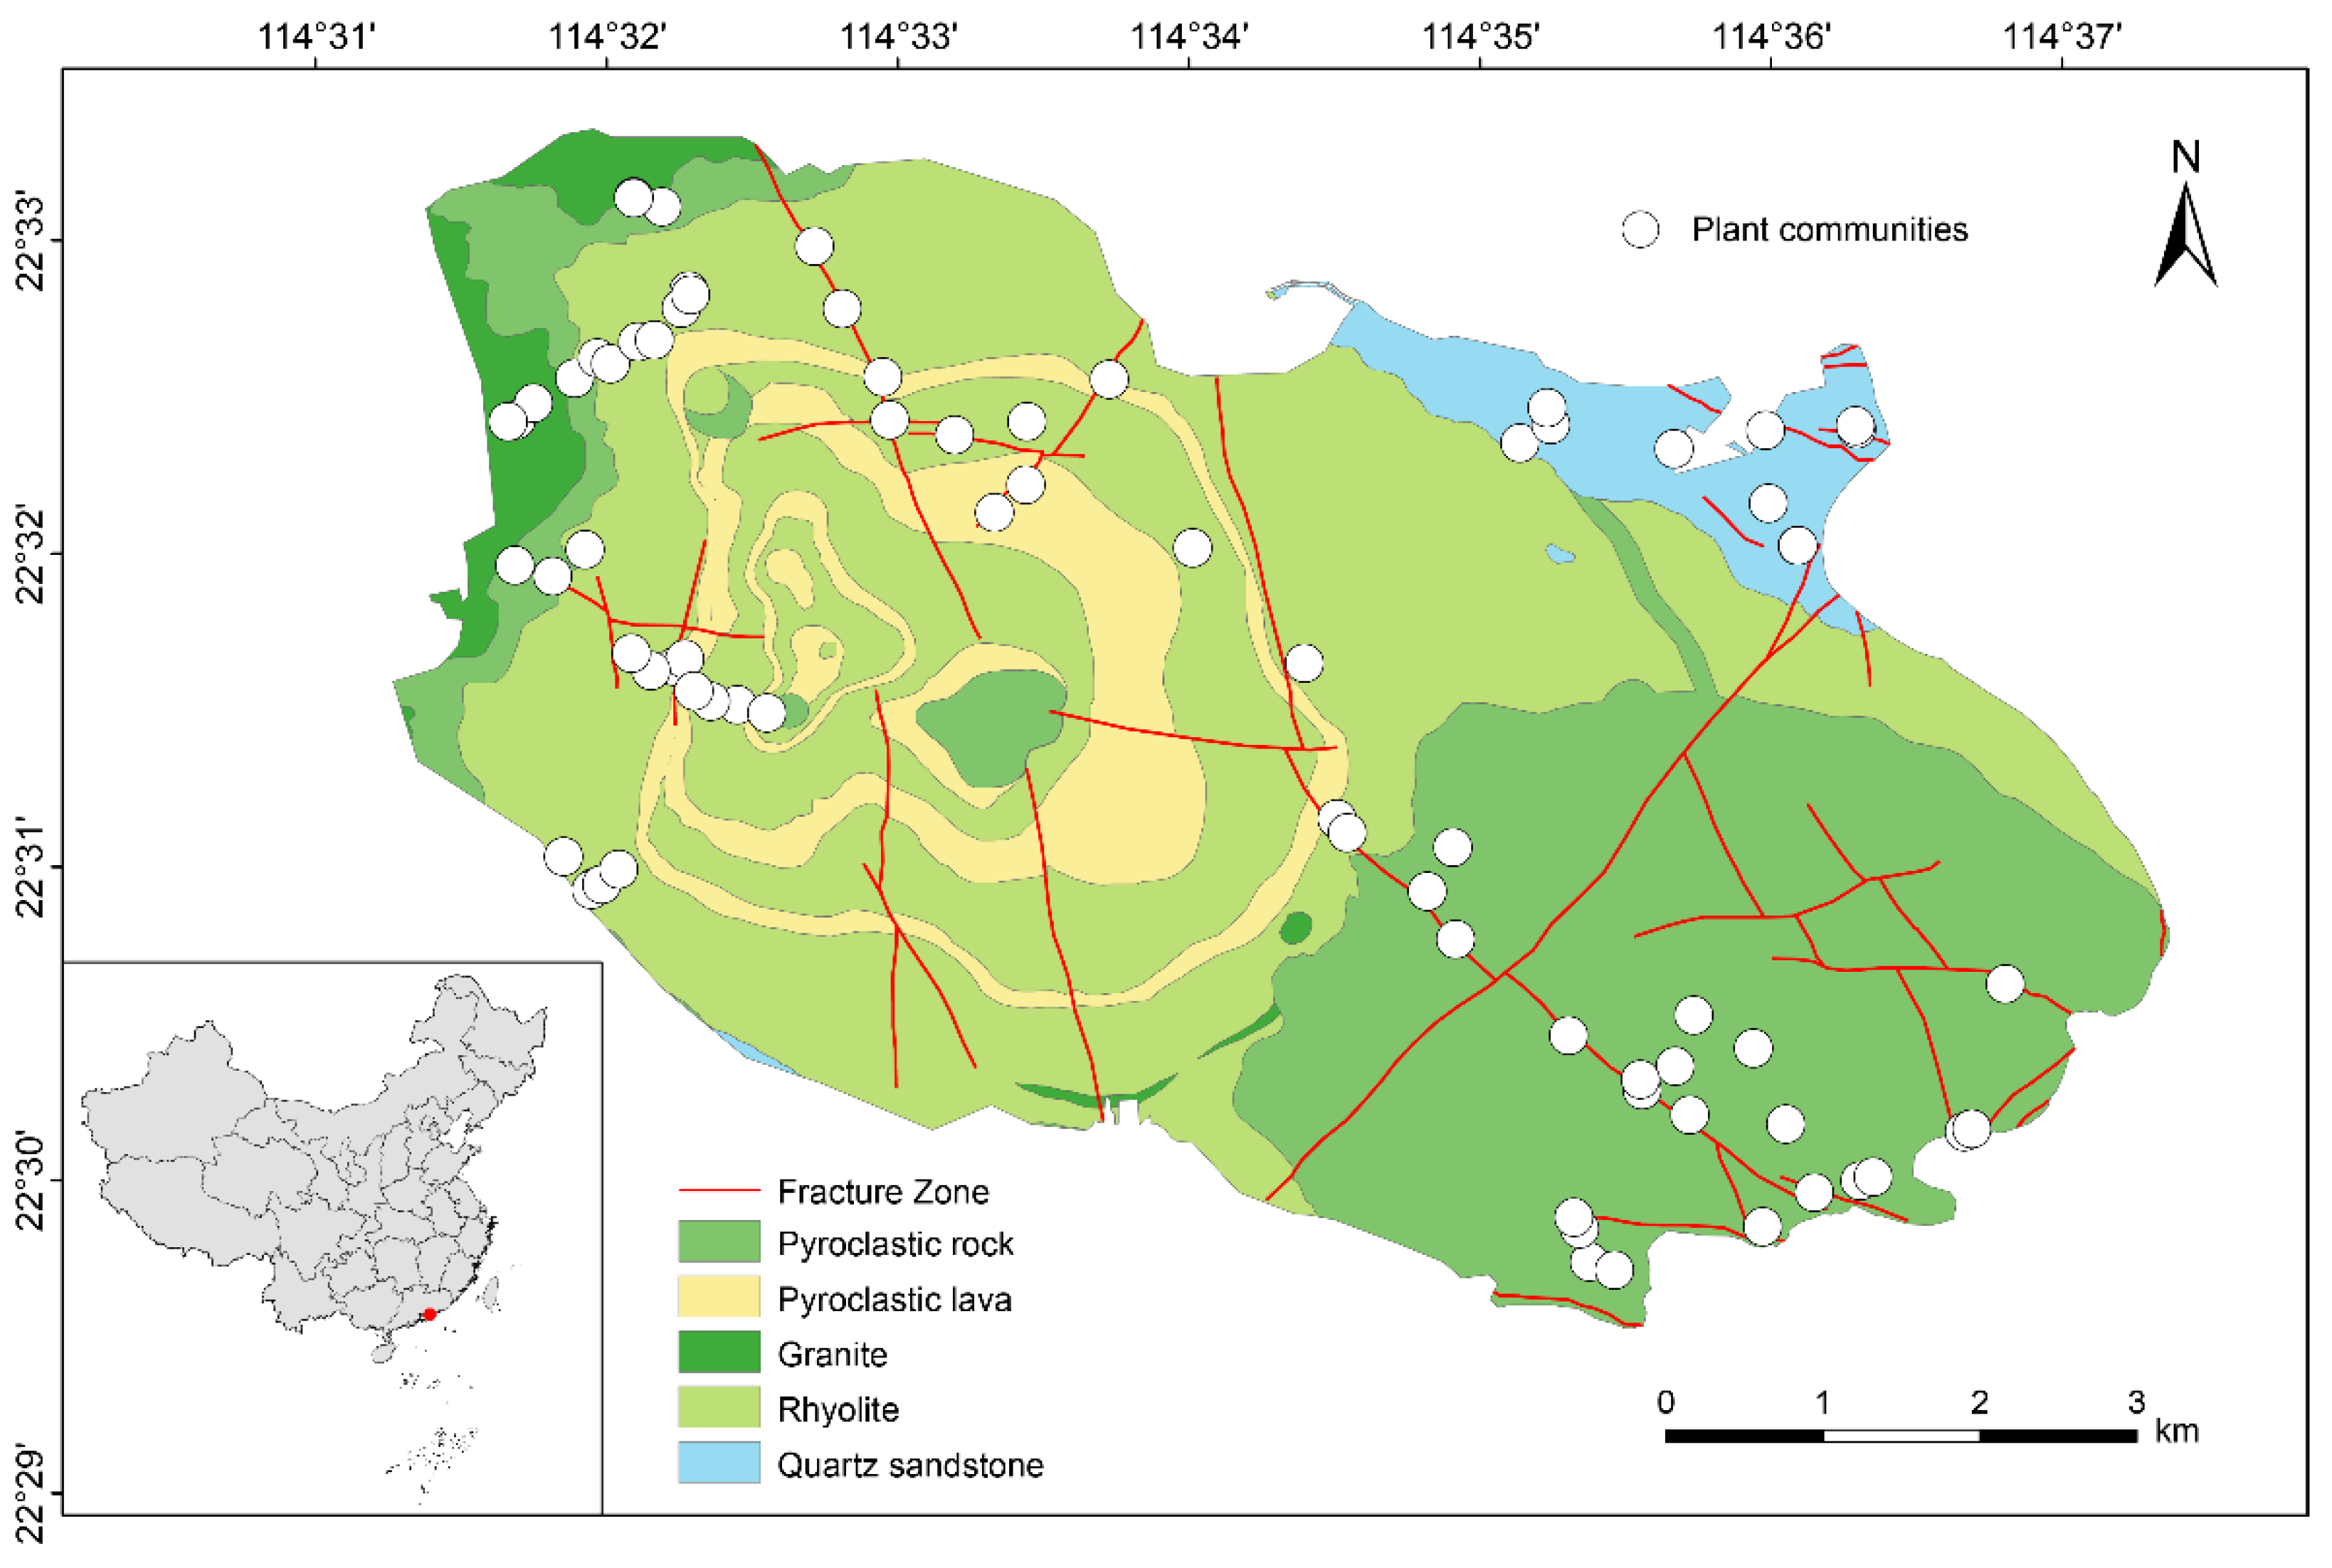
Qiniangshan Mountain, a geological remnant of the Yanshan orogeny, is located in the southeastern of the Dapeng Peninsula in Shenzhen, Guangdong Province, China. Its geographical coordinates range from 22°29′31″N to 22°33′21″N and from 114°31′14″E to 114°37′22″E, covering an area of 46.073 km², with elevation range from sea level to 869.7 m. The bedrock in Qiniangshan Mountain mainly consists of volcanic rocks, including rhyolite, pyroclastic rock, and pyroclastic lava, accompanied by granite and quartz sandstone (Fig. 1). In addition, Qiniangshan Mountain situated in the East Asia monsoon region, exhibits a remarkable diversity of vegetation, rendering it an ideal site for investigating the intricate interplay between flora and bedrock environment. Maps of China and Qiniangshan Mountain used in this study were adapted from the DataV.GeoAtlas (http://datav.aliyun.com/portal/school/atlas/area_selector), and visualization in ArcGIS 10.8 (http://www.esri.com/).
Figure 1.
Geographical distribution, bedrock types and plant communities in Qiniangshan Mountain.
2.2. Community Data Acquisition and Standardization
The investigated community was situated within the undisturbed natural vegetation zone of Qiniangshan Mountain. The field survey spanned from July 2020 to August 2021. To study the difference of vegetation communities on different bedrock types. We strategically placed community quadrats to comprehensively account for geographical and environmental factors (e.g., elevation, slope, aspect, and bedrock). The survey method of the field community quadrat was adopted based on previous studies (Fang et al., 2009). The sampled quadrat area of plant communities was 400 m2 - 1200 m2. For each community, we recorded its geographical data (e.g., latitude, longitude, and elevation) (Extended Data Table S1) and all species occurrences information. A total of 594 species belong to 119 families and 322 genera were recorded in 75 plant communities (Extended Data Table S4).
The ‘lcvplants’ package in R 4.2.3 (www.r-project.org) was utilized to standardize the scientific names of plants in the community quadrats to Leipzig Catalogue of Vascular Plants (LCVP), and taxonomic ranks below the species level were consolidated to the species level (Freiberg et al., 2020).
2.3. Environmental Data
(1) Climate data
The 19 bioclimatic variables, BIO1-BIO19, were retrieved from the CHELSA climate dataset (version 1.2, available at http://chelsa-climate.org/) at 30 arc-second resolution, which describe temperature, precipitation, and fluctuations in temperature and precipitation at various time scales. (Karger et al., 2017). Although this precise climate data is rough for each community, it still has a certain correlation with the species richness of the community for the whole Qiniangshan Mountain region (Extended Data Fig. S1). The extraction of climatic data was conducted using the ‘raster’ package in R version 4.2.3 (Hijmans et al., 2015). Because some of the climatic variables (e.g., mean annual temperature and mean temperature of the warmest quarter) are highly intercorrelated, we excluded variables with a Pearson correlation coefficient greater than 0.95 to reduce collinearity. Seven climatic variables were finally included in our analysis of plant community quadrats (Extended Data Table S2).
(2) Bedrock data
The bedrock in the study area is categorized into five types based on classification standards from Volcanic Petrology (Wang and Zhou, 1982) and the geological survey findings of Qiniangshan Mountain (You et al., 2020). These are three volcanic rocks: rhyolite (lava), pyroclastic rock, and pyroclastic lava; one subvolcanic rock: granite; and one sedimentary rock: quartz sandstone (Fig. 1). Rhyolite, pyroclastic rock, pyroclastic lava, and granite stem from Mesozoic volcanic eruptions and contribute to Qiniangshan Mountain’s complex and varied volcanic topography. The quartz sandstone, which can be dating back to the Devonian period, exclusively occurs in the Luzui area situated southeast of Qiniangshan Mountain (Fig. 1). The largest bedrock in Qiniangshan Mountain is rhyolite, followed by pyroclastic rock, both present in the 0-800 m elevation range. Pyroclastic lava is concentrically distributed in the 100-600 m elevation range. Conversely, granite and quartz sandstone are primarily found below 100 m elevation.
(3) Topographic data
The topographic dataset includes three variables: slope, aspect, and elevation. These data were obtained from field measurements by GPSMAP 62sc.
2.4. Phylogenetic Diversity and Phylogenetic Structure
(1) Phylogenetic tree construction
Utilizing standardized species information from community surveys, we constructed a phylogenetic tree with the ‘V.PhyloMaker2’ package in R 4.2.3 (Jin and Qian, 2022). The backbone of the tree, GBOTB.extended.LCVP.tre, is based on the LCVP nomenclature standardization system and includes gene sequence data with GenBank (Zanne et al., 2014; Smith and Brown, 2018; Freiberg et al., 2020). Among the 594 species occurs in plant communities, 458 species were included in “GBOTB.extended.LCVP.tre” respectively. The others species absent from “GBOTB.extended.LCVP.tre” were matched to their respective genera based on Phylomatic method by ‘V.PhyloMaker2’ (Webb et al., 2011). Branch lengths for these species were then estimated using the BLADJ function in ‘V.PhyloMaker2’ (Webb et al., 2011; Jin and Qian, 2022). We used build. nodes. 1 to extract genus and family information and generated our final mega-phylogeny using Scenario 3 in V.PhyloMaker2 following Jin and Qian (2022). Finally, we generated phylogenetic trees for 594 species in 75 plant communities in Qiniangshan Mountain (Extended Data Fig. S2).
(2) Phylogenetic diversity and phylogenetic structure
We selected the most frequently used Phylogenetic Diversity (PD) metric to quantify community phylogenetic diversity (Faith, 1992). PD is the cumulative sum of all phylogenetic branch lengths that connect the species within a community (Faith, 1992). Because PD is significantly positively correlated with species richness (P < 0.001) (Extended Data Fig. S3). To mitigate the effect of species richness on PD, we use the Phylogenetic Diversity Index (PDI), which is the standardized effect size of PD’s null model. The PDI is calculated under null model with PD as [PDI = (PDobserved − PDrandomized)/(sdPDrandomized)] by ‘picante’ in R version 4.2.3 (Kembel et al., 2010). Here, PDobserved represents the observed PD, PDrandomized represents the expected PD obtained from 999 random combinations, and sdPDrandomized is the standard deviation of the expected PD.
The inference of community phylogenetic structure was based on the Net Relatedness Index (NRI), and the Nearest Taxon Index (NTI). NRI measures the phylogenetic relatedness among species within a community (Webb, 2000; Lu et al., 2018; Qian et al., 2019). Based on a null model, it is the standardized effect size of the Mean Phylogenetic Distance (MPD) of all species pairs (Webb et al., 2002). NRI reflects the deeper phylogenetic structure. Based on a null model, NTI is the standardized effect size of the Mean Nearest Taxon Distance (MNTD) for each species, indicating the shallower phylogenetic relationships. The calculated of NRI and NTI were under the same null model with PDI as [NRI = − (MPDobserved − MPDrandomized)/(sdMPDrandomized)] and NTI are: [NTI = − (MNTDobserved − MNTDrandomized)/(sdMNTDrandomized)] via the R package ‘PhyloMeasures’ (Tsirogiannis et al., 2016).
2.5. Statistical Analysis
Data normalization: The species richness data of plant community quadrats were transformed using the Hellinger method. Quantitative variables, including elevation, latitude, longitude, slope, and climatic factors were processed using the range normalization formula, denoted as (xi-min)/(max-min), effectively scaling the data to a range between 0 and 1 (Ricklefs and He, 2016).
GLM regression analysis: Because the bedrock effects can be confounded with local climate and habitat conditions. We extended the Generalized Linear Models (GLM) to include all of the local climate, and geography variables. GLM models were used to incorporate environmental data, including bedrock type, elevation, slope, aspect, and climatic factors, as predictors in regression analyses of SR, NRI, NTI, and PDI. Model selection during regression was progressively based on the Akaike Information Criterion (AIC) values, favoring models with lower AIC values. These regressions were conducted using the ‘MASS’ package and the ‘glm’ function in R version 4.2.3.
Spatial autocorrelation: Considering the spatial scale constraints on species dispersal, the species composition of communities exhibits spatial autocorrelation. The homogenizing effect of dispersal between two communities intensifies with proximity (Tuomisto and Ruokolainen, 2006; Hubbell et al., 2001; Condit et al., 2002). Thus, this study utilizes Moran’s I value to measure the residual spatial autocorrelation, akin to Pearson’s correlation coefficient, which typically ranges from 1 to -1. An expected Moran’s I value close to 0 suggests an absence of spatial autocorrelation. The spatial autoregressive model (SAR) regression, performed with the ‘spdep’ package in R version 4.2.3, accounts for spatial autocorrelation interference among plant community quadrats, thereby evaluating the impact of various environmental factors (Bivand, 2022). For detailed model output results, refer to Extended Data Table S3.
3. Results
3.1. Diversity Pattern of Plant Communities
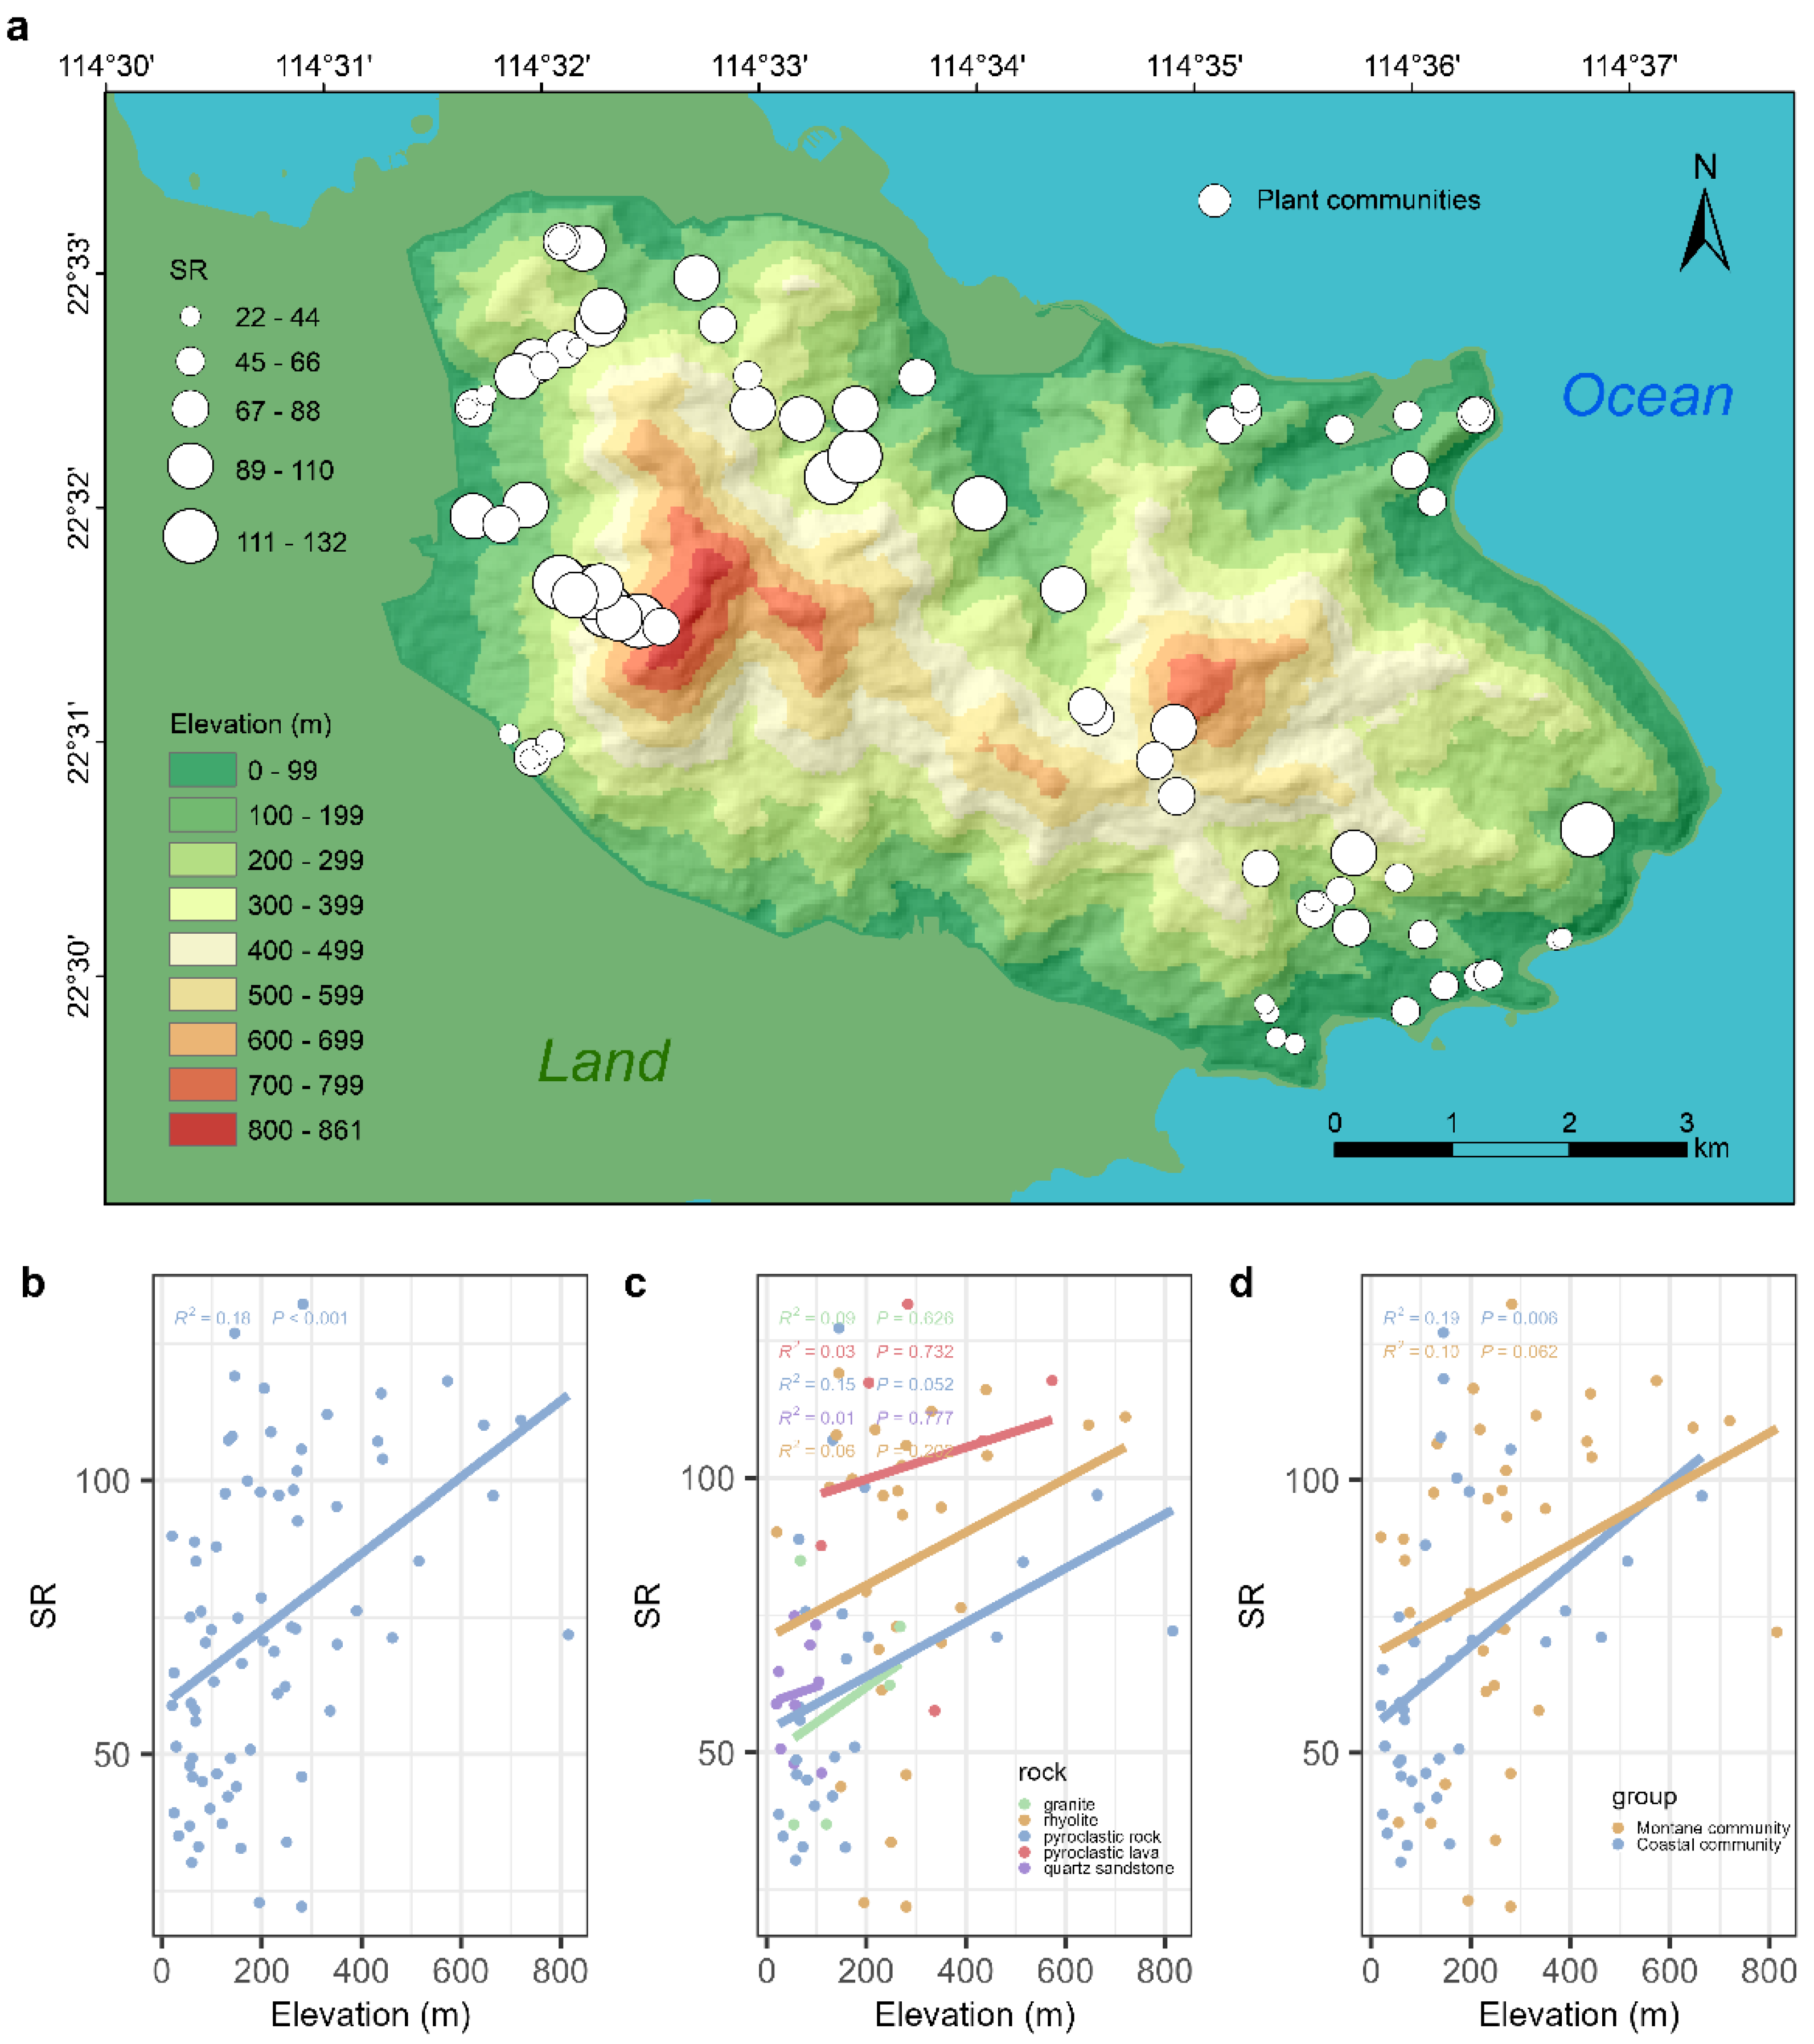
In Qiniangshan Mountain, plant communities with higher species richness (SR) are primarily distributed in the mid-to-high elevation range of approximately 400-600 meters above sea level (Fig. 2a). Conversely, plant communities with lower species richness are primarily located in low-elevation areas below 300 meters. Furthermore, there is a noticeable difference in the species richness of plant communities on the north and south slopes of Qiniangshan Mountain. Montane communities on the northwestern slope connected with the land exhibit higher species richness, while coastal communities on the southeastern slope near the ocean have lower species richness. The species richness of plant communities in Qiniangshan Mountain exhibits a "monotonically increasing" pattern along the elevation gradient (Fig. 2b). The species richness of plant communities at mid to high elevations is significantly higher than that of low-elevation communities (R2 = 0.18, P < 0.001). There is no significant linear relationship between species richness and elevation for plant communities on different bedrock types (Fig. 2c, P-values > 0.05). Overall, montane communities have higher species richness compared to coastal communities. However, there is no significant linear relationship between species richness and elevation in mountain communities (R2 = 0.10, P = 0.062), whereas coastal communities exhibit a significantly "monotonically increasing" pattern of species richness along the elevation gradient (R2 = 0.19, P = 0.006).
Figure 2.
Spatial distribution pattern of species richness of plant communities in Qiniangshan Mountain and its response to elevation gradient. a, Spatial distribution pattern of species richness, the size of the circle represents the SR of each plant communities; b, Response of species richness to elevation gradient; c, Response of species richness on different bedrock to elevation gradient; d, Response of species richness of montane communities and coastal communities to altitude gradient.
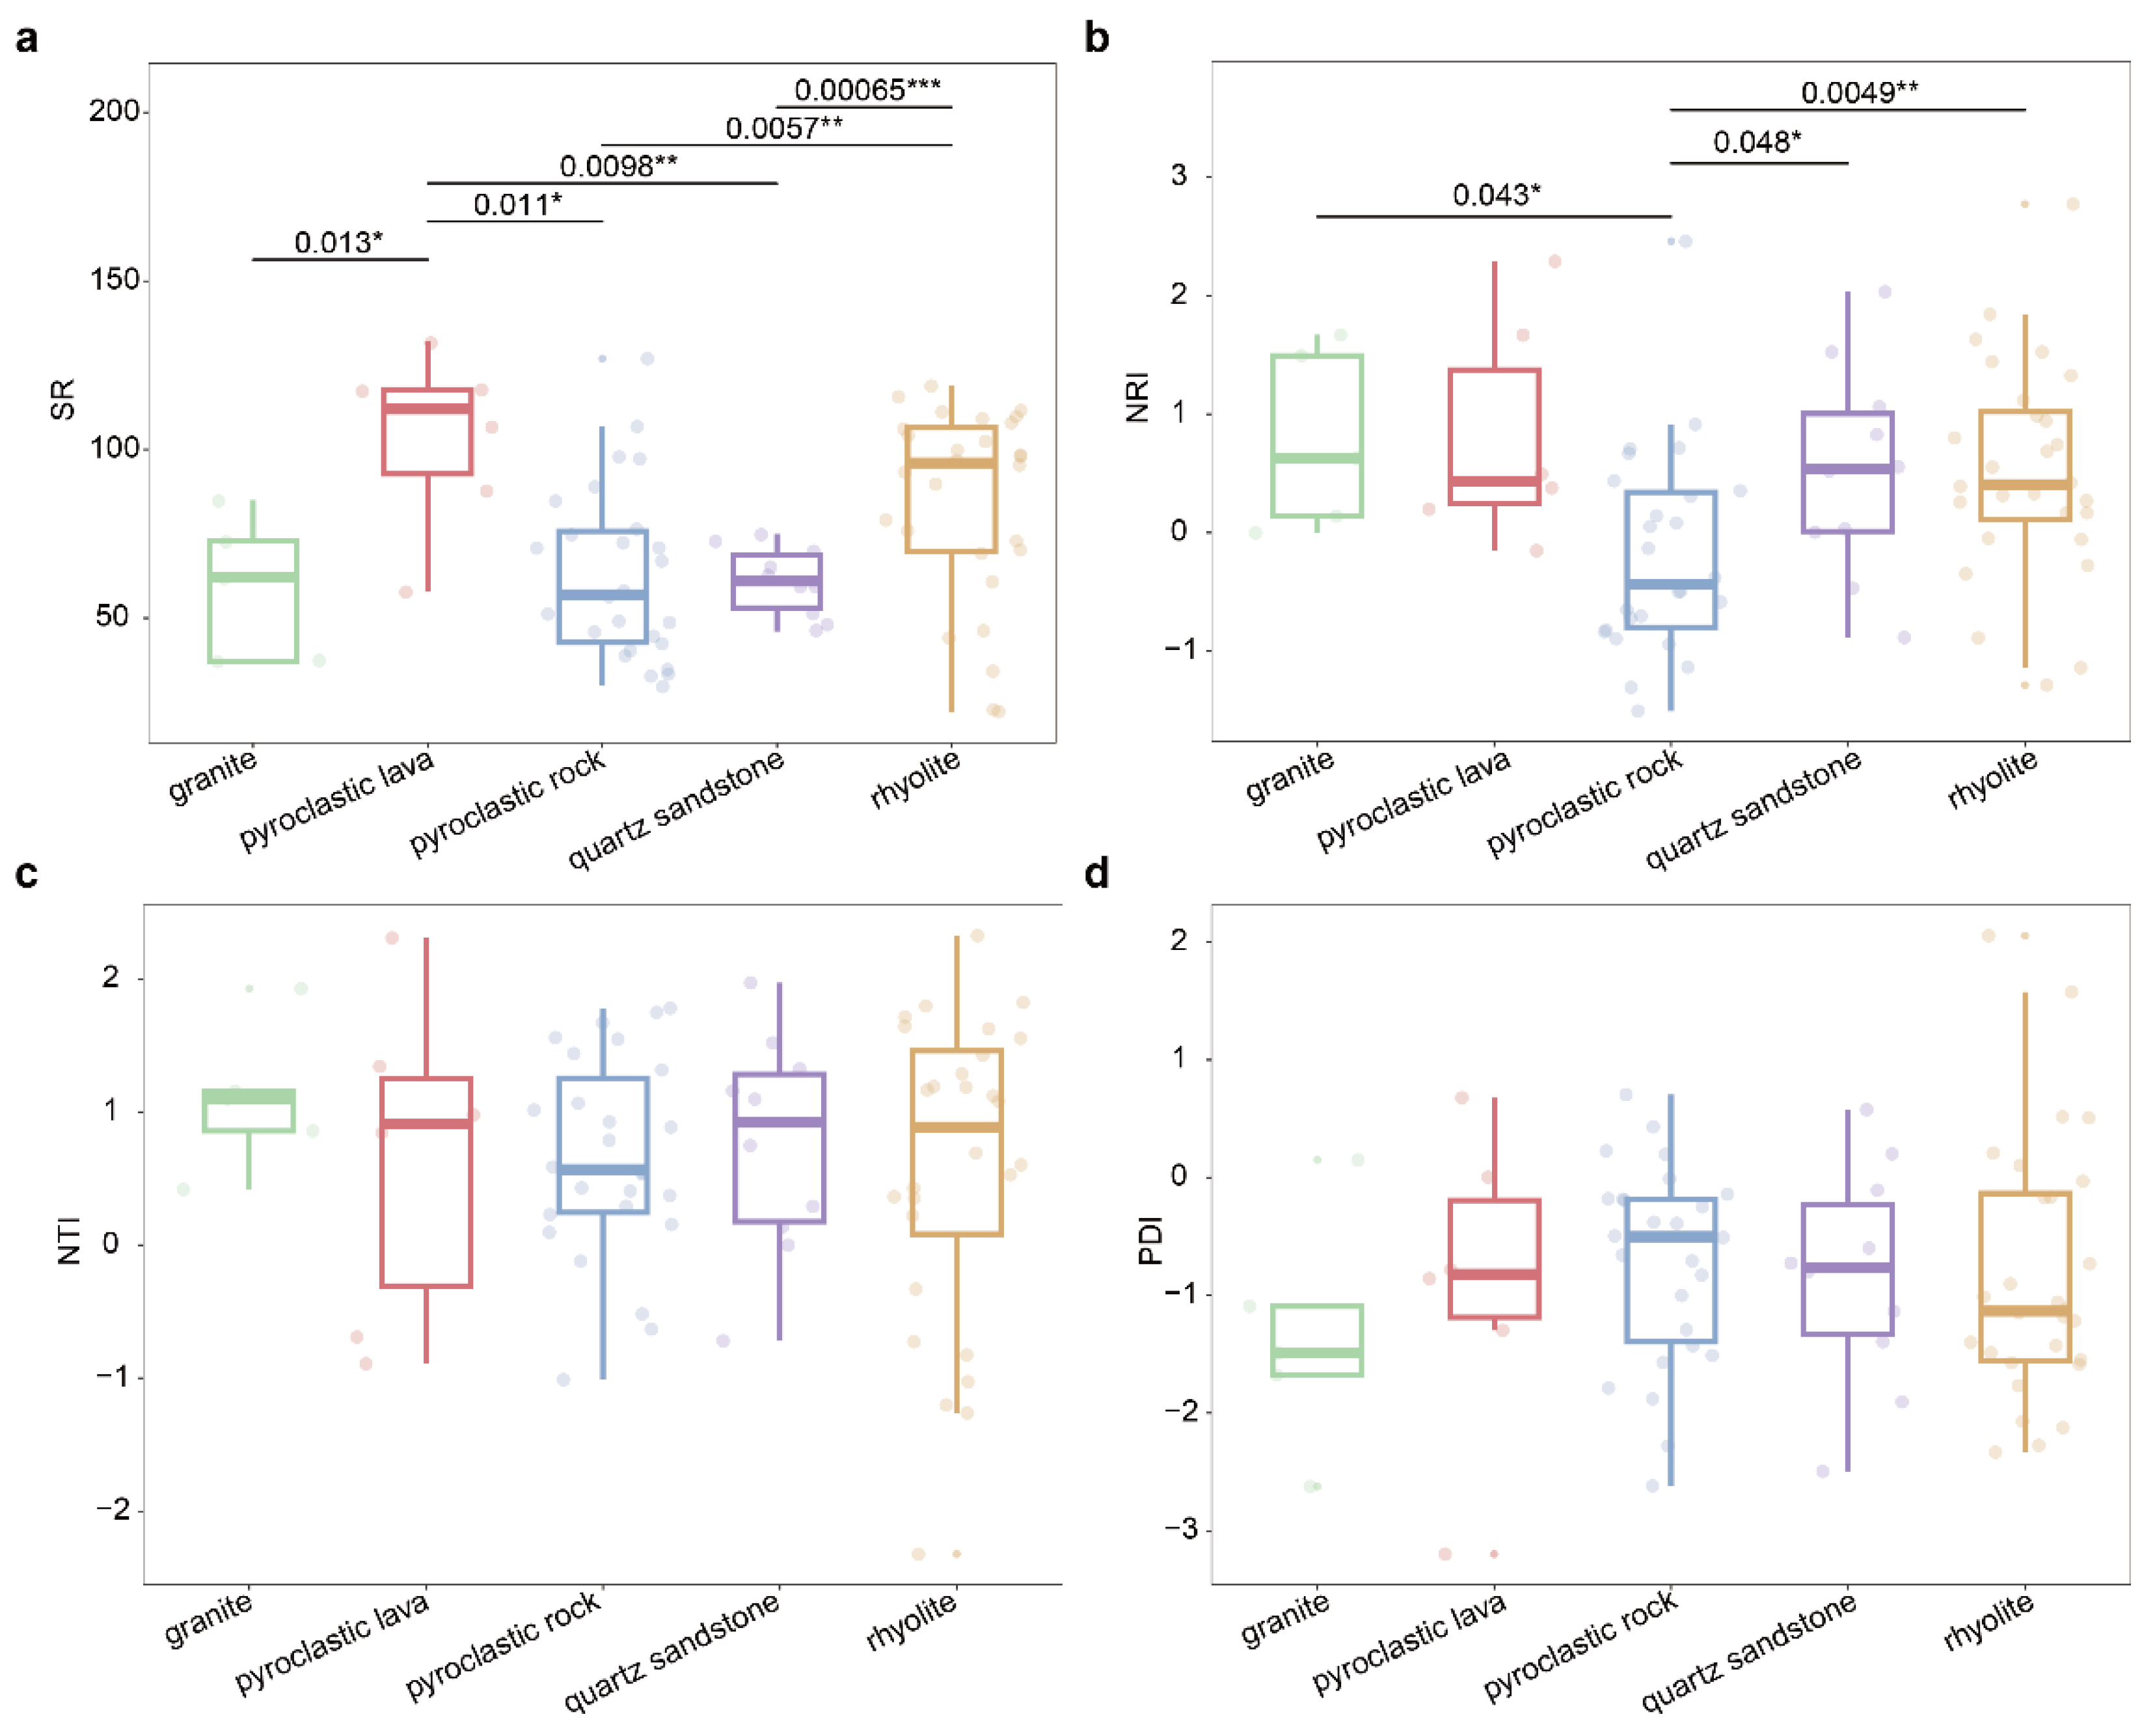
The species diversity of the community is, to some extent, influenced by the underlying bedrock. In Qiniangshan Mountain, the species richness of plant communities distributed on different bedrocks shows significant differences (Fig. 3a). Plant communities on pyroclastic lava exhibit significantly higher species richness compared to those on granite (P = 0.013), pyroclastic rock (P = 0.011), and quartz sandstone (P = 0.0098). Additionally, plant communities on rhyolite have significantly higher species richness than those on pyroclastic rock (P = 0.0057) and quartz sandstone (P = 0.00065). Analysis of the differences in community phylogenetic structure indicates that the NRI of plant communities on pyroclastic rock is significantly lower than those on granite (P = 0.043), quartz sandstone (P = 0.048), and rhyolite (P = 0.0049) (Fig. 3b). The deep phylogenetic structure of plant communities on pyroclastic rock tends to be overdispersed, whereas those on other bedrocks tend to be clustered. There is no significant difference in the NTI of plant communities across different bedrocks, with NTI values being less than 0 for communities on all five bedrock types, indicating that the shallow phylogenetic structure of these plant communities tends to be clustered overall (Fig. 3c). The PDI of plant communities does not show significant differences across different bedrocks (Fig. 3d). However, plant communities on pyroclastic rock have a relatively high overall PDI, indicating a more complex species composition, while plant communities on granite have a relatively low overall PDI, indicating a simpler species composition.
Figure 3.
The differences in species richness, phylogenetic structure among types of bedrock. a, species richness; b, NRI (net relatedness index); c, NTI (Nearest Taxon Index); d, PDI (phylogenetic diversity index); Granite, rhyolite, pyroclastic rock, pyroclastic lava are volcanic bedrocks, and quartz sandstone is non-volcanic bedrocks; There is a significant difference between the two sets of data marked with *, * means P < 0.05, ** means P < 0.01, *** means P < 0.001.
3.2. Effects of Environmental Factors on Species richness And Phylogenetic Structure
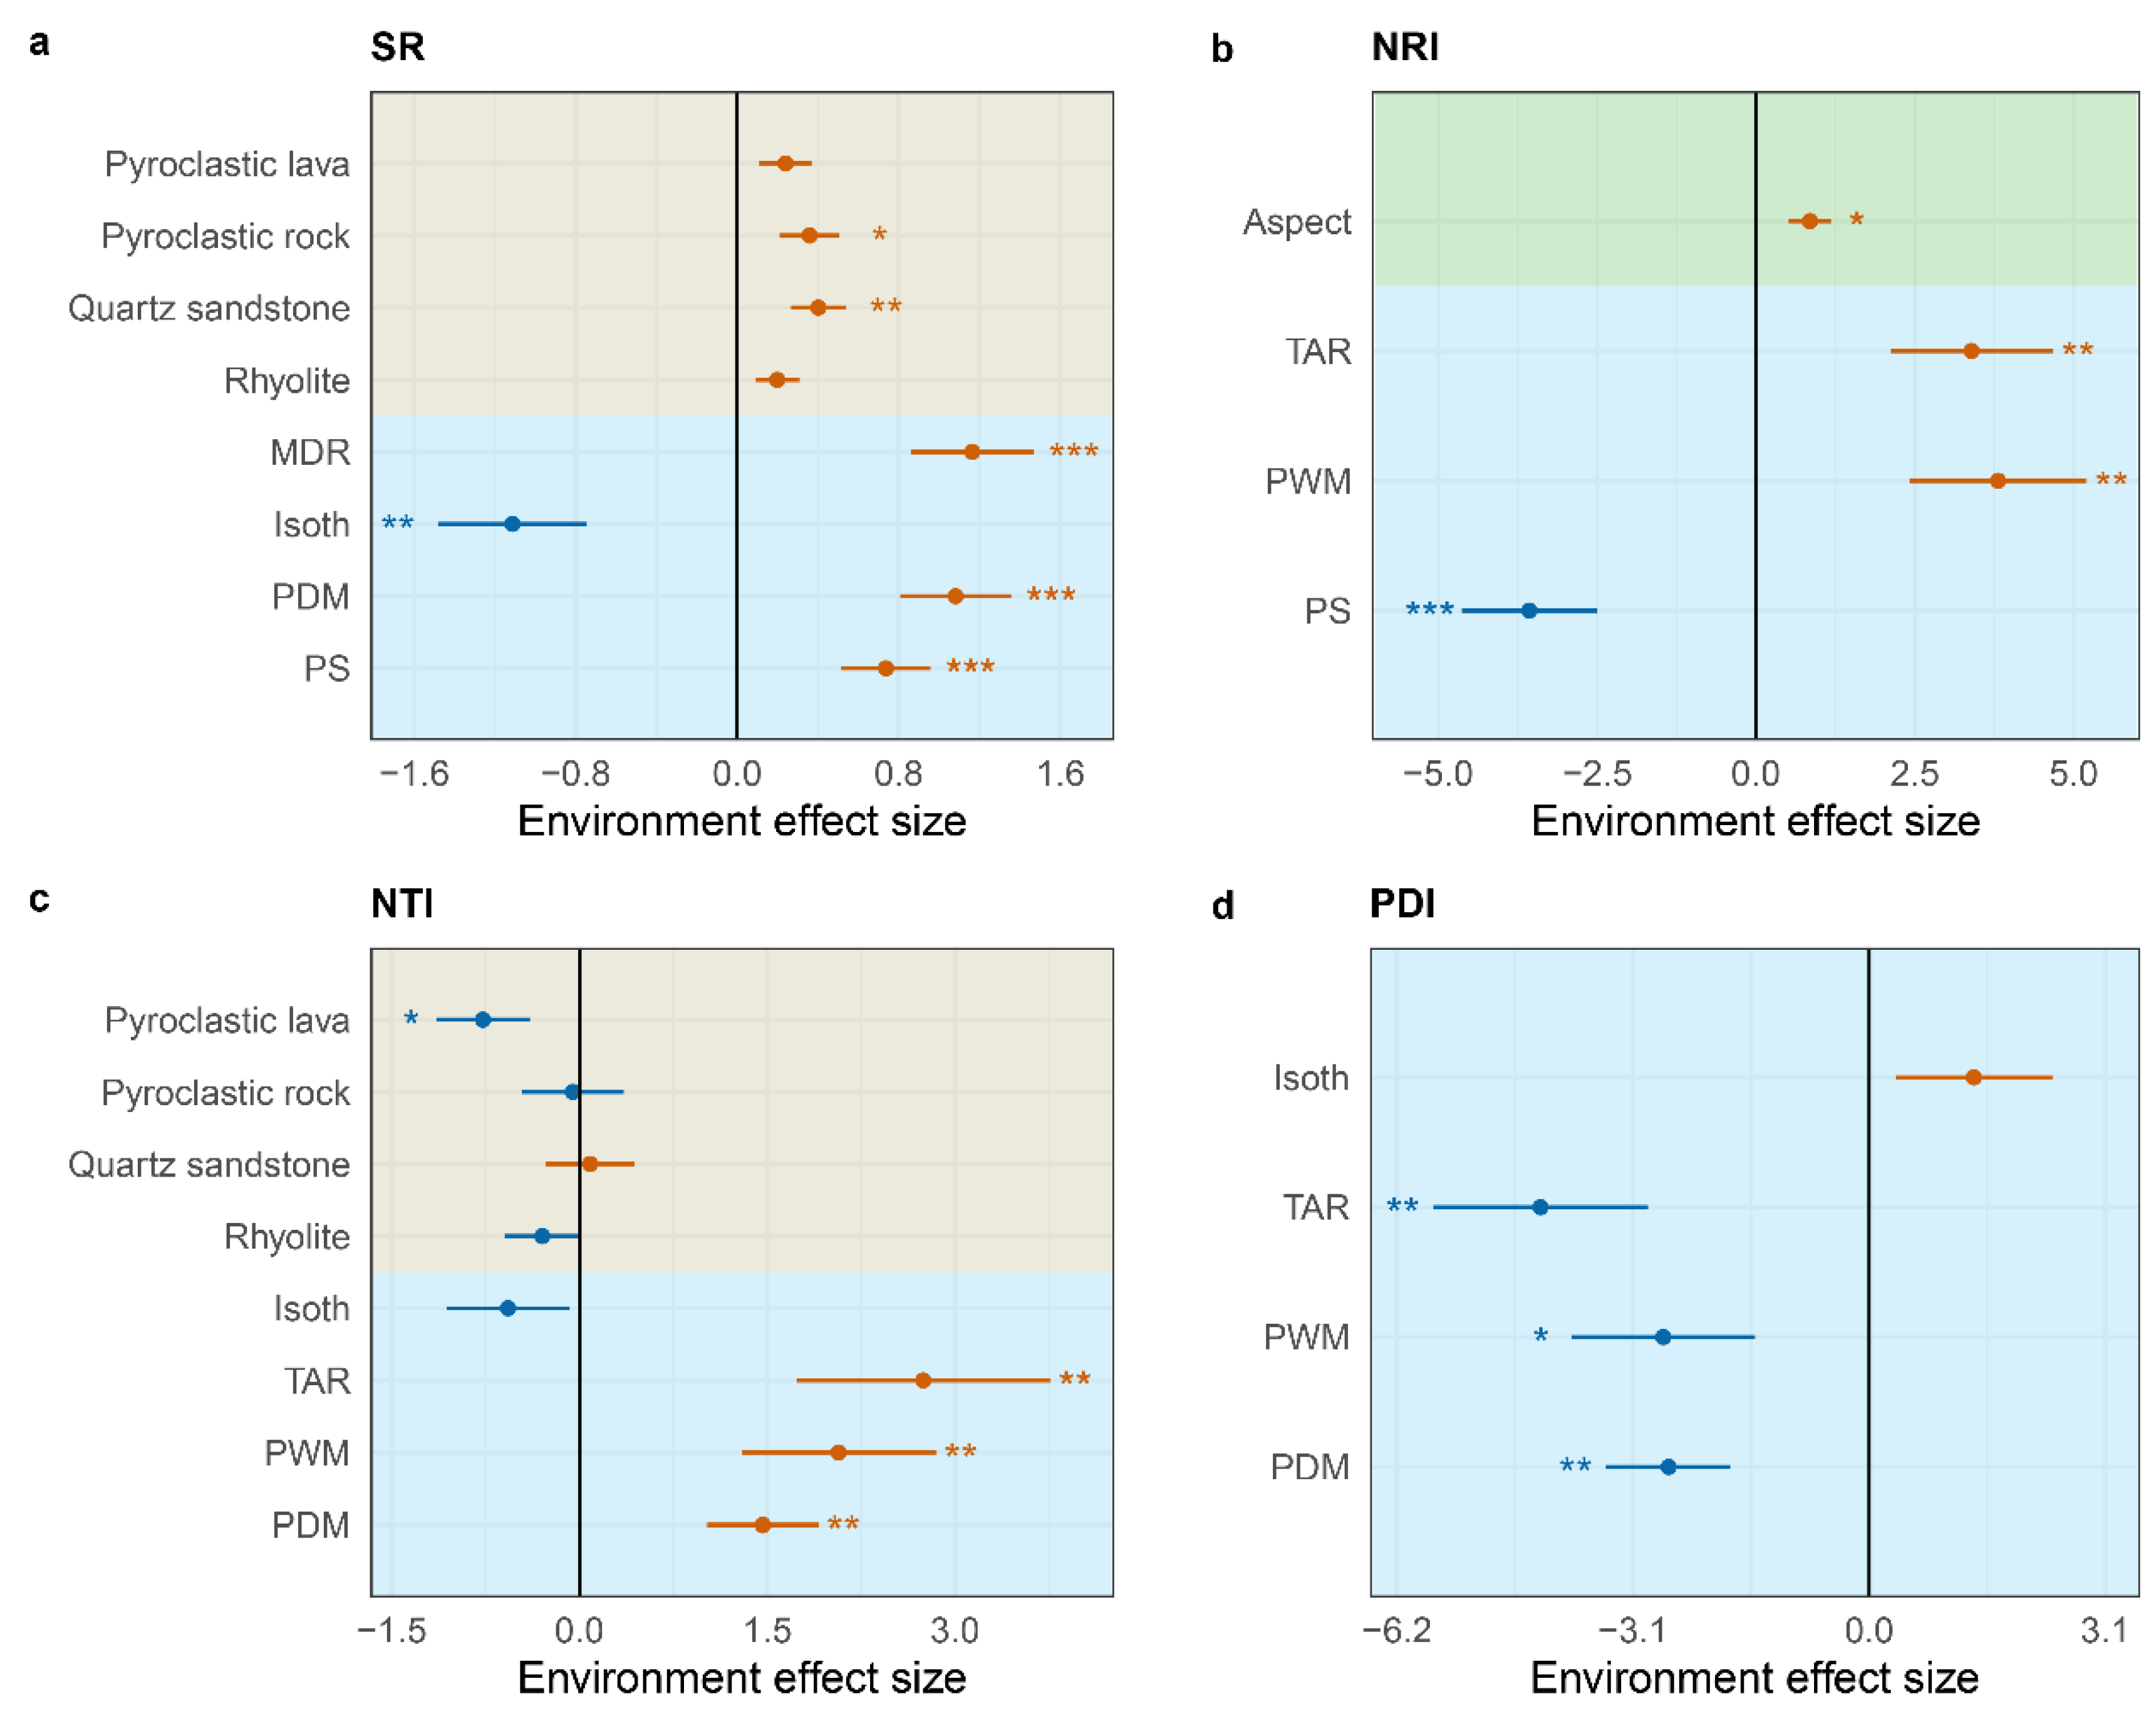
In the SAR model, climate factors and bedrock are the primary determinants of species richness in plant communities, collectively explaining 68.60% of the variation in species richness (AIC = 44.35). Isothermality (Isoth) is significantly negatively correlated with species richness, while pyroclastic rock, quartz sandstone, Mean Diurnal Range (MDR), Precipitation of Driest Month (PDM), and Precipitation Seasonality (PS) are significantly positively correlated with species richness (Fig. 4a; Extended Data Table S3). The NRI of plant communities is mainly determined by climate factors and aspect, together explaining 39.20% of the variation in NRI (AIC = 181.12). PS is significantly negatively correlated with NRI, whereas aspect, Temperature Annual Range (TAR), and Precipitation of Wettest Month (PWM) are significantly positively correlated with NRI (Fig. 4b; Extended Data Table S3). The primary predictors of NTI are bedrock and four climate variables: Isoth, TAR, PWM, and PDM, collectively explaining 48.60% of the variation in NTI (AIC = 202.16). Pyroclastic lava is significantly negatively correlated with NTI, while TAR, PWM, and PDM are significantly positively correlated with NTI (Fig. 4c; Extended Data Table S3). The primary predictors of PDI are four climate variables: Isoth, TAR, PWM, and PDM, which represent the availability of energy and water in the environment. These factors collectively explain 37.60% of the variation in PDI (AIC = 201.18), with TAR, PWM, and PDM all significantly negatively correlated with PDI.
Figure 4.
Determinants of species richness, phylogenetic structure of plant communities in Qiniangshan Mountain. a, species richness; b, NRI (net relatedness index); c, NTI (Nearest Taxon Index); d, PDI (phylogenetic diversity index); Red stands for positive effect and blue stands for negative effect; Different background colors represent different environmental factors, khaki represents bedrock, blue represents climate and green represents topography; * P < 0.05, ** P < 0.01, *** P < 0.001. The model output results of the bedrock are calculated with reference to granite (intercept).
4. Discussion
4.1. Spatial Distribution Pattern of Diversity of Plant Communities in Qiniangshan Mountain
Our study reveals that the species richness along the elevational gradient of plant communities in Qiniangshan Mountain exhibits a “monotonically increasing” pattern (Fig. 2b). Plant communities with higher species richness are primarily distributed at elevations of 400-600 meters (Fig. 2a). The reasons for “monotonically increasing” of SR are multifaceted, such as human pressure in low-elevation areas (Wang et al., 2022; Zhang et al., 2023), and sample strategy interference (Guo et al., 2013). The communities surveyed in this study are well-preserved natural vegetation, largely avoiding areas of strong human disturbance. Therefore, we suspect that the vertical gradient of plant community of species richness of Qiniangshan Mountain is driven by the regional environmental conditions. The high temperature and large forest evaporation in low-elevation areas lead to water deficiency, while mid-to-high elevation areas offer the most suitable habitat due to the optimal combination of hydrothermal conditions. Hence the richest communities' species composition is found there (McCain, 2007; Cheng et al., 2023). The mid-to-high elevation areas of Qiniangshan Mountain feature more exposed rocks, which are beneficial for plants to capture moisture through rock fissures.
The overall species richness of montane plant communities on the northwest slope (inland leeward slope) of Qiniangshan Mountain is higher than that of coastal plant communities on the southeast slope (seaward windward slope) (Fig. 2d). Coastal plant communities are subject to more stringent habitat filtering and ecological constraints compared to montane plant communities, such as the influence of sea winds on the windward slope, salt stress in the air and soil, and nutrient-poor soil conditions (Acosta et al., 2009). The cooling effect of the ocean on rising temperatures in coastal areas may force hardwood and pine mixed forests to retreat further to the ridge tops (Potter, 2014). Consequently, the species richness of coastal plant communities responds more significantly to the elevation gradient than that of montane plant communities (Fig. 2d). Additionally, coastal plants are better adapted to environmental stresses (e.g., high salinity, drought, and strong winds). This high specialization limits their migration to different types of ecosystems, resulting in many plant communities being confined to coastal zones, such as mangrove communities and Glehnia littoralis communities, which have high species endemism and conservation value (Martins et al., 2013; Hernández et al., 2015).
For plant communities on individual bedrock, there is no significant linear relationship between species richness and elevation (Fig. 2c). This may be due to the heterogeneity of habitats created by different bedrock types, which significantly influences the distribution patterns of species richness (Rahbek et al., 2019b). Plant communities on different bedrock types show significant differences in species richness, with the highest overall species richness found on pyroclastic lava (Fig. 3a). Pyroclastic lava is distributed in a ring at elevations of 100-600 meters in Qiniangshan Mountain, and the soils developed on these rocks are rich in organic matter, nitrogen, and phosphorus (Liu, 2020), providing a foundation for plant growth and development within the communities. Phylogenetic Niche Conservatism (PNC) posits that environmental filtering promotes the clustering of phylogenetic structures in mountainous plant communities (Segovia et al., 2020; Ringelberg et al., 2023). Conversely, competitive exclusion drives the divergence of phylogenetic structures in mountain plant communities. The NRI results for plant communities on different bedrock types show that the deep phylogenetic structure of plant communities on pyroclastic rock tends to be overdispersed, indicating that competitive exclusion influences species coexistence processes within the community. In contrast, plant communities on pyroclastic lava, rhyolite, granite, and quartz sandstone tend to be clustered, with habitat filtering dominating the community assembly process (Fig. 3b). The NTI of plant communities does not show significant differences across different bedrock types, with the shallow phylogenetic structure of plant communities on all five bedrock types generally tending to be clustered (Fig. 3c). This shows that the diverse habitats on different bedrock types play a role in environmental filtering, with habitat filtering being dominant in the community assembly of plant communities. Plant communities on pyroclastic rock have higher PDI, indicating more complex species composition within the community, while plant communities on granite have lower PDI, indicating smaller phylogenetic differences and closer relatedness among species (Fig. 3d).
4.2. Climate and Bedrock Collectively Influence the Diversity Pattern of Plant Communities
One of the most urgent challenges in ecology and conservation biology is investigating how various environmental stresses affect community ecosystems and their biodiversity (Tekin et al., 2020; Simmons et al., 2021; Pirotta et al., 2022). In this study, we revealed climate is the main factor affecting the species richness and phylogenetic structure of plant communities, and the interaction effects between climate and bedrock on species richness and phylogenetic structure should be further considered. Previous research has demonstrated a close interdependence between plant species richness and climatic variables, notably temperature and precipitation (McCain and Colwell, 2011; Beggs, 2013; Loewen et al., 2023). Precipitation is a key determinant of water availability for vegetation and its associated groups, which, in turn, influences plant diversity and primary productivity (Antonelli et al., 2018a; Harrison et al., 2020; Neves et al., 2020). Biophysical processes of vegetation have been proven to be related to water availability and affect ecosystem processes (Ratzmann et al., 2016; Abel et al., 2021). Our findings corroborate this perspective, specifically, the climate factors MDR, PDM, and PS are significantly positively correlated with species richness (Fig. 4a). In addition to climatic factors, bedrock characteristics significant predictors of species richness. Bedrock geochemistry influences vegetation growth by regulating the regolith water holding capacity (Jiang et al., 2020). For example, volcanic rocks, due to their high porosity, have high permeability, allowing groundwater systems to enhance regional cooling effects through the bedrock layer (Ishiyama et al., 2023). Variations in bedrock types correspond to differences in parent soil nutrients and the capacity of rocks to retain water, together with the mountains’ microclimatic conditions, these factors contribute to habitat heterogeneity within plant communities, thereby providing a spectrum of ecological niches for the species that comprise these communities (Chang et al., 2023). Additionally, the diversity of bedrock types offers a range of soil substrates and micro-geomorphological environments, acting as environmental filters that influence the species composition within these communities (Graham et al., 2014).
In the SAR model, aspect and the climate factors TAR, PWM are significantly positively correlated with the NRI of plant communities (Fig. 4b). Aspect, as a major topographic factor in mountainous areas, affects the angle between the ground and wind direction and the amount of solar radiation received by the ground, leading to differences in light, heat, moisture, and soil properties between different aspects, thereby influencing vegetation distribution (Liu, 2013). This correlation indicates that aspect and climate conditions related to temperature and precipitation form an "environmental filter," leading to the clustering of deeper phylogenetic structures within plant communities, consistent with Phylogenetic Niche Conservatism (PNC). The climate factors TAR, PWM, and PDM are significantly positively correlated with the NTI of plant communities. TAR represents the availability of energy in the environment, while PWM and PDM indicate the availability of water under extreme conditions (driest and wettest months). The availability of energy and water determines plant diversity and primary productivity (Antonelli et al., 2018a; Harrison et al., 2020; Neves et al., 2020). Therefore, the differences in available energy and water promote the clustering of shallow phylogenetic structures within plant communities. Pyroclastic lava is significantly negatively correlated with the NTI of plant communities, possibly because bedrocks promote the evolution of endemic edaphic specialists (Corlett and Tomlinson, 2020). Habitat filtering and local species differentiation result in more distant phylogenetic relationships within plant communities on pyroclastic lava, leading to divergent phylogenetic structures. Similarly, the climate factors TAR, PWM, and PDM are significantly negatively correlated with the PDI of plant communities, as these climate factors promote the clustering of phylogenetic structures within plant communities.
5. Conclusions
This study of the distribution patterns and environmental determinants of plant community diversity in Qiniangshan Mountain has revealed the complex interactions between local climate and bedrock in shaping species and phylogenetic structure. The peak of plant community diversity occurs at mid to high elevations on the mountain. Bedrock types and climate variables, particularly those related to temperature and precipitation, are significant predictors of plant community diversity. However, the importance of climate and bedrock differs for species richness and phylogenetic structure of plant communities. It is essential to emphasize that in regions with high geological diversity, such as volcanic areas, observing patterns of species richness and phylogenetic structure requires a comprehensive consideration of climate conditions, bedrock composition, and their interactions. The complex coupling effects between climatic conditions and geological substrates on plant diversity warrant continuous investigation.
Author Contributions
Xujie Li, Wenbo Liao and Qiang Fan conceived the research. Xujie Li, Wanyi Zhao, Xianling Sun, Xuejiao Zhang, Wenbo Liao and Qiang Fan collected community data. Xujie Li, Wanyi Zhao analyzed the data. Xujie Li wrote the first draft. Xujie Li, Wanyi Zhao, Wenbo Liao and Qiang Fan edited a revised version of the manuscript.
Data availability statement: The species list, distributions and model data of plant communities for this study can be found in the supplementary materials of this study.
Declaration of competing interest: The authors declare no conflict of interest.
Acknowledgments
We appreciate Dr. Yarong Wang, Dr. Yulong Li for their valuable help in graphical analysis. We also thank numerous individuals who contributed to the field survey of plant communities in Qiniangshan Mountain. This work was supported by the project of Co-evolution of Vegetation and Geological Environment in Shenzhen Dapeng Peninsula National Geopark (HT-99982020-0258).
References
- Abel, C.; Horion, S.; Tagesson, T. , et al. The human–environment nexus and vegetation–rainfall sensitivity in tropical drylands. Nature Sustainability 2021, 4, 25–32. [Google Scholar]
- Acosta, A.; Carranza, M.L.; Izzi, C.F. Are there habitats that contribute best to plant species diversity in coastal dunes? . Biodiversity and Conservation 2009, 18, 1087–1098. [Google Scholar] [CrossRef]
- Allen, A.P.; Gillooly, J.F. Assessing latitudinal gradients in speciation rates and biodiversity at the global scale. Ecology letters 2006, 9, 947–954. [Google Scholar] [CrossRef] [PubMed]
- Anacker B L, Whittall J B, Goldberg E E, et al. Origins and consequences of serpentine endemism in the California flora. Evolution 2011, 65, 365–376.
- Antonelli A, Kissling W D, Flantua S G A, et al. Geological and climatic influences on mountain biodiversity. Nature Geoscience 2018, 11, 718–725.
- Antonelli A, Zizka A, Carvalho F A, et al. Amazonia is the primary source of Neotropical biodiversity. Proceedings of the National Academy of Sciences 2018, 115 6034-6039.
- Badgley C, Smiley T M, Terry R, et al. Biodiversity and topographic complexity: modern and geohistorical perspectives. Trends in Ecology & Evolution 2017, 32, 211–226.
- Beggs, P.J. New Directions: Climatediversity: A new paradigm for climate science. Atmospheric Environment 2013, 68: 112-113.
- Bivand, R. R packages for analyzing spatial data: A comparative case study with areal data. Geographical Analysis 2022, 54, 488–518. [Google Scholar] [CrossRef]
- Cavender-Bares J, Kozak K H, Fine P V A, et al. The merging of community ecology and phylogenetic biology. Ecology Letters 2009, 12, 693–715.
- Chang Y, Gelwick K, Willett S D, et al. Phytodiversity is associated with habitat heterogeneity from Eurasia to the Hengduan Mountains. New Phytologist 2023, 240, 1647–1658.
- Cheng, C.; He, N.; Li, M.; et al. 2023. Plant species richness on the Tibetan Plateau: patterns and determinants. Ecography 2023, e06265.
- Clements R, Sodhi N S, Schilthuizen M, et al. Limestone karsts of Southeast Asia: imperiled arks of biodiversity. Bioscience 2006, 56, 733–742.
- Condit R, Pitman N, Leigh Jr E G, et al. Beta-diversity in tropical forest trees. Science 2002, 295, 666–669.
- Corlett, R.T.; Tomlinson, K.W. Climate change and edaphic specialists: irresistible force meets immovable object? . Trends in Ecology & Evolution 2020, 35, 367–376. [Google Scholar]
- Engler R, Randin C F, Vittoz P, et al. Predicting future distributions of mountain plants under climate change: does dispersal capacity matter?. Ecography 2009, 32, 34–45.
- Faith, D.P. Conservation evaluation and phylogenetic diversity. Biological Conservation 1992, 61, 1–10. [Google Scholar] [CrossRef]
- Fang, J.Y.; Wang, X.P.; Shen, Z.H.; et al. Methods and protocols for plant community inventory. Biodiversity Science 2009, 17(06), 533–548. [Google Scholar]
- Freiberg M, Winter M, Gentile A, et al. LCVP, The Leipzig catalogue of vascular plants, a new taxonomic reference list for all known vascular plants. Scientific data 2020, 7, 416.
- Graham C H, VanDerWal J, Phillips S J, et al. Dynamic refugia and species persistence: tracking spatial shifts in habitat through time. Ecography 2010, 33 1062-1069.
- Graham C H, Carnaval A C, Cadena C D, et al. The origin and maintenance of montane diversity: integrating evolutionary and ecological processes. Ecography 2014, 37, 711–719.
- Guo Q, Kelt D A, Sun Z, et al. Global variation in elevational diversity patterns. Scientific Reports 2013, 3 3007.
- Hahm W J, Riebe C S, Lukens C E, et al. Bedrock composition regulates mountain ecosystems and landscape evolution. Proceedings of the National Academy of Sciences 2014, 111, 3338–3343.
- Harrison, S.; Spasojevic, M.J.; Li, D. Climate and plant community diversity in space and time. Proceedings of the National Academy of Sciences 2020, 117 4464-4470.
- Hernández-Cordero, A.I.; Pérez-Chacón Espino, E.; Hernández-Calvento, L. Vegetation, distance to the coast, and aeolian geomorphic processes and landforms in a transgressive arid coastal dune system. Physical Geography 2015, 36, 60–83. [Google Scholar] [CrossRef]
- Hijmans R J, Van Etten J, Cheng J, et al. Package ‘raster’. R Package 2015, 734, 473.
- Hu A, Wang J J, Sun H, et al. Mountain biodiversity and ecosystem functions: interplay between geology and contemporary environments. The ISME Journal 2020, 14, 931–944.
- Hubbell S P, Ahumada J A, Condit R, et al. Local neighborhood effects on long-term survival of individual trees in a neotropical forest. Ecological Research 2001, 16, 859–875.
- Hubbell, S.P. Neutral theory in community ecology and the hypothesis of functional equivalence. Functional ecology 2005, 19, 166–172. [Google Scholar] [CrossRef]
- Hutchinson, G.E.; MacArthur, R.H. A theoretical ecological model of size distributions among species of animals. The American Naturalist 1959, 93, 117–125. [Google Scholar] [CrossRef]
- Ishiyama N, Sueyoshi M, García Molinos J, et al. Underlying geology and climate interactively shape climate change refugia in mountain streams. Ecological Monographs 2023, 93, e1566.
- Jiang Z, Liu H, Wang H, et al. Bedrock geochemistry influences vegetation growth by regulating the regolith water holding capacity. Nature communications 2020, 11 2392.
- Jin, Y.; Qian, H.V. PhyloMaker2: An updated and enlarged R package that can generate very large phylogenies for vascular plants. Plant Diversity 2022, 44, 335–339. [Google Scholar] [CrossRef]
- Karger D N, Conrad O, Böhner J, et al. Climatologies at high resolution for the earth’s land surface areas. Scientific data 2017, 4, 1–20.
- Kembel S W, Cowan P D, Helmus M R, et al. Picante: R tools for integrating phylogenies and ecology. Bioinformatics 2010, 26, 1463–1464.
- Kreft, H.; Jetz, W. Global patterns and determinants of vascular plant diversity. Proceedings of the National Academy of Sciences 2007, 104, 5925–5930. [Google Scholar] [CrossRef]
- Kruckeberg, A.R. Geology and plant life: the effects of landforms and rock types on plants[M]. University of Washington Press 2004.
- Liu, M.X. Plant community composition and nitrogen-phosphorus stoichiometry along a slope aspect gradients in a alpine meadow [D]. Lanzhou University 2013.
- Liu, Y.R. Study on the altitude gradient characteristics of plant communities in Qiniangshan Mountain Geopark [D]. Sun Yat-sen University 2020.
- Loewen CJ, G.; Jackson, D.A.; Gilbert, B. Biodiversity patterns diverge along geographic temperature gradients. Global Change Biology 2023, 29, 603–617. [Google Scholar] [CrossRef] [PubMed]
- Lu L M, Mao L F, Yang T, et al. Evolutionary history of the angiosperm flora of China. Nature 2018, 554, 234–238.
- Maestre F T, Quero J L, Gotelli N J, et al. Plant species richness and ecosystem multifunctionality in global drylands. Science 2012, 335, 214–218.
- Martins, M.C.; Neto, C.S.; Costa, J.C. The meaning of mainland Portugal beaches and dunes’ psammophilic plant communities: a contribution to tourism management and nature conservation. Journal of Coastal Conservation 2013, 17, 279–299. [Google Scholar] [CrossRef]
- McCain, C.M.; Colwell, R.K. Assessing the threat to montane biodiversity from discordant shifts in temperature and precipitation in a changing climate. Ecology letters 2011, 14, 1236–1245. [Google Scholar] [CrossRef]
- McCain, C.M. Could temperature and water availability drive elevational species richness patterns? A global case study for bats. Global Ecology and biogeography 2007, 16, 1–13. [Google Scholar] [CrossRef]
- Morford, S.L.; Houlton, B.Z.; Dahlgren, R.A. Increased forest ecosystem carbon and nitrogen storage from nitrogen rich bedrock. Nature 2011, 477, 78–81. [Google Scholar] [CrossRef]
- Mouquet N, Devictor V, Meynard C N, et al. Ecophylogenetics: advances and perspectives. Biological reviews 2012, 87, 769–785.
- Neves D M, Dexter K G, Baker T R, et al. Evolutionary diversity in tropical tree communities peaks at intermediate precipitation. Scientific Reports 2020, 10, 1188.
- Ott, R.F. How lithology impacts global topography, vegetation, and animal biodiversity: A global-scale analysis of mountainous regions. Geophysical Research Letters 2020, 47, e2020GL088649. [Google Scholar] [CrossRef]
- Owen N R, Gumbs R, Gray C L, et al. Global conservation of phylogenetic diversity captures more than just functional diversity. Nature Communications 2019, 10, 859.
- Pauli, G.; Grabherr, M.; Gottfriedand, H. Climate effects on mountain plants. Nature 1994, 369, 448. [Google Scholar]
- Pauli H, Gottfried M, Dullinger S, et al. Recent plant diversity changes on Europe’s mountain summits. Science 2012, 336, 353–355.
- Pirotta E, Thomas L, Costa D P, et al. Understanding the combined effects of multiple stressors: A new perspective on a longstanding challenge. Science of the Total Environment 2022, 821, 153322.
- Potter, C. Understanding climate change on the California coast: accounting for extreme daily events among long-term trends. Climate 2014, 2, 18–27. [Google Scholar] [CrossRef]
- Qian H, Deng T, Jin Y, et al. Phylogenetic dispersion and diversity in regional assemblages of seed plants in China. Proceedings of the National Academy of Sciences 2019, 116 23192-23201.
- Rahbek C, Borregaard M K, Antonelli A, et al. Building mountain biodiversity: Geological and evolutionary processes. Science 2019, 365 1114-1119.
- Rahbek C, Borregaard M K, Colwell R K, et al. Humboldt’s enigma: What causes global patterns of mountain biodiversity?. Science 2019, 365 1108-1113.
- Ratzmann G, Gangkofner U, Tietjen B, et al. Dryland vegetation functional response to altered rainfall amounts and variability derived from satellite time series data. Remote Sensing 2016, 8, 1026.
- Ren Y J, Lü Y H, Hu J, et al. Geodiversity underpins biodiversity but the relations can be complex: Implications from two biodiversity proxies. Global Ecology and Conservation 2021, 31, e01830.
- Ricklefs, R.E.; He, F. Region effects influence local tree species diversity. Proceedings of the National Academy of Sciences 2016, 113, 674–679. [Google Scholar] [CrossRef]
- Ringelberg J J, Koenen E J M, Sauter B, et al. Precipitation is the main axis of tropical plant phylogenetic turnover across space and time. Science Advances 2023, 9, eade4954.
- Segovia R A, Pennington R T, Baker T R, et al. Freezing and water availability structure the evolutionary diversity of trees across the Americas. Science Advances 2020, 6, eaaz5373.
- Sianta, S.A.; Kay, K.M. Adaptation and divergence in edaphic specialists and generalists: serpentine soil endemics in the California flora occur in barer serpentine habitats with lower soil calcium levels than serpentine tolerators. American Journal of Botany 2019, 106, 690–703. [Google Scholar] [CrossRef]
- Silvertown, J. Plant coexistence and the niche. Trends in Ecology & Evolution 2004, 19, 605–611. [Google Scholar]
- Simmons B I, Blyth P S A, Blanchard J L, et al. Refocusing multiple stressor research around the targets and scales of ecological impacts. Nature Ecology & Evolution 2021, 5 1478-1489.
- Smith, S.A.; Brown, J.W. Constructing a broadly inclusive seed plant phylogeny. American Journal of Botany 2018, 105, 302–314. [Google Scholar] [CrossRef]
- Sommer J H, Kreft H, Kier G, et al. Projected impacts of climate change on regional capacities for global plant species richness. Proceedings of the Royal Society B: Biological Sciences 2010, 277, 2271–2280.
- Tekin E, Diamant E S, Cruz-Loya M, et al. Using a newly introduced framework to measure ecological stressor interactions. Ecology Letters 2020, 23 1391-1403.
- Tsirogiannis, C.; Sandel, B. PhyloMeasures: a package for computing phylogenetic biodiversity measures and their statistical moments. Ecography 2016, 39, 709–714. [Google Scholar] [CrossRef]
- Tukiainen H, Bailey J J, Field R, et al. Combining geodiversity with climate and topography to account for threatened species richness. Conservation Biology 2017, 31, 364–375.
- Tuomisto, H.; Ruokolainen, K. Analyzing or explaining beta diversity? Understanding the targets of different methods of analysis. Ecology 2006, 87 2697-2708.
- Vandermeer, J.H. Niche theory. Annual Review of Ecology and Systematics 1972, 3, 107–132. [Google Scholar] [CrossRef]
- Wang, D.Z.; Zhou, X.M. Volcanic Petrology[M]. Beijing: Science Press 1982.
- Wang X Y, Zhong M J, Yang S N, et al. Multiple β-diversity patterns and the underlying mechanisms across amphibian communities along a subtropical elevational gradient. Diversity and Distributions 2022, 28, 2489–2502.
- Webb, C.O.; Ackerly, D.D.; Kembel, S.W. Phylocom: Software for the analysis of phylogenetic community structure and character evolution, with phylomatic, version: 4.2 2011. https://phylodiversity.net/phylocom/.
- Webb C O, Ackerly D D, McPeek M A, et al. Phylogenies and community ecology. Annual Review of Ecology and Systematics 2002, 33, 475–505.
- Webb, C.O. Exploring the phylogenetic structure of ecological communities: an example for rain forest trees. The American Naturalist 2000, 156, 145–155. [Google Scholar] [CrossRef]
- Wiens, J.J.; Graham, C.H. Niche conservatism: integrating evolution, ecology, and conservation biology. Annual Review of Ecology, Evolution, and Systematics 2005, 36, 519. [Google Scholar] [CrossRef]
- Xu J C, Grumbine R E, Shrestha A, et al. The melting Himalayas: cascading effects of climate change on water, biodiversity, and livelihoods. Conservation Biology 2009, 23, 520–530.
- Yamamichi, M.; Ellner, S.P.; Hairston Jr, N.G. Beyond simple adaptation: Incorporating other evolutionary processes and concepts into eco-evolutionary dynamics. Ecology Letters 2023, 26, S16–S21. [Google Scholar] [CrossRef]
- You S S, Li Z J, Yu X H, et al. 1:5000 digital geological survey and research report in Qiniangshan Mountain area of Dapeng Peninsula National Geonatural Park, Shenzhen[R]. Guangdong: Regional Geological Survey Team of Sichuan Geology and Mineral Exploration and Development Bureau 2020, 1-91.
- Yu, Y.; Yang, J.F. The Role and Practice of Geodiversity in Serving Ecosystems in China. Sustainability 2022, 14, 4547. [Google Scholar] [CrossRef]
- Zanne, A.E.; Tank, D.C.; Cornwell, W.K.; et al. Corrigendum: Three keys to the radiation of angiosperms into freezing environments. Nature 2014, 514, 394–394. [Google Scholar] [CrossRef]
- Zhang, L.; Guo, S.; Wu, B. The source, spatial distribution and risk assessment of heavy metals in soil from the Pearl River Delta based on the National Multi-Purpose Regional Geochemical Survey. PLoS One 2015, 10, e0132040. [Google Scholar] [CrossRef]
- Zhang Y, Sun J, Song X, et al. Revealing the main factors affecting global forest change at distinct altitude gradients. Ecological Indicators 2023, 148, 110131.
Disclaimer/Publisher’s Note: The statements, opinions and data contained in all publications are solely those of the individual author(s) and contributor(s) and not of MDPI and/or the editor(s). MDPI and/or the editor(s) disclaim responsibility for any injury to people or property resulting from any ideas, methods, instructions or products referred to in the content. |
© 2024 by the authors. Licensee MDPI, Basel, Switzerland. This article is an open access article distributed under the terms and conditions of the Creative Commons Attribution (CC BY) license (http://creativecommons.org/licenses/by/4.0/).
Copyright: This open access article is published under a Creative Commons CC BY 4.0 license, which permit the free download, distribution, and reuse, provided that the author and preprint are cited in any reuse.


