
Submitted:
29 November 2024
Posted:
29 November 2024
You are already at the latest version
Abstract
China has recently launched extensive marine ranching projects, highlighting the need for scien-tific evaluation of ecosystem structure and function to guide their development. This study estab-lished two energy flow models and an evaluation index system to assess the structure, function, carrying capacity, and ecological status of both a marine ranching ecosystem and a nearby control site in the Beibu Gulf. The results showed that the ranching ecosystem outperformed the control ecosystem in terms of food chain length, system size, and the ecological carrying capacity of eco-nomically important species. The ranching ecosystem was classified as "relatively good," while the control ecosystem was deemed "relatively poor," confirming the success of the ranching efforts. Mussels, large crabs, and Scorpaenidae were identified as key species for stock enhancement based on their biomass potential. Scenario simulations using Ecosim, driven by biomass and fishing factors, indicated that stock enhancement strategies targeting MOB (mussels, oysters, and barna-cles) significantly improved the ranching ecosystem, raising its status to "good." However, the simulations also revealed that stock enhancement had limited effects on optimizing food web structure, system organization, and energy transfer efficiency, suggesting that a combination of strategies is necessary for further improvement.
Keywords:
marine ranching
; stock enhancement
; index system
; carrying capacity
; scenarios simulation
1. Introduction
Inshore water areas provide a wide range of essential ecological services to humanity, including the provision of food and raw materials, environmental purification, climate regulation, and cultural enrichment [1,2]. Although they cover only 18% of the Earth's surface, these areas contribute to 25% of the planet's primary productivity and account for 90% of global fishery yields [3]. In particular, inshore waters are of vital importance to China, playing a critical role in ensuring food security and maintaining ecological balance [4,5]. However, in recent years, human activities such as industrialization, urbanization, agricultural expansion, and climate change have severely degraded China's inshore habitats and fishery resources, resulting in reduced fishery yields, diminished biodiversity, and the simplification of food webs [6].
In response to the challenges posed by the degradation of inshore ecosystems, China has proposed the establishment of a marine ecological civilization and implemented a range of measures aimed at protecting and restoring marine ecosystems. These initiatives include the restoration of nearshore environments, the development of marine ranching projects, the enforcement of seasonal fishing moratoriums, and the regulation of fishing vessels—efforts designed to enhance the stability, diversity, and sustainability of marine ecosystems [7,8,9]. Among these, the development of marine ranching projects is viewed as a key strategy for transforming and upgrading China’s marine fisheries while safeguarding the marine environment [10].
Unlike many other countries, China places greater emphasis on the development of artificial reefs, hatchery releases, and the establishment of online monitoring systems. The goal is to create a comprehensive industrial development framework for marine ranching that encompasses site selection, planning and layout, habitat restoration, resource conservation, and safety assurance [11]. Effective assessment of the structural and functional characteristics, as well as the carrying capacity of marine ranching ecosystems, is a fundamental prerequisite for the successful construction and management of marine ranching in China [6]. This is not only crucial for holistic planning but also for ensuring the scientific construction and management of these ecosystems [12,13,14]. Specifically, these assessments provide essential data to guide decisions on the construction area, type, and scale of marine ranching projects. For example, they help in selecting appropriate hatchery release species, estimating optimal stocking densities, and determining the appropriate scale for artificial reef construction [15,16,17,18,19]. Moreover, these assessments are critical for ensuring the long-term sustainability of marine ranching through effective management, which includes determining strategies for sustainable harvest based on carrying capacity [20,21,22].
Due to limitations in carrying capacity assessment technology, most marine ranching projects in China have not conducted comprehensive evaluations of carrying capacity [23]. Existing assessments have largely focused on biomass community structure, water quality, and the enhancement effects of individual species [18,24,25,26,27,28], with little attention to the overall performance of marine ranching systems [8,14,29]. Even system-level evaluations generally compare marine ranching with small adjacent areas, lacking a robust evaluation system and clear grading standards [28,30,31,32,33,34], which undermines the credibility of the results. As a result, most marine ranching projects rely heavily on empirical knowledge, with insufficient scientific foundations for selecting hatchery release species, estimating stocking densities, and designing habitat construction strategies. This leads to significant ecological and economic risks [6,14,35,36,37,38,39]. Therefore, there is an urgent need for the development of systematic evaluation and simulation methods for marine ranching ecosystems to enhance the scientific rigor and sustainability of marine ranching projects in China.
Ecological Network Analysis (ENA) is a systems-based methodology that quantifies the structure and function of marine ecosystems by analyzing the material and energy flow relationships among all components within the ecosystem food web [40,41,42,43,44,45,46,47,48]. This approach has proven to be a valuable tool for assessing ecosystem health and for linking ecological and socio-economic systems. It is widely applied in marine ecosystem management and ecological restoration, providing critical insights for decision-making and policy development [49,50,51].
The Ecopath with Ecosim (EwE) model is widely used to calculate ENA indices for marine ecosystems. It consists of three main components: Ecopath, Ecosim, and Ecospace. Ecopath is primarily employed to analyze the material and energy flows between various ecosystem components, while Ecosim simulates the dynamics of ecosystem food webs under different pressures. The EwE model has been extensively applied in recent studies to assess and simulate marine ranching ecosystems [52,53].
In this study, a marine ranching ecosystem and its control counterpart in the Beibu Gulf of China were selected as research subjects. Ecopath models were constructed for both ecosystems to evaluate their energy flow, trophic structure, and ecological carrying capacity. An index system based on ENA and a fuzzy comprehensive evaluation model was developed to assess the status of these ecosystems. SuiTable Atock enhancement groups for the marine ranching ecosystem were identified, and ecosystem dynamics were simulated under different stock enhancement strategies. This research aims to provide essential technical and theoretical support for the comprehensive evaluation and ecosystem-based stock enhancement of marine ranching. Furthermore, it seeks to contribute to the sustainable and high-quality development of marine ranching in the Beibu Gulf and across China.
2. Materials and Methods
2.1. Introduction of the Marine Ranching
The marine ranching, named “Jinggong”, is located to the southwest of the Guantou Ridge in Beibu Gulf, with coordinates ranging from 21°25'31.26″N to 21°25'58.96″N and from 108°54'15.39″E to 108°56'38.37″E. The specific location of the marine ranching is illustrated in Figure 1. Covering an area of 4.80 km², the marine ranching has an average water depth of approximately 9 meters. It was primarily established through artificial reef construction and hatchery releases. Moreover, an online environmental monitoring system has been implemented to track water quality. Since December 2020, approximately 20,000 cubic meters of artificial reefs have been deployed, categorized into four types, as shown in Figure 2, with materials predominantly composed of reinforced concrete. The control ecosystem is located about 2 kilometers south of the marine ranching.
2.2. Construction of Ecopath Models
2.2.1. Introduction of the Ecopath Model
Please refer to the Appendix A: Introduction of Ecopath model.
2.2.2. Survey of the Marine Environment
Surveys of the biotic and abiotic environment in the Jinggong marine ranching and control ecosystem were conducted in spring and autumn of 2023. Phytoplankton biomass was assessed by measuring chlorophyll a according to standard procedures [54]. Zooplankton samples were obtained through vertical tows using plankton nets with a mesh size of 169 µm. Benthic and swimming organisms in mud substrate areas were surveyed following the Specifications for Marine Surveys GB/T12763.6-2007. Swimming organisms and macrobenthos in reef areas were surveyed using SCUBA diving techniques for hand collection and video recording [32,55], meanwhile, sea urchins and gastropods were collected from reefs using 0.5 × 0.5 m quadrats, while attached organisms such as mussels, barnacles, and oysters were collected by scraping with a small knife. Hard-to-observe organisms, such as Charybdis japonica, were sampled using ground cage nets. Trawl surveys were also conducted around the reef area, with trawl data serving as an important supplement to ground cage net data. Taxa, biomass, and abundance of zooplankton, benthic, and swimming animals were measured for all collected samples.
2.2.3. Functional Group Division
Adhering to the functional group division principle of the Ecopath model [56], the marine ranching ecosystem was categorized into 23 functional groups, including pelagic fishes, large and medium demersal fishes, sparids, leiognathidae, small demersal fishes, corpaenidae, gobiidae, mantis shrimps, large crabs, other crabs, Metapenaeopsis Barbata, other shrimps, cephalopods, sea urchins, gastropods, barnacles, oysters, mussels, other bivalves, other benthos, zooplankton, phytoplankton, and detritus. The phytoplankton group served as the primary producer group, while all other groups functioned as consumers except for detritus. In contrast, the control ecosystem comprised 19 functional groups, exhibiting similar compositions to the marine ranching, but excluding sparids, barnacles, oysters, and mussels. The specific species of each functional group are listed in Appendix E: tables (Table A1 and Table A2).
2.2.4. Data Sources of Functional Groups
The Ecopath models were designed to model a period of 1 year. Biomass for each functional group was expressed as wet weight in t/km2. Input data for biomass (B), production to biomass ratios (P/B), consumption to biomass ratios (Q/B), and diet composition of each group were estimated using data obtained from field surveys and literature sources. The methods employed to acquire these data are detailed in the Appendix E: tables (Table A3). The diet composition of each consumer group was displayed in Table A4 and Table A5. The unassimilated ratio of consumption (Ui) for mussels, barnacles, oysters, and other bivalves was set at 0.40, while the group of other benthic organisms was set at 0.35, and all other consumer groups were set at 0.20 [56,57,58]. Fishery data were provided by the Qinzhou Agriculture and Rural Bureau of Guangxi Zhuang Autonomous Region.
2.2.5. Model Balancing and Uncertainty
We used the estimated ecotrophic efficiency (EE) value of each functional group (which was <1) in the first attempt to balance the model. If the estimated EE value exceeded 1, the consumed biomass was greater than that produced. When this occurred, the input data of the diet composition for each consumer group was modified with small changes, with each change not exceeding 0.05. Furthermore, we ensured that most of the P/Q values (the gross food conversion efficiency, the ratio between production and consumption) were in the range of 0.1−0.3. We also ensured that the respiration to assimilation (R/A) and production to respiration (P/R) ratios in the model were <1; the respiration to biomass (R/B) ratio was higher in active species than in sedentary groups [56,59,60]. The pre-balanced diagnosis was also used to identify issues in the model structure and in data quality before balancing the models [61].
2.3. Construction of Indices System
2.3.1. Description of ENA Indices
This study established an index system to evaluate the ecosystem status of marine ecosystems based on ENA indices. The ENA indices were categorized into three groups. Firstly, indices representing the function of the ecosystem include Detritivory/Herbivory (D/H), the average transfer efficiency among different trophic levels (TE), and relative ascendancy (A/C). Secondly, indices representing the characteristics of ecosystem food web structure include connectance index (CI), system omnivory index (SOI), Finn's cycling index (FCI), and average path length (APL) [62]. Lastly, indices representing the maturity of the ecosystem include total primary production/total respiration (TPP/TR), total primary production/total biomass (TPP/TB), and total biomass/total system throughput (TB/TST) (Table 1). The meanings of each index are described in Appendix C: Introduction of ecological network analysis indicators.
2.3.2. Classification of Ecosystem Status Levels
Due to the lack of historical data on ENA indices in the study areas, directly evaluating the current status of the ecosystems was challenging. An alternative approach was to establish standards through inter-ecosystem comparison. Therefore, published literature on ecosystem assessment based on ENA for the world's coastal marine ecosystems (139 ecosystems in total, including estuaries, bays, islands, straits, oyster reefs, artificial reefs, etc.) was collected as much as possible and presented in Appendix E: tables (Table A6). The ecosystems were divided into 5 levels using the quintiles method. For positive type indicators, where a higher value indicates better system performance, the first, second, third, fourth, and fifth quintiles denote the critical values for the “poor”, “relatively poor”, “medium”, “relatively good”, and “good” grades, respectively. For negative type indicators, where a higher value indicates worse system performance, the first, second, third, fourth, and fifth quintiles denote the critical values for the “good”, “relatively good”, “medium”, “relatively poor”, and “poor” grades, respectively (Table 2).
Among the indices, D/H, TE, TB/TST, CI, SOI, FCI, and APL indicate a better ecosystem status as their values increase. Regarding A/C, Ulanowicz et al. (2009) proposed that the optimal trade-off value is 0.4596 [63], values below this threshold are positively correlated with improved system performance. Since none of the cases examined in this study exceeded this threshold, A/C was considered a positive indicator. For TPP/TR and TPP/TB, values greater than 1 suggest lower ecosystem maturity. The weighting of the indicators follows the methodology outlined by Zeng et al. (2021) [64]. As some of the ecosim scenarios in our study did not include fishing activities, we excluded the indicator of mean TL of the catch, as considered by Zeng et al. (2021) [64], and proportionally redistributed its weight among the remaining ecosystem function indices.
2.3.3. Evaluation of the Ecosystem Status of the Ecosystems
Fuzzy comprehensive evaluation (FCE) was used to calculate the composite score of all indicators. The final evaluation result was determined based on the principle of maximum membership degree. The specific evaluation steps are referenced from the methods of Tobor-Kapłon et al. (2007), Dong et al. (2021), and Wu and Hu (2020) [65,66,67].
2.4. Evaluation of Ecological Carrying Capacity
Ecological carrying capacity is defined as the maximum biomass that functional groups within an ecosystem can sustain while maintaining energy balance [68]. The methods for evaluating the ecological carrying capacity were adapted from Jiang and Gibbs (2005) [69]. The biomasses of the target functional group were incrementally increased until the ecosystem became unbalanced. The critical point immediately before ecosystem disbalance was identified as the ecological carrying capacity. No parameters other than the biomass of the target functional group were manually altered during the calculation of ecological carrying capacity.
2.5. Evaluation of Stock Enhancement Potential and Selection of Stock Enhancement Groups
All functional groups in the marine ranching were categorized into three groups based on their trophic level (TL): TL 2.0-2.5, TL 2.5-3.0, and TL 3.0-3.5. The difference between the ecological carrying capacity and current biomass of each functional group was used to evaluate the stock enhancement potential, with a larger difference indicating higher stock enhancement potential. Preferably, groups with higher stock enhancement potential within each TL category were selected as stock enhancement groups. Additionally, the maturity of related enhancement technologies, such as seedling breeding and larval releasing, was considered crucial for selecting stock enhancement groups.
2.6. Simulation of Stock Enhancement Strategies
The Ecosim model was employed to simulate the dynamics of the ecosystem food web over the next 14 years under different stock enhancement strategies. In each simulation scenario, the Ecopath model from the tenth year was extracted to represent the new state of the ecosystem. The ecosystem status was then evaluated using the indices system based on the Ecopath model’s ENA indices.
2.6.1. Introduction of the Ecosim Model
Please refer to Appendix B: Introduction of the Ecosim model.
2.6.2. Construction of Ecosim Model
The vulnerability (v) index is a critical parameter in constructing the Ecosim model. Which determines whether the trophic control between predator and prey is a top-down, bottom-up, or intermediate effect. Due to the lack of historical survey data in the marine ranching, an empirical formula was applied to calculate the v index for each functional group [70]:
where TLi is the TL corresponding to functional group i. v settings ranging from 0 to 1, with 0.0–0.3 representing a bottom-up control, 0.3 representing the mixed control, and 0.3–1.0 describing a top-down impact [71]. The vi was then transformed to derive vnew for Ecosim input, which ranged from 1 to ∞:
Within the marine ranching ecosystem, oysters, barnacles, and mussels act as ecosystem engineers, enhancing the spatial complexity and heterogeneity of the habitat. They provide essential refuges, foraging, and reproductive spaces for organisms in the artificial reef area, which in turn influences the behavior and distribution of predators. These effects were incorporated into the simulations using mediation functions in Ecosim. Sigmoidal functions were used to modulate the predator-prey relationships through these mediation functions in this study. The specific mediation settings were determined based on methodologies outlined by Harvey (2014) and Sadchatheeswaran et al. (2020) [72,73].
2.6.3. Simulation Scenario Design
We assumed that the maximum biomass achievable by the selected stock enhancement group within the marine ranching ecosystem corresponds to the biomass at ecological carrying capacity. Therefore, setting the biomass of the stock enhancement group at ecological carrying capacity became one of the driving factors in establishing the Ecosim model. Additionally, fishing effort was also taken into account as a driving factor for model construction. Fishing data used to drive the model were obtained from the fishing efforts in the marine ranching during 2023.
Based on the selection of stock enhancement groups, three groups were chosen: mussels, large crabs, and scorpaenidae. Since the method for stock enhancement of mussels in marine ranching involved constructing artificial reefs, and both mussels and oysters would grow on the reef once deployed, these three groups, which shared similar ecological characteristics, were combined into one stock enhancement group (MOB).
Three single-group stock enhancement strategies were established for MOB, large crabs, and scorpaenidae, respectively. Additionally, four multiple-group stock enhancement strategies were set: MOB + large crabs, MOB + scorpaenidae, large crabs + scorpaenidae, and MOB + large crabs + scorpaenidae. For each stock enhancement strategy, two scenarios were simulated: with fishing and without fishing. Furthermore, one simulation scenario involving only fishing activity was also included. Therefore, a total of 15 simulation scenarios were conducted in this study (see Table 10).
3. Results
3.3. Trophic Structure
The TLs of functional groups in the marine ranching ecosystem ranged from 1 to 3.46 (Table 3, Table 4). Sparids exhibited the highest TL, followed by large and medium-sized demersal fishes and scorpaenidae (3.42 and 3.27, respectively). Additionally, cephalopods, small-sized demersal fishes, and mantis shrimps also displayed relatively high TLs (3.28, 3.22, and 3.22, respectively). Conversely, oysters and mussels had low TLs, both at 2.02. In the control ecosystem, functional groups exhibited TLs ranging from 1 to 3.63, with sparids being the highest, followed by large and medium-sized demersal fishes and cephalopods (3.35 and 3.25, respectively). Scorpaenidae and small-sized demersal fishes also had relatively high TLs (3.30 and 3.16, respectively).
The TL I comprised phytoplankton and detritus, TL II mainly consisted of shellfish, barnacles, shrimps, zooplankton, and sea urchins, while TL III mainly consisted of fish, cephalopods, mantis shrimps, and crabs in both ecosystems. Mussels had the highest biomass in TL II (80.40 t/km2), followed by barnacles (30 t/km2), while sparids had the highest biomass in TL III (0.33 t/km2), followed by large crabs and other crabs (both at 0.30 t/km2) in the marine ranching ecosystem. The total biomass distributed among TLs I, II, and III in the marine ranching ecosystem was 60.29, 153.17, and 1.92 t/km2, respectively, compared to 65.67, 7.00, and 1.26 t/km2, respectively, in the control ecosystem. The phytoplankton showed the highest biomass in the control ecosystem (24.64 t/km2).
3.4. Energy Flow Structure
The EE values of functional groups in the two ecosystems are presented in Table 3 and Table 4. In the marine ranching ecosystem, large crabs, mantis shrimps, and cephalopods exhibited high EE values of 0.92, 0.86, and 0.80, respectively. Conversely, sea urchins, barnacles, oysters, and mussels displayed very low EE values due to their high biomass and lack of predators. Shrimps exhibited the highest EE value (0.96) in the control ecosystem, followed by other bivalves, other crabs, M. barbata, and other benthic organisms, with EE values of 0.95, 0.92, 0.91, and 0.89, respectively. Leiognathidae, zooplankton, and detritus had very low EE values (0.01, 0.07, and 0.09, respectively).
The energy flow among TLs in the two ecosystems is depicted in Figure 3. Approximately 2152.00 and 2365.00 t/km2/a of energy flowed to TL II in the marine ranching and control ecosystems, respectively, accounting for 68.00% and 16.00% of their total primary production, respectively. The transfer efficiency between TL II and III, III and IV were both 4.00% in the marine ranching ecosystem, while in the control ecosystem, they were 4.00% and 11.00%, respectively. The average transfer efficiency among TLs II to V was 5.84% and 6.47% in the marine ranching and control ecosystems, respectively.
3.5. Ecosystem Attributes
The metrics of total system throughput (TST), total production, and total biomass—key indicators of ecological size—were 2.75, 1.40, and 5.56 times higher, respectively, in the marine ranching ecosystem compared to the control ecosystem (Table 5). In the marine ranching ecosystem, the proportion of total consumption to TST was the highest at 39.06%, followed by the flow to detritus, which accounted for 30.56% of TST. In contrast, in the control ecosystem, the highest proportion was the flow to detritus at 72.59% of TST, followed by total consumption, which accounted for 19.08%.
3.6. Ecosystem Status
The values of ENA indices of the marine ranching and control ecosystems are presented in Table 6. The evaluated results of the ecosystem status of the marine ranching and control ecosystems are presented in Table 7. The ecosystem status of the marine ranching ecosystem was rated as “relatively good”. Specifically, the FCI was classified as “good”, while the FML, TPP/TR, TPP/TB, and TB/TST were classified as “relatively good”. The CI and D/H were classified as “medium”, and the SOI, A/C, and TE were classified as “relatively poor”. In contrast, the ecosystem status of the control ecosystem was rated as “relatively poor”. Specifically, the CI and SOI were classified as “relatively good”, while D/H was classified as “medium”. Furthermore, FCI, FML, A/C, TPP/TR, and TPP/TB were all classified as “relatively poor”.
3.7. Ecological Carrying Capacity and Stock Enhancement Potential
The ecological carrying capacity of the two ecosystems is detailed in Table 8. Notably, the functional groups within the marine ranching system exhibited generally higher carrying capacities compared to those in the control ecosystem. Mussels displayed the highest carrying capacity within the marine ranching at 163 t/km2, closely followed by oysters at 96 t/km2. Pelagic fishes emerged as the group with the highest carrying capacity among fish species. Conversely, the control ecosystem's highest carrying capacity was observed with shrimps at 0.95 t/km2, followed by large and medium-sized demersal fishes at 0.48 t/km2.
The stock enhancement potential of economic functional groups within the marine ranching system was estimated based on the disparity between carrying capacity and current biomass (Table 9). Among groups with TLs of 3.0 - 3.5, gobiidae exhibited the highest stock enhancement potential, followed by scorpaenidae. In the TL range of 2.5 - 3.0, pelagic fishes demonstrated the greatest potential, followed by large crabs. For TLs between 2.0 and 2.5, mussels showcased the highest potential, followed by oysters.
Currently, there are no effective stock enhancement technologies available for gobiidae and pelagic fishes. However, seedling breeding and larval releasing technologies for large crabs (mainly composed of Portunus trituberculatus) and scorpaenidae (mainly composed of Epinephelus moara) have reached a mature stage [74,75], this study opted for large crabs and scorpaenidae as suitable candidates for stock enhancement. Moreover, the enhancement of mussels is primarily hindered by the limited availability of hard substrate within marine ranching. Therefore, constructing artificial reefs can effectively enhance mussel populations. Recognizing that mussels, oysters, and barnacles (MOB) thrive upon the deployment of artificial reefs, these three groups were amalgamated into a single stock enhancement group, with an estimated carrying capacity of 218.06 t/km2.
3.8. Ecosystem Dynamics Under Different Stock Enhancement Strategies
The Ecosim model was employed to simulate the dynamics of the marine ranching ecosystem under various stock enhancement scenarios for the forthcoming 14 years. The outcomes are illustrated in Appendix F: Figures (Figure A1, Figure A2, Figure A3, Figure A4, Figure A5, Figure A6, Figure A7, Figure A8, Figure A9, Figure A10, Figure A11, Figure A12, Figure A13, Figure A14 and Figure A15). Table 10 and Table 11 present the ecosystem status of the marine ranching system at the tenth year of modeling. The results revealed that in scenarios involving fishing alone, stock enhancement of MOB + fishing, scorpaenidae + fishing, and MOB + scorpaenidae + fishing, large crabs experienced a rapid decline in biomass to zero. Similarly, in scenarios of large crabs + fishing and large crabs + scorpaenidae + fishing, the biomass of large and medium demersal fishes also decreased to zero. These observations suggest a collapse in the energy flow structure within these scenarios. Consequently, only the ecosystem status of predicted scenarios without such collapse can be effectively evaluated using the index system. The evaluated results indicate that in scenarios involving the stock enhancement of MOB, MOB + large crabs, MOB + large crabs + fishing, MOB + scorpaenidae, MOB + scorpaenidae + fishing, MOB + large crabs + scorpaenidae, and MOB + large crabs + scorpaenidae + fishing, the ecosystem status notably improved to a "good" level. Specifically, there was a significant decrease in the indices of TPP/TR and TPP/TB, accompanied by a significant increase in FCI and FML, while other indices displayed minimal changes.
4. Discussion
In China, the primary objective behind constructing marine ranching was to restore the marine environment and ensure the sustainable yield of fishery resources [76]. Following almost four years of development, the Jinggong marine ranching has experienced significant transformations in both biotic community composition and system functionality compared to the control ecosystem. The biomasses of fish, crustaceans, and mollusks within the marine ranching are 1.82, 16.99, and 33.51 times greater, respectively, than those observed in the control ecosystem. The substantial increase in mollusk biomass can be primarily attributed to the deployment of artificial reefs, which serve as crucial substrates for attached organisms like mussels and oysters [77,78,79]. The robust filter-feeding and biodeposition activities of mussels and oysters contribute significantly to nutrient enrichment in the benthic environment surrounding the artificial reefs [80]. Furthermore, the pronounced spatial heterogeneity offered by artificial shellfish reefs provides effective refuge and foraging grounds for marine organisms. This dynamic supports the growth and reproductive success of various organisms, including echinoderms, crustaceans, and fishes inhabiting the reef area [81,82].
SOI and CI serve as crucial indicators of ecosystem food web complexity. In the marine ranching and control ecosystems, CI values were 0.28 and 0.32, respectively, while SOI values were 0.13 and 0.21, respectively. Comparatively, the CI in the marine ranching system was rated at a “medium” level in relation to coastal marine ecosystems collected in this study, while the SOI was rated as “relatively poor”. Moreover, both CI and SOI values were notably lower compared to small marine ecosystems (1−10 km2) investigated by Heymans et al. (2014) [47]. CI reflects the ratio of actual links to potential links within an ecosystem’s food web, whereas SOI delineates the distribution of feeding interactions across TLs (Christensen et al., 2005; Libralato, 2008) [45,56]. SOI compensates for the limitations of CI in delineating food web complexity, especially given that CI remains constant despite variations in prey proportions within predator diets [56,83]. The low SOI observed in the marine ranching ecosystem suggests weak connections among functional groups, potentially resulting in lower energy flux and a simplified food web structure. The lower CI and SOI in marine ranching compared to the control ecosystem may stem from increased biomasses of mollusk, echinoderm, and barnacles. The simpler diets of these species contribute to a less complex food web structure. The increased biomass of these groups also contributed to increased EE values for phytoplankton and detritus within the marine ranching ecosystem, resulting in a notable enhancement of energy utilization efficiency between TLs I and II. However, despite these improvements, the TE values among TLs II to V remained notably low, averaging 5.84%. This level was classified as “relatively poor” according to the index system, falling far below the natural ecosystem average of 10% [84].
A/C serves as an indicator of ecosystem organization and efficiency. Both ecosystems in this study were classified at the “relatively poor” level, suggesting diminished organization and system efficiency. The observed low A/C value in the marine ranching ecosystem may be attributed to the fact that increasing system organization levels hinge on the succession of community structure, a process that typically unfolds over an extended period [85,86]. Additionally, external disturbances can also disrupt the self-organization process of the ecosystem [87], thereby impeding improvements in its organizational levels.
The low complexity of the food web, TE, and A/C values in marine ranching suggest that this system may be subject to significant external pressures [47,88,89,90], resulting in the majority of TST occurring at low TLs. Overfishing emerges as a prominent source of pressure among various external stressors. Indeed, overfishing has led to a severe decline, and in some cases depletion, of large carnivorous fish in China's coastal ecosystems [6,91], echoing the phenomenon of “fishing down the marine food web” observed in diverse contexts [92,93,94]. Modeled results from Ecosim in this study indicate that large crabs in the marine ranching are subject to overfishing. Chen et al. (2008) similarly observed overfishing in the Beibu Gulf [95]. Fishing activities in areas adjacent to marine ranching may adversely affect marine ranching. The migration patterns of many marine creatures within and around these ranches, particularly for type II and III fish species that only spend part of their lifecycle in the ranches, expose them to significant fishing risks during their movement between regions [14,96,97,98]. Considering the diverse habitat requirements of marine creatures at different life stages, proposals such as those by Yang and Ding (2022) are noteworthy [99]. They suggest constructing global aquatic ecological ranching systems that designate entire estuaries or bays as ranching areas. Similarly, Liang et al. (2020) propose developing marine ranching facilities designed to meet all habitat needs across different life stages of fish [98]. In the long term, these proposals hold the potential to mitigate challenges faced by marine ranching, including strong external disturbances and difficulties in maintaining a complex food web structure and high system organization levels.
The TPP/TR and TPP/TB ratios in the marine ranching and control ecosystems were 1.82 and 8.93, and 17.27 and 85.22, respectively. These values in the marine ranching were rated as “good”, whereas those in the control ecosystem were deemed “relatively poor”. Additionally, the D/H ratio in marine ranching exceeded that in the control ecosystem. These findings suggest that the establishment of marine ranching has significantly enhanced ecosystem maturity and stability [100,101]. Despite comparable total primary production in both ecosystems, the decline in TPP/TR and TPP/TB ratios can be attributed to increases in total biomass and total respiration. Notably, in marine ranching, filter-feeding bivalves accounted for the largest portion of both total biomass and total respiration. These bivalves exhibit ecological characteristics similar to those of zooplankton, but with lower turnover rates. While zooplankton can quickly respond to ecosystem disturbances, bivalves exhibit slower responses, thus creating a pathway for slow energy flow. The asynchronous dynamics of bivalves and zooplankton likely play a pivotal role in sustaining ecosystem stability [102].
The evaluation based on the index system revealed that the ecosystem status in marine ranching was “relatively good”, contrasting with the “relatively poor” status of the control ecosystem. Notably, marine ranching's maturity indices, such as TPP/TR, TPP/TB, and TB/TST, significantly outperformed those of the control ecosystem. Furthermore, indices like FCI and FML demonstrated marked improvements, indicating that marine ranching enhances system maturity, energy recycling efficiency, and food chain length. Moreover, metrics such as TST, total production, and total biomass in marine ranching were 2.75, 1.40, and 5.56 times higher, respectively, than those in the control ecosystems. The carrying capacities for fish, crustaceans, and shellfish have also significantly increased in marine ranching areas, underscoring the positive impacts of marine ranching construction efforts. However, despite these achievements, the construction efforts have yet to effectively improve metrics such as TE, the level of system organization, and food web complexity.
Stock enhancement serves as a pivotal approach to improving marine environments and achieving sustainable utilization of fishery resources [103]. However, the efficacy of stock enhancement in restoring marine resources varies across different initiatives [18,104,105,106,107]. Some studies even contend that this method is entirely ineffective [108]. Simulation scenarios conducted in this study revealed that stocking single fish or crab species did not notably optimize the ecosystem. However, the stock enhancement of the bivalve-dominated MOB group enhanced the ecosystem status from “relatively good” to “good”. This may be attributed to the higher enhancing capacity of MOB compared to crab and fish groups. Additionally, the augmentation in biomasses of mussels, barnacles, and oysters expanded shellfish reefs, providing increased refuge and food resources for crustaceans, cephalopods, fish, and other organisms [79]. This indirect effect also contributed positively to optimizing the ecosystem status.
Yang et al. (2023) demonstrated that stock enhancement of multiple species may have better ecological effects than single-species stock enhancement [109]. This finding aligns with the results of our study. For instance, in scenarios involving single-group stock enhancement of crab, fish, and the MOB group alongside fishing activities, the populations of large crabs or large and medium demersal fishes rapidly collapsed. Conversely, in scenarios combining MOB with crab and fishing, or MOB with crab, fish, and fishing, all functional groups maintained relatively stable biomasses, leading to an increase in ecosystem status to a higher level (from “relatively good” to “good”). These findings suggest that stock enhancement involving multiple species from different TLs represents a more effective strategy for optimizing ecosystem structure and function. However, it is important to note that maintaining the biomass of stock enhancement groups at the group’s carrying capacity in simulation scenarios may not fully reflect real-world conditions. This is because the carrying capacity of each functional group is dynamically influenced by external factors, such as climate change and human activities [20]. To improve ecological outcomes, it is essential to strengthen research on the dynamics of ecological carrying capacity in marine ranching and adjust stock enhancement strategies accordingly [19,110,111]. Moreover, enhancing activities aimed at boosting the biomass of stock enhancement groups to carrying capacity levels may pose ecological risks, potentially pushing the ecosystem toward a critical state of energy imbalance. Integrating the ecological roles of different organisms and implementing multi-species stock enhancement [107], or reducing the stocking density of target organisms, can help mitigate these risks.
In scenarios focused on MOB (excluding MOB + fishing and MOB + fish + fishing), the ecosystem status was elevated to a “good” level, indicating that ecosystem structure and function were effectively optimized compared to the initial state. However, this does not imply that the ecosystem has reached an ideal or perfect state. The index system we constructed in this study provides a general overview of coastal ecosystems, and achieving a 'good' level does not necessarily align with the standards of mature ecosystems as described by Odum (1969) [100]. For example, values of TE, A/C, CI, and SOI showed only slight changes in these scenarios, remaining at “relatively poor” or “medium” levels. This indicates that the simulated stock enhancement strategies had a limited impact on optimizing the food web structure, system organization level, and energy transfer efficiency. This finding aligns with the conclusions of Yang et al. (2023) [112], who reported that stock enhancement did not significantly increase ecosystem species diversity, and its restoration effects were limited. It can be inferred that stock enhancement of only a few species may not be sufficient to fully optimize system structure and function. In line with this, Deevesh et al. (2024) emphasized the importance of prioritizing protection and natural recovery to enhance ecosystem structure and function [113]. To truly optimize the structure and function of marine ranching ecosystems, it is crucial to adopt a more integrated approach that includes strengthening ecological connectivity between marine ranching and adjacent areas, improving fishing management strategies, and advancing the design and deployment of artificial reefs [22,114,115]. When implemented together, these measures could provide a more sustainable and holistic framework for ecosystem restoration and management in marine ranching [22,114,115].
5. Conclusions
In this study, we developed two Ecopath models to assess the energy flow and trophic structure of both marine ranching and control ecosystems. Additionally, we established an index system based on ENA and the fuzzy comprehensive model, incorporating ENA data from 139 coastal marine ecosystems, to evaluate the ecosystem status. The results provide valuable insights for the ongoing development of marine ranching initiatives. Importantly, this index system addresses the challenge of lacking reliable standards for evaluating marine ranching ecosystems, offering a methodological framework that can support the assessment of other marine ranching projects in China. The ecosystem status was rated as “relatively good” in the marine ranching ecosystem and “relatively poor” in the control ecosystem. TST, total production, total biomass, and ecological carrying capacity of economic groups were significantly higher in the marine ranching ecosystem compared to the control, indicating the success of the construction efforts. Based on their biomass enhancement potential, mussels, large crabs, and scorpaenidae were identified as the most suiTable Apecies for stock enhancement. Future research should focus on determining optimal stocking densities by accounting for the mortality rates and growth characteristics of stock enhancement species. The scenario simulations conducted using Ecosim revealed that stock enhancement strategies involving MOB (excluding MOB + fishing and MOB + fish + fishing) elevated the status of marine ranching to a “good” level. Furthermore, enhancing multiple species simultaneously appears to yield better ecological outcomes than focusing solely on single-species stock enhancement. In the simulation scenarios, the biomasses of stock enhancement groups were assumed to reach their carrying capacity levels, which may not fully reflect real-world conditions. Future research should focus on exploring the dynamics of ecological carrying capacity across different temporal scales and adjusting stock enhancement strategies accordingly to achieve the most effective ecological outcomes. The scenario simulations suggest that stock enhancement involving only a few species is insufficient to fully optimize ecosystem structure and function. To address this limitation, future research should adopt a more integrated approach, focusing on strengthening protection and management strategies, as well as advancing the design and deployment of artificial reefs. These measures could play a pivotal role in enhancing ecosystem structure and function, ultimately ensuring the long-term sustainability and resilience of marine ranching ecosystems.
Author Contributions
Investigation, Methodology, Writing - original draft, J. F. and H.L.; Methodology, Writing - original draft, L.J. and H.Y.; Data curation, Methodology, Writing- review & editing, C.Y., X.L. Zhao, J.Y., and Y. L.; Investigation, Methodology, C.C., Y.F., X.L. Wang, and Y.J.; Supervision, Conceptualization, Writing- review & editing, J.L., T.Z. All authors have read and agreed to the published version of the manuscript.
Funding
This research was funded by the National Key R&D Program of China(2022YFD2401301), the Primary Research and Development Plan of Guangxi Province (Grant No. AB21220064), National Natural Science Foundation of China (Grant No. 42106102 and 42306151), the program supported by China National Offshore Oil Corporation Marine Environment and Ecological Protection Public Welfare Foundation (Grant No. CF-MEEC/TR/2024-5), the program supported Key Laboratory of Ecological Prewarning, Protection and Restoration of Bohai Sea, Ministry of Natural Resources (Grant No. 2023109).
Institutional Review Board Statement
This study was reviewed and approved by the Experimental Animal Ethics Committee of Institute of Oceanology, Chinese Academy of Sciences.
Informed Consent Statement
Not applicable.
Data Availability Statement
The original contributions presented in the study are included in the article and supplementary material; further inquiries can be directed to the corresponding authors.
Conflicts of Interest
The authors declare no conflicts of interest.
Appendix A. Introduction of Ecopath Model
The Ecopath model is commonly used to quantitatively estimate mass transfer and energy flow in an ecosystem [56,71]. According to thermodynamic theories, the energy input and output of a certain biological functional group should be balanced, with productivity equaling the sum of mortalities (Equation 1). Another equation was used to determine the inner mass balance of the group (Equation 2), where the consumption (Q) of each group was equal to the sum of the production (P), respiration (Ri), and unassimilated food (Ui) of the group. The equations are as follows:
where Bi is the biomass of functional group i, (P/B)i is the production ratio, (Q/B)i is the consumption ratio, EEi is the ecotrophic efficiency (the proportion of production utilized in the system), DCij is the proportion of prey i in the diet of predator j, Yi is the fishery mortality, BAi is the biomass accumulation rate, and Ei is the net migration rate. In the parameter input process, Bi, (P/B)i, (Q/B)i, and DCij are required. If one of the first three values is missing, the corresponding EE value can be designated. In addition, Ei and catches are also required.
Appendix B. Introduction of the Ecosim model
Ecosim is a time-scale based dynamic model based on Ecopath [71]. It incorporates a time-dynamic aspect by varying the Ecopath model over time increments, simulating systemic response changes over the time series. The equation used is as follows:
where Bi is the biomass of functional group i, (P/B)i is the production ratio, (Q/B)i is the consumption ratio, EEi is the ecotrophic efficiency (the proportion of production utilized in the system), DCij is the proportion of prey i in the diet of predator j, Yi is the fishery mortality, BAi is the biomass accumulation rate, and Ei is the net migration rate. In the parameter input process, Bi, (P/B)i, (Q/B)i, and DCij are required. If one of the first three values is missing, the corresponding EE value can be designated. In addition, Ei and catches are also required.
where dBi/dt is the rate of change in biomass, gi is the net growth efficiency, Qji is the consumption rate of function group j to function group i, Ii is the emigration rate, Fi is the fishing mortality rate, Moi is the non-predatory natural mortality, ei is the move-in rate, and Bi is the biomass of functional group i [56].
The Ecosim models use foraging arena theory’s where each predator/prey interaction is defined by vulnerability parameters that affect the predator consumption rate (Equation Q) to describe the top-down and bottom-up controls of the predator/prey interactions. Vulnerability parameters can range between 1 and infinity, with 2 as the default. For each predator-prey interaction consumption rates, Qij, are calculated as:
where aij is the effective search rate for predator j feeding on a prey i, vij is vulnerability expressing the rate with which prey i move between being vulnerable and not-vulnerable, B, is prey biomass, Pj is predator biomass (or abundance for split groups), Ti represents prey relative feeding time, Tj is predator relative feeding time, Mij are the mediation forcing effects, and Dj represents handling time as a limit to consumption rate [117,118]. [f(Env_function, t)]is the environmental response function that restricts the size of the foraging arena to account for external environmental drivers changing over time [117].
Appendix C. Introduction of Ecological Network Analysis Indicators
D/H reflects the ratio of the transfer of flows (carbon, energy, or nutrients) from detritus or autotrophs to trophic level II in a food web [48]. A high D/H value indicates a shift to a more detritus-based food web, which indicates more maturity, stability, and a more resilient ecosystem.
TE is derived from the logarithmic mean of the efficiencies of the trophic levels between II and IV. A high TE value is characteristic of a mature ecosystem or of an oligotrophic ecosystem with scarce elements. Various disturbances such as species invasions and eutrophication would lower the TE value [48].
The ratio of ascendency or overhead to system throughput is derived from information theory as a measure of the average mutual information in a system and could also be a measurement of ecosystem growth and development. Relative Ascendency (A/C) is an index of the organization of a food web and concerns the efficiency of an organization. A/C is higher when pathways are few in number and transport most of the material. The highest theoretical value of ascendency can be achieved when all system components only have a single input and output [90]. The opposite of A/C is the O/C for two values that add up to 1. The latter represents redundant flows, which are additional (parallel) pathways between nodes [119]. As a high A/C indicates high efficiency and a high O/C indicates high resilience, a tradeoff or balance between A/C and O/C (efficiency vs resilience) exists, which leads to the interpretation that a good ecosystem consists of different types of pathways, some of which are efficient while others are redundant. Since the O/C and A/C are mutually exclusive, only A/C is selected as an indicator.
The CI and SOI are important indices that are used to describe food web features. High values of CI and SOI could reflect a high diversity of diet composition, while low values indicate a linear food web pattern rather than a web-like structure. FCI represents the fraction of an ecosystem throughput that is recycled compared with total throughput. It is assumed that mature systems show a higher degree of recycling than immature systems [120]. A high cycling index increases a system’s maturity and stability. The higher the cycling index, the more the ecosystem is released from stress. Finn’s mean path length (FML) measures the mean number of groups that a unit of flux will experience from its entry into the system until it leaves the system. As the diversities of flows and cycling are expected to increase with maturity, it is assumed that the FML will be higher in a more mature system.
The TPP/TR and TPP/TB ratios are both significant parameters that reflect the maturity of an ecosystem. When an ecosystem develops into maturity, the TPP/TR ratio approaches 1 and the TPP/TB ratio decreases. While in ecosystems suffering from organic pollution, this ratio of TPP/TR is expected to be less than 1 [56,100]. The TB/TST value is directly proportional to system maturity. This ratio tends to be low in developing ecosystems and increases with the maturity and stability of the system [71].
Appendix D. Data Sources for the Ecopath Models of the Marine Ranching and Control Ecosystems
The data sources of B, P/B, Q/B and diet composition of each group in the two ecosystems were described in Table A3.
Appendix E. Tables

Table A1.
Trophic groups and main species included in the marine ranching ecosystem Ecopath model.
| Numbers | Functional groups | Maine species |
|---|---|---|
| 1 | Pelagic fishes | Konosirus punctatus, Thryssa dussumieri,Trachinotus ovatus |
| 2 | Large and medium demersal fishes | Sillago sihama, Alepes djedaba, Scatophagus argus, Takifugu alboplumbeus, Saurida elongate, Lagocephalus spadiceus, Ilisha melastoma, Ilisha elongate, Planiliza affinis |
| 3 | Sparids | Plectorhinchus lineatus, Acanthopagrus latus, Evynnis cardinalis, Jaydia lineata |
| 4 | Leiognathidae | Equulites rivulatus, Leiognathus brevirostris, Leiognathus berbis |
| 5 | Small demersal fishes | Pennahia anea, Psenopsis anomala, Callionymus curvicornis, Solea ovata, Johnius belangerii, Johnius fasciatus, Osteomugil strongylocephalus, Sardinella albella, Pennahia macrocephalus |
| 6 | Scorpaenidae | Vespicula trachinoides, Sebastiscus marmoratus |
| 7 | Gobiidae | Cryptocentrus russus, Parachaeturichthys polynema, Amoya caninus, Tridentiger obscurus, Myersina filifer |
| 8 | Mantis shrimps | Oratosquilla oratoria |
| 9 | Large crabs | Charybdis japonica, Portunus trituberculatus, Portunus pelagicus |
| 10 | Other crabs | Pilumnopeus eucratoides, Charybdis helleri, Parthenope Validus, Charybdis acuta, Thalamita sima, Dorippe facchino, Halimede ochtodes |
| 11 | Metapenaeopsis barbata | M. barbata |
| 12 | Other shrimps | Alpheus hoplocheles, Marsupenaeus japonicus, Trachypenaeus curvirostris, Metapenaeus intermedius, Parapenaeopsis hungerfordi Alcock |
| 13 | Cephalopods | Loliolus japonica |
| 14 | Sea urchins | Anthocidaris crassispina, Hemicentrotus pulcherrimus |
| 15 | Gastropods | Patelloida pygmaea, Nassarius semiplicatus, Turritella terebra bacillum, Cellana toreuma, Murex trapa |
| 16 | Barnacle | Amphibalanus reticulatus |
| 17 | Oysters | Crassostrea gigas, Ostrea denselamellosa |
| 18 | Mussels | Perna viridis |
| 19 | Other bivalves | Dosinia aspera, Timoclea scabra, Vepricadium coronatum, Lucina scarlatoi, Clausinella isabelline, Ruditapes variegatus |
| 21 | Other benthos | Anthopleura xanthogrammica |
| 22 | Zooplankton | Paracalanus parvus, Parvocalanus carssirostris, Oithona nana, Corycaeus dahli, Corycaeus affinis |
| 23 | Phytoplankton | Chaetoceros lorenzianus, Eucampia cornuta, Eucampia zoodiacus, Stephanopyxis palmeriana, Chaetoceros constrictus |
| 24 | Detritus | Detritus in water, detritus in sediment |
Table A2.
Trophic groups and main species included in the control ecosystem Ecopath model.
| Numbers | Functional groups | Maine species |
|---|---|---|
| 1 | Pelagic fishes | Konosirus punctatus |
| 2 | Large and medium demersal fishes | Sillago sihama, Scatophagus argus, Trichiurus japonicus, Nematalosa japonica, Atule mate, Lagocephalus spadiceus, Ilisha elongata |
| 3 | Sparids | Lutjanus erythropterus, Evynnis cardinalis |
| 4 | Leiognathidae | Leiognathus brevirostris, Equulites rivulatus |
| 5 | Small demersal fishes | Pennahia anea, Psenopsis anomala, Callionymus curvicornis, Johnius belangerii, Johnius fasciatus, Osteomugil strongylocephalus |
| 6 | Scorpaenidae | Sebastiscus marmoratus |
| 7 | Gobiidae | Cryptocentrus russus, Trypauchen vagina, Odontamblyopus lacepedii, Parachaeturichthys polynema, Amoya caninus, Myersina filifer |
| 8 | Mantis shrimps | Oratosquilla oratoria |
| 9 | Large crabs | Portunus pelagicus |
| 10 | Other crabs | Charybdis hellerii, Charybdis acuta, Thalamita sima, Pilumnopeus eucratoides |
| 11 | Metapenaeopsis barbata | M. barbata |
| 12 | Other shrimps | Marsupenaeus japonicus, Trachypenaeus curvirostris |
| 13 | Cephalopods | Loliolus japonica |
| 14 | Gastropods | Architectonica perspectiva |
| 15 | Bivalves | Vepricadium coronatum, Trapezium sublaevigatum, Scapharca anomala |
| 16 | Other benthos | |
| 17 | Zooplankton | Paracalanus parvus, Parvocalanus carssirostris, Paracalanus nanus, Corycaeus dahli, Oithona attenuata |
| 18 | Phytoplankton | Chaetoceros constrictus, Thalassionema nitzschioides, Odontella sinensis, Bacteriastrum furcatum Shadbolt, Thalassionema nitzschioides |
| 19 | Detritus | Detritus in water, detritus in sediment |
Table A3.
Data sources of B, P/B, Q/B and diet composition of each group in the marine ranching and control ecosystems.
Table A3.
Data sources of B, P/B, Q/B and diet composition of each group in the marine ranching and control ecosystems.
| Functional groups | B | PB | QB | Diets |
|---|---|---|---|---|
| Pelagic fishes | By trawl nets in non-reef area, SCUBA videos in reef area. Trawl nets near reef were also conducted for correction of video data. | Estimated according to empirical formula [121] | Estimated according to empirical formula [125] | [127,128] |
| Large and medium demersal fishes | Same as pelagic fishes | Estimated according to empirical formula [121] | Estimated according to empirical formula [125] | [129,130,131,132] |
| Sparids | Same as pelagic fishes | Estimated according to empirical formula [121] | Estimated according to empirical formula [125] | [133,134] |
| Leiognathidae | Same as pelagic fishes | Estimated according to empirical formula [121] | Estimated according to empirical formula [125] | [135] |
| Small demersal fishes | Same as pelagic fishes | Estimated according to empirical formula [121] | Estimated according to empirical formula [125] | [16,116,136,137] |
| Scorpaenidae | Same as pelagic fishes | Estimated according to empirical formula [121] | Estimated according to empirical formula [125] | [138] |
| Gobiidae | Same as pelagic fishes | Estimated according to empirical formula [121] | Estimated according to empirical formula [125] | [139,140,141] |
| Mantis shrimps | By trawl nets in non-reef area, cage nets in reef area [32]. Trawl nets and cage nets near reef were also conducted for correction of cage nets data. | Estimated according to empirical formula [122] | By measuring the R/B first [126], then the Q/B was calculated according to: Q/B = P/B + R/B + U/B. U = 0.2Q [58], U/B = 0.2Q/B. | [142] |
| Large crabs | Same as mantis shrimps | Estimated according to empirical formula [122] | Same as mantis shrimps | [143] |
| Other crabs | Same as mantis shrimps | Estimated according to Empirical formula [122] | Same as mantis shrimps | [144] |
| Metapenaeopsis barbata | Same as mantis shrimps | Estimated according to Empirical formula [122] | Same as mantis shrimps | [145] |
| Other shrimps | Same as mantis shrimps | Estimated according to Empirical formula [122] | Same as mantis shrimps | [146] |
| Cephalopods | Same as mantis shrimps | Estimated according to Empirical formula [122] | Same as mantis shrimps | [147] |
| Sea urchins | By SCUBA grasping with a 0.5 × 0.5 m quadrats | Estimated according to Empirical formula [122] | Same as mantis shrimps | [148] |
| Gastropods | Same as sea urchins | Estimated according to Empirical formula [122] | Same as mantis shrimps | [149] |
| Barnacle | By SCUBA grasping with a 0.5 × 0.5 m quadrats, samples were oysters were collected by using a small knife | Estimated according to Empirical formula [122] | Same as mantis shrimps | [150] |
| Oysters | Same as barnacle | Estimated according to Empirical formula [122] | Same as mantis shrimps | [32] |
| Mussels | Same as barnacle | Estimated according to Empirical formula [122] | Same as mantis shrimps | [32] |
| Other bivalves | By collecting the samples with a sediment sampler | Estimated according to Empirical formula [122] | Same as mantis shrimps | [151] |
| Other benthos | By collecting the samples with a sediment sampler | Estimated according to Empirical formula [122] | By measuring the R/B first [126], then the Q/B was calculated according to: Q/B = P/B + R/B + U/B. U = 0.35Q [58], U/B = 0.35Q/B. | [151] |
| Zooplankton | By vertical towing using plankton nets | [123] | Obtained from Duan et al. (2009) [123] | |
| Phytoplankton | Calculated according to Chl a [54] | [124] | ||
| Detritus | Estimated according to empirical formula [83] |
Note: B: biomass; P/B: production/biomass; Q/B: consumption/biomass.
Table A4.
Diet matrix of the marine ranching ecosystem.
| Numbers | Prey \ predator | 1 | 2 | 3 | 4 | 5 | 6 | 7 | 8 | 9 | 10 | 11 | 12 | 13 | 14 | 15 | 16 | 17 | 18 | 19 | 20 | 21 |
|---|---|---|---|---|---|---|---|---|---|---|---|---|---|---|---|---|---|---|---|---|---|---|
| 1 | Pelagic fishes | 0.02 | ||||||||||||||||||||
| 2 | Large and medium demersal fishes | 0.05 | ||||||||||||||||||||
| 3 | Sparids | 0.01 | ||||||||||||||||||||
| 4 | Leiognathidae | |||||||||||||||||||||
| 5 | Small demersal fishes | 0.02 | 0.023 | 0.02 | 0.03 | 0.02 | ||||||||||||||||
| 6 | Scorpaenidae | 0.001 | ||||||||||||||||||||
| 7 | Gobiidae | 0.015 | 0.02 | 0.01 | 0.01 | |||||||||||||||||
| 8 | Mantis shrimps | 0.04 | 0.01 | |||||||||||||||||||
| 9 | Large crabs | 0.02 | 0.02 | 0.01 | ||||||||||||||||||
| 10 | Other crabs | 0.005 | 0.03 | 0.06 | 0.04 | 0.07 | 0.1 | 0.05 | 0.079 | 0.03 | 0.02 | 0.1 | ||||||||||
| 11 | Metapenaeopsis barbata | 0 | 0.081 | 0.05 | 0.05 | 0.05 | 0.05 | 0.03 | 0.02 | 0.02 | 0.1 | |||||||||||
| 12 | Other shrimps | 0.03 | 0.21 | 0.464 | 0.08 | 0.38 | 0.15 | 0.15 | 0.096 | 0.04 | 0.04 | 0.01 | 0.13 | 0.03 | ||||||||
| 13 | Cephalopods | 0.03 | 0.02 | 0.002 | 0.03 | |||||||||||||||||
| 14 | Sea urchins | 0.1 | ||||||||||||||||||||
| 15 | Gastropods | 0.05 | 0.053 | 0.05 | 0.05 | |||||||||||||||||
| 16 | Barnacle | 0.096 | 0 | 0.05 | ||||||||||||||||||
| 17 | Oysters | 0 | 0.170 | 0.140 | 0.1 | 0.04 | ||||||||||||||||
| 18 | Mussels | 0.09 | 0.11 | 0.17 | 0.17 | 0.16 | 0.544 | 0.561 | 0.1 | 0.04 | 0.04 | 0.07 | 0.03 | |||||||||
| 19 | Other bivalves | 0.28 | 0.13 | 0.31 | 0.27 | 0.215 | 0.013 | 0.014 | 0.05 | 0.07 | 0.17 | 0.05 | 0.03 | |||||||||
| 20 | Other benthos | 0.2 | 0.13 | 0.1 | ||||||||||||||||||
| 21 | Zooplankton | 0.648 | 0.1 | 0.055 | 0.22 | 0.15 | 0.1 | 0.16 | 0.02 | 0.13 | 0.13 | 0.31 | 0.1 | 0.05 | 0.02 | 0.02 | 0.02 | 0.02 | 0.2 | |||
| 22 | Phytoplankton | 0.317 | 0.14 | 0.1 | 0.35 | 0.65 | 0.637 | 0.6 | 0.66 | |||||||||||||
| 23 | Detritus | 0.1 | 0.1 | 0.1 | 0.184 | 0.66 | 0.66 | 0.8 | 0.58 | 0.63 | 0.33 | 0.343 | 0.38 | 0.67 | 0.34 | |||||||
| 24 | Import | 0.515 | 0.1 | 0.1 | 0 | 0.05 | 0.1 | |||||||||||||||
| 25 | Sum | 1 | 1 | 1 | 1 | 1 | 1 | 1 | 1 | 1 | 1 | 1 | 1 | 1 | 1 | 1 | 1 | 1 | 1 | 1 | 1 | 1 |
Table A5.
Diet matrix of the control ecosystem.
| Numbers | Prey \ predator | 1 | 2 | 3 | 4 | 5 | 6 | 7 | 8 | 9 | 10 | 11 | 12 | 13 | 14 | 15 | 16 | 17 |
|---|---|---|---|---|---|---|---|---|---|---|---|---|---|---|---|---|---|---|
| 1 | Pelagic fishes | 0.008 | ||||||||||||||||
| 2 | Large and medium demersal fishes | 0.05 | ||||||||||||||||
| 3 | Sparids | |||||||||||||||||
| 4 | Leiognathidae | 0.04 | ||||||||||||||||
| 5 | Small demersal fishes | 0.02 | 0.063 | 0.03 | 0.02 | 0.02 | ||||||||||||
| 6 | Scorpaenidae | 0.001 | ||||||||||||||||
| 7 | Gobiidae | 0.015 | 0.092 | 0.06 | 0.01 | |||||||||||||
| 8 | Mantis shrimps | 0.04 | 0.01 | |||||||||||||||
| 9 | Large crabs | 0.02 | 0.02 | 0.01 | 0.08 | |||||||||||||
| 10 | Other crabs | 0.005 | 0.03 | 0.16 | 0.02 | 0.03 | 0.1 | 0.05 | 0.015 | 0.01 | 0.02 | 0.02 | ||||||
| 11 | Metapenaeopsis barbata | 0.17 | 0.02 | 0.02 | 0.1 | 0.02 | 0.03 | 0.0084 | 0.02 | 0.02 | ||||||||
| 12 | Other shrimps | 0.03 | 0.21 | 0.198 | 0.12 | 0.38 | 0.1 | 0.18 | 0.21 | 0.072 | 0.04 | 0.01 | 0.21 | |||||
| 13 | Cephalopods | 0.02 | 0.03 | 0.008 | 0.03 | |||||||||||||
| 14 | Gastropods | 0.047 | 0.05 | 0.05 | ||||||||||||||
| 15 | Bivalves | 0.096 | 0.36 | 0.3 | 0.44 | 0.44 | 0.375 | 0.7 | 0.71 | 0.1 | 0.11 | 0.21 | 0.365 | 0.01 | ||||
| 16 | Other benthos | 0.2 | 0.135 | 0.005 | ||||||||||||||
| 17 | Zooplankton | 0.648 | 0.1 | 0.03 | 0.24 | 0.15 | 0.1 | 0.26 | 0.02 | 0.18 | 0.13 | 0.31 | 0.05 | 0.01 | 0.067 | |||
| 18 | Phytoplankton | 0.317 | 0.14 | 0.6 | 0.66 | |||||||||||||
| 19 | Detritus | 0.1 | 0.1 | 0.1 | 0.21 | 0.66 | 0.71 | 0.58 | 0.39 | 0.923 | 0.34 | |||||||
| 20 | Import | 0.547 | 0.1 | 0.1 | 0.1 | |||||||||||||
| 21 | Sum | 1 | 1 | 1 | 1 | 1 | 1 | 1 | 1 | 1.0004 | 1 | 1 | 1 | 1 | 1 | 1 | 1 | 1 |
Table A6.
Values of indicators of an ecological network analysis of coastal ecosystems worldwide.
| Study area | Time | Ecosystem function | Food web structure | Ecosystem maturity | Data sources | ||||||||
|---|---|---|---|---|---|---|---|---|---|---|---|---|---|
| D/H | A/C | TE | CI | SOI | FCI | FML | TPP/TR | TPP/TB | TB/TST | ||||
| 1 | Tongoy Bay | 1992 | 0.396 | 6.420 | 0.320 | 0.090 | 1.500 | 3.340 | 3.500 | 26.600 | 0.016 | [28,30,32,52,95,101,110,116,137,152,153,154,155,156,157,158,159,160,161,162,163,164,165,166,167,168,169,170,171,172,173,174,175,176,177,178,179,180,181,182,183,184,185,186,187,188,189,190,191,192,193,194,195,196,197,198,199,200,201,202,203,204,205,206,207,208,209,210,211,212,213,214,215,216,217,218,219,220,221] | |
| 2 | 2002 | 0.318 | 7.130 | 0.320 | 0.110 | 2.900 | 3.490 | 2.500 | 12.200 | 0.034 | |||
| 3 | 2012 | 0.339 | 9.410 | 0.310 | 0.090 | 2.200 | 3.340 | 2.400 | 16.000 | 0.026 | |||
| 4 | Pagasitikos Gulf | 2008 | 0.250 | 1.470 | 9.100 | 0.030 | |||||||
| 5 | The North and Central Gulf of California | 1980s | 1.652 | 0.347 | 22.200 | 0.133 | 0.320 | 6.240 | 2.500 | 16.500 | 0.022 | ||
| 6 | The southeastern Gulf of California | 1994–1997 | 0.322 | 0.290 | 14.500 | 0.200 | 0.200 | 5.200 | 2.344 | 1.947 | 0.039 | ||
| 7 | 2006–2007 | 0.233 | 0.340 | 7.500 | 0.100 | 0.100 | 4.700 | 12.192 | 13.699 | 0.034 | |||
| 8 | Bay of Seine and eastern part of the English Channel | 2007-2013 | 0.520 | 0.173 | 9.160 | 0.030 | |||||||
| 9 | Seine estuary | 1996-2002 | 4.500 | 0.180 | 8.520 | 2.820 | 2.590 | 48.680 | 0.007 | ||||
| 10 | Seine estuary | 1996-2002 | 5.200 | 0.190 | 18.940 | 4.010 | 1.220 | 8.990 | 0.022 | ||||
| 11 | Seine estuary | 1996-2002 | 6.800 | 0.160 | 3.650 | 2.630 | 1.090 | 6.950 | 0.009 | ||||
| 12 | Seine estuary | 1996-2002 | 9.100 | 0.190 | 13.860 | 3.600 | 1.560 | 12.020 | 0.020 | ||||
| 13 | Seine estuary | 1996-2002 | 7.400 | 0.180 | 11.230 | 3.260 | 1.930 | 16.680 | 0.016 | ||||
| 14 | Seine estuary | 1996-2002 | 9.900 | 0.160 | 20.650 | 4.330 | 1.110 | 9.150 | 0.020 | ||||
| 15 | Black Sea | 1960–1969 | 4.275 | 0.070 | 9.400 | 2.660 | 1.630 | 132.000 | 0.003 | ||||
| 16 | Black Sea | 1980–1987 | 4.800 | 0.120 | 4.600 | 2.480 | 2.270 | 90.960 | 0.004 | ||||
| 17 | Black Sea | 1988–1994 | 5.500 | 0.120 | 2.760 | 2.320 | 3.610 | 116.770 | 0.004 | ||||
| 18 | Black Sea | 1995–2000 | 3.675 | 0.120 | 15.010 | 2.940 | 1.160 | 89.850 | 0.004 | ||||
| 19 | North-westem Mediteranean sea | 1999-2003 | 14.300 | 0.190 | 9.120 | 2.750 | 4.890 | 32.000 | |||||
| 20 | Gulf of lions | 2000-2009 | 19.700 | 0.210 | 11.870 | 3.990 | 2.090 | 15.100 | |||||
| 21 | lower coninentalslope of Catalan sea | 2009 | 15.700 | 0.290 | 4.200 | ||||||||
| 22 | North-Central Adriatic Sea | 1990 | 10.000 | 0.190 | 14.700 | 5.410 | 2.730 | 8.820 | |||||
| 23 | North Aegean Sea | 2003–2006 | 17.400 | 0.180 | 14.600 | 3.630 | 2.990 | 16.210 | |||||
| 24 | Greek Ionian Sea | 1998-2006 | 13.100 | 0.360 | 14.330 | 5.850 | 1.830 | 23.250 | |||||
| 25 | Gulf of Gabes | 2000-2005 | 19.240 | 7.350 | 3.050 | 2.410 | 16.750 | ||||||
| 26 | Gulf of Cadiz | 2009 | 14.900 | 0.180 | 3.000 | 2.430 | 3.300 | 39.800 | |||||
| 27 | Jade Bay (German Wadden Sea) | 1935–1937 | 1.800 | 0.349 | 4.960 | 0.432 | 6.100 | 5.130 | |||||
| 28 | 1975–1977 | 1.300 | 0.389 | 2.920 | 0.289 | 4.260 | 3.700 | ||||||
| 29 | 2009 | 4.200 | 0.419 | 4.220 | 0.310 | 7.690 | 3.940 | ||||||
| 30 | Mejillones bay | 2005-2012 | 0.241 | 0.200 | 0.074 | 4.880 | 2.920 | 1.550 | 6.280 | 0.060 | |||
| 31 | Antofagasta bay | 2005-2012 | 0.285 | 0.180 | 0.069 | 6.020 | 2.770 | 1.400 | 7.190 | 0.050 | |||
| 32 | Nigerian coastal waters | 1985 | 12.780 | 0.284 | 0.273 | 2.238 | 9.230 | ||||||
| 33 | 2000 | 11.930 | 0.284 | 0.256 | 2.133 | 9.390 | |||||||
| 34 | Somme Bay | 1998 | 0.350 | 4.000 | 0.250 | 0.009 | 12.200 | 15.509 | 21.816 | 0.012 | |||
| 35 | Kuosheng Bay | 1998-2001 | 2.444 | 6.500 | 0.480 | 0.520 | 32.000 | 4.400 | 1.060 | 40.000 | 0.006 | ||
| 36 | Cadiz Gulf | 2009 | 0.283 | 14.900 | 0.250 | 0.180 | 3.000 | 2.430 | 3.300 | 39.800 | 0.010 | ||
| 37 | Estuary of Sirinhaém River in northeastern Brazil | 2013-2014 | 0.980 | 0.290 | 11.580 | 0.270 | 0.160 | 5.610 | 2.590 | 32.590 | 0.010 | ||
| 38 | Poonthura Estuary | 2016-2020 | 0.240 | 0.150 | 12.450 | 0.350 | 0.380 | 17.940 | 0.460 | 5.210 | 0.020 | ||
| 39 | Estuarine ecosystem around bight of Benin, Nigeria | 0.461 | 0.423 | 6.800 | 0.327 | 0.288 | 1.700 | 2.300 | 6.325 | 82.615 | 0.005 | ||
| 40 | South Catalan Sea | late 1970 | 1.004 | 0.417 | 11.500 | 0.220 | 4.980 | 2.400 | 6.840 | 33.960 | 0.010 | ||
| 41 | South Catalan Sea | mid 1990 | 0.670 | 0.358 | 12.200 | 0.220 | 5.770 | 2.560 | 4.820 | 26.740 | 0.010 | ||
| 42 | South Catalan Sea | early 2000 | 0.664 | 0.411 | 13.300 | 0.200 | 6.220 | 2.410 | 6.710 | 28.980 | 0.010 | ||
| 43 | Gulf of Maine | 1980 | 0.265 | 0.307 | 0.650 | 2.010 | 2.090 | 42.560 | 0.011 | ||||
| 44 | Gulf of Maine | 1990 | 0.265 | 0.290 | 3.630 | 2.310 | 1.760 | 18.940 | 0.023 | ||||
| 45 | A marine protected area on the coast of Sénégal | 2003 | 0.255 | 0.340 | 0.146 | 3.540 | 2.500 | 1.910 | 18.290 | 0.021 | |||
| 46 | 2006-2008 | 0.272 | 0.340 | 0.154 | 3.660 | 2.500 | 2.080 | 18.220 | 0.022 | ||||
| 47 | Venezuela Shelf Ecosystem | 1986-1989 | 0.399 | 6.600 | 0.135 | 2.200 | 4.050 | 27.000 | 0.023 | ||||
| 48 | Eastern Central Pacific Ocean | 1986-1989 | 2.000 | 2.400 | |||||||||
| 49 | Gulf of Mexico | 1986-1989 | 0.391 | 0.195 | 2.100 | 3.030 | 7.000 | 0.015 | |||||
| 50 | British Columbia Shelf | 1991-2007 | 0.401 | 0.140 | 2.030 | 21.100 | 0.180 | ||||||
| 51 | Northern Benguela Upwelling ecosystem | 1991-2007 | 48.500 | 4.220 | 3.500 | ||||||||
| 52 | Terminos Lagoon, Mexico | 1980-1988 | 7.000 | 10.000 | |||||||||
| 53 | Sandy Barrier Lagoon, Taiwan | 1997 | 10.800 | 3.380 | |||||||||
| 54 | Boca Paila Reef, Mexico | 1990-1998 | 0.860 | 13.400 | 1285.000 | 15.600 | |||||||
| 55 | Channel of São Sebastião ecosystems | 1990-1997 | 25.400 | 0.260 | 0.210 | 30.100 | 0.700 | 11.200 | 0.012 | ||||
| 56 | Inner shelf of São Sebastião ecosystems | 1990-1997 | 23.200 | 0.280 | 0.210 | 25.800 | 1.900 | 30.100 | 0.010 | ||||
| 57 | Bengal Bay | 2003 | 0.387 | 5.900 | 0.420 | 0.220 | 10.000 | 2.580 | 1.350 | 14.690 | 0.026 | ||
| 58 | Northern and Central Adriatic Sea | 1990s. | 1.680 | 27.000 | 10.000 | 0.190 | 14.700 | 3.340 | 2.730 | 8.800 | 0.030 | ||
| 59 | Prince Edward Islands marine ecosystem | 1960 | 0.300 | 11.100 | 0.204 | 0.220 | 1.560 | 30.380 | 0.012 | ||||
| 60 | Prince Edward Islands marine ecosystem | 1980 | 0.300 | 11.000 | 0.204 | 0.210 | 1.560 | 30.390 | 0.012 | ||||
| 61 | Prince Edward Islands marine ecosystem | 2000 | 0.300 | 11.000 | 0.204 | 0.200 | 1.560 | 30.440 | 0.012 | ||||
| 62 | Kerguelen lsland marine ecosystem | 2005 | 0.230 | 0.170 | 1.160 | 12.980 | 0.024 | ||||||
| 63 | South Georgia | 2012 | 0.190 | 0.410 | 0.890 | 6.820 | 0.031 | ||||||
| 64 | South Shetlands | 2003 | 0.250 | 0.160 | 2.750 | 53.090 | 0.008 | ||||||
| 65 | Falklands marine ecosystem | 2005 | 0.180 | 0.280 | 12.310 | 83.950 | 0.006 | ||||||
| 66 | Antarctic Peninsula | 2005 | 0.270 | 0.160 | 5.140 | 9.460 | 0.048 | ||||||
| 67 | 2008 | 0.200 | 0.150 | 10.350 | 11.480 | 0.037 | |||||||
| 68 | 2012 | 0.200 | 0.180 | 1.580 | 16.610 | 0.021 | |||||||
| 69 | Southern Plateau, New Zealand | 1989-1996 | 0.160 | 0.290 | 1.490 | 48.560 | 0.006 | ||||||
| 70 | Jurien Bay, Western Australia | 2005-2006 | 9.600 | 0.160 | 0.250 | 1.100 | 2.100 | 0.080 | |||||
| 71 | Eritrean Red Sea | 1997-2005 | 8.600 | 0.460 | 0.210 | 10.760 | 3.640 | 1.100 | 11.950 | 0.023 | |||
| 72 | Subtidal area in Tongoy Bay, Chile | 1971-2001 | 11.500 | 0.200 | 0.140 | 2.610 | 2.400 | 2.700 | 12.220 | 0.034 | |||
| 73 | Western Scotland coast ecosystem | 1997-2003 | 0.290 | 0.180 | 2.540 | 2.060 | 4.510 | 30.610 | 0.013 | ||||
| 74 | Rocky coastal ecosystem Bahia Tortugas, Mexico | 2006-2008 | 0.200 | 0.230 | 0.230 | 1.050 | 1.340 | ||||||
| 75 | Sublittoral community of the Bay of Calvi, Corsica | 1983-1998 | 11.300 | 0.340 | 21.690 | 4.260 | 0.800 | 1.500 | 0.095 | ||||
| 76 | Eastern Bering Sea ecosystem | 1950s | 0.325 | 0.290 | 0.183 | 13.200 | 3.470 | 0.940 | 5.850 | 0.046 | |||
| 77 | 1980s | 0.309 | 0.300 | 0.157 | 11.100 | 3.510 | 0.780 | 4.940 | 0.045 | ||||
| 78 | West Coast of Sabah, Malaysia | 1972 | 0.270 | 0.220 | 2.070 | 19.620 | 0.020 | ||||||
| 79 | West Coast of Sarawak, Malaysia | 1972 | 0.270 | 0.220 | 2.080 | 19.370 | 0.020 | ||||||
| 80 | San Pedro Bay, Leyte, Philippins | 0.450 | 0.290 | 1.390 | 46.810 | 0.008 | |||||||
| 81 | Karnataka Arabian Sea | 1999-2001 | 0.329 | 13.400 | 0.382 | 0.299 | 6.030 | 2.810 | 1.283 | 29.900 | 0.012 | ||
| 82 | northern Benguela upwelling system, Namibia | 1990-1995 | 0.485 | 0.194 | 0.252 | 4.220 | 3.500 | ||||||
| 83 | Tenerife and La Gomera islands marine ecosystem | 2016 | 0.268 | 18.930 | 0.190 | 0.280 | 14.440 | 3.490 | 1.980 | 7.790 | 0.040 | ||
| 84 | Pearl River Delta coastal sea ecosystem | 1997-1999 | 0.237 | 0.327 | 2.867 | 18.134 | 0.017 | ||||||
| 85 | Wangjiadao Islands marine ecosystem | 2019 | 0.633 | 49.100 | 0.240 | 0.180 | 13.890 | 3.550 | 1.650 | ||||
| 86 | Gulf of Ulloa | 1980-2006 | 0.650 | 46.000 | 0.200 | 0.150 | 0.160 | 33.000 | |||||
| 87 | Isla del Coco, Costa Rica, Eastern Tropical Pacific | 2015 | 1.383 | 2.320 | 0.170 | 0.400 | 6.500 | 0.248 | 0.380 | ||||
| 88 | Northern Hangzhou Bay | 2006-2007 | 0.310 | 8.900 | 0.310 | 0.350 | 25.000 | 2.170 | 2.560 | 69.250 | 0.005 | ||
| 89 | Beibu Gulf | 1959-1961 | 0.750 | 0.579 | 7.100 | 0.316 | 0.186 | 1.860 | 1.755 | 1.013 | 28.920 | 0.062 | |
| 90 | 1990s | 0.460 | 0.476 | 9.400 | 0.310 | 0.171 | 0.840 | 1.206 | 2.184 | 54.355 | 0.010 | ||
| 91 | 1997-1999 | 12.200 | 0.333 | 0.319 | 0.840 | 1.206 | 3.182 | 24.547 | 0.018 | ||||
| 92 | Bohai Sea | 1982 | 12.300 | 0.350 | 9.745 | 127.493 | 0.004 | ||||||
| 93 | 1992-1993 | 16.200 | 0.341 | 8.400 | 86.043 | 0.006 | |||||||
| 94 | 2014-2015 | 5.100 | 0.330 | 0.140 | 5.380 | 99.830 | 0.005 | ||||||
| 95 | 2016 | 0.367 | 0.626 | 11.350 | 0.341 | 0.276 | 0.892 | 2.091 | 11.713 | 168.789 | 0.003 | ||
| 96 | Xiangyun Bay | 2019-2020 | 2.036 | 0.268 | 9.160 | 0.240 | 0.161 | 19.810 | 4.071 | 0.748 | 4.257 | 0.038 | |
| 97 | 2019-2020 | 1.240 | 0.319 | 7.570 | 0.247 | 0.130 | 11.810 | 2.883 | 2.657 | 30.734 | |||
| 98 | Northern South China Sea | 1989-1992 | 17.500 | 4.537 | 2.352 | 6.000 | 0.060 | ||||||
| 99 | 1997-2000 | 8.380 | 2.790 | 2.818 | 40.252 | 0.010 | |||||||
| 100 | 2000-2004 | 2.630 | 2.302 | 8.676 | 60.839 | 0.008 | |||||||
| 101 | 2007-2008 | 11.500 | 0.290 | 0.239 | 4.380 | 2.476 | 2.596 | 25.000 | 0.016 | ||||
| 102 | 2015-2016 | 21.940 | 0.313 | 0.325 | 13.680 | 3.775 | 1.005 | 32.190 | 0.008 | ||||
| 103 | Southern East China Sea | 1999-2002 | 0.637 | 12.000 | 0.330 | 0.213 | 4.100 | 2.398 | 3.060 | ||||
| 104 | East China Sea | 1997-2000 | 0.507 | 14.600 | 0.190 | 0.201 | 0.180 | 1.903 | 3.383 | 43.458 | |||
| 105 | South Yellow Sea | 2000-2001 | 0.583 | 0.248 | 8.100 | 0.360 | 0.210 | 9.830 | 1.430 | 41.270 | 0.028 | ||
| 106 | South-west Yellow Sea | 2006-2009 | 0.618 | 13.220 | 0.280 | 0.217 | 3.983 | 2.444 | 2.541 | 50.362 | 0.008 | ||
| 107 | Yangtze River Estuary | 1985-1986 | 0.723 | 12.400 | 0.471 | 0.103 | 9.350 | 2.778 | 1.724 | 31.483 | 0.011 | ||
| 108 | 2000 | 9.400 | 0.449 | 0.256 | 2.215 | 5.293 | 79.021 | 0.006 | |||||
| 109 | 2006 | 9.900 | 0.414 | 0.313 | 0.060 | 2.595 | 1.815 | 41.672 | 0.009 | ||||
| 110 | 2004 | 0.685 | 14.700 | 0.539 | 0.069 | 4.200 | 2.461 | 2.527 | 50.350 | 0.008 | |||
| 111 | 2012 | 0.544 | 9.400 | 0.371 | 0.196 | 5.990 | 2.500 | 2.095 | 67.525 | 0.006 | |||
| 112 | 2016-2017 | 0.073 | 9.300 | 0.345 | 0.321 | 1.245 | 53.402 | 0.007 | |||||
| 113 | 2020 | 0.451 | 9.850 | 0.388 | 0.234 | 3.200 | 31.910 | 0.010 | |||||
| 114 | Haizhou Bay | 2003 | 13.800 | 0.270 | 0.210 | 0.030 | 2.220 | 4.500 | 40.339 | 0.012 | |||
| 115 | 2013 | 7.900 | 0.415 | 0.174 | 0.114 | 2.301 | 1.331 | 44.986 | 0.009 | ||||
| 116 | 2013 | 0.647 | 5.620 | 3.093 | 4.720 | 92.404 | 0.005 | ||||||
| 117 | 2015 | 0.488 | 5.660 | 0.184 | 1.299 | 44.000 | 0.007 | ||||||
| 118 | 2018 | 12.630 | 0.429 | 0.204 | 1.392 | 7.069 | 56.866 | 0.017 | |||||
| 119 | Daya Bay | 2010-2011 | 0.525 | 0.363 | 10.900 | 0.249 | 0.138 | 2.170 | 2.210 | 3.500 | 82.500 | 0.005 | |
| 120 | Laizhou Bay | 2009-2010 | 6.200 | 0.290 | 0.170 | 0.070 | 1.530 | 24.540 | 0.014 | ||||
| 121 | Jiaozhou Bay | 2011 | 0.341 | 14.400 | 0.310 | 0.160 | 2.470 | 2.300 | 3.180 | 30.040 | 0.010 | ||
| 122 | 2015-2016 | 16.350 | 0.248 | 0.116 | 4.269 | 2.436 | 2.518 | 32.873 | 0.012 | ||||
| 123 | Yellow River Estuary | 2012-2013 | 1.163 | 9.700 | 0.300 | 0.150 | 6.160 | 2.470 | 33.300 | 0.012 | |||
| 124 | 2013-2014 | 5.400 | 0.380 | 0.120 | 2.800 | 3.450 | 38.910 | 0.011 | |||||
| 125 | Artificial reef ecosystem near Yantai coast | 2019 | 10.560 | 0.300 | 0.200 | 1.930 | |||||||
| 126 | Artificial reef ecosystem near Li Island | 2014 | 11.700 | 0.320 | 0.140 | 5.460 | 2.690 | 1.820 | 6.600 | 0.060 | |||
| 127 | Artificial reef ecosystem in Laizhou Bay | 2010-2012 | 12.800 | 0.440 | 0.360 | 12.230 | 3.300 | 1.035 | 15.580 | 0.019 | |||
| 128 | Artificial reef ecosystem in Laoshan Bay | 2014-2016 | 10.800 | 0.290 | 0.330 | 20.950 | 4.000 | 1.130 | 13.610 | ||||
| 129 | Gouqi Island marine ecosystem, Shanghai | 2007-2008 | 12.700 | 0.330 | 0.220 | 2.950 | 1.250 | ||||||
| 130 | Artificial reef ecosystem on the west of Furong Island | 2019-2020 | 0.620 | 0.320 | 8.920 | 0.160 | 0.120 | 22.670 | 5.170 | 1.010 | 9.620 | 0.020 | |
| 131 | Artificial reef ecosystem in xiangyun Bay | 2017-2018 | 0.630 | 0.249 | 6.940 | 0.240 | 0.150 | 20.510 | 4.310 | 0.700 | 4.220 | 0.034 | |
| 132 | Oyster-macroalgae reef ecosystem in xiangyun Bay | 2017-2018 | 0.610 | 0.266 | 9.120 | 0.240 | 0.160 | 19.710 | 4.070 | 0.750 | 4.257 | 0.038 | |
| 133 | Artificial reef ecosystem near Dachen island | 2019-2020 | 0.570 | 0.278 | 12.460 | 0.240 | 0.270 | 19.810 | 4.000 | 1.300 | 32.160 | 0.008 | |
| 134 | Artificial reef ecosystem near Wuzhizhou island | 2019-2020 | 0.390 | 0.343 | 12.070 | 0.200 | 0.240 | 16.860 | 5.200 | 2.020 | 33.740 | 0.011 | |
| 135 | Galapagos subtidal rocky reef ecosystem | 1997-2003 | 0.250 | 0.160 | 0.480 | 5.060 | 0.030 | ||||||
| 136 | Qilianyu Islands coral reef ecosystem | 2019 | 0.552 | 26.300 | 0.330 | 0.210 | 3.640 | 2.470 | 0.277 | 3.790 | |||
| 137 | Nanwan Bay coral reef ecosystem | 2001-2003 | 1.400 | 9.900 | 3.500 | 4.400 | |||||||
| 138 | Tampalam Reefs ecosystem, Mexico | 1990-1998 | 1.000 | 13.500 | 1.240 | 14.080 | |||||||
| 139 | Mahahual Reefs ecosystem, Mexico | 1990-1998 | 1.000 | 15.400 | 1.270 | 12.450 | |||||||
Appendix F. Figures
Figure A1.
Predicted relative changes in biomass of each functional group in the Ecopath Model of marine ranching ecosystem for the stock enhancement scenario of MOB without fishing activities. MOB: mussels, oysters, and barnacles.
Figure A1.
Predicted relative changes in biomass of each functional group in the Ecopath Model of marine ranching ecosystem for the stock enhancement scenario of MOB without fishing activities. MOB: mussels, oysters, and barnacles.
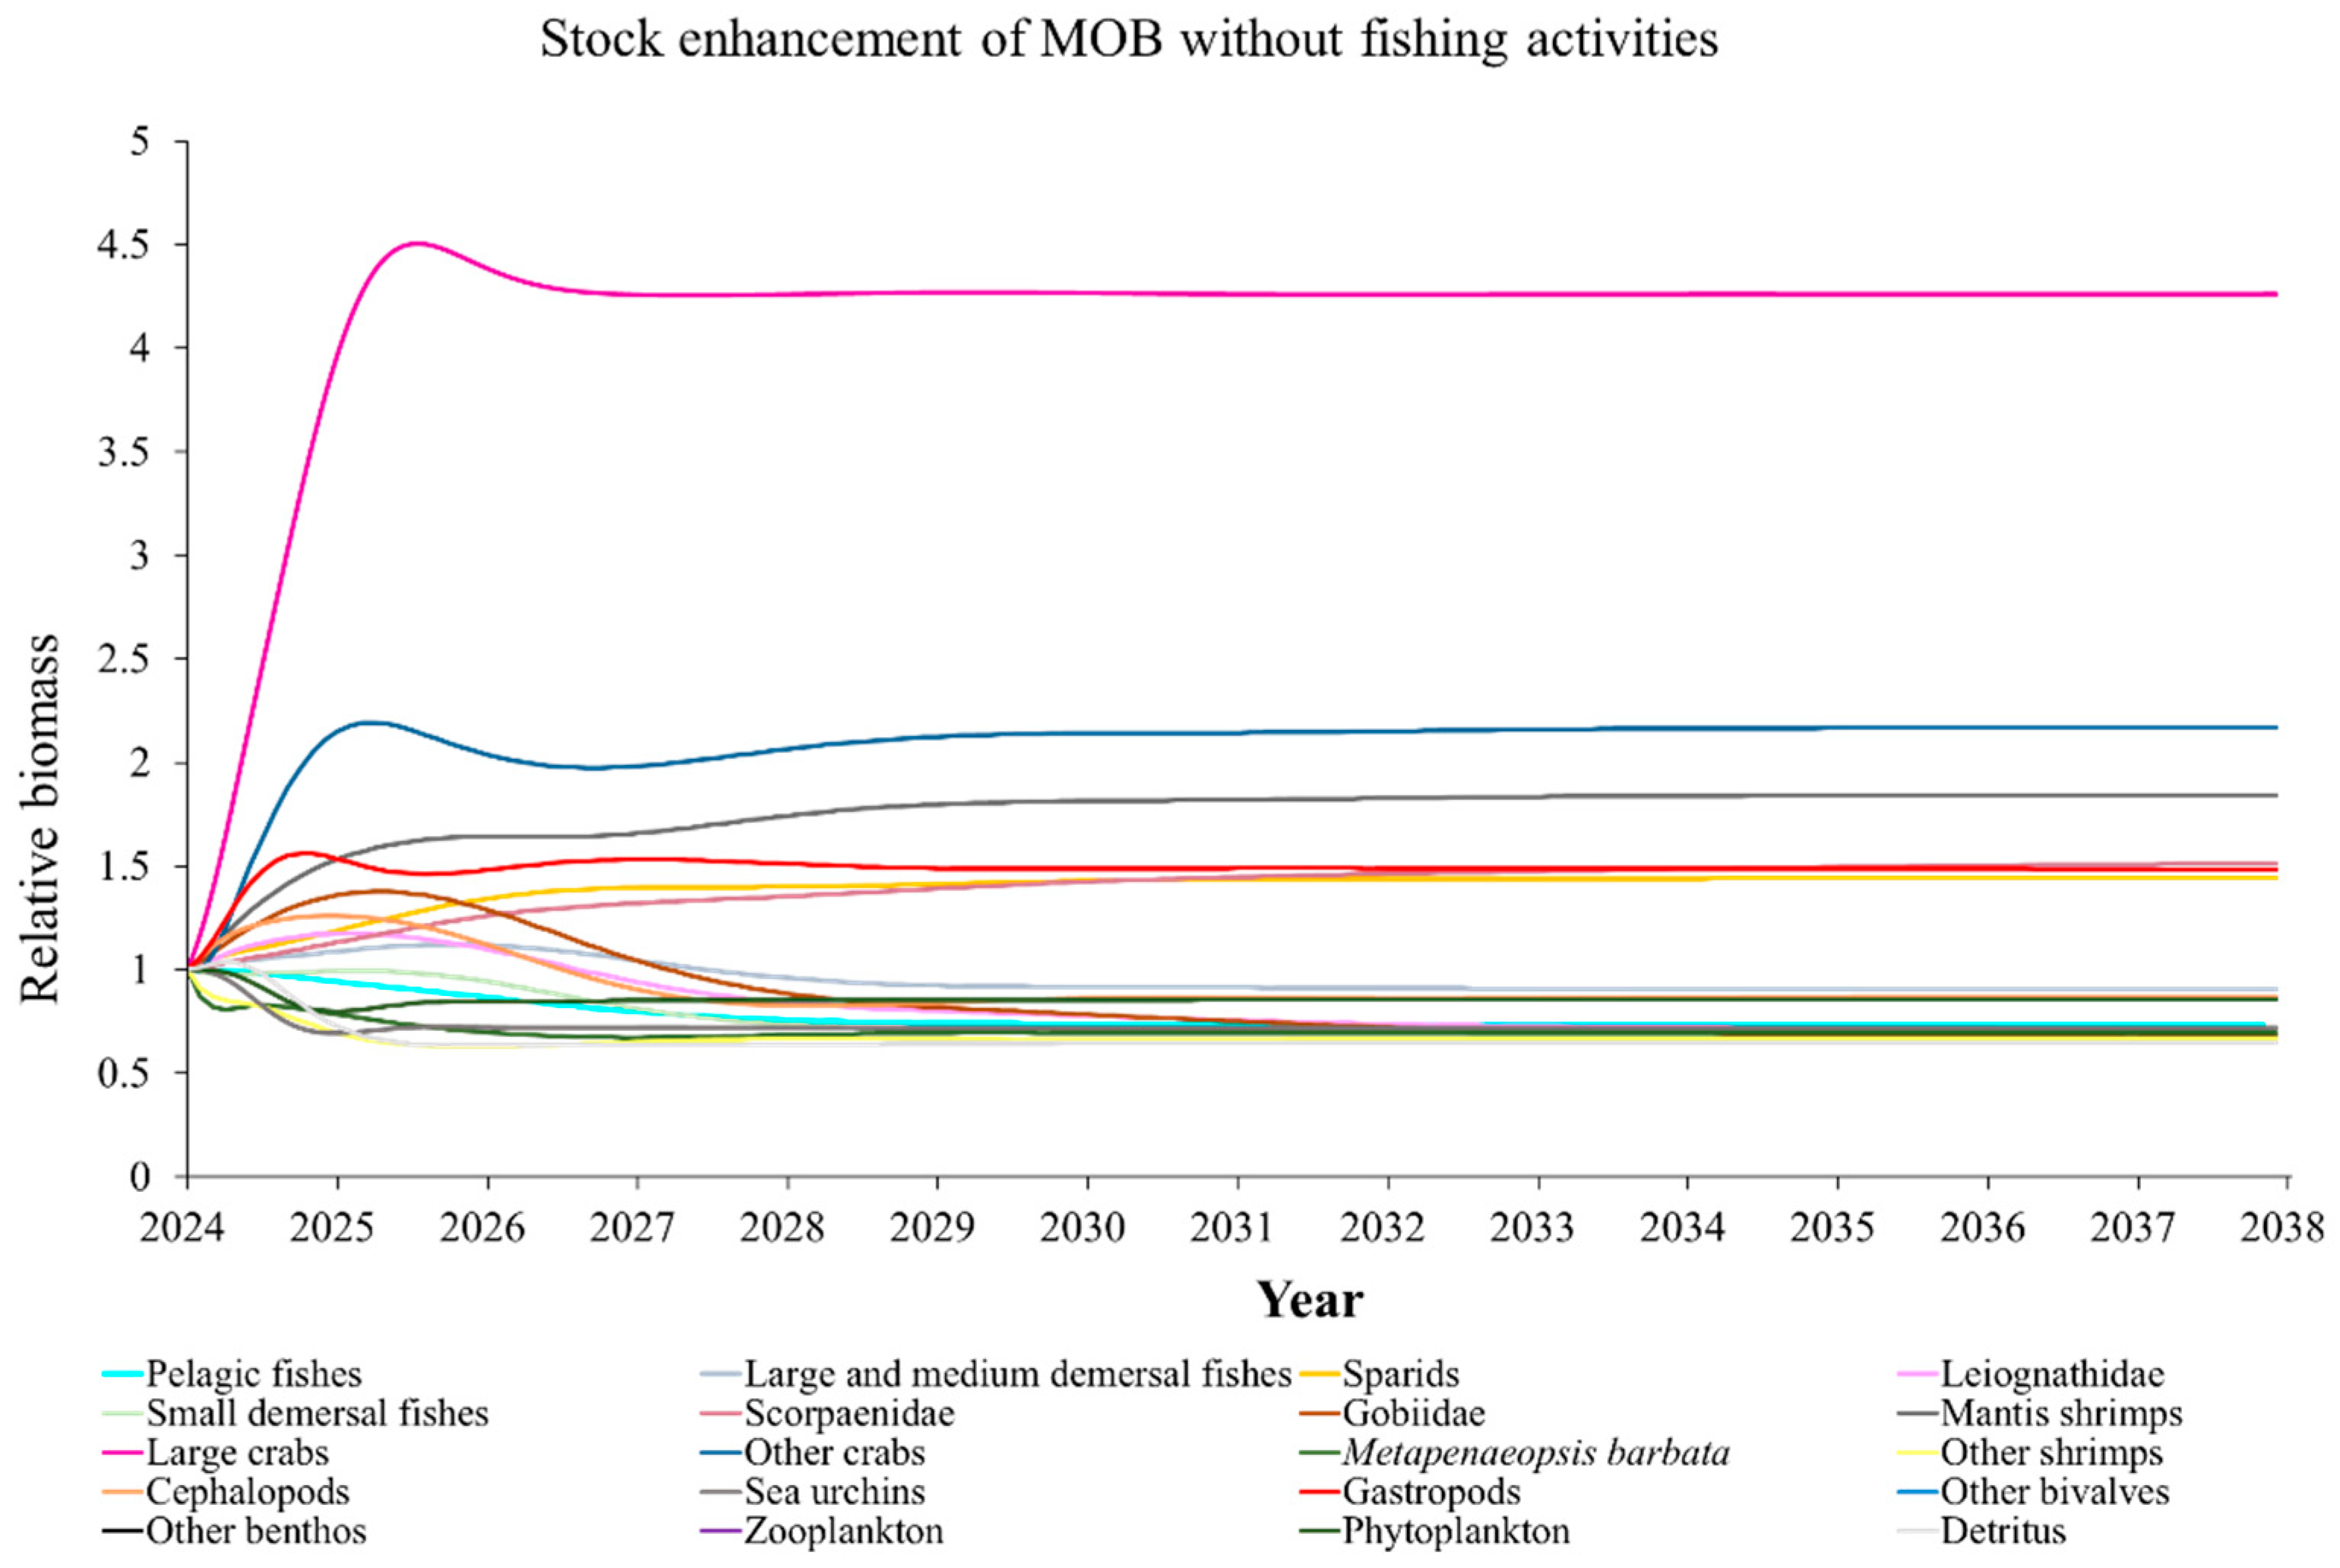
Figure A2.
Predicted relative changes in biomass of each functional group in the Ecopath Model of marine ranching ecosystem for the stock enhancement scenario of MOB with fishing activities. MOB: mussels, oysters, and barnacles.
Figure A2.
Predicted relative changes in biomass of each functional group in the Ecopath Model of marine ranching ecosystem for the stock enhancement scenario of MOB with fishing activities. MOB: mussels, oysters, and barnacles.
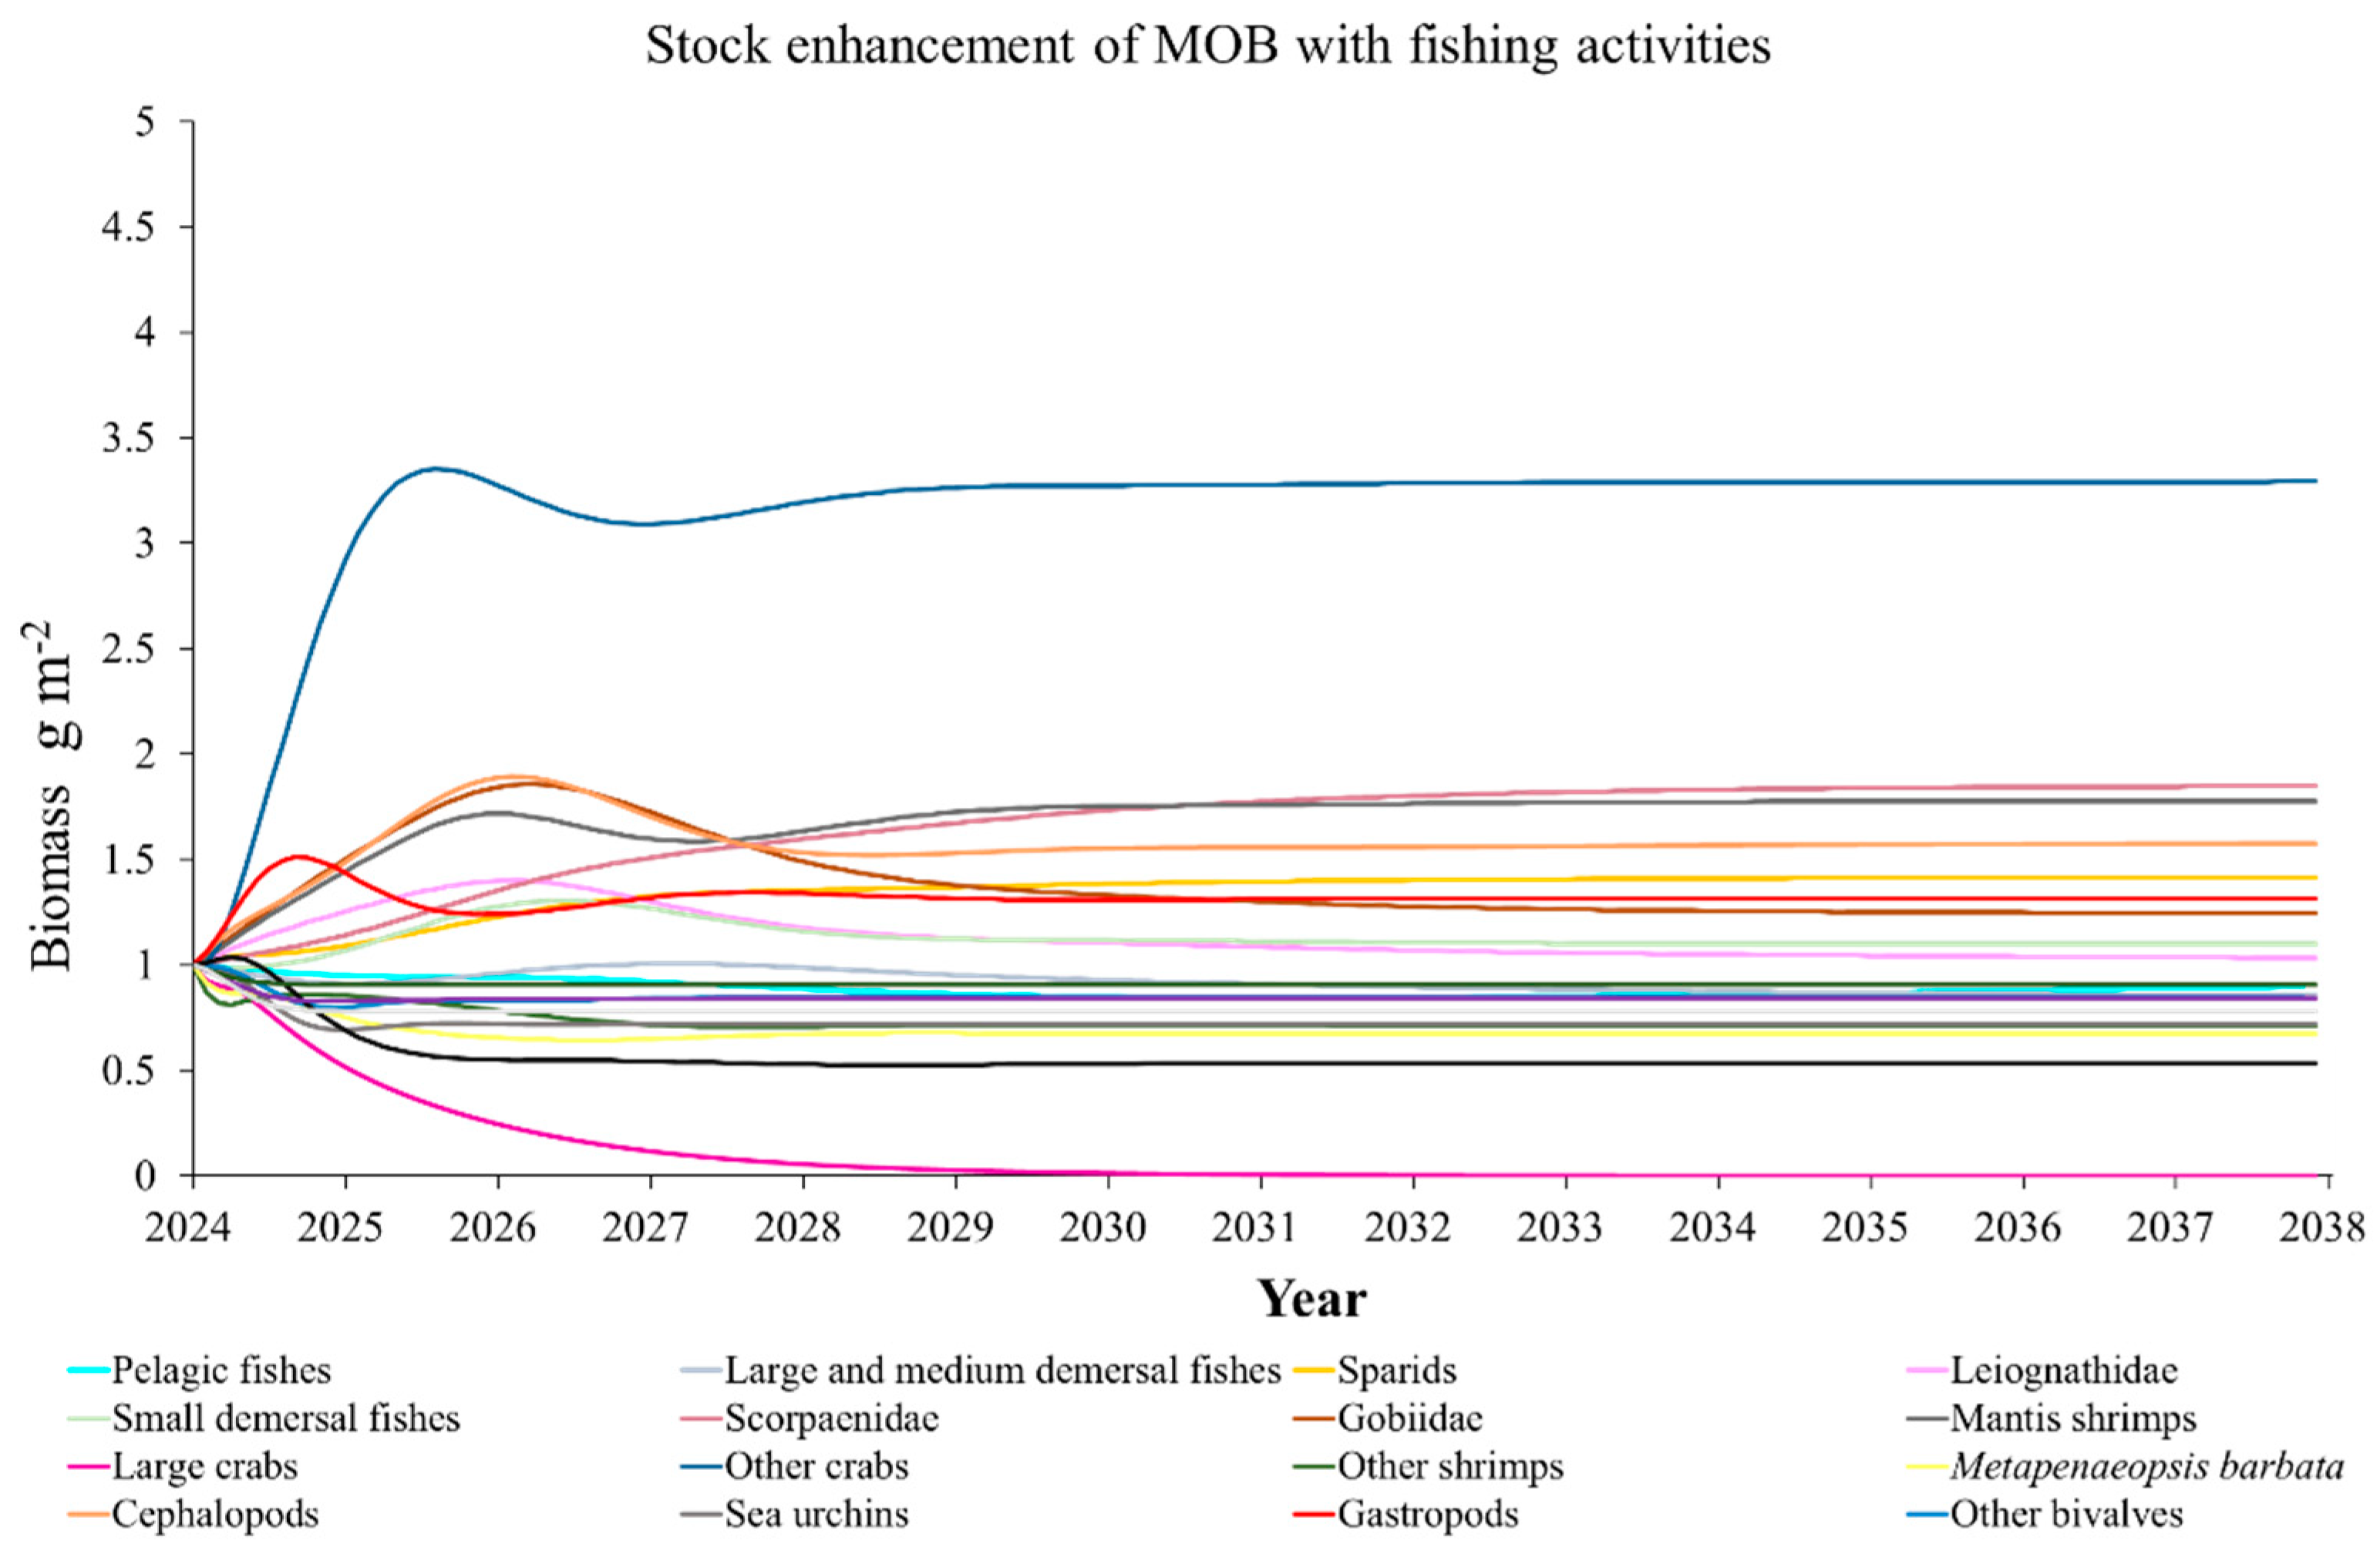
Figure A3.
Predicted relative changes in biomass of each functional group in the Ecopath Model of marine ranching ecosystem for the stock enhancement scenario of crabs (functional group of large crabs) without fishing activities.
Figure A3.
Predicted relative changes in biomass of each functional group in the Ecopath Model of marine ranching ecosystem for the stock enhancement scenario of crabs (functional group of large crabs) without fishing activities.
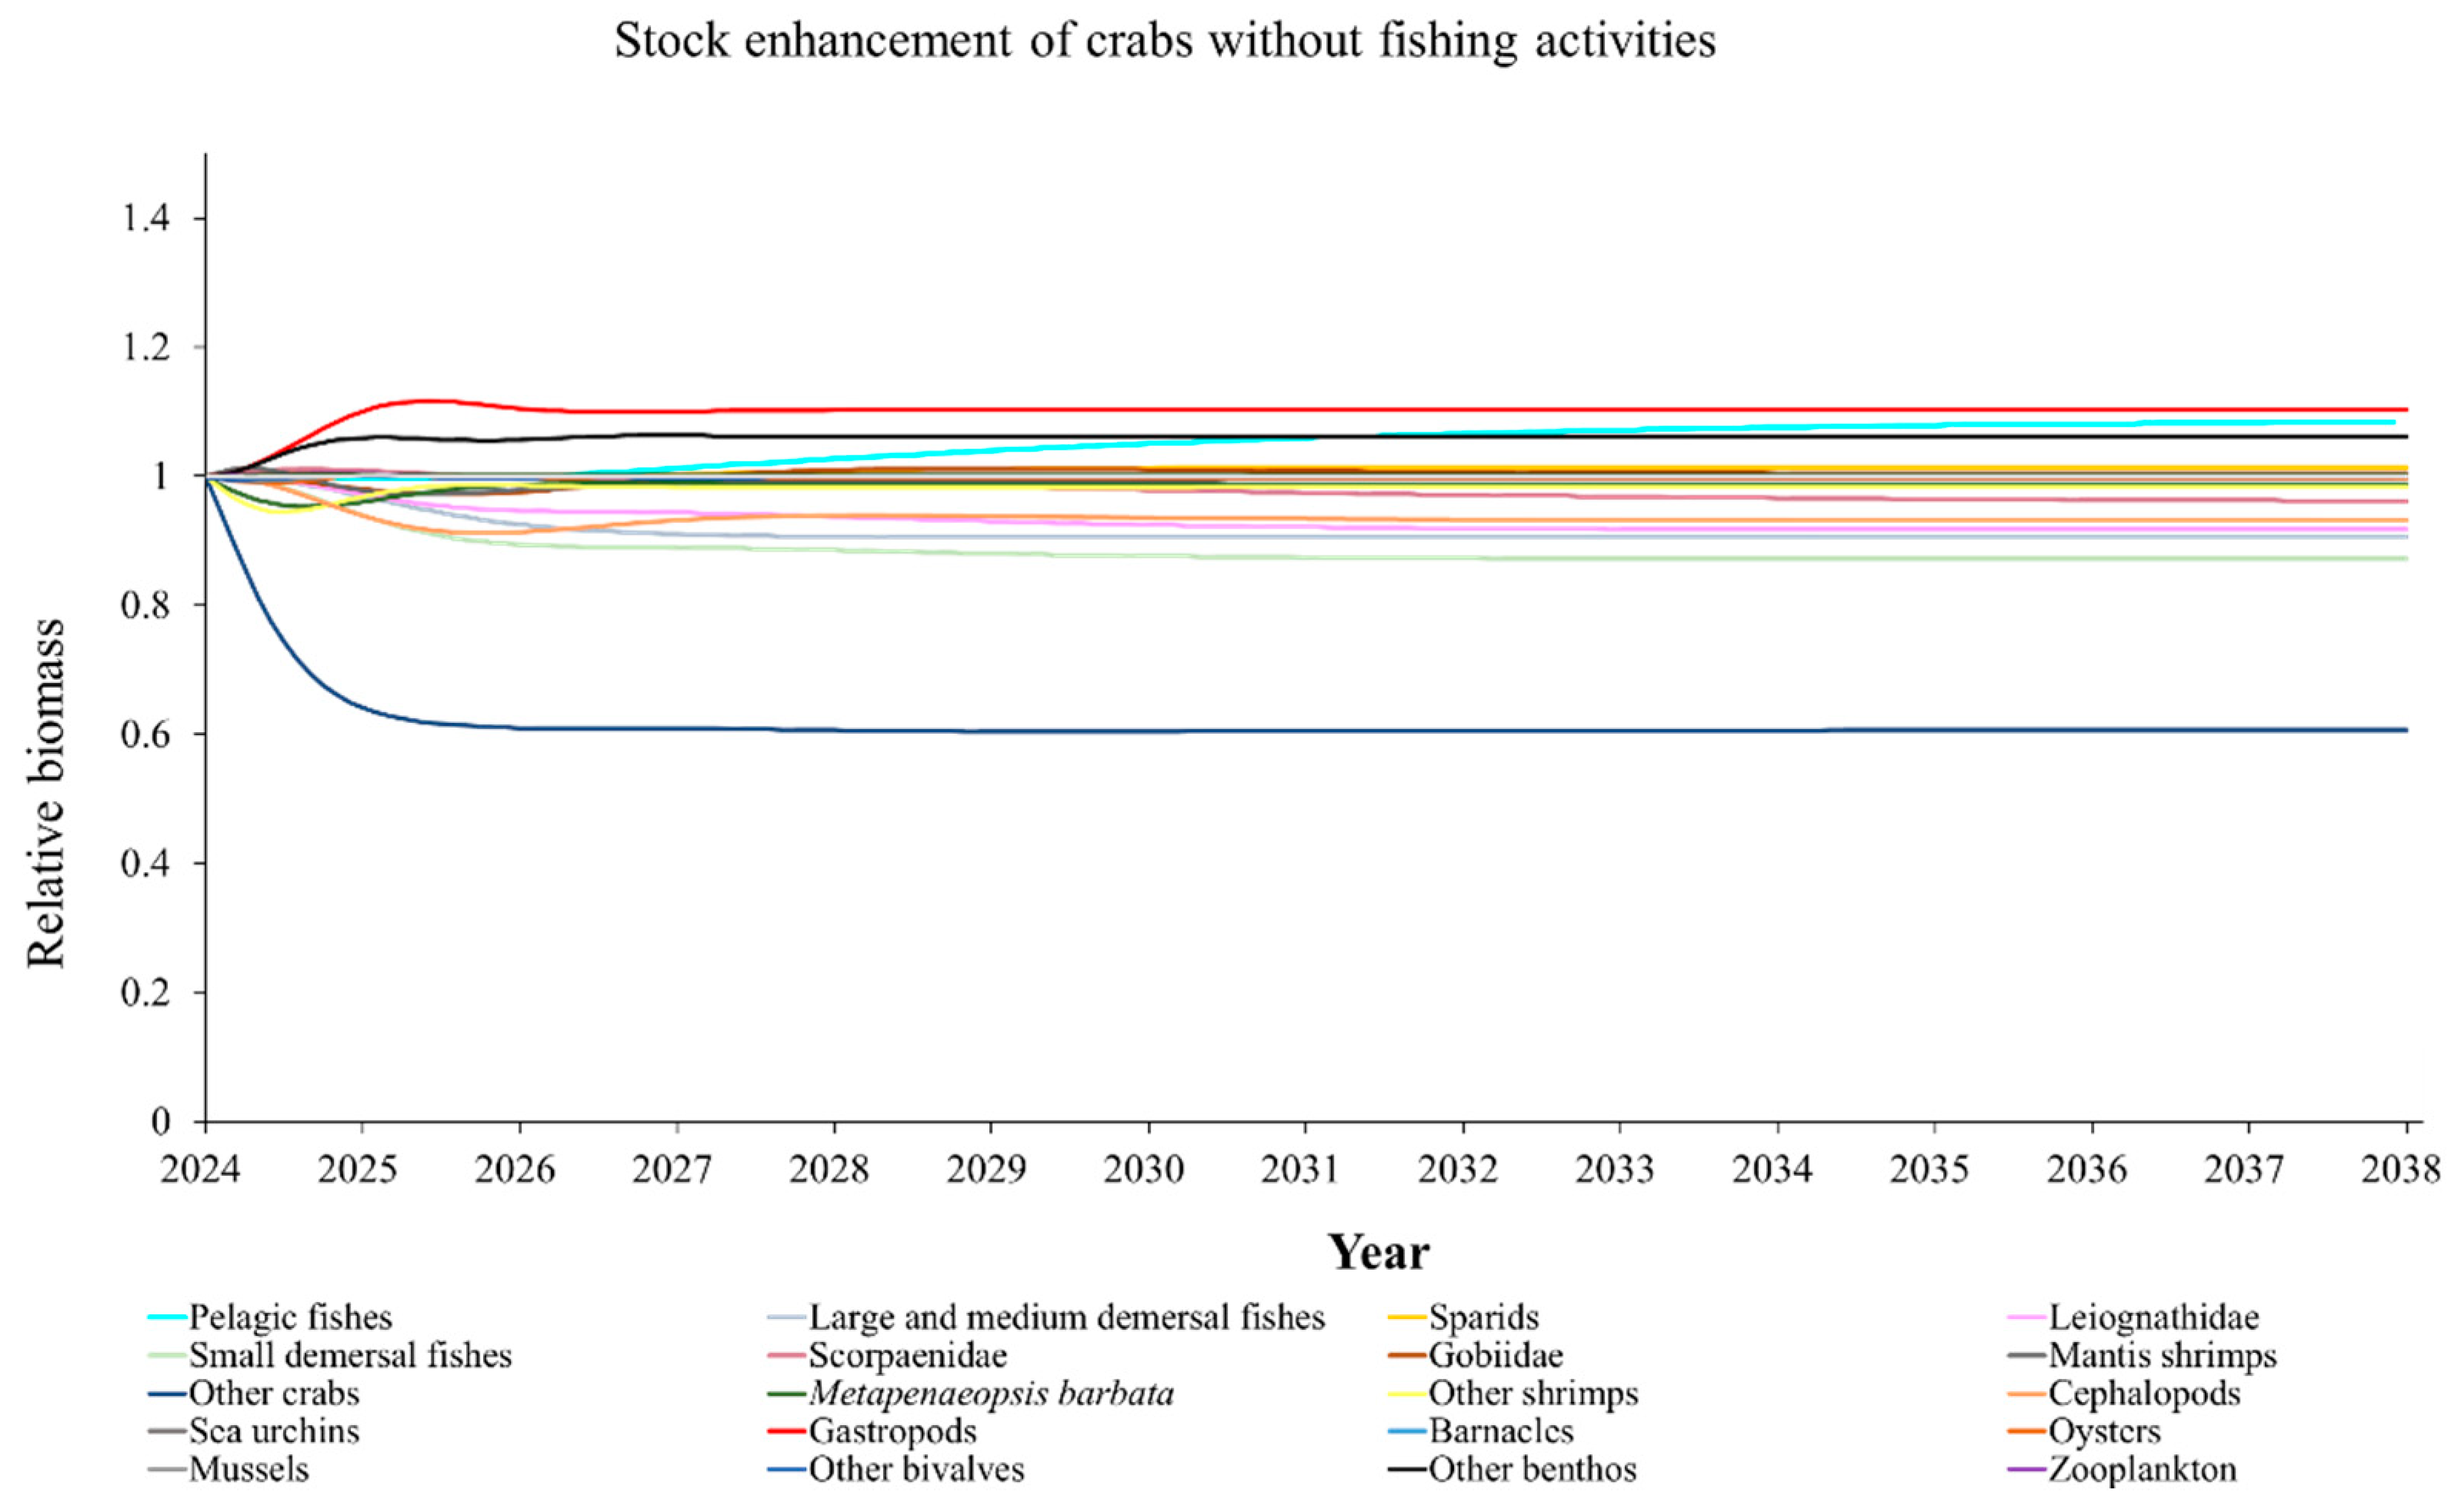
Figure A4.
Predicted relative changes in biomass of each functional group in the Ecopath Model of marine ranching ecosystem for the stock enhancement scenario of crabs (functional group of large crabs) with fishing activities.
Figure A4.
Predicted relative changes in biomass of each functional group in the Ecopath Model of marine ranching ecosystem for the stock enhancement scenario of crabs (functional group of large crabs) with fishing activities.
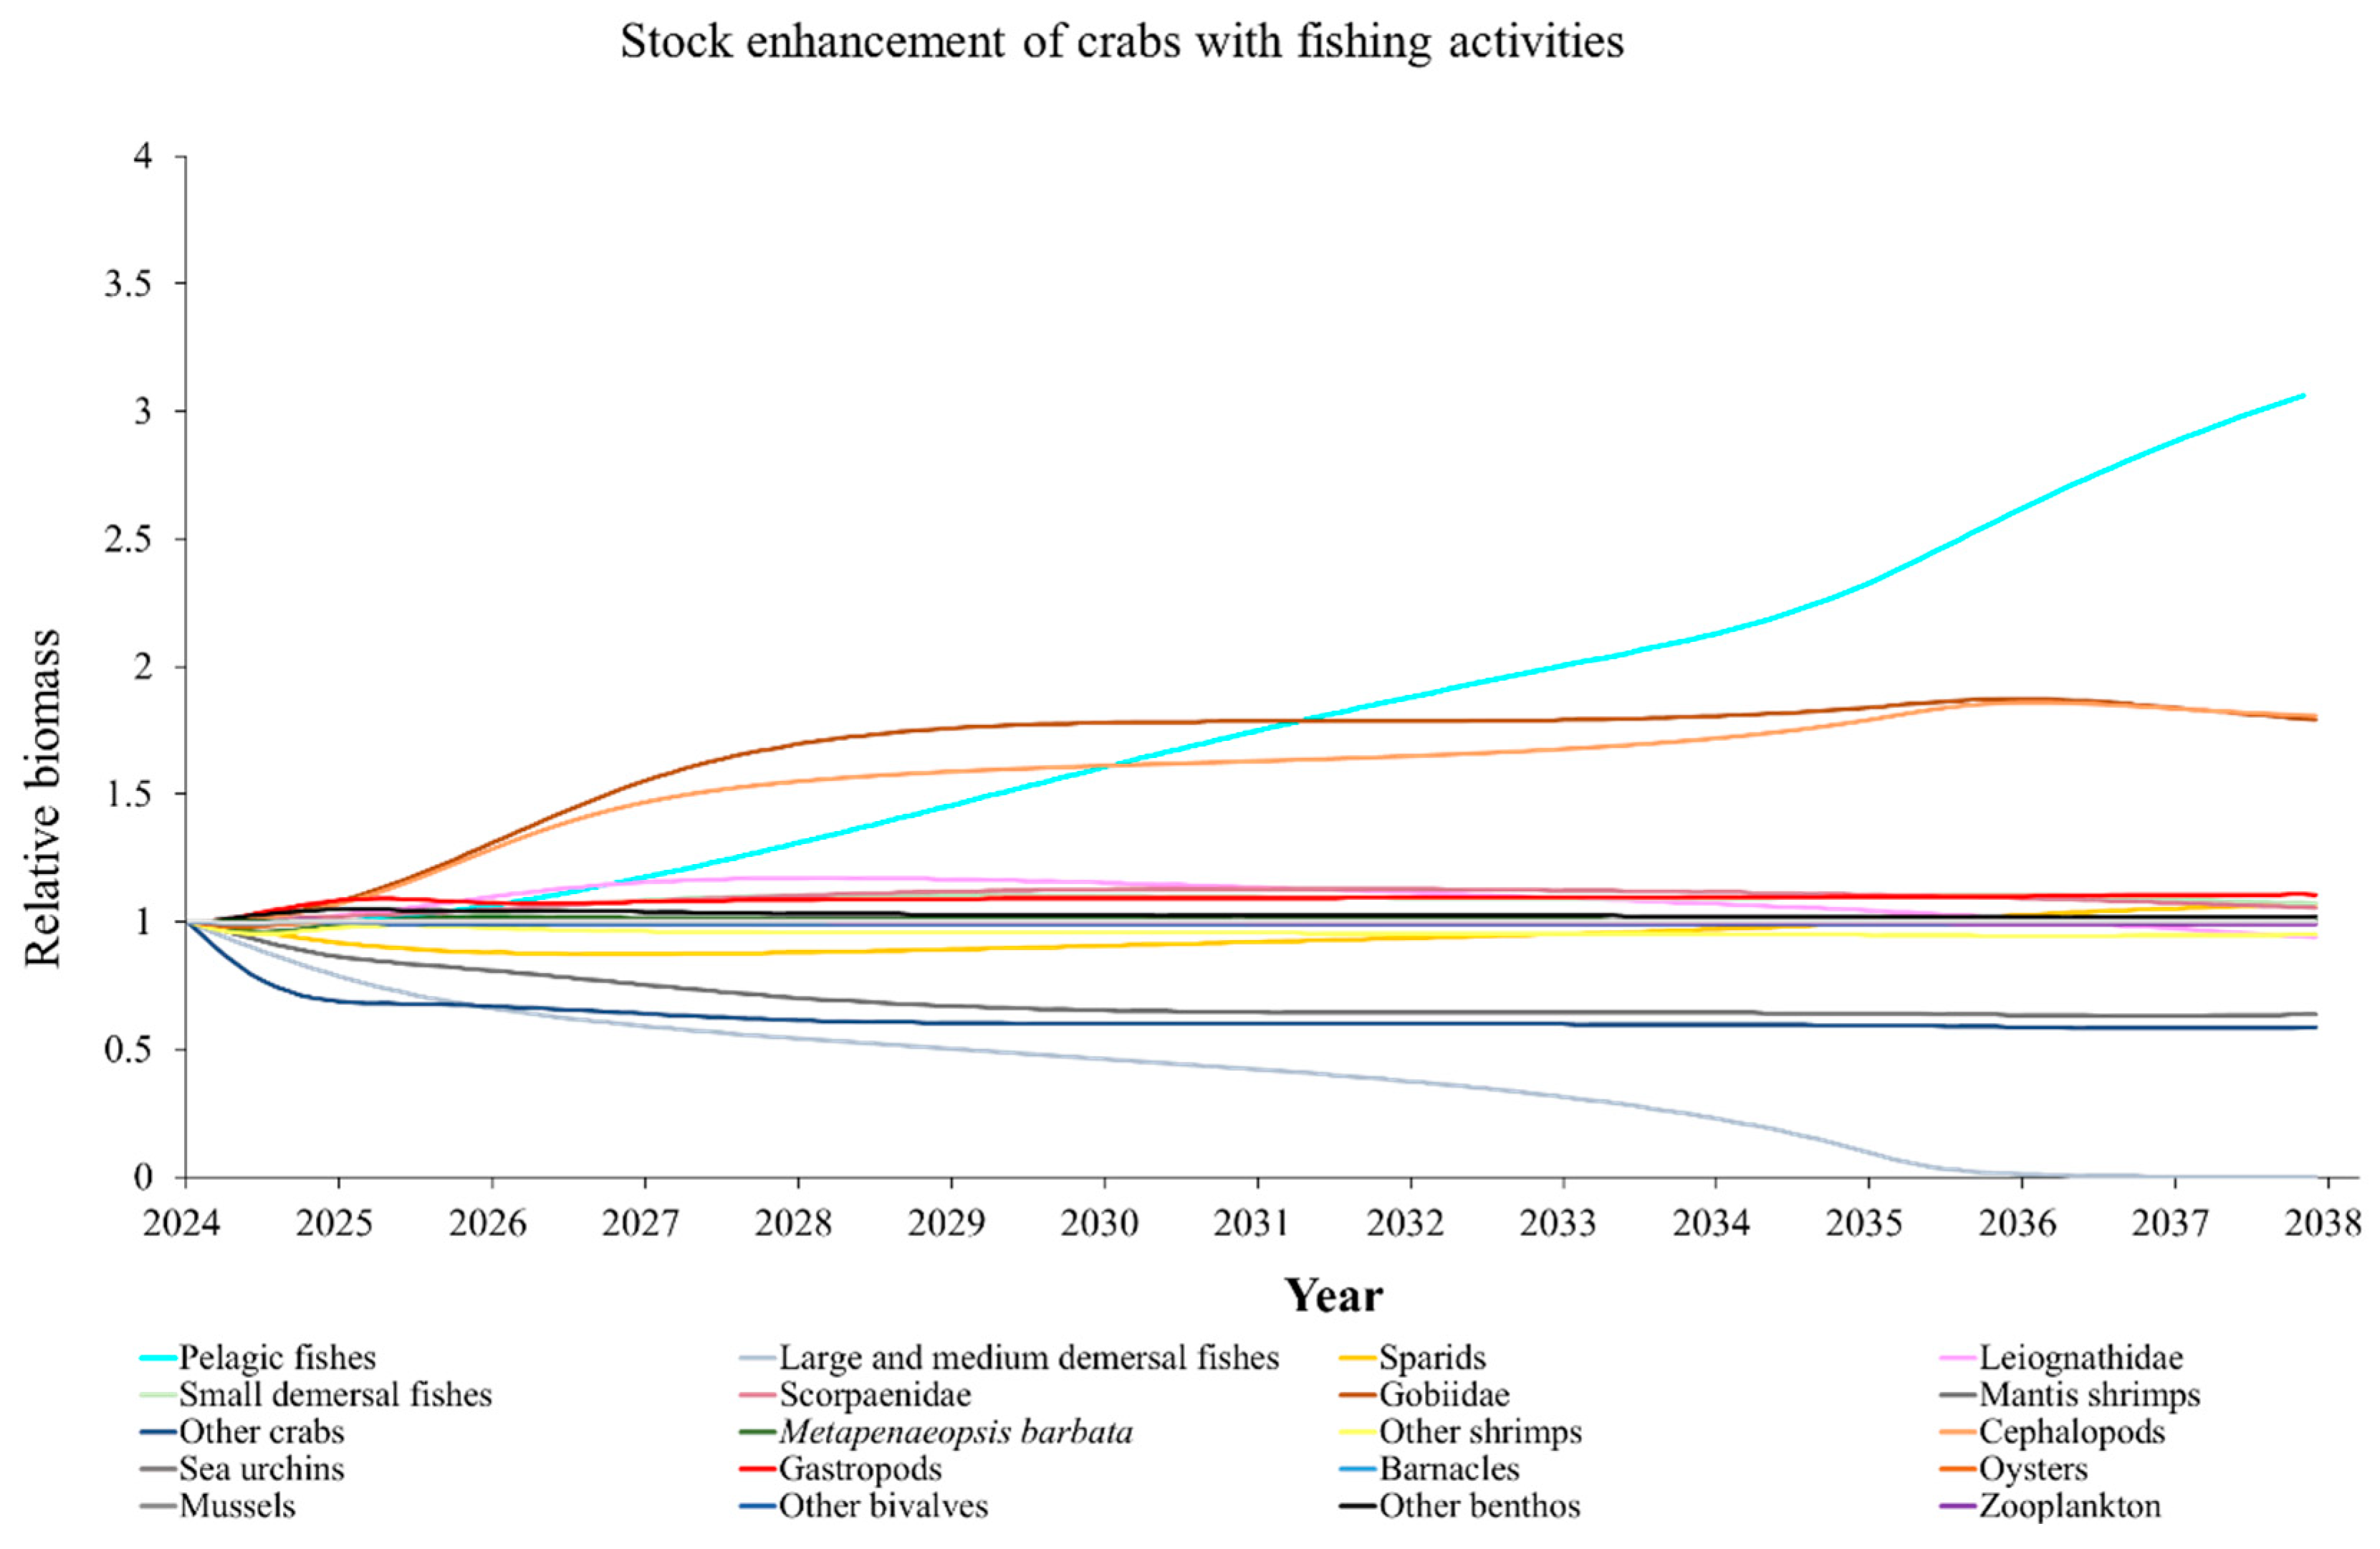
Figure A5.
Predicted relative changes in biomass of each functional group in the Ecopath Model of marine ranching ecosystem for the stock enhancement scenario of fish (functional group of scorpaenidae) without fishing activities.
Figure A5.
Predicted relative changes in biomass of each functional group in the Ecopath Model of marine ranching ecosystem for the stock enhancement scenario of fish (functional group of scorpaenidae) without fishing activities.
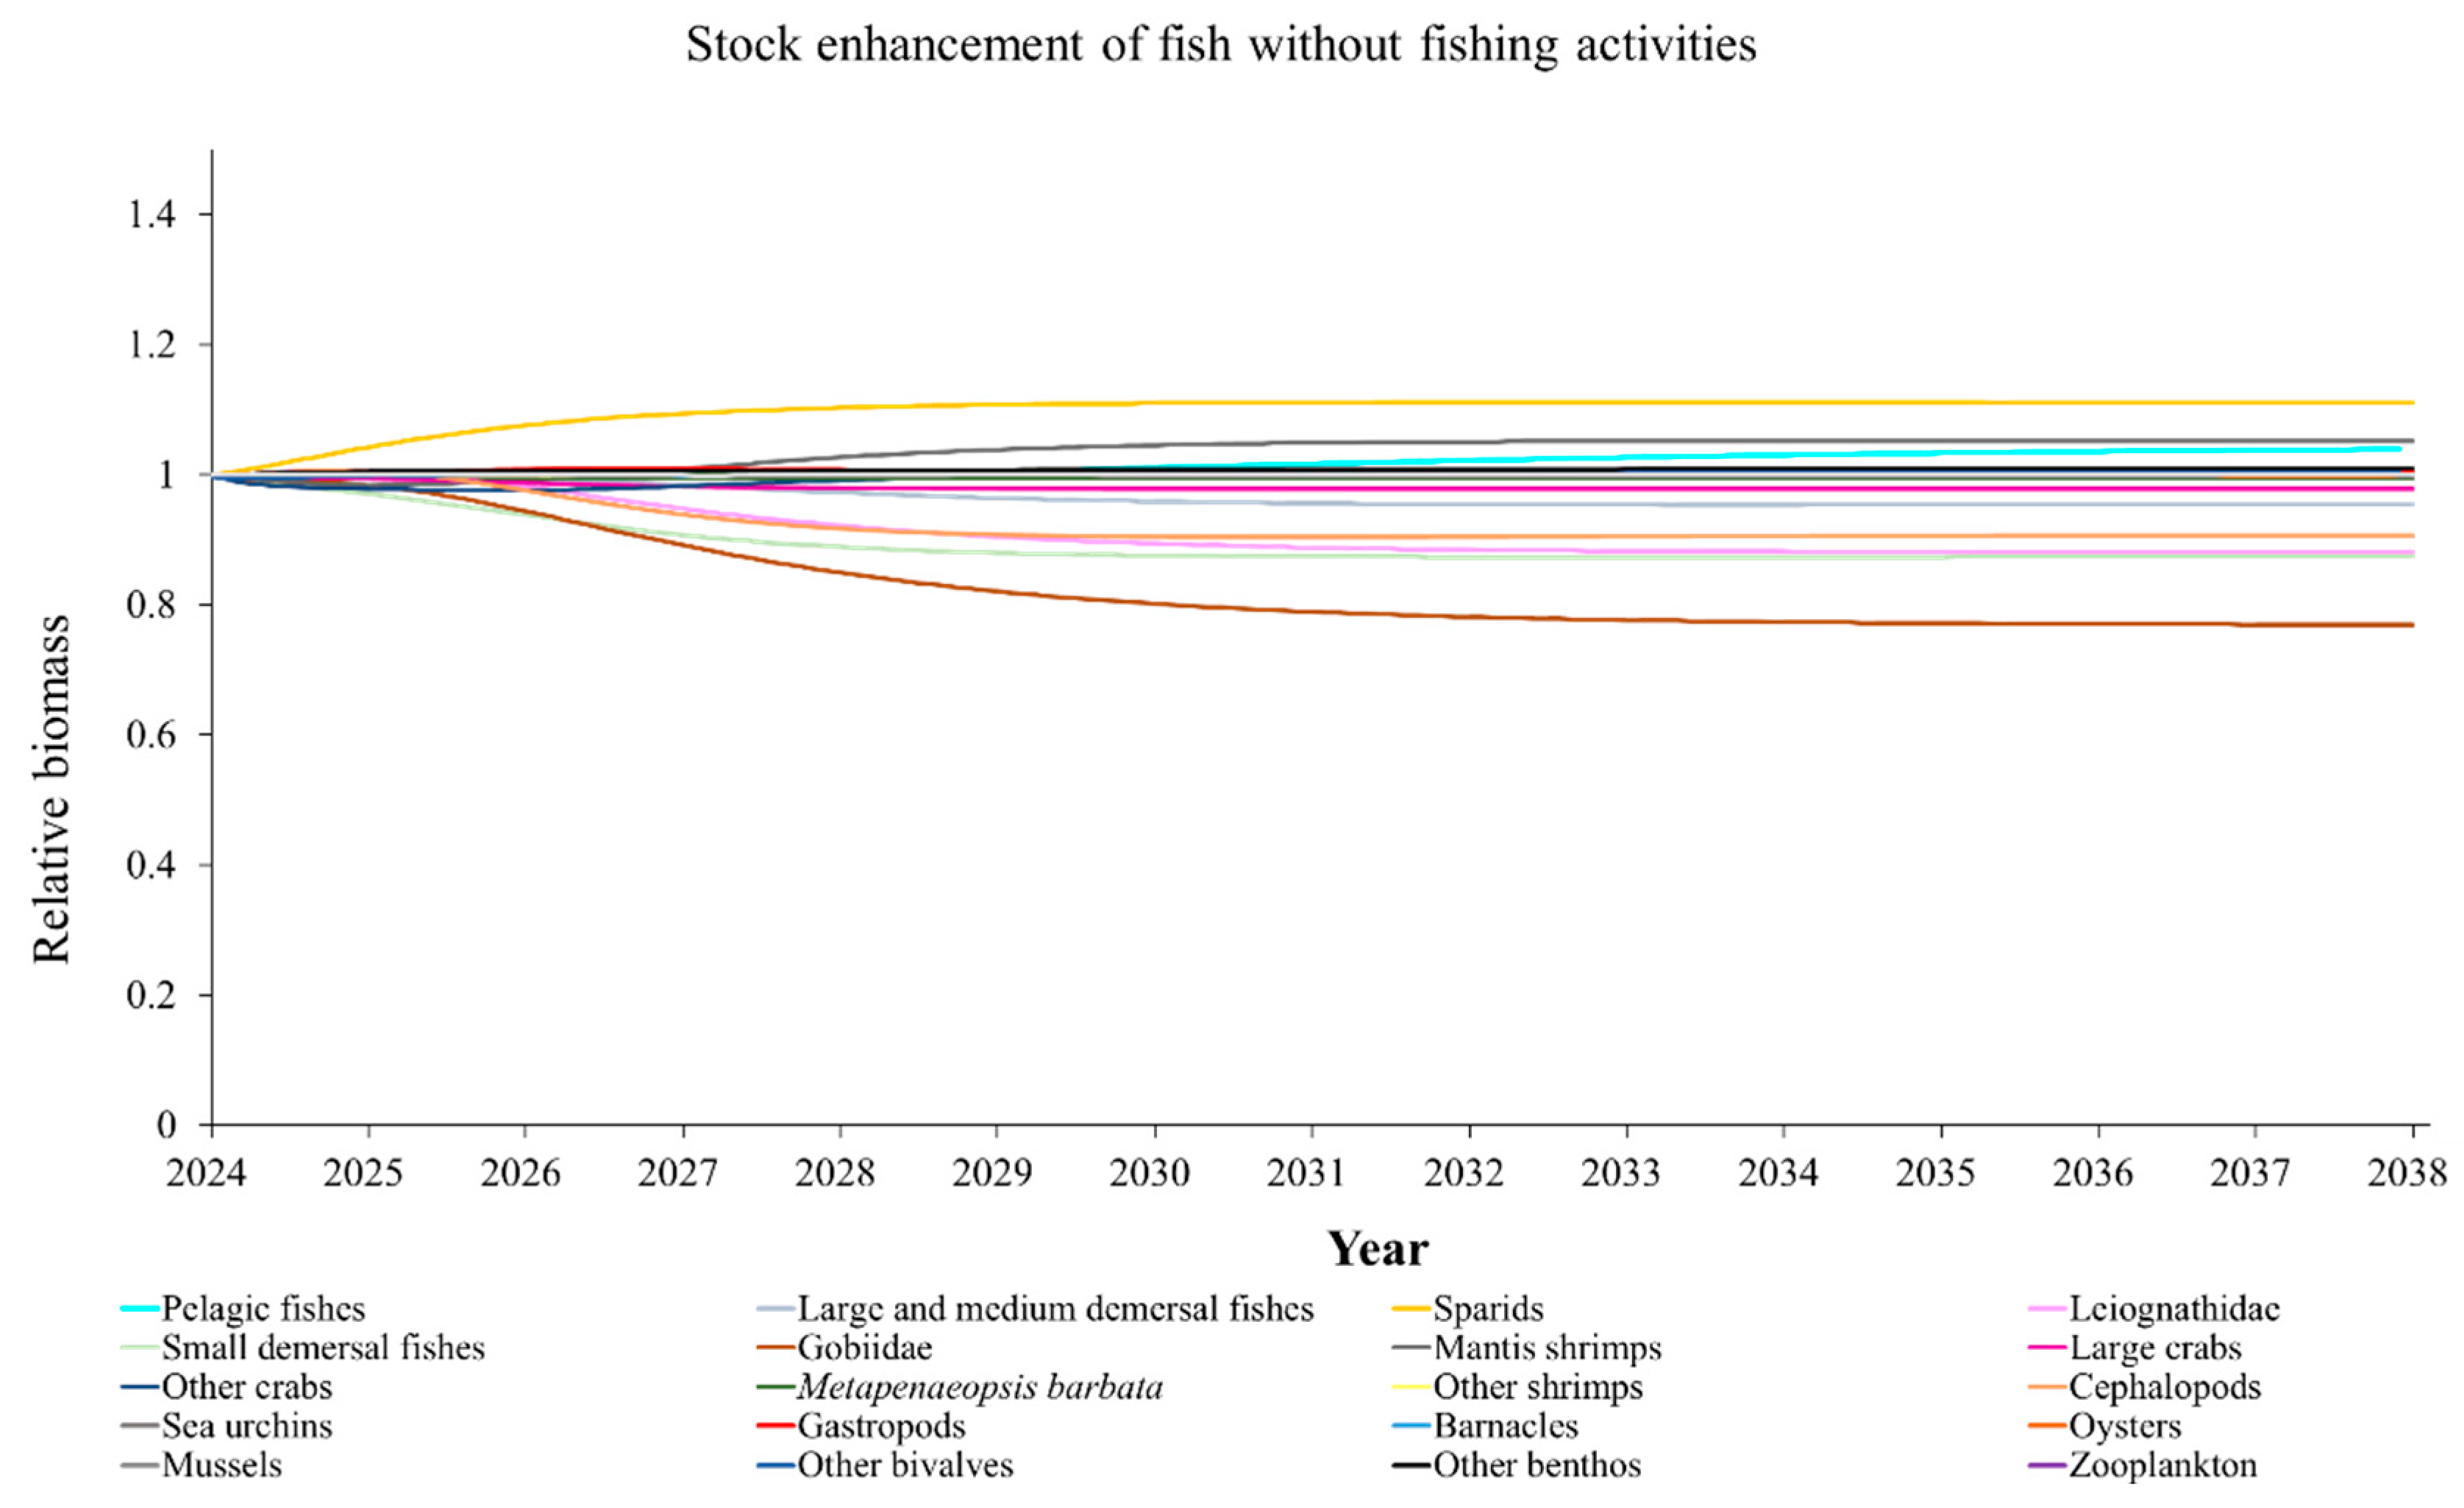
Figure A6.
Predicted relative changes in biomass of each functional group in the Ecopath Model of marine ranching ecosystem for the stock enhancement scenario of fish (functional group of scorpaenidae) with fishing activities.
Figure A6.
Predicted relative changes in biomass of each functional group in the Ecopath Model of marine ranching ecosystem for the stock enhancement scenario of fish (functional group of scorpaenidae) with fishing activities.
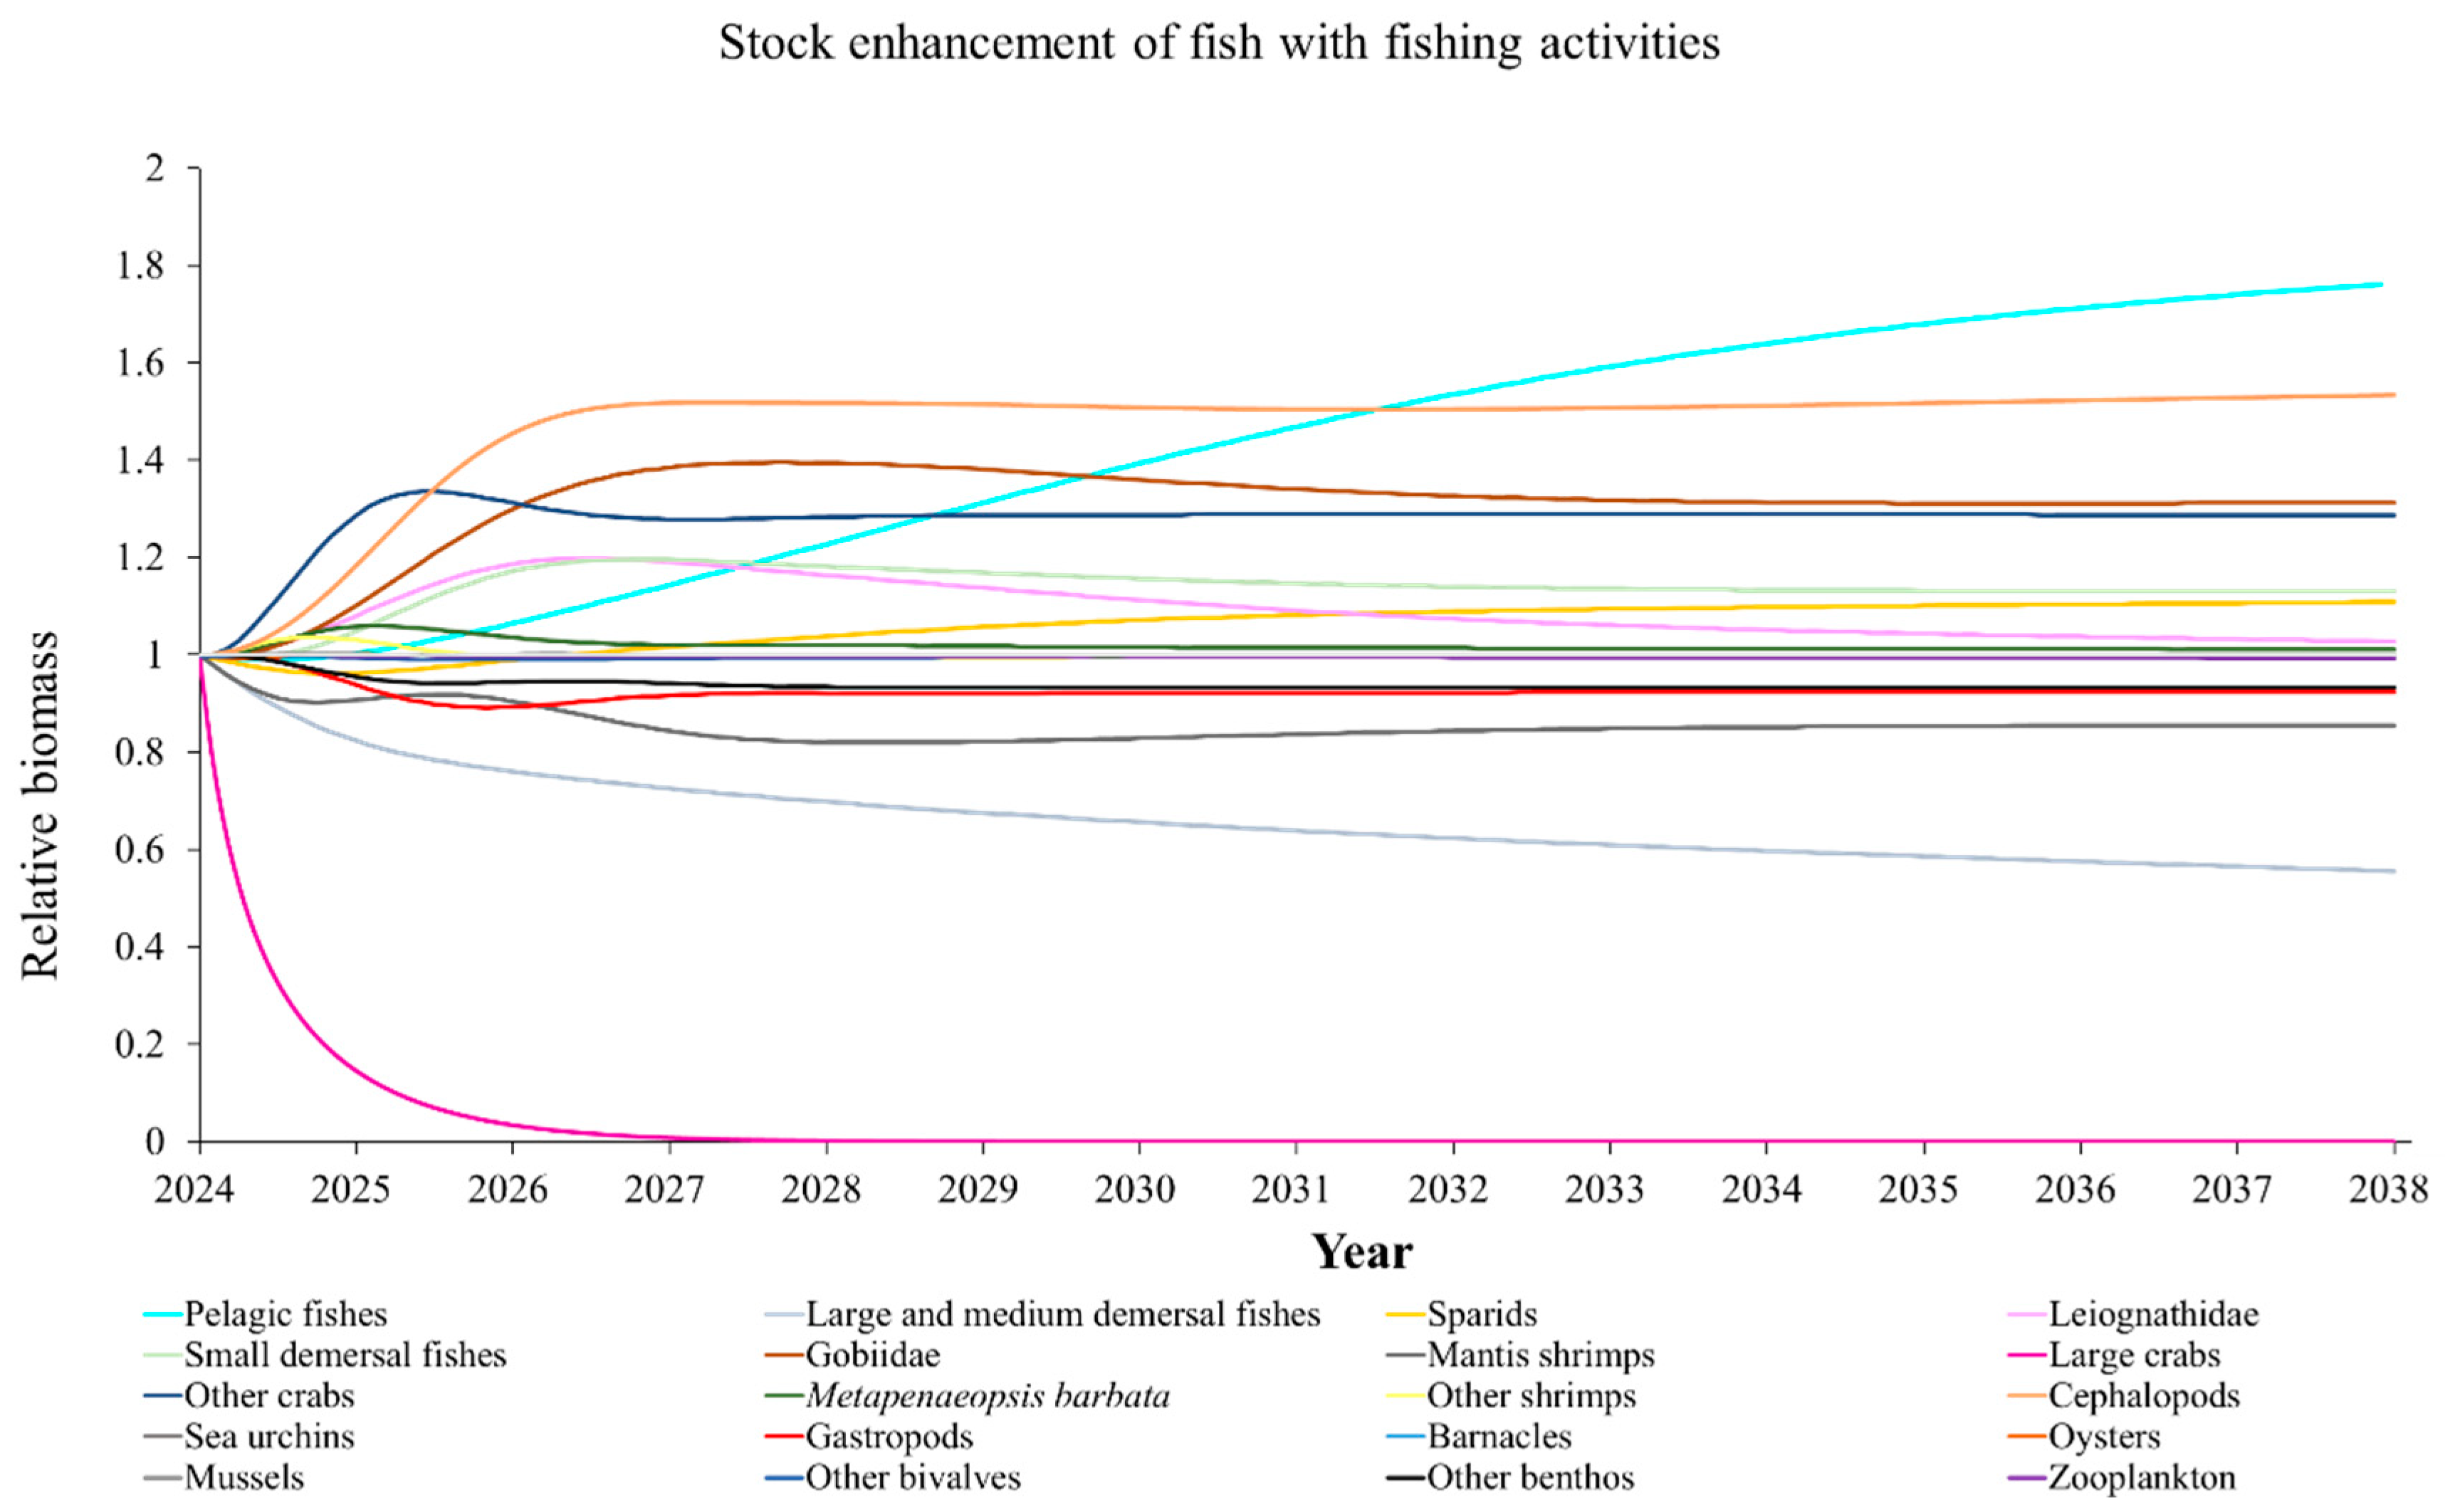
Figure A7.
Predicted relative changes in biomass of each functional group in the Ecopath Model of marine ranching ecosystem for the stock enhancement scenario of MOB and crabs without fishing activities.
Figure A7.
Predicted relative changes in biomass of each functional group in the Ecopath Model of marine ranching ecosystem for the stock enhancement scenario of MOB and crabs without fishing activities.
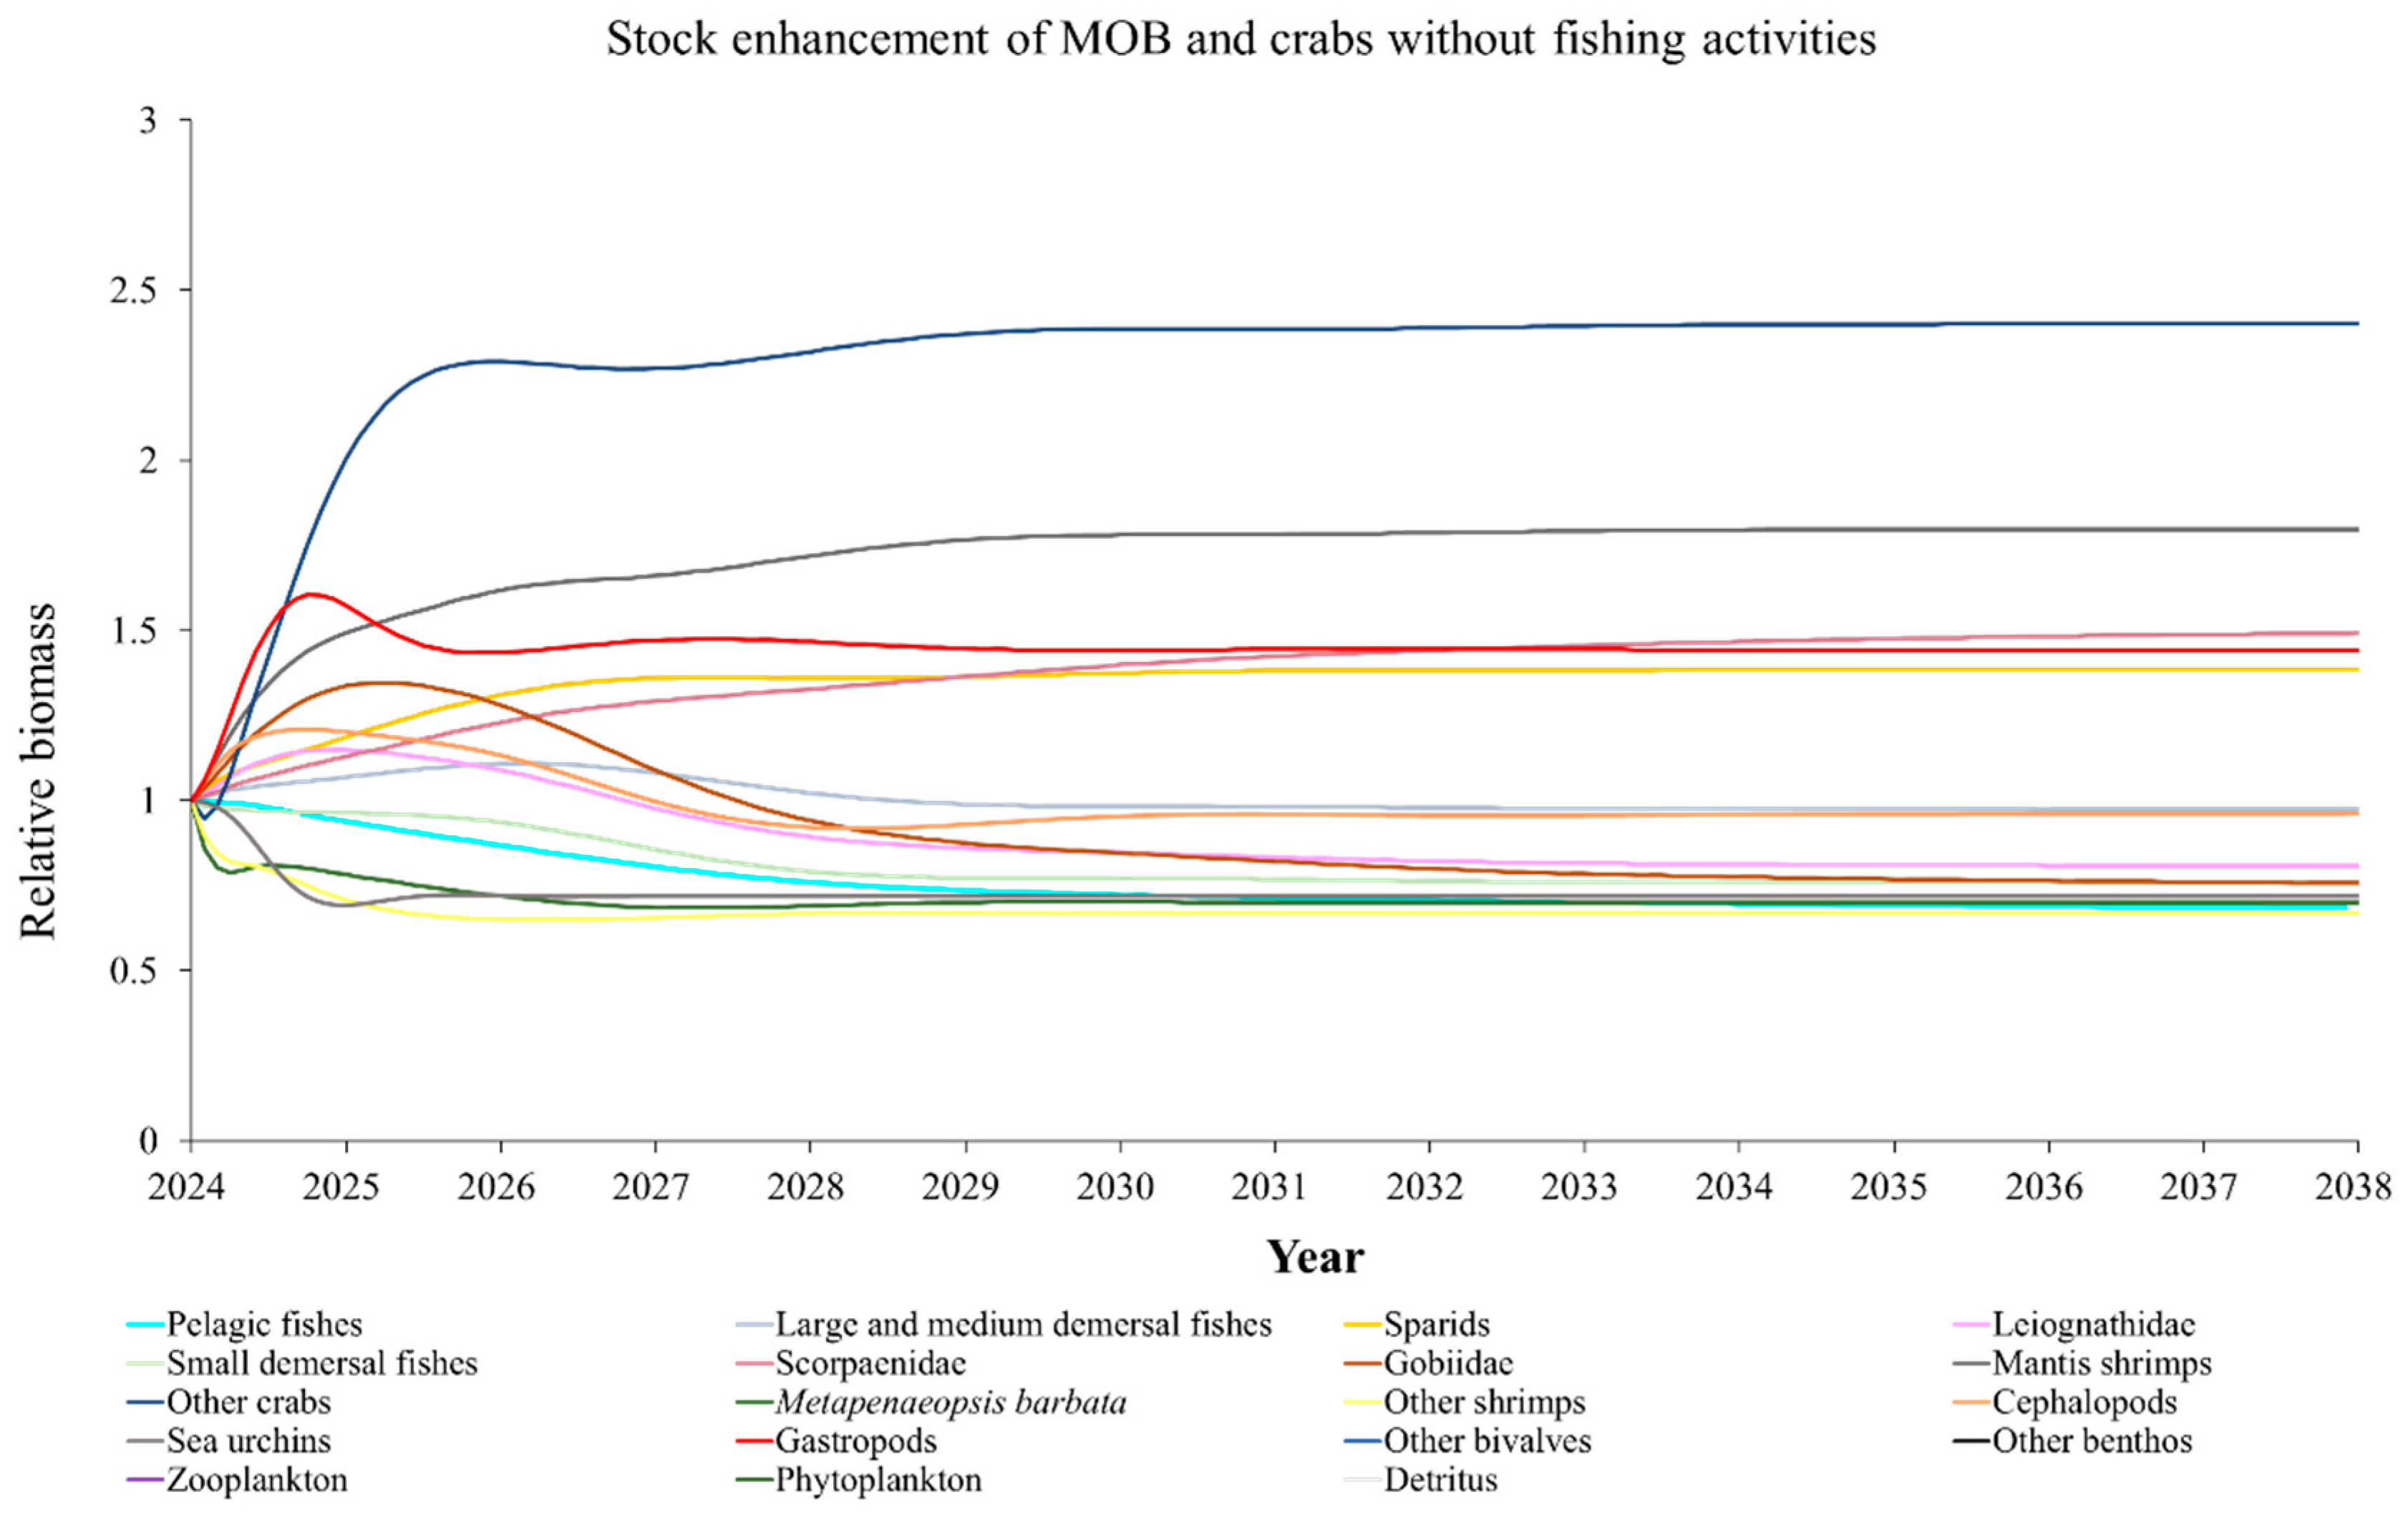
Figure A8.
Predicted relative changes in biomass of each functional group in the Ecopath Model of marine ranching ecosystem for the stock enhancement scenario of MOB and crabs with fishing activities.
Figure A8.
Predicted relative changes in biomass of each functional group in the Ecopath Model of marine ranching ecosystem for the stock enhancement scenario of MOB and crabs with fishing activities.
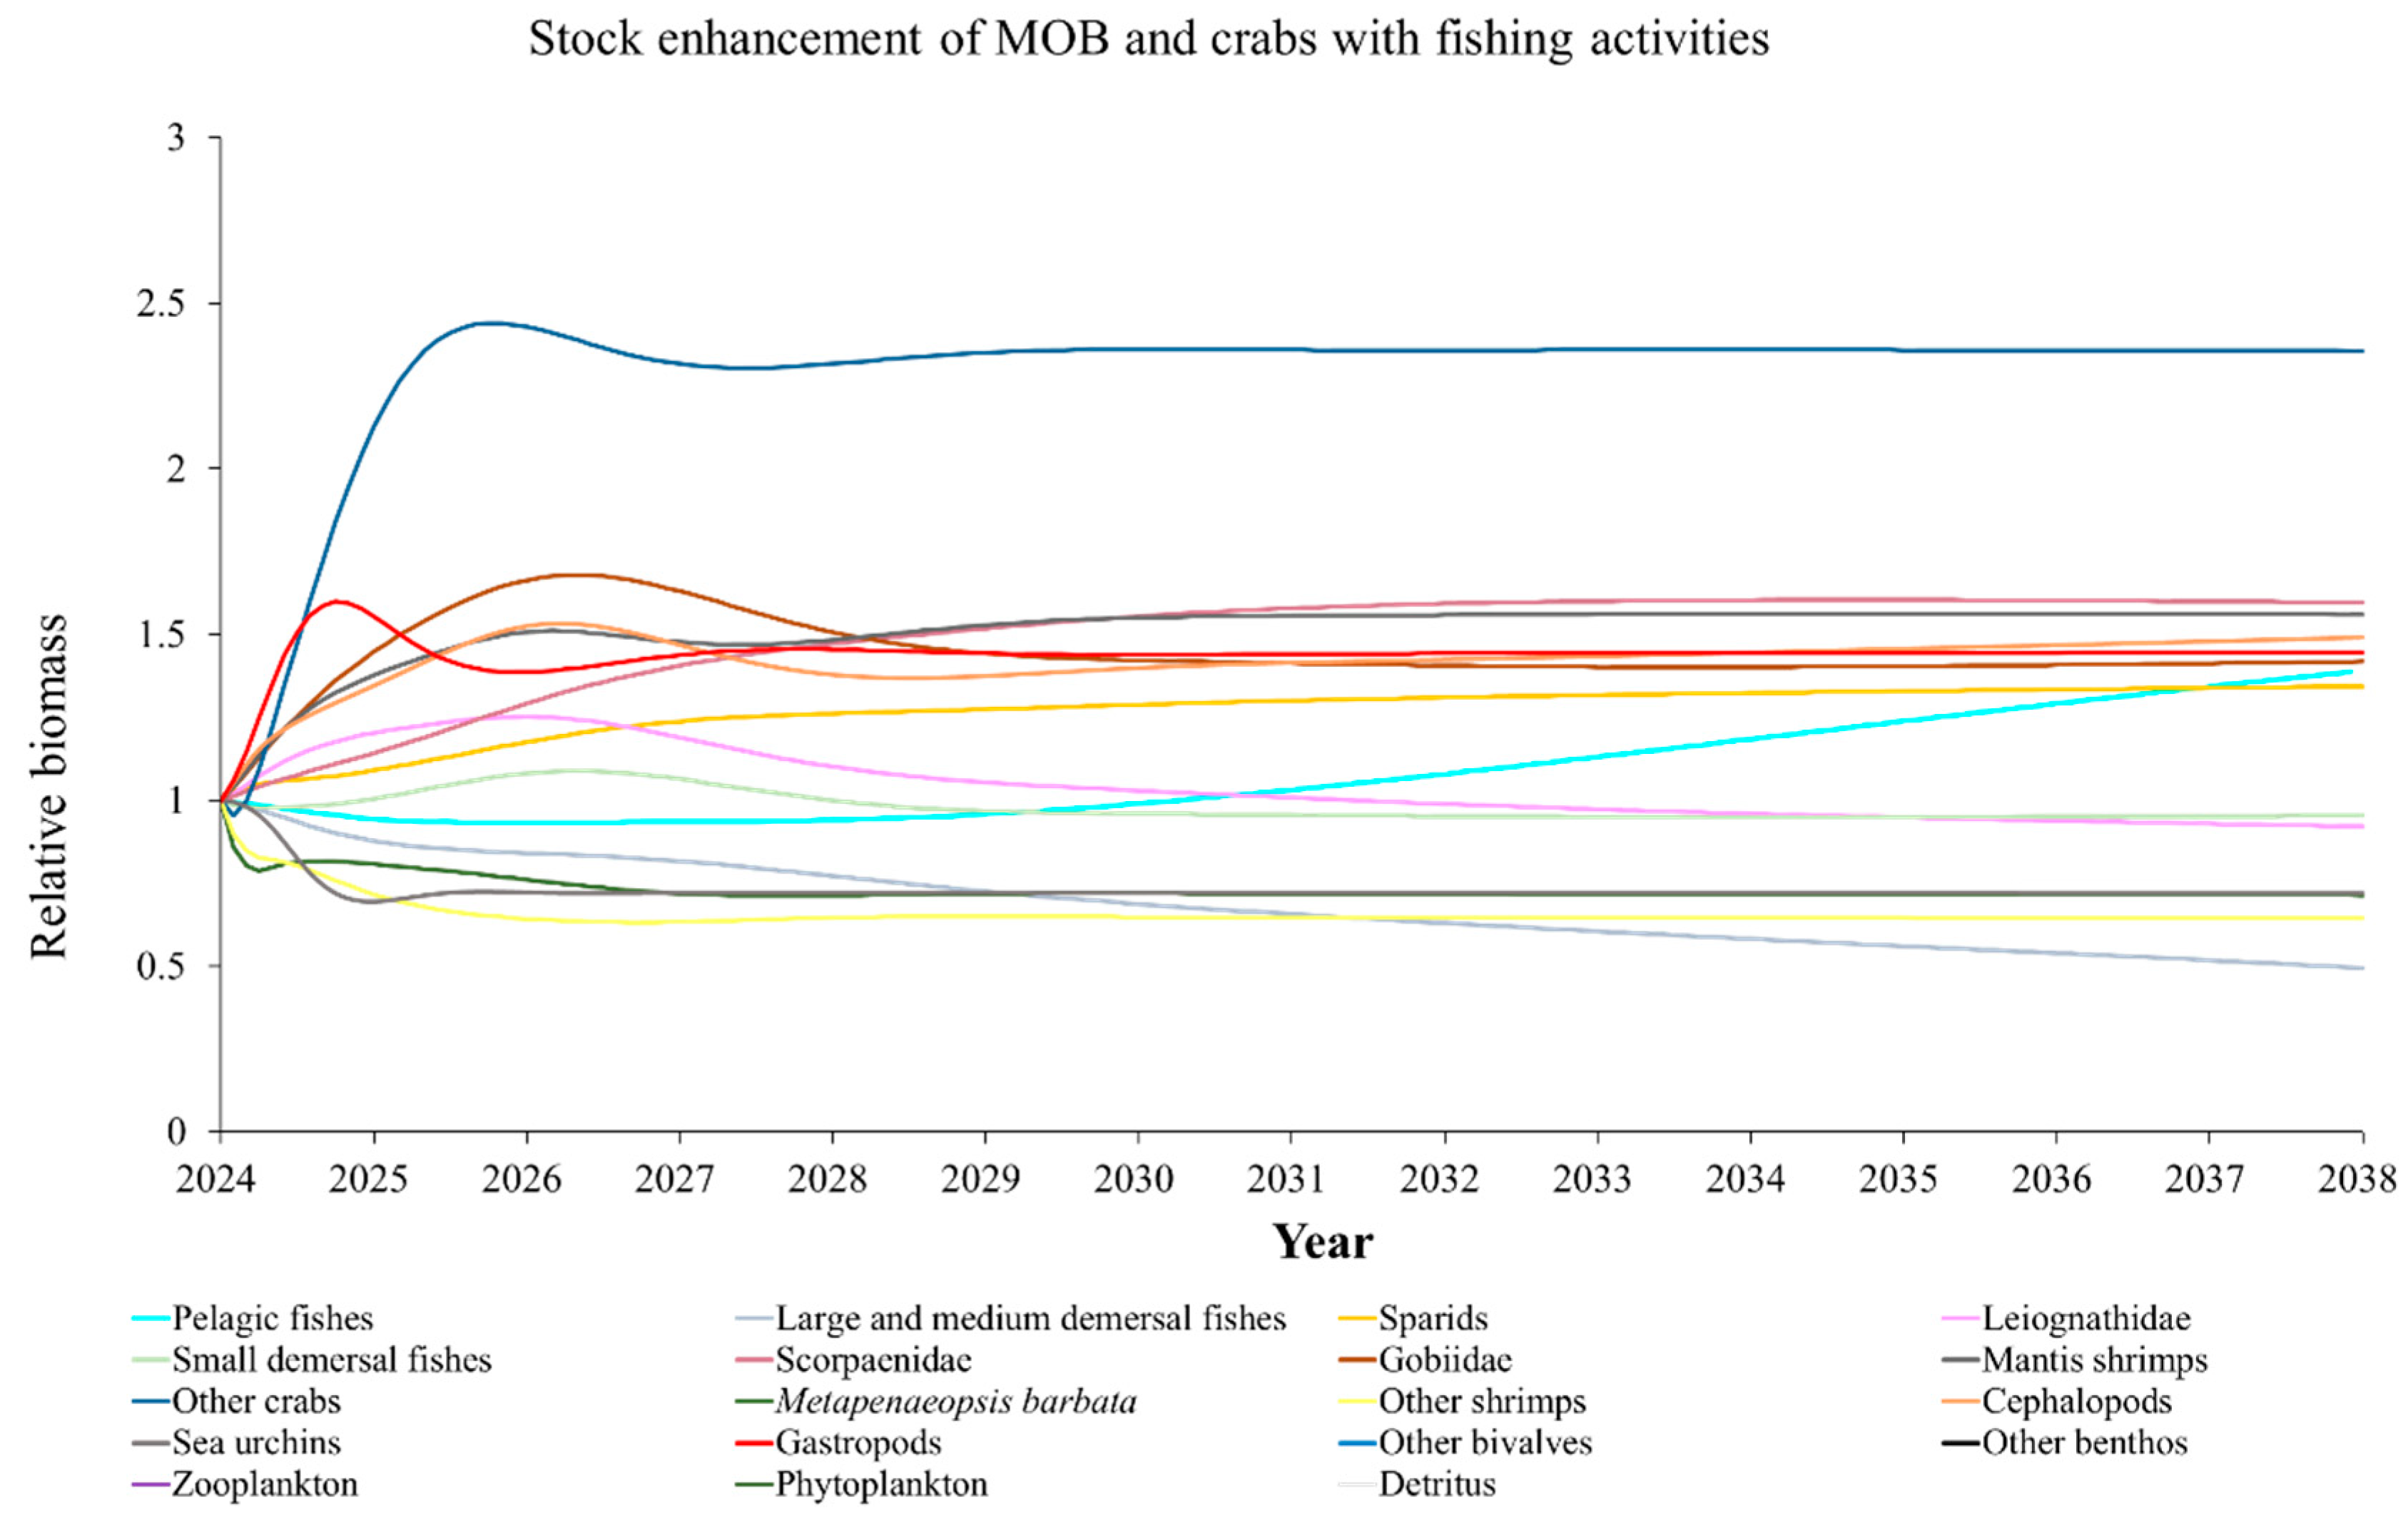
Figure A9.
Predicted relative changes in biomass of each functional group in the Ecopath Model of marine ranching ecosystem for the stock enhancement scenario of MOB and fish without fishing activities.
Figure A9.
Predicted relative changes in biomass of each functional group in the Ecopath Model of marine ranching ecosystem for the stock enhancement scenario of MOB and fish without fishing activities.
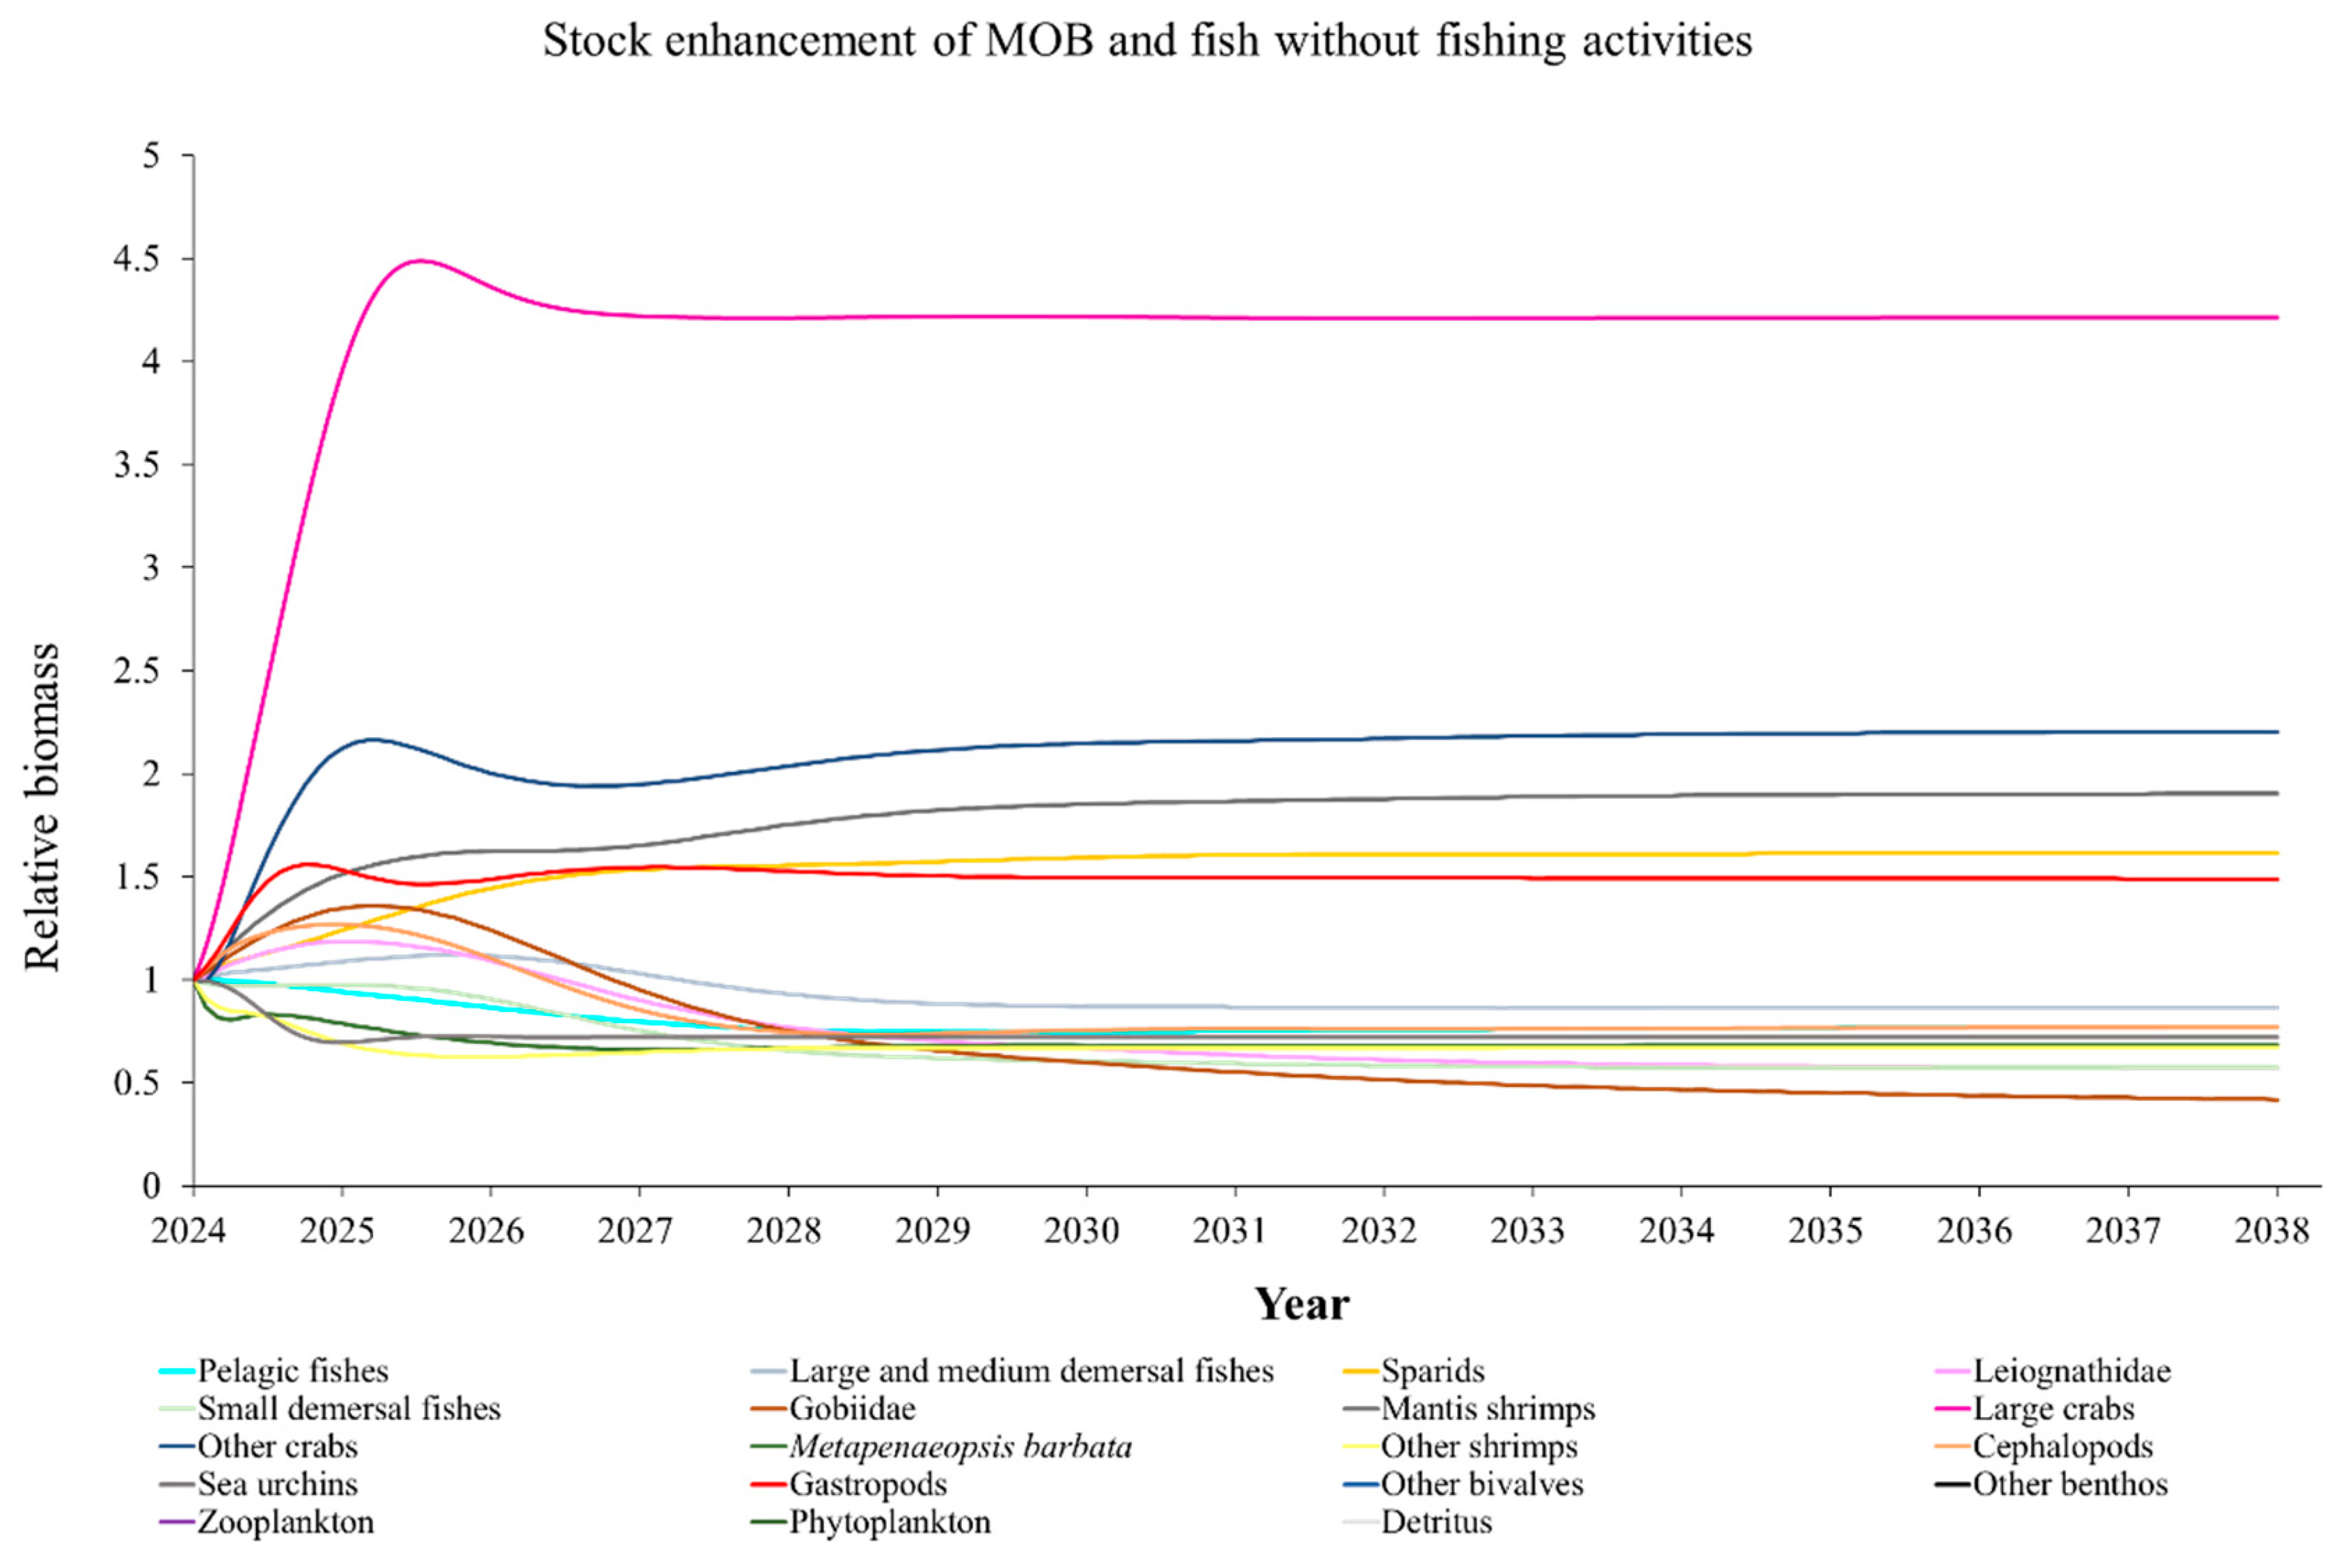
Figure A10.
Predicted relative changes in biomass of each functional group in the Ecopath Model of marine ranching ecosystem for the stock enhancement scenario of MOB and fish with fishing activities.
Figure A10.
Predicted relative changes in biomass of each functional group in the Ecopath Model of marine ranching ecosystem for the stock enhancement scenario of MOB and fish with fishing activities.
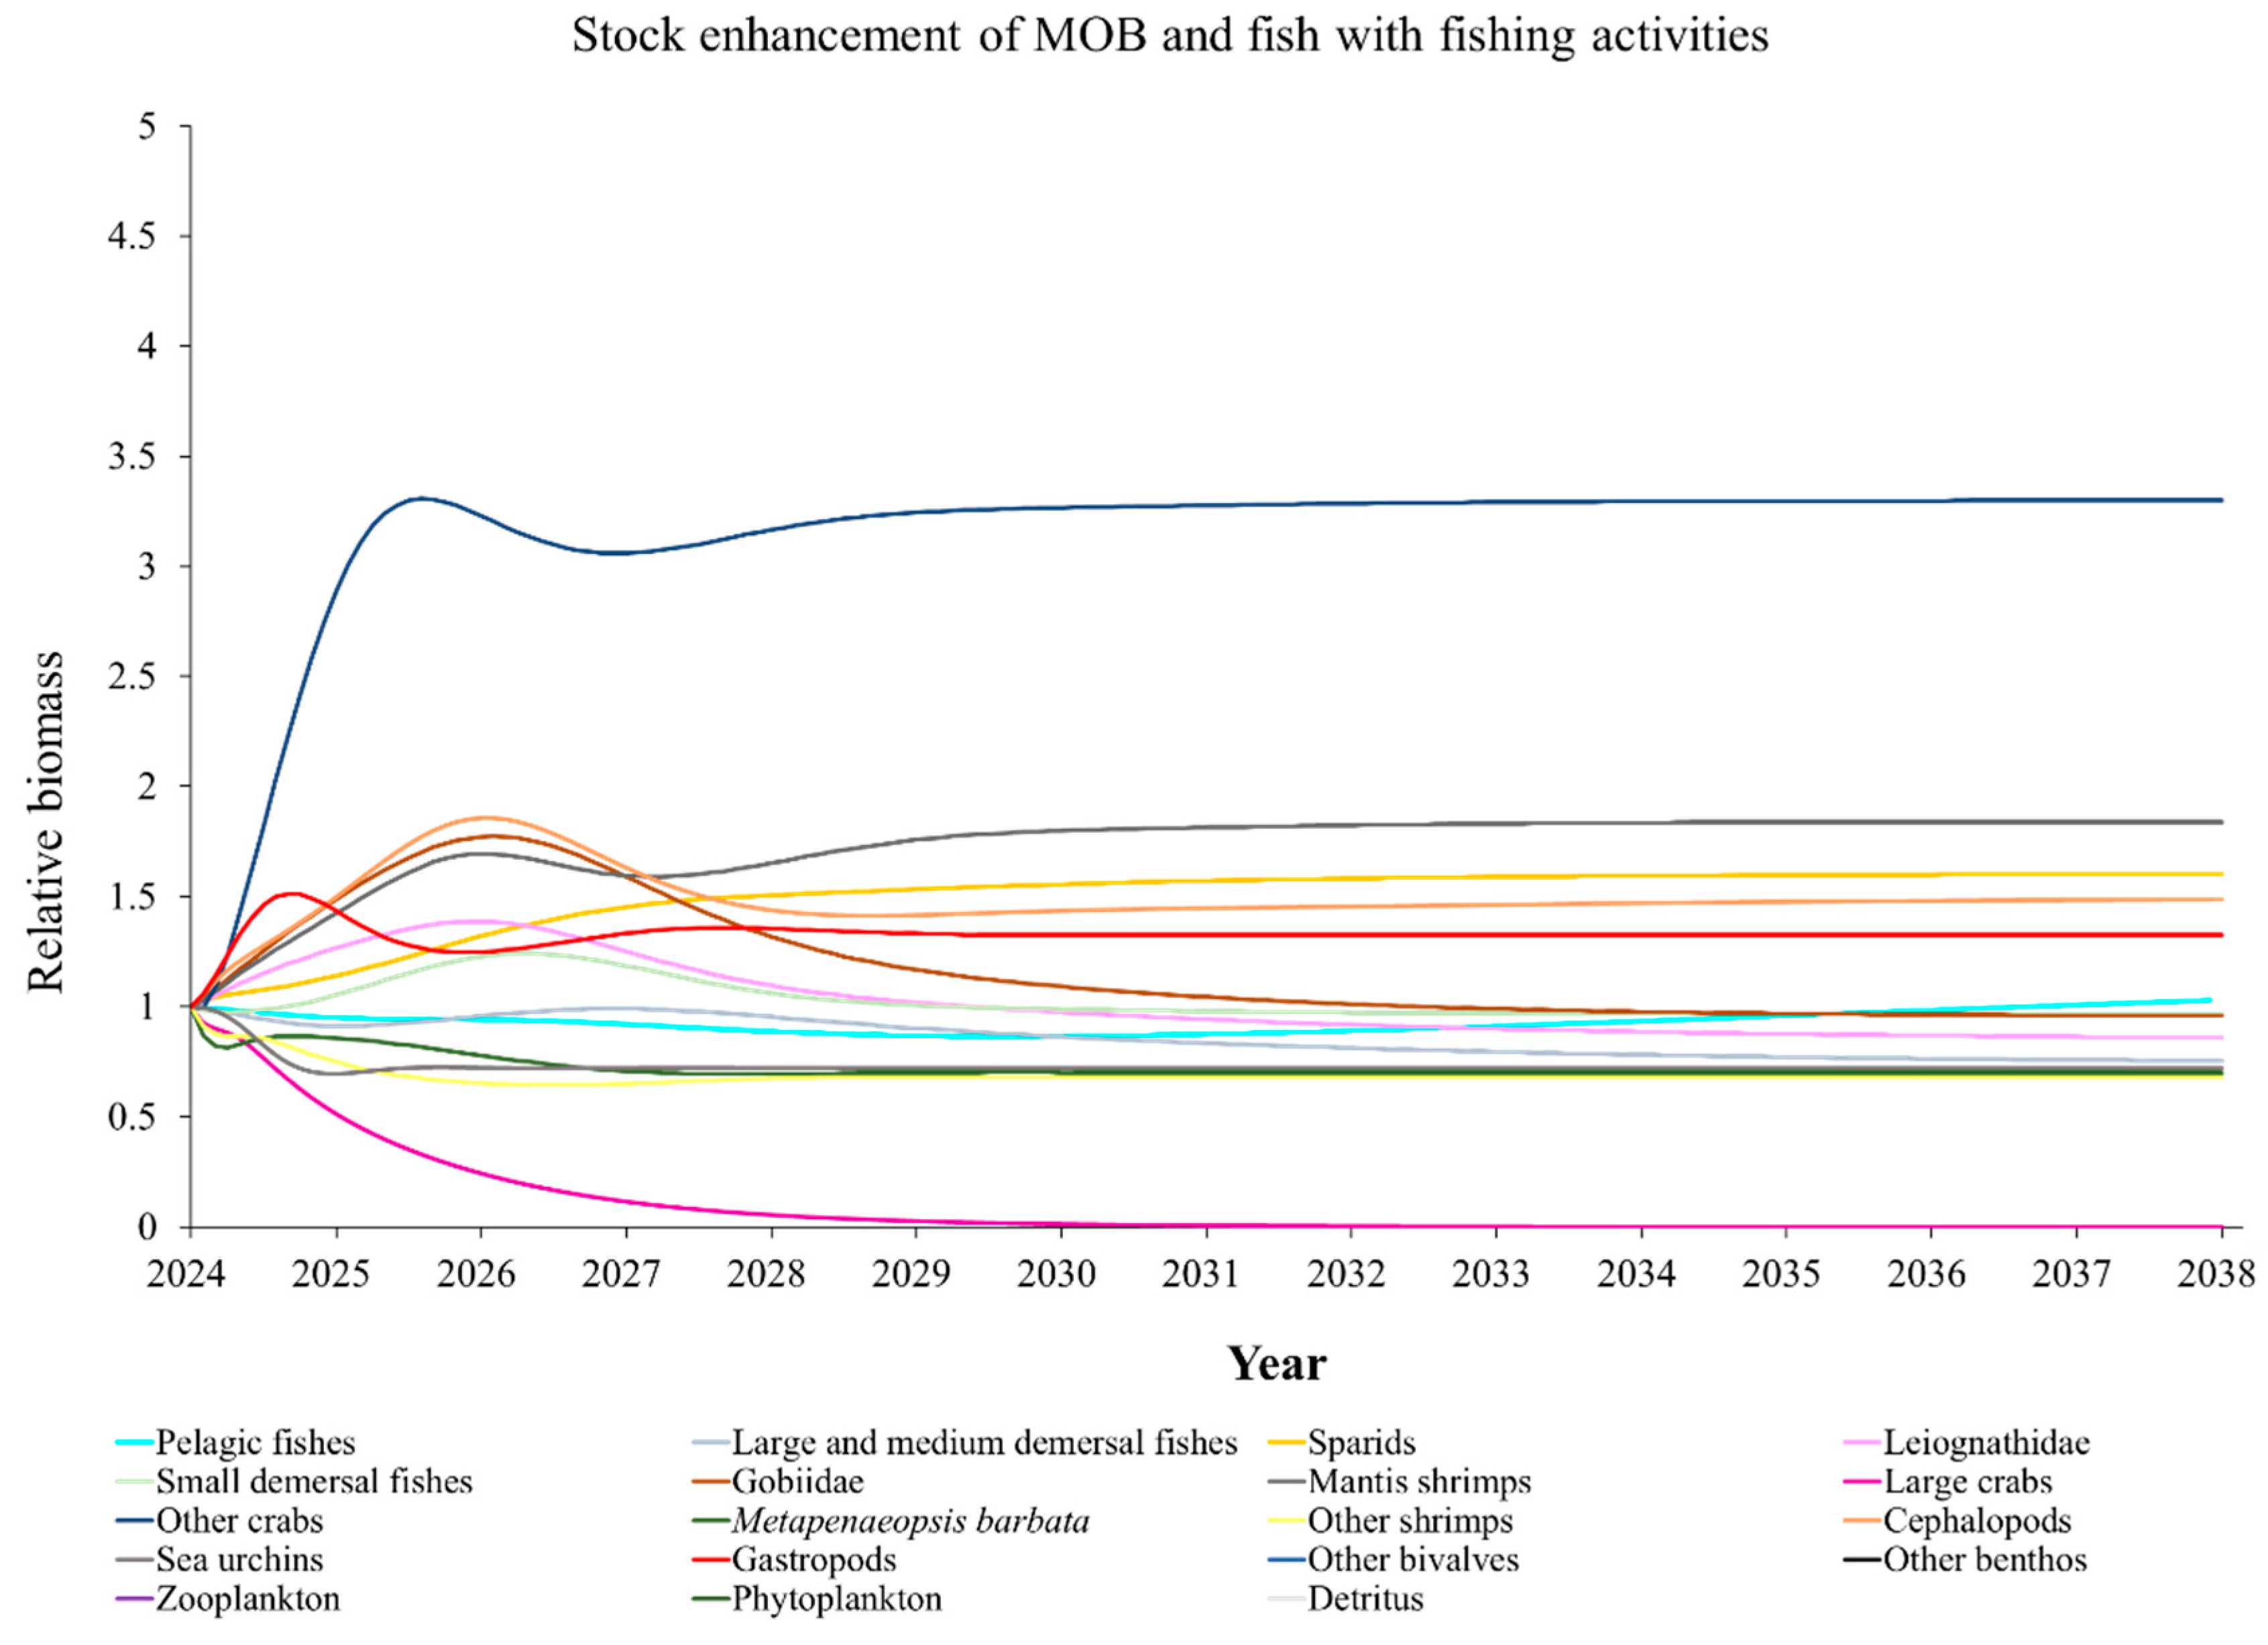
Figure A11.
Predicted relative changes in biomass of each functional group in the Ecopath Model of marine ranching ecosystem for the stock enhancement scenario of MOB, crabs, and fish without fishing activities.
Figure A11.
Predicted relative changes in biomass of each functional group in the Ecopath Model of marine ranching ecosystem for the stock enhancement scenario of MOB, crabs, and fish without fishing activities.
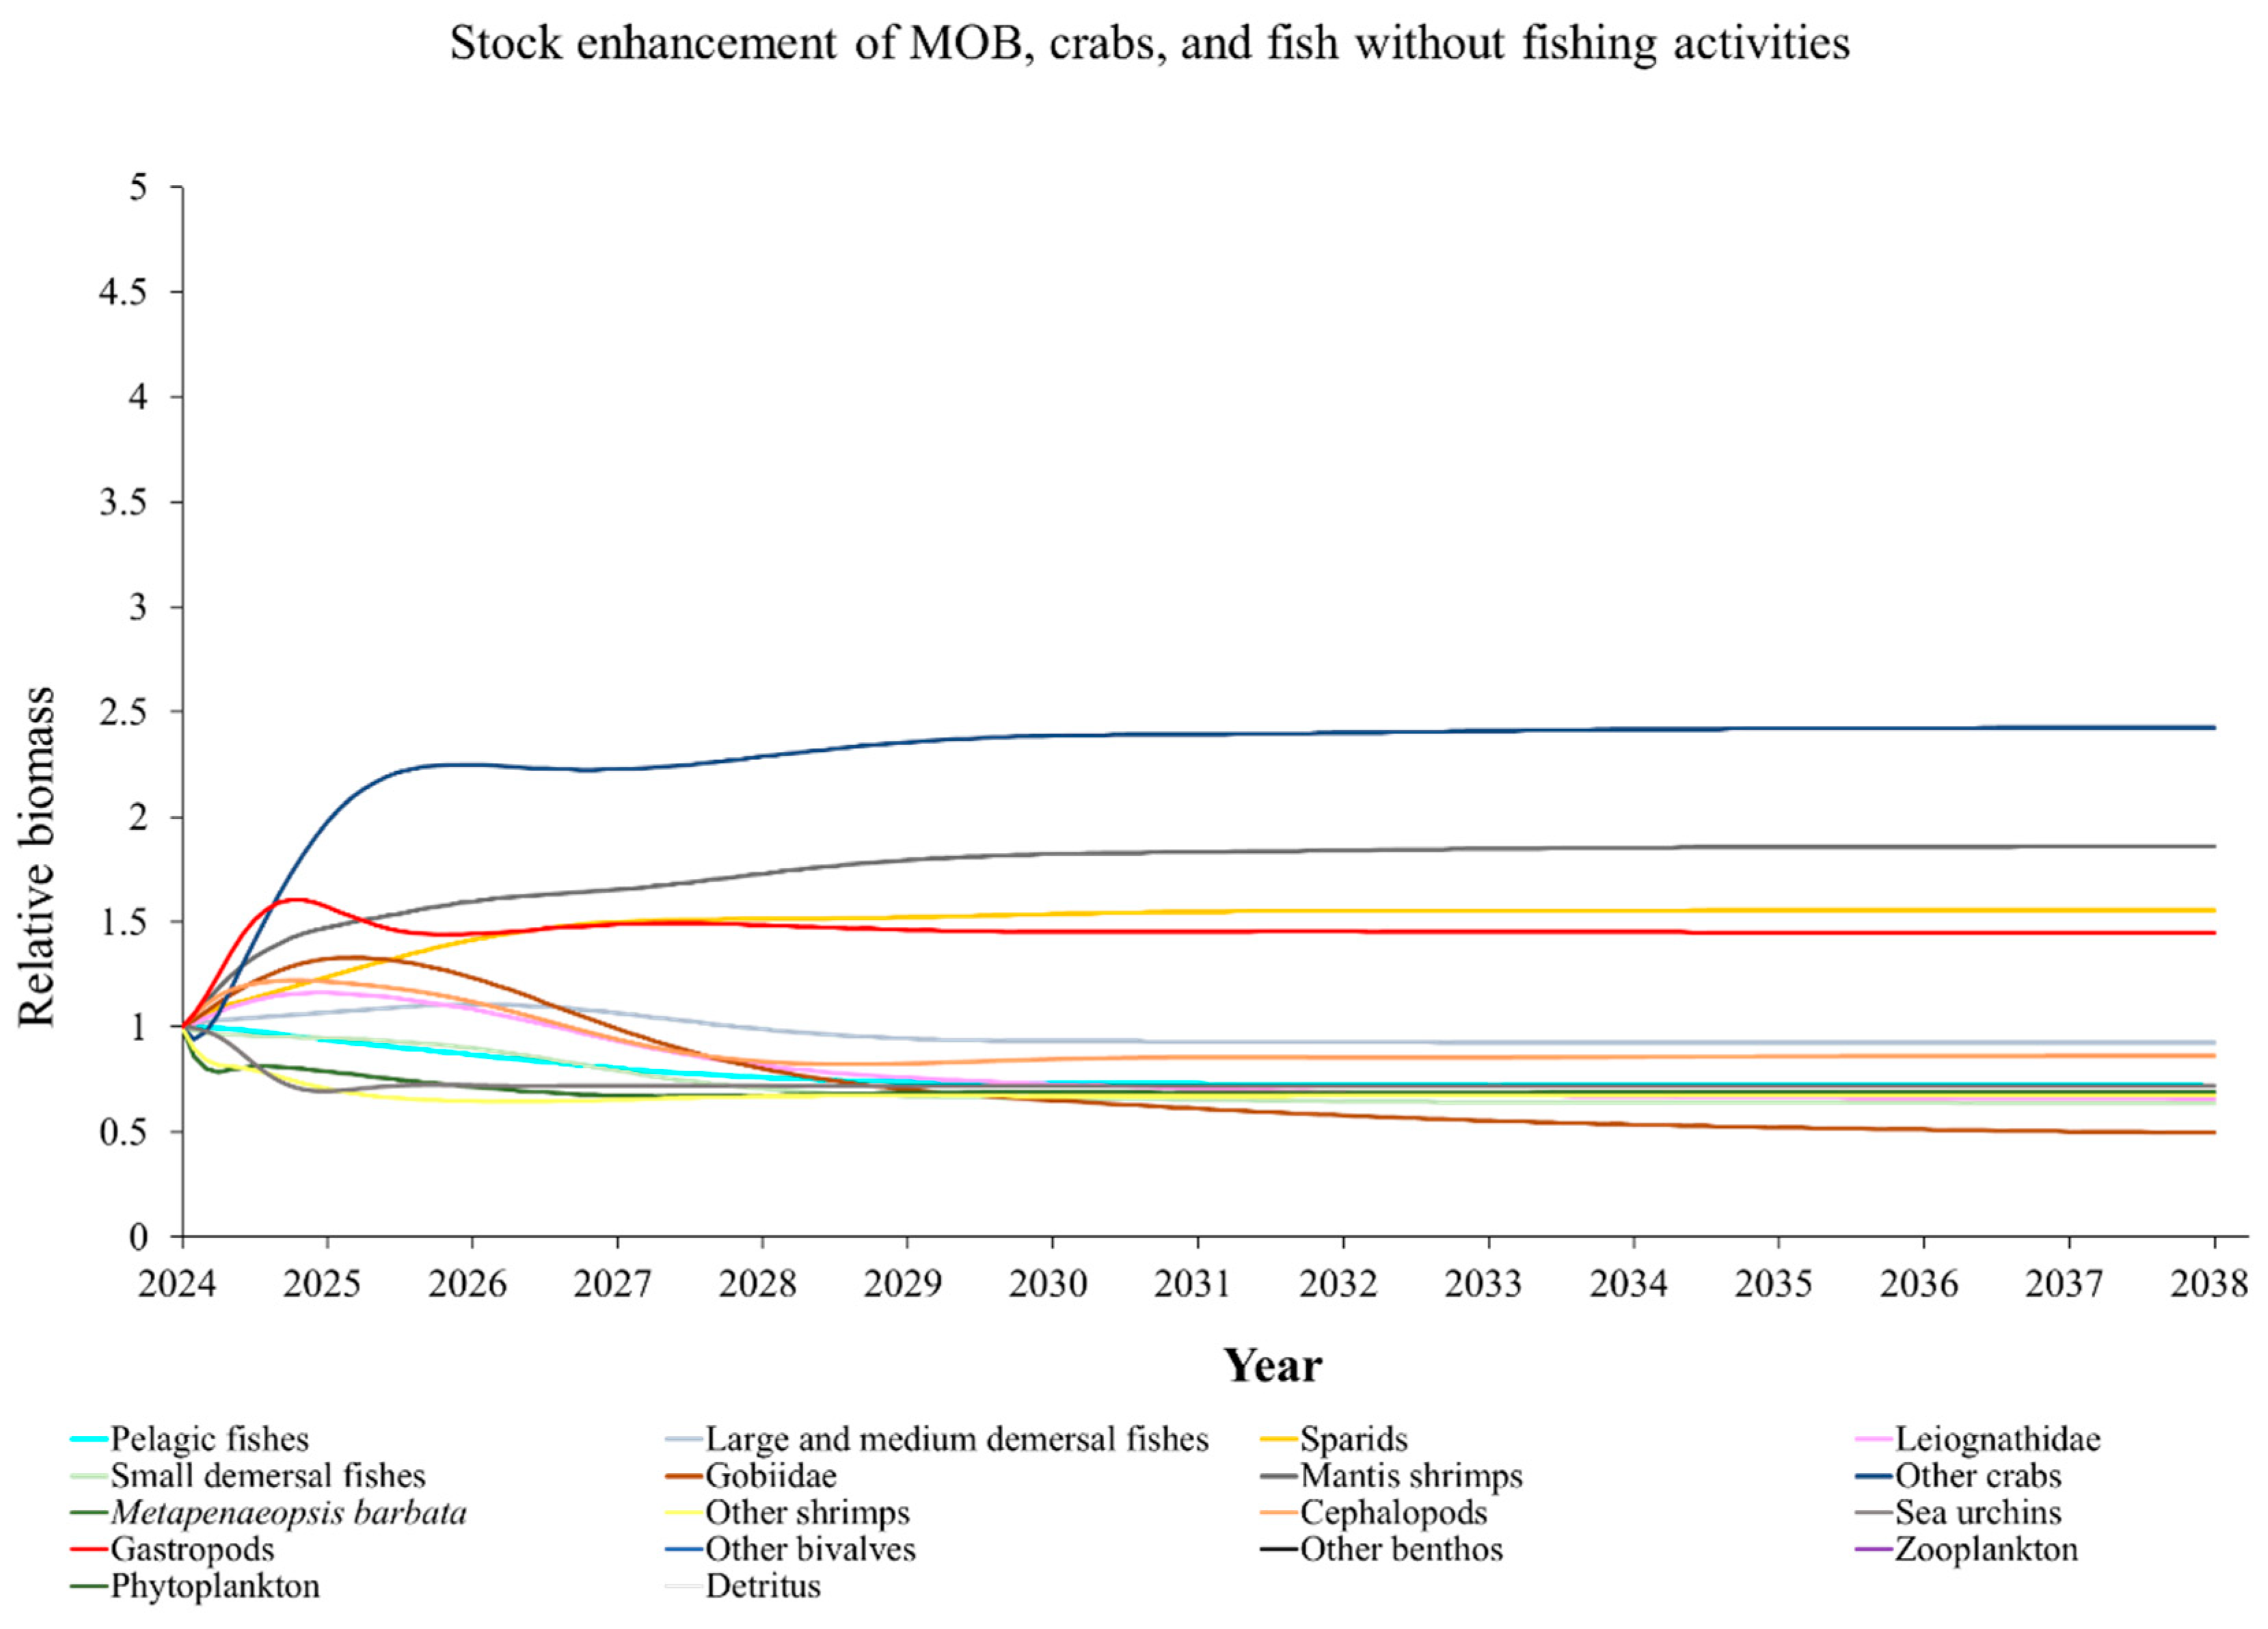
Figure A12.
Predicted relative changes in biomass of each functional group in the Ecopath Model of marine ranching ecosystem for the stock enhancement scenario of MOB, crabs, and fish with fishing activities.
Figure A12.
Predicted relative changes in biomass of each functional group in the Ecopath Model of marine ranching ecosystem for the stock enhancement scenario of MOB, crabs, and fish with fishing activities.
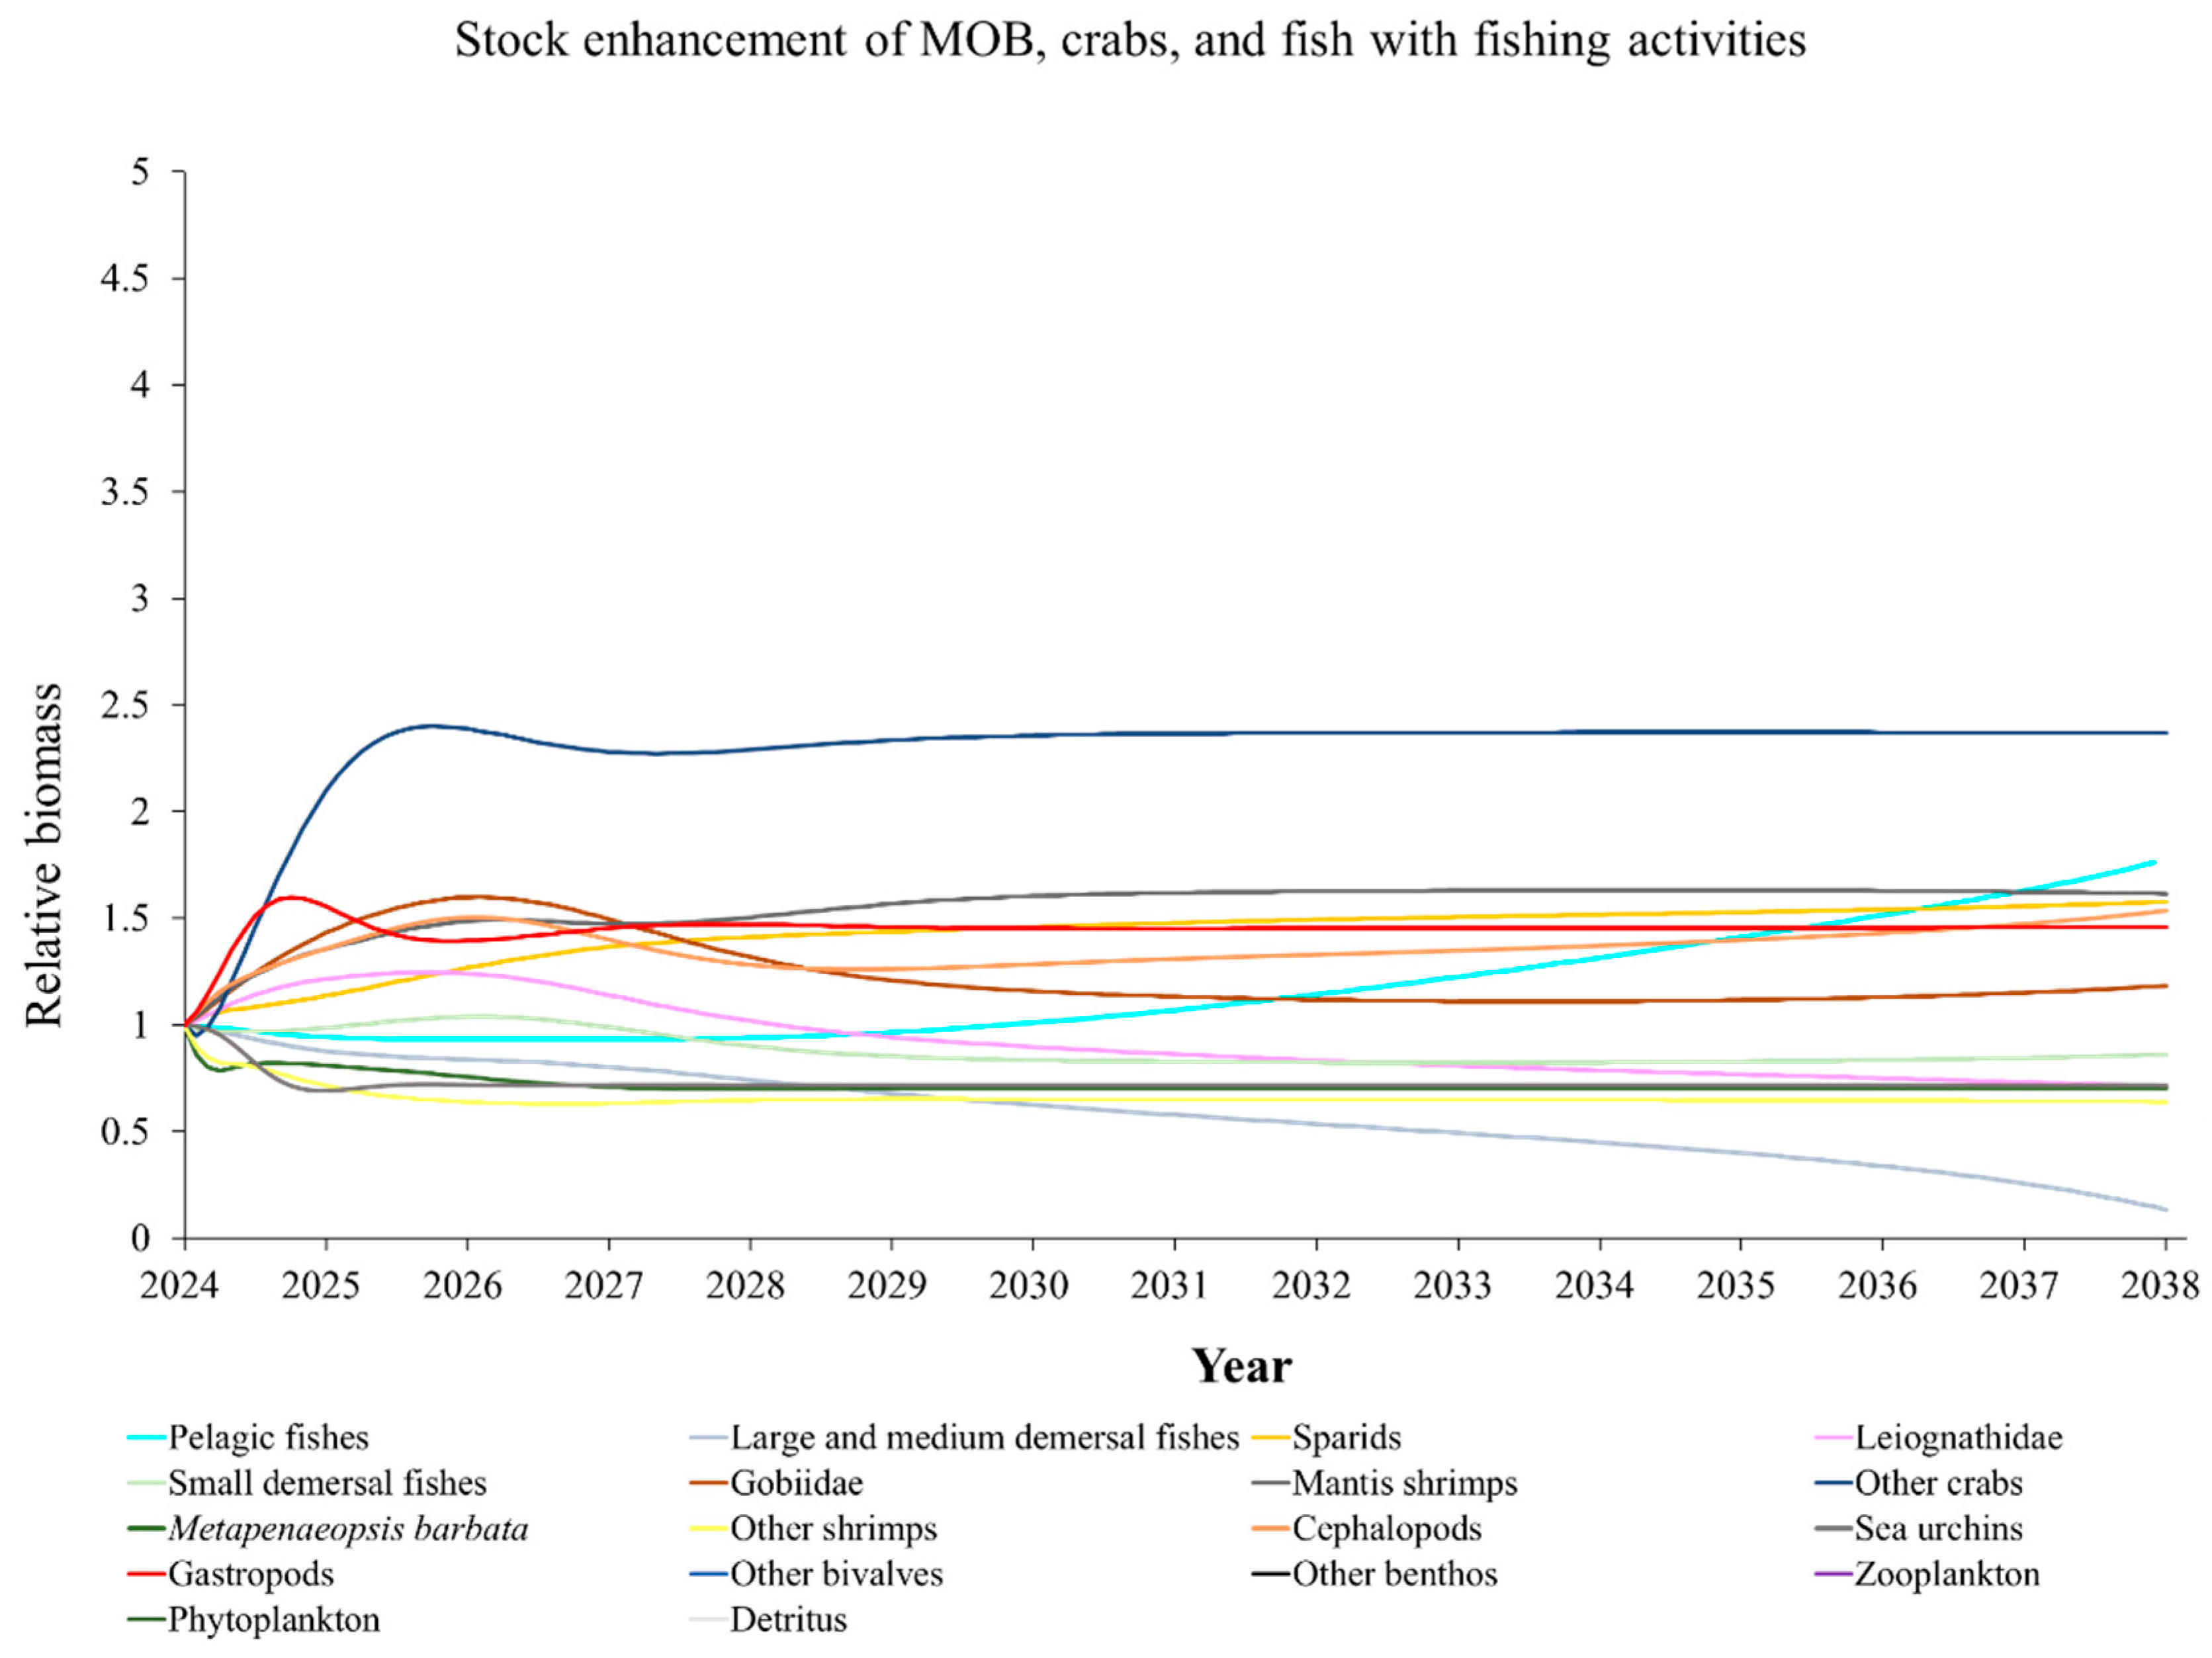
Figure A13.
Predicted relative changes in biomass of each functional group in the Ecopath Model of marine ranching ecosystem for the stock enhancement scenario of crabs and fish without fishing activities.
Figure A13.
Predicted relative changes in biomass of each functional group in the Ecopath Model of marine ranching ecosystem for the stock enhancement scenario of crabs and fish without fishing activities.
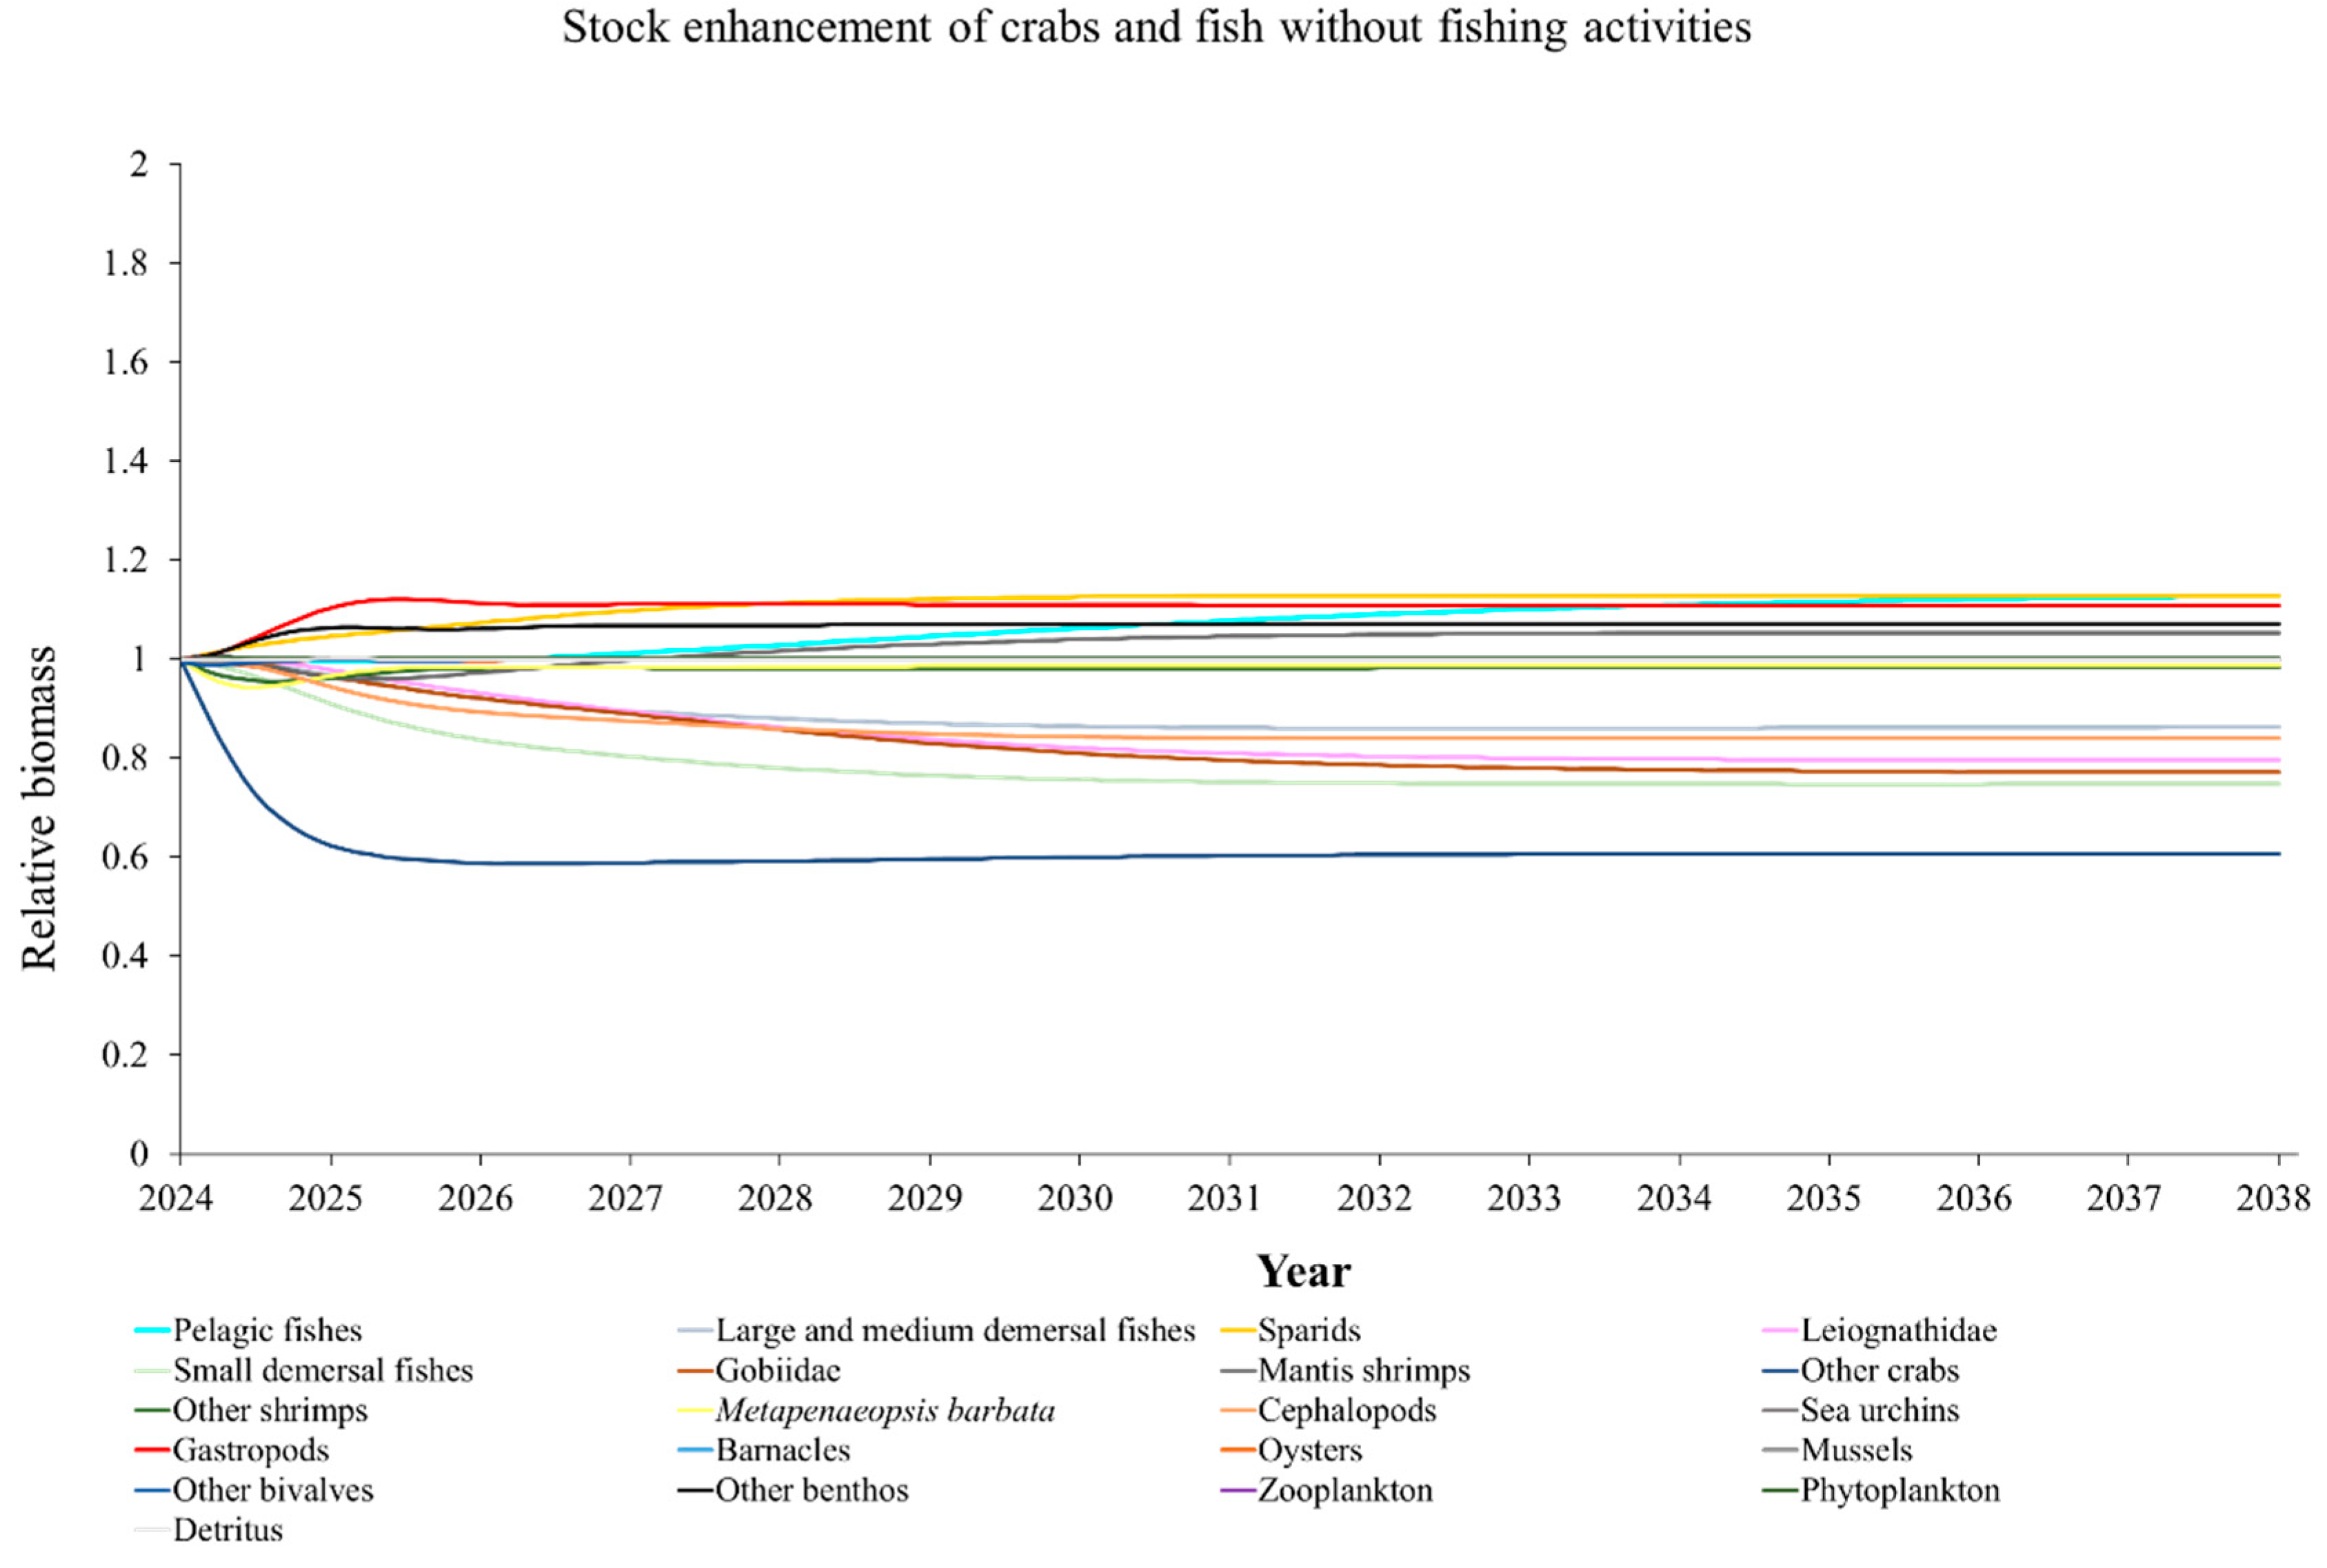
Figure A14.
Predicted relative changes in biomass of each functional group in the Ecopath Model of marine ranching ecosystem for the stock enhancement scenario of crabs and fish with fishing activities.
Figure A14.
Predicted relative changes in biomass of each functional group in the Ecopath Model of marine ranching ecosystem for the stock enhancement scenario of crabs and fish with fishing activities.
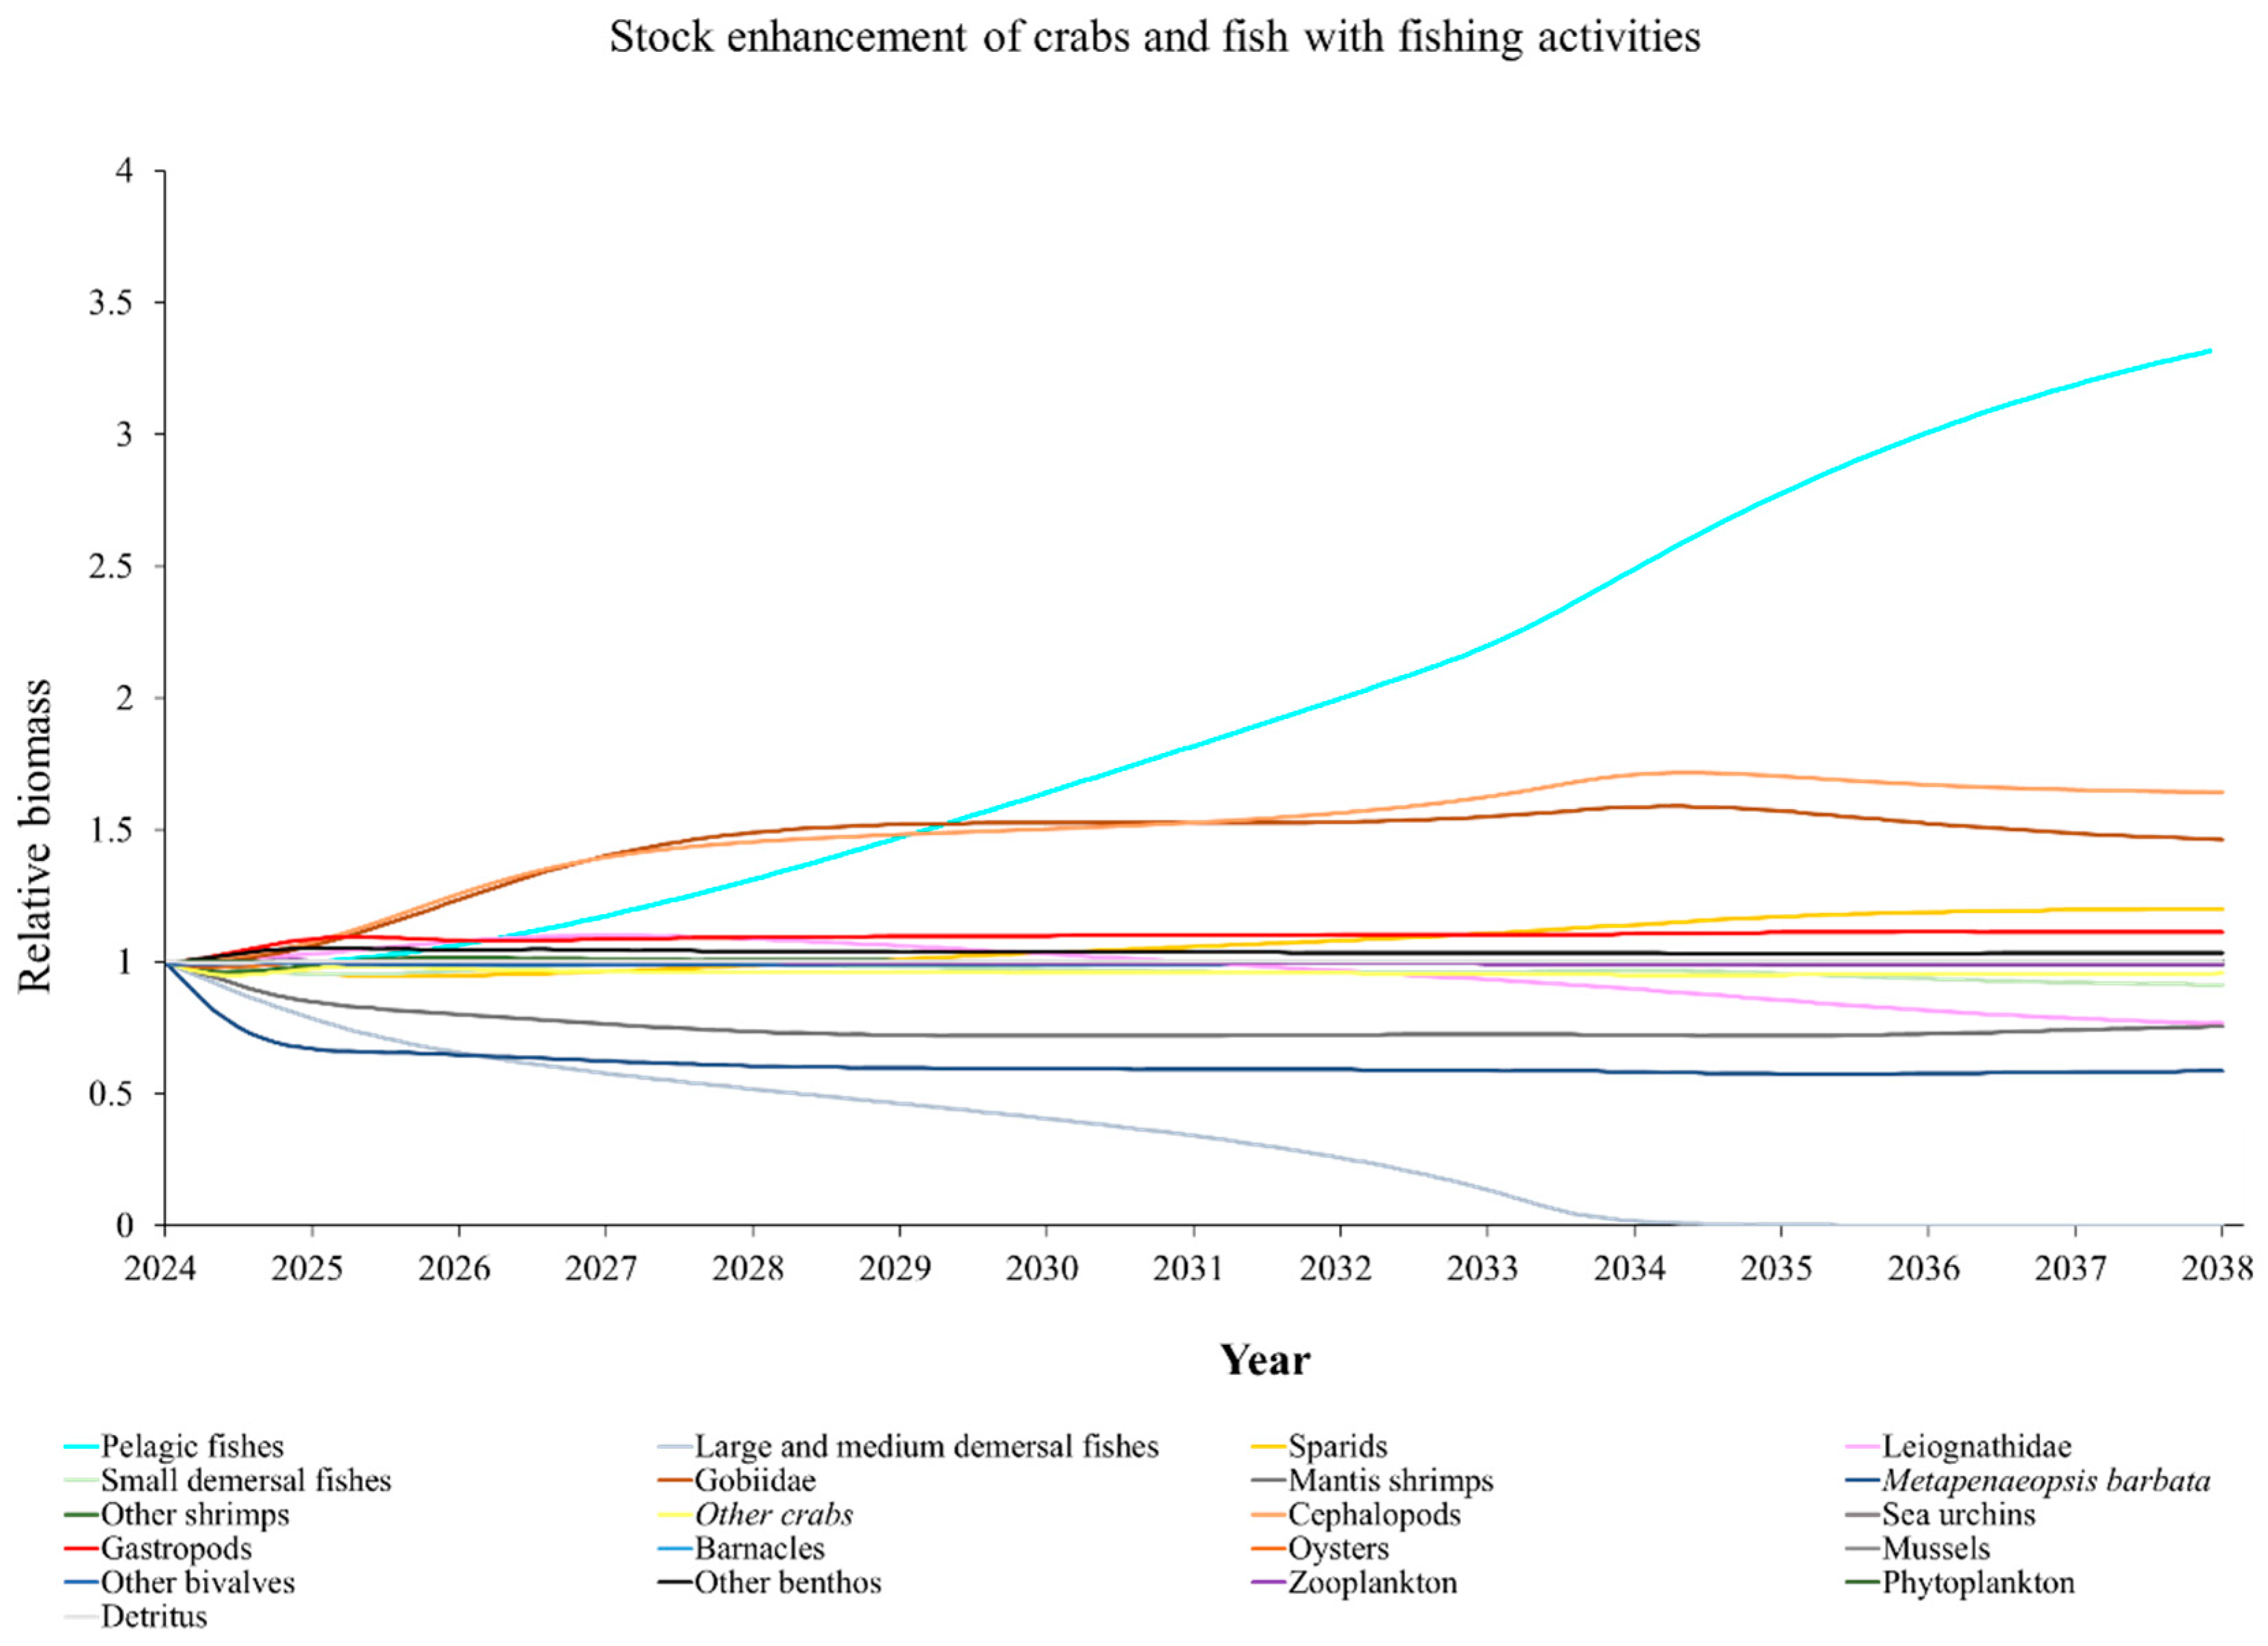
Figure A15.
Predicted relative changes in biomass of each functional group in the Ecopath Model of marine ranching ecosystem for the scenario of fishing activities.
Figure A15.
Predicted relative changes in biomass of each functional group in the Ecopath Model of marine ranching ecosystem for the scenario of fishing activities.
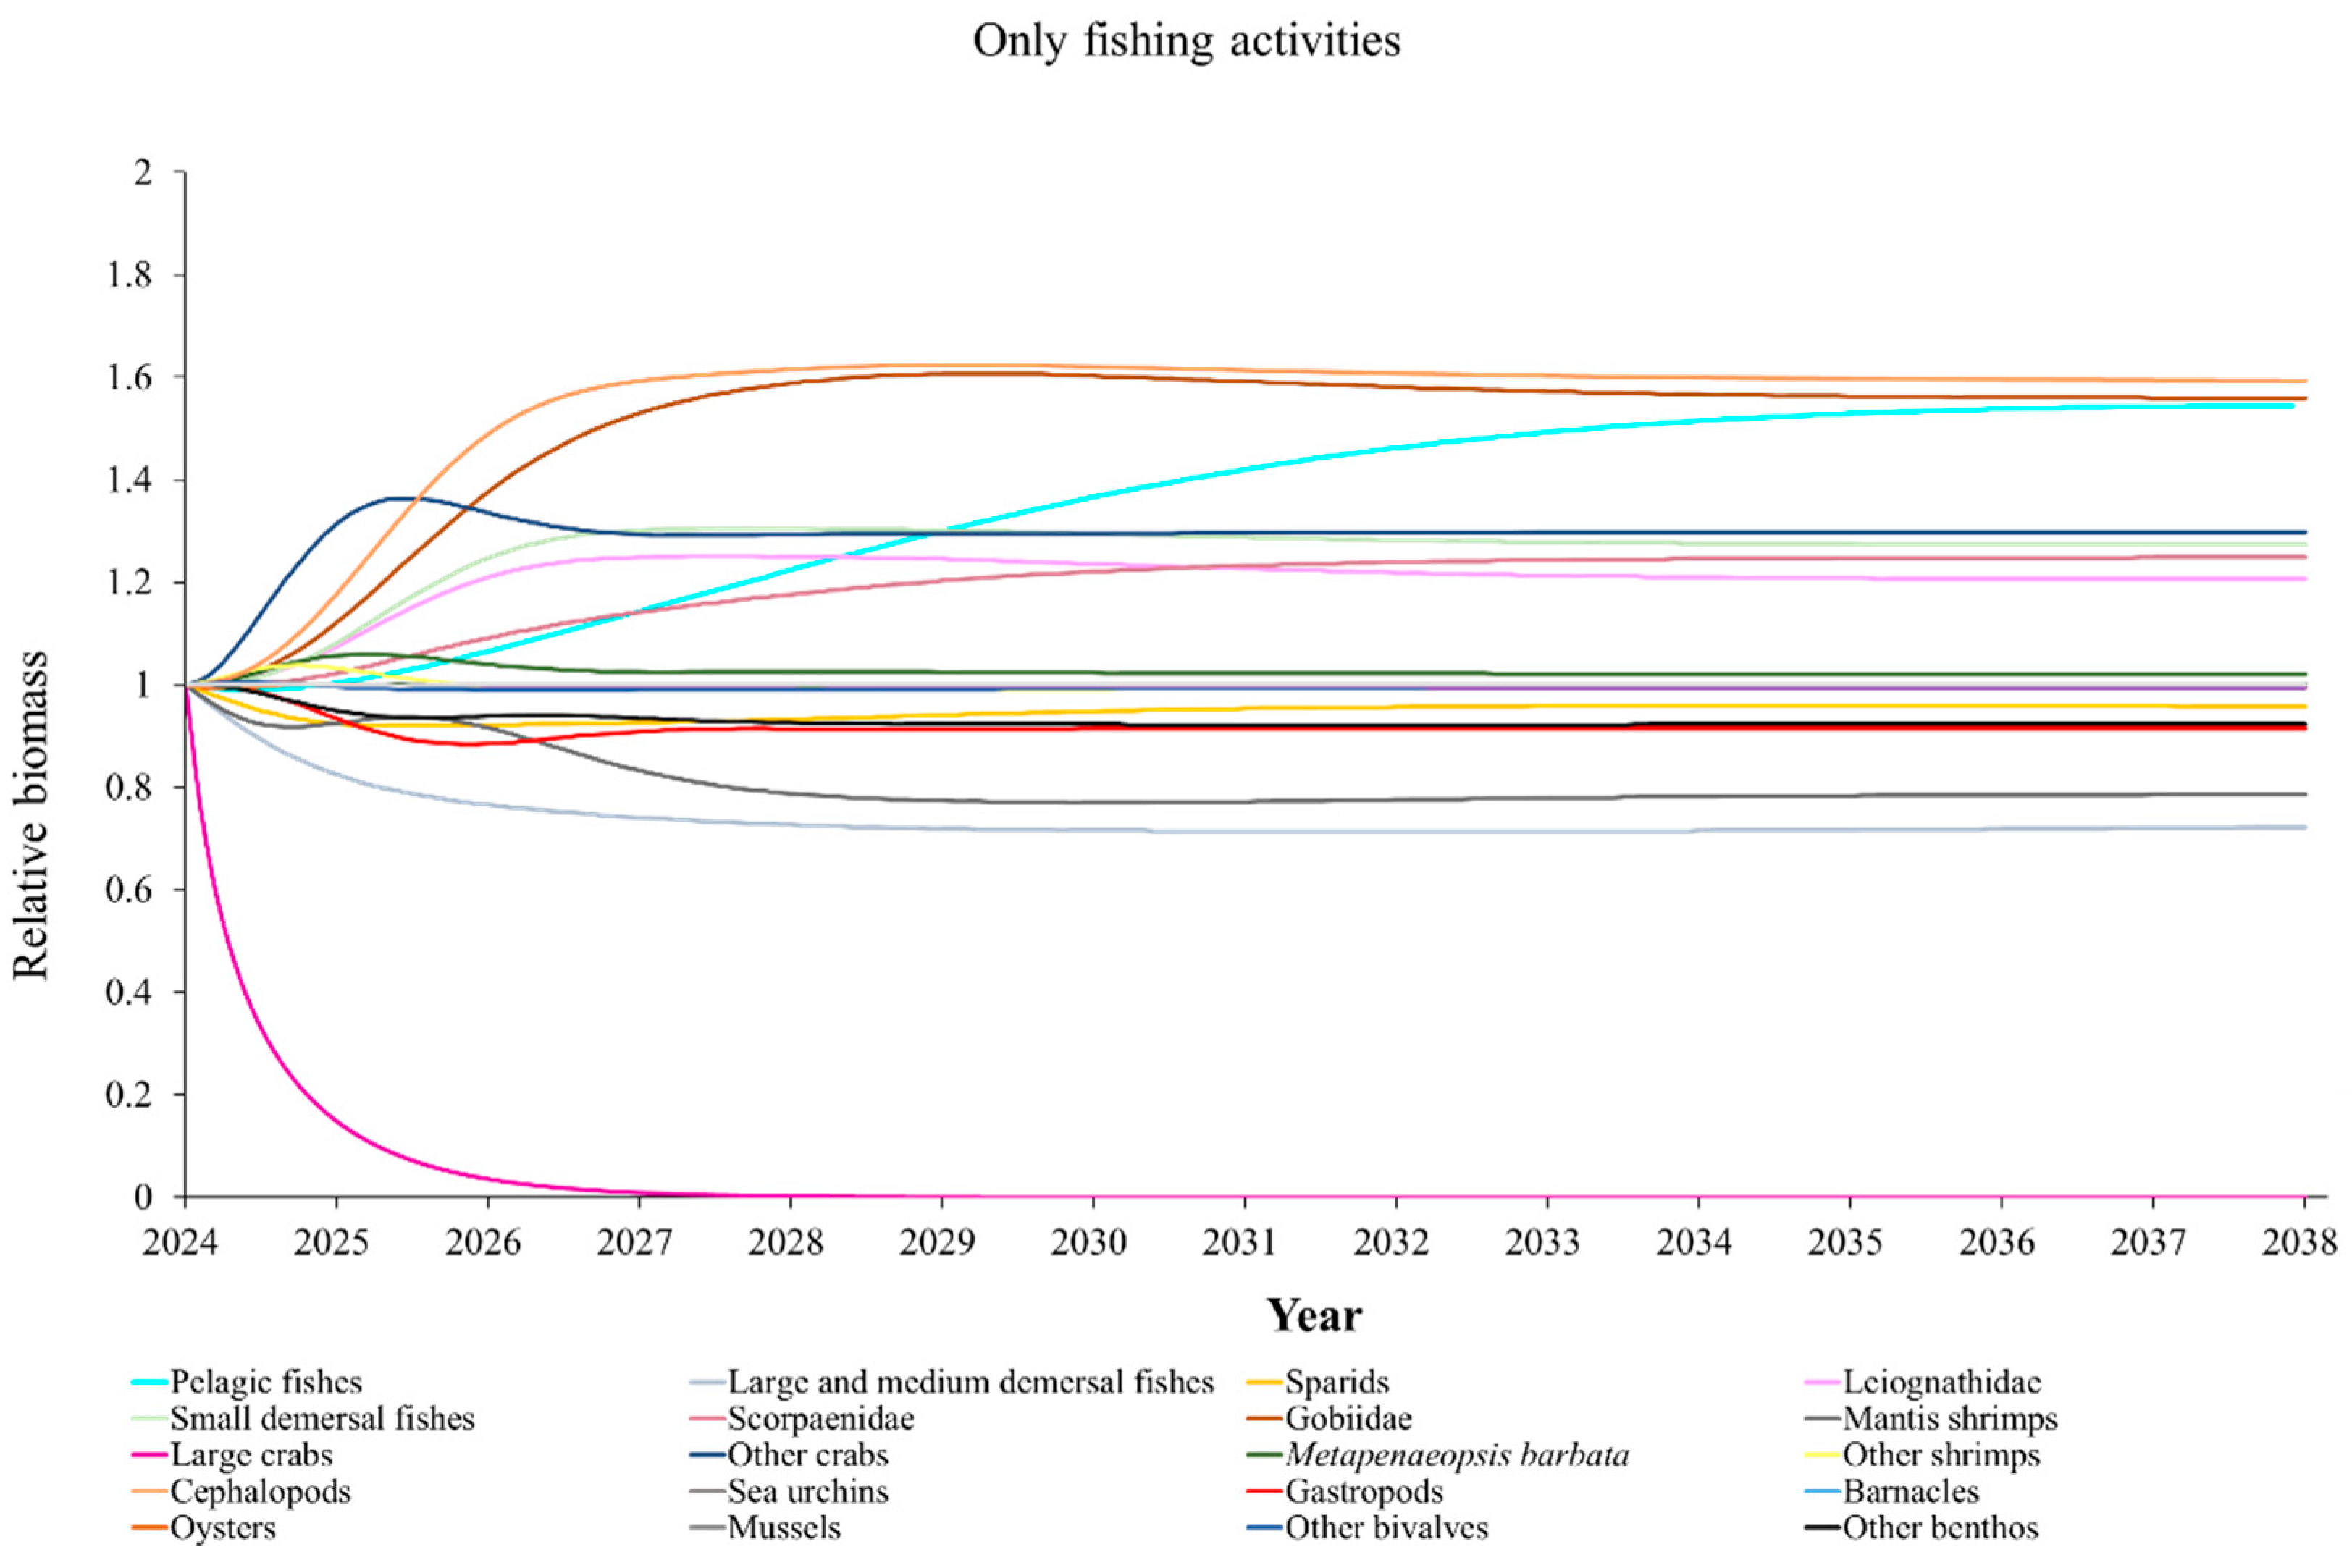
References
- Kang, X.; Zhang, H. Research progress on the evaluation of offshore marine ecosystem service functions and their values. Ocean Development and Management. 2010, 27(05), 60–64. (in Chinese). [Google Scholar]
- Qiu, W. Influence of international non-governmental organizations on the rule of the international law on marine environmental protection: taking an example of IUCN. Master thesis, Wuhan University, Wuhan 2019. (in Chinese). [Google Scholar]
- Field, J.; Hempel, G.; Summerhayes, C.; Scientific Committee on Oceanic Research. International Council of Scientific Unions; Scientific Committee on Problems of the Environment. International Council of Scientific Unions Oceans 2020: Science, Trends, and the Challenge of Sustainability. Isl. Press. 2002. [Google Scholar]
- Sun, X.X.; Yu, R.C.; Hu, Z.Y. Ecological security of coastal ocean and future marine ecosystem management strategies. Bulletin of Chinese Academy of Sciences. 2016, 31(12), 1293–1301, (in Chinese with English abstract). [Google Scholar]
- Yang, Z.Y.; Zhang, D. The high-quality development of Chinese fisheries from the perspective of the all-encompassing approach to food: current situation, problems and improvement strategies. Chinese Fisheries Economics 2023, 41(06), 1–13, (in Chinese with English abstract). [Google Scholar]
- Lin, C.; Yang, H.; Chen, Y.; Jin, X.; Chen, B.; Li, W.; Ren, Z.; Leng, S.; Ding, D. ; Construction and Development of Modern Marine Ranching Academic Review of the 230th Shuangqing Forum. Bulletin of National Natural Science Foundation of China 2021, 35(1), 143–152, (in Chinese with English Abstract). [Google Scholar]
- CCSC. Outline of the 14th Five-Year Plan (2021-2025) for National Economic and Social Development and Long-Range Objectives for 2035. Central Committee of the Communist Party of China & State Council 2021. (in Chinese with English Abstract).
- Chen, Z.; Qiu, Y. Assessment of the food-web structure, energy flows, and system attribute of northern South China Sea ecosystem. Acta Ecologica Sinica. 2020, 30(18), 4855–4865. [Google Scholar]
- Wang, T.; Yin, Z. Exploring Xi Jinping’s View of Marine Ecological Civilization from the Perspective of System Thinking. Modern Communication. 2023, 11, 9–16, (in Chinese with English abstract). [Google Scholar]
- Yang, H.; Huo, D.; Xu, Q. Views on modern marine ranching. Oceanologia et Limnologia Sinica 2016, 47(6), 1069–1074, (in Chinese with English abstract). [Google Scholar]
- Ru, X.; Deng, B.; Feng, Q.; Lin, C.; Zhang, L.; Yang, H. ; Comparison of Marine Ranching Constructions between China and Foreign Countries. Journal of Fisheries of China 2023, 47(11). (in Chinese with English Abstract). [Google Scholar]
- Loneragan, N.R.; Jenkins, G.I.; Taylor, M.D. Marine stock enhancement, restocking, and sea ranching in australia: future directions and a synthesis of two decades of research and development. Rev. Fish. Sci 2013, 21, 222–236. [Google Scholar] [CrossRef]
- Yang, H.; Ru, X. ; Zhang, L; Lin, C. Industrial convergence of marine ranching and offshore wind power: concept and prospect. Bulletin of the Chinese Academy of Sciences 2019a, 34(6), 700–707, (in Chinese with English abstract). [Google Scholar]
- Liu, S.; Zhou, X.; Zeng, C.; Frankstone, T.; Cao, L. Characterizing the Development of Sea Ranching in China. Rev. Rev. Fish Biol. Fish. 2022, 32. [Google Scholar] [CrossRef]
- Seitz, R.D.; Lipcius, R.N.; Knick, K.E.; Seebo, M.S.; Long, W.C.; Brylawski, B.J.; Smith, A. Stock enhancement and carrying capacity of blue crab nursery habitats in Chesapeake Bay. Rev. Fish. Sci. 2008, 16, 329–337. [Google Scholar] [CrossRef]
- Zhang, X.; Wang, X.; Tu, Z.; Zhang, P.; Wang, Y.; Gao, T.; Wang, S. Current status and prospect of fisheries resource enhancement in Shandong Province. Chinese Fisheries Economics 2019a, 27(02), 51–58, (in Chinese with English abstract). [Google Scholar]
- Taylor, M.D.; Brennan, N.P.; Lorenzen, K.; Leber, K.M. Generalized predatory impact model: a numerical approach for assessing trophic limits to hatchery releases and controlling related ecological risks. Rev. Fish. Sci. 2013, 21, 341–353. [Google Scholar] [CrossRef]
- Kitada, S. Economic, Ecological and Genetic Impacts of Marine Stock Enhancement and Sea Ranching: A Systematic Review. Fish Fish. 2018, 19(3), 511–532. [Google Scholar] [CrossRef]
- Xu, X.; Tang, W.; Wang, Y. Releasing capacity of Portunus trituberculatus enhancement in Zhoushan fishing ground and Yangtze river estuary fishing ground and their adjacent waters. South China Fisheries Science 2019, 15(3), 126–132, (in Chinese with English abstract). [Google Scholar]
- Tang, Q. On the capacity and its research. Progress in Fishery Sciences. 1996, 02, 1–6, (in Chinese with English abstract). [Google Scholar]
- Yang, H.; Zhang, S.; Zhang, X.; Chen, P.; Tian, T.; Zhang, T. Strategic thinking on the construction of modern marine ranching in China. Journal of Fisheries of China 2019b, 43(4), 1255–1262, (in Chinese with English abstract). [Google Scholar]
- Zhang, Y.Z.; JIiang, R.J.; Liang, J. The evaluation on conservation effect of fishery resources in marine ranching of Ma'an Archipelago area Zhejiang Shengsi. Journal of Zhejiang Ocean University (Natural Science) 2020, 41(05), 466–472, (in Chinese with English abstract). [Google Scholar]
- Yang, C.; Wu, Z.; Liu, H.; Zhang, P.; Li, W.; Zeng, X.; Zhang, X. The fishing strategy of charybdis japonica and rapana venosa and the carrying capacity of Apostichopus japonucus in Zhuwang, Laizhou artificial reef ecosystem based on Ecopath model. Periodical of Ocean University of China 2016, 46(11), 168–177, (in Chinese with English abstract). [Google Scholar]
- Sun, L. Evaluation of artificial reef construction in Shandong province. Doctoral thesis, Ocean University of China, Qingdao 2011. (in Chinese). [Google Scholar]
- Xu, Q.; Zhang, S. ; Site selection evaluation of marine ranching in Zhoushan area based on AHP method. Journal of Shanghai Ocean University 2013, 22(1), 128–133, (in Chinese with English abstract). [Google Scholar]
- Zhao, X.; Sun, W.; Ren, G.; Ma, Y. Ecosystem health evaluation of Haizhou Bay marine ranching. Acta Laser Biology Sinica 2014, 23, 626–632, (in Chinese with English abstract). [Google Scholar]
- Wang, Y.; Li, Y.; Xiao, P.; Shen, S.; Cai, H.; Song, W. Evaluation of Social Effects of Artificial Reefs in the South Bay Islands by AHP. Ocean Dev. Manag. 2019, 36(02), 40–44. [Google Scholar]
- Zhang, R.; Zhang, Q.; Zhao, J.; Wu, Z.; Liu, H.; Shou, L.; Liao, Y.B.; Liu, Q.; Tang, Y.; Zeng, J. Using Ecopath Models to Explore Differences in Ecosystem Characteristics Between an Artificial Reef and a Nearby Natural Reef on the Coast of the North Yellow Sea, China. 2022. [CrossRef]
- Qin, M.; Wang, X.R.; Du, Y.W.; Wan, X.L. Influencing factors of spatial variation of national marine ranching in China. Ocean Coastal Manage. 2021, 199, 12. [Google Scholar] [CrossRef]
- Wu, Z.X.; Zhang, X.M.; Lozano-Montes, H.M.; Loneragan, N.R. Trophic flows, kelp culture and fisheries in the marine ecosystem of an artificial reef zone in the Yellow Sea. Estuar. Coast. Shelf Sci. 2016, 182, 86–97. [Google Scholar] [CrossRef]
- Harrison, S.R. ; M. Comparison of artificial and natural reef productivity in Nantucket Sound, MA, USA. Estuaries Coasts 2020, 43(8), 2092–2105. [Google Scholar] [CrossRef]
- Wang, X.; Feng, J.; Lin, C.G.; Liu, H.; Chen, M.Y.; Zhang, Y.L. Structural and functional improvements of coastal ecosystem based on artificial oyster reef construction in the Bohai Sea, China. Front. Mar. Sci. 2022b, 9, 829557. [Google Scholar] [CrossRef]
- Yuan, Y.; Feng, J.; Xian, W.W.; Zhang, H. Analysis of the ecosystem characteristics and ecological carrying capacity of the main commercial fish in the artificial reef ecosystem in Laizhou Bay using the Ecopath model. Sustainability. 2022a, 14(21), 18. [Google Scholar] [CrossRef]
- Li, Z.P.; Chen, Y.; Wang, G.; Mu, J.D.; Sun, Y.F.; Yu, H.L.; Xu, J.L.; Yan, Y.; Luo, S.Y.; Han, F.Q.; Feng, J.; Pan, Z. Ecological carrying capacity and carbon sequestration potential of bivalve shellfish in marine ranching: A case study in Bohai Bay, China. Front. Mar. Sci. 2023, 10, 1174253. [Google Scholar] [CrossRef]
- Wootton, J.T. Effects of disturbance on species diversity: a multitrophic perspective. The American Naturalist. 1998, 152(6), 803–825. [Google Scholar] [CrossRef] [PubMed]
- Chesson, P. Mechanisms of maintenance of species diversity. Annu. Rev. Ecol. Syst. 2000, 31, 343–366. [Google Scholar] [CrossRef]
- Ruiz, G.M.; Carlton, J.T.; Grosholz, E.D.; Hines, A.H. Global invasions of marine and estuarine habitats by non-indigenous species: Mechanisms, extent, and consequences. Am. Zool. 1997, 37(6), 621–632. [Google Scholar] [CrossRef]
- Yang, H.; Huo, D.; Xu, Q. Views on modern marine ranching. Oceanologia et Limnologia Sinica 2016, 47(6), 1069–1074, (in Chinese with English abstract). [Google Scholar]
- Zhang, S.; Zhou, X.; Wang, K.; Li, J.; Zhao, J.; Zhao, X.; Guo, Y.; Liu, S.; Cheng, X. Review of marine livestock ecological urbanization hypothesis and marine ranching construction key-technology against blue growth background. Journal of Fisheries of China 2019, 43(1), 81–96, (in Chinese with English abstract). [Google Scholar]
- Baird, D.; Ulanowicz, R.E. ; The seasonal dynamics of the Chesapeake Bay ecosystem. Ecological monographs. 1989, 59(4), 329–364. [Google Scholar] [CrossRef]
- Wulff, J.; Field, K.; Mann, H. Coastal and Estuarine Studies (COASTAL, volume 32). Springer–Verlag, New York. 1989.
- Ulanowicz, R.E. Growth and development: ecosystems phenomenology. Springer–Verlag, New York. 1986.
- Ulanowicz, R.E. Ecology: the ascendant perspective. Columbia University Press, New York. 1997.
- Ulanowicz, E, R. Quantitative methods for ecological network analysis. Computational Biology and Chemistry 2004, 28(5-6), 321–339. [CrossRef]
- Libralato, S. System Omnivory Index. Encycl. Encycl. Ecol. Second Ed. 2008, 3472–3477. [Google Scholar] [CrossRef]
- Biondi, E.; Casavecchia., S.; Pesaresi., S.; Zivkovic., L. Natura 2000 and the Pan-European Ecological Network: a new methodology for data integration[J]. Biodiversity & Conservation 2012, 21(7), 1741–1754. [Google Scholar] [CrossRef]
- Heymans, J.J.; Coll, M.; Libralato, S.; Morissette, L.; Christensen, V. Global patterns in ecological indicators of marine food webs: a modelling approach. PLoS One. 2014, 9(4), 21. [Google Scholar] [CrossRef]
- Safi, G.; Giebels, D.; Larissa Arroyo, N.; Heymans, J.J.; Preciado, I.; Raoux, A.; Schueckel, U.; Tecchio, S.; De Jonge, V.N.; Niquil, N. Vitamine ENA: A framework for the development of ecosystem-based indicators for decision makers. Ocean Coast. Manag. 2019, 174, 116–130. [Google Scholar] [CrossRef]
- De Jonge, V.; Kolkman, M.; Ruijgrok, E.; De Vries, M. The need for new paradigms in integrated socio-economic and ecological coastal policy making, Proceedings of 10th International Wadden Sea Symposium. Ministry of Agriculture, Nature Management and Fisheries. Department North 2003, 247–270. [Google Scholar]
- De Jonge, V.N.; Pinto, R.; Turner, R.K. ; Integrating ecological, economic and social aspects to generate useful management information under the EU Directives'‘ecosystem approach’. Ocean Coastal Management. 2012, 68, 169–188. [Google Scholar] [CrossRef]
- Borrett, S. R.; Freeze, M. A.; Salas, A. K. Equivalence of the realized input and output oriented indirect effects metrics in ecological network analysis[J]. Ecological Modelling 2011, 222. [Google Scholar] [CrossRef]
- Wang, D.; Wu, X.; Ding, L.; Zhang, M.; Xie, H.; Zhang, Q.; Li, S. A preliminary analysis of the ecosystem structure and function of the Yangtze Estuary based on Ecopath model. Journal of Environmental Engineering Technology 2022a, 12(2), 417–425, (in Chinese with English abstract). [Google Scholar]
- Yuan, Y.; Xian, W.; Zhang, H. A review of the ecological carrying capacity of fishery resources in China based on the Ecopath model. Marine Sciences. 2022b, 46(7), 105–119. [Google Scholar]
- Parsons, T.R.; Maita, Y.; Lalli, C.M. Determination of chlorophylls and total carotenoids: spectrophotometric method - sciencedirect. Man. Chem. Biol. Man. Chem. Biol. Methods Seawater Anal. 1984, 101–104. [Google Scholar]
- Willis, T.J.; Babcock, R.C. A baited underwater video system for the determination of relative density of carnivorous reef fish. Marine and Freshwater research. 2000, 51(8), 755–763. [Google Scholar] [CrossRef]
- Christensen, V.; Walters, C.J.; Pauly, D. Ecopath with Ecosim: a user’s guide. Fisheries Centre, University of British Columbia, Vancouver. November 2005 edition, 2005, 154 p.
- Winberg, G.G. Rate of metabolism and food requirements of fishes. Belorussian State University, Minsk. Fisheries Research Board of Canada Translation Series 194 (1960). Biological Station, Nanaimo, BC. 1956.
- Yang, H.S. Monitoring and biocapacity evaluation of marine ranching ecosystem. Science Press, Beijing. 2018 (in Chinese with English abstract).
- Link, J.S. Adding rigor to ecological network models by evaluating a set of pre-balance diagnostics: A plea for PREBAL (vol 221, pg 1582, 2010). Ecol. Model. 2016, 337, 348–349. [Google Scholar] [CrossRef]
- Heymans, J.J.; Coll, M.; Link, J.S.; Mackinson, S.; Steenbeek, J.; Walters, C.; Christensen, V. Best practice in Ecopath with Ecosim food-web models for ecosystem-based management. Ecol. Model. 2016, 331, 173–184. [Google Scholar] [CrossRef]
- Link, J.S. Adding rigor to ecological network models by evaluating a set of pre-balance diagnostics: a plea for PREBAL. Ecol. Model. 2010, 221, 1580–1591. [Google Scholar] [CrossRef]
- Chea, R.; Guo, C.B.; Grenouillet, G.; Lek, S. Toward an ecological understanding of a flood-pulse system lake in a tropical ecosystem: Food web docstructure and ecosystem health. Ecol. Model. 2016, 323, 1–11. [Google Scholar] [CrossRef]
- Ulanowicz, R.E.; Goerner, S.J.; Lietaer, B.; Gomez, R. Quantifying sustainability: resilience, efficiency and the return of information theory. Ecol Complex 2009, 6, 27−36. [Google Scholar] [CrossRef]
- Zeng, Y.; Zhao, Y.; Qi, Z. Evaluating the ecological state of Chinese lake baiyangdian (BYD) based on ecological network analysis. Ecol. Indic. 2021, 127, 107788. [Google Scholar] [CrossRef]
- Tobor-Kapłon, M., Holtkamp. Evaluation of information indices as indicators of envrionmental stress in terrestial soils. Ecol. Model. 2008, 80–90. [Google Scholar] [CrossRef]
- Dong, C.; Zhou, Y.; Li, J.; Yang, H.; Yu, Y.; Shen, L.; Wu, J. Water quality analysis of the Middle Yangtze River based on fuzzy comprehensive evaluation. Freshwater Fisheries 2021, 51(2), 55–62, (in Chinese with English abstract). [Google Scholar]
- Wu, X.; Hu, F. Analysis of ecological carrying capacity using a fuzzy comprehensive evaluation method. Ecol. Indic. 2020, 113, 106243. [Google Scholar] [CrossRef]
- U.S. GLOBEC. Report on climate change and carrying capacity of the North Pacific ecosystem. U.S. Global Ocean Ecosystem Dynamics Rep. Univ. California, Berkeley. 1996.
- Jiang, W.M.; Gibbs, M.T. Predicting the carrying capacity of bivalve shellfish culture using a steady, linear food web model. Aquaculture 2005, 244(1-4), 171–185. [Google Scholar] [CrossRef]
- Cheung, W.L.; Watson, R.; Pitcher, T. Policy simulation of fisheries in the Hong Kong marine ecosystem. The use of ecosystem models to investigate multispecies management strategies for capture fisheries. The use of ecosystem models to investigate multispecies management strategies for capture fisheries. Fisheries Centre Research Reports. 2002, 10(2), 46–54. [Google Scholar]
- Christensen, V.; Walters, C.J. Ecopath with Ecosim: methods, capabilities and limitations. Ecol. Model. 2004, 172, 109–139. [Google Scholar] [CrossRef]
- Harvey, C.J. Mediation functions in Ecopath with Ecosim: handle with care. Can. J. Fish. Aquat. 2014, 71, 1020–1029. [Google Scholar] [CrossRef]
- Sadchatheeswaran, S.; Branch, G.M.; Shannon, L.J.; Moloney, C.L.; Robinson, T.B. Modelling changes in trophic and structural impacts of alien ecosystem engineers on a rocky-shore island. Ecol. Model. 2020, 433, 109227. [Google Scholar] [CrossRef]
- Qiu, C.G.; Xu, S.L.; Qi, C.; Lin, S.Z. Studies on early growth and development in Sebastiscus marmoratus with artificial breeding technology. Journal of Ningbo University (NSEE). 2013, 26(4), 17–23, (in Chinese with English abstract). [Google Scholar]
- Yang, C.H.; Liu, Q.; Wang, Y.B. Assessment of the maximum sustainable yield of Portunus Trituberculatus in the northern areas of the East China Sea under the impact of stock enhancement. Oceanologia Et Limnologia Sinica 2022, 53(5), 1219–1224, (in Chinese with English abstract). [Google Scholar]
- Yang, H. Construction of marine ranching in china: reviews and prospects. J. Fish. China 2016, 40(7), 1133–1140, (in Chinese with English abstract). [Google Scholar] [CrossRef]
- Boaventura, D.; Moura, A.; Leitao, F.; Carvalho, S.; Cúrdia, J.; Pereira, P.; de Fonseca, L.C.; dos Santos, M.N.; Monteiro, C.C. Macrobenthic colonisation of artificial reefs on the southern coast of Portugal (Ancao, Algarve). Hydrobiologia. 2006, 555, 335–343. [Google Scholar] [CrossRef]
- Walker, S.J.; Schlacher, T.A.; Schlacher-Hoenlinger, M.A. Spatial heterogeneity of epibenthos on artificial reefs: fouling communities in the early stages of colonization on an East Australian shipwreck. Mar. Ecol.-Evol. Persp 2007, 28(4), 435–445. [Google Scholar] [CrossRef]
- Beck, M.; Brumbaugh, R.; Airoldi, L.; Carranza, A.; Coen, L.; Crawford, C.; Defeo, O.; Edgar, G.; Hancock, B.; Kay, M. Shellfish reefs at risk: a global analysis of problems and solutions. Arlington, VA. The Nature Conservancy 2009. [Google Scholar]
- Cresson, P.; Ruitton, S.; Harmelin-Vivien, M. . Artificial reefs do increase secondary biomass production: mechanisms evidenced by stable isotopes. Mar. Ecol.-Prog. Ser. 2014, 509, 15–26. [Google Scholar] [CrossRef]
- Grabowski, J.H.; Brumbaugh, R.D.; Conrad, R.F.; Keeler, A.G.; Opaluch, J.J.; Peterson, C.H.; Piehler, M.F.; Powers, S.P.; Smyth, A.R. Economic Valuation of Ecosystem Services Provided by Oyster Reefs. Bioscience. 2012, 62(10), 900–909. [Google Scholar] [CrossRef]
- Lima, J.S.; Atalah, J.; Sanchez-Jerez, P.; Zalmon, I.R. Evaluating the performance and management of artificial reefs using artificial reef multimetric index (ARMI). Ocean coastal management. 2020, 198, 105350. [Google Scholar] [CrossRef]
- Pauly, D.; Bartz, M.L.S. Improved Construction, Parametrization and Interpretation of Steady-State Ecosystem Models. In Proceedings of the Iclarm Conference. 1993.
- Lindeman, R.L. The trophic-dynamic aspect of ecology. Ecology 1942, 23, 399−418. [Google Scholar] [CrossRef]
- Connell, J.H.; Slatyer, R.O. Slatyer Mechanisms of Succession in Natural Communities and Their Role in Community Stability and Organization. Am. Nat. 1977, 1119–1144. [Google Scholar] [CrossRef]
- Walker, L.R.; Chapin, F.S. ; Interactions among processes controlling successional change. Oikos. 1987, 50, 131–135. [Google Scholar] [CrossRef]
- Pickett, S.T.A.; White, P.S.; Courtney, S.P. The ecology of natural disturbance and patch dynamics. Science. 1985, 230, 434–435. [Google Scholar] [CrossRef]
- Mccann, K.; Hastings, A. Re-evaluating the omnivory–stability relationship in food webs. Proc. R. Soc. Proc. R. Soc. B Biol. Sci. 1997, 264. [Google Scholar] [CrossRef]
- Odum, E.P. Trends expected in stressed ecosystems. BioScience. 1985. [Google Scholar] [CrossRef]
- Scharler, U.M.; Baird, D. A Comparison of selected ecosystem attributes of three south african estuaries with different freshwater inflow regimes, using network analysis. J. Mar. Syst. 2005, 56, 283–308. [Google Scholar] [CrossRef]
- Jin, X. S.; Dou, S. Z.; Shan, X. J.; Wang, Z. Y.; Wang, R. J.; Bian, X. D. Hot spots of frontiers in the research of sustainable yield of Chinese inshore fishery. Prog. Prog. Fish. Sci. 2015, 36(1), 124–131. [Google Scholar] [CrossRef]
- Pauly, D.; Christensen, V.; Dalsgaard, J.; Froese, R.; Torres Jr, F. Fishing down marine food webs. Science. 1998, 279(5352), 860–863. [Google Scholar] [CrossRef] [PubMed]
- Liang, C.; Pauly, D. Fisheries impacts on China's coastal ecosystems: Unmasking a pervasive 'fishing down' effect. PLoS One. 2017, 12(3), 15. [Google Scholar] [CrossRef] [PubMed]
- Liang, C.; Pauly, D. Masking and unmasking fishing down effects: The Bohai Sea (China) as a case study. Ocean Coastal Manage. 2020, 184, 105033. [Google Scholar] [CrossRef]
- Chen, Z.Z.; Qiu, Y.S.; Jia, X.P. Structure and function of Beibu Gulf ecosystem based on Ecopath model. J. Fish. Sci. China. 2008, 15, 460–468. [Google Scholar] [CrossRef]
- Bohnsack, J.A.; Sutherland, D.L. ; Artificial reef research: a review with recommendations for future priorities. Bulletin of marine science. 1985, 37(1), 11–39. [Google Scholar]
- Nakamura, Makoto. Evolution of artificial fishing reef concepts in Japan. Bulletin of marine. Science. 1985, 37(1), 271–278.
- Liang, Z.; Guo, Z.; Jiang, Z.; Zhu, L.; Sun, L. Construction concept and technology of the marine ranching mode of the whole life history of fishes. Journal of Fisheries of China 2020, 44(7), 1211–1222, (in Chinese with English abstract). [Google Scholar]
- Yang, H.; Ding, D. Marine ranching version 3.0: history, status and prospects. Bulletin of the Chinese Academy of Sciences 2022, 37(6), 832–839, (in Chinese with English abstract). [Google Scholar]
- Odum, E.P. The Strategy of Ecosystem Development. Science. 1969, 164, 262–270. [Google Scholar] [CrossRef] [PubMed]
- Lassalle, G.; Lobry, J.; Loc’H, F.L.; Bustamante, P.; Certain, G.; Delmas, D.; Dupuy, C.; Hily, C.; Labry, C.; Pape, O.L. Lower Trophic levels and detrital biomass control the bay of Biscay Continental Shelf food web: implications for ecosystem management. Prog. Oceanogr. 2011, 91, 561–575. [Google Scholar] [CrossRef]
- Rooney, N.; Mccann, K.S. Integrating food web diversity, structure and stability. Trends Ecol. Evol. 2012, 27, 40–46. [Google Scholar] [CrossRef] [PubMed]
- Zhang, X.; Ji, Q.; Hu, C.; Xu, H.; Wang, Y.; Yang, X.; Guo, H. Ecosystem stability of marine ranching and its response to disturbance: research status, issues,and suggestions. Journal of Fisheries of China. 2023, 47(11), 119509, (in Chinese with English abstract). [Google Scholar]
- Laikre, L.; Schwartz, M.K.; Waples, R.S.; Ryman, N. Compromising genetic diversity in the wild: unmonitored large-scale release of plants and animals. Trends in ecology evolution. 2010, 25(9), 520–529. [Google Scholar] [CrossRef]
- Lorenzen, K.; Beveridge, M.C.M.; Mangel, M. Cultured fish: integrative biology and management of domestication and interactions with wild Fish. Biol. Rev. 2012, 87, 639–660. [Google Scholar] [CrossRef] [PubMed]
- Craig, J.K.; Link, J.S. It is past time to use ecosystem models tactically to support ecosystem-based fisheries management: Case studies using Ecopath with Ecosim in an operational management context. Fish. Fish. 2023, 24(3), 381–406. [Google Scholar] [CrossRef]
- Shui, B.N. Rethinking and optimization of releasing stock enhancement for marine fishery resources: a review. Journal of Dalian Ocean University. 2023, 38(5), 737–743. [Google Scholar]
- Radinger, J.; Matern, S.; Klefoth, T.; Wolter, C.; Feldhege, F.; Monk, C.T.; Arlinghaus, R. Ecosystem-based management outperforms species-focused stocking for enhancing fish populations. Science. 2023, 379(6635), 946–951. [Google Scholar] [CrossRef]
- Yang, W.; Zhang, Z.; Wu, Y.; Sun, T.; Liu, H.; Zhao, Y. Ecosystem-based fishery management that accounts for trade-offs between fishing and enhancement stocking: A case study of Juehua island in the Bohai Sea. Ecol. Indic. 2023, 156. [Google Scholar] [CrossRef]
- Hong, X.F.; Chen, Z.Z. ; C.; Zhang, J.; Jiang, Y.E.; J.; Gong, Y.Y.; Cai, Y.C.; Yang, Y.T. Analysis of ecological carrying capacity of reef organisms in Qilianyu Islands based on Ecopath model. Journal of Tropical Oceanography. 2022, 41(01), 15–27, (in Chinese with English abstract). [Google Scholar]
- Yuan, Y.; Xian, W.; Zhang, H. A review of the ecological carrying capacity of fishery resources in China based on the Ecopath model. Marine Sciences. 46(7), 105–119.
- Yang, W.; Zhang, Z.; Wu, Y.; Sun, T.; Liu, H.; Zhao, Y. Ecosystem-based fishery management that accounts for trade-offs between fishing and enhancement stocking: a case study of Juehua Island in the Bohai Sea. Ecol. Indic. 2023, 156. [Google Scholar] [CrossRef]
- Hemraj, D.A.; Bishop, M.; Carstensen, J.; Krause-Jensen, D.; Stæhr, P.A.U.; Russell, B.D. Nature protection must precede restoration. Science. 2024, 383, 158–158. [Google Scholar] [CrossRef] [PubMed]
- Balbar, A.C.; Metaxas, A. The current application of ecological connectivity in the design of marine protected areas. Glob. Ecol. Conserv. 2019, 17, 20. [Google Scholar]
- Ashley, R.; Russell, D.; Swallow, B. The policy terrain in protected area landscapes: challenges for agroforestry in integrated landscape conservation[J]. Biodiversity & Conservation 2006, 15(2), 663–689. [Google Scholar] [CrossRef]
- Yin, J.; Xue, Y.; Li, Y.; Zhang, C.; Xu, B.; Liu, Y.; Ren, Y.; Chen, Y. Evaluating the efficacy of fisheries management strategies in china for achieving multiple objectives under climate change. Ocean Coast. Manag. 2023, 245, 1.1–1.10. [Google Scholar] [CrossRef]
- Ahrens, R.N.M.; Walters, C.J.; Christensen, V. Foraging arena theory. Fish Fish. 2012, 13, 41–59. [Google Scholar] [CrossRef]
- Christensen, V.; Walters, C.J.; Pauly, D.; Forrest, R. Ecopath with Ecosim version 6 user guide. 2008.
- Fath, B.D.; Asmus, H.; Asmus, R.; Baird, D.; Borrett, S.R.; de Jonge, V.N.; Ludovisi, A.; Niquil, N.; Scharler, U.M.; Schückel, U.; Wolff, M. Ecological network analysis metrics: The need for an entire ecosystem approach in management and policy. Ocean Coastal Manage. 2019, 174, 1–14. [Google Scholar] [CrossRef]
- Christensen, V. Ecosystem maturity towards quantification. Ecol. Model. 1995, 77(1), 3–32. [Google Scholar] [CrossRef]
- Pauly, D. On the interrelationships between natural mortality, growth parameters, and mean environmental temperature in 175 fish stocks. Ices J. Mar. Sci. 1980, 39(2), 175–192. [Google Scholar] [CrossRef]
- T. A. Collection of empirical relations for use in ecological modelling. Naga. 1999, 22, 24–28.
- Duan, L.J.; Li, S.Y.; Liu, Y.; Jiang, T.; Failler, P. A. Trophic model of the Pearl River Delta coastal ecosystem. Ocean Coast. Manag. 2009, 52, 359–367. [Google Scholar] [CrossRef]
- Wu, Y.C. The temporal and spatial patterns and size-fractioned structure of primary productivity in Beibu Gulf. Doctoral thesis 2008. (in Chinese with English abstract). [Google Scholar] [CrossRef]
- Palomares, M.L.D.; Paulyb, D. Predicting food consumption of fish populations as functions of mortality, food type, morphometrics, temperature and salinity. Marine and Freshwater Research. 1998, 49(5), 447–453. [Google Scholar] [CrossRef]
- Brey, T. Population dynamics in benthic invertebrates. A virtual handbook. Version 01.2 [online]. 2001. Available from http://www. thomas-brey.de/science/virtualhandbook.
- Lv, X.M. Study on the diet composition of juvenile of Liza haematocheila and Konosirus punctatus and its relationship with ambient phytoplankton. Master thesis, Ocean University of Shanghai, Shanghai. 2016(in Chinese with English abstract).
- Jiao, Y.; Chen, D.G.; Liu, Q.; Zhong, C.J.; Zeng, X.Q.; Ren, Y.P. Biological characteristics of some small species in Engraulidae and Clupeidae. Transactions of Oceanology and Limnology. 2001, 25(4), 323–329, (in Chinese with English abstract). [Google Scholar]
- Jiang, R.J.; Xue, L.J.; Zhang, H.L. Zhu, Z.J. Feeding habits of Ilisha Elongata in the East China Sea. Mar. Fish. 2013, 35, 168–175. [Google Scholar]
- Khan, M.A.; Yousuf, K.; Riaz, S. Food and feeding habits of Sillago Sihama (Forsskal, 1775) (Family: Sillaginidae) from Karachi Coast. AkiNik Publ 2014, 1(3), 27–31, (in Chinese with English abstract). [Google Scholar]
- Li, Z.L.; Zhang, W.X.; He, X.B.; Yan, Y.R. Feeding ecology and feeding competition between Decapterus maruadsi and Trachurus japonicus in autumn in the Beibu Gulf, South China Sea. Journal of Guangdong Ocean University 2019, 39(3), 79–86. [Google Scholar]
- Yang, G.; Sun, X.; Hou, X.; Chen, C. Measurement of the trophic level of fish in a coral reef ecosystem using stable isotopes. J. Fish. Sci. China. 2012, 23, 105–115, (in Chinese with English abstract). [Google Scholar] [CrossRef]
- Zhang, Y.M.; Dai, C.T.; Yan, Y.R.; Yang, Y.L.; Lu, H.S. Feeding habits and trophic level of crimson sea bream (Parargyrops edita Tanaka) in the Beibu Gulf. Journal of Fisheries of China. 2014, 38(2), 265–273, (in Chinese with English abstract). [Google Scholar]
- Jin, H.W.; Xue, L.J.; Zhu, Z.J.; Pan, G.L. Feeding Habits of Apogon Lineatusin the East China Sea and Southern Yellow Sea. Mar. Fish 2012, 34(4), 361–370, (in Chinese with English abstract). [Google Scholar] [CrossRef]
- Liu, J. Morphological comparison of the feeding apparatus of three co-occurring species of ponyfishes (Leiognathidae). Chinese Journal of Oceanology and Limnology. 1997, 15, 224–226. [Google Scholar] [CrossRef]
- Yang, L.; Cao, W.Q.; Lin, Y.S.; Chen, Y.H.; Lin, Z.J.; Wang, X.H. Preliminary study on feeding habits and trophic niche of nine economic fish species in Beibu Gulf in summer. J. Trop. Oceanogr. 2016, 35(2), 66–75, (in Chinese with English abstract). [Google Scholar]
- Yan, Y.R. Feeding ecology and food relations of the main fishes in the beibu gulf, south china Sea. Doctor thesis, Graduate School of Chinese Academy of Sciences, Beijing. 2010. (in Chinese with English abstract).
- Wang, K.; Li, C.W.; Wang, Z.H.; Zhao, J.; Zhang, S.Y. Feeding habits of the marbled rockfish Sebastiscus Marmoratus in the marine ranching off Ma’an Archipelago, China. Chin. J. Appl. Ecol. 2017, 2321–2326, (in Chinese with English abstract). [Google Scholar]
- Han, D.; Xue, Y.; Ji, Y.; Xu, B.; Ma, Q. Trophic and spatial niche of five gobiid fishes in Jiaozhou Bay. J. Fish. Ences China. 2013, 20, 148–156, (in Chinese with English abstract). [Google Scholar] [CrossRef]
- Han, D.Y. Study on feeding ecology of dominate gobiidfishes in Jiaozhou Bay. Master thesis, Ocean University of China, Qingdao. 2013(in Chinese with English abstract).
- Xu, J.W.; Zhang, B.; Zhang, C.L.; Xu, B.D.; Ji, Y.P.; Ren, Y.P.; Xue, Y. Feeding ecology of Amblychaeturichthys hexanema in Haizhou bay based on linear mixed model. Chinese Journal of Applied Ecology 2022, 33(9), 2563–2571, (in Chinese with English abstract). [Google Scholar]
- Ning, J.; Du, F.; Wang, X.; Gu, Y.; Li, Y. Feeding habits of mantis shrimp based on stable isotope analysis. J. Fish. China. 2016a, 40(6), 903–910. [Google Scholar] [CrossRef]
- Ning, J.J.; Du, F.Y.; Li, Y.F. Dietary Composition and trophic position of blue swimmer crab (Portunus Pelagicus)in Honghai Bay. Haiyang Xue bao. 2016b, 8(10), 62–69. [Google Scholar] [CrossRef]
- Huang, M.Z. Study on feeding habitats and nutrient level of four cephalopod specie s from Taiwan Strait and its adjacent areas. Journal of Oceanography in Taiwan Strait 2004, 23(3), 331–340, (in Chinese with English abstract).. [Google Scholar]
- Huang, M.Z. Study on feeding habits and nutrient level of shrimp species from Taiwan Strait and its adjacent sea areas. Journal of Oceanography in Tai wan Strait 2004, 23(4), 481–488, (in Chinese with English abstract).. [Google Scholar]
- Yu, J. ; Chen, P; Feng, X. Food habits and trophic levels for 4 species of economical shrimps in the Pearl River estuary shallow waters. Journal of Southern Agriculture. 2016, 47(5), 736–741, (in Chinese with English abstract).. [Google Scholar]
- Huang, M.Z. Study on feeding habits and nutrient level of four cephalopod species from Taiwan Strait and its adjacent areas. Journal of Oceanography in Tai wan Strait 2004, 23(3), 331–340, (in Chinese with English abstract). [Google Scholar] [CrossRef]
- Mo, B.; Qin, C.; Chen, P.; Li, X.; Yuan, H. Feeding habits of the purple sea urchin Heliocidaris Crassispina based on stable carbon and nitrogen isotope analysis. J. Fish. Sci. China 2017, 24(3), 566–575, (in Chinese with English abstract). [Google Scholar] [CrossRef]
- Ding, M.M. Diet assessment and gut microbiota of intertidal grazing gastropods. Master thesis, Xiamen University, Xiamen.2019 (in Chinese with English abstract).
- Lu, J.P.; Cai, R.X.; Qian, Z.X. Stomach contents of the several barnacles in Zhoushan waters. In Donghai Marine science; 1996; Volume 14, 1, pp. 28–35, (in Chinese with English abstract). [Google Scholar]
- Xu, Q. Evaluation of food sources of bivalve in seaweed and filter-feeding bivalve polyculture ecosystem. Doctoral thesis, The Institute of Oceanology, Chinese Academy of Sciences, Qingdao. 2007 (in Chinese with English Abstract).
- Abdul, W. O.; Adekoya, E.O. Preliminary Ecopath Model of a tropical coastal estuarine ecosystem around Bight of Benin, Nigeria. Environ. Biol. Fishes. 2016, 99(12), 909–923. [Google Scholar] [CrossRef]
- Adebola, T.; Mutsert, K.D. Spatial simulation of redistribution of fishing effort in Nigerian coastal waters Using Ecospace. Ecosphere. 2019, 10. [Google Scholar] [CrossRef]
- Akoglu, E.; Salihoglu, B.; Libralato, S.; Oguz, T.; Solidoro, C. An indicator-based evaluation of black sea food web dynamics during 1960–2000. J. Mar. Syst. 2014, 134, 113–125. [Google Scholar] [CrossRef]
- Arias-González, J.E.; Nuñez-Lara, E.; González-Salas, C.; Galzin, R. Trophic models for investigation of fishing effect on coral reef ecosystems. Ecol. Model. 2004, 172, 197–212. [Google Scholar] [CrossRef]
- Bella, K.; Sahadevan, P.; Raghavan, R. Ramteke K.K. Sreekanth G.B. Trophic functioning of a small, anthropogenically disturbed, tropical estuary. Mar. Environ. Res. 2023, 192, 1.1–112. [Google Scholar] [CrossRef] [PubMed]
- Bradford-Grieve, J.M.; Probert, P.K.; Nodder, S.D.; Thompson, D.; Hall, J.; Hanchet, S.; Boyd, P.; Zeldis, J.; Baker, A.N.; Best, H.A. Pilot trophic model for subantarctic water over the southern plateau, New Zealand: a low biomass, high transfer efficiency system. J. Exp. Mar. Biol. Ecol. 2003, 289, 223–262. [Google Scholar] [CrossRef]
- Campos, W.L. An Ecosystem Model of San Pedro Bay, Leyte, Philippines: Initial Parameter Estimates. Work. Pap. 2003. [Google Scholar]
- Chen, K.; Meng, Z.; Li, X.; Hu, F.; Du, H.; Liu, L.; Zhu, Y.; Yang, D. Community structure and functional diversity of fishes in Zhelin reservoir,Jiangxi Province. Acta Ecologica Sinica 2022, 42(11), 4592–4602, (in Chinese with English abstract).. [Google Scholar]
- Chen, X.P. A study on the community structure and trophic dynamics of fishery resources in Dachen Island area. Doctoral Thesis, Shanghai Ocean University, Shanghai. 2023(in Chinese with English Abstract).
- Chen, Z.; Qiu, Y. Assessment of the food-web structure, energy flows, and system attribute of northern South China Sea ecosystem. Acta Ecologica Sinica 2010, 30(18), 4855–4865, (in Chinese with English abstract). [Google Scholar]
- Chen, Z.; Qiu, Y.; Jia, X. Mass-balance Ecopath model of Belbu Gulf ecosystem. Ying Yong Sheng Tai Xue Bao. 2006, 17, 1107–1111. [Google Scholar]
- Z. ; Xu, S.; He, P. An ecological model of the artificial ecosystem (Northern Hangzhou Bay, China): analysis of ecosystem structure and fishing impacts. Helgol. Mar. Res. 2011, 65, 217–231. [Google Scholar] [CrossRef]
- Chen, Z.; Xu, S.; Qiu, Y. Using a food-web model to assess the trophic structure and energy flows in Daya Bay, China. Cont. Shelf Res. 2015, 111, 316–326. [Google Scholar] [CrossRef]
- Coll, M.; Palomera, I.; Tudela, S. Decadal Changes in a NW Mediterranean sea food web in relation to fishing exploitation. Ecol. Model. 2009, 220, 2088–2102. [Google Scholar] [CrossRef]
- Coll, M.; Santojanni, A.; Palomera, I.; Tudela, S.; Arneri, E. An ecological model of the northern and central Adriatic Sea: analysis of ecosystem structure and fishing impacts. J. Mar. Syst. 2007, 67, 119–154. [Google Scholar] [CrossRef]
- Colléter, M.; Gascuel, D.; Ecoutin, J.M.; Morais, L.T.D. Modelling trophic flows in ecosystems to assess the efficiency of marine protected area (MPA), a case study on the coast of Senegal. Ecol. Model. 2012, 232, 1–13. [Google Scholar] [CrossRef]
- Corrales, X.; Coll, M.; Tecchio, S.; Bellido, J.M.; Fernández, A.M.; Palomera, I. Ecosystem structure and fishing impacts in the northwestern Mediterranean Sea using a food web model within a comparative approach. J. Mar. Syst. 2015, 148, 183–199. [Google Scholar] [CrossRef]
- Dimarchopoulou, D.; Keramidas, I.; Tsagarakis, K.; Tsikliras, A.C. Ecosystem models and effort simulations of an Untrawled Gulf in the central Aegean Sea. Front. Mar. Sci. 2019, 6, 648. [Google Scholar] [CrossRef]
- Duan, L. J.; Li, S. Y.; Liu, Y.; Jiang, T.; Failler, P. A trophic model of the Pearl River Delta coastal ecosystem. Ocean & Coastal Management. 2009, 52(7), 359–367. [Google Scholar]
- Fourriére, M.; Alvarado, J.J.; Cortés, J.; Taylor, M.H.; Ayala-Bocos, A.; Azofeifa-Solano, J.C.; Arauz, R.; Heidemeyer, M.; López-Garro, A.; Zanella, I.; Wolff, M. Energy flow structure and role of keystone groups in shallow water environments in Isla Del Coco, Costa Rica, Eastern Tropical Pacific. Ecol. Model. 2019, 396, 74–85. [Google Scholar] [CrossRef]
- Garces, L.R.; Alias, M.; Abu Talib, A.; Mohamad-Norizam, M.; Silvestre, G.T. A trophic model of the coastal fisheries ecosystem off the West Coast of Sabah and Sarawak, Malaysia, Assessment, management and future directions for coastal fisheries in asian countries. WorldFish Center Conference Proceedings 2003, 333–335. [Google Scholar]
- Gurney, L.J.; Pakhomov, E.A.; Christensen, V. An Ecosystem model of the Prince Edward Island Archipelago. Ecol. Model. 2014, 294, 117–136. [Google Scholar] [CrossRef]
- Haggan, N.; Pitcher, T. Ecosystem Simulation Models of Scotland’s West Coast and Sea Lochs. Univ. Br. Columbia Fish. Cent. 2005, 13(4), 1–67. [Google Scholar]
- Han, R.; Chen, Q.; Wang, L.; Tang, X.; Shen, X. Analysis of the ecosystem structure and energy flow of the Yangtze River estuary and adjacent seas,based on the Ecopath model. Acta Ecologica Sinica. 2016, 36(15), 4907–4918. [Google Scholar]
- Hernández-Padilla, J.C.; Zetina-Rejón, M.J.; Arreguín-Sánchez, F.; Del Monte-Luna, P.; Nieto-Navarro, J.T.; Salcido-Guevara, L.A. Structure and function of the southeastern Gulf of California ecosystem during low and high sea surface temperature variability. Reg. Stud. Mar. Sci. 2021, 43, 11. [Google Scholar] [CrossRef]
- Hervé Rybarczyk; Elkaim, B.; Ochs, L.; Loquet, N. Analysis of the trophic network of a macrotidal ecosystem: The Bay of Somme (Eastern Channel). Estuar. Coast. Shelf Sci. 2003, 58, 405–421. [CrossRef]
- Heymans, J.J.; Baird, D. Network Analysis of the Northern Benguela Ecosystem by means of NETWRK and ECOPATH. Ecol. Model. 2000, 131, 97–119. [Google Scholar] [CrossRef]
- Hong, J.; He-Qin, C.; Hai-Gen, X.; Arrequín-Sánchez, F.; Zetina-Rejón, M.J.; Luna, P.D.M.; Le Quesne, W.J. Trophic controls of jellyfish blooms and links with fisheries in the East China Sea. Ecol. Model 2008, 212(3-4). [Google Scholar] [CrossRef]
- Jing, Z.; Shou-yu, Z.; Min, X.U. ; The primary research of the energy flow in Gouqi kelp bed ecosystem. Journal of Shanghai Ocean University. 2010, 19(1), 98–104, (in Chinese with English abstract). [Google Scholar]
- Li, Y.K.; Yu, N.; Chen, L.Q.; Chen, Y.; Feng, D.X. Ecological modeling on structure and functioning of Southern East China Sea ecosystem. Prog. Fish. Sci. 2010, 31, 30–39. [Google Scholar] [CrossRef]
- Lin, H.J.; Shao, K.T.; Kuo, S.R.; Hsieh, H.L.; Wong, S.L.; Chen, I.M.; Lo, W.T.; Hung, J.J. A Trophic Model of a sandy barrier lagoon at Chiku in Southwestern Taiwan. Estuar. Coast. Shelf Sci. 1999, 48, 575–588. [Google Scholar] [CrossRef]
- Lin, Q.; Jin, X.; Guo, X.; Zhang, B. Study on the structure and energy flow of the Yangtze River estuary and adjacent waters ecosystem based on Ecopath Model. J. Hydroecology, 2009, 2, 30–38. [Google Scholar]
- Lin, Q.; Jin, X.; Zhang, B.; Guo, X. Comparative study on the changes of the Bohai Sea ecosystem structure based on Ecopath model between ten years. Acta Ecologica Sinica 2009, 29(7), 3613–3620, (in Chinese with English abstract).. [Google Scholar]
- Lin, Q.; Jin, X.S.; Zhang, B. ; Trophic interactions, ecosystem structure and function in the southern Yellow Sea. Chin. J. Oceanol. Limnol. 2013a, 31(1), 46–58. [Google Scholar] [CrossRef]
- Lin, Q.; Li, X.S.; Li, Z.Y.; Jin, X.S. Ecological Carrying Capacity of Chinese Shrimp stock enhancement in Laizhou Bay of East China based on Ecopath Model. Ying Yong Sheng Tai Xue Bao. J. Appl. Ecol 2013b, 24, 1131–1140, (in Chinese with English abstract).. [Google Scholar]
- Lin, Q.; Shan, X.; Wang, J.; Li, Z. Changes in Chinese Shrimp (Fenneropenaeus chinensis) carrying capacity of the Bohai Sea. Progress in Fishery Sciences. 2018, 39(4), 19–29, (in Chinese with English abstract).. [Google Scholar]
- Lin, Q.; Wang, J.; Li, Z.Y.; Wu, Q. Assessment of ecosystem energy flow and carrying capacity of swimming crab enhancement in the Yellow River Estuary and adjacent waters. Chin. J. Appl. Ecol. 2015, 26, 3523–3531, (in Chinese with English abstract). [Google Scholar]
- Lira, A.; Angelini, R.; Le Loc'h, F.; Menard, F.; Lacerda, C.; Fredou, T.; Fredou, F.L. ; Trophic flow structure of a neotropical estuary in northeastern Brazil and the comparison of ecosystem model indicators of estuaries. J. Mar. Syst. 2018, 182, 31–45. [Google Scholar] [CrossRef]
- Liu, H.; Yang, C.; Zhang, P.; Li, W.; Zhang, X. An Ecopath evaluation of system structure and function for the Laoshan Bay artificial reef zone ecosystem. Acta Ecologica Sinica 2019, 39(11), 3926–3936, (in Chinese with English abstract).. [Google Scholar]
- Liu, P.J.; Shao, K.T.; Jan, R.Q.; Fan, T.Y.; Wong, S.L.; Hwang, J.S.; Chen, J.P.; Chen, C.C.; Lin, H.J. A Trophic model of fringing coral reefs in Nanwan Bay, Southern Taiwan suggests overfishing. Mar. Environ. Res. 2009, 68, 106–117. [Google Scholar] [CrossRef] [PubMed]
- Lozano-Montes, H.M.; Loneragan, N.R.; Babcock, R.C.; Jackson, K. Using Trophic flows and ecosystem structure to model the effects of fishing in the Jurien Bay Marine Park, Temperate Western Australia. Mar. Freshw. Res. 2011, 62, 421–431. [Google Scholar] [CrossRef]
- Ma, M.; Chen, Z.; Xu, S.; Zhang, J.; Yu, W. Trophic structure and energy flow of continental slope of the northern South China Sea ecosystem. Journal of Fisheries of China 2020, 44(10), 1685–1694, (in Chinese with English abstract).. [Google Scholar]
- Ma, M.; Xu, S.; Xu, Y.; Zhang, K.; Yuan, W.; Chen, Z. Comparative study of Jiaozhou Bay ecosystem based on an Ecopath model. J. Fish. Sci. China 2018, 25, 413–422. [Google Scholar] [CrossRef]
- Manickchand-Heileman, S.; Arreguín-Sánchez, F.; Lara-Domínguez, A.; Soto, L.A. Energy flow and network analysis of Terminos Lagoon, SW Gulf of Mexico. Journal of Fish Biology. 1998, 53, 179–197. [Google Scholar] [CrossRef]
- Monte-Luna, P.D.; Arreguín-Sánchez, F.; Lluch-Belda, D. Marine ecosystem analyses in the gulf of Ulloa, Mexico: BAC meets Ecopath. NCOFISH ecosystem models: transiting from Ecopath to ecospace. Fisheries Centre Research Reports Fisheries Centre, University of British Columbia, Vancouver. 2007, 15(6), 114-133.
- Montero, L.C.; Christensen, V.; Hernández, J.J.C. Simulating trophic impacts of fishing scenarios on two Oceanic Islands using Ecopath with Ecosim. Mar. Environ. Res. 2021, 169, 12. [Google Scholar] [CrossRef]
- Morales-Zárate, M.V.; Lluch-Cota, S.E.; Serviere-Zaragoza, E.; del Próo, S.G. Modeling an exploited rocky coastal ecosystem: Bahia Tortugas, Mexico. Ecol. Model. 2011, 222, 1185–1191. [Google Scholar] [CrossRef]
- Okey, T.A.; Banks, S.; Born, A.R.; Bustamante, R.H.; Calvopiña, M.; Edgar, G.J.; Espinoza, E.; Fariña, J.M.; Garske, L.E.; Reck, G.K.; Salazar, S.; Shepherd, S.; Toral-Granda, V.; Wallem, P. A trophic model of a Galapagos subtidal rocky reef for evaluating fisheries and conservation strategies. Ecol. Model. 2004, 172(2-4), 383–401. [Google Scholar] [CrossRef]
- Ortiz, M.; Berrios, F.; Campos, L.; Uribe, R.; Ramirez, A.; Hermosillo-Núñez, B.; González, J.; Rodriguez-Zaragoza, F. Mass balanced trophic models and short-term dynamical simulations for benthic ecological systems of Mejillones and Antofagasta bays (SE Pacific): Comparative network structure and assessment of human impacts. Ecol. Model. 2015, 309, 153–162. [Google Scholar] [CrossRef]
- Ortiz, M.; Wolff, M. Trophic models of four benthic communities in Tongoy Bay (Chile): Comparative analysis and preliminary assessment of management strategies. J. Exp. Mar. Biol. Ecol. 2002, 268, 205–235. [Google Scholar] [CrossRef]
- Pinnegar, *!!! REPLACE !!!*; Keith, J. Pinnegar; Keith, J. Planktivorous fishes: links between the Mediterranean littoral and pelagic. University of Newcastle upon Tyne, 2000. [Google Scholar]
- Rahman, M.F.; Qun, L.; Shan, X.J.; Chen, Y.L.; Ding, X.S.; Liu, Q. Temporal changes of structure and functioning of the Bohai Sea ecosystem: insights from Ecopath models. Thalass. Thalass. Int. J. Mar. Sci. 2019, 35. [Google Scholar] [CrossRef]
- Ren, X.; Liu, Y.; Xu, B.; Zhang, C.; Ren, Y.; Cheng, Y.; Xue, Y. Ecosystem structure in the Haizhou Bay and adjacent waters based on Ecopath model. Acta Oceanologica Sinica. 2020, 42(6), 101–109, (in Chinese with English abstract).. [Google Scholar]
- Rocha, G.R.A.; Rossi-Wongtschowski, C.L.d.B.; Pires-Vanin, A.M.S.; Soares, L.S.H. Trophic models of São Sebastião channel and continental shelf systems, SE Brasil. Pan-American Journal of Aquatic Sciences. 2007, 2(2), 149–162. [Google Scholar]
- Schückel, U.; Kröncke, I.; Baird, D. Linking long-term changes in trophic structure and function of an intertidal macrobenthic system to eutrophication and climate change using ecological network analysis. Mar. Ecol.-Prog. Ser. 2015, 536, 25–38. [Google Scholar] [CrossRef]
- Steffen, W.; Sanderson, A.; Tyson, P.; Jäger, J.; Matson, P.; Moore, B.; Oldfield, F.; Richardson, K. Reverberations of Change: The Responses of the Earth System to Human Activities. Springer Berl. Heidelb. 2005, 10.1007/b137870, 143–202. [CrossRef]
- Tecchio, S.; Rius, A.T.; Dauvin, J.C.; Lobry, J.; Lassalle, G.; Morin, J.; Bacq, N.; Cachera, M.; Chaalali, A.; Villanueva, M.C. The mosaic of habitats of the Seine Estuary: insights from food-web modelling and network analysis. Ecol. Model. 2015, 312, 91–101. [Google Scholar] [CrossRef]
- Torres, M.; Coll, M.; Heymans, J.J.; Christensen, V.; Sobrino, I. Food-web structure of and fishing impacts on the Gulf of Cadiz Ecosystem (South-Western Spain). Ecol. Model. 2013, 265, 26–44. [Google Scholar] [CrossRef]
- Tsehaye, I.; Nagelkerke, L.A.J. Exploring optimal fishing scenarios for the multispecies artisanal fisheries of eritrea using a trophic Model. Ecol. Model. 2008, 212, 319–333. [Google Scholar] [CrossRef]
- Ullah, Md.H.; Rashed-Un-Nabi, Md.; Al-Mamun, Md.A. Trophic model of the coastal ecosystem of the Bay of Bengal using mass balance Ecopath Model. Ecol. Model. 2012, 225, 82–94. [Google Scholar] [CrossRef]
- Wang, T.; Zhang, H.; Zhang, H.; Zhang, S. Ecological carrying capacity of Chinese shrimp stock enhancement in Haizhou Bay of East China based on Ecopath model. Journal of Fishery Sciences of China 2016, 23(4), 965–975, (in Chinese with English abstract). [Google Scholar]
- Wang, W.; Wang, J.; Zuo, P.; Li, Y.; Zou, X. Analysis of Structure and Energy Flow in Southwestern Yellow Sea Ecosystem Based on Ecopath Model. J. Appl. Oceanogr 2019, 38(4), 528–539, (in Chinese with English abstract).. [Google Scholar]
- Wang, X.H.; Li, S.Y.; Peng, R.Y. Establishment and comparative analysis of Ecopath model of ecosystem evolvement in northern continental shelf of South China Sea. Marine Environmental Science. 2009, 28(3), 288–292. [Google Scholar]
- Wang, Y.; Gao, L.; Chen, Y. Assessment of Portunus (Portunus) Trituberculatus (Miers, 1876) stock in the northern East China Sea. Indian J. Fish. 2018. [Google Scholar] [CrossRef]
- Wolff, M. A Trophic model for Tongoy Bay —a system exposed to suspended scallop culture (Northern Chile). J. Exp. Mar. Biol. Ecol. 1994, 182, 149–168. [Google Scholar] [CrossRef]
- Xu, C.; Wang, S.; Zhao, F.; Song, C.; Zhuang, P. Trophic structure and energy flow of the Yangtze estuary ecosystem based on the analysis with Ecopath model. Mar. Fish. 2018, 40(3), 309–318. [Google Scholar]
- Xu, M.; Yang, X.Y.; Song, X.J.; Xu, K.D.; Yang, L.L. Seasonal analysis of artificial oyster reef ecosystems: implications for sustainable fisheries management. Aquac. Int. 2021, 29, 167–192. [Google Scholar] [CrossRef]
- Zhang, S.; Wang, T. ; Fu, X; Zhang, H. A primary study on the energy flow in the ecosystem of fishery ecological restoration area in Haizhou Bay, Lianyungang. Mar. Environ. Sci 2015, 34(1), 42–47, (in Chinese with English abstract). [Google Scholar]
- Zhang, X.; Xian, W. Energy Flow and Network Analysis of the Yangtze Estuary ecosystem during 1985–1986. Mar. Sci. 2016, 40(7), 60–72, (in Chinese with English abstract). [Google Scholar]
- Zhang, Y.; Chen, Y. Modeling and evaluating ecosystem in 1980s and 1990s for American lobster (Homarus Americanus) in the Gulf of Maine. Ecol. Model. 2007, 203, 475–489. [Google Scholar] [CrossRef]
Figure 1.
Geographic location and sampling sites of the Jinggong marine ranching and control ecosystems in the Bay of Beibu gulf.
Figure 1.
Geographic location and sampling sites of the Jinggong marine ranching and control ecosystems in the Bay of Beibu gulf.
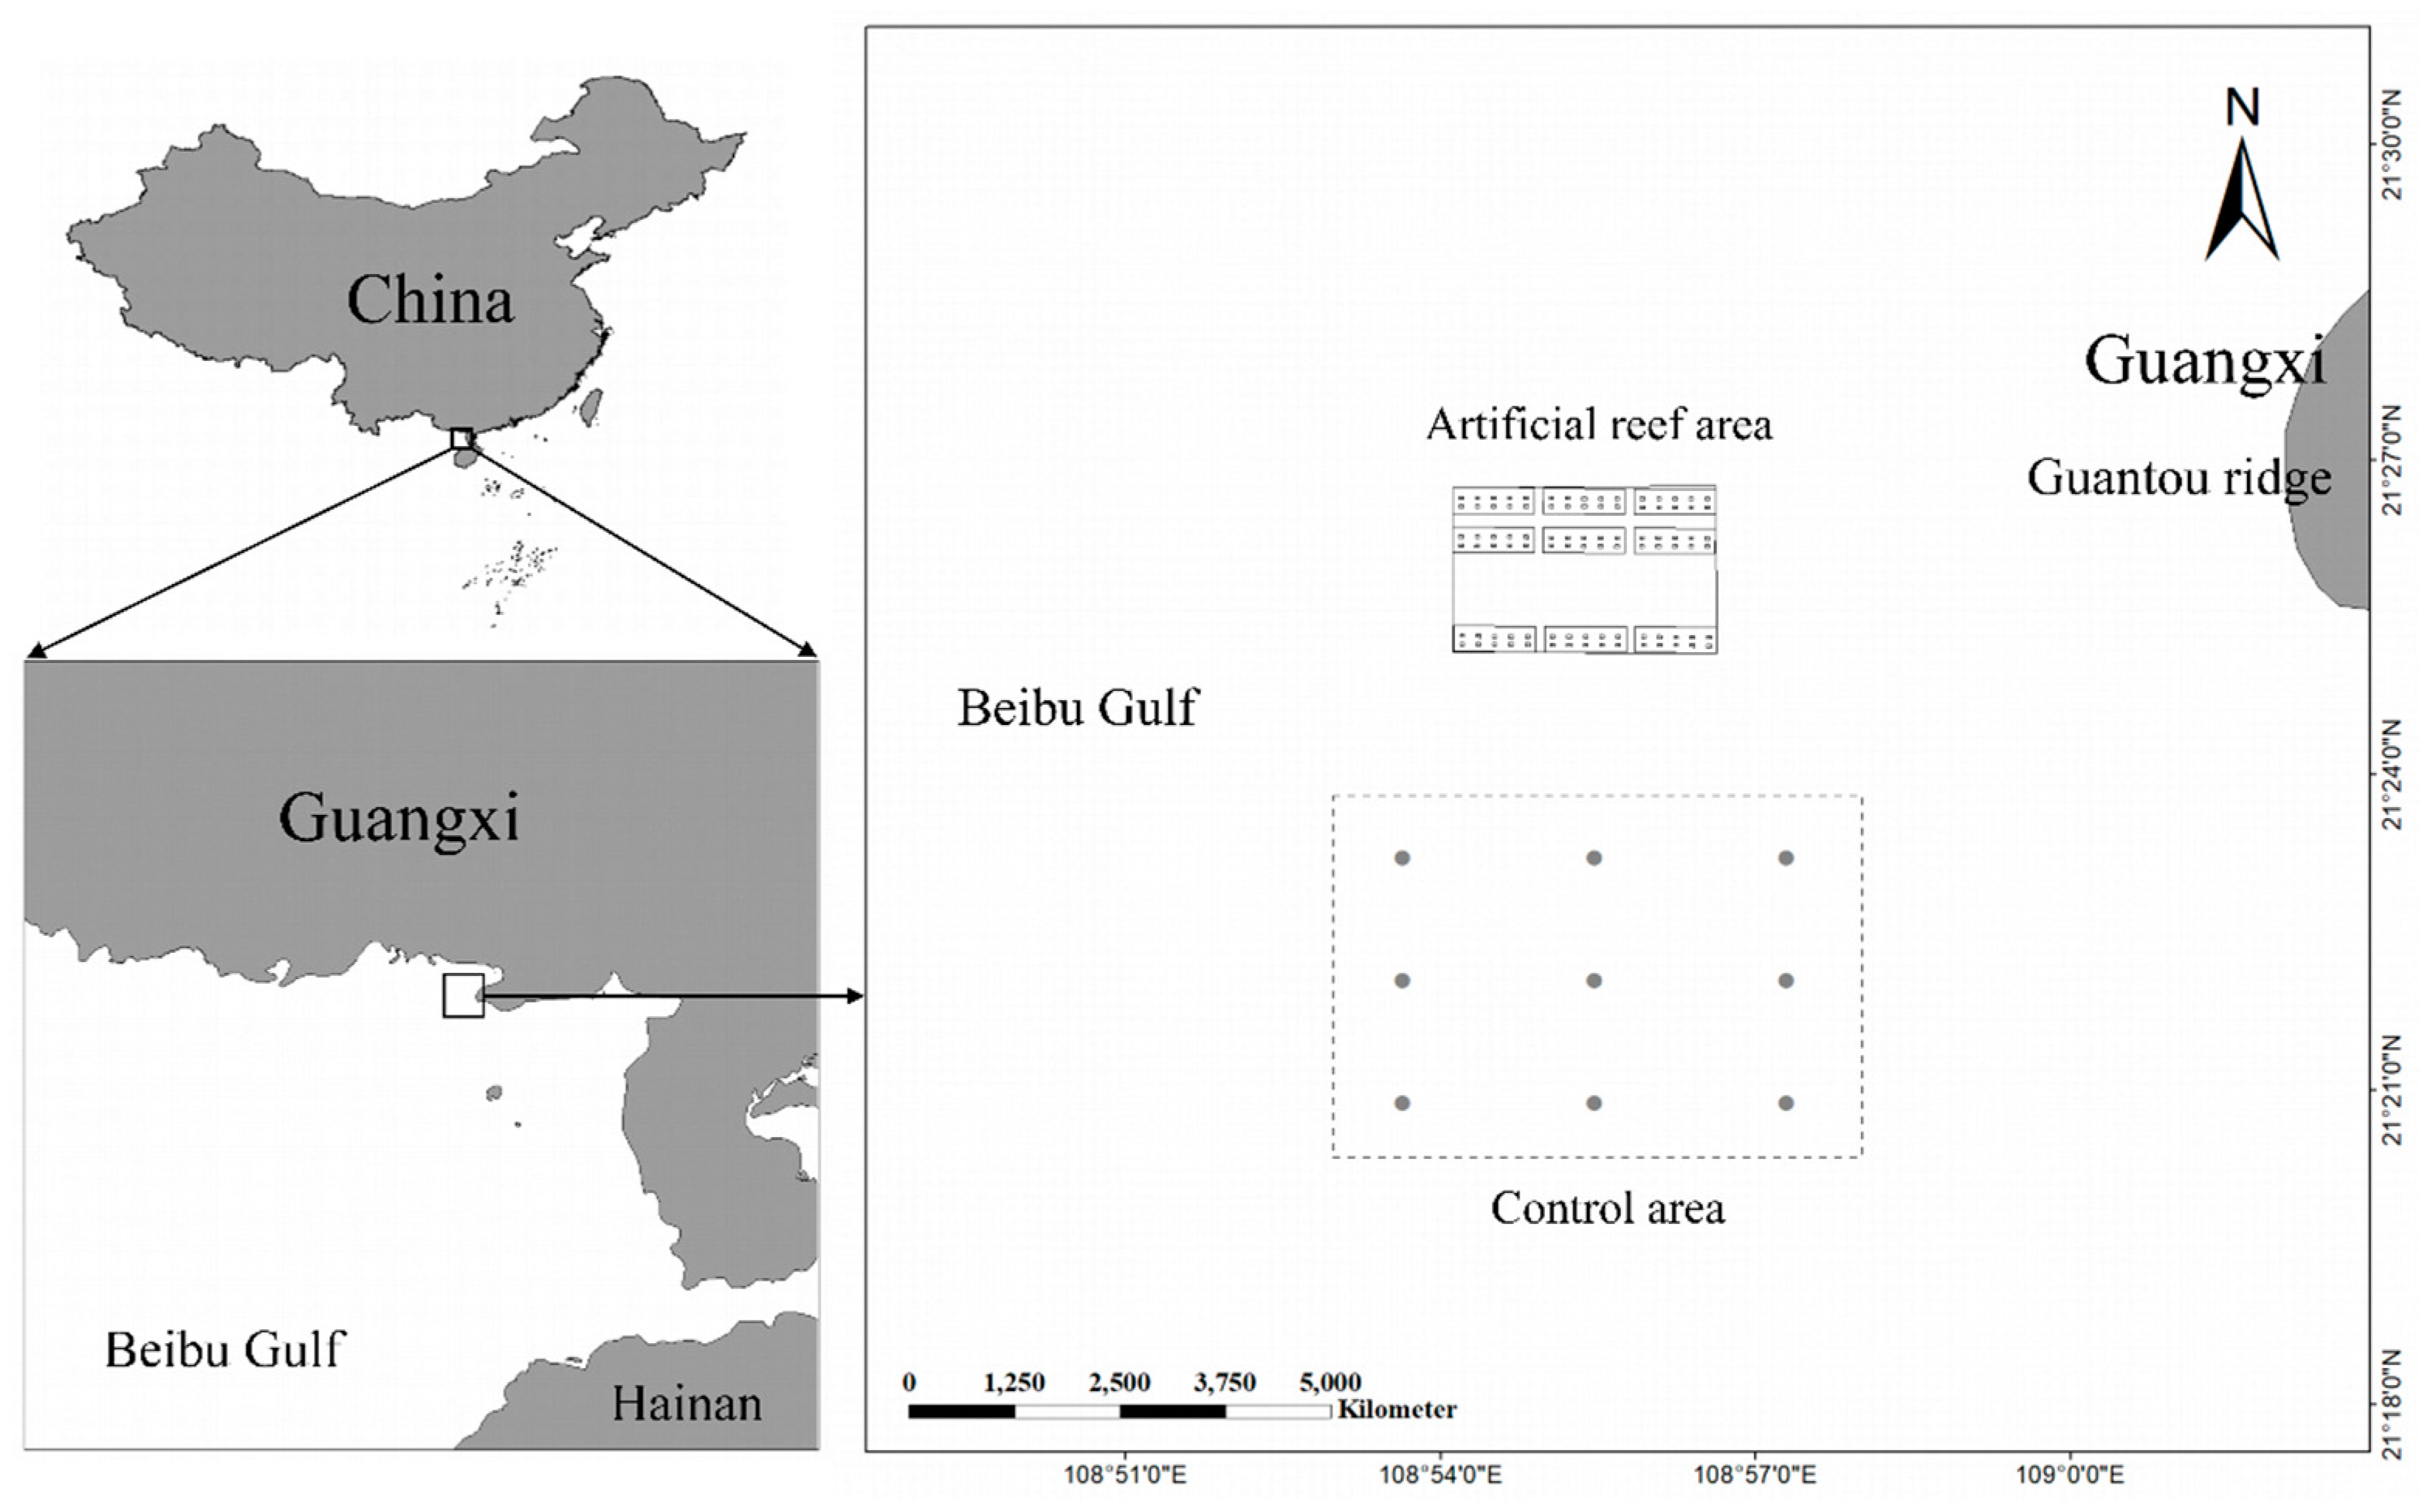
Figure 2.
Types of artificial reefs deployed in marine ranching (Size: type Ⅰ: 3.0m×3.0m×3.5m; type Ⅱ: 3.0m×3.0m×3.5m; type Ⅲ: 2m×2m×2m; type Ⅳ: 2.1m×2.1m×2.1m).
Figure 2.
Types of artificial reefs deployed in marine ranching (Size: type Ⅰ: 3.0m×3.0m×3.5m; type Ⅱ: 3.0m×3.0m×3.5m; type Ⅲ: 2m×2m×2m; type Ⅳ: 2.1m×2.1m×2.1m).

Figure 2.
The energy flow (t/km2/a) among different trophic levels in the marine ranching and control ecosystems, respectively (D: detritus; P: primary producers; TL: trophic level; TE: transfer efficiency; TST: total system throughput).
Figure 2.
The energy flow (t/km2/a) among different trophic levels in the marine ranching and control ecosystems, respectively (D: detritus; P: primary producers; TL: trophic level; TE: transfer efficiency; TST: total system throughput).
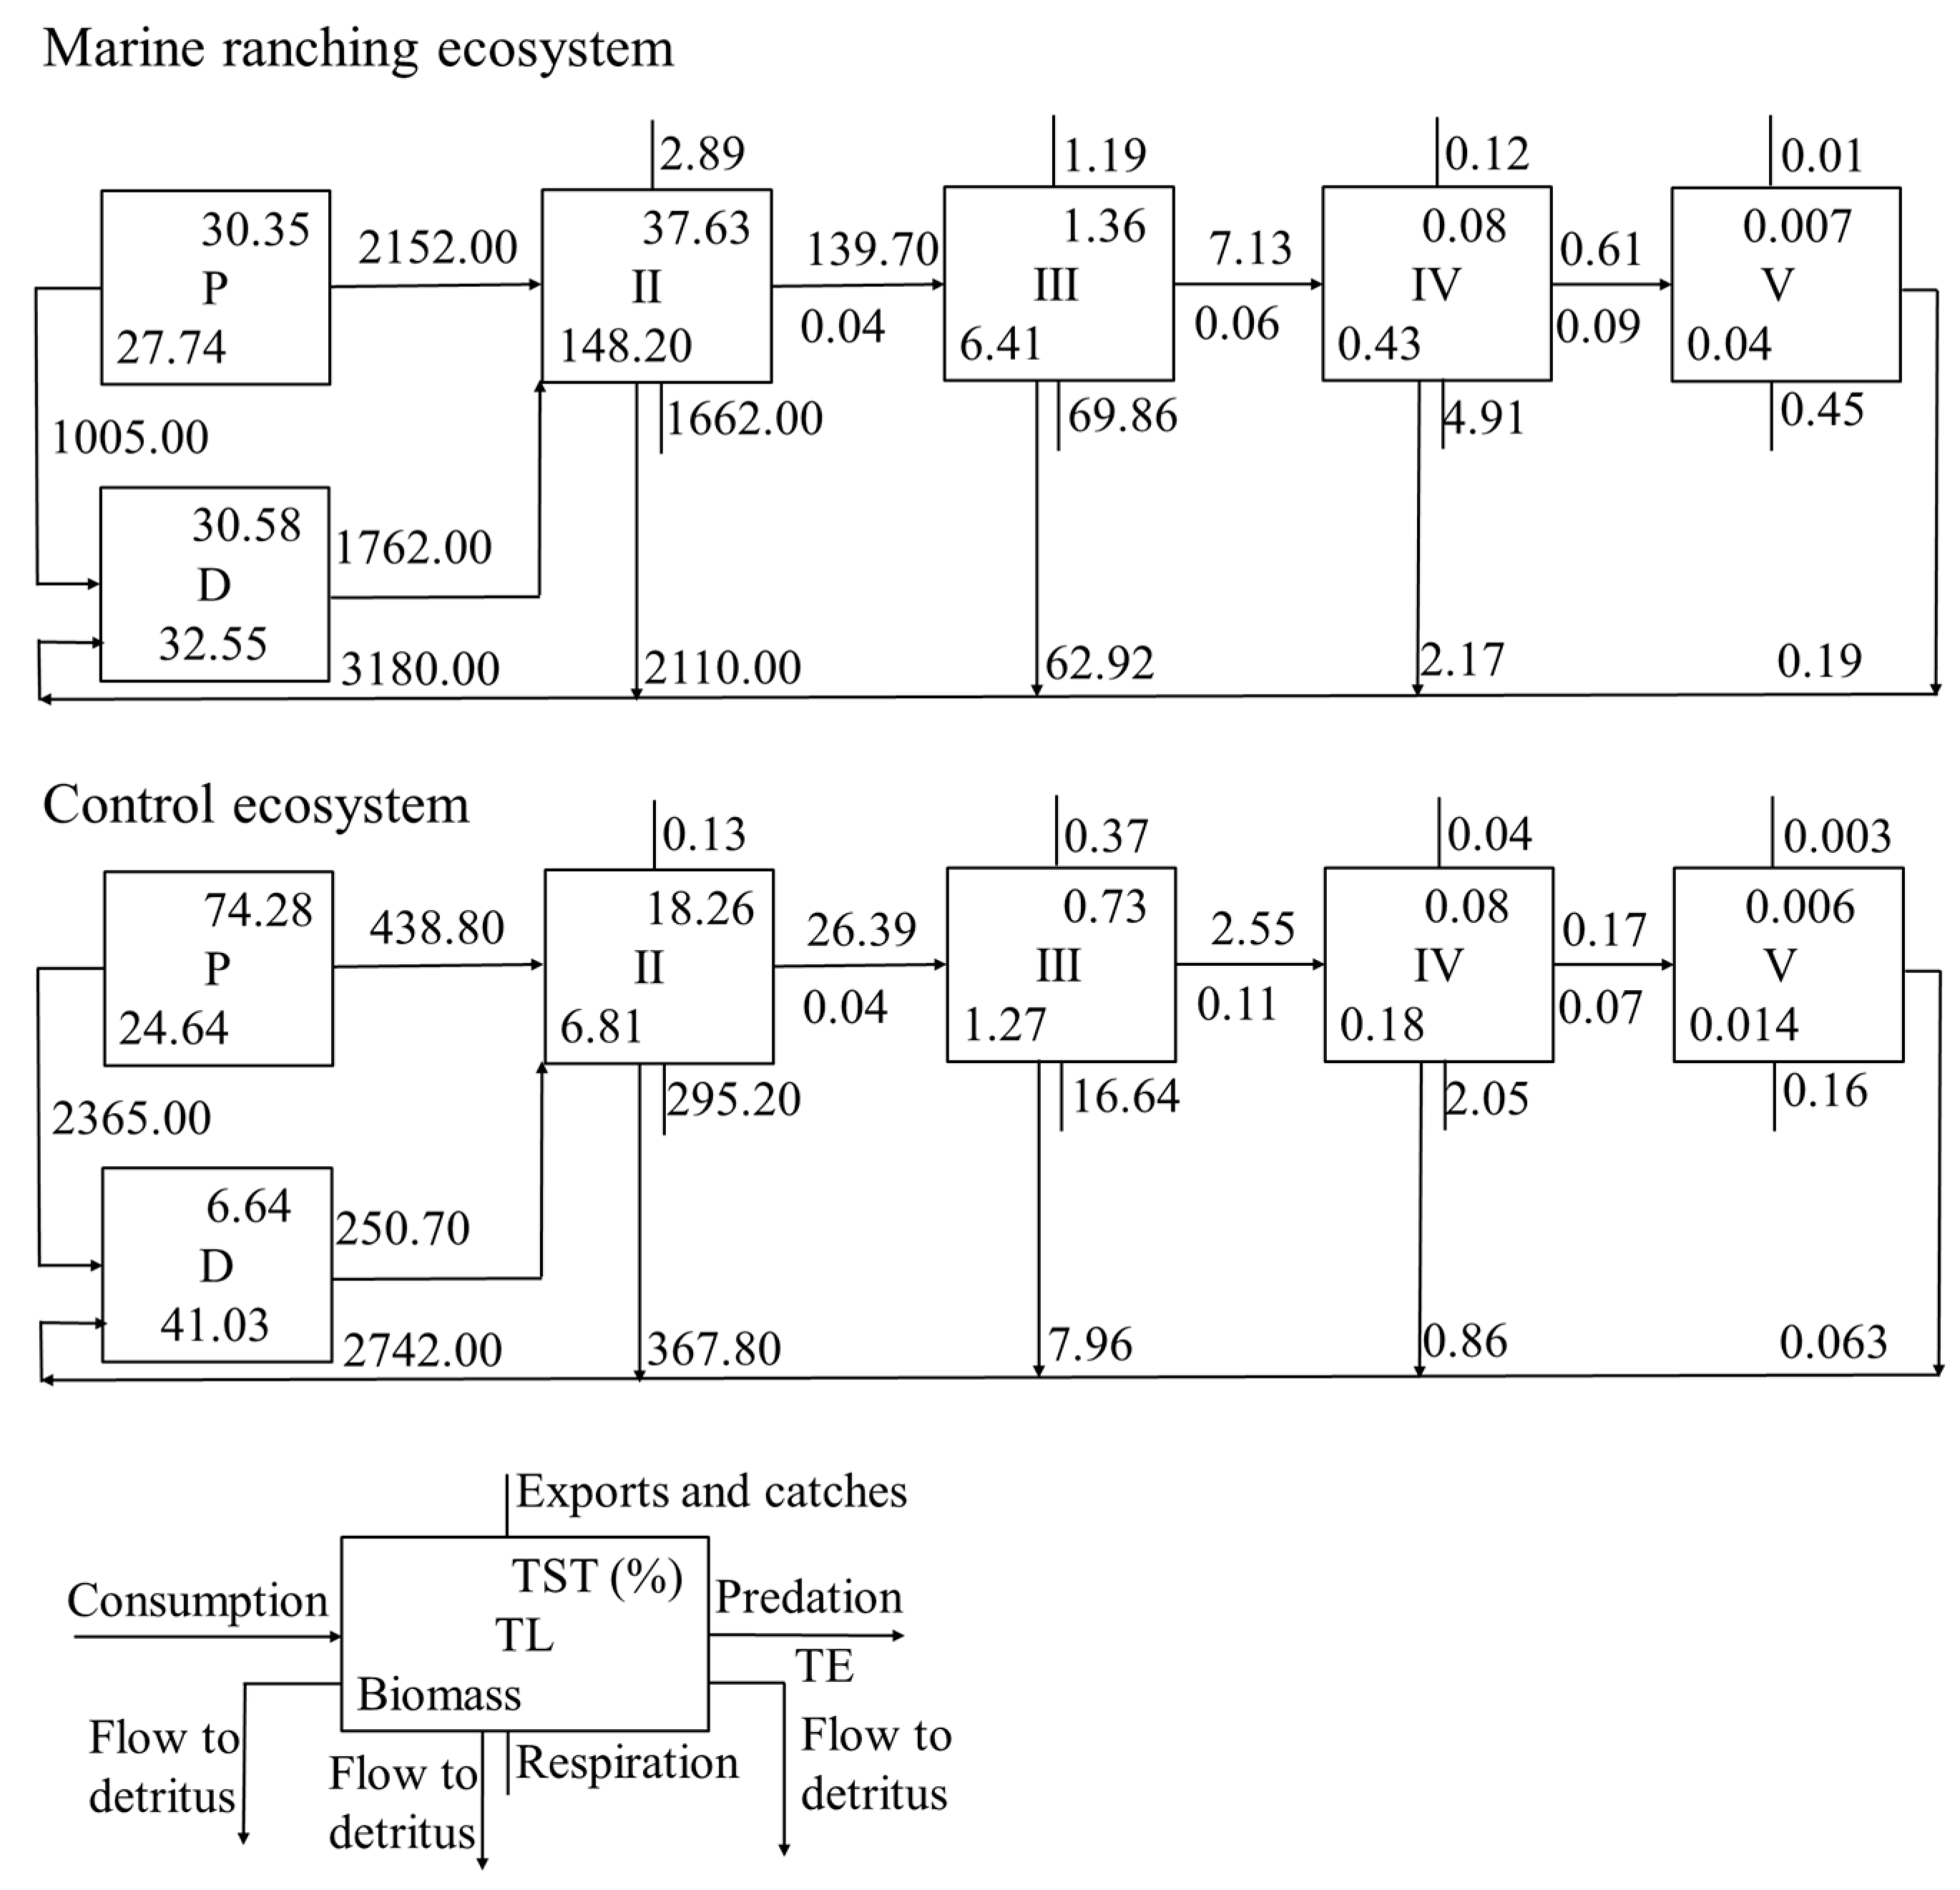
Table 1.
Selected indices and their weight assignment.
| Overall target | Criterion layers | Indicator tayers | Weight |
|---|---|---|---|
| Ecosystem state | Ecosystem function | D/H | 0.133 |
| 0.4 | A/C | 0.133 | |
| TE | 0.133 | ||
| Food web structure | CI | 0.114 | |
| 0.4 | SOI | 0.114 | |
| FCI | 0.114 | ||
| FML | 0.057 | ||
| Ecosystem maturity | TPP/TR | 0.1 | |
| 0.2 | TPP/TB | 0.05 | |
| TB/TST | 0.05 |
Note: D:H: Detritivory: herbivory ratio; TE: transfer efficiency; A/C: relative ascendancy; FCI: Finn’s cycling index; CI: connectance index; SOI: system omnivory index; FML: Finn’s mean path length; TPP/TR: total primary production/total respiration; TPP/TB: total primary production/total biomass; TB/TST: total biomass/total throughput.
Table 2.
The values of interval points between the different evaluation grades for indicators.
| Indicators | Grades | Indicator types | ||||
|---|---|---|---|---|---|---|
| Poor | Relatively poor | medium | Relatively good | Good | ||
| D/H | 0.073 | 0.414 | 0.540 | 0.631 | 1.209 | Positive |
| TE | 2.920 | 6.800 | 9.400 | 11.500 | 13.236 | Positive |
| A/C | 0.150 | 0.264 | 0.302 | 0.339 | 0.368 | Positive |
| CI | 0.100 | 0.204 | 0.265 | 0.310 | 0.348 | Positive |
| SOI | 0.009 | 0.144 | 0.180 | 0.210 | 0.271 | Positive |
| FCI | 0.650 | 2.800 | 4.980 | 9.400 | 14.700 | Positive |
| FML | 1.206 | 2.336 | 2.568 | 3.193 | 4.000 | Positive |
| TPP/TR | 15.509 | 3.522 | 2.572 | 1.922 | 1.346 | Negtive |
| TPP/TB | 132.000 | 48.656 | 31.964 | 17.338 | 9.110 | Negtive |
| TB/TST | 0.003 | 0.008 | 0.011 | 0.019 | 0.030 | Negtive |
Note: the abbreviations are the same to Table 1.
Table 3.
TL, B, P/B, Q/B, EE, and Ui of each functional group in the marine ranching ecosystem.
| Functional groups | TL | B (t/km2) | P/B (/a) | Q/B (/a) | EE | Ui |
|---|---|---|---|---|---|---|
| Pelagic fishes | 2.70 | 0.11 | 0.60 | 16.29 | 0.76 | 0.20 |
| Large and medium demersal fishes | 3.42 | 0.18 | 1.16 | 12.82 | 0.77 | 0.20 |
| Sparids | 3.46 | 0.33 | 0.95 | 14.43 | 0.19 | 0.20 |
| Leiognathidae | 2.86 | 0.24 | 2.40 | 14.12 | 0.50 | 0.20 |
| Small demersal fishes | 3.22 | 0.18 | 1.76 | 13.60 | 0.72 | 0.20 |
| Scorpaenidae | 3.27 | 0.02 | 0.97 | 4.00 | 0.25 | 0.20 |
| Gobiidae | 3.22 | 0.07 | 2.32 | 12.96 | 0.86 | 0.20 |
| Mantis shrimps | 3.08 | 0.12 | 5.98 | 30.81 | 0.18 | 0.20 |
| Large crabs | 2.89 | 0.30 | 5.49 | 26.79 | 0.92 | 0.20 |
| Other crabs | 3.13 | 0.30 | 6.82 | 30.35 | 0.75 | 0.20 |
| Metapenaeopsis barbata | 2.33 | 0.52 | 7.89 | 27.61 | 0.31 | 0.20 |
| Other shrimps | 2.37 | 1.50 | 6.68 | 23.92 | 0.63 | 0.20 |
| Cephalopods | 3.28 | 0.07 | 3.81 | 14.83 | 0.80 | 0.20 |
| Sea urchins | 2.10 | 11.43 | 6.38 | 23.60 | 0.01 | 0.20 |
| Gastropods | 2.46 | 0.88 | 5.75 | 23.83 | 0.63 | 0.20 |
| Barnacles | 2.02 | 30.00 | 6.15 | 27.19 | 0.01 | 0.20 |
| Oysters | 2.02 | 21.76 | 4.61 | 20.93 | 0.07 | 0.40 |
| Mussels | 2.02 | 80.40 | 5.06 | 19.34 | 0.05 | 0.40 |
| Other bivalves | 2.02 | 1.58 | 6.20 | 23.46 | 0.74 | 0.40 |
| Other benthos | 2.34 | 0.93 | 6.10 | 21.95 | 0.61 | 0.35 |
| Zooplankton | 2.00 | 4.17 | 32.54 | 192.47 | 0.73 | 0.40 |
| Phytoplankton | 1.00 | 27.74 | 113.82 | 0.68 | ||
| Detritus | 1.00 | 32.55 | 0.55 |
Note: TL: trophic level; B: biomass; P/B: production/biomass; Q/B: consumption/biomass; EE: ecotrophic efficiency; Ui: unassimilated consumption.
Table 4.
TL, B, P/B, Q/B, EE, and Ui of each functional group in the control ecosystem.
| Functional groups | TL | B (t/km2) | P/B (/a) | Q/B (/a) | EE | Ui |
|---|---|---|---|---|---|---|
| Pelagic fishes | 2.70 | 0.06 | 0.60 | 16.29 | 0.73 | 0.20 |
| Large and medium demersal fishes | 3.35 | 0.18 | 1.30 | 15.18 | 0.78 | 0.20 |
| Sparids | 3.63 | 0.01 | 0.73 | 15.87 | 0.69 | 0.20 |
| Leiognathidae | 2.84 | 0.18 | 2.75 | 17.81 | 0.01 | 0.20 |
| Small demersal fishes | 3.16 | 0.12 | 1.83 | 12.75 | 0.61 | 0.20 |
| Scorpaenidae | 3.30 | 0.00 | 0.97 | 4.00 | 0.16 | 0.20 |
| Gobiidae | 3.16 | 0.07 | 2.30 | 13.92 | 0.41 | 0.20 |
| Mantis shrimps | 3.01 | 0.13 | 5.18 | 31.68 | 0.13 | 0.20 |
| Large crabs | 2.84 | 0.33 | 4.67 | 24.38 | 0.34 | 0.20 |
| Other crabs | 3.09 | 0.11 | 4.84 | 24.90 | 0.92 | 0.20 |
| Metapenaeopsis barbata | 2.31 | 0.06 | 7.40 | 28.04 | 0.91 | 0.20 |
| Other shrimps | 2.37 | 0.58 | 6.77 | 25.85 | 0.96 | 0.20 |
| Cephalopods | 3.25 | 0.07 | 4.58 | 15.82 | 0.36 | 0.20 |
| Gastropods | 2.42 | 0.26 | 5.70 | 23.80 | 0.65 | 0.20 |
| Bivalves | 2.01 | 2.86 | 5.65 | 23.77 | 0.95 | 0.40 |
| Other benthos | 2.08 | 0.11 | 6.10 | 21.95 | 0.89 | 0.35 |
| Zooplankton | 2.00 | 3.13 | 32.39 | 192.29 | 0.07 | 0.40 |
| Phytoplankton | 1.00 | 24.64 | 113.82 | 0.16 | ||
| Detritus | 1.00 | 41.03 | 0.09 |
Note: the abbreviations are the same to Table 3.
Table 5.
Ecosystem attributes of the marine ranching and control ecosystems.
| Attributes | Marine ranching ecosystem | Control ecosystem | Unit |
|---|---|---|---|
| Total system throughput | 10404.99 | 3777.48 | t/km2/a |
| Total consumption | 4064.63 | 720.83 | t/km2/a |
| Total export | 1422.78 | 0.54 | t/km2/a |
| Total respiration | 1737.31 | 314.03 | t/km2/a |
| Total flow to detritus | 3180.26 | 2742.08 | t/km2/a |
| Total production | 4098.69 | 2932.48 | t/km2/a |
| Total primary production | 3157.37 | 2804.18 | t/km2/a |
| Total biomass | 182.83 | 32.90 | t/km2 |
Table 6.
Values of ENA indicators in the marine ranching and control ecosystems.
| Ecosystem | ENA indicators | |||||||||||
| Ecosystem function | Food web structure | Ecosystem maturity | ||||||||||
| D/H | TE | A/C | CI | SOI | FCI | FML | TPP/TR | TPP/TB | TB/TST | |||
| Marine ranching | 0.82 | 5.84 | 0.22 | 0.28 | 0.16 | 12.43 | 3.29 | 1.82 | 17.27 | 0.018 | ||
| Control ecosystem | 0.57 | 6.47 | 0.48 | 0.32 | 0.2 | 2.55 | 2.23 | 8.93 | 85.22 | 0.005 | ||
Note: ENA: Ecological network analysis indicator; the abbreviations of D/H, TE, A/C, CI, SOI, FCI, FML, TPP/TR, TPP/TB, and TB/TST as in Table 1.
Table 7.
Evaluation results of the fuzzy synthetic evaluation for the status of marine ranching and control ecosystems.
Table 7.
Evaluation results of the fuzzy synthetic evaluation for the status of marine ranching and control ecosystems.
| Type | Ecosystem | Evaluation grade of ENA indices or ecosystem status | ||||
|---|---|---|---|---|---|---|
| Poor | Relatively poor | medium | Relatively good | Good | ||
| CI | Marine ranching ecosystem | 0 | 0 | 0.67 | 0.33 | 0 |
| Control ecosystem | 0 | 0 | 0 | 0.74 | 0.26 | |
| SOI | Marine ranching ecosystem | 0 | 0.55 | 0.45 | 0 | 0 |
| control ecosystem | 0 | 0 | 0.33 | 0.67 | 0 | |
| FCI | Marine ranching ecosystem | 0 | 0 | 0 | 0.43 | 0.57 |
| control ecosystem | 0.12 | 0.88 | 0 | 0 | 0 | |
| FML | Marine ranching ecosystem | 0 | 0 | 0.12 | 0.88 | 0 |
| control ecosystem | 0.09 | 0.91 | 0 | 0 | 0 | |
| D/H | Marine ranching ecosystem | 0 | 0.32 | 0.68 | 0 | 0 |
| control ecosystem | 0 | 0.4 | 0.6 | 0 | 0 | |
| A/C | Marine ranching ecosystem | 0.42 | 0.58 | 0 | 0 | 0 |
| control ecosystem | 0.03 | 0.97 | 0 | 0 | 0 | |
| TPP/TR | Marine ranching ecosystem | 0 | 0 | 0 | 0.82 | 0.18 |
| control ecosystem | 0.45 | 0.55 | 0 | 0 | 0 | |
| TPP/TB | Marine ranching ecosystem | 0 | 0 | 0 | 0.99 | 0.01 |
| control ecosystem | 0.44 | 0.56 | 0 | 0 | 0 | |
| TB/TST | Marine ranching ecosystem | 0 | 0 | 0.13 | 0.88 | 0 |
| Control ecosystem | 0.6 | 0.4 | 0 | 0 | 0 | |
| TE | Marine ranching ecosystem | 0.25 | 0.75 | 0 | 0 | 0 |
| control ecosystem | 0.09 | 0.91 | 0 | 0 | 0 | |
| Total ecosystem status | Marine ranching ecosystem | 0.08 | 0.26 | 0.23 | 0.35 | 0.09 |
| Control ecosystem | 0.14 | 0.54 | 0.11 | 0.17 | 0.03 | |
Note:The values in the table indicate the degree of membership for each indicator and the ecosystem within each evaluation grade. The highest value represents the status level of the indicators or ecosystem.
Table 8.
Carrying capacity of the marine ranching and control ecosystems.
| Functional groups | Carrying capacity (t/km²) | |
|---|---|---|
| Marine ranching | Control ecosystem | |
| Pelagic fishes | 2.12 | 0.48 |
| Large and medium demersal fishes | 0.23 | 0.24 |
| Sparids | 0.38 | 0.027 |
| Leiognathidae | 0.9 | 0.26 |
| Small demersal fishes | 0.62 | 0.16 |
| Scorpaenidae | 0.62 | 0.11 |
| Gobiidae | 0.87 | 0.098 |
| Mantis shrimps | 0.34 | 0.12 |
| Large crabs | 0.29 | 0.10 |
| Pelagic fishes | 0.85 | 0.40 |
| Other crabs | 0.86 | 0.135 |
| Metapenaeopsis barbata | 1.6 | 0.40 |
| Other shrimps | 3.1 | 0.95 |
| Cephalopods | 0.34 | 0.12 |
| Gastropods | 1.82 | 0.36 |
| Oysters | 96 | / |
| Mussels | 163 | / |
Table 9.
The enhancing potential of each functional group in marine ranching.
| Category | Functional groups | Enhancing potential (t/km²) |
|---|---|---|
| TL 3.0-3.5 | Large and medium demersal fishes | 0.05 |
| Sparids | 0.05 | |
| Small demersal fishes | 0.44 | |
| Scorpaenidae | 0.60 | |
| Gobiidae | 0.80 | |
| Cephalopods | 0.27 | |
| Mantis shrimps | 0.17 | |
| Other crabs | 0.56 | |
| TL 2.5-3.0 | Leiognathidae | 0.52 |
| Pelagic fishes | 2.01 | |
| Large crabs | 0.55 | |
| TL 2.0-2.5 | Other shrimps | 1.60 |
| Metapenaeopsis barbata | 1.08 | |
| Gastropods | 0.94 | |
| Oysters | 74.24 | |
| Mussels | 82.60 | |
| Sea urchins | 15.40 |
Table 10.
ENA indicators in marine ranching under different simulation scenarios.
| Simulation scenarios | ENA indicators | |||||||||||
|---|---|---|---|---|---|---|---|---|---|---|---|---|
| Ecosystem function | Food web structure | Ecosystem maturity | ||||||||||
| D/H | TE | A/C | CI | SOI | FCI | FML | TPP/TR | TPP/TB | TB/TST | |||
| Only MOB | 0.74 | 5.25 | 0.27 | 0.28 | 0.16 | 20.12 | 3.97 | 1.18 | 10.89 | 0.02 | ||
| MOB+fishing | 0.74 | 6.07 | 0.26 | 0.28 | 0.16 | 19.99 | 3.98 | 1.17 | 10.8 | 0.02 | ||
| Only Crab | 0.73 | 5.14 | 0.22 | 0.28 | 0.15 | 12.45 | 3.3 | 1.82 | 17.24 | 0.02 | ||
| Crab+fishing | / | / | / | / | / | / | / | / | / | / | ||
| Only Fish | 0.73 | 5.45 | 0.22 | 0.28 | 0.13 | 12.44 | 3.29 | 1.81 | 17.22 | 0.02 | ||
| Fish+fishing | / | / | / | / | / | / | / | / | / | / | ||
| MOB+crab | 0.73 | 5.22 | 0.27 | 0.28 | 0.16 | 20.13 | 3.97 | 1.19 | 10.9 | 0.02 | ||
| MOB+crab+fishing | 0.73 | 5.68 | 0.27 | 0.28 | 0.16 | 20.14 | 3.97 | 1.19 | 10.9 | 0.02 | ||
| MOB+fish | 0.73 | 5.48 | 0.27 | 0.28 | 0.14 | 20.11 | 3.97 | 1.18 | 10.87 | 0.02 | ||
| MOB+fish+fishing | / | / | / | / | / | / | / | / | / | / | ||
| Crab+fish | 0.74 | 5.46 | 0.22 | 0.28 | 0.12 | 12.39 | 3.29 | 1.81 | 17.21 | 0.02 | ||
| Crab+fish+fishing | / | / | / | / | / | / | / | / | / | / | ||
| MOB+Crab+fish | 0.74 | 5.44 | 0.27 | 0.28 | 0.14 | 20.12 | 3.97 | 1.19 | 10.88 | 0.02 | ||
| MOB+Crab+fish +fishing | 0.74 | 5.89 | 0.27 | 0.28 | 0.14 | 20.13 | 3.97 | 1.19 | 10.88 | 0.02 | ||
| Only fishing | / | / | / | / | / | / | / | / | / | / | ||
Note: crab and fish represent functional group of large crabs and scorpaenidae, respectively. MOB: mussels, oysters, and barnacles.
Table 11.
Evaluation results of the fuzzy synthetic evaluation for the status of marine ranching under different simulation scenarios.
Table 11.
Evaluation results of the fuzzy synthetic evaluation for the status of marine ranching under different simulation scenarios.
| Simulation scenarios | Poor | Relatively poor | Medium | Relatively good | Good |
|---|---|---|---|---|---|
| Only MOB | 0.05 | 0.29 | 0.22 | 0.08 | 0.36 |
| Only Crab | 0.10 | 0.26 | 0.20 | 0.29 | 0.15 |
| Only Fish | 0.10 | 0.29 | 0.17 | 0.34 | 0.10 |
| MOB+crab | 0.05 | 0.28 | 0.16 | 0.08 | 0.36 |
| MOB+crab+fishing | 0.03 | 0.29 | 0.23 | 0.08 | 0.36 |
| MOB+fish | 0.04 | 0.34 | 0.17 | 0.08 | 0.36 |
| Crab+fish | 0.10 | 0.28 | 0.17 | 0.34 | 0.10 |
| MOB+Crab+fish | 0.04 | 0.34 | 0.17 | 0.08 | 0.36 |
| MOB+Crab+fish +fishing | 0.03 | 0.35 | 0.17 | 0.08 | 0.36 |
Note:The values in the table indicate the degree of membership for the ecosystem within each evaluation grade. The highest value represents the status level of the ecosystem. MOB: mussels, oysters, and barnacles.
Disclaimer/Publisher’s Note: The statements, opinions and data contained in all publications are solely those of the individual author(s) and contributor(s) and not of MDPI and/or the editor(s). MDPI and/or the editor(s) disclaim responsibility for any injury to people or property resulting from any ideas, methods, instructions or products referred to in the content. |
© 2024 by the authors. Licensee MDPI, Basel, Switzerland. This article is an open access article distributed under the terms and conditions of the Creative Commons Attribution (CC BY) license (http://creativecommons.org/licenses/by/4.0/).
Copyright: This open access article is published under a Creative Commons CC BY 4.0 license, which permit the free download, distribution, and reuse, provided that the author and preprint are cited in any reuse.


