
Submitted:
28 November 2024
Posted:
29 November 2024
You are already at the latest version
Abstract
Adapting to climate change and controlling carbon emissions have emerged as significant challenges confronted by the international community. The high-quality pedestrian space system of TOD neighborhoods, as an essential means for carbon reduction and sink enhancement in cities, has exhibited a demonstration effect of green intensification, low-carbon sustainability in urban spatial development. The intersectional research of low-carbon block creation and urban microclimate was conducted, along with microclimate simulation (CFD) calculation of the pedestrian space morphology of typical TOD neighborhoods in Qingdao. The correlation between the simulation experiment results and the measured data was compared and comprehensively evaluated to quantitatively analyze the coupling relationship between the block morphology and the comprehensive microclimate environment of wind, heat, and carbon. Summarize and extract the adaptive planning strategies of TOD block space for low-carbon purposes, aiming to realize the low-carbon transformation of cities through the creation of a healthy microclimate environment.
Keywords:
1. Introduction
2. Methodology
2.1. Study Area
2.2. Climatic Data for Analysis
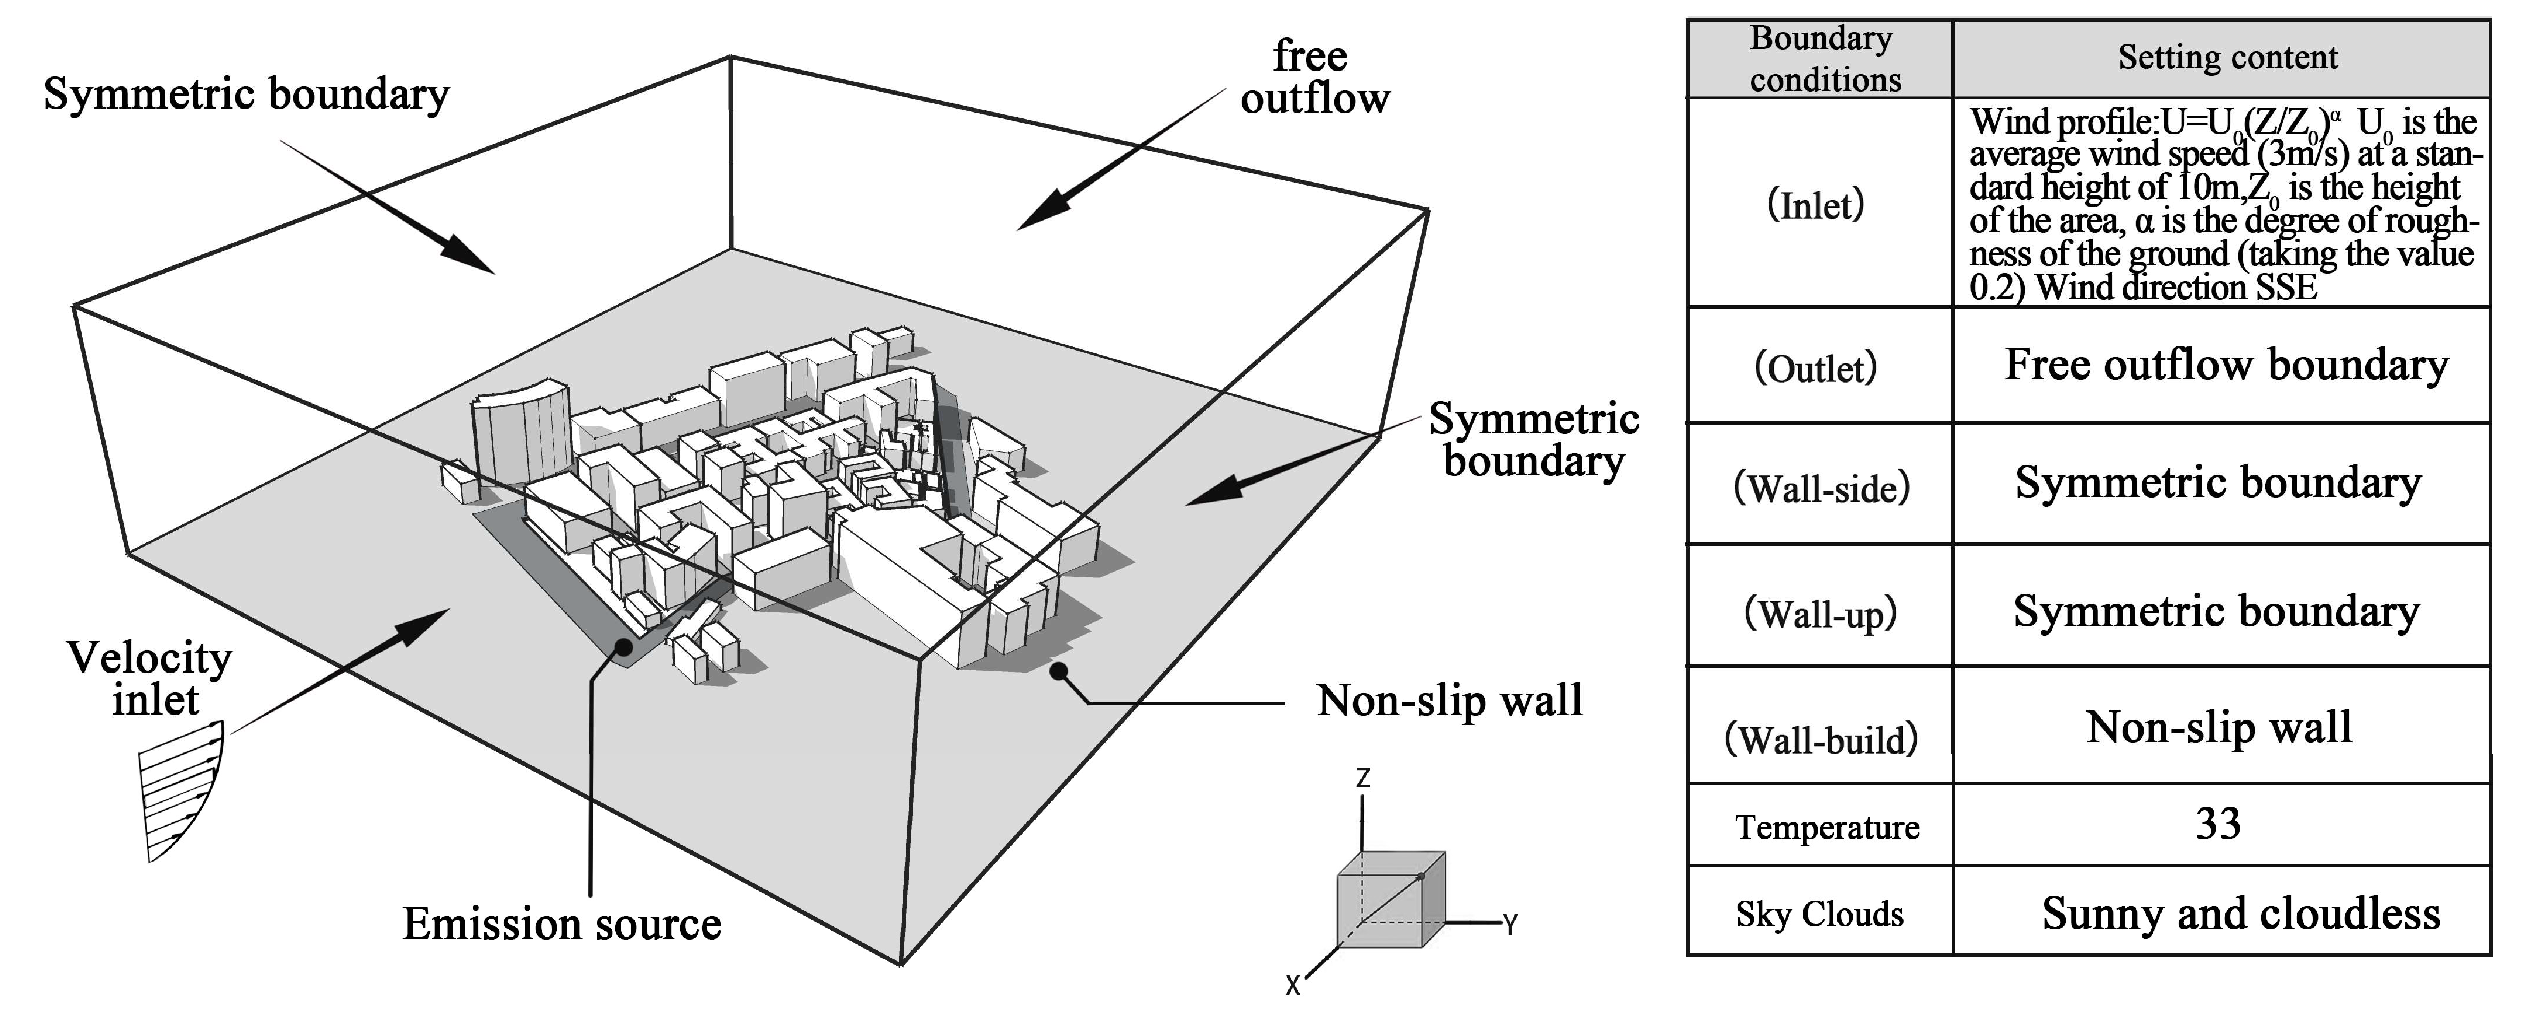
2.3. Urban Microclimate Simulation Analysis
3. Results
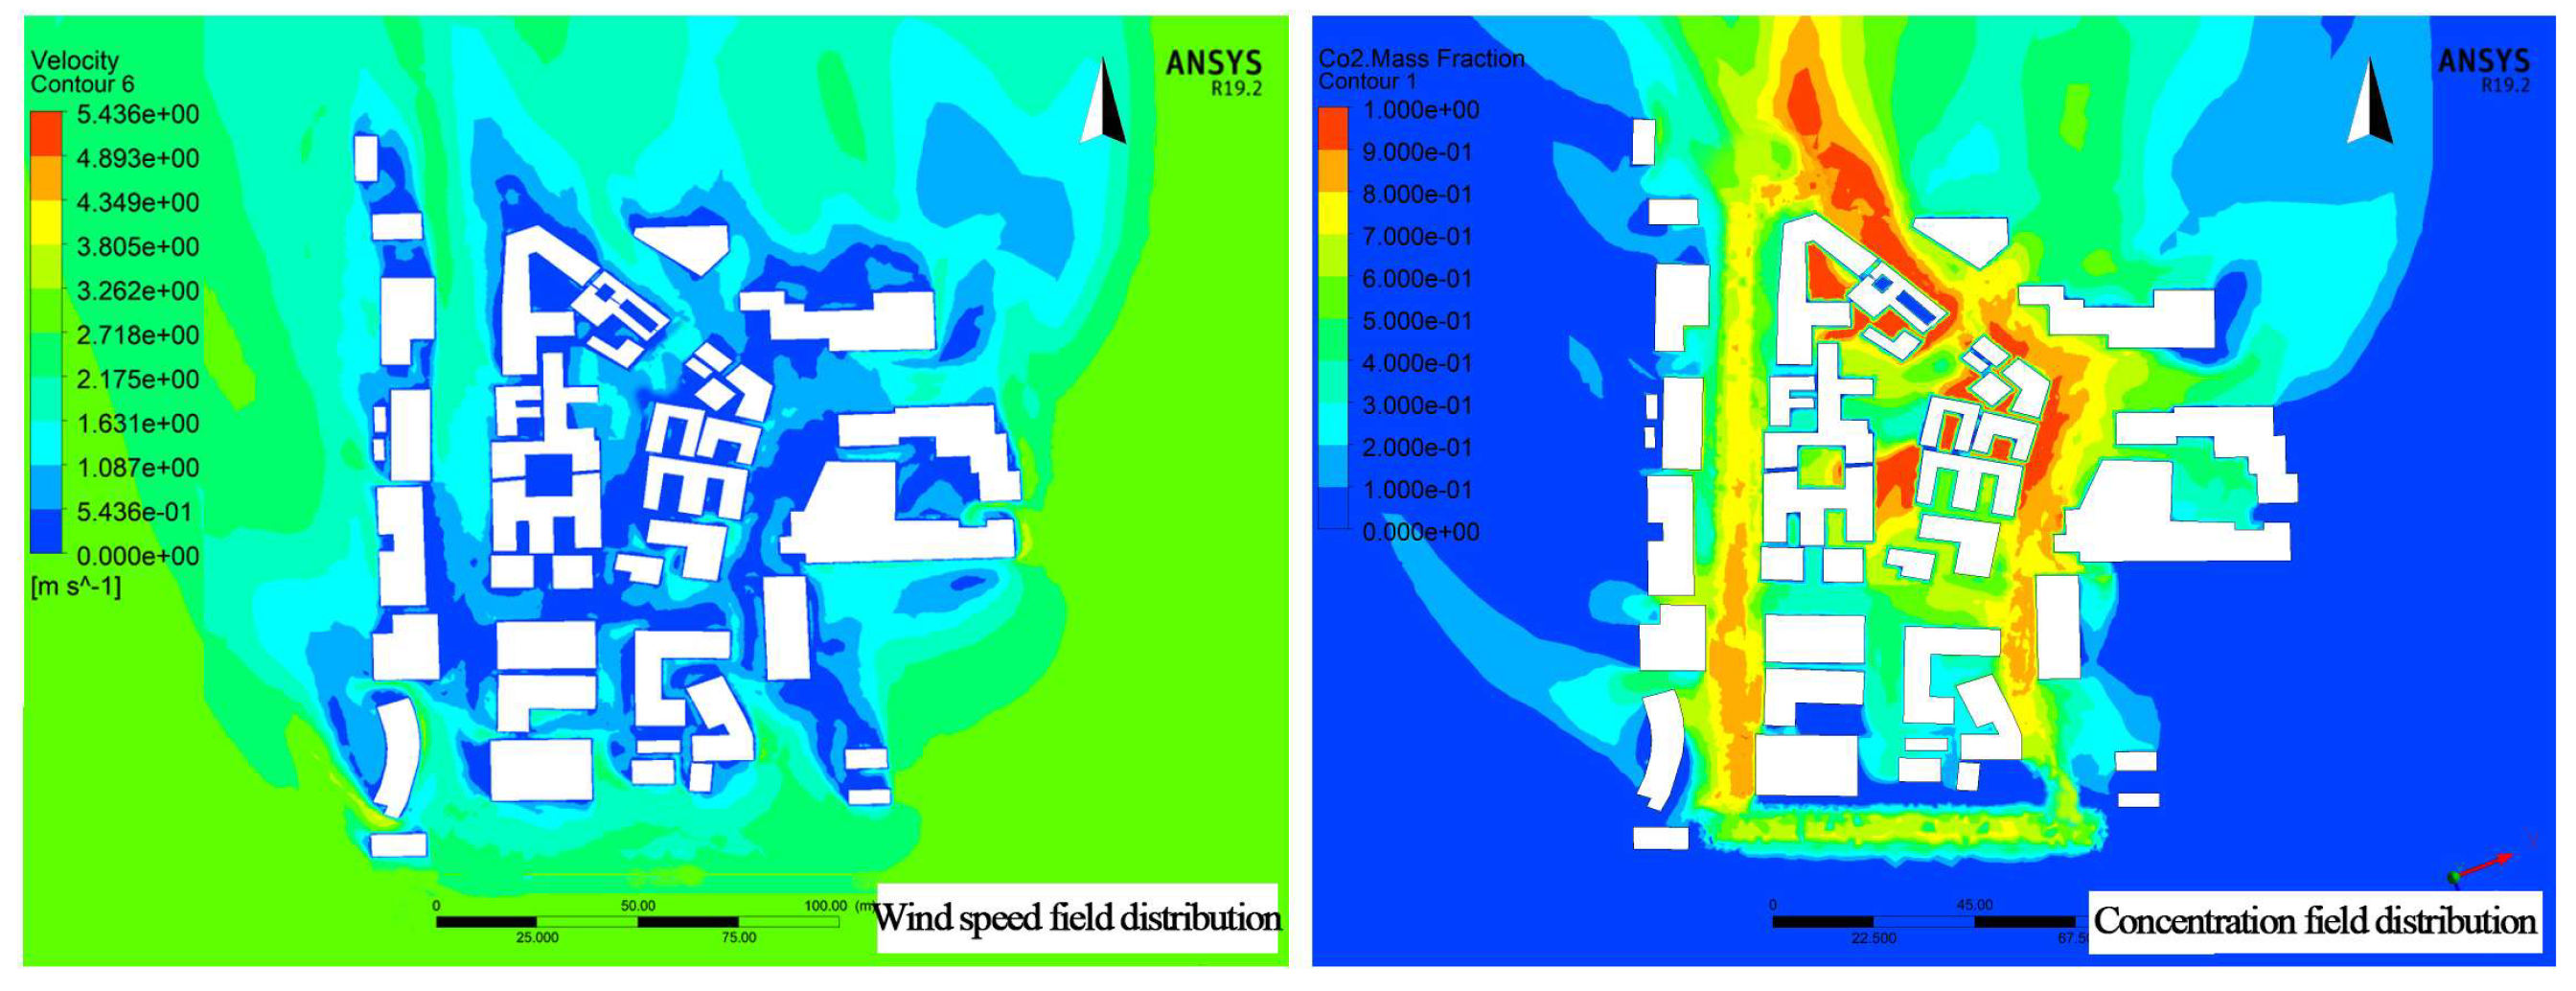
3.1. Wind-Heat Environment Simulation
3.1.1. Experimental Feasibility Verification
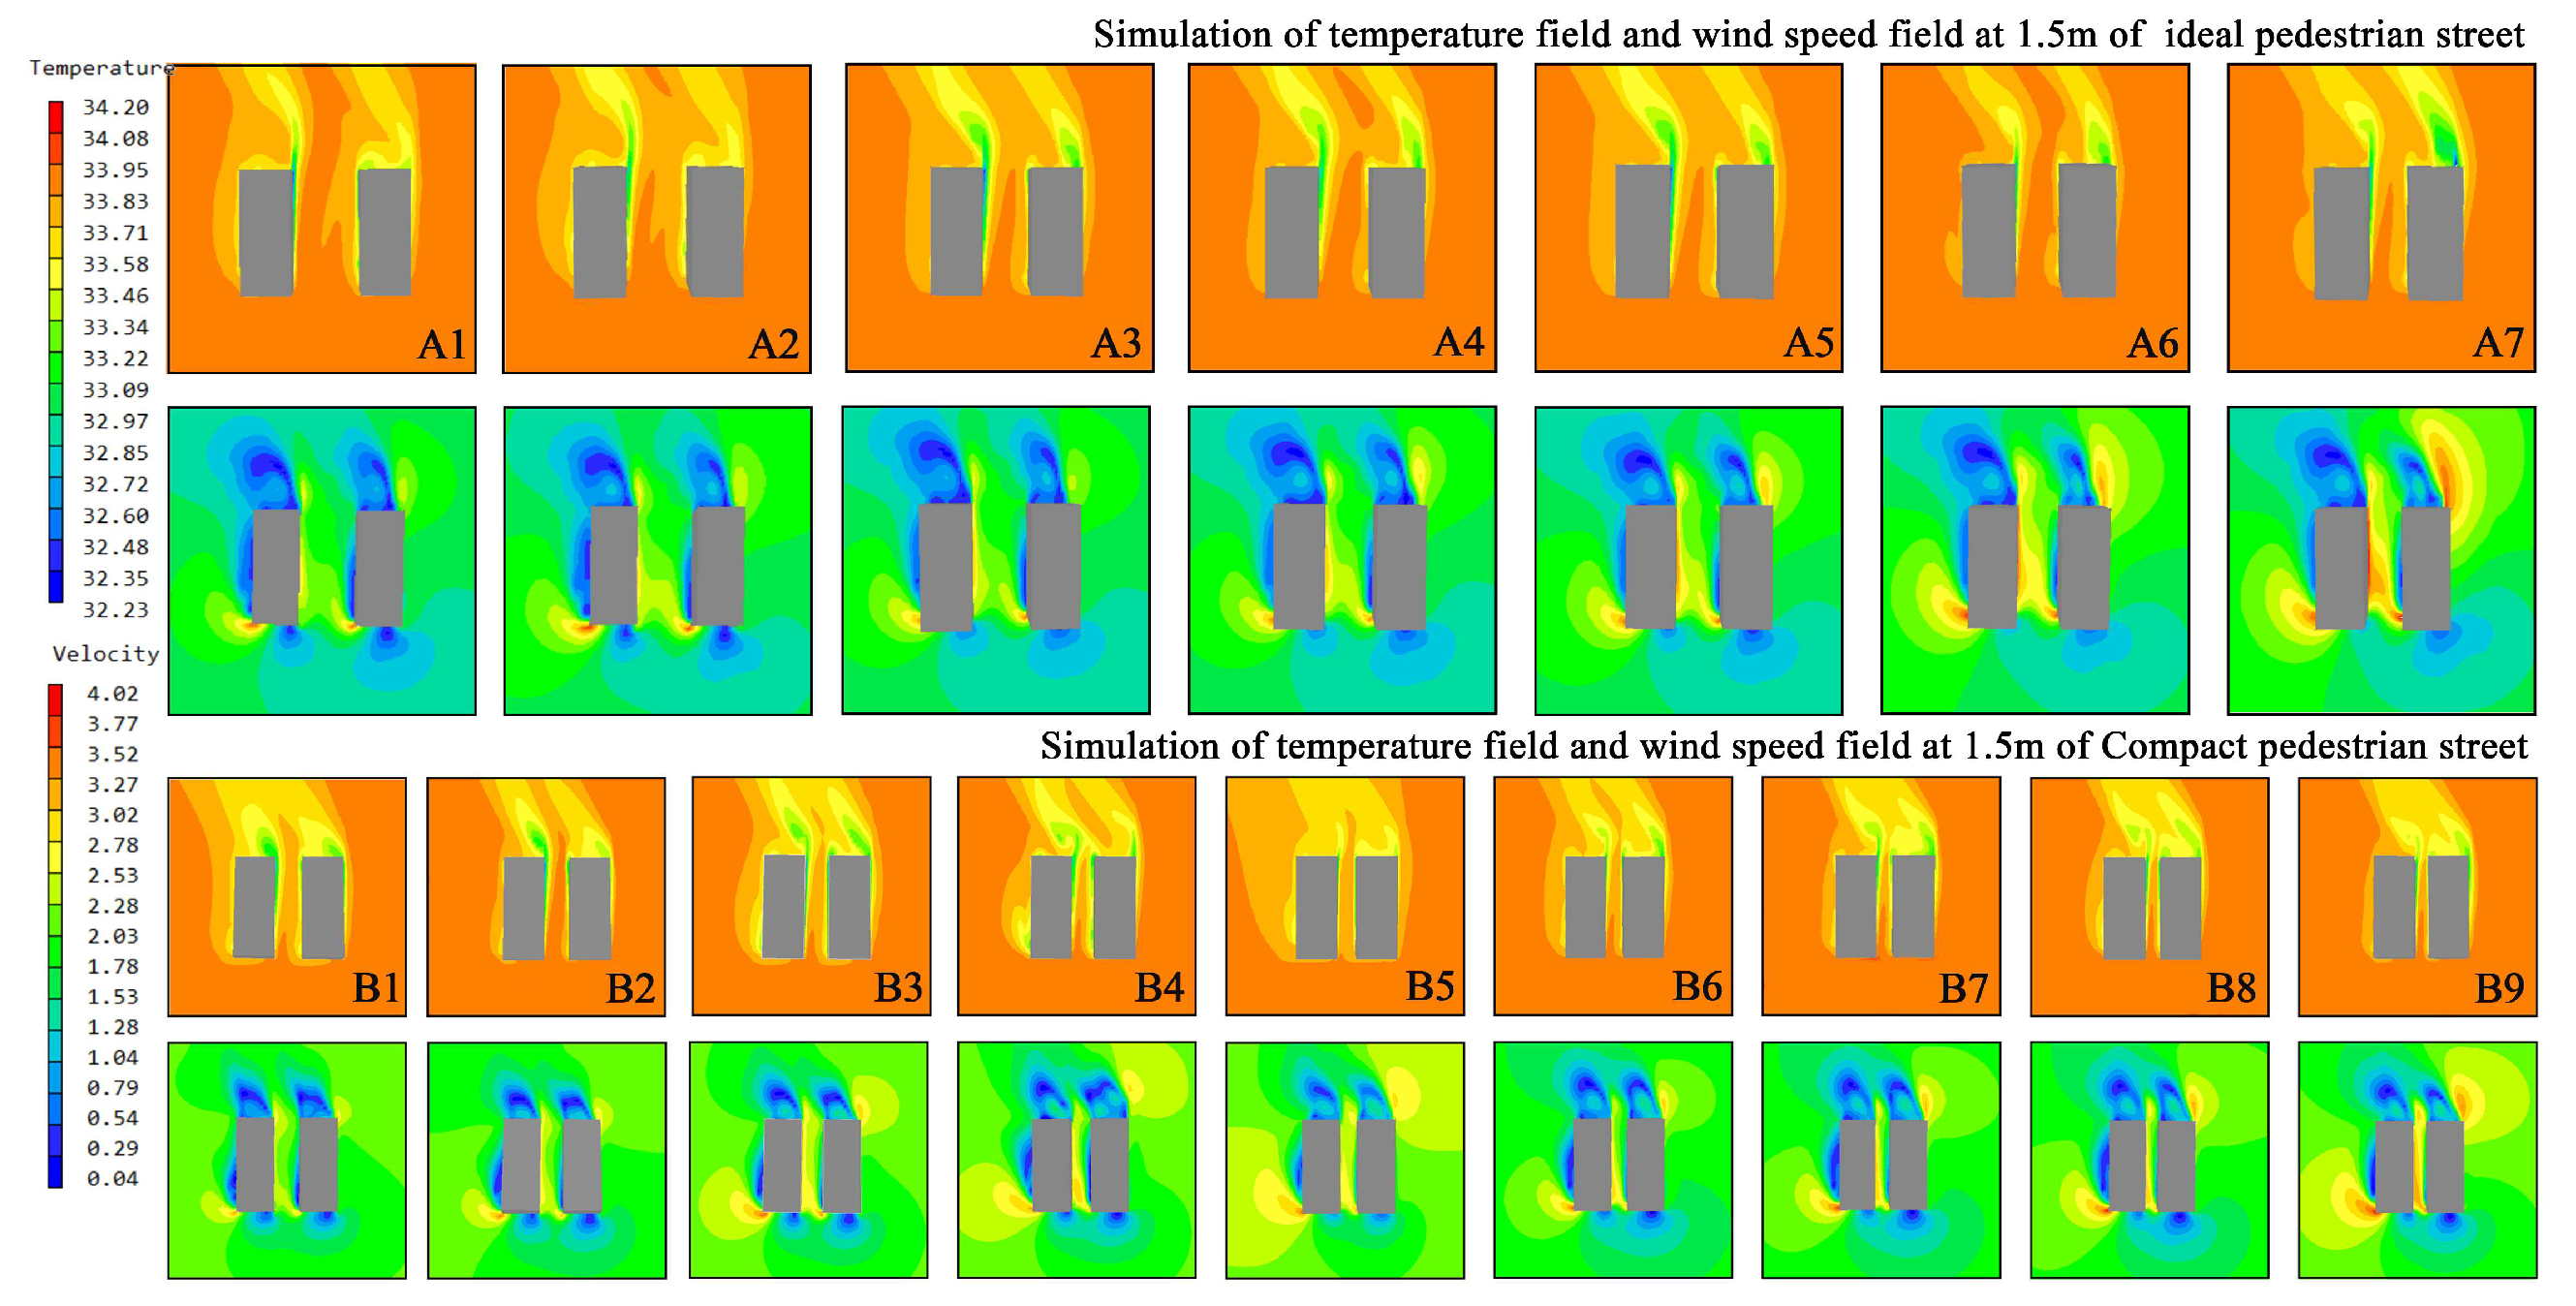
3.1.2. Simulation Methods
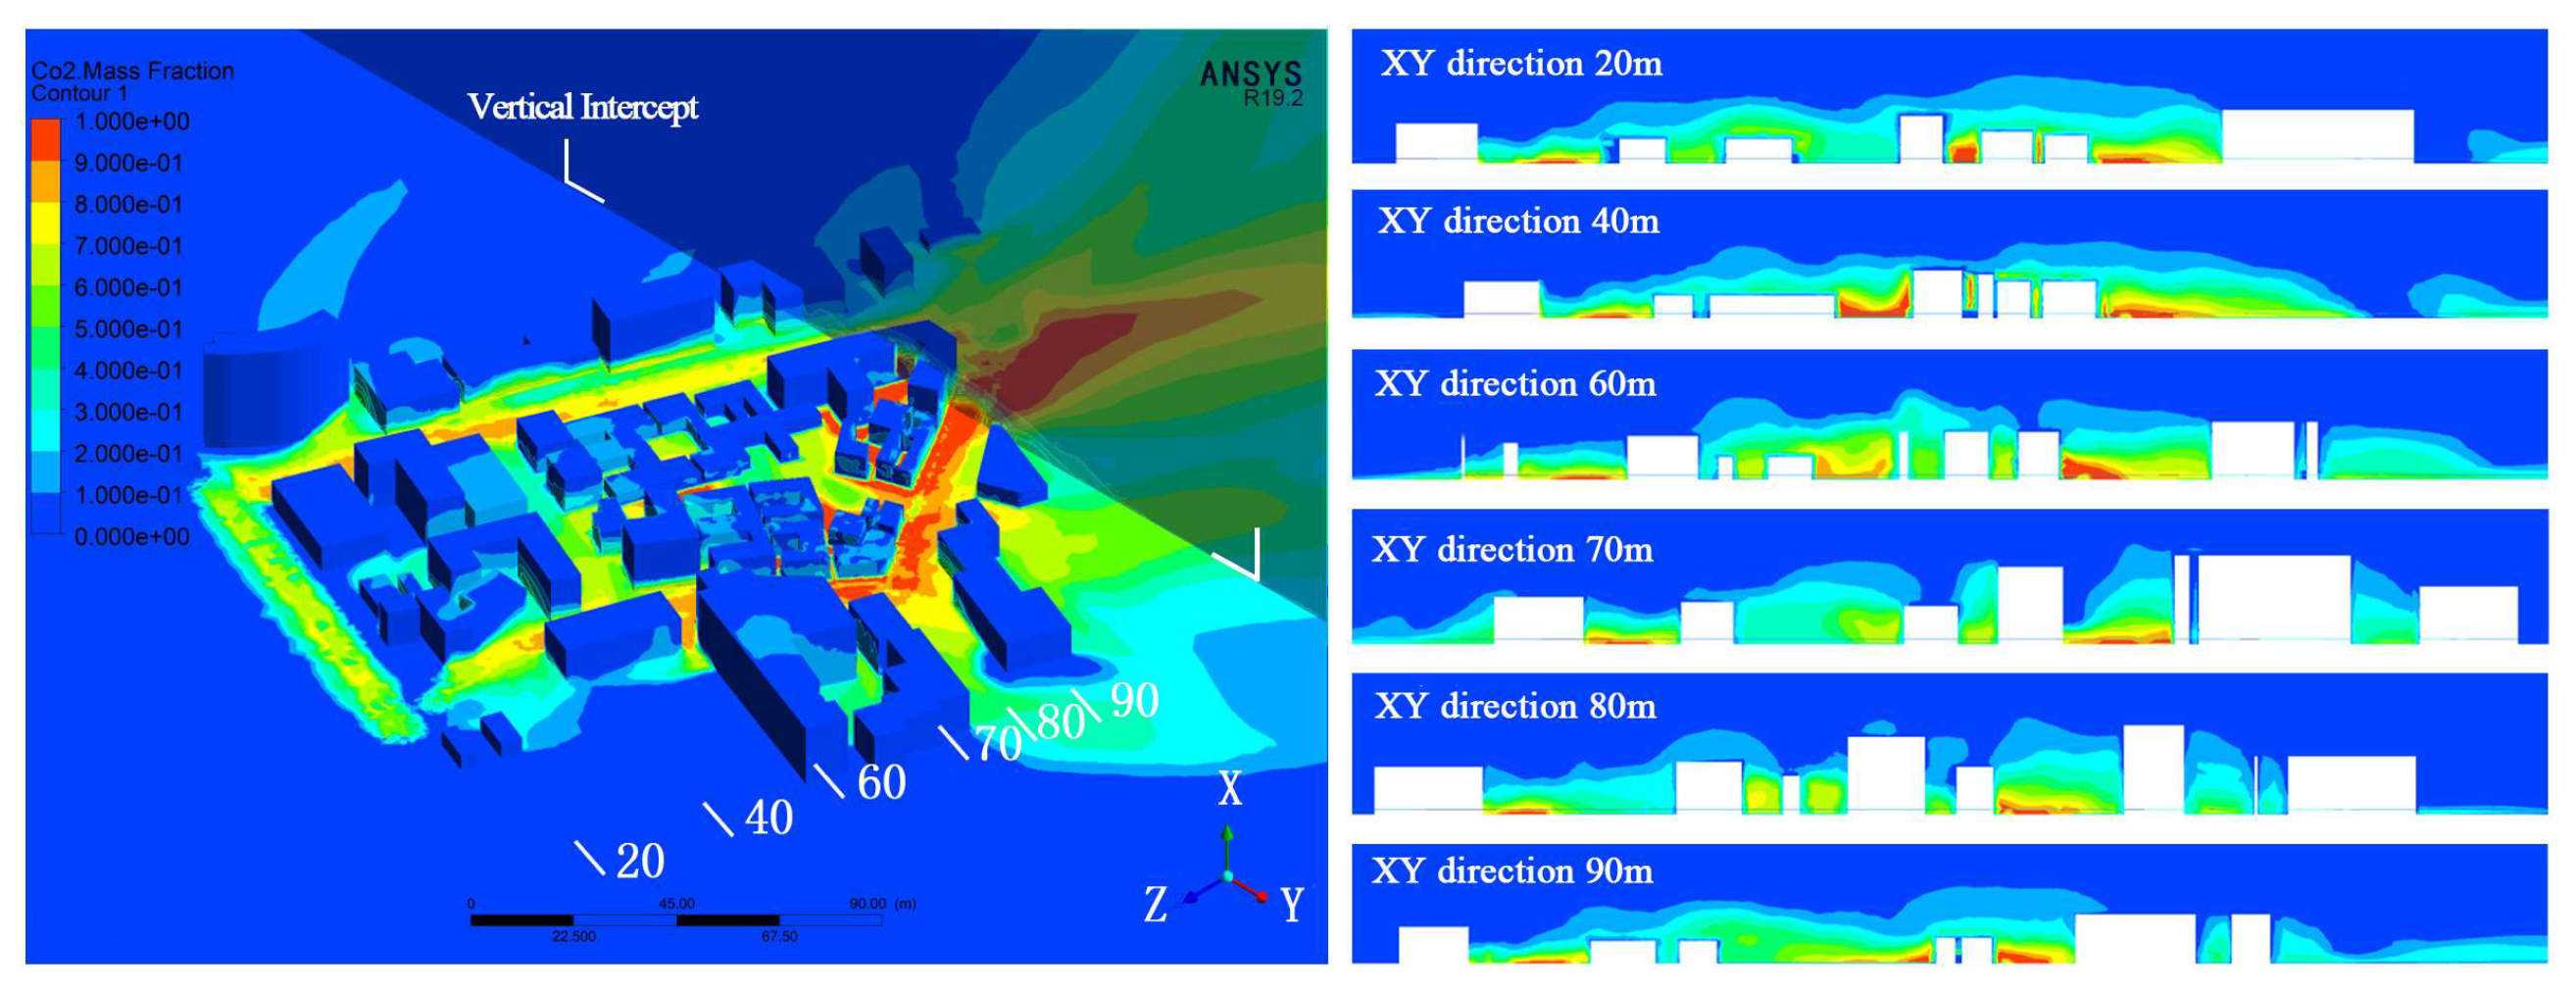
3.2. CO2 Concentration Diffusion Simulation
3.2.1. Correlation Analysis
3.2.2. Simulation Methods
4. Discussion
5. Conclusions
Author Contributions
Funding
Conflicts of Interest
References
- BAI Chun. Climate model language for urban design[J]. Huazhong Architecture, 2009, 27(5):130-132.
- CHEN Sha, YIN Guangtao,YE Min. Intension Analysis and Implementation Framework for TOD[J]. Urban Transport of China, 2008, 6 (06): 57-63.
- PAN Haixiao. Urban Spatial Structure towards Low Carbon:New Urban Transpot and Land Use Model[J]. Urban Development Studies, 2010, 17 (01): 40-45.
- DENG Hao, SONG Feng, CAI Haiying. Urban Tissue and Walkability-Morphological Analysis on the Essential Characteristics of Urban Walkable Space[J], 2008 (2): 118-132, 224-245.
- ANDERSON W P, KANAROGLOU P S, MILLER E J. Urban Form, Energy and the Environment: A Review of Issues, Evidence and Policy[J].Urban Studies, 1996, 33 (1): 7-35. [CrossRef]
- DING Wowo, HU Youpei, DOU Pingping. A Study of The Correlation between Urban form and Urban Microclimate[J], Architectural Journal, 2012 (07): 16-21.
- FAN Chenjing, TIAN Li, LI Jingwei. Research Progress of Impacts of Urban Form on Air Quality[J]. Urban Development Studies, 2017, 24 (12): 40-45.
- Ye, Y.; Wang, C.; Zhang, Y.; Wu, K.; Wu, Q.; Su, Y. Low-Carbon Transportation Oriented Urban Spatial Structure: Theory, Model and Case Study. Sustainability 2018, 10, 19. [CrossRef]
- CHEN Hong, YANG Dongshuai. A Study on the Impact of Block Spatial Form on the Diffusion of Traffic Pollution in Neighboring Blocks of Street Canyon[J]. New Architecture, 2019, (05): 8-12.
- Ming T, Lian S, Wu Y, Shi T, Peng C, Fang Y, de Richter R, Wong NH. Numerical Investigation on the Urban Heat Island Effect by Using a Porous Media Model[J]. Energies, 2021, 14 (15): 4681. [CrossRef]
- LI Lei, HU Fei, LIU Jing. Application of CFD Technique on Micro-Scale Issues in Urban Climatic Environment Researches in China[J]. Advances in Meteorological Science and Technology, 2015, 5 (06): 23-30.
- ZENG Huiping. Research on the Theory of “source-flow-sink ” ventilated corridor system construction and planning strategy ——The case of the center districts of Tianjin[D]. Tianjin University, 2016.
- GUO Linlin, LI Baofeng, CHEN Hong. A Review of Urban Micro-climate Research on Block Scale in China[J]. Urban Development Studies, 2017, 24 (01): 75-81.
- HE Shuoshuo. Study on planning of urban rail transit station vicinity based on TOD mode[J]. Modern Urban Transit, 2021, (01): 14-17.
- WANG Fang, GAO Xiaolu, XUZening. Identification and classification of urban commercial districts at block scale[J]. Geographical Research, 2015, 34 (06): 1125-1134. [CrossRef]
- YANG Junfeng, WU Hao, ZHENG Yi. Research on Characteristics and Interactive Mechanism of Street Walkability Through Multi-source Big Data: Nanjing Central District as a Case Study[J]. Urban Planning International, 2019, 34 (05): 33-42. [CrossRef]
- KANG Yuhao, WANG Yueyao, XIA Zhujun, et al. Identification and Classification of Wuhan Urban Districts Based on POI[J]. Journal of Geomatics, 2018, 43 (01): 81-85. [CrossRef]
- SHU Bo, CHEN Yang, CUI Jin, et al. Preliminary Study on the City's Functional Structure of Subway Station's Surrounding Area Under the TOD Model: Empirical Analysis Based on POI Data Along Chengdu Metro[J]. Huazhong Architecture, 2019, 37 (05): 79-83.
- YANG Dongshuai. Study on the Effect of Spatial Morpholopy on theDiffusion of Traffic Pollution in Adjacent Canyon[D]. Huazhong University of Science and Technology, 2018.
- MA Shen. Study On The Development Strategy OfTheResidential Quarter' planning In Changchun Based On The CFD Simulation Of Wind Environment[D]. Jilin Jianzhu University,2017.
- Toparlar, Yasin, B. Blocken, Bino Maiheu and GertJan van Heijst. A review on the CFD analysis of urban microclimate[J]. Renewable & Sustainable Energy Reviews, 2017, 80: 1613-1640. [CrossRef]
- LIU Taowei, CHENG Shidan, LI Xin. Research on Wind Environment of Nanfeng Ancient City Based on Phoenics Simulation[J]. Modern Urban Research, 2022 (07): 14-21.
- WANG Jiao, ZANG Xinyu, LI Yao. Study on the Optimal Strategy and Coupling Simulation between Ecological Resilience and Heat Wave Disturbance of Urban Existing Block[J]. Architectural Journal, 2023 (S1): 128-133.
- MA Junlai. Detailed Complete Streets Classification for Planning Integration[J]. Urban Transport of China, 2021, 19 (04): 100-111.
- WANG Zhen, LI Baofeng, HUANG Yuan. From Street Canyon to Urban Canyons: the Correlation Analysis between Urban Morphology and Microclimate[J]. South Architecture, 2016, (03): 5-10.
- HAN Zhanzhong, WANG Jing LAN Xiaoping. FLUENT: Fluid Engineering Simulation Calculation Examples and Applications[M]. Bejing Institure of Technlolgy Press, 2004.
- RONG Yingfei, ZHANG Jipeng,HUO Wei, et al. Sudy on Automobile Tail Gas Emission Strength and Emission on Quantity in Qingdao[J]. Environmental Protection Science, 2010,36 (02): 1-1+33.
- ZHANG Zhenyu, LI Jianzhi, WU Hongyuan, et al. The Experience and Inspiration of Pedestrian Space Planning in TOD Areas Around Rail Stations, Korea[J]. Planners, 2022, 38 (11): 138-146.
- CHEN Tian, GENG Huizhi, LU Huapu, et al. RONG Yingfei, Green and Low-Carbon Urban Regeneration[J]. City Planning Review, 2023, 47 (11): 32-39.
- Brown, R.D. Ameliorating the effects of climate change: Modifying microclimates through design. Landsc. Urban Plan. 2011, 100, 372–374. [CrossRef]
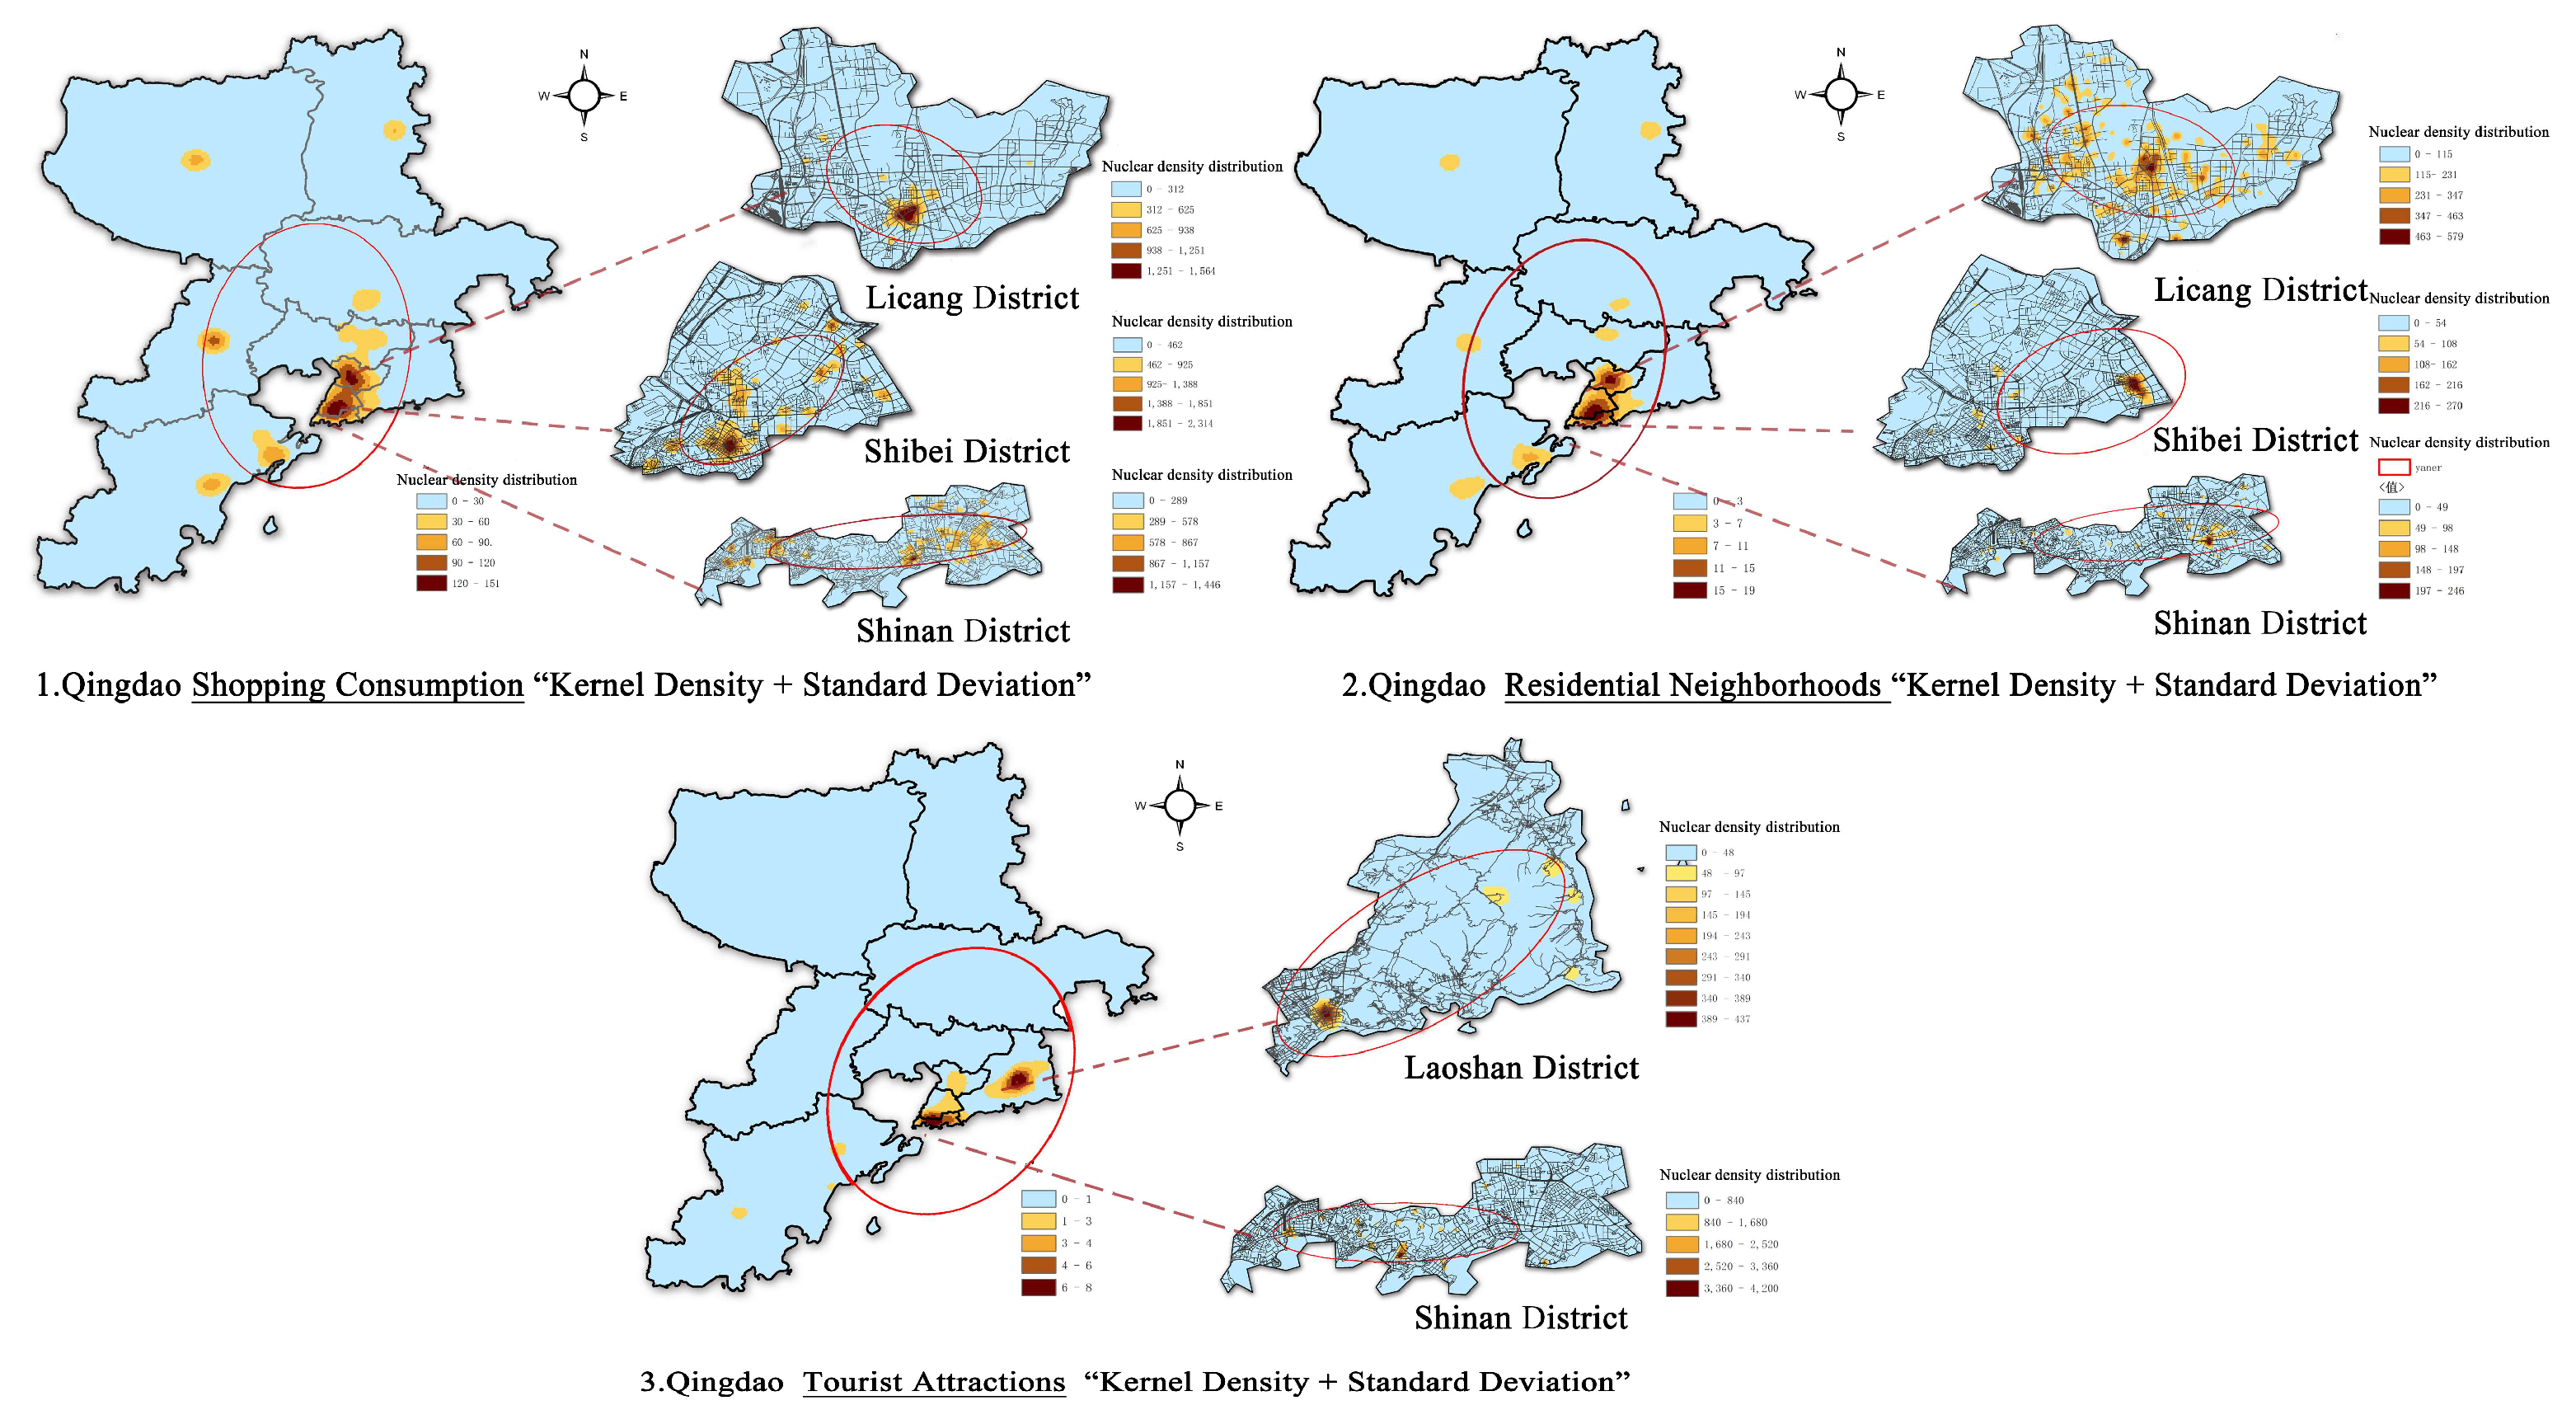
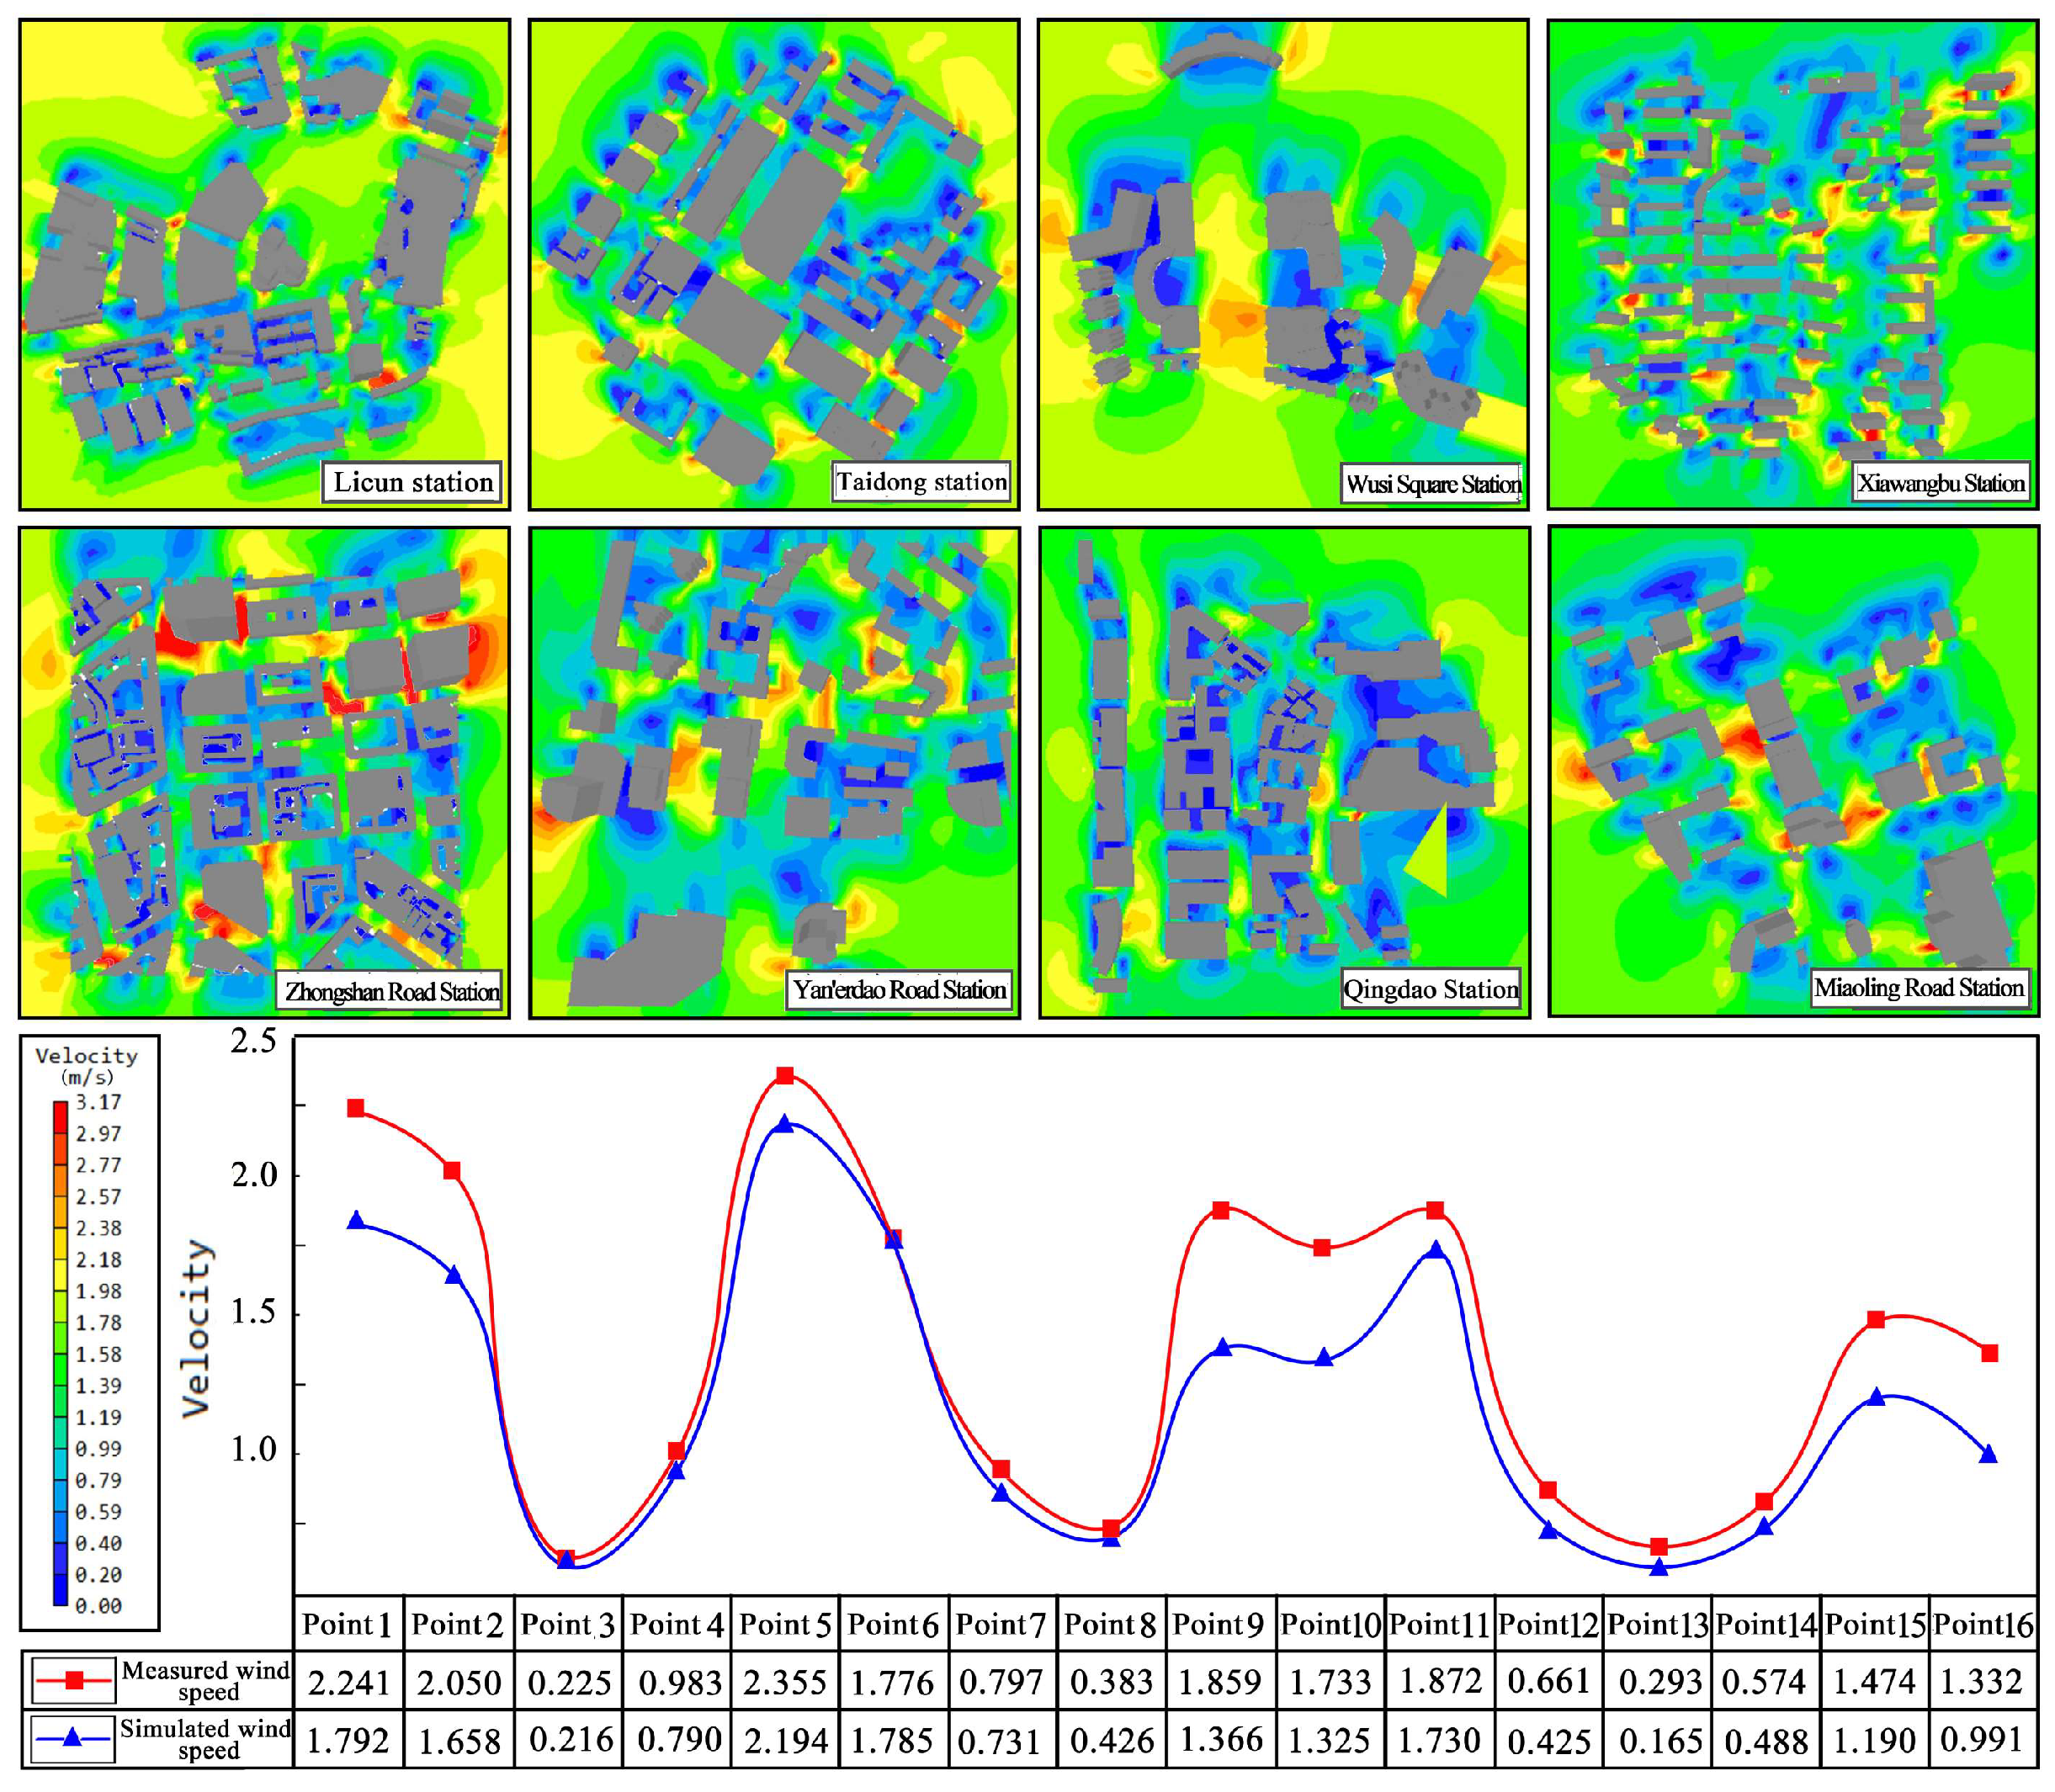

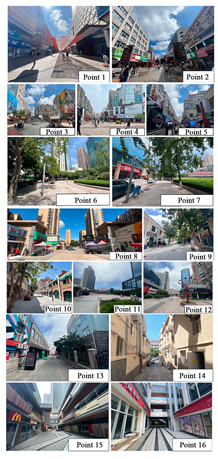
| Type of station | Name of station | Measurement point distribution | Schematic of the scene |
|---|---|---|---|
| Shopping and consumption | Licun Station | 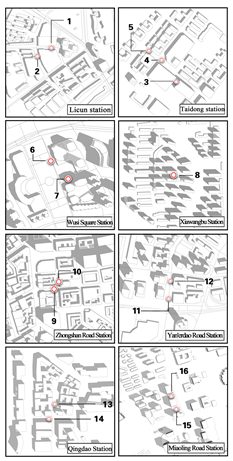 |
 |
| Taidong Station | |||
| Wusi Square Station | |||
| Residential neighborhoods | Xiawangbu Station | ||
| Zhongshan Road Station | |||
| Yan'erdao Road Station | |||
| Tourist landscape | Qingdao Station | ||
| Miaoling Road Station |
| Ideal type | A1 | A2 | A3 | A4 | A5 | A6 | A7 | |
|---|---|---|---|---|---|---|---|---|
| Height H (m) | 26.1 | 32.2 | 34.1 | 36.1 | 38.4 | 47.5 | 43.3 | |
| Width D (m) | 27.7 | 25.5 | 23.7 | 21.1 | 19.4 | 18.5 | 15.7 | |
| Height to width ratio H/D | 0.96 | 1.26 | 1.44 | 1.71 | 1.98 | 2.57 | 2.76 | |
| Temperature(°C) | Street entrance | 33.99 | 33.95 | 33.94 | 33.92 | 33.92 | 33.88 | 33.85 |
| Middle of street | 33.96 | 33.94 | 33.92 | 33.91 | 33.95 | 33.86 | 33.80 | |
| End of street | 33.91 | 33.91 | 33.90 | 33.89 | 33.93 | 33.84 | 33.78 | |
| Average | 33.95 | 33.93 | 33.92 | 33.91 | 33.89 | 33.86 | 33.81 | |
| Temperature growth rate (%) | - | -0.06 | -0.03 | -0.03 | -0.06 | -0.09 | -0.15 | |
| Wind Speed(m/s) | Street entrance | 2.136 | 2.168 | 2.205 | 2.374 | 2.549 | 2.683 | 2.944 |
| Middle of street | 1.975 | 2.079 | 1.937 | 2.138 | 2.236 | 2.347 | 2.725 | |
| End of street | 1.682 | 1.615 | 1.768 | 1.545 | 1.476 | 1.483 | 1.603 | |
| Average | 1.931 | 1.954 | 1.970 | 2.019 | 2.087 | 2.171 | 2.424 | |
| Wind speed growth rate (%) | - | 1.19 | 0.82 | 2.48 | 3.36 | 4.02 | 11.65 | |
| Compact type | B1 | B2 | B3 | B4 | B5 | B6 | B7 | B8 | B9 | |
|---|---|---|---|---|---|---|---|---|---|---|
| Height H (m) | 11.4 | 15.3 | 17.1 | 19.2 | 20.3 | 21.0 | 23.4 | 25.3 | 24.9 | |
| Width D (m) | 13.8 | 12.5 | 11.7 | 11.3 | 9.4 | 8.9 | 8.4 | 7.7 | 7.1 | |
| Height to width ratio H/D | 0.8. | 1.22 | 1.46 | 1.70 | 2.17 | 2.43 | 2.79 | 3.29 | 3.51 | |
| Temperature(°C) | Street entrance | 33.79 | 33.83 | 33.87 | 33.74 | 33.68 | 33.84 | 33.81 | 33.79 | 33.74 |
| Middle of street | 33.73 | 33.72 | 33.66 | 33.67 | 33.58 | 33.77 | 33.72 | 33.71 | 33.68 | |
| End of street | 33.70 | 33.64 | 33.54 | 33.45 | 33.42 | 33.61 | 33.45 | 33.39 | 33.44 | |
| Average | 33.74 | 33.73 | 33.69 | 33.62 | 33.56 | 33.74 | 33.66 | 33.63 | 33.62 | |
| Temperature growth rate (%) | -0.03 | -0.12 | -0.21 | -0.18 | 0.54 | -0.24 | -0.09 | -0.03 | ||
| Wind Speed(m/s) | Street entrance | 2.086 | 2.285 | 2.473 | 2.539 | 2.103 | 2.273 | 2.425 | 2.599 | 2.614 |
| Middle of street | 1.973 | 2.163 | 2.386 | 2.481 | 1.982 | 2.096 | 2.184 | 2.426 | 2.377 | |
| End of street | 1.827 | 1.708 | 2.011 | 1.976 | 1.717 | 1.553 | 1.784 | 2.034 | 2.101 | |
| Average | 1.9362 | 2.052 | 2.290 | 2.332 | 1.934 | 1.974 | 2.131 | 2.353 | 2.364 | |
| Wind speed growth rate (%) | 4.58 | 11.59 | 1.83 | -17.07 | 2.07 | 7.95 | 10.42 | 0.47 | ||
| Correlation coefficient | Width | Height | Height to width ratio | Temperature | Wind Speed |
|---|---|---|---|---|---|
| Temperature | -0.98(0.000***) | -0.93(0.003***) | -0.98(0.000***) | ||
| Wind Speed | 0.95(0.001***) | 0.91(0.005***) | 0.97(0.000***) | -0.98(0.000***) | |
| concentration | -0.96(0.001***) | -0.94(0.001***) | -0.95(0.001***) | 0.83(0.020**) | -0.89(0.008***) |
| Type | Optimization measures | Graphical relationships |
|---|---|---|
| Aspect ratio range | Ideal: 1.3 to 2.0; Compact: 1.2 to 1.7 |
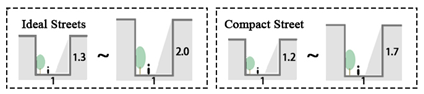 |
| Entrance Forms | Design of entrance forms at right angles or cut corners | 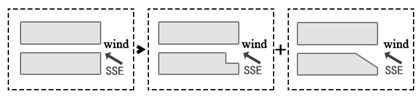 |
| spatial openness | Open enclosure for greater air permeability | 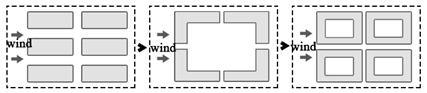 |
| multistory building complex | Installation of certain open spaces in the leeward direction of high-rise buildings | 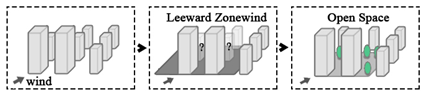 |
Disclaimer/Publisher’s Note: The statements, opinions and data contained in all publications are solely those of the individual author(s) and contributor(s) and not of MDPI and/or the editor(s). MDPI and/or the editor(s) disclaim responsibility for any injury to people or property resulting from any ideas, methods, instructions or products referred to in the content. |
© 2024 by the authors. Licensee MDPI, Basel, Switzerland. This article is an open access article distributed under the terms and conditions of the Creative Commons Attribution (CC BY) license (http://creativecommons.org/licenses/by/4.0/).


