Submitted:
29 November 2024
Posted:
29 November 2024
You are already at the latest version
Abstract
2-deoxyglucose (2-DG), targeting Hexokinase I (HKI) to inhibit glycolysis in cancer cells, has inspired drug design. Increasing evidence suggests that its phosphorylated form, 2-deoxyglucose-6-phosphate (2-DG-6-P), may inhibit HKI more effectively, highlighting the need to understand the molecular mechanisms behind this effect. Using molecular simulations, we examined interactions between HKI and its substrates—glucose (G) and glucose-6-phosphate (G-6-P)—and inhibitors—2-DG and 2-DG-6-P. G and G-6-P showed stable interactions with HKI, involving residues like ILE 662, SER 588, and PRO 590, while 2-DG had less stable interactions. However, 2-DG-6-P formed the most stable complex, engaging additional residues such as VAL 663 and THR 848, with enhanced binding through hydrophobic and hydrogen bond interactions facilitated by its phosphorylated group. This study reveals the differential effects of 2-DG and 2-DG-6-P on HKI inhibition, highlighting the unique mechanism of 2-DG post-phosphorylation and supporting the development of targeted HKI inhibitors that exploit cancer cell metabolism.
Keywords:
molecular simulation
; glycolysis
; hexokinase I
; 2-deoxyglucose
; 2-deoxyglucose-6-phosphate
1. Introduction
The preferential utilization of glycolysis by cancer cells, even in the presence of ample oxygen, known as aerobic glycolysis or the Warburg effect—a phenomenon first described by Nobel laureate Otto Warburg—remains a cornerstone of cancer metabolism [1,2]. Notably, poorly vascularized and inherently hypoxic regions within solid tumors further bias cancer cells towards glycolysis as a primary ATP production pathway [3,4,5]. This metabolic dependence offers a unique opportunity to selectively target and eradicate malignant cells without impacting non-transformed cells.
In glycolysis, a pivotal enzyme known as hexokinase (HK) plays a crucial role by catalyzing the initial and rate-limiting step of converting glucose into glucose phosphate. HKs are evolutionarily conserved enzymes that five human HK isoenzymes have been identified, namely hexokinase I-Ⅳ (HKI-Ⅳ) and the recently unveiled hexokinase domain-containing protein 1 (HKDC1) [6]. Each isoform exhibits unique patterns of tissue expression, subcellular localization, enzyme kinetics, and substrate specificity. Among these isoenzymes, HKI and HKII stand out as the most prevalent forms, sharing significant structural similarities. HKI is expressed ubiquitously, with a particular predominance in the brain and kidneys [7]. On the other hand, while HKII is also broadly expressed, its presence is typically more subdued across most tissues [8]. Notably, HKII is found primarily in insulin-sensitive tissues such as adipocytes and adult skeletal and cardiac muscles [9]. Despite resemblances between the HKI and HKII, they diverge significantly in their functions. It is proposed that HKI is more suited for catabolic processes, adapting in response to specific effectors [10]. In contrast, HKII is believed to primarily serve anabolic functions, highlighting the intricate regulatory mechanisms governing metabolic pathways [10]. Given its general effect and widespread body distribution, HKI emerges as the most pertinent focus, hence, this molecular simulation study is specifically centered on HKI.
In the context of cancer metabolism, 2-deoxyglucose (2-DG) emerges as a significant metabolic disruptor by inhibiting HKI, the enzyme that catalyzes the initial step in glycolysis. The relative non-toxicity and oral bioavailability of 2-DG make it an attractive candidate for anticancer therapy [11,12,13,14,15]. However, the clinical application of 2-DG is restricted by its rapid metabolism and short half-life, which significantly reduce its efficacy as a drug. These limitations have prompted researchers to enhance its bioavailability and therapeutic concentration and to explore novel 2-DG analogs, such as 2-halogen substituted d-glucose and fluoro-hexose compounds [16,17]. Another direction of research revisits the molecular mechanisms by which 2-DG exerts its glycolytic inhibition, aiming for a deeper understanding of its biochemical impact.
The inhibition of glycolysis by 2-DG occurs in a complex scenario involving multiple molecules (glucose, glucose-6-phosphate, 2-deoxyglucose, and 2-deoxyglucose-6-phosphate) [18,19]. Once internalized, 2-DG is phosphorylated to 2-deoxy-D-glucose-6-phosphate (2-DG-6-P), a charged compound that becomes trapped within cells. Increasing evidence suggests that 2-DG-6-P may play a more direct and pivotal role in inhibiting HKI than 2-DG itself [20,21]. This distinction highlights the importance of differentiating the pharmacodynamics of 2-DG and 2-DG-6-P when considering their potential as therapeutic agents. Despite preliminary biochemical and structural data, a significant knowledge gap persists in molecular understanding of how 2-DG and 2-DG-6-P modulate HKI activity. Bridging this gap is crucial as it may reveal novel mechanisms through which these molecules exert their effects, offering potential strategies to enhance their therapeutic utility. Therefore, this study employs molecular simulation (MS) techniques to elucidate the interactions between HKI and its substrates and inhibitors—glucose (G), glucose-6-phosphate (G-6-P), 2-DG, and 2-DG-6-P. By examining these interactions in detail, we aim not only to fill existing knowledge gaps but also to uncover novel drug targets, thereby enhancing the strategic development of targeted metabolic therapies for cancer. The outcomes of this research are expected to provide both theoretical foundations and empirical evidence for the design of more effective HKI inhibitors, propelling forward the field of cancer metabolic therapy.
2. Materials and Methods
2.1. Molecular Docking
In this study, we employed a method based on deep equivariant generative models, known as DynamicBind [22], to predict the structures of specific ligand-protein complexes. This approach is capable of recovering the bound-state conformation from the unbound protein structures, achieving high-precision ligand docking. Initially, an inference environment was set up according to the GitHub repository guidelines, followed by a step-by-step installation of the required Python libraries and dependencies. Subsequently, the working directory containing the model checkpoints was downloaded and extracted. For our simulations, we used the crystal structure of human HKI obtained from the Protein Data Bank (PDB) under the accession code PDB ID: 4F9O. This structure was selected due to its high resolution and completeness, making it suitable for molecular dynamics simulations. The parent species of this structure is Homo sapiens, aligning with the clinical relevance of our study. During the dynamic docking inference phase, the protein's PDB file and the ligand's CSV file (converted from SDF format listing the ligands' SMILES) were inputted. The inference process generated eight ligand-binding poses, which were then ranked based on their docking scores and included a relaxation process. The optimal docking result was selected as the initial input for the molecular dynamics simulation.
2.2. Molecular Simulations
Molecular dynamics simulations were performed using Amber 22 (San Francisco, CA, USA) [23], employing the ff19SB force field [24] for calculating system force field parameters. The system was solvated using the TIP3P water model, and counterions (Na+ and Cl-) were added to neutralize the system and maintain an ionic strength of 0.15 M, mimicking physiological conditions. Following energy minimization, the system was gradually heated from 0 K to 300 K over 500 ps.
Subsequent equilibration was conducted under the Canonical Ensemble (NVT) [22], maintaining a constant number of particles, volume, and temperature, which is crucial for the preparatory steps of energy minimization, heating, and system pre-equilibration. This was followed by a 100 ns production run under the Isothermal-Isobaric Ensemble (NPT) [23], maintaining a constant number of particles, pressure, and temperature, which reflects conditions experienced by biomolecules under real-life experimental conditions. The pressure was set at 1 bar, equivalent to standard atmospheric pressure.
The molecular dynamics simulation steps during the production phase were set at a time-step of 0.002 fs, accumulating to a total of 250 million steps. Covalent bonds involving hydrogen were constrained using the SHAKE algorithm to stabilize the simulation. The dynamic results and analysis were performed using AmberTools23 [23,25], providing insights into the behavior and interactions of the biomolecular system under study. This comprehensive simulation setup allows for an accurate representation of molecular interactions and dynamics, paving the way for detailed studies on protein-ligand interactions and potential drug discovery efforts. While a single MD simulation was employed in this study, such an approach has been widely validated in prior computational studies for obtaining reliable insights into molecular interactions [26,27,28]. Moreover, the use of a relatively long simulation time (50 ns) ensures sufficient trajectory data to capture key conformational dynamics and produces robust statistical analyses of the binding interactions.
2.3. Root Mean Square Deviation (RMSD) Analysis
Root Mean Square Deviation (RMSD) is utilized to determine the deviations of the predicted positions of atoms in molecular dynamics simulations. The RMSD calculation formula is as follows (1):
Here, is the distance between atom in the two structures, and is the total number of equivalent atoms.
Root Mean Square Fluctuation (RMSF) Analysis is used to evaluate the flexibility of the residues in the protein throughout the simulation. The RMSF calculation formula is as follows (2):
Here, denotes time, represents the position of atom at time , and refers to the average position of this atom. is the displacement of atom at time relative to its average position.
2.4. Free Energy Calculation
In Amber 22, the MMPBSA.py script is used to calculate the free energy of binding of ligands. The MM/PBSA method is widely accepted as an approach for investigating protein-ligand interactions due to its ability to provide reliable insights into binding affinities [29,30]. The calculation formula is as follows (3):
In (3), referring to (4), the free energy G is:
Here, refers to the gas-phase molecular mechanics energy difference, is the solvation-free energy difference, and -TΔS (where T is the temperature) is the entropy change.
The gas-phase energy change, , can be further subdivided into van der Waals energy (EvdW), electrostatic energy (EELE), and internal energy in the gas phase (EINT). The solvation-free energy change, , is calculated using the continuum solvation method, which comprises contributions from polar (GPB) and nonpolar (GNP) components. The conformational entropy (-TS) is estimated through quasi-harmonic analysis of the simulation trajectory. Its contribution to the results is relatively minor and can typically be neglected.
2.5. Binding Mode Analysis
The binding modes and their stability during the simulation period are analyzed to provide an in-depth understanding of the interactions.
2.6. Hydrogen Bond Analysis
Hydrogen atoms form covalent bonds with electronegative atom X and can mediate hydrogen bonding interactions with another atom Y that is also electronegative and small in radius. This leads to the formation of hydrogen bonds characterized as X-H…Y interactions. The criteria for calculating hydrogen bonds are as follows: (1) The distance between atom X and atom Y is less than 3.0 Å; (2) The angle between X-H in the hydrogen bond donor and atom Y in the hydrogen bond acceptor is less than 135 degrees.
2.7. LCPO Surface Area Calculation
The LCPO method mentioned in Weiser et al.'s study [31] is applied to calculate the surface area involved in the interaction.
2.8. Principal Component Analysis (PCA)
PCA is utilized for dimensionality reduction of data. The equation (5) is employed to calculate the covariance matrix Z of the skeletal movements in the simulated system:
Here, represents the Cartesian coordinates of the Cα atom at position i, <> denotes the time average of the selected configurations in the trajectory, and N is the total number of Cα atoms. Mode1 and mode2 correspond to the pseudo-trajectories of the first two principal components.
2.9. Free Energy Landscape (FEL) Analysis
The concept of a Free Energy Landscape (FEL) revolves around analyzing the system's most stable states (corresponding to the minima on the FEL) and transitions between different representative conformational states, comparing the motions and conformational differences of biomolecules. PCA, widely used to characterize functional slow-motion patterns in biological systems, is employed to plot the FEL, where fluctuations on the first (PC1) and second (PC2) principal components are defined as the reaction coordinates. Free energy is solved by the distribution probability of conformations and the Boltzmann relationship, as seen in equation (6):
Here, G is the free energy, k is the Boltzmann constant (eV/K), T is the absolute temperature (K), and P is the probability of conformational transitions (%). i.png: Contour distribution map of system i. The color bar on the right indicates relative density, with darker areas corresponding to higher densities. Combined Display.png: As above, a combined display map with all systems together. Stacked Display.png: A combined display with all systems stacked for clarity, with only the main parts of each system shown. Colors are as follows: purple for the first system, blue for the second, green for the third, orange for the fourth, and red for the fifth.
3. Results
3.1. Molecular Docking of G, G-6-P, 2-DG, and 2-DG-6-P with HKI
We employed the high-precision ligand docking technology DynamicBind to simulate the interactions of G, G-6-P, 2-DG, and 2-DG-6-P with HKI. Overlapping docking results revealed that all ligands shared a high degree of spatial overlap in the binding region of HKI with G, suggesting that they may affect HKI catalytic activity via competitive bindings (Figure 1A). The binding modes of these small molecules at the catalytic site of HKI were shown in greater detail: G-6-P, 2-DG, and 2-DG-6-P exhibited binding patterns similar to the natural substrate, glucose, but with subtle differences that suggest variations in binding affinity with HKI (Figure 1B).
The three-dimensional view showed that G engaged in interactions with several amino acid residues of HKI, including GLY 534, GLY 535, SER 603, ASP 657, GLU 742, and GLU 708. SER 603 and GLU 742 played a critical role in the phosphorylation reaction of G, potentially participating directly in substrate conversion. ASP 657, GLU 742, and GLU 708 are key in positioning ATP and transferring phosphate groups, reflecting the optimized binding state of glucose as the natural substrate. These residues were located within the binding region of the optimally docked ligands, further confirming the stable binding of G within the catalytic pocket of HKI. In addition to the residues interacting with G, G-6-P also interacted with VAL 678, TRP 709, and GLY 862 (Figure 1C). These additional interactions may provide extra stability, accommodating its phosphorylated state and potentially leading to minor structural adjustments at the active site. Compared to the natural substrate glucose, 2-DG exhibited fewer close interactions at the docking site, lacking interactions with GLY 710 and GLN 739, which may reduce its binding affinity. 2-DG-6-P demonstrated a unique binding mode, forming new contacts with TYR 749 and GLY 862, potentially indicating stronger binding stability as an inhibitor (Figure 1C). This may reflect the potential efficacy of 2-DG-6-P in inhibiting HKI activity. From a structural perspective, the interactions between different ligands and HKI revealed subtle changes in the enzyme’s adaptability to various substrates, which is crucial for understanding its catalytic mechanism and designing inhibitors. Particularly, the differential interactions of 2-DG and 2-DG-6-P at the active site of the kinase are noteworthy.
An exhaustive map of interactions at the active site of HKI with different ligands was provided in Figure 1D, illustrating potential polar interactions, hydrophobic effects, electrostatic interactions, and hydrogen bonding. G, as the natural substrate, engages in interactions filled with polarity, hydrophobic effects, and electrostatic interactions, particularly with key residues such as ASP 657 and GLU 742. These interactions are crucial for its phosphorylation, facilitating the production of G-6-P and paving the way for the glycolytic process. In contrast, G-6-P interacts with additional residues such as GLY 534 and GLU 708, which may particularly adapt to the binding of the phosphate group. The interaction diagram for 2-DG, lacking key hydroxyl groups compared to G, shows a reduction in hydrogen bonding with GLY 710, potentially leading to weaker binding at the active site, though still sufficient for phosphorylation. The interaction pattern of 2-DG-6-P is more complex, involving additional residues such as GLY 534 and GLU 708, and offering a hydrogen bonding site at ASN 683 (Figure 1D). Overall, the variations in these interaction patterns highlight the unique roles that different ligands may play in regulating HKI activity, providing important insights into the enzyme’s substrate specificity, catalytic mechanisms, and potential inhibitor design.
3.2. Conformation and Motion Analysis of the Complexes of G, G-6-P, 2-DG, and 2-DG-6-P with HKI
A 100-nanosecond (ns) molecular dynamics simulation was conducted to explore the movement and stability of G, G-6-P, 2-DG, and 2-DG-6-P within the catalytic pocket of HKI. The simulation results indicated that all ligands remained primarily confined within the catalytic pocket throughout the simulation period, with no instances of ligand egress observed (Supplementary Videos S1-S4; Supplementary Figure S1. This confinement suggested that these molecules are likely to maintain long-term interactions with the enzyme in vivo, potentially exerting a sustained influence on enzymatic activity. Moreover, the restricted movement of the small molecules during the simulation may indicate multiple interaction points with amino acid residues within HKI's active pocket. Notably, the stability of 2-DG and 2-DG-6-P suggested that these molecules can effectively mimic the behavior of natural substrates. For 2-DG-6-P, its stable binding within the pocket was particularly significant, as a phosphorylated product of 2-DG, it is not further metabolized in vivo, which could lead to its accumulation.
The root mean square deviation (RMSD) curves over time during the molecular dynamic simulations for the four sets of molecules were depicted (Figure 2A, Supplementary Figure S2). While fluctuations in RMSD indicate the dynamic nature of the structures, no large-scale conformational changes were observed in the protein-ligand complexes, suggesting that ligand bindings may have caused local rather than global structural adjustments. The RMSD values for the G with HKI complex were relatively stable throughout the simulation, mostly maintaining lower levels (approximately 2 to 3.5 angstroms). This smaller range of fluctuation indicates minimal overall conformational changes in the protein post-glucose binding, likely reflecting the high binding specificity and structural compatibility of glucose as the natural substrate for HKI. The low RMSD also implies that the protein-glucose complex maintained high structural stability during the simulation. In contrast, G-6-P, 2-DG, and 2-DG-6-P exhibited higher RMSD fluctuations, particularly at certain points, which might indicate that these small molecules induced more significant dynamic changes in the protein (Figure 2A, Supplementary Figure S2).
The radius of gyration (Rg) values for all complexes remained within a relatively narrow range of 39 to 42 angstroms throughout the simulation, showing no significant long-term trends, indicating that the overall conformation of the protein was maintained relatively stable (Figure 2B). These findings were consistent with the RMSD results, further suggesting that the complexes did not undergo substantial structural transformations during the simulation, implying that the bindings of the ligands did not cause significant unfolding or tightening of the protein conformation. Specifically, no ligand exhibited a markedly different trend in Rg changes, suggesting that the various small molecule complexes with HKI exhibited similar stability in spatial conformation (Figure 2B).
The Solvent Accessible Surface Area (SASA) is a parameter used to measure the degree of exposure of a protein or protein-ligand complex to the solvent, providing valuable insights into protein folding and conformational changes. The initial decrease in SASA values at the start of the simulation may indicate a transient closure of certain domains on the complex's surface due to the entry of ligands into the catalytic pocket. Subsequently, SASA values fluctuated for all complexes without showing a clear long-term increasing or decreasing trend, suggesting that ligand binding did not induce large-scale permanent structural unfolding of the complexes (Figure 2C). The minimal SASA fluctuations observed with 2-DG-6-P throughout the simulation indicated a relatively stable structure of the complex with HKI, likely implying tight interactions with residues in the catalytic pocket that provide higher binding specificity and stable inhibitory effects (Figure 2C). Moderate SASA fluctuations for G and 2-DG suggest that the complexes maintained balanced conformational dynamics, reflecting their adaptability as substrates or inhibitors in the protein structure (Figure 2C). Larger SASA fluctuations observed with G-6-P suggest that it might induce relatively significant protein structural changes, potentially related to local conformational changes in the catalytic pocket (Figure 2C).
Root Mean Square Fluctuation (RMSF) values reflect the mobility of individual amino acid residues during the simulation, with higher RMSF values indicating greater local flexibility or dynamic changes. G, G-6-P, and 2-DG-6-P exhibit smaller RMSF in the relevant residue areas of HKI catalytic pocket (approximately amino acids 500 to 850) (Figure 2D). This suggests that their bindings to HKI stabilize the conformations of relevant residues, indicating robust interactions within the catalytic pocket, resulting in lower local flexibility and fewer dynamic changes. In contrast, 2-DG shows higher RMSF, particularly in the active pocket region, indicating that 2-DG binding might lead to greater conformational changes and increased dynamics in that region (Figure 2D). This could be due to less stable interactions of 2-DG with HKI compared to the natural substrate glucose or other ligands, or because 2-DG induces different protein conformational changes than other substrates or ligands.
The free energy landscape, typically used to describe the relative probabilities of the system visiting various conformations during simulation, was constructed by combining the distributions of RMSD (reflecting the magnitude of conformational changes) and Rg (reflecting the compactness of the conformation). From the free energy landscape graph in Supplementary Figure S3, complexes of G, G-6-P, and 2-DG-6-P with HKI tend to cluster in areas of lower RMSD and moderate Rg values, showing a clear high-probability "well," indicating that these ligands form relatively stable bindings with HKI, and the complexes undergo minimal conformational changes and are more compact. Particularly, G and 2-DG-6-P exhibit a narrow, deep free energy "well," further suggesting high structural stability and low conformational diversity upon binding to HKI. In contrast, 2-DG exhibits a broader area of high probability that includes higher RMSD and Rg values, suggesting that the 2-DG-HKI complex might dynamically alternate among various conformational states (Supplementary Figure S3). This broader distribution of free energy could be due to higher conformational diversity following the binding of 2-DG to HKI, exhibiting greater flexibility and diverse conformational states.
The three-dimensional free energy landscape showed distinct peaks for G and 2-DG-6-P, indicating that during the simulation, these complexes mostly occupied specific, low-energy conformations. This narrow peak represented a stable conformational state, typically indicative of high binding affinity and specificity, suggesting that these ligands may form a series of strong interactions with the enzyme's active site (Figure 3A). On the other hand, the free energy landscapes for G-6-P and 2-DG presented broader energy peaks, indicating that these ligands explored a wider conformational space during the simulation. Particularly, the broad peak for 2-DG suggested that it might have undergone multiple different conformational states during the simulation, possibly due to looser binding with HKI or inducing significant conformational adjustments in the protein (Figure 3A).
The principal component analysis (PCA) displays the main motion modes of the protein-ligand complexes (Figure 3B). Systems interacting with G, 2-DG-6-P, and G-6-P showed distinct compact and dispersed areas in the PCA plot, indicating that the complexes underwent flexible conformational changes when interacting with HKI, yet still maintained areas of high conformational stability. In contrast, the system interacting with 2-DG exhibited a wide range of stable distributions, which implied that HKI had more conformational freedom when bound to 2-DG (Figure 3B). This increased range of motion could reflect the inherent flexibility and variety of conformational states accessible to HKI in the presence of 2-DG, highlighting the dynamic nature of enzyme-ligand interactions and the impact of different ligands on the enzyme's structural dynamics.
3.3. The End-Point Complex Structures and Interactions of G, G-6-P, 2-DG, and 2-DG-6-P with HKI
PyMOL was further used to visualize multiple facets of the optimal molecular simulation (MS) results depicting interactions between G, G-6-P, 2-DG, 2-DG-6-P, and HKI (Figure 4). Each set's three-dimensional structures showed the ligands positioned within HKI’s catalytic pocket (Figure 4A1, B1, C1, D1). The binding of 2-DG-6-P to HKI appears the tightest, characterized by the snug encapsulation of the small molecule within the binding pocket. Conversely, the binding of 2-DG is relatively loose, with a more open catalytic pocket, suggesting weaker interactions with HKI compared to other ligands. Zooming into the catalytic active site interactions (Figure 4A2, B2, C2, D2), we observe direct interactions between each ligand and key residues, potentially mediated by hydrogen bonds (indicated by purple arrows), polar interactions, hydrophobic forces, and electrostatic interactions, each contributing to overall binding affinity and specificity. The two-dimensional diagrams simplify these complex interactions, offering an intuitive depiction of how each ligand may influence HKI's conformation and activity through different types of interactions (Figure 4A3, B3, C3, D3).
The three-dimensional structure showed glucose positioned within HKI's catalytic pocket, tightly encased by specific amino acid residues, aiding in maintaining the correct orientation crucial for enzymatic catalysis (Figure 4A1). Detailed interactions at the catalytic site involved residues within 5Å, including GLY 519, PHE 587, SER 588, and so on, contributing to a stable interaction (Figure 4A2). The two-dimensional diagram simplified this view, showing potential polar interactions (e.g., ASN 641, THR 643), hydrophobic interactions (e.g., PHE 587, ILE 662), electrostatic interactions (e.g., LYS 606, ASP 642), and flexible glycine structures (GLY 666), along with possible hydrogen bonding (ASP 642) (Figure 4A3).
The three-dimensional molecular simulation results depicted G-6-P within the catalytic pocket, interacting with residues that create a specific environment tailored to its phosphate group, causing shifts in interactions compared to glucose (Figure 4B1). The two-dimensional diagram showed interactions including potential hydrogen bonds (ASN 668, LYS 606) and polar interactions with charged residues (LYS 606, GLU 727), which, along with the hydrophobic environment provided by residues like ILE 662, help stabilize G-6-P's position within the pocket (Figure 4B2, B3).
The three-dimensional view of the molecular simulation of 2-DG with HKI showed 2-DG in a more open catalytic pocket, indicating weaker interactions with HKI (Figure 4C1). This looser binding was reflected in the reduced number of interacting residues at the active site, potentially affecting its binding affinity and stability. The two-dimensional diagram highlighted reduced hydrogen bonding due to the absence of a hydroxyl group, with hydrophobic interactions still contributing to stabilizing its position (Figure 4C3).
The three-dimensional structure of 2-DG-6-P with HKI showed a tight interaction within the catalytic pocket, indicating strong binding affinity (Figure 4D1). 2-DG-6-P interacted with additional residues (e.g., PHE 587, VAL 663), enhancing its stability and inhibitory potential. The two-dimensional interaction diagram further illustrated how 2-DG-6-P's phosphate group might form additional hydrogen bonds (e.g., with THR 665), with its interactions mediated by polar, hydrophobic, and electrostatic forces, as well as flexible glycine structures (Figure 4D3). Overall, these visual representations provide a detailed insight into how each ligand interacts within the catalytic pocket of HKI, highlighting the complex interplay of forces that govern binding specificity and enzyme modulation (Figure 4).
3.4. Binding Affinities of the End-Point Complexes of G, G-6-P, 2-DG, and 2-DG-6-P with HKI
The binding affinity scores for the complexes of each group provided insights into the interaction strengths between the ligands and HKI (Figure 5A). The affinity score for G was -6.9873, indicating a strong binding affinity, which is expected for the natural substrate essential for catalytic activity. G-6-P displayed a similar affinity score of -7.0672, suggesting it also forms a stable complex with the enzyme. 2-DG showed a significantly higher affinity score of -3.6365 compared to both G and G-6-P, indicating the weakest binding affinity with HKI among the evaluated ligands. Such binding affinity suggested that 2-DG might not act as a strong competitive inhibitor on its own. 2-DG-6-P exhibited the lowest affinity score of -7.6934, indicating the tightest binding among the ligands studied (Figure 5A). This tight binding could lead to the occlusion of the catalytic pocket, impeding the further transformation of glucose and thus potentially inhibiting the glycolytic pathway in cells.
The number of hydrogen bonds formed between different ligands (2-DG, 2-DG-6-P, G, G-6-P) and HKI over the course of the simulation was then illustrated (Figure 5B and Figure S4). Hydrogen bonds play a crucial role in stabilizing protein-ligand complexes. 2-DG, 2-DG-6-P, and G initially had a higher number of hydrogen bonds, which fluctuated significantly early in the simulation but then decreased and stabilized, suggesting that the complexes may reach a relatively stable conformation. Notably, 2-DG-6-P maintained a more stable and generally higher count of hydrogen bonds throughout the simulation, indicating a more constant and robust interaction. In contrast, G-6-P exhibited significant fluctuations in the number of hydrogen bonds during the simulation, suggesting multiple binding modes or dynamic changes in the binding conformation (Figure 5B and Figure S4).
The decomposition of total energy contributions from different amino acid residues within HKI when interacting with four ligands (G, G-6-P, 2-DG, and 2-DG-6-P) was shown in Figure 5C. During the interaction with G, ILE 662 had a very significant negative energy contribution, indicating its crucial role in binding glucose through hydrophobic interactions with the non-polar parts of glucose (Figure 5C1). SER 588 also provided a large contribution, likely through hydrogen bonding between its side chain hydroxyl group and the hydroxyl groups of glucose, helping to stabilize the ligand's position. PRO 590 contributed significantly, where its cyclic structure might provide a rigid framework for the correct positioning of glucose at HKI’s active site. ASN 641 showed a notable negative energy contribution, suggesting potential hydrogen bonding or dipole-dipole interactions, aiding in precise glucose positioning. THR 603 and THR 605 may also form hydrogen bonds with glucose’s hydroxyl groups, contributing to complex stability. GLY 519 and GLY 695 had smaller contributions, potentially due to their relative static nature during ligand binding or minor roles in complex stability (Figure 5C1).
The energy contributions with G-6-P were: ILE 662 still showed the largest negative energy contribution, underscoring its core role in binding both G and G-6-P through hydrophobic interactions (Figure 5C2). SER 588 and PRO 590 maintained significant energy contributions in the interaction with G-6-P, likely stabilizing the ligand through hydrogen and hydrophobic interactions. A notably increased contribution from ASN 668, whose energy contribution was more significant with G-6-P binding than with G, possibly due to the additional charge and spatial requirements introduced by G-6-P's phosphate group (Figure 5C2). GLY 666 increased contribution to G-6P binding, possibly through the contacts with the phosphate group (Figure 5C2).
For 2-DG, ILE 662 continued to show significant negative energy contribution, emphasizing its key role in maintaining ligand-enzyme interactions (Figure 5C3). Its hydrophobic interactions were likely crucial for the stability of 2-DG. PRO 590 showed the largest contributions, highlighting the importance of this residue for the integrity and conformation of the enzyme's active pocket. A decrease in contributions from SER 588, THR 603, and THR 605 is likely due to reduced hydrogen bonding opportunities with 2-DG's structure (Figure 5C3).
As for 2-DG-6-P, the energy contributions were as follows: ILE 662's contribution was the most significant in binding 2-DG-6-P, continuously highlighting its central role in binding phosphorylated ligands (Figure 5C4). Its hydrophobic interactions were crucial for the stability of the phosphorylated ligand. SER 588 showed significant energy contributions in binding 2-DG-6-P, likely due to key hydrogen bonding in ligand recognition and binding. PRO 590 consistently showed high energy contributions across all ligands, suggesting its cyclic structure provides a stable environment for substrate binding. VAL 663 also contributed to the binding of 2-DG-6-P, indicating potential hydrophobic interactions with the phosphorylated ligand, enhancing ligand binding stability. An increase in energy contribution from GLY 666, possibly due to the small volume of GLY allowing necessary spatial flexibility for tighter contacts between the ligand and residues. THR 848 showed significant negative energy contributions, potentially because its side chain hydroxyl can form stable interactions with 2-DG-6-P's phosphate group (Figure 5C4).
These observations indicate that certain amino acid residues like ILE 662, SER 588, and PRO 590 play key roles in maintaining the structural integrity and functionality of the protein-ligand complexes, critical for drug design to enhance the efficacy and specificity of new drug molecules. The unique interactions with 2-DG-6-P, particularly involving residues like VAL 663 and THR 848, reveal interaction patterns that may be key to its effective inhibitory effects (Figure 5C).
3.5. Interactions of G, G-6-P, 2-DG, and 2-DG-6-P with Key Binding Residues of HKI
The interactions of G with HKI over time at specific intervals (20 ns, 40 ns, 60 ns, 80 ns, and 100 ns) were illustrated (Figure 6A). Key residues such as ILE 662, SER 588, PRO 590, and ASN 641 were highlighted for their roles in stabilizing the glucose within the active site of HKI. ILE 662 maintained a stable hydrophobic contact with glucose throughout the simulation, reinforcing its importance in stabilizing the ligand binding. SER 588, positioned near glucose, likely formed hydrogen bonds with glucose's hydroxyl groups, crucial for maintaining complex stability throughout the simulation. PRO 590 acted as an anchor around glucose, with its cyclic side chain potentially stabilizing the ligand's position and maintaining the overall shape of the active site. ASN 641's proximity to glucose remained relatively constant, suggesting its role in positioning glucose through dipole-dipole interactions or hydrogen bonds, adding further stability. Despite minor conformational changes observed between 60 ns and 80 ns, glucose remained within a pocket formed by these key residues, and the complex returned to a relatively stable state by 100 ns (Figure 6A).
Interactions at similar time intervals for G-6-P with HKI were illustrated in Figure 6B. ILE 662 continued to make significant hydrophobic contacts with G-6-P throughout the simulation, indicating its critical role irrespective of the ligand. SER 588, although slightly farther from the phosphate group of G-6-P, may still contribute to positioning and stabilizing G-6-P through hydrogen bonds with nearby water molecules or directly with the ligand. PRO 590 consistently supported G-6-P, suggesting that its proline ring structure helps maintain the ligand in the correct orientation for catalytic transformation. ASN 668, not ASN 641 as in the glucose interactions, played a significant role in stabilizing G-6-P, likely through hydrogen bonds with the phosphate group, which adds to the precision of ligand positioning (Figure 6B). Despite minor positional and orientational changes of G-6-P, the binding environment remains consistent thanks to these residues.
The interactions of 2-DG with HKI were also examined. ILE 662 demonstrated significant energy contributions at every observed time point, indicating its essential role in the hydrophobic stabilization of 2-DG. PRO 590 also showed consistent contributions, suggesting its importance in maintaining the active site's conformation favorable for 2-DG binding. The interactions here were limited mainly to these two residues, as 2-DG lacked additional hydroxyl groups for more extensive hydrogen bonding, which might explain the larger conformational changes observed during the simulation (Figure 6C).
The interactions of 2-DG-6-P with HKI were shown in Figure 6D. ILE 662 is pivotal in stabilizing the phosphorylated ligand through significant hydrophobic interactions. SER 588's contribution remained stable, potentially interacting with the phosphate group of 2-DG-6-P or other hydrogen-bond-capable sites, aiding in ligand stabilization. PRO 590 contributed consistently across all time points, with its cyclic structure providing a stable scaffold. VAL 663 and GLY 666 showed particularly high energy contributions, likely enhancing the binding stability through additional hydrophobic forces and providing conformational flexibility. THR 848 significantly contributed by possibly forming hydrogen bonds with the phosphate group of 2-DG-6-P, further stabilizing the ligand (Figure 6D).
4. Discussion
HKI is a pivotal enzyme in the glycolytic pathway [32], responsible for the phosphorylation of glucose to glucose-6-phosphate. This initial step is crucial for cellular metabolism, particularly in rapidly proliferating cells such as cancer cells, which exhibit an increased glycolytic flux known as the Warburg effect [33]. Several studies have previously characterized the binding interactions and inhibitory mechanisms of various HKI substrates and inhibitors. For example, researchers have demonstrated that glucose and G-6-P exhibit stable binding with HKI, consistent with the pivotal interactions identified in our simulations [34]. Additionally,our study showed that glucose analogs like 2-DG and its phosphorylated form, 2-DG-6-P, possessed differential binding affinities and stabilities that can modulate HKI activity. 2-DG showed the weakest binding affinity with HKI among the evaluated ligands. This suggested that 2-DG might not act as a strong competitive inhibitor of HKI on its own. Meanwhile, studies have reported that 2-DG, despite structurally similar to glucose, forms less stable complexes with HKI due to the absence of the hydroxyl group at the C-2 position, which weakens its ability to form hydrogen bonds, as supported by our findings [35,36]. Furthermore, existing literature suggests that phosphorylated inhibitors, such as glucose-6-phosphate analogs, tend to exhibit stronger inhibitory effects due to increased binding affinity facilitated by additional electrostatic and hydrogen bond interactions [37]. This aligns with our observation that 2-DG-6-P, in its phosphorylated form, engages more residues and forms a more stable complex with HKI compared to 2-DG. For 2-DG-6-P, its stable binding within the pocket was particularly significant, and as a phosphorylated product of 2-DG, it is not further metabolized in vivo, which could lead to its accumulation [16]. This point was particularly important when considering 2-DG as a therapeutic agent, focusing on the effects of its metabolic product rather than just the activity of the original molecule itself [38].
In clinical settings, 2-DG-6-P could potentially be used in combination with other metabolic inhibitors, such as agents targeting oxidative phosphorylation, to achieve a dual blockade of cellular energy production. Moreover, it could be synergistically administered with standard chemotherapies or radiotherapies, as glycolytic inhibition can sensitize cancer cells to these treatments by exacerbating energy stress and impairing their capacity to manage oxidative damage [39]. Combining metabolic targeting with chemotherapy is anticipated to improve therapeutic outcomes and may help overcome drug resistance [40]. Additionally, inhibiting glycolysis with 2-DG-6-P could modulate the tumor microenvironment by reducing lactate production, potentially enhancing the efficacy of immunotherapies [41]. However, challenges such as the efficient delivery of phosphorylated molecules into tumor cells and potential toxicity must be addressed through further preclinical studies to fully realize the therapeutic potential of 2-DG-6-P in clinical oncology.
The molecular docking and dynamics simulations provided detailed insights into the interactions between HKI and these glucose analogs, highlighting the potential for designing new inhibitors. For 2-DG, the lack of additional stabilizing interactions may explain its lower binding affinity, emphasizing that its inhibitory effects likely rely on its phosphorylated form. By understanding the specific interactions that stabilized 2-DG-6-P within the catalytic pocket of HKI, particularly the role of key amino acid residues (including ILE 662, SER 588, PRO 590, VAL 663, GLY 666, and THR 848), drug designers could develop inhibitors that mimic these interactions [42], potentially improving the therapeutic index for treatments of diseases characterized by altered metabolic pathways.
While the study provided significant insights into the potential of 2-DG and 2-DG-6-P as inhibitors of HKI, there were inherent limitations that must be considered. The reliance on computational docking and dynamic simulations, though powerful, does not always capture the full spectrum of molecular interactions and dynamics that occur in vivo. Protein flexibility, for instance, remains a significant challenge, as molecular dynamics simulations may not fully capture the complete range of conformational changes that occur in vivo, such as those involved in induced fit or allosteric regulation. Furthermore, simulations often operated under idealized conditions that may not adequately model the physicochemical properties of the cellular milieu, such as pH variations and the presence of other ions and molecules that can affect enzyme kinetics [43]. These environmental conditions, particularly the acidic and hypoxic nature of the tumor microenvironment, may alter the interaction dynamics of HKI with inhibitors like 2-DG-6-P. Additionally, the study's focus on HKI could overlook interactions with other isoforms of hexokinase, which may have different sensitivities to these inhibitors. Addressing these limitations would require integrating computational findings with experimental data, including kinetic assays and cellular studies, to validate the predicted interactions and effects in a more physiological setting in future studies. Moreover, while our current study focuses on HKI, the consideration of isoform specificity was not directly addressed in this research. We concur that delving into the interactions of 2-DG-6-P with other hexokinase isoforms, notably HKII, could yield valuable insights for targeted therapies in cancer treatment. This is an important direction for future research, and we intend to broaden our research scope to examine the potential distinct effects of 2-DG-6-P across diverse hexokinase isoforms, potentially facilitating the customization of more precise metabolic interventions.
5. Conclusions
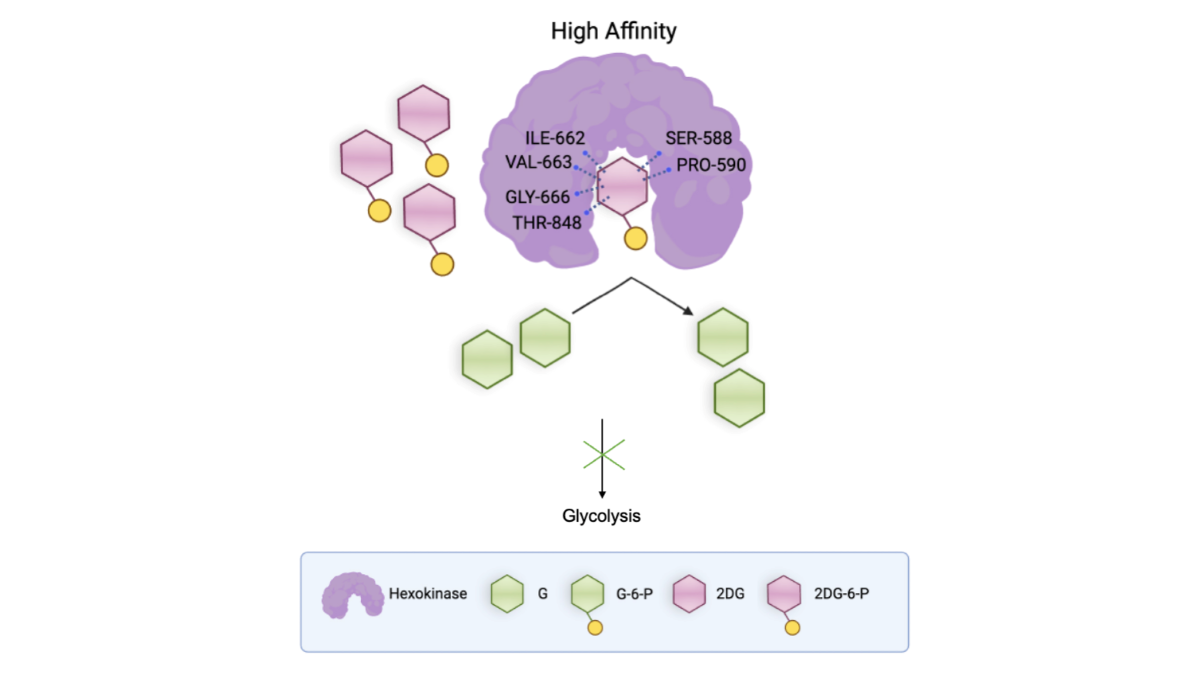
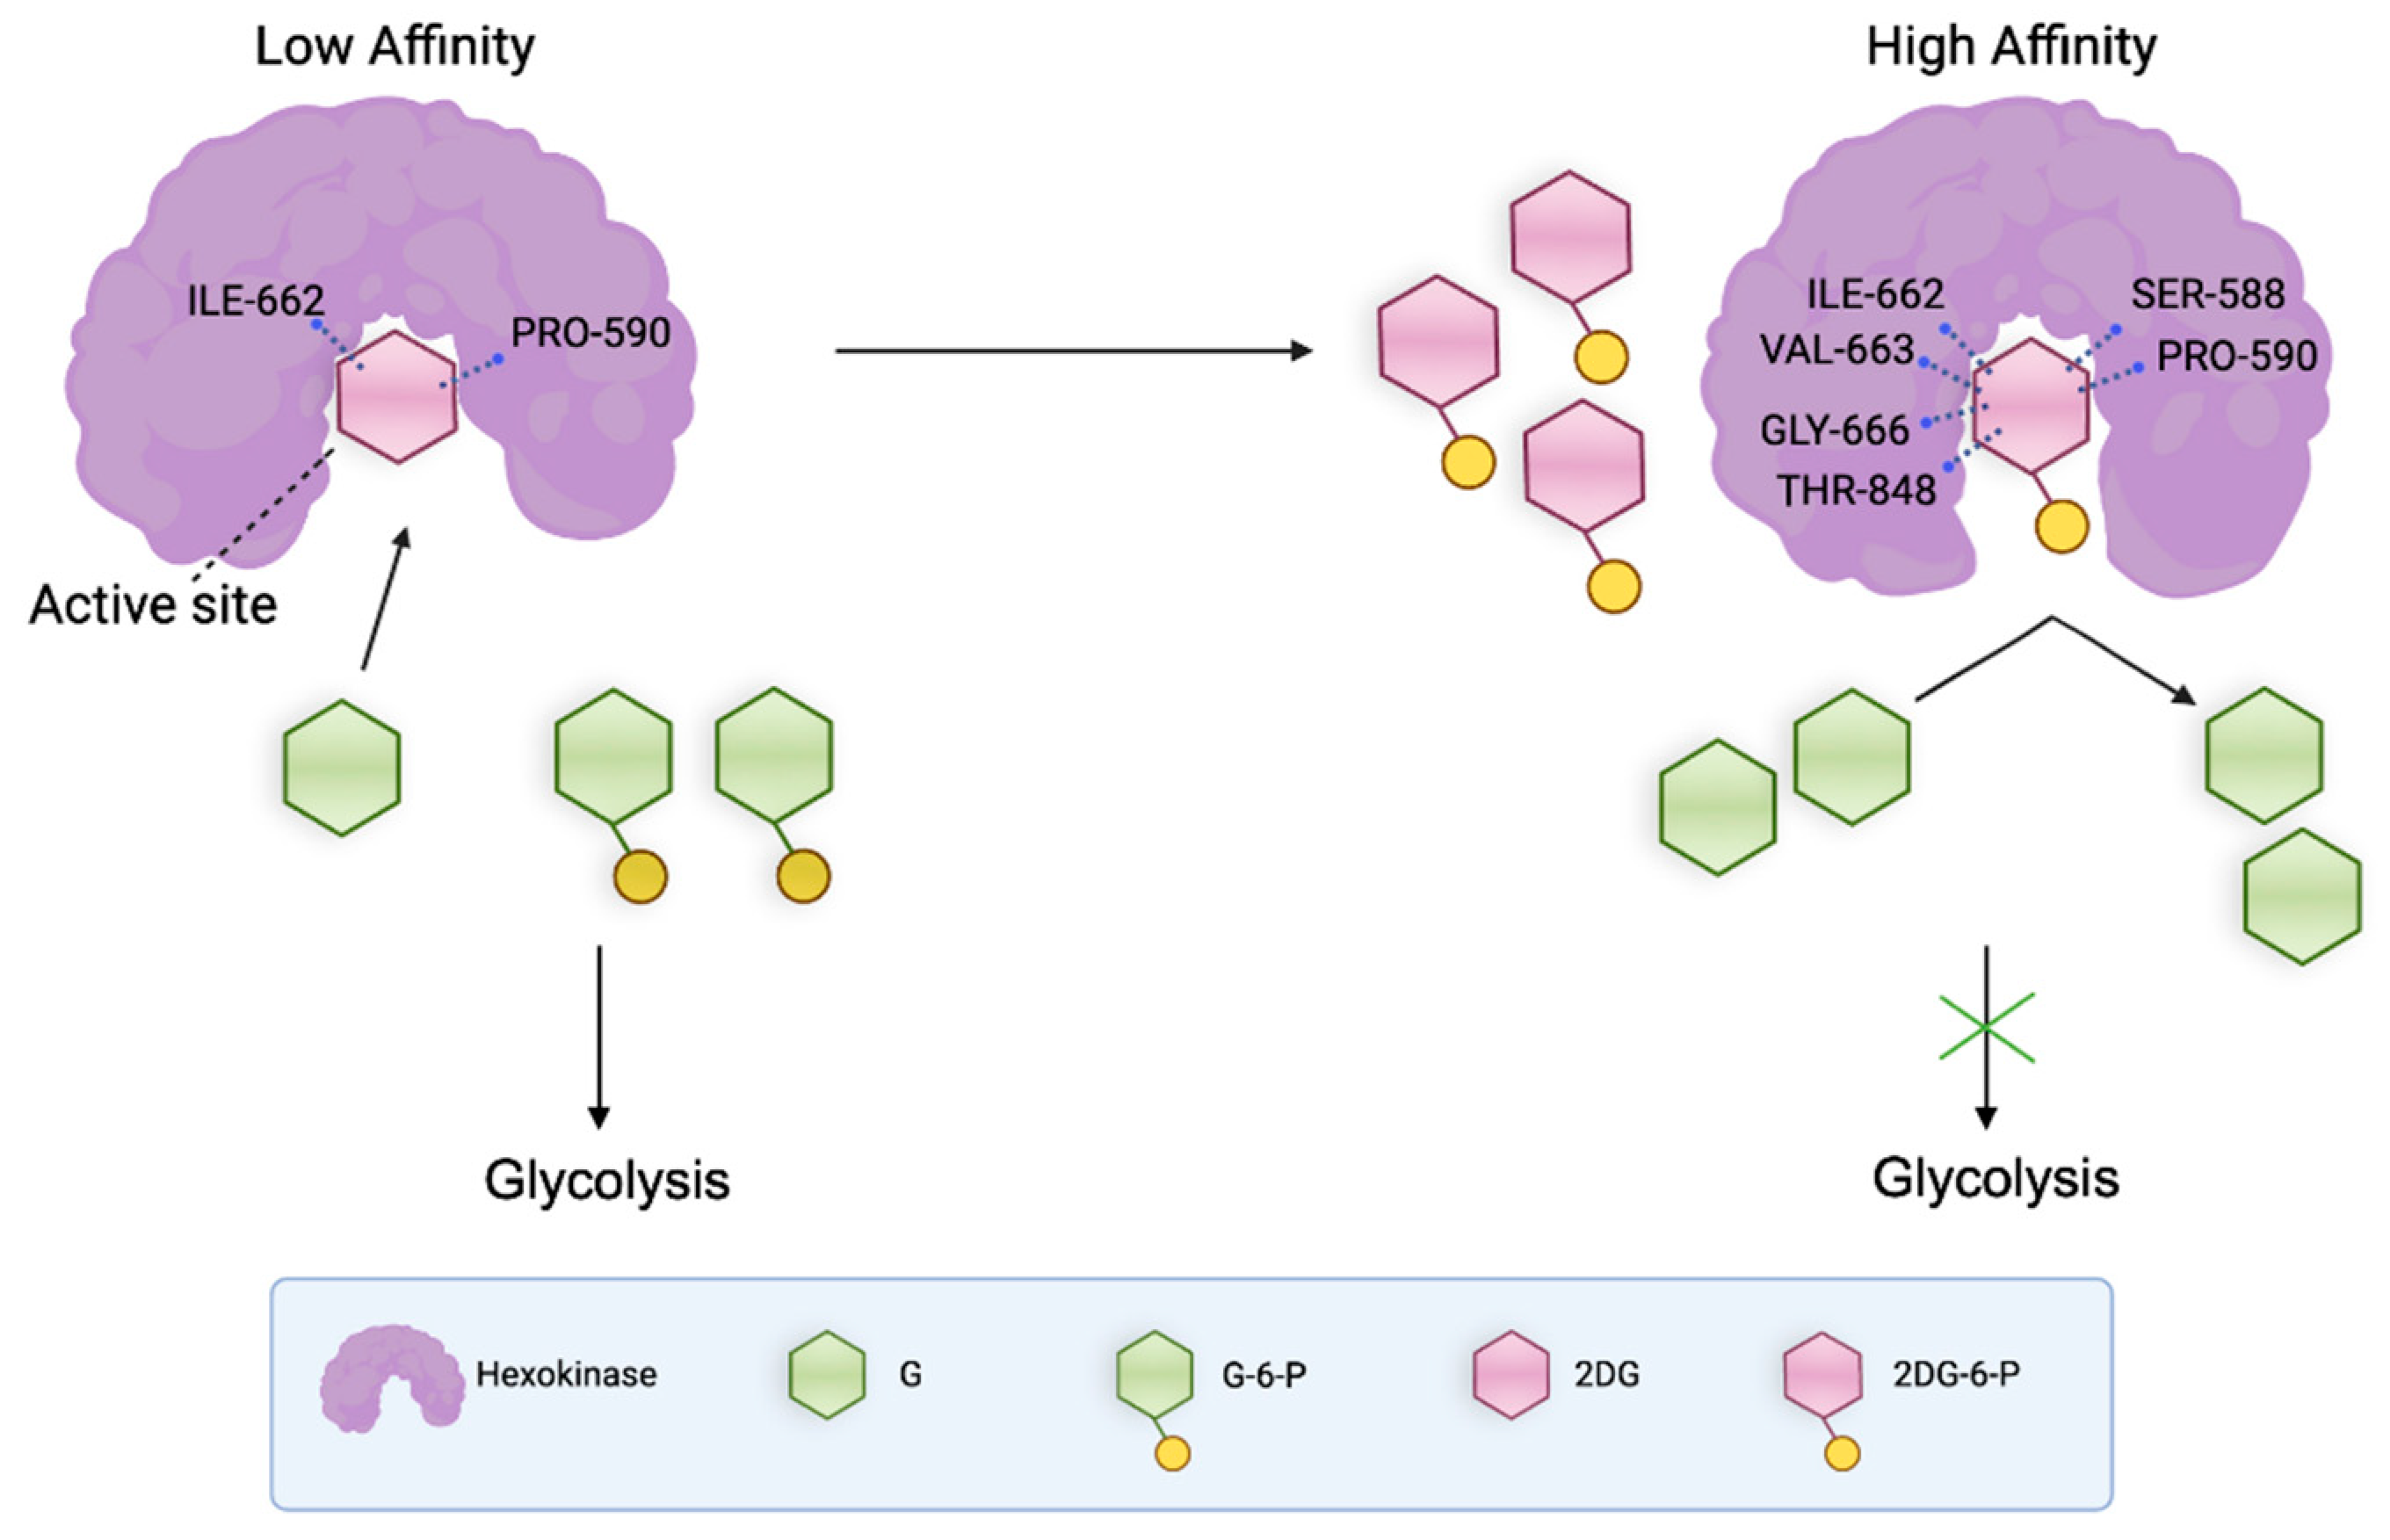
In this study, we examine the interactions of HKI with G, G-6-P, 2-DG, and 2-DG-6-P. Compared to glucose, 2-DG shows relatively unstable binding to HKI, resulting from its simplified structure and fewer residue interactions. G-6-P maintains binding stability similar to that of glucose due to consistent interaction patterns with key residues. The most stable complex with the highest binding affinity is formed between HKI and 2-DG-6-P, attributed to its strong interactions with multiple critical residues, including ILE 662, SER 588, PRO 590, VAL 663, GLY 666, and THR 848. This implies that 2-DG’s inhibitory effect could be primarily exerted through its conversion to 2-DG-6-P within the cell (Figure 7). By advancing our understanding of the interactions between HKI and various glucose analogs at a molecular level, this study offers new insights for future targeted drug design of metabolic manipulations and anticancer therapies.
Supplementary Materials
The following supporting information can be downloaded at: www.mdpi.com/xxx/s1, Figure S1: Structures of the end-point complexes for each group from molecular simulations; Figure S2: Time evolution of the RMSD for the four groups of HKI and their ligands; Figure S2: Free energy landscape diagrams for the four complexes during the simulation process; Video S1: A 100-nanosecond (ns) molecular dynamics simulation of G within HKI catalytic pocket; Video S2: A 100-nanosecond (ns) molecular dynamics simulation of G-6-P,within HKI catalytic pocket; Video S3: A 100-nanosecond (ns) molecular dynamics simulation of 2-DG within HKI catalytic pocket; Video S4: A 100-nanosecond (ns) molecular dynamics simulation of 2-DG-6-P within HKI catalytic pocket;.
Author Contributions
Conceptualization, S.C. and Y.C.; Data curation, Y.H. and S.C.; Investigation, Y.H., H.L. and Q.S.; Software, L.X., J.F., C.X., Y.Q., B.M., X.L. and X.L.; Writing – original draft, Y. H. and S.C. All authors have read and agreed to the published version of the manuscript.
Funding
This work was supported by grants from the National Natural Science Foundation of China (82401143, 82201119, 82170987), Guangzhou Basic and Applied Basic Research Scheme (2024A04J4856), Natural Science Foundation of Guangdong Province (2024A1515013060), Guangdong Basic and Applied Basic Research Foundation (2022A1515110434) and the AO Research Grant.
Institutional Review Board Statement
Not applicable.
Informed Consent Statement
Not applicable.
Data Availability Statement
All the other data supporting the findings of this study are available within the article and its Supplementary files. Raw data files are available to be shared upon request to the corresponding authors.
Acknowledgments
The schematic diagram was created using BioRender.com.
Conflicts of Interest
The authors declare no conflicts of interest.
References
- Warburg, O.; Minami, S. Versuche an Überlebendem Carcinom-gewebe. Klin Wochenschr. 1923, 2, 776–777. [Google Scholar] [CrossRef]
- Upadhyay, M.; Samal, J.; Kandpal, M.; Singh, O.V.; Vivekanandan, P. The Warburg effect: insights from the past decade. Pharmacol Ther. 2013, 137, 318–330. [Google Scholar] [CrossRef] [PubMed]
- Reiter, R.J.; Sharma, R.; Ma, Q. Switching diseased cells from cytosolic aerobic glycolysis to mitochondrial oxidative phosphorylation: A metabolic rhythm regulated by melatonin? J Pineal Res. 2021, 70, e12677. [Google Scholar] [CrossRef] [PubMed]
- Zhang, J.; Yang, J.; Lin, C.; Liu, W.; Huo, Y.; Yang, M.; Jiang, S.H.; Sun, Y.; Hua, R. Endoplasmic Reticulum stress-dependent expression of ERO1L promotes aerobic glycolysis in Pancreatic Cancer. Theranostics 2020, 10, 8400–8414. [Google Scholar] [CrossRef]
- Fadaka, A.O.; Ajiboye, B.O.; Ojo, O.A.; Adewale, O.B.; Olayide, I.; Emuowhochere, R. Biology of glucose metabolization in cancer cells. Journal of Oncological Sciences 2017, 3, 45–51. [Google Scholar] [CrossRef]
- Farooq, Z.; Ismail, H.; Bhat, S.A.; Layden, B.T.; Khan, M.W. Aiding Cancer's "Sweet Tooth": Role of Hexokinases in Metabolic Reprogramming. Life 2023, 13, 946. [Google Scholar] [CrossRef]
- Wilson, J.E. Isozymes of mammalian hexokinase: structure, subcellular localization and metabolic function. J Exp Biol. 2003, 206, 2049–2057. [Google Scholar] [CrossRef]
- Ciscato, F.; Ferrone, L.; Masgras, I.; Laquatra, C.; Rasola, A. Hexokinase 2 in Cancer: A Prima Donna Playing Multiple Characters. Int J Mol Sci. 2021, 22, 4716. [Google Scholar] [CrossRef]
- Nederlof, R.; Eerbeek, O.; Hollmann, M.W.; Southworth, R.; Zuurbier, C.J. Targeting hexokinase II to mitochondria to modulate energy metabolism and reduce ischaemia-reperfusion injury in heart. Br J Pharmacol. 2014, 171, 2067–2079. [Google Scholar] [CrossRef]
- Wilson, J.E. Isozymes of mammalian hexokinase: structure, subcellular localization and metabolic function. J Exp Biol. 2003, 206, 2049–2057. [Google Scholar] [CrossRef]
- Dey, S.; Murmu, N.; Mondal, T.; Saha, I.; Chatterjee, S.; Manna, R.; Haldar, S.; Dash, S.K.; Sarkar, T.R.; Giri, B. Multifaceted entrancing role of glucose and its analogue, 2-deoxy-D-glucose in cancer cell proliferation, inflammation, and virus infection. Biomed Pharmacother. 2022, 156, 113801. [Google Scholar] [CrossRef] [PubMed]
- Bost, F.; Decoux-Poullot, A.G.; Tanti, J.F.; Clavel, S. Energy disruptors: rising stars in anticancer therapy? Oncogenesis 2016, 5, e188. [Google Scholar] [CrossRef] [PubMed]
- Su, M.; Shan, S.; Gao, Y.; Dai, M.; Wang, H.; He, C.; Zhao, M.; Liang, Z.; Wan, S.; Yang, J.; et al. 2-Deoxy-D-glucose simultaneously targets glycolysis and Wnt/β-catenin signaling to inhibit cervical cancer progression. IUBMB Life 2023, 75, 609–623. [Google Scholar] [CrossRef] [PubMed]
- Al-Shammari, A.M.; Abdullah, A.H.; Allami, Z.M.; Yaseen, N.Y. 2-Deoxyglucose and Newcastle Disease Virus Synergize to Kill Breast Cancer Cells by Inhibition of Glycolysis Pathway Through Glyceraldehyde3-Phosphate Downregulation. Front Mol Biosci. 2019, 6, 90. [Google Scholar] [CrossRef]
- Zhang, D.; Li, J.; Wang, F.; Hu, J.; Wang, S.; Sun, Y. 2-Deoxy-D-glucose targeting of glucose metabolism in cancer cells as a potential therapy. Cancer Lett. 2014, 355, 176–183. [Google Scholar] [CrossRef]
- Pajak, B.; Siwiak, E.; Sołtyka, M.; et al. 2-Deoxy-d-Glucose and Its Analogs: From Diagnostic to Therapeutic Agents. Int J Mol Sci. 2019, 21, 234. [Google Scholar] [CrossRef]
- Lampidis, T.J.; Kurtoglu, M.; Maher, J.C.; Liu, H.; Krishan, A.; Sheft, V.; Szymanski, S.; Fokt, I.; Rudnicki, W.R.; Ginalski, K.; et al. Efficacy of 2-halogen substituted D-glucose analogs in blocking glycolysis and killing "hypoxic tumor cells". Cancer Chemother Pharmacol. 2006, 58, 725–734. [Google Scholar] [CrossRef]
- Datema, R.; Schwarz, R.T. Formation of 2-deoxyglucose-containing lipid-linked oligosaccharides. Interference with glycosylation of glycoproteins. Eur J Biochem. 1978, 90, 505–516. [Google Scholar] [CrossRef]
- Singh, R.; Gupta, V.; Kumar, A.; Singh, K. 2-Deoxy-D-Glucose: A Novel Pharmacological Agent for Killing Hypoxic Tumor Cells, Oxygen Dependence-Lowering in Covid-19, and Other Pharmacological Activities. Adv Pharmacol Pharm Sci. 2023, 2023, 9993386. [Google Scholar] [CrossRef]
- Oikonomakos, N.G.; Zographos, S.E.; Johnson, L.N.; Papageorgiou, A.C.; Acharya, K.R. The binding of 2-deoxy-D-glucose 6-phosphate to glycogen phosphorylase b: kinetic and crystallographic studies. J Mol Biol. 1995, 254, 900–917. [Google Scholar] [CrossRef]
- Chen, W.; Guéron, M. The inhibition of bovine heart hexokinase by 2-deoxy-D-glucose-6-phosphate: characterization by 31P NMR and metabolic implications. Biochimie. 1992, 74, 867–873. [Google Scholar] [CrossRef] [PubMed]
- Lu, W.; Zhang, J.; Huang, W.; Zhang, Z.; Jia, X.; Wang, Z.; Shi, L.; Li, C.; Wolynes, P.G.; Zheng, S. DynamicBind: predicting ligand-specific protein-ligand complex structure with a deep equivariant generative model. Nat Commun. 2024, 15, 1071. [Google Scholar] [CrossRef] [PubMed]
- Case, D.A.; Aktulga, H.M.; Belfon, K.; Cerutti, D.S.; Cisneros, G.A.; Cruzeiro, V.W.D.; Forouzesh, N.; Giese, T.J.; Götz, A.W.; Gohlke, H.; et al. AmberTools. J Chem Inf Model. 2023, 63, 6183–6191. [Google Scholar] [CrossRef] [PubMed]
- Tian, C.; Kasavajhala, K.; Belfon, K.A.A.; Raguette, L.; Huang, H.; Migues, A.N.; Bickel, J.; Wang, Y.; Pincay, J.; Wu, Q.; et al. ff19SB: Amino-Acid-Specific Protein Backbone Parameters Trained against Quantum Mechanics Energy Surfaces in Solution. J Chem Theory Comput. 2020, 16, 528–552. [Google Scholar] [CrossRef]
- Roe, D.R.; Cheatham, T.E. , 3rd. PTRAJ and CPPTRAJ: Software for Processing and Analysis of Molecular Dynamics Trajectory Data. J Chem Theory Comput. 2013, 9, 3084–3095. [Google Scholar] [CrossRef]
- Casalino L, Nierzwicki Ł, Jinek M, Palermo G. Catalytic Mechanism of Non-Target DNA Cleavage in CRISPR-Cas9 Revealed by Ab Initio Molecular Dynamics. ACS Catal. 2020, 10, 13596–13605. [Google Scholar] [CrossRef]
- Carola Jerves, Rui P. P. Neves, Maria J. Ramos, Saulo da Silva, and Pedro A. Fernandes Reaction Mechanism of the PET Degrading Enzyme PETase Studied with DFT/MM Molecular Dynamics Simulations. ACS Catal. 2021, 11, 11626–11638. [Google Scholar] [CrossRef]
- PD; Ghosh, S. ; Ganguly, B. Revealing the Inhibition Mechanism of RNA-Dependent RNA Polymerase (RdRp) of SARS-CoV-2 by Remdesivir and Nucleotide Analogues: A Molecular Dynamics Simulation Study. J Phys Chem B. 2020, 124, 10641–10652. [Google Scholar] [CrossRef]
- Valdés-Tresanco MS, Valdés-Tresanco ME, Valiente PA, Moreno E. gmx_MMPBSA: A New Tool to Perform End-State Free Energy Calculations with GROMACS. J Chem Theory Comput. 2021, 17, 6281–6291. [Google Scholar] [CrossRef]
- Miller BR 3rd, McGee TD Jr, Swails JM, Homeyer N, Gohlke H, Roitberg AE. MMPBSA.py: An Efficient Program for End-State Free Energy Calculations. J Chem Theory Comput. 2012, 8, 3314–3321. [Google Scholar] [CrossRef]
- Weiser, J.; Shenkin, P.S.; Still, W.C. Approximate atomic surfaces from linear combinations of pairwise overlaps (LCPO). J Comput Chem. 1999, 20, 217–230. [Google Scholar] [CrossRef]
- Sundaram, S.M.; Doughty, L.A.; Sereda, M.W. Location matters: hexokinase 1 in glucose metabolism and inflammation. Trends Endocrinol Metab. 2022, 33, 665–667. [Google Scholar] [CrossRef] [PubMed]
- Vaupel, P.; Multhoff, G. Revisiting the Warburg effect: historical dogma versus current understanding. J Physiol. 2021, 599, 1745–1757. [Google Scholar] [CrossRef] [PubMed]
- Garcia, S.N.; Guedes, R.C.; Marques, M.M. Unlocking the Potential of HK2 in Cancer Metabolism and Therapeutics. Curr Med Chem. 2019, 26, 7285–7322. [Google Scholar] [CrossRef]
- Jin, T.; Mehrens, H.; Wang, P.; Kim, S.G. Glucose metabolism-weighted imaging with chemical exchange-sensitive MRI of 2-deoxyglucose (2DG) in brain: Sensitivity and biological sources. Neuroimage. 2016, 143, 82–90. [Google Scholar] [CrossRef]
- Pajak, B.; Siwiak, E.; Sołtyka, M.; Priebe, A.; Zieliński, R.; Fokt, I.; Ziemniak, M.; Jaśkiewicz, A.; Borowski, R.; Domoradzki, T.; et al. 2-Deoxy-d-Glucose and Its Analogs: From Diagnostic to Therapeutic Agents. Int. J. Mol. Sci. 2020, 21, 234. [Google Scholar] [CrossRef]
- Shan, W.; Zhou, Y.; Tam, K.Y. The development of small-molecule inhibitors targeting hexokinase 2. Drug Discov Today. 2022, 27, 2574–2585. [Google Scholar] [CrossRef]
- Swargiary, G.; Mani, S. Molecular docking and simulation studies of phytocompounds derived from Centella asiatica and Andrographis paniculata against hexokinase II as mitocan agents. Mitochondrion 2021, 61, 138–146. [Google Scholar] [CrossRef]
- Chelakkot, C.; Chelakkot, V.S.; Shin, Y.; Song, K. Modulating Glycolysis to Improve Cancer Therapy. Int. J. Mol. Sci. 2023, 24, 2606. [Google Scholar] [CrossRef]
- Peng J, Cui Y, Xu S, et al. Altered glycolysis results in drug-resistant in clinical tumor therapy. Oncol Lett. 2021, 21, 369. [Google Scholar] [CrossRef]
- Brand A, Singer K, Koehl GE, et al. LDHA-Associated Lactic Acid Production Blunts Tumor Immunosurveillance by T and NK Cells. Cell Metab. 2016, 24, 657–671. [Google Scholar] [CrossRef] [PubMed]
- Bhattacharjee, R.; Devi, A.; Mishra, S. Molecular docking and molecular dynamics studies reveal structural basis of inhibition and selectivity of inhibitors EGCG and OSU-03012 toward glucose regulated protein-78 (GRP78) overexpressed in glioblastoma. J Mol Model. 2015, 21, 272. [Google Scholar] [CrossRef] [PubMed]
- Gu, J.; Mavis, C.; Wang, J.C.; Bowman, K.; Mandeville, T.K.; Tatar, A.E.; Benekli, Z.; Cortese, M.J.; Hernandez-Ilizaliturri, F.J. Novel Drug to Target HK2 Overcomes Therapeutic Resistance in Preclinical B-Cell Lymphoma Models. Blood 2023, 142, 5793. [Google Scholar] [CrossRef]
Figure 1.
Molecular docking results of G, G-6-P, 2-DG, and 2-DG-6-P with HKI. (A) Superimposition of the docking complex structures for each group; (B) Overlapping binding modes of each group's ligands at the catalytic site of HKI; Three-dimensional (C) and two-dimensional (D) views of the interactions between the amino acid residues in the binding region of HKI and each group's ligands.
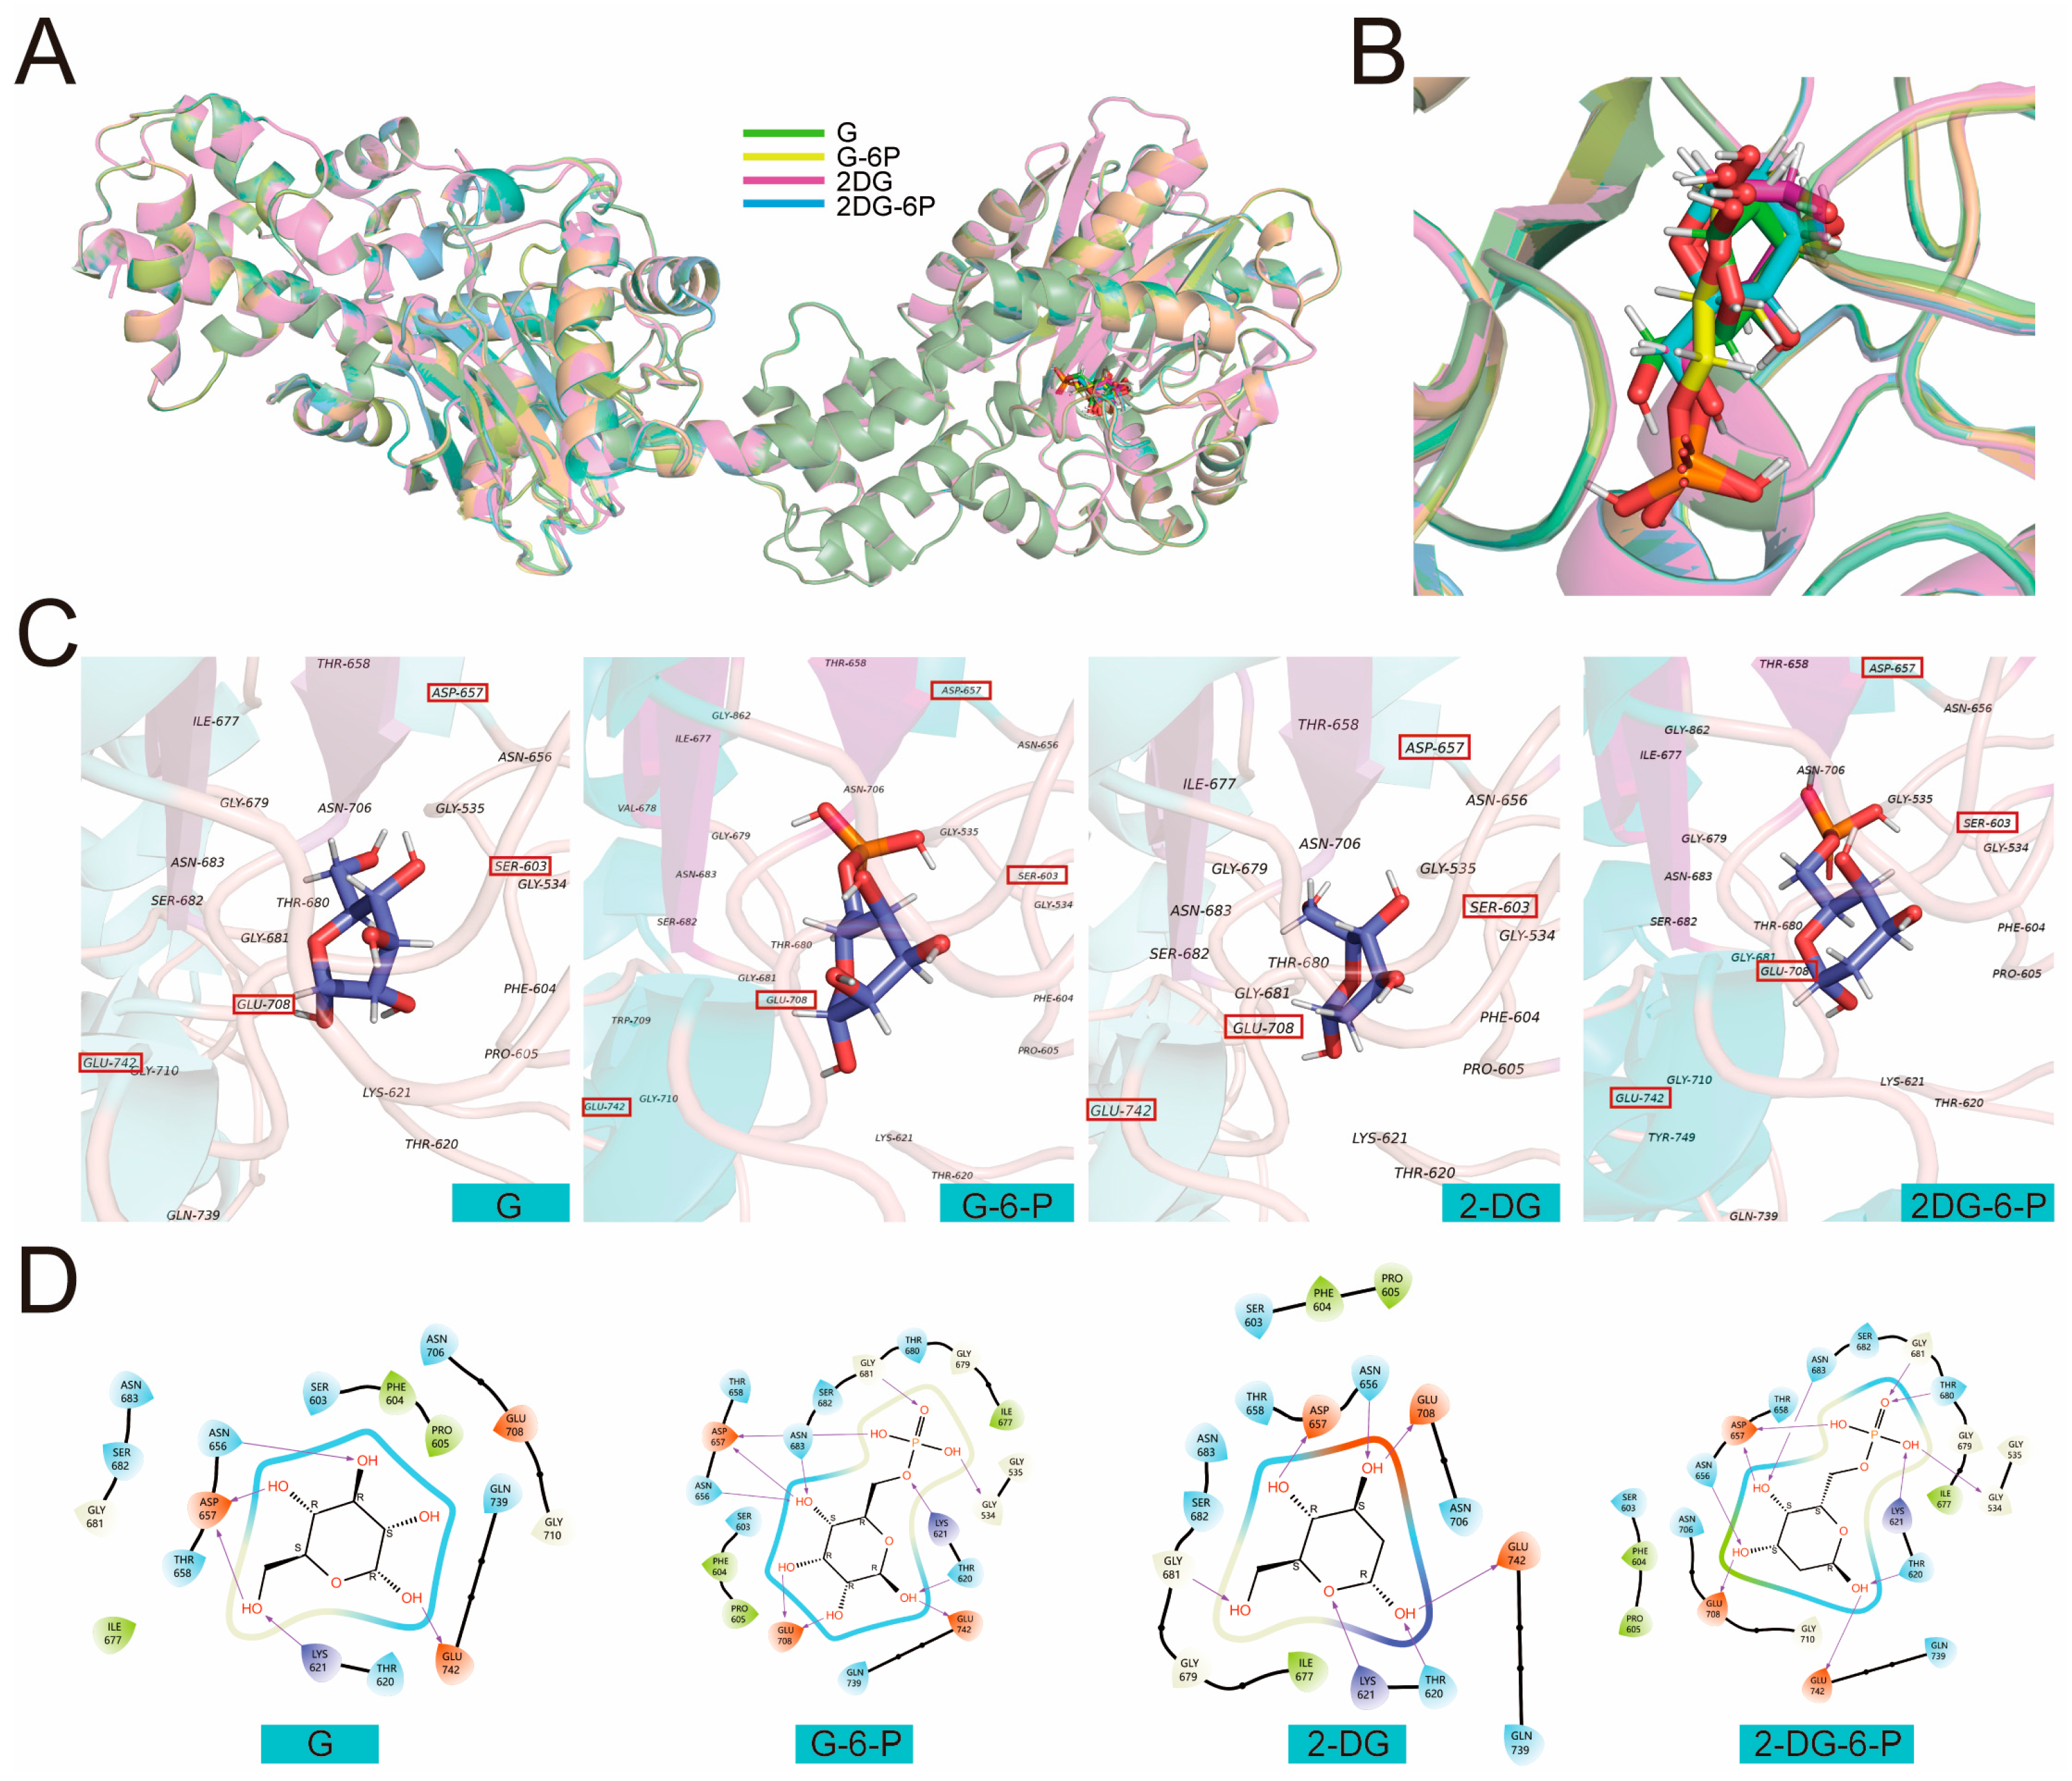
Figure 2.
Molecular dynamics simulation of G, G-6-P, 2-DG, and 2-DG-6-P with HKI. (A) The RMSD curves for the four complexes over time; (B) The Rg curves over time for the protein-ligand complexes of the four groups; (C) The SASA curves over time for the protein-ligand complexes of the four groups; (D) The RMSF of each amino acid residue within the protein-ligand complexes of the four groups, illustrating the extent of movement during the simulation process.
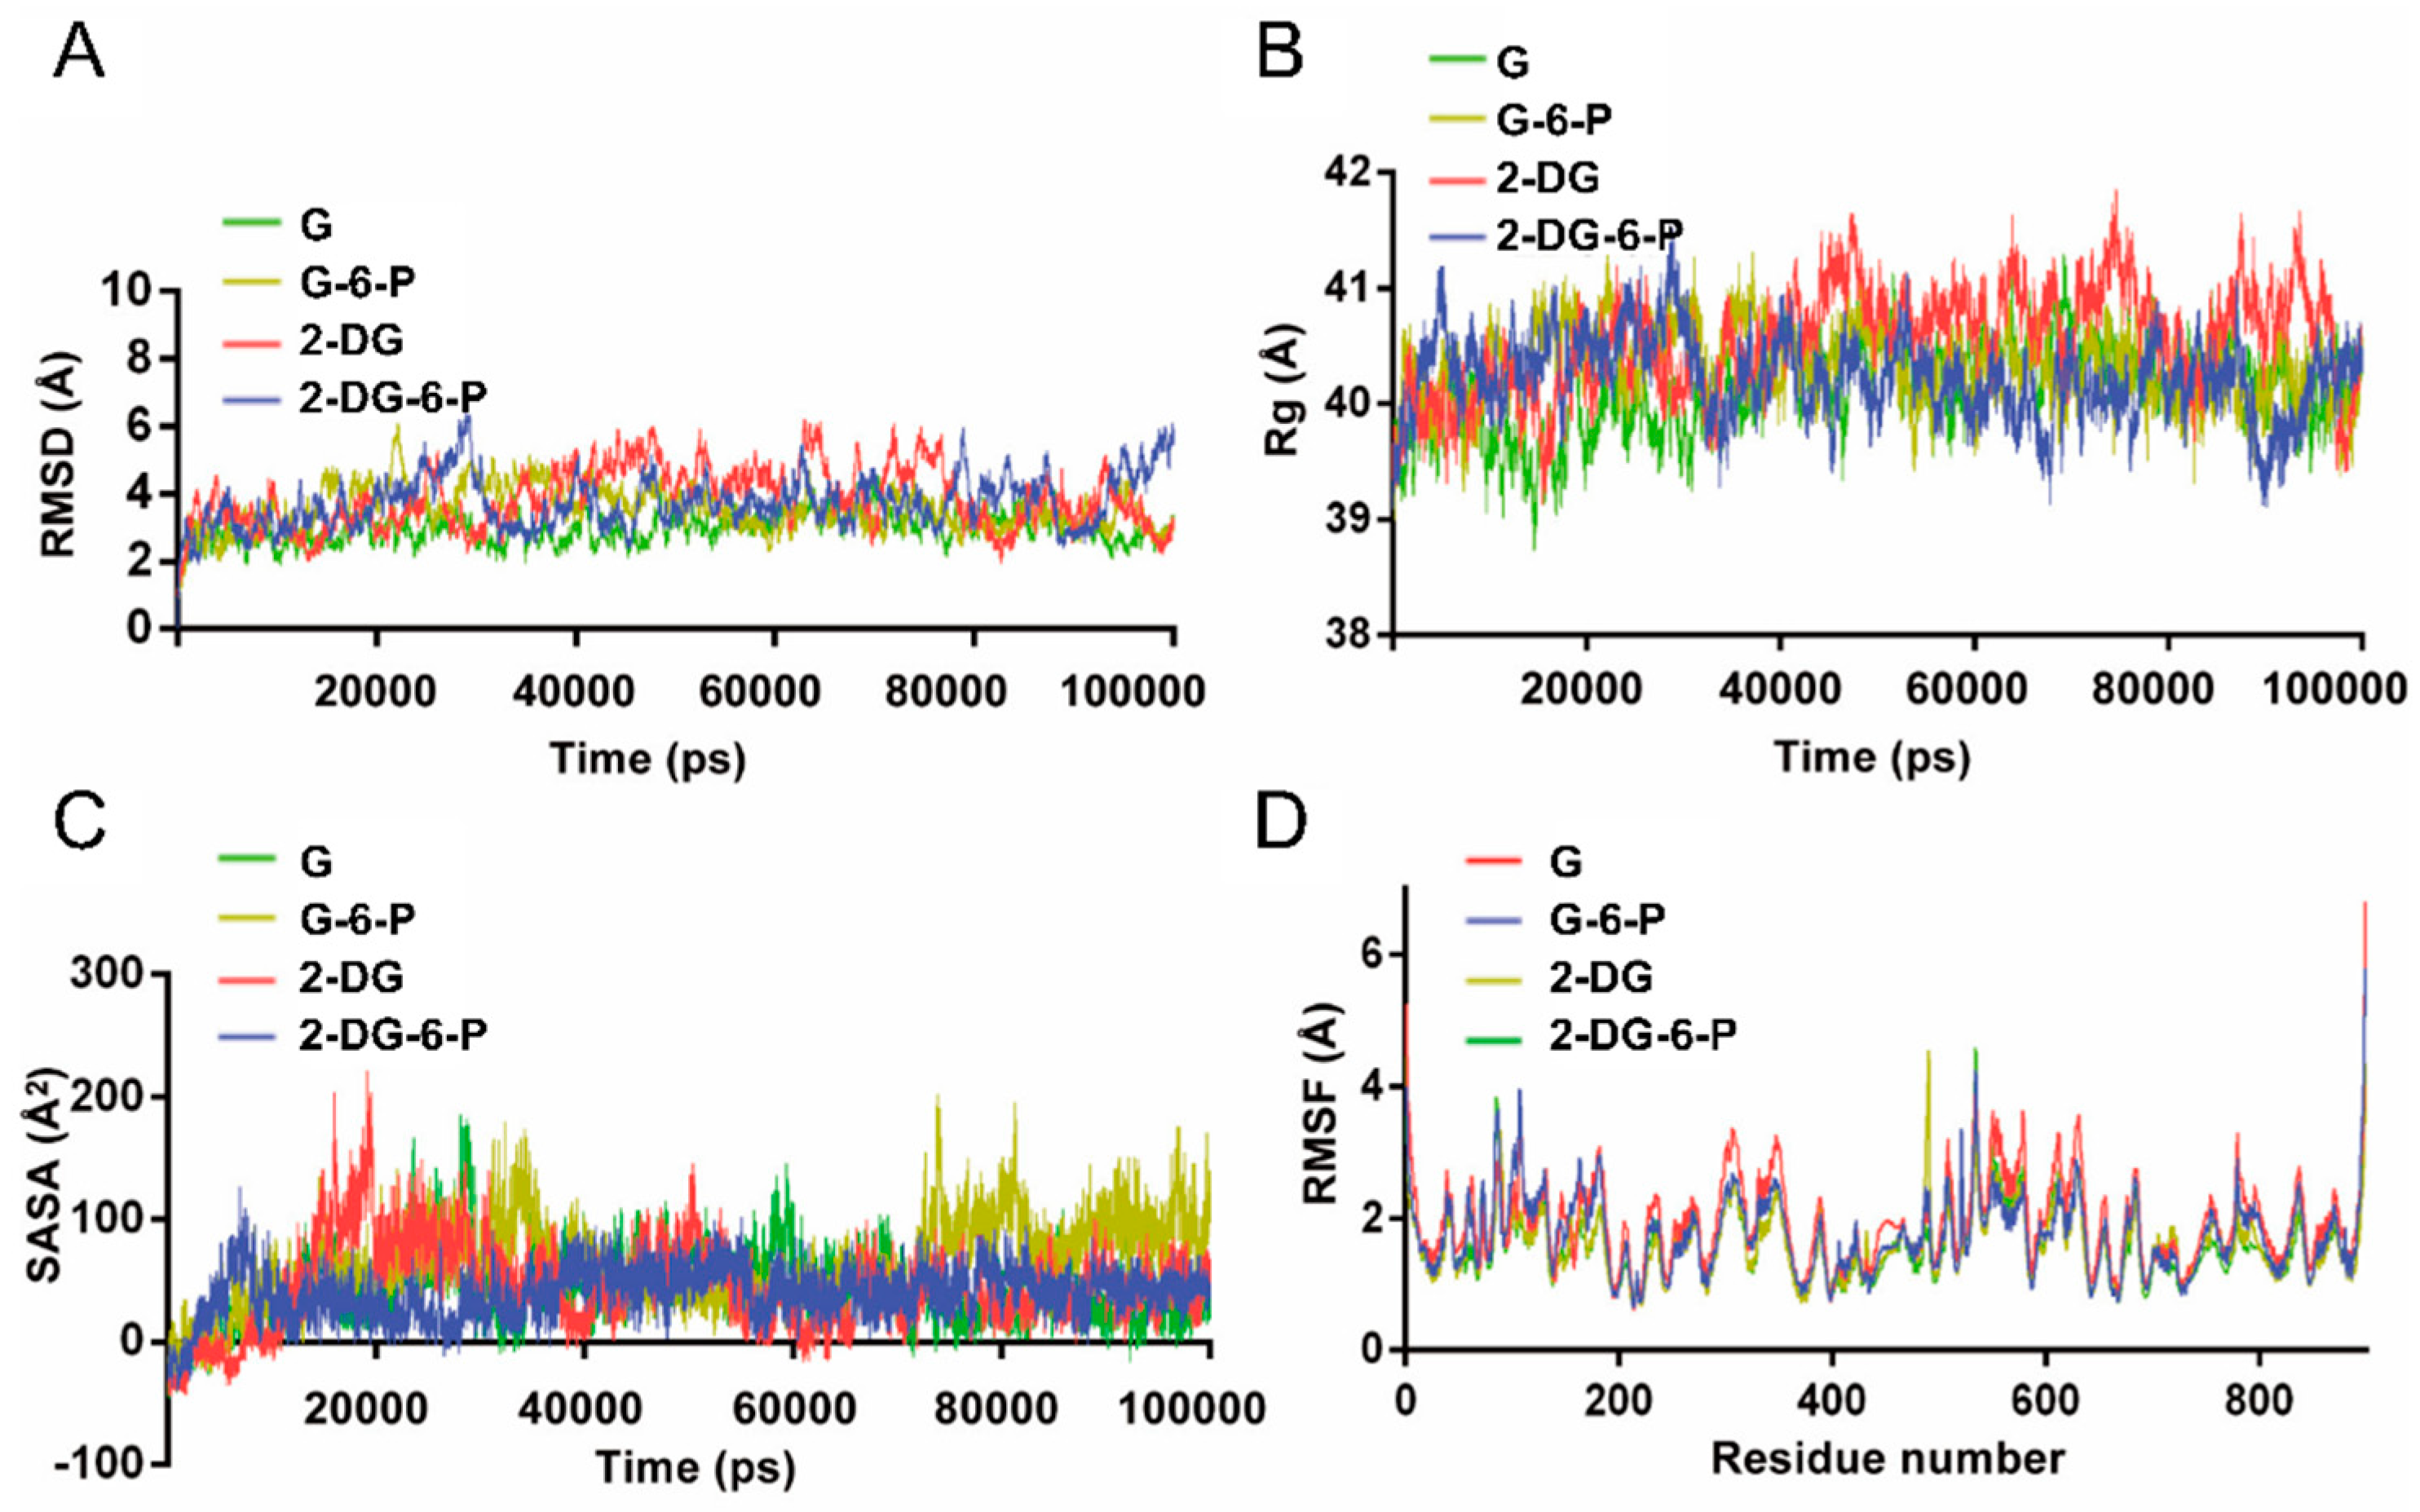
Figure 3.
Conformation and motion distribution of the complexes of G, G-6-P, 2-DG, and 2-DG-6-P with HKI during molecular dynamics simulations. (A) Three-dimensional free energy landscapes of the four complexes; (B) PCA of the four complexes.
Figure 3.
Conformation and motion distribution of the complexes of G, G-6-P, 2-DG, and 2-DG-6-P with HKI during molecular dynamics simulations. (A) Three-dimensional free energy landscapes of the four complexes; (B) PCA of the four complexes.
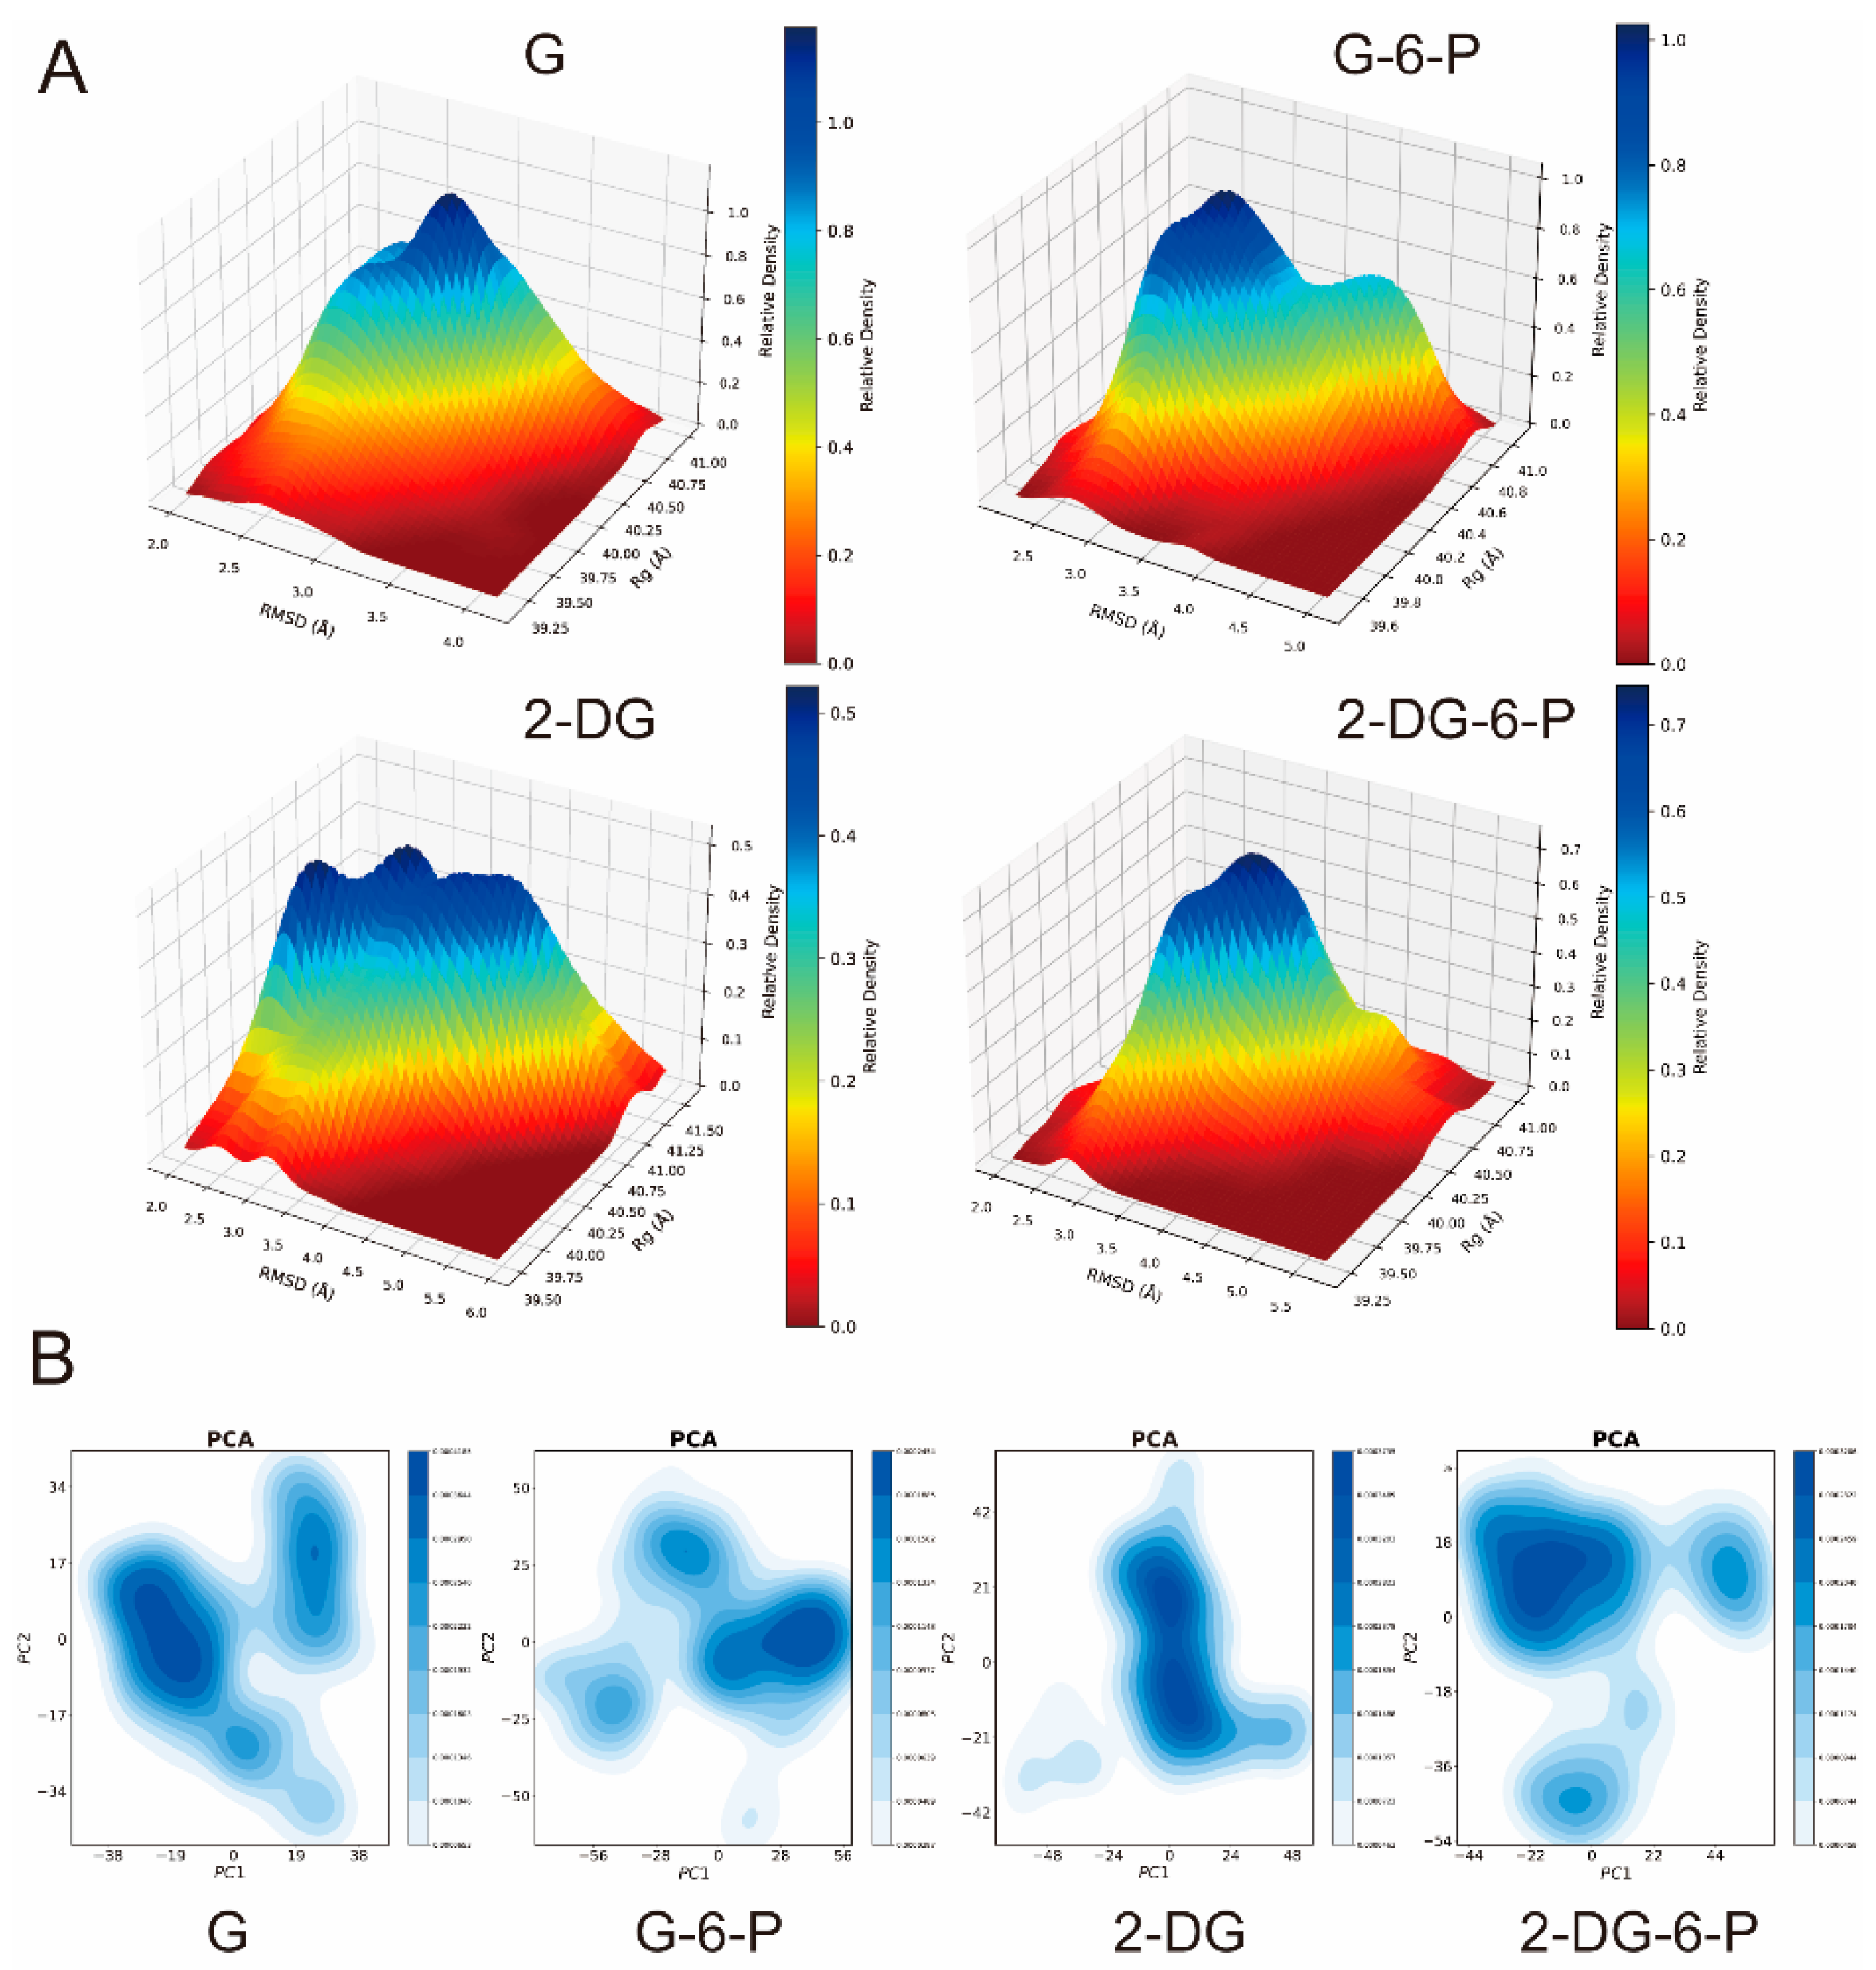
Figure 4.
The end-point complex structures and interactions from the molecular dynamic simulations of G, G-6-P, 2-DG, and 2-DG-6-P with HKI. (A) Molecular simulation results of the G-HKI complex (A1: three-dimensional structure, A2: three-dimensional interaction details at the catalytic active site; A3: two-dimensional representation of the catalytic active site); (B) Molecular simulation results of the G-6-P-HKI complex (B1: three-dimensional structure, B2: three-dimensional interaction details at the catalytic active site; B3: two-dimensional representation of the catalytic active site); (C) Molecular simulation of the 2-DG-HKI complex (C1: three-dimensional structure, C2: three-dimensional interaction details at the catalytic active site; C3: two-dimensional representation of the catalytic active site); (D) Molecular simulation results of the 2-DG-6-P-HKI complex (D1: three-dimensional structure, D2: three-dimensional interaction details at the catalytic active site; D3: two-dimensional representation of the catalytic active site).
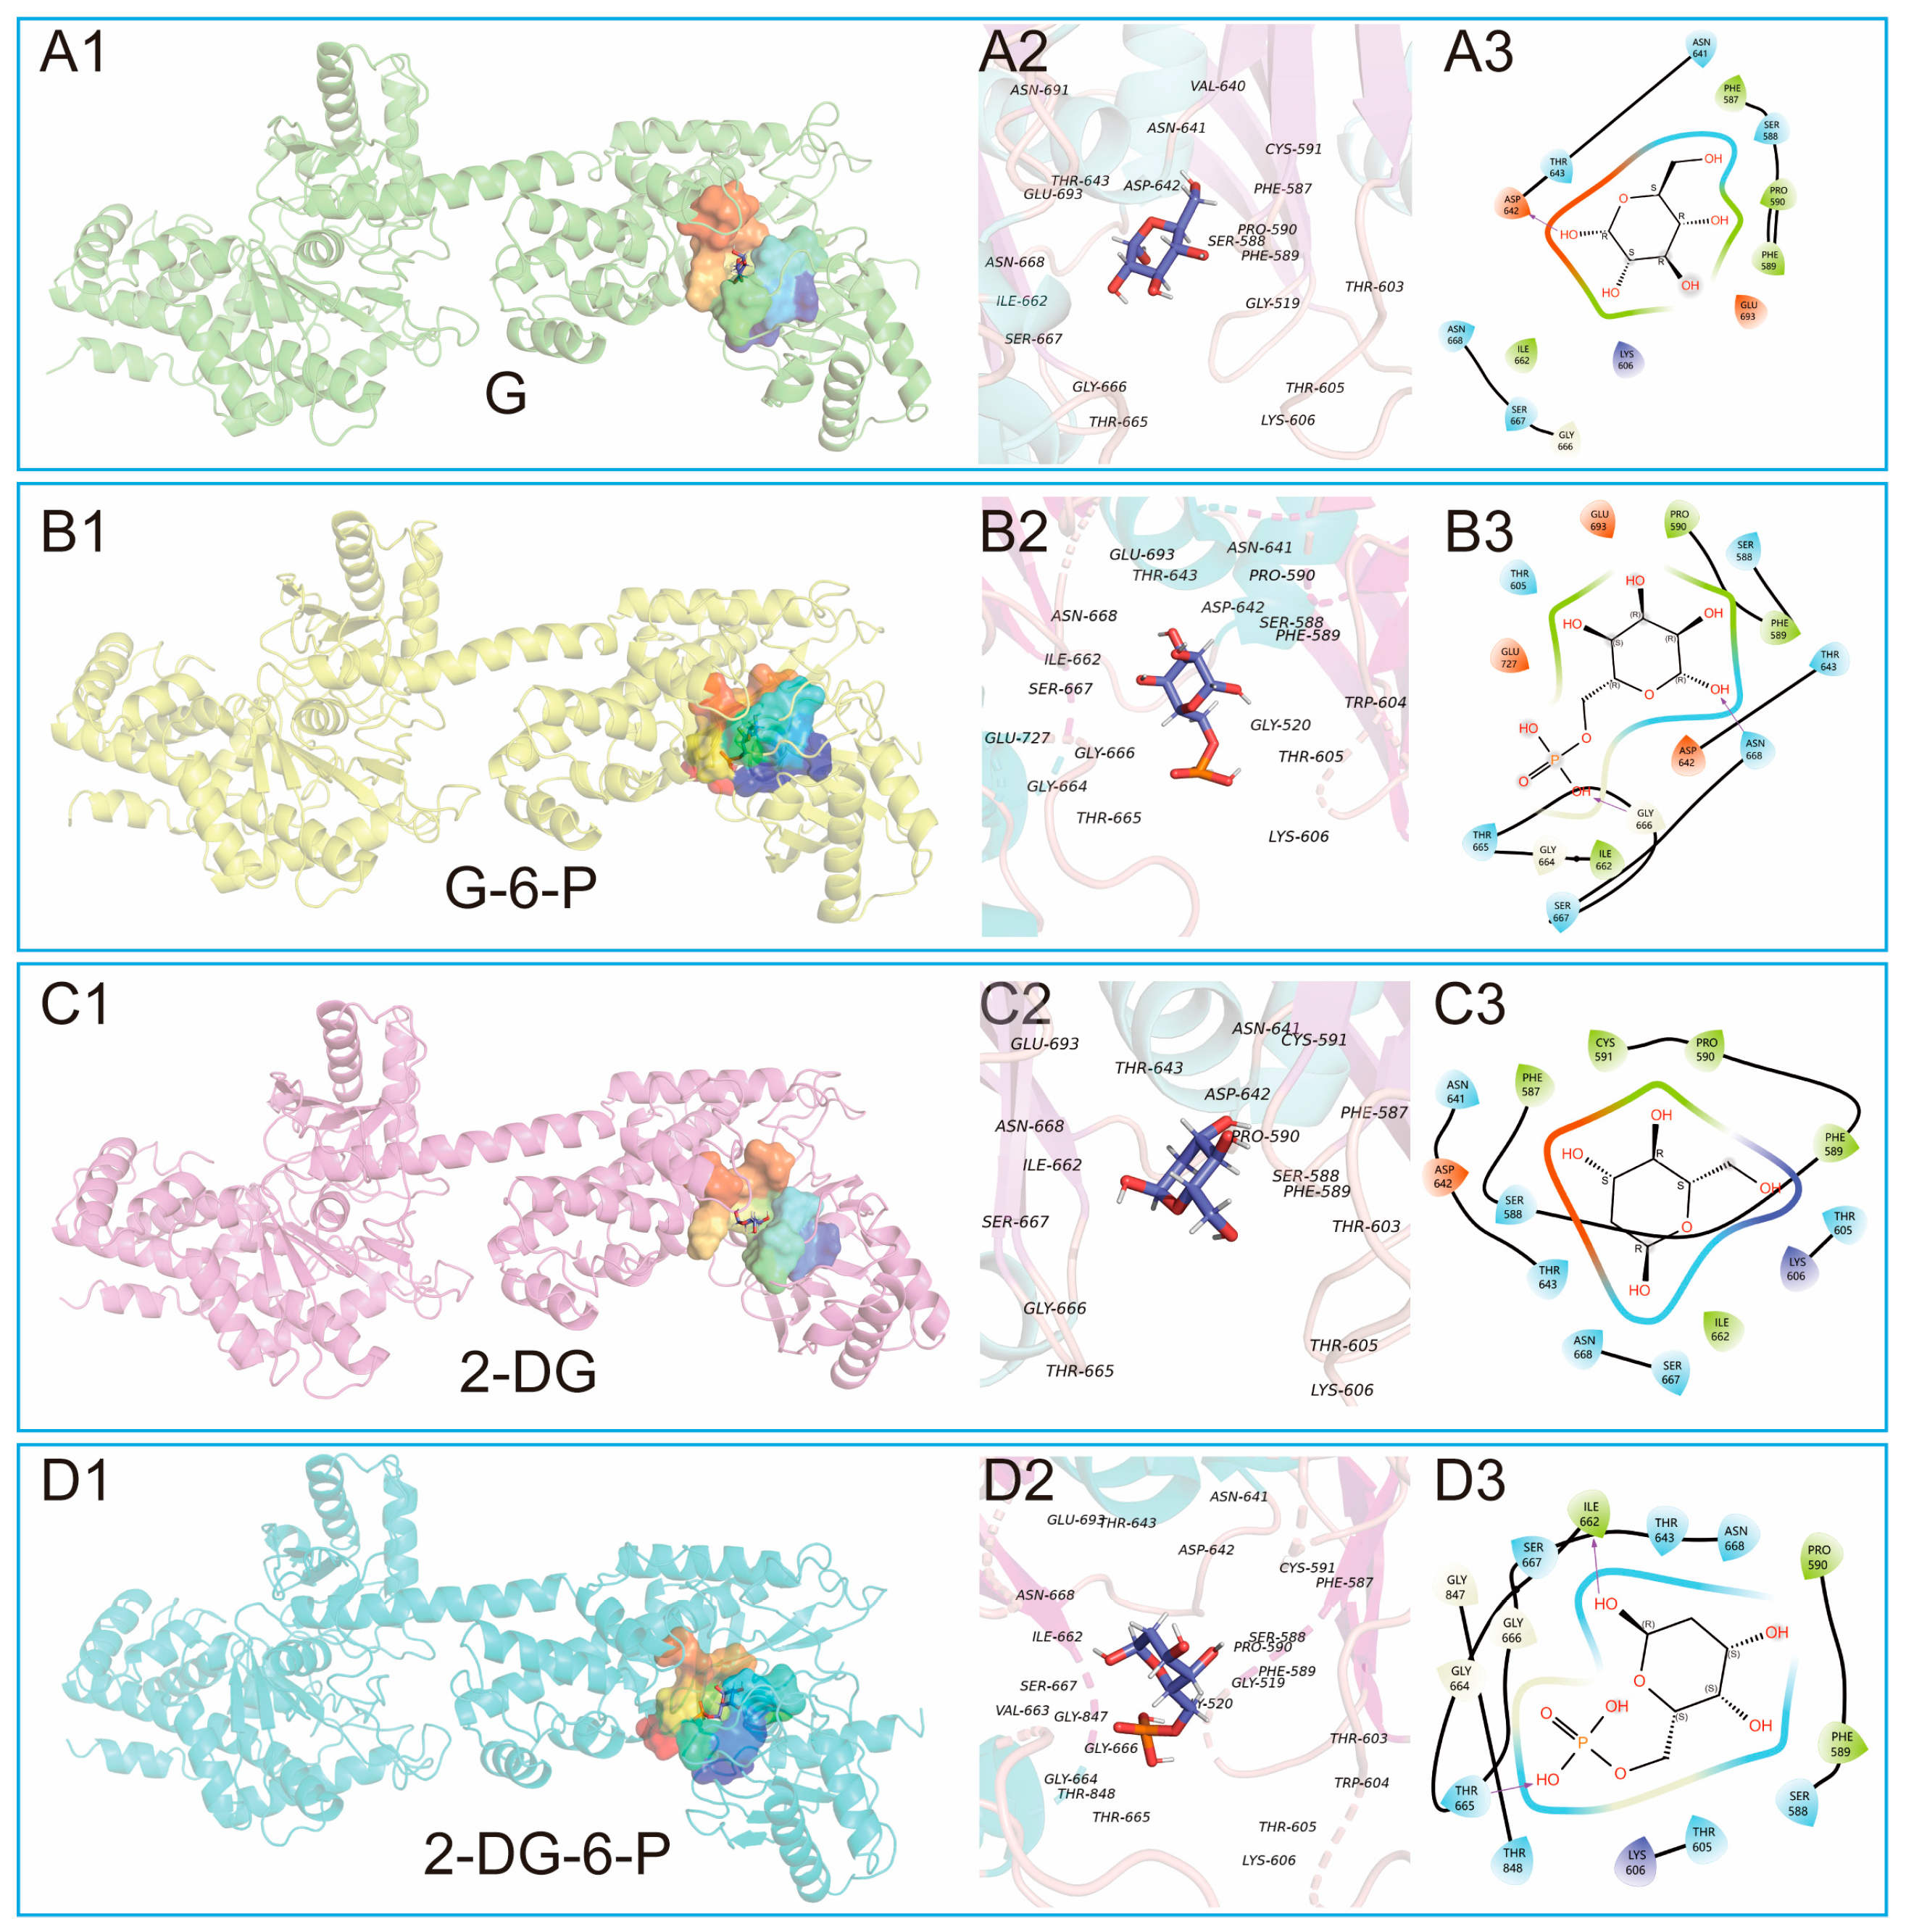
Figure 5.
Binding affinities of the end-point complexes from the molecular dynamic simulations of G, G-6-P, 2-DG, and 2-DG-6-P with HKI. (A) Affinity scores of each group's complexes; (B) The variation over time of the number of hydrogen bonds formed by each group's complexes; (C) Decomposition of the total energy contribution by different residues within the protein when interacting with the four ligands and HKI.
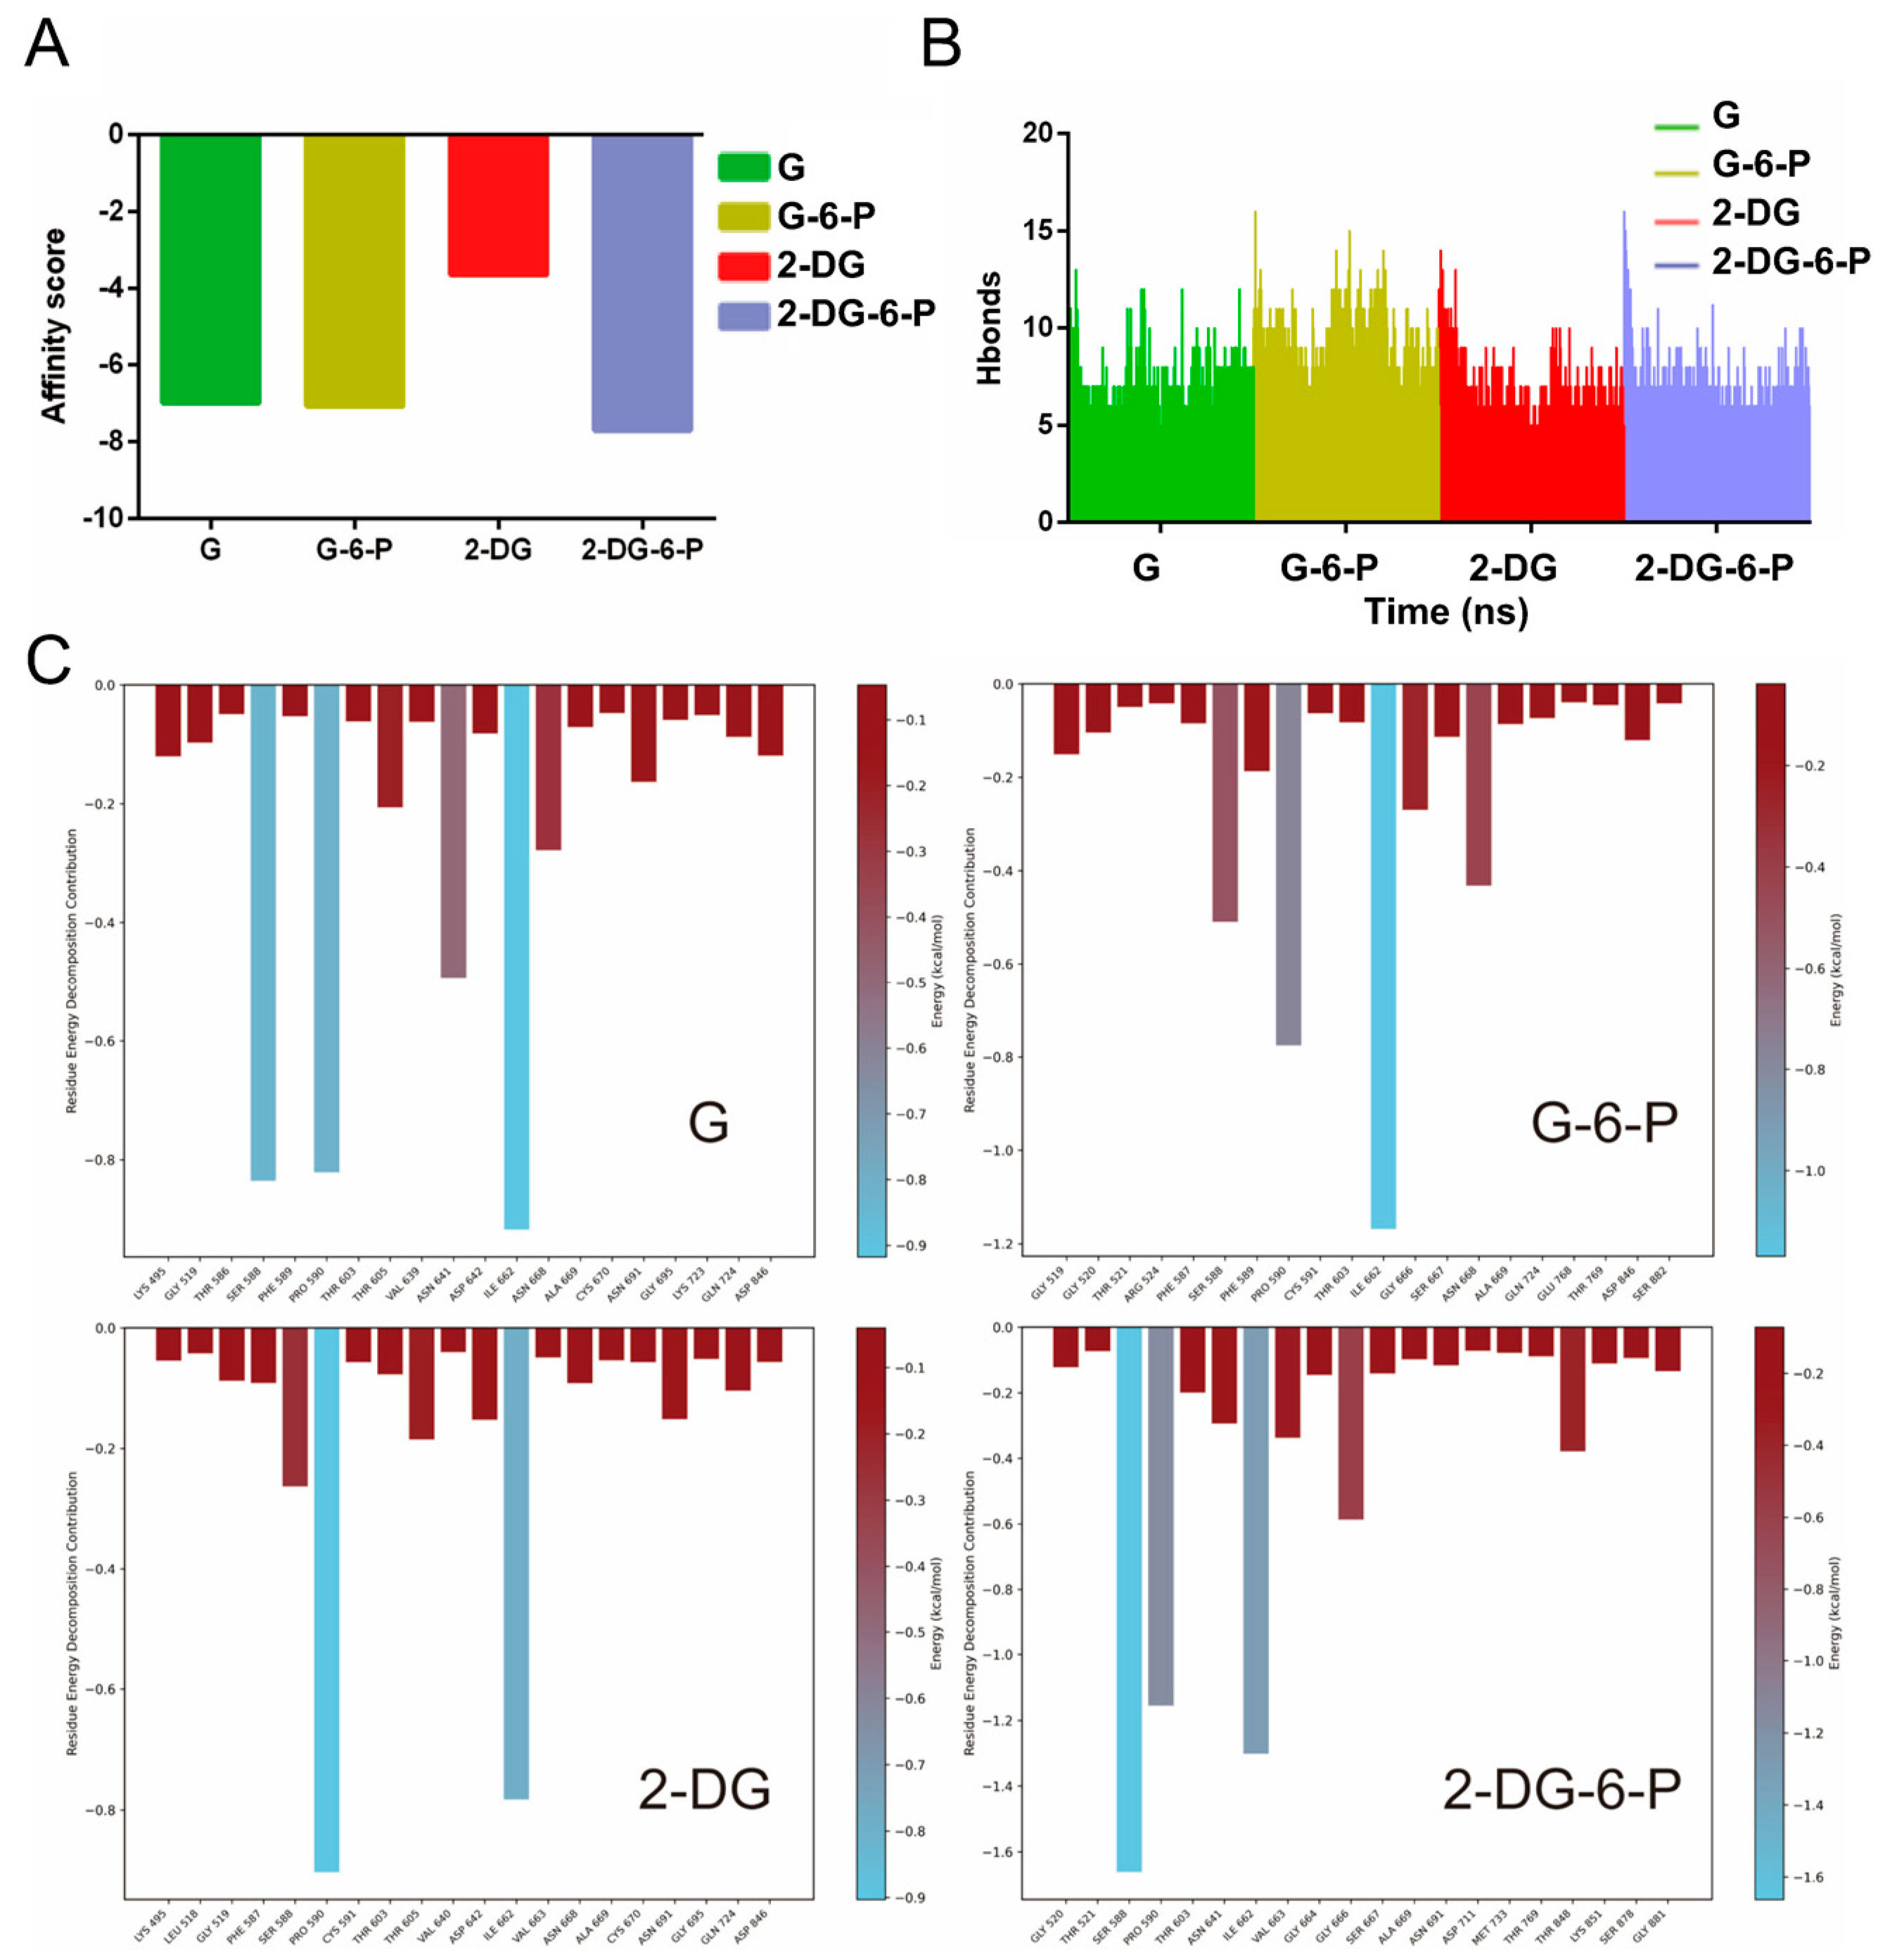
Figure 6.
Interactions of four groups of ligands with key binding residues of HKI during the simulation process. (A) Interactions of G with HKI; (B) Interactions of G-6-P with HKI; (C) Interactions of 2-DG with HKI; (D) Interactions of 2-DG-6-P with HKI.
Figure 6.
Interactions of four groups of ligands with key binding residues of HKI during the simulation process. (A) Interactions of G with HKI; (B) Interactions of G-6-P with HKI; (C) Interactions of 2-DG with HKI; (D) Interactions of 2-DG-6-P with HKI.
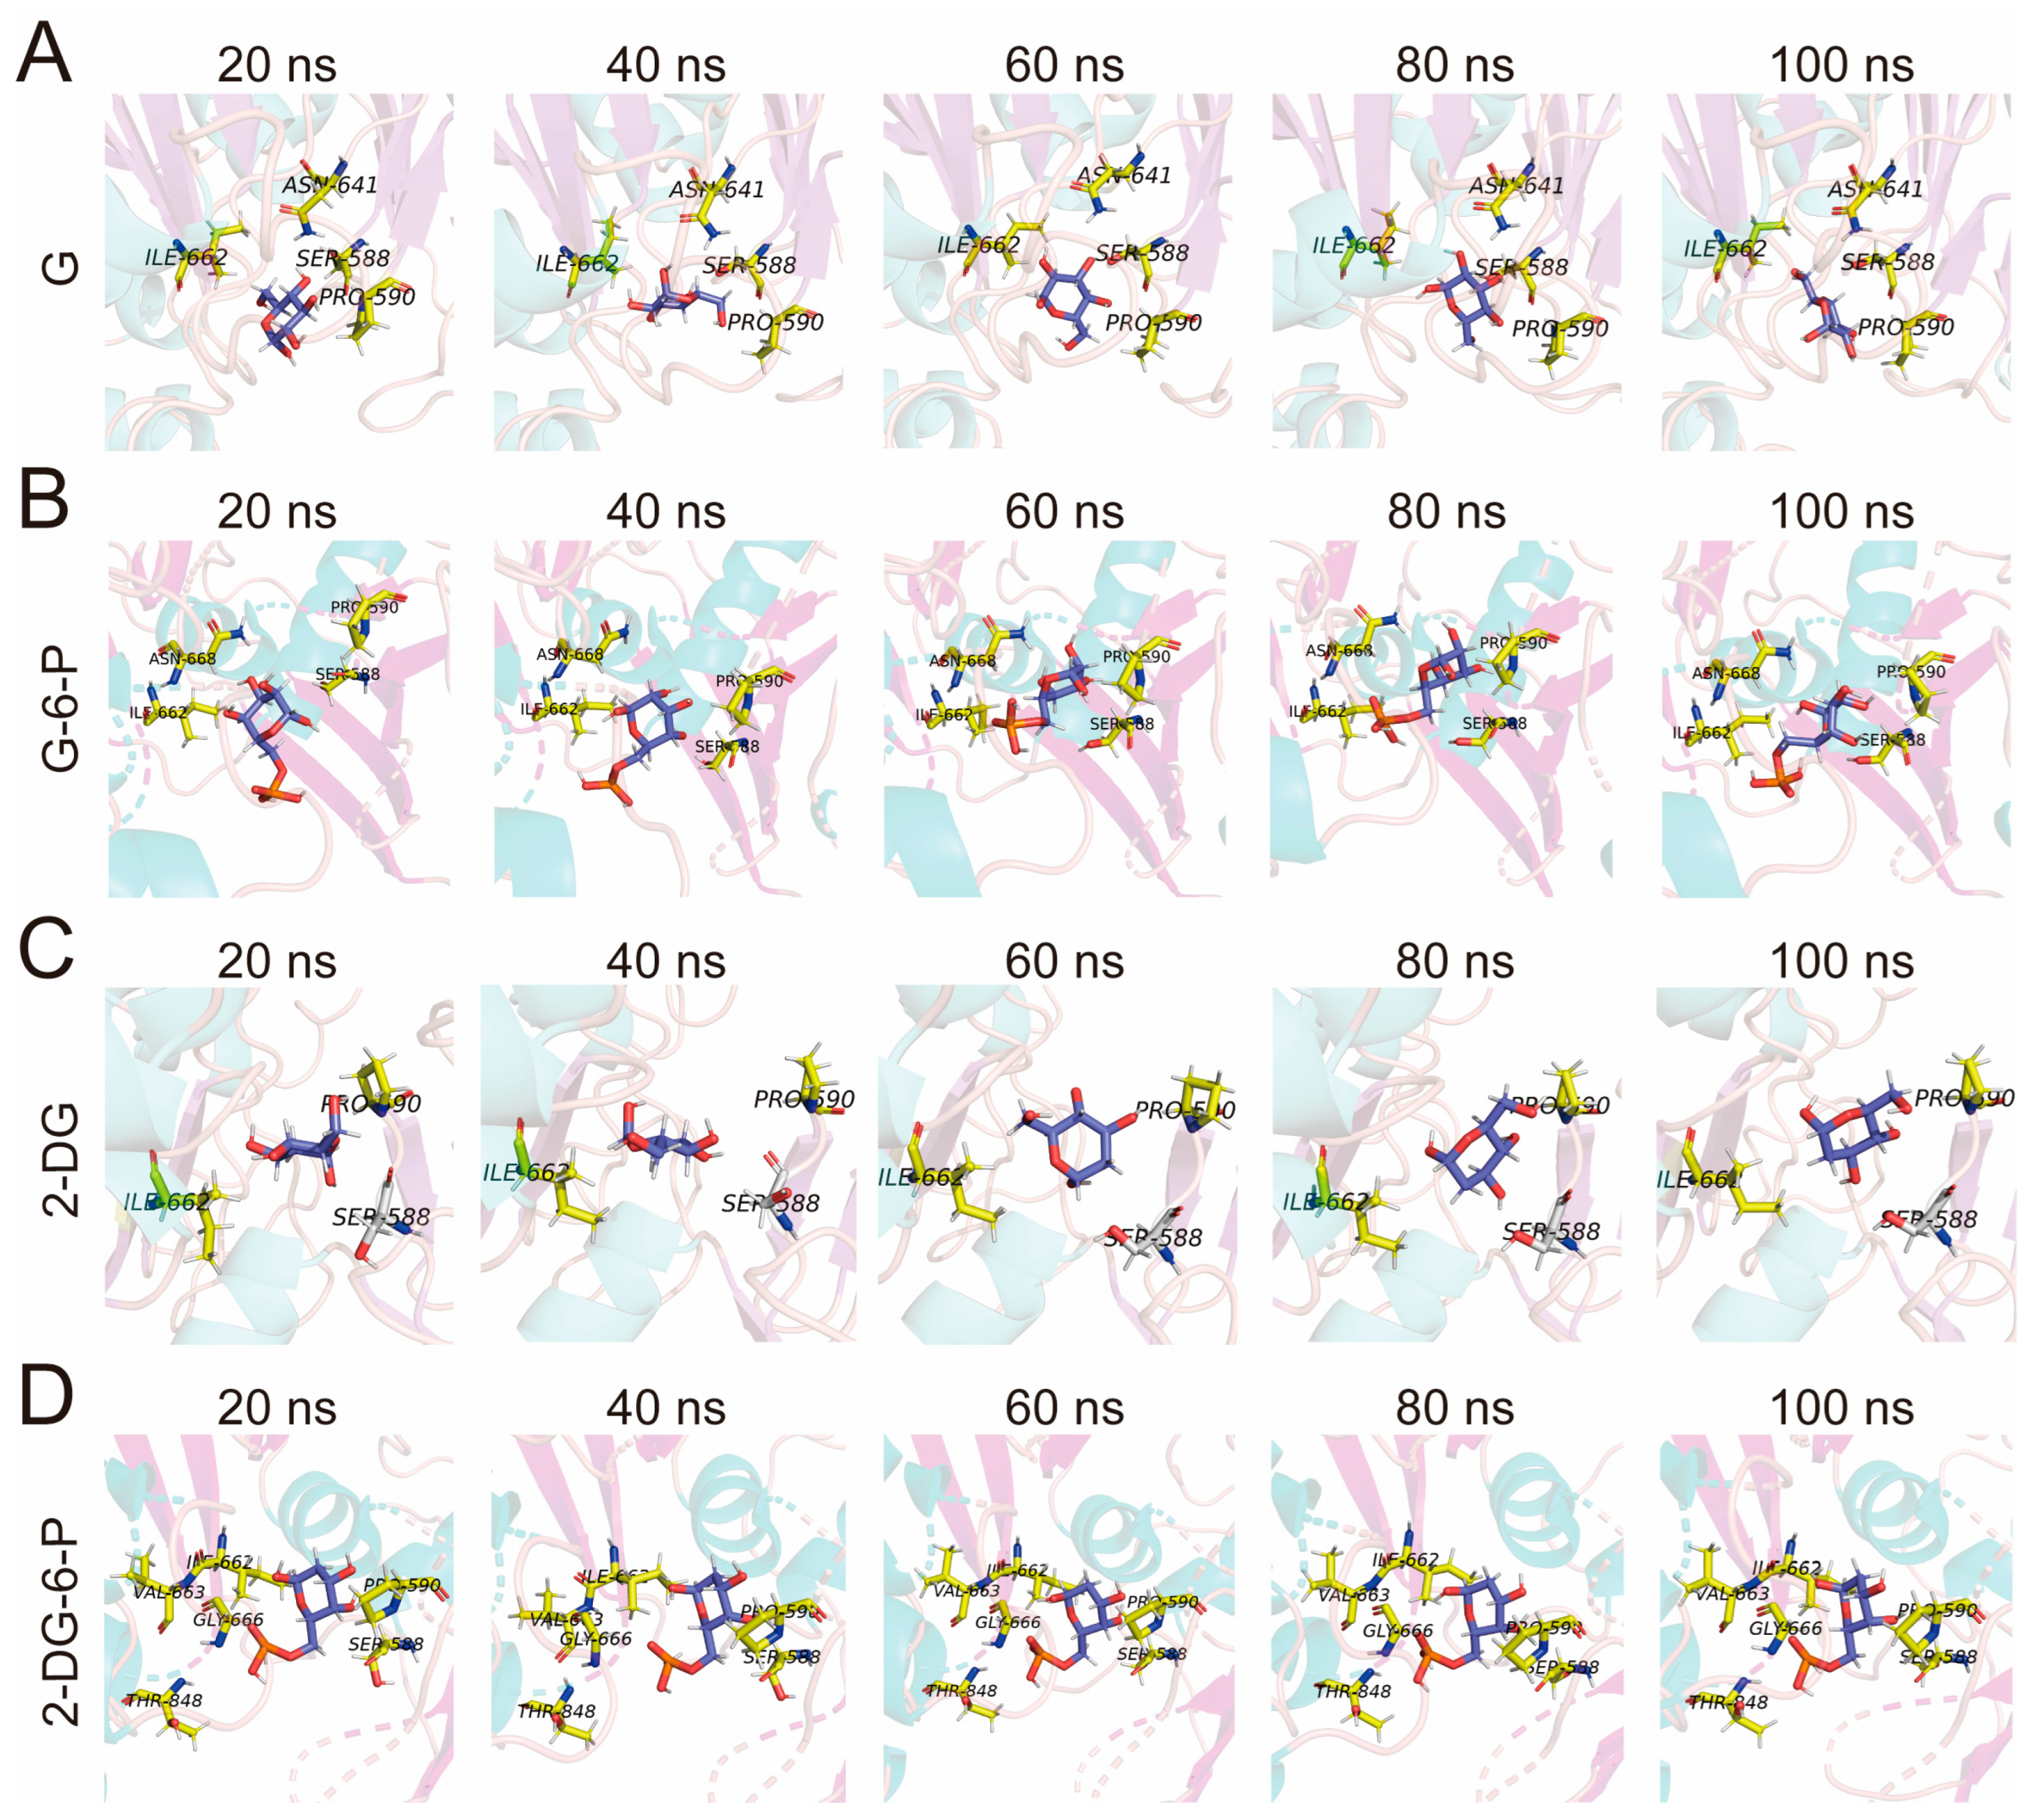
Figure 7.
Schematic diagram of the article. 2-DG significantly enhances its affinity with the active site of HKI by converting it into 2-DG-6-P, thereby effectively inhibiting glycolysis.
Figure 7.
Schematic diagram of the article. 2-DG significantly enhances its affinity with the active site of HKI by converting it into 2-DG-6-P, thereby effectively inhibiting glycolysis.
Disclaimer/Publisher’s Note: The statements, opinions and data contained in all publications are solely those of the individual author(s) and contributor(s) and not of MDPI and/or the editor(s). MDPI and/or the editor(s) disclaim responsibility for any injury to people or property resulting from any ideas, methods, instructions or products referred to in the content. |
© 2024 by the authors. Licensee MDPI, Basel, Switzerland. This article is an open access article distributed under the terms and conditions of the Creative Commons Attribution (CC BY) license (http://creativecommons.org/licenses/by/4.0/).
Copyright: This open access article is published under a Creative Commons CC BY 4.0 license, which permit the free download, distribution, and reuse, provided that the author and preprint are cited in any reuse.


