Submitted:
27 November 2024
Posted:
29 November 2024
Read the latest preprint version here
Abstract
This comprehensive review paper explores the diverse landscape of cryptocurrency forecasting, tracing its evolution from an alternative to traditional monetary systems to its significant growth in the global financial arena. It consolidates existing research by categorizing and analyzing 234 scholarly articles, organizing them into machine learning, deep learning, deep reinforcement learning, and statistical methodologies, and evaluating the related metrics. The case study titled “Examining the performance differences between backtesting and forward testing” highlights the challenges investors face, as strategies that appear effective in backtesting often fail in practical use. Another case study, “Social Data Exploration in Cryptocurrency Trends,” examines how social media data can provide insights into market movements and investor sentiment, revealing the impact of social trends on cryptocurrency prices. The findings section provides a detailed view, illuminating trends such as yearly publication rates, methodological distributions, input features, training/testing splits, the total number of data samples considered, and forecasting time horizons. This survey paper serves as a valuable resource, providing researchers and investors with a solid foundation for understanding and navigating the dynamic field of cryptocurrency forecasting.
Keywords:
Bitcoin
; Cryptocurrency Forecasting
; Machine Learning
; Deep Learning
; Reinforcement Learning
; Statistical Models
; Time Series Analysis
; Social Data Analysis
; Market Sentiment Analysis
; Backtesting
; Forward Testing
; Financial Market Prediction
1. Introduction
In human history, currency systems have always played a vital role in shaping economies, societies, and the global financial landscape. The evolution of currency systems has been continuous, progressing from ancient barter systems to modern central banks and fiat currencies [1]. Traditional monetary systems are predominantly based on fiat currencies, characterized by government and central bank control over the issuance and regulation of money. However, this system faces several challenges, including inflation risk, dependence on intermediaries like banks, and centralization. Moreover, traditional currencies may not be accessible to unbanked individuals, limiting their ability to save money, make investments, or engage in financial activities. This exclusion underscores the importance of exploring alternative economic systems to address these limitations.
Figure 1.
From bartering shells to digital wallets: the journey of currency evolution in one glance.
Figure 1.
From bartering shells to digital wallets: the journey of currency evolution in one glance.
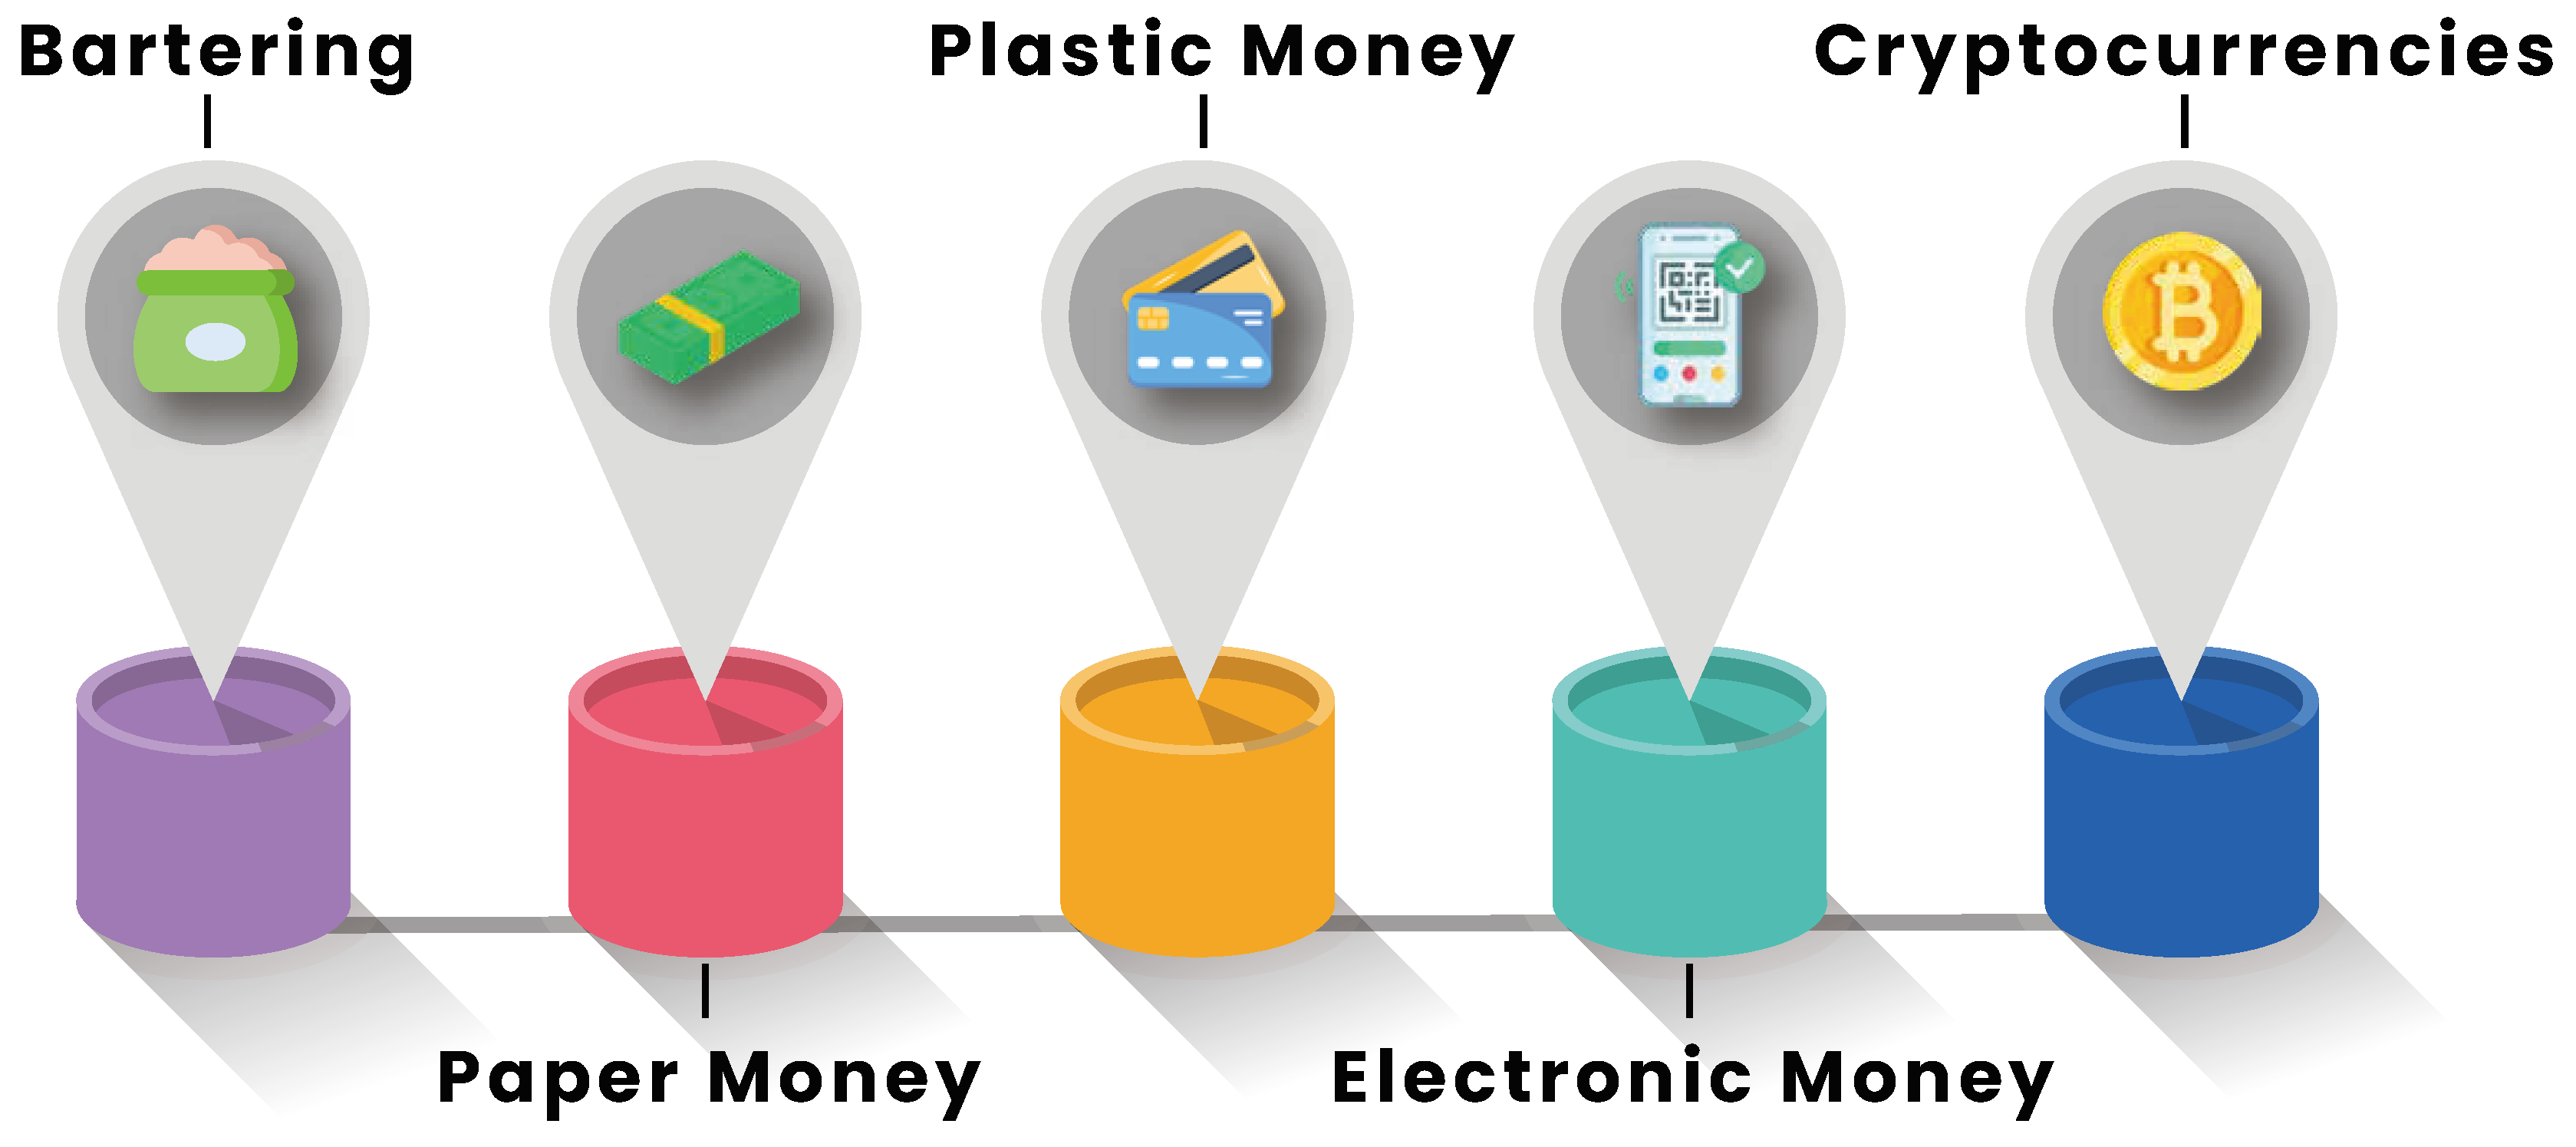

Table 1.
Abbreviations for AI models used in cryptocurrency forecasting literature
| Name | Abbreviation | Type |
|---|---|---|
| Adaptive Neuro Fuzzy Inference System | ANFIS | Machine Learner |
| Advantage Actor-Critic | A2C | Deep Reinforcement Learner |
| Artificial Neural Network | ANN | Deep Learner |
| Asymmetric Power Autoregressive Conditional Heteroskedasticity | APARCH | Statistical Learner |
| Auto Regressive Integrated Moving Average | ARIMA | Statistical Learner |
| Bidirectional Long Short-Term Memory | BiLSTM | Deep Learner |
| Binary Auto Regressive Tree | BART | Statistical Learner |
| Convolutional Neural Network | CNN | Deep Learner |
| Convolutional Neural Network Long Short-Term Memory | CNN-LSTM | Deep Learner |
| Deep Feedforward Neural Networks | DFFNNs | Deep Learner |
| Deep Q-Network | DQN | Deep Reinforcement Learner |
| Exponential Generalized Autoregressive Conditional Heteroskedasticity | EGARCH | Statistical Learner |
| Exponential Smoothing | ES | Statistical Learner |
| Extreme Gradient Boosting | XGBoost | Machine Learner |
| Financial BERT | FinBERT | Deep Learner |
| Gated Recurrent Unit | GRU | Deep Learner |
| Generalized Autoregressive Conditional Heteroskedasticity | GARCH | Statistical Learner |
| Gradient Boosting Classifiers | GBC | Machine Learner |
| K-Nearest Neighbours | KNN | Machine Learner |
| Local Gaussian Mixture Model | LGTM | Machine Learner |
| Logistic Regression | LR | Machine Learner |
| Long Short-Term Memory | LSTM | Deep Learner |
| Naive Bayes | NB | Machine Learner |
| Neural Networks | NN | Deep Learner |
| Proximal Policy Optimization | PPO | Deep Reinforcement Learner |
| Random Forest | RF | Machine Learner |
| Recurrent Neural Network | RNN | Deep Learner |
| Support Vector Machines | SVM | Machine Learner |
| Support Vector Regression | SVR | Machine Learner |
| Temporal Convolutional Network | TCN | Deep Learner |
Digital currencies can be traced in 2008 when an anonymous figure using the pseudonym Satoshi Nakamoto published a groundbreaking whitepaper “Bitcoin: A Peer-to-Peer Electronic Cash System” [2]. This whitepaper introduced a decentralized digital currency system that operates independently of traditional financial intermediaries. The year 2009 marked the birth of the first cryptocurrency Bitcoin. Bitcoin was built upon blockchain technology which revolutionized the concept of trust by relying on cryptographic proofs rather than centralized authorities. Anyone can facilitate direct peer-to-peer transactions on a blockchain network without any processing times.
The cryptocurrency market experienced a significant surge in December 2017 [?], marked by Bitcoin’s price skyrocketing to nearly $20,000, garnering global attention. This period also witnessed the emergence of numerous alternative cryptocurrencies alongside Bitcoin. Among these, Ether stands out as a notable creation introduced by Vitalik Buterin and his team in July 2015 [?]. Ether, the native cryptocurrency of the Ethereum platform, introduced groundbreaking concepts such as smart contracts, enabling developers to build decentralized applications on its blockchain. In January 2018, Ether reached an all-time high of around $1,400 [?]. It’s crucial to note that while Bitcoin primarily serves as digital currency, Ethereum is a decentralized platform facilitating various applications beyond currency, making it a prominent player in the blockchain space.
The cryptocurrency market disrupted traditional financial systems. Investors, traders, businesses, and researchers seeking tools and technologies to know about the volatility of the cryptocurrency market and earn maximum profit. Researchers have recognized the importance of cryptocurrency forecasting to uncover underlying factors driving market dynamics, adoption, and liquidity. The cryptocurrency market operates 24/7 which allows traders and investors to take advantage at any time.
The cryptocurrency boom created new exciting opportunities for investors due to its high market volatility. This volatility is due to multiple factors like speculative trading, regulatory developments, market sentiment, and macroeconomic events. Therefore 24/7 trading environment causes market volatility as compared to traditional financial markets.
Table 2.
List of cryptocurrencies and their abbreviations
| Name | Abbreviation | Name | Abbreviation |
|---|---|---|---|
| Avalanche | AVAX | Binance Coin | BNB |
| Bitcoin | BTC | Bitcoin Cash | BCH |
| Bitcoin SV | BSV | Cardano | ADA |
| Chainlink | LINK | Dogecoin | DOGE |
| Ether | ETH | Ethereum Classic | ETC |
| Litecoin | LTC | Maker | MKR |
| Monero | XMR | NEM | XEM |
| Polkadot | DOT | Polygon | MATIC |
| Ripple | XRP | Solana | SOL |
| Stellar | XLM | Tether | USDT |
| TRON | TRX | Zcash | ZEC |
This survey paper holds significant importance within the realm of cryptocurrency research and market analysis. It undertook a comprehensive examination of 234 scholarly articles about cryptocurrency forecasting. Given the inherent volatility of the cryptocurrency market, this survey offers a thorough exploration and data-driven analysis of recent research endeavors. By synthesizing a wide array of literature, this survey paper aims to furnish a comprehensive overview of prevailing trends, methodologies, and challenges in the domain of cryptocurrency forecasting. Its findings are poised to furnish invaluable insights to a diverse audience encompassing traders, investors, businesses, and researchers.
Moreover, this survey endeavors to arm its readership with a nuanced understanding of both the challenges and opportunities inherent in cryptocurrency forecasting. By serving as a conduit between academic research and practical applications, this paper endeavors to foster a deeper appreciation for the intersection of theoretical insights and real-world implementations in the cryptocurrency landscape.
2. Contribution of This Survey Article
This section highlights the significant contributions of this survey article to the field of cryptocurrency forecasting.
2.1. Existing Surveys
This survey paper highlights the lack of comprehensive surveys focused on cryptocurrency forecasting. Olvera et al. [3] conducted a study exclusively on Bitcoin price forecasting. However, their investigation was confined to Bitcoin price prediction and primarily relied on hybrid models such as ARIMA. Kervanci et al. [4] conducted a review encompassing both Machine Learning and Statistical methods for Bitcoin price forecasting, providing a broader scope compared to Olvera et al. [3] Fang et al. [5] undertook an extensive analysis of 146 research papers spanning from 2013 to June 2021, covering various aspects of cryptocurrency trading systems, crypto assets, forecasting volatility and returns, as well as addressing topics like bubbles and extreme market conditions. Their survey also delved into research trends and distributions among research objects and datasets.
Sina et al. [6] focused on forecasting cryptocurrency market volatility, albeit with a narrow emphasis on Artificial Neural Networks. Abubakar et al. [7] provided a survey specifically targeting the forecasting of digital assets using Machine Learning-based technologies from 2014 to 2022. Their review comprised 75 research articles focusing primarily on classification problems, covering aspects such as datasets, data sources, features, evaluation metrics, Machine Learning models, and model efficiency.
Biju et al. [8] conducted a bibliometric analysis of the financial sphere, specifically exploring the integration of Artificial Intelligence, Deep Learning, and Machine Learning. Utilizing the Web of Science bibliographic repository, they retrieved 723 publications from 1993 to 2022 indexed in the Social Sciences Citation Index. Their analysis revealed that institutions in the USA and China were at the forefront of applying AI and ML techniques in the financial domain. It is worth noting that they exclusively considered publications in the fields of ML and DL within the financial sphere.
2.2. Our Contributions
2.2.1. Comprehensive Coverage
One of the primary contributions of this survey is its comprehensive coverage. This survey conducted an extensive review of 234 research papers, encompassing various cryptocurrencies, including but not limited to Bitcoin, Ether, Ripple, Litecoin, and others. This broad coverage ensures that our survey provides insights into the latest developments and trends across multiple currencies.
2.2.2. Coverage of ML, DL, DRL, and Statistical Models
Our survey article covers a wide range of forecasting models, including Machine Learning, Deep Learning, Deep Reinforcement Learning, and Statistical Models. By exploring these different methodologies, this study offers readers a holistic understanding of the diverse approaches used in cryptocurrency forecasting.
2.2.3. Social Data Analysis
In addition to reviewing existing literature, this survey includes insightful case studies and analyses of social data. This study explores the impact of social media data, Google Trends, and other external factors on cryptocurrency price movements. These case studies provide practical examples and real-world insights into the complexities of cryptocurrency forecasting.
2.2.4. Investigation of Performance Disparities
This survey investigates the performance disparities between backtesting and forward-testing methodologies. By examining the effectiveness of these testing approaches, this survey sheds light on the challenges and limitations faced by cryptocurrency forecasters in practical settings.
2.2.5. Findings and Insights
Through comprehensive analysis, this survey extracts key findings and insights from the reviewed literature. These findings encompass Statistical analyses, trends, and patterns observed in cryptocurrency forecasting research. By synthesizing and presenting this information, this survey article contributes valuable knowledge to the field. Overall, this survey article offers a thorough examination of cryptocurrency forecasting, building upon existing literature and providing new insights into the field.
3. Background
In this survey paper, an exploration unfolds across key AI paradigms. Each subsection delves into the details of Machine Learning, Deep Learning, Deep Reinforcement Learning, and Statistical Learning. The goal is to break down these concepts for readers, whether new to the field or experienced, providing a clear understanding of different techniques in AI research. This paper aims to be a helpful resource, explaining how these methods work and their significance in the broader field of artificial intelligence.
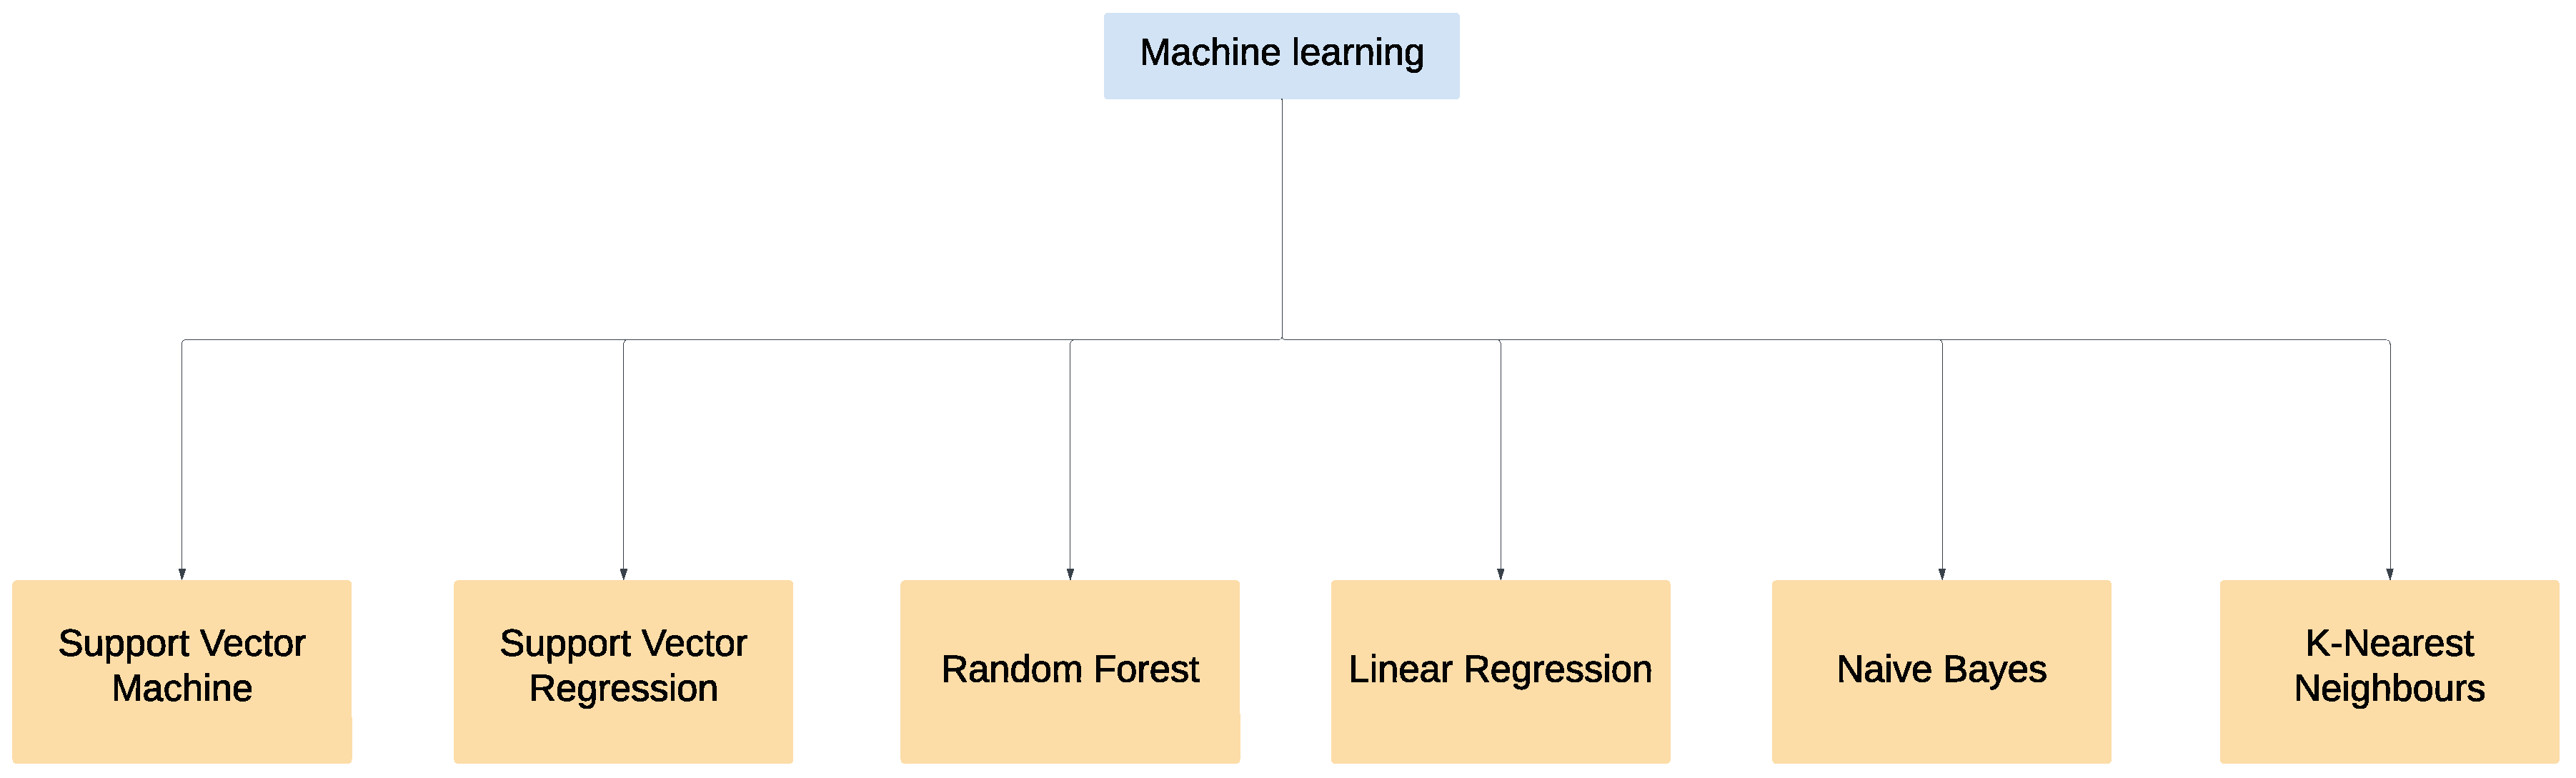
3.1. Machine Learning
Machine Learning is a diverse field with a variety of algorithms that serve as powerful tools in cryptocurrency forecasting. Each algorithm has distinct strengths, making them suitable for various tasks within the dynamic landscape of financial markets.
Figure 2.
Comprehensive overview of Machine Learning and its key algorithms. Machine Learning encompasses various algorithms including SVM, SVR, RF, LR, NB, and KNN, each representing distinct methodologies within the field.
Figure 2.
Comprehensive overview of Machine Learning and its key algorithms. Machine Learning encompasses various algorithms including SVM, SVR, RF, LR, NB, and KNN, each representing distinct methodologies within the field.
3.1.1. Support Vector Machines
Support vector machines [9] serve as robust classifiers in the ML toolkit. They excel in finding optimal decision boundaries within data, making them particularly useful for binary classification tasks in cryptocurrency analysis. SVM seeks to maximize the margin between different classes, ensuring a clear separation. In the context of cryptocurrency forecasting, SVM can effectively determine market trends, aiding traders and investors in decision-making. From a technological viewpoint, SVM employs a kernel trick to transform input data into higher-dimensional spaces, where complex relationships become more apparent. This transformation enables SVM to handle nonlinear relationships in the cryptocurrency data, providing a more nuanced understanding of market dynamics.
3.1.2. Support Vector Regression
Support vector regression [10] extends SVM’s capabilities into the realm of regression tasks. In cryptocurrency forecasting, SVR becomes a valuable ally for predicting numerical values, such as future price movements. Its ability to accommodate non-linear patterns in data makes SVR well-suited for capturing the complex dynamics of cryptocurrency markets. Technically, SVR employs support vectors and a specified epsilon-insensitive tube to guide the prediction process. The algorithm minimizes errors within this tube, allowing for flexibility in handling fluctuations in cryptocurrency prices. SVR’s adaptability and predictive accuracy make it a powerful tool for traders seeking precise forecasts.
3.1.3. Random Forest
Random forest [11] represents an ensemble learning technique in which multiple decision trees collaborate to make predictions. In the cryptocurrency realm, RF acts as a wise council of trees, each providing its opinion on potential market movements. This ensemble approach enhances prediction accuracy and robustness, making RF a reliable tool for understanding the complexities of cryptocurrency markets. At a technical level, RF constructs decision trees through a process called bagging (Bootstrap Aggregating). Each tree is trained on a subset of the data, and their collective wisdom is harnessed during the prediction phase. Moreover, RF introduces randomness during tree construction, further diversifying the perspectives considered in cryptocurrency forecasting.
3.1.4. Linear Regression
Linear regression [12] serves as a fundamental yet powerful tool for understanding the relationship between independent and dependent variables. In cryptocurrency analysis, LR becomes a guiding force in unveiling how specific factors influence market trends. For instance, it can elucidate how trading volume correlates with price movements. From a technological viewpoint, LR minimizes the sum of squared differences between observed and predicted values, finding the line (or hyperplane in multidimensional space) that best represents the relationship. This straightforward approach makes LR interpretable and valuable for identifying linear patterns in cryptocurrency data.
3.1.5. Naive Bayes
Naive Bayes [13] takes on the role of a probabilistic classifier, leveraging Bayesian principles for cryptocurrency sentiment analysis. In the vast sea of discussions surrounding cryptocurrencies, NB acts as a clever detective, discerning positive or negative sentiments from textual data. Technically, NB assumes that features are conditionally independent, simplifying the computation of probabilities. Cryptocurrency sentiment analysis processes textual data to estimate the probability of positive or negative sentiment. NB’s simplicity, efficiency, and effectiveness in handling large datasets make it a valuable asset in understanding market sentiment.
3.1.6. K-Nearest Neighbors
K-Nearest Neighbors [14] is a versatile algorithm employed in both classification and regression tasks. In the context of cryptocurrency forecasting, KNN acts as a neighborly guide, making predictions based on the majority class or average of its k-nearest data points. From a technological viewpoint, KNN relies on distance metrics, such as Euclidean or Manhattan distance, to determine the proximity of data points. The algorithm then classifies or predicts based on the collective behavior of its neighbors. KNN’s simplicity and adaptability make it a useful tool, especially in scenarios where local patterns in cryptocurrency data are crucial for accurate predictions.
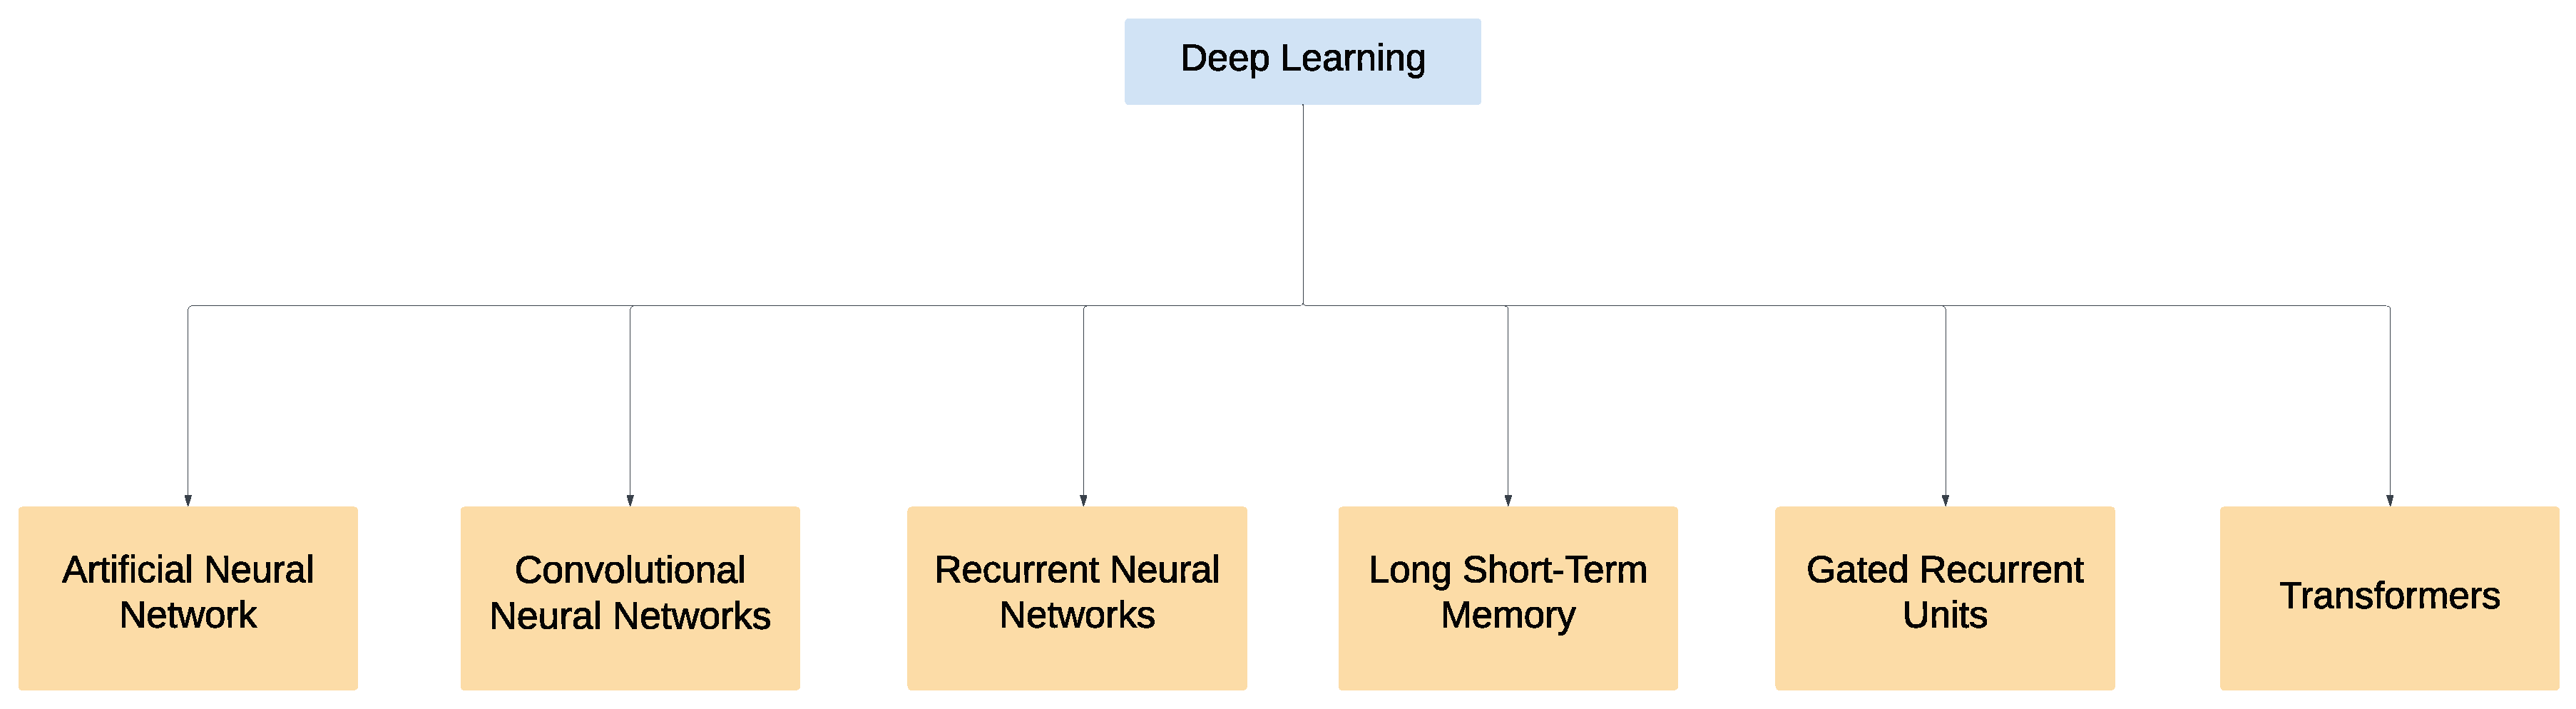
3.2. Deep Learning
Deep Learning [15] is a powerful tool in the world of cryptocurrency forecasting. It has lots of different methods, and each one is good at different tasks. They’re good at spotting tricky patterns in cryptocurrency data, which helps make better predictions about what might come next in the digital money world.
Figure 3.
Deep Learning encompasses a diverse array of architectures including artificial neural networks, Convolutional Neural Networks, Recurrent Neural Networks, Long Short-Term Memory networks, gated recurrent units, and transformers. Each architecture represents a unique paradigm within Deep Learning, collectively shaping the landscape of modern artificial intelligence.
3.2.1. Artificial Neural Network
Artificial neural networks [16] are computational models inspired by the structure and functioning of the human brain. Comprising interconnected nodes organized into layers, ANNs are designed to process and learn from data, making them powerful tools for a diverse range of tasks. Each node takes in information, processes it, and gives an answer. When we train the network by showing it examples, it gets better at understanding complex patterns and connections in the data. ANNs can learn from one set of data and then use that knowledge to make predictions or sort things out in new, unseen data. They’re super versatile, helping with tasks like recognizing pictures, understanding language, looking at trends over time, and solving all kinds of tricky problems by learning and recognizing patterns.
3.2.2. Convolutional Neural Networks
A convolutional neural network [17] is a neural network that is specially designed for understanding image data. Imagine we have a picture of a cat and each small piece of image has some details like colors and shapes. Convolutional neural network process at each small piece and then put all these small pieces together to understand the whole image. Convolutional neural network uses special filters to understand specific parts of the image such as zooming in, sharpening, etc. Convolutional neural networks can be used in lots of places like recognizing faces, and in self-serving cars to figure out what is around them. CNN also has applications beyond visual data it can also be effectively implemented for time series analysis.
3.2.3. Recurrent Neural Networks
RNNs [18] are a class of artificial neural networks that is specifically designed to understand and work with data that comes in a specific order, making them particularly well-suited for tasks such as natural language processing, time series analysis, and speech recognition. The special thing about RNNs is that they remember stuff from the past and use it to make sense of what’s happening next. Imagine reading a story– you need to remember what happened in the beginning to understand the later parts. RNNs do something similar with data. This recurrent structure enables RNNs to capture sequential dependencies, making them particularly valuable in scenarios where the order of input data is crucial. Sometimes, they struggle to learn if the information is too far back in the past or if it becomes too big. We call these problems the vanishing and exploding gradient problems. It’s like trying to remember something from a really long time ago – it can be tough for the program. Even though there are challenges, RNNs are super useful. RNNs find application in a wide array of fields, including natural language processing, speech recognition, and time series analysis. This ability of RNNs to understand and remember sequential dependencies makes them valuable in tasks where understanding the context and order of input data is essential.
3.2.4. Long Short-Term Memory
A specialized variant of Recurrent Neural Networks is designed to address the challenges of modeling long-term dependencies in sequential data. LSTMs [18] have gained prominence in various applications due to their unique architecture, allowing for improved information retention and selective processing over extended time intervals. The key innovation of LSTMs lies in their ability to mitigate the vanishing gradient problem, a limitation in traditional RNNs. LSTMs achieve this through a more complex architecture involving specialized memory cells, and input, forget, and output gates. These components allow LSTMs to selectively retain or discard information over different time steps, facilitating the modeling of both short and long-term dependencies. The selective memory retention mechanism of LSTMs equips them with the ability to capture and remember patterns over extended time intervals. This feature makes LSTMs particularly well-suited for tasks where understanding long-term dependencies is essential, such as natural language processing, speech recognition, and time series analysis.
3.2.5. Gated Recurrent Units
Gated recurrent units [19] are a type of Recurrent Neural Network architecture, and they’re like smart memory systems for computers. Inspired by the way our brains remember and forget information, GRUs are designed to capture and store important details from past data. In a GRU, information is processed through special gates that decide what to keep and what to forget. These gates help the network learn and remember over time. This makes them useful for tasks like understanding the context in language, predicting future values in time series data, or anything where remembering and adapting to past information is important.
3.2.6. Transformers
Transformers [20] refers to a type of neural network architecture introduced to handle sequential data more efficiently, with a particular focus on natural language processing tasks. Transformers consist of an encoder-decoder structure, where the encoder processes input data and the decoder generates output. The Transformer architecture has been highly successful in tasks such as language translation, text summarization, various natural language understanding applications, and notably, time series analysis.
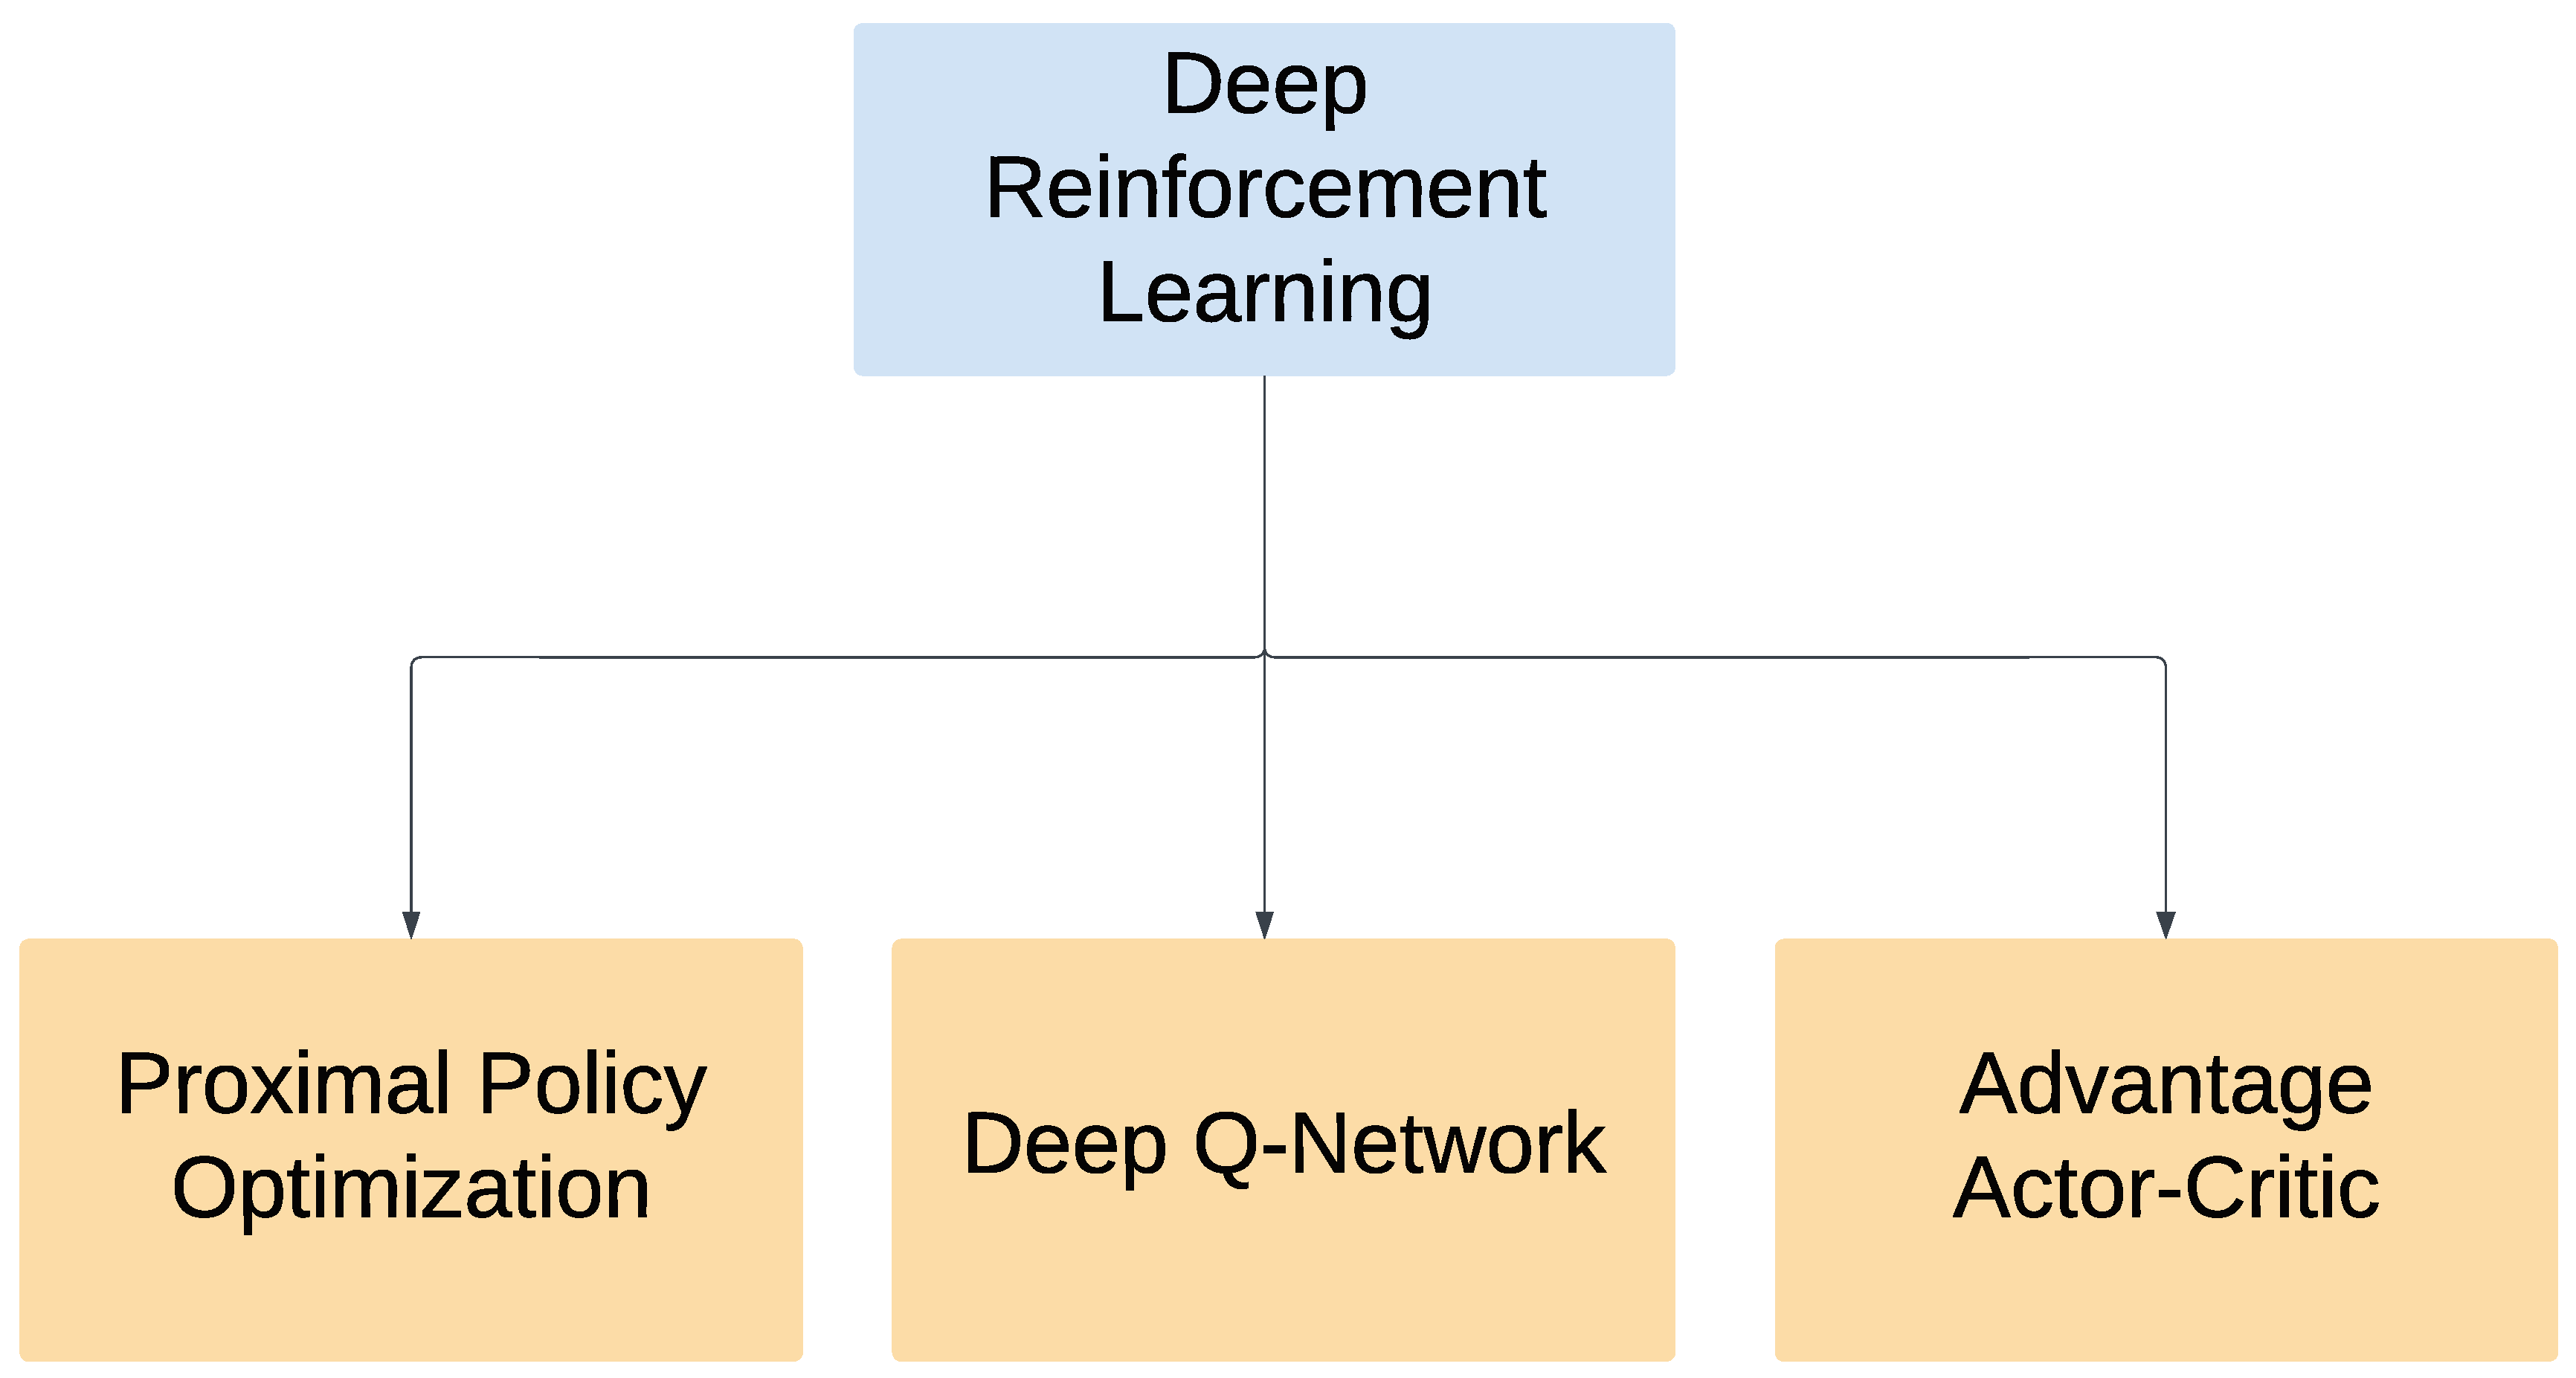
3.3. Deep Reinforcement Learning
Deep reinforcement learning! [21] brings a level of sophistication to cryptocurrency forecasting by combining neural networks with reinforcement learning principles. These algorithms learn optimal strategies through interactions with the environment, making them well-suited for dynamic and evolving cryptocurrency markets.
Figure 4.
Illustration demonstrating the breadth of Deep Reinforcement Learning algorithms, encompassing various techniques and methodologies.
Figure 4.
Illustration demonstrating the breadth of Deep Reinforcement Learning algorithms, encompassing various techniques and methodologies.
3.3.1. Proximal Policy Optimization
Proximal policy optimization [22] acts as a smart assistant in the DRL toolkit. It belongs to the family of policy optimization algorithms that focus on iteratively improving the policy governing an agent’s actions. In cryptocurrency trading, PPO continuously refines trading strategies by efficiently utilizing past experiences. Technically, PPO incorporates a clipped surrogate objective, preventing policy updates from deviating too far from the current policy. This stability ensures safer exploration and exploitation in the volatile cryptocurrency market. PPO’s adaptability and ability to handle continuous action spaces make it a valuable asset for refining trading strategies.
3.3.2. Advantage Actor-Critic
Advantage actor-critic [23] operates as a dynamic duo within DRL. This algorithm combines elements of policy iteration and value iteration, with an actor suggesting actions and a critic evaluating the quality of those actions. A2C’s collaborative approach enhances the learning process by providing a balance between exploration and exploitation. From a technological viewpoint, the actor determines the optimal policy, while the critic estimates the value of state-action pairs. By leveraging advantages (differences between actual and expected returns), A2C fine-tunes strategies for navigating the intricate landscape of cryptocurrency markets. The algorithm’s ability to adapt to changing conditions makes it a valuable tool for real-time decision-making.
3.3.3. Deep Q-Network
Deep Q-Network [21] stands out as a fearless explorer in the DRL domain. It operates on the principles of Q-learning [24], using a deep neural network to approximate the Q-function, which represents the expected cumulative reward for taking a particular action in a given state. Technically, DQN employs experience replay and target networks to stabilize training and improve sample efficiency. Experience replay involves storing and randomly sampling past experiences, facilitating better exploration and learning. DQN’s capacity to make decisions based on learned experiences makes it adept at navigating the intricate and ever-changing landscape of cryptocurrency markets.
3.4. Statistical Learning
Statistical models have a rich history in financial forecasting, and cryptocurrency markets are no exception. In this section, this survey reviews research that relies on Statistical models, such as autoregressive integrated moving averages, GARCH, and regression analysis, to predict cryptocurrency prices and trends. This survey analyzes the efficacy of Statistical approaches, their limitations, and their place in the landscape of cryptocurrency forecasting.
3.4.1. Autoregressive Integrated Moving Average
The Autoregressive integrated moving average [25] model is a fundamental Statistical method extensively applied in financial forecasting, including cryptocurrency markets. ARIMA models are particularly adept at analyzing and predicting time-series data by incorporating the autoregressive, differencing, and moving average components. The autoregressive facet elucidates the correlation between an observation and its preceding values, while differencing transforms non-stationary data into a stationary form to stabilize the mean. The moving average component captures the error of the model as a linear combination of past error terms. In cryptocurrency forecasting, ARIMA models excel at capturing short-term trends and patterns based on historical price data.
3.4.2. Generalized Autoregressive Conditional Heteroskedasticity
Generalized Autoregressive Conditional Heteroskedasticity [26] models are pivotal tools in financial time series analysis, renowned for their ability to model and forecast volatility, a crucial aspect of cryptocurrency markets. GARCH models extend the autoregressive conditional heteroskedasticity model by encompassing time-varying volatility dynamics. In cryptocurrency forecasting, where volatility fluctuations are prevalent, GARCH models provide invaluable insights into the evolving risk landscape. By capturing volatility clustering and persistence, GARCH models aid investors and analysts in comprehending and managing risk exposure within cryptocurrency portfolios.
4. Methodological Landscape in Cryptocurrency Forecasting Literature
In cryptocurrency forecasting, the past decade has glimpsed an outbreak of research activity. As cryptocurrencies continue to reshape the financial sphere, scholars and practitioners alike have ventured into the depths of historical data, employing a diverse array of methodologies to decipher price trends, market dynamics, and investment opportunities.
This comprehensive survey, containing a comprehensive analysis of 234 research papers, is poised to unravel the multifaceted landscape of cryptocurrency forecasting. The survey will systematically present the literature review, categorized by the methodologies employed, offering insights into the evolution and current state of this dynamic field. The approaches considered include Machine Learning, Deep Learning, Statistical Models, and Deep Reinforcement Learning. Each category represents a unique aspect of the methodologies adopted by researchers in their quest to forecast cryptocurrency movements.
As this study ventures on this journey through the cryptocurrency forecasting literature, this study will delve into the specific insights, trends, and challenges presented by each of these methodological approaches, providing readers with a holistic perspective on the vast and developing landscape of cryptocurrency prediction. Exploring the methodological landscape of Machine Learning literature further, this survey analyzes the distribution of publications across key methodologies.
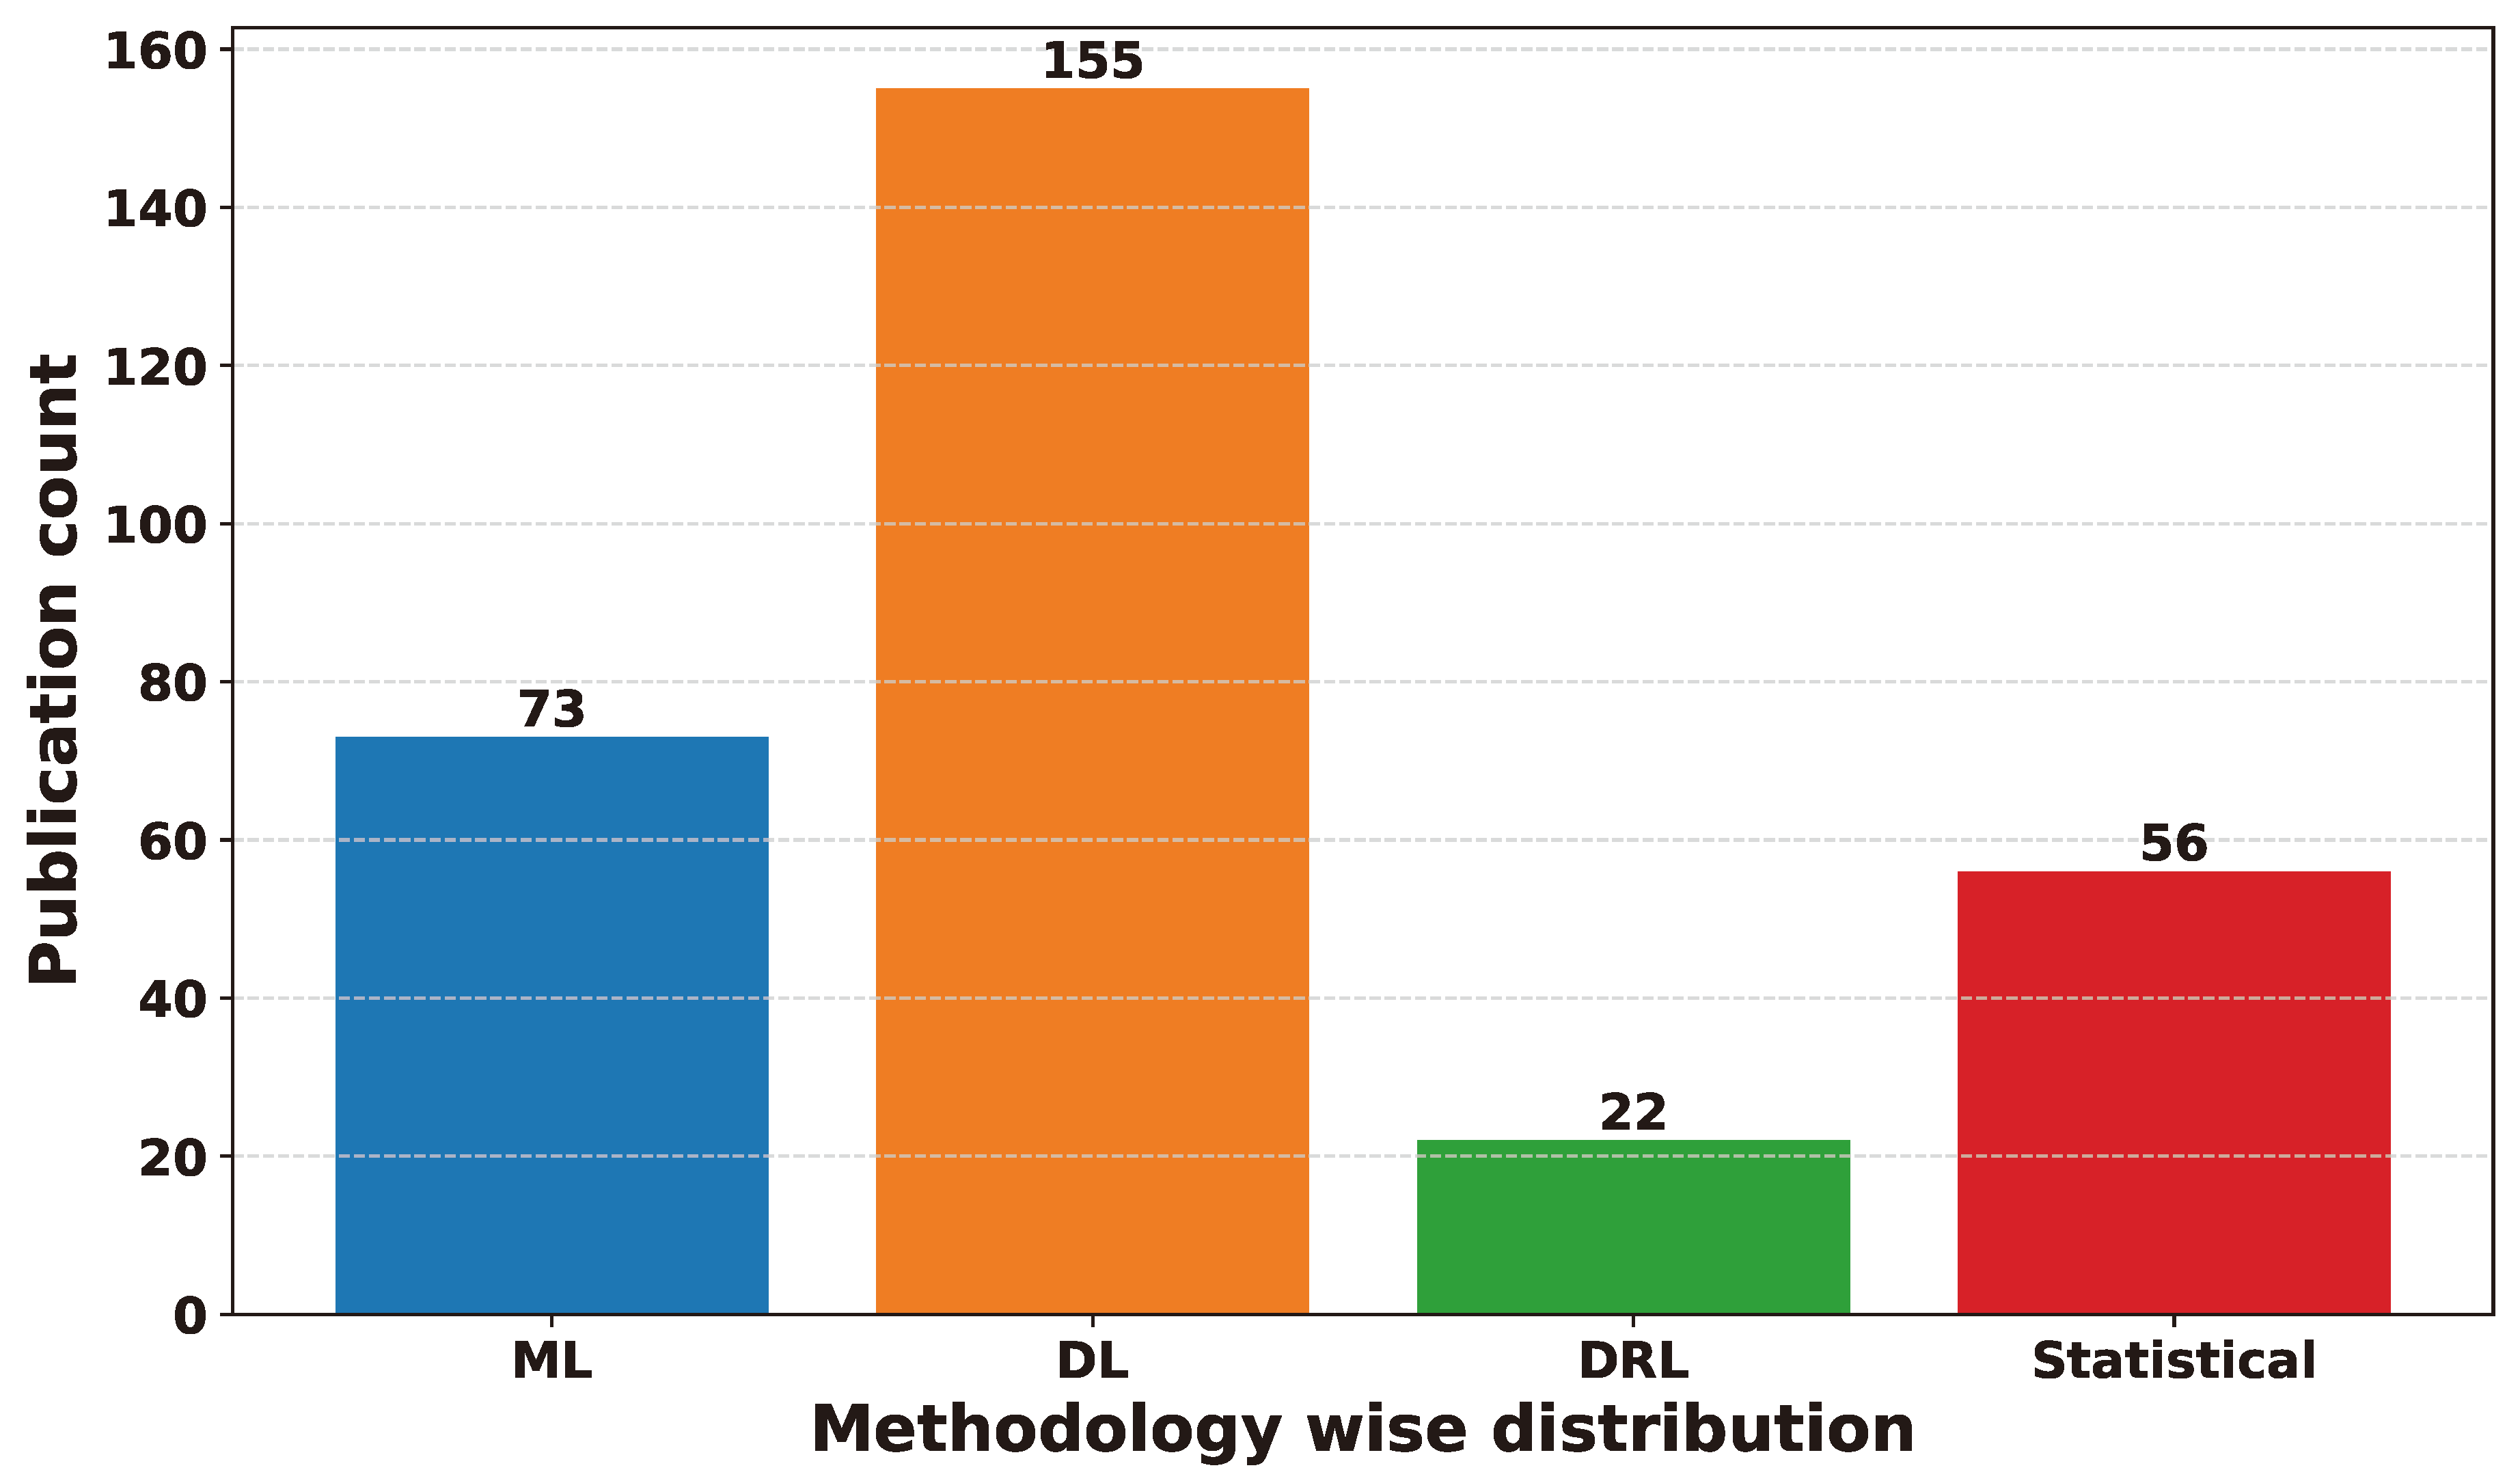
Figure 5 visualizes the prevalence of different approaches, with the y-axis indicating the count of publications and the x-axis representing categories including Deep Learning, Machine Learning, Deep Reinforcement Learning, and Statistical methods. Deep Learning emerges as the most frequently employed methodology, with the longest bar indicating its prevalence in current research. Machine Learning follows closely behind, reflecting its sustained relevance in the field. Statistical methods exhibit a significant presence, albeit less pronounced compared to DL and ML. Deep Reinforcement Learning shows the shortest bar, indicating its comparatively lesser utilization in recent literature. Figure 5 distribution sheds light on the dominant methodologies driving Machine Learning research, offering insights into the evolving landscape of techniques and approaches.
Figure 5.
Frequency of research papers across learning domains: Machine Learning, Deep Learning, Deep Reinforcement Learning, and Statistical Learning for cryptocurrency forecasting
Figure 5.
Frequency of research papers across learning domains: Machine Learning, Deep Learning, Deep Reinforcement Learning, and Statistical Learning for cryptocurrency forecasting
5. Use of ML in Cryptocurrency Forecasting
In this section, this survey will delve into the comprehensive body of research that harnesses machine-learning methodologies for cryptocurrency forecasting. ML, with its ability to identify patterns and relationships within vast datasets, has become a cornerstone of predictive analytics in the cryptocurrency domain. Machine Learning is a fascinating field in computer science that empowers computers to understand and make decisions from data, much like how humans learn from experience. At its core, ML is about building algorithms that can automatically identify patterns, make predictions, or take actions without being explicitly programmed to do so. It works by providing a computer with a large amount of data, allowing it to discover hidden insights and relationships within that data. Think of ML as teaching a computer to recognize cats in photos by showing it thousands of cat images until it learns the defining features of a cat. Once trained, an ML model can generalize its knowledge to identify cats in new, unseen images.
The Section 5 unfolds into three distinct categories, each offering a specialized perspective on the application and evolution of Machine Learning in cryptocurrency forecasting. Firstly, Section 5.1, the detailed analysis and trends in Machine Learning studies examine the methodological intricacies and emerging patterns prevalent in recent research endeavors. Secondly, Section 5.2, studies utilizing Machine Learning for cryptocurrency delve into specific case studies and methodologies employed to forecast digital asset prices. Lastly, Section 5.3, the summarized literature review of Machine Learning approaches encapsulates a synthesis of existing literature, distilling key insights and advancements in the field. Together, these subsections provide a comprehensive overview of the landscape, facilitating a deeper understanding of the complexities and innovations driving Machine Learning applications in cryptocurrency forecasting.
5.1. Detailed Analysis and Trends in Machine Learning Studies
In this dedicated section, the utilization of Machine Learning techniques to predict changes in the cryptocurrency market will be explored. Machine Learning involves the application of algorithms and Statistical models to analyze data, identify patterns, and make predictions without explicit programming. This study will delve into the specific methods used, the cryptocurrencies that are commonly analyzed, and how researchers consider time-related factors to improve prediction accuracy. By examining these aspects, this study aims to elucidate the significance of Machine Learning in comprehending and forecasting trends within the cryptocurrency market.
5.1.1. Methodological Trends in Machine Learning Literature
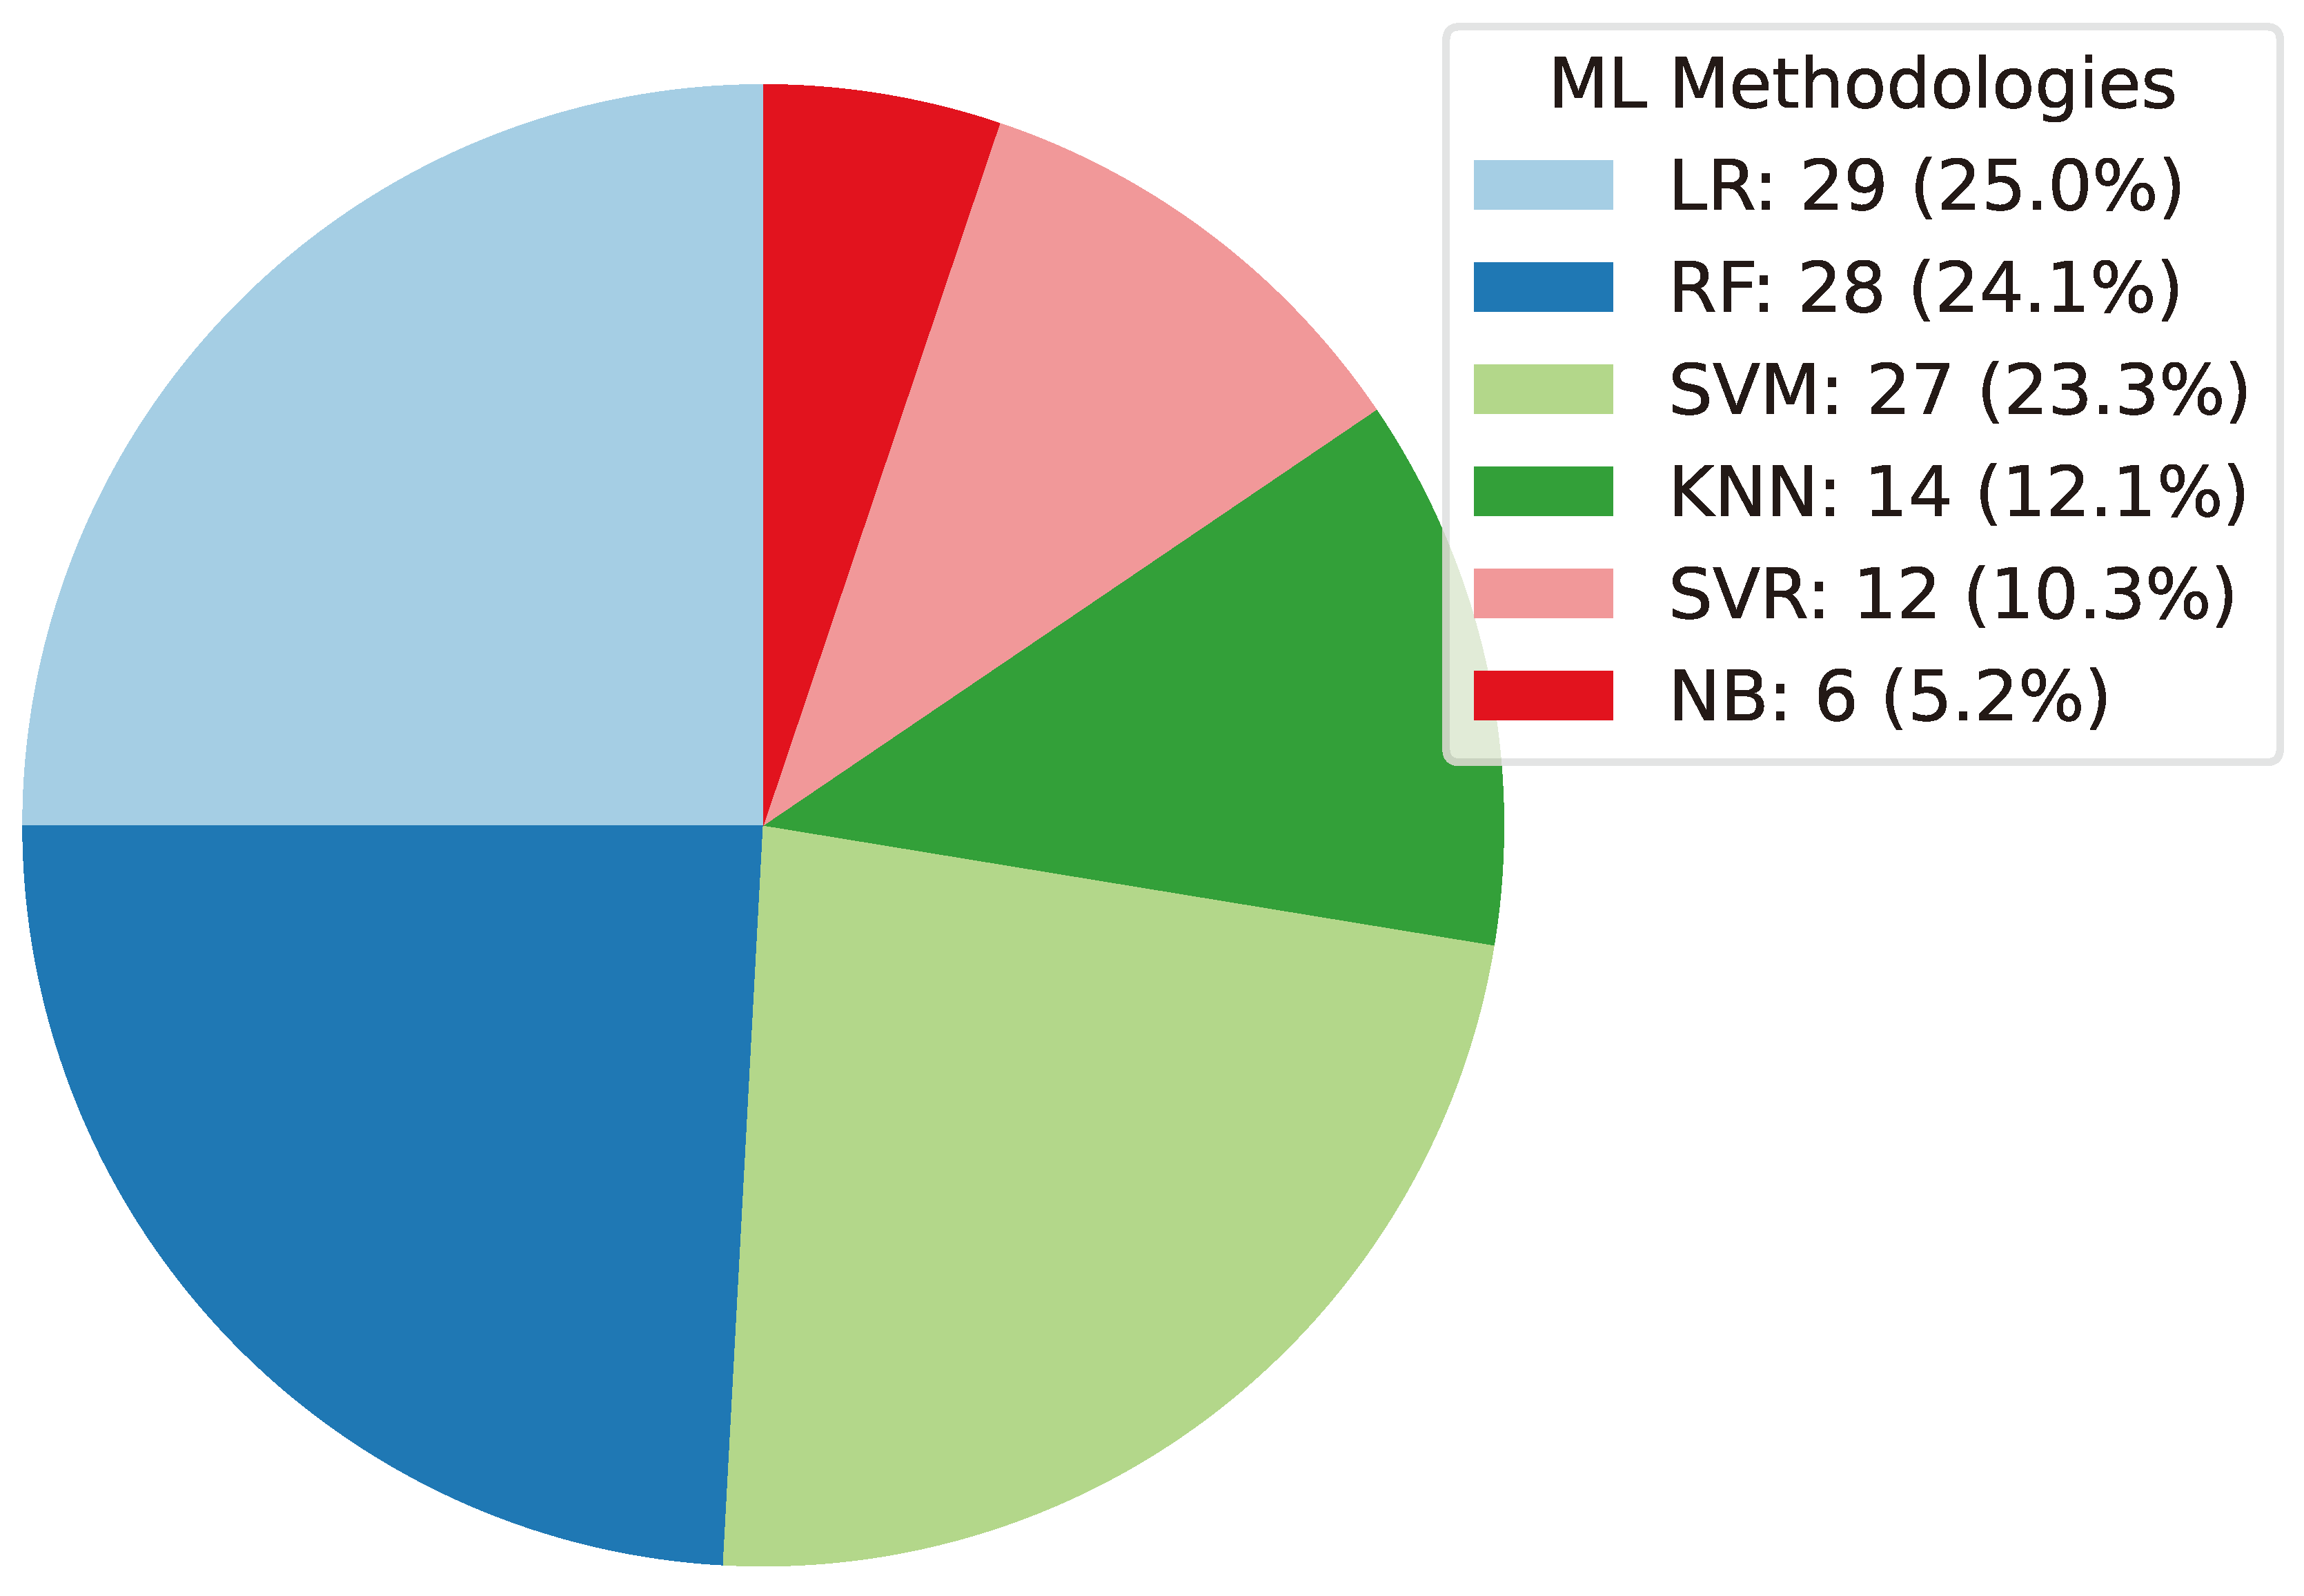
In investigating the methodological landscape of Machine Learning research, a comprehensive analysis reveals distinct patterns in the distribution of methodologies across the literature. A pie chart representation demonstrates the prevalence of various Machine Learning techniques utilized in recent research papers. Figure 6 illustrates that Linear Regression has been prominently featured in 29 research papers, closely followed by Random Forest with 28 instances. SVM techniques have been employed in 27 papers, while KNN has been utilized in 14 papers. This distribution not only reflects the popularity of certain methodologies within the Machine Learning domain but also provides insights into the preferences and trends shaping contemporary research practices.
Figure 6.
Methodological distribution in Machine Learning literature: A breakdown of techniques employed in studied research papers
Figure 6.
Methodological distribution in Machine Learning literature: A breakdown of techniques employed in studied research papers
5.1.2. Currency-Wise Distribution in Machine Learning Literature
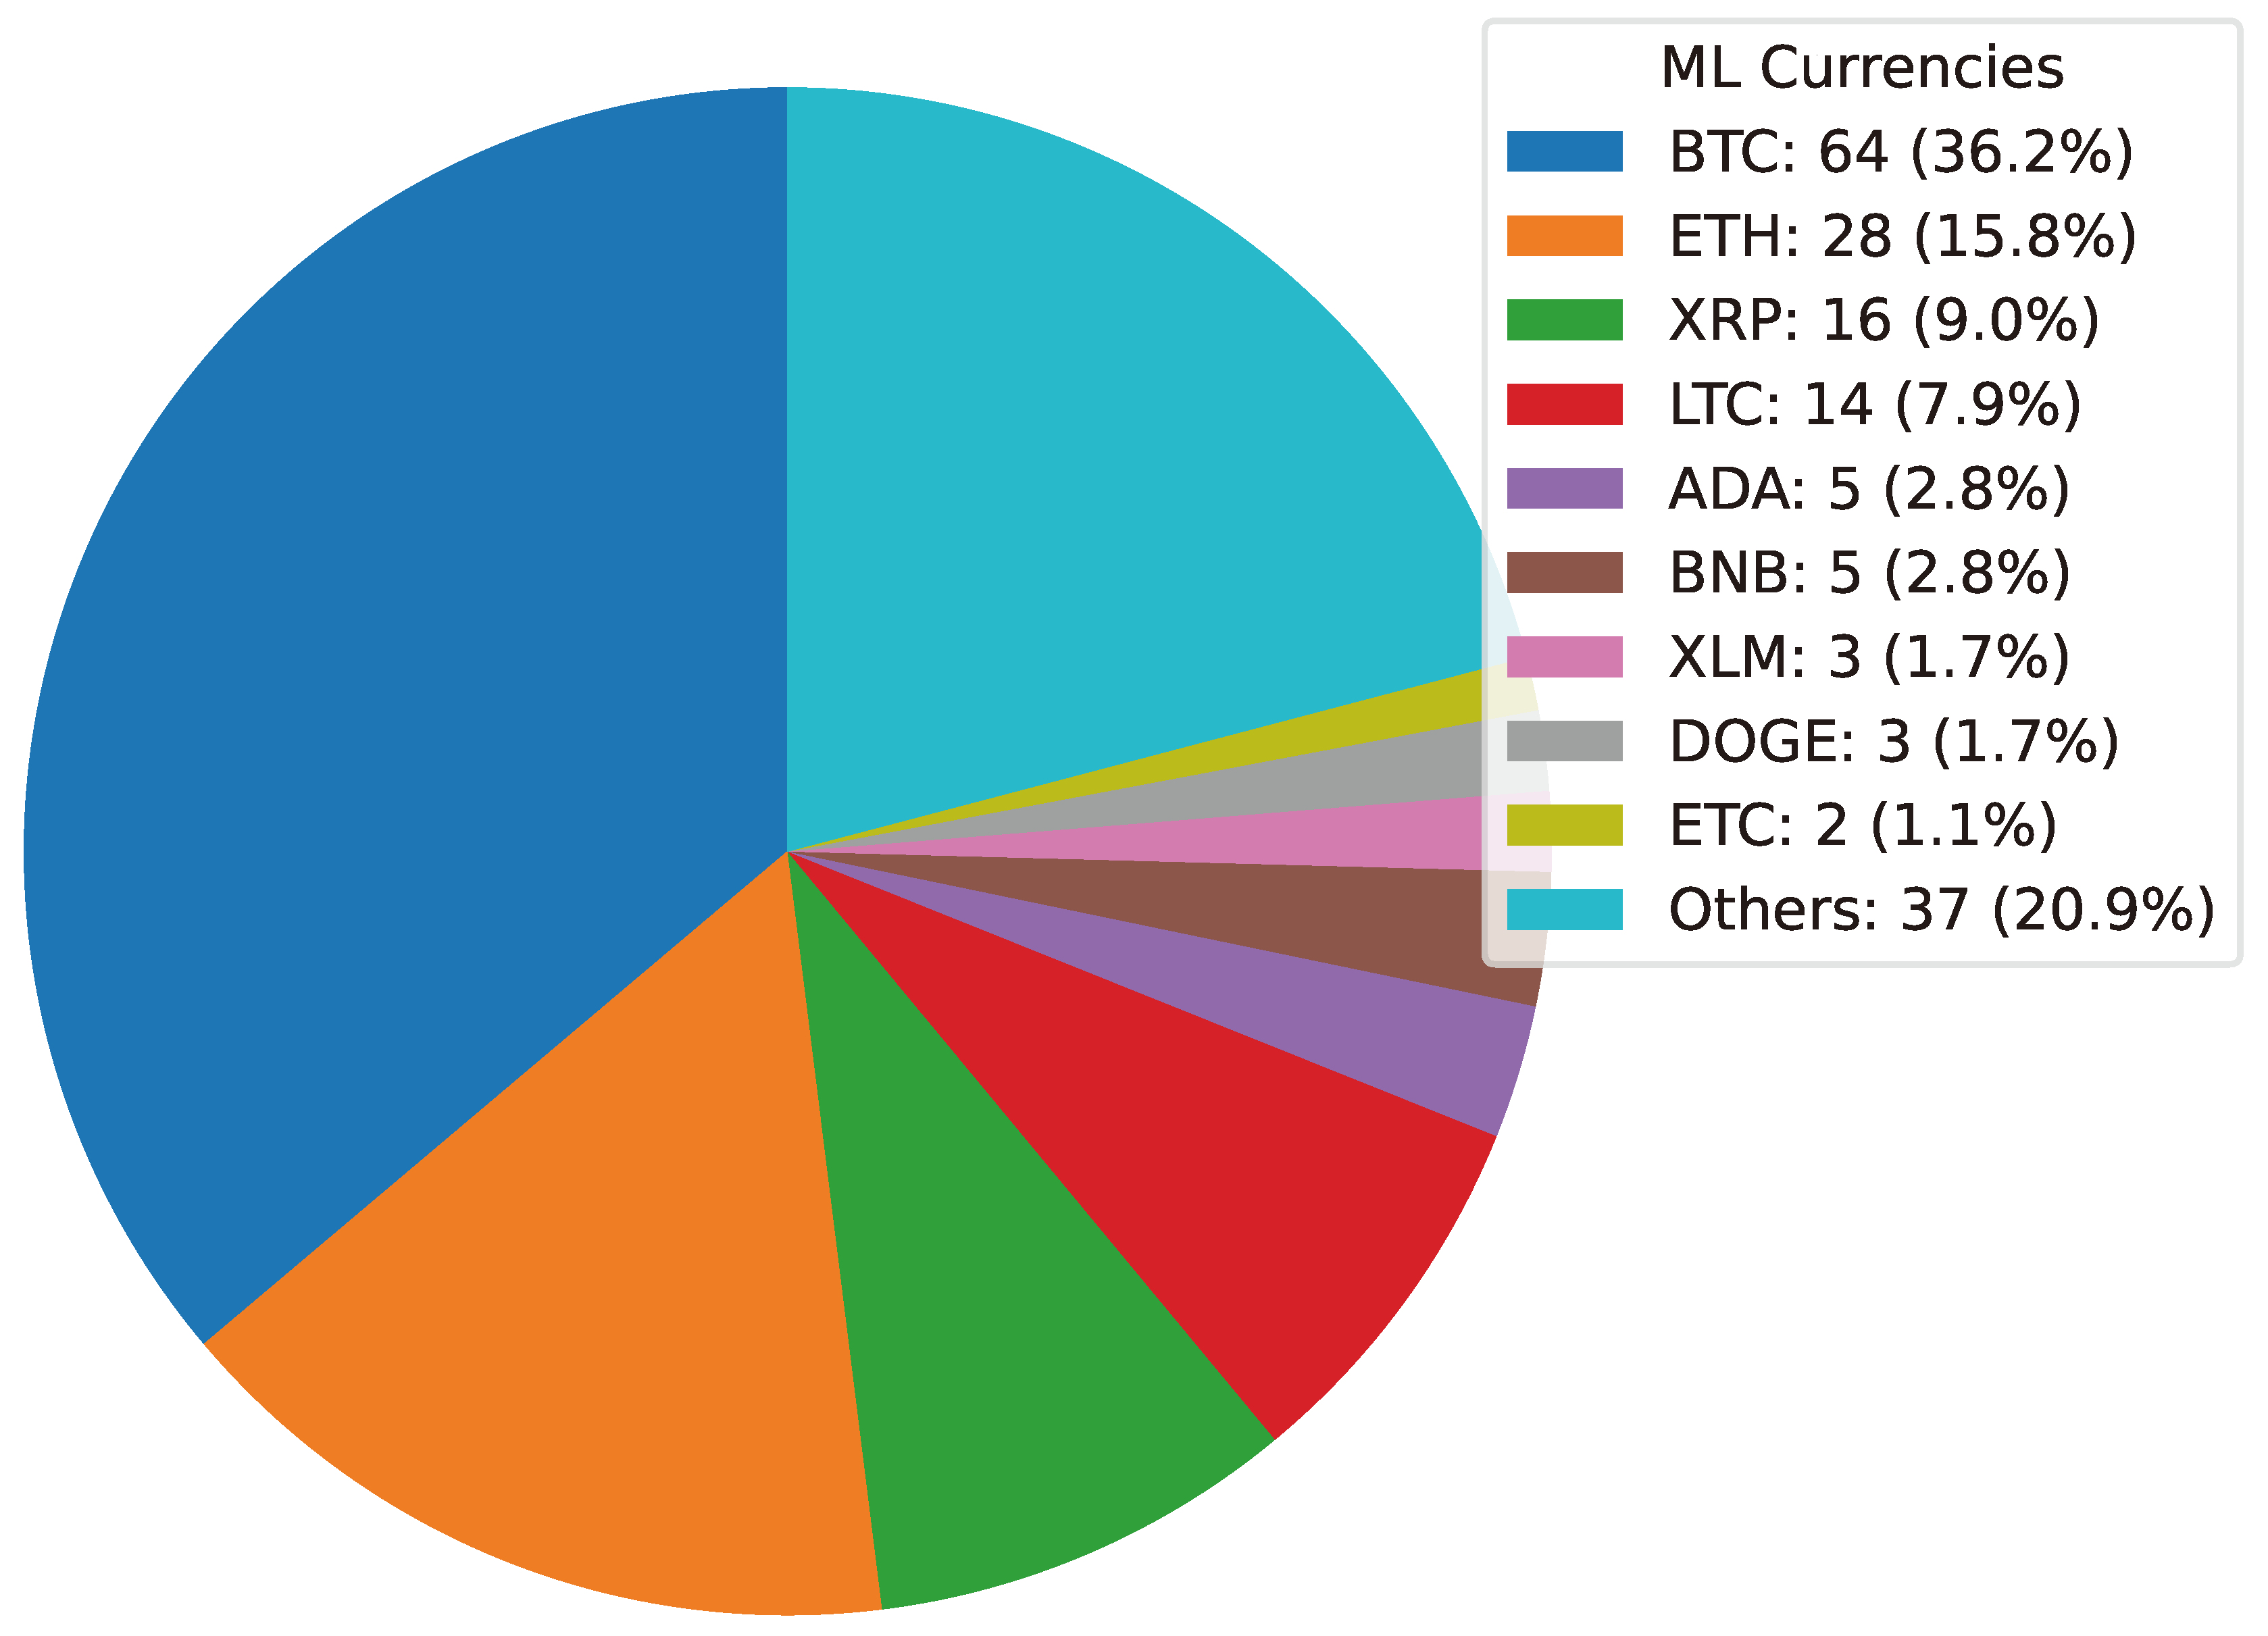
Examining the currency-wise distribution within Machine Learning literature provides valuable insights into the preferences and trends prevalent in the field. Figure 7 illustrates the proportional representation of various cryptocurrencies utilized in recent research papers. Bitcoin emerges as the dominant cryptocurrency, constituting 36.2% of the literature examined. Following BTC, Ether holds a significant share at 15.8%. Ripple and Litecoin account for 9% and 7.9% of the literature, respectively This distribution not only reflects the prevalence of specific cryptocurrencies within Machine Learning research but also highlights the diverse applications and interests within the intersection of cryptocurrency and Machine Learning domains.
Figure 7.
Currency-wise distribution in Machine Learning literature: proportional representation of cryptocurrencies in recent research papers
Figure 7.
Currency-wise distribution in Machine Learning literature: proportional representation of cryptocurrencies in recent research papers
5.1.3. Time Horizon-Wise Distribution in Machine Learning Literature
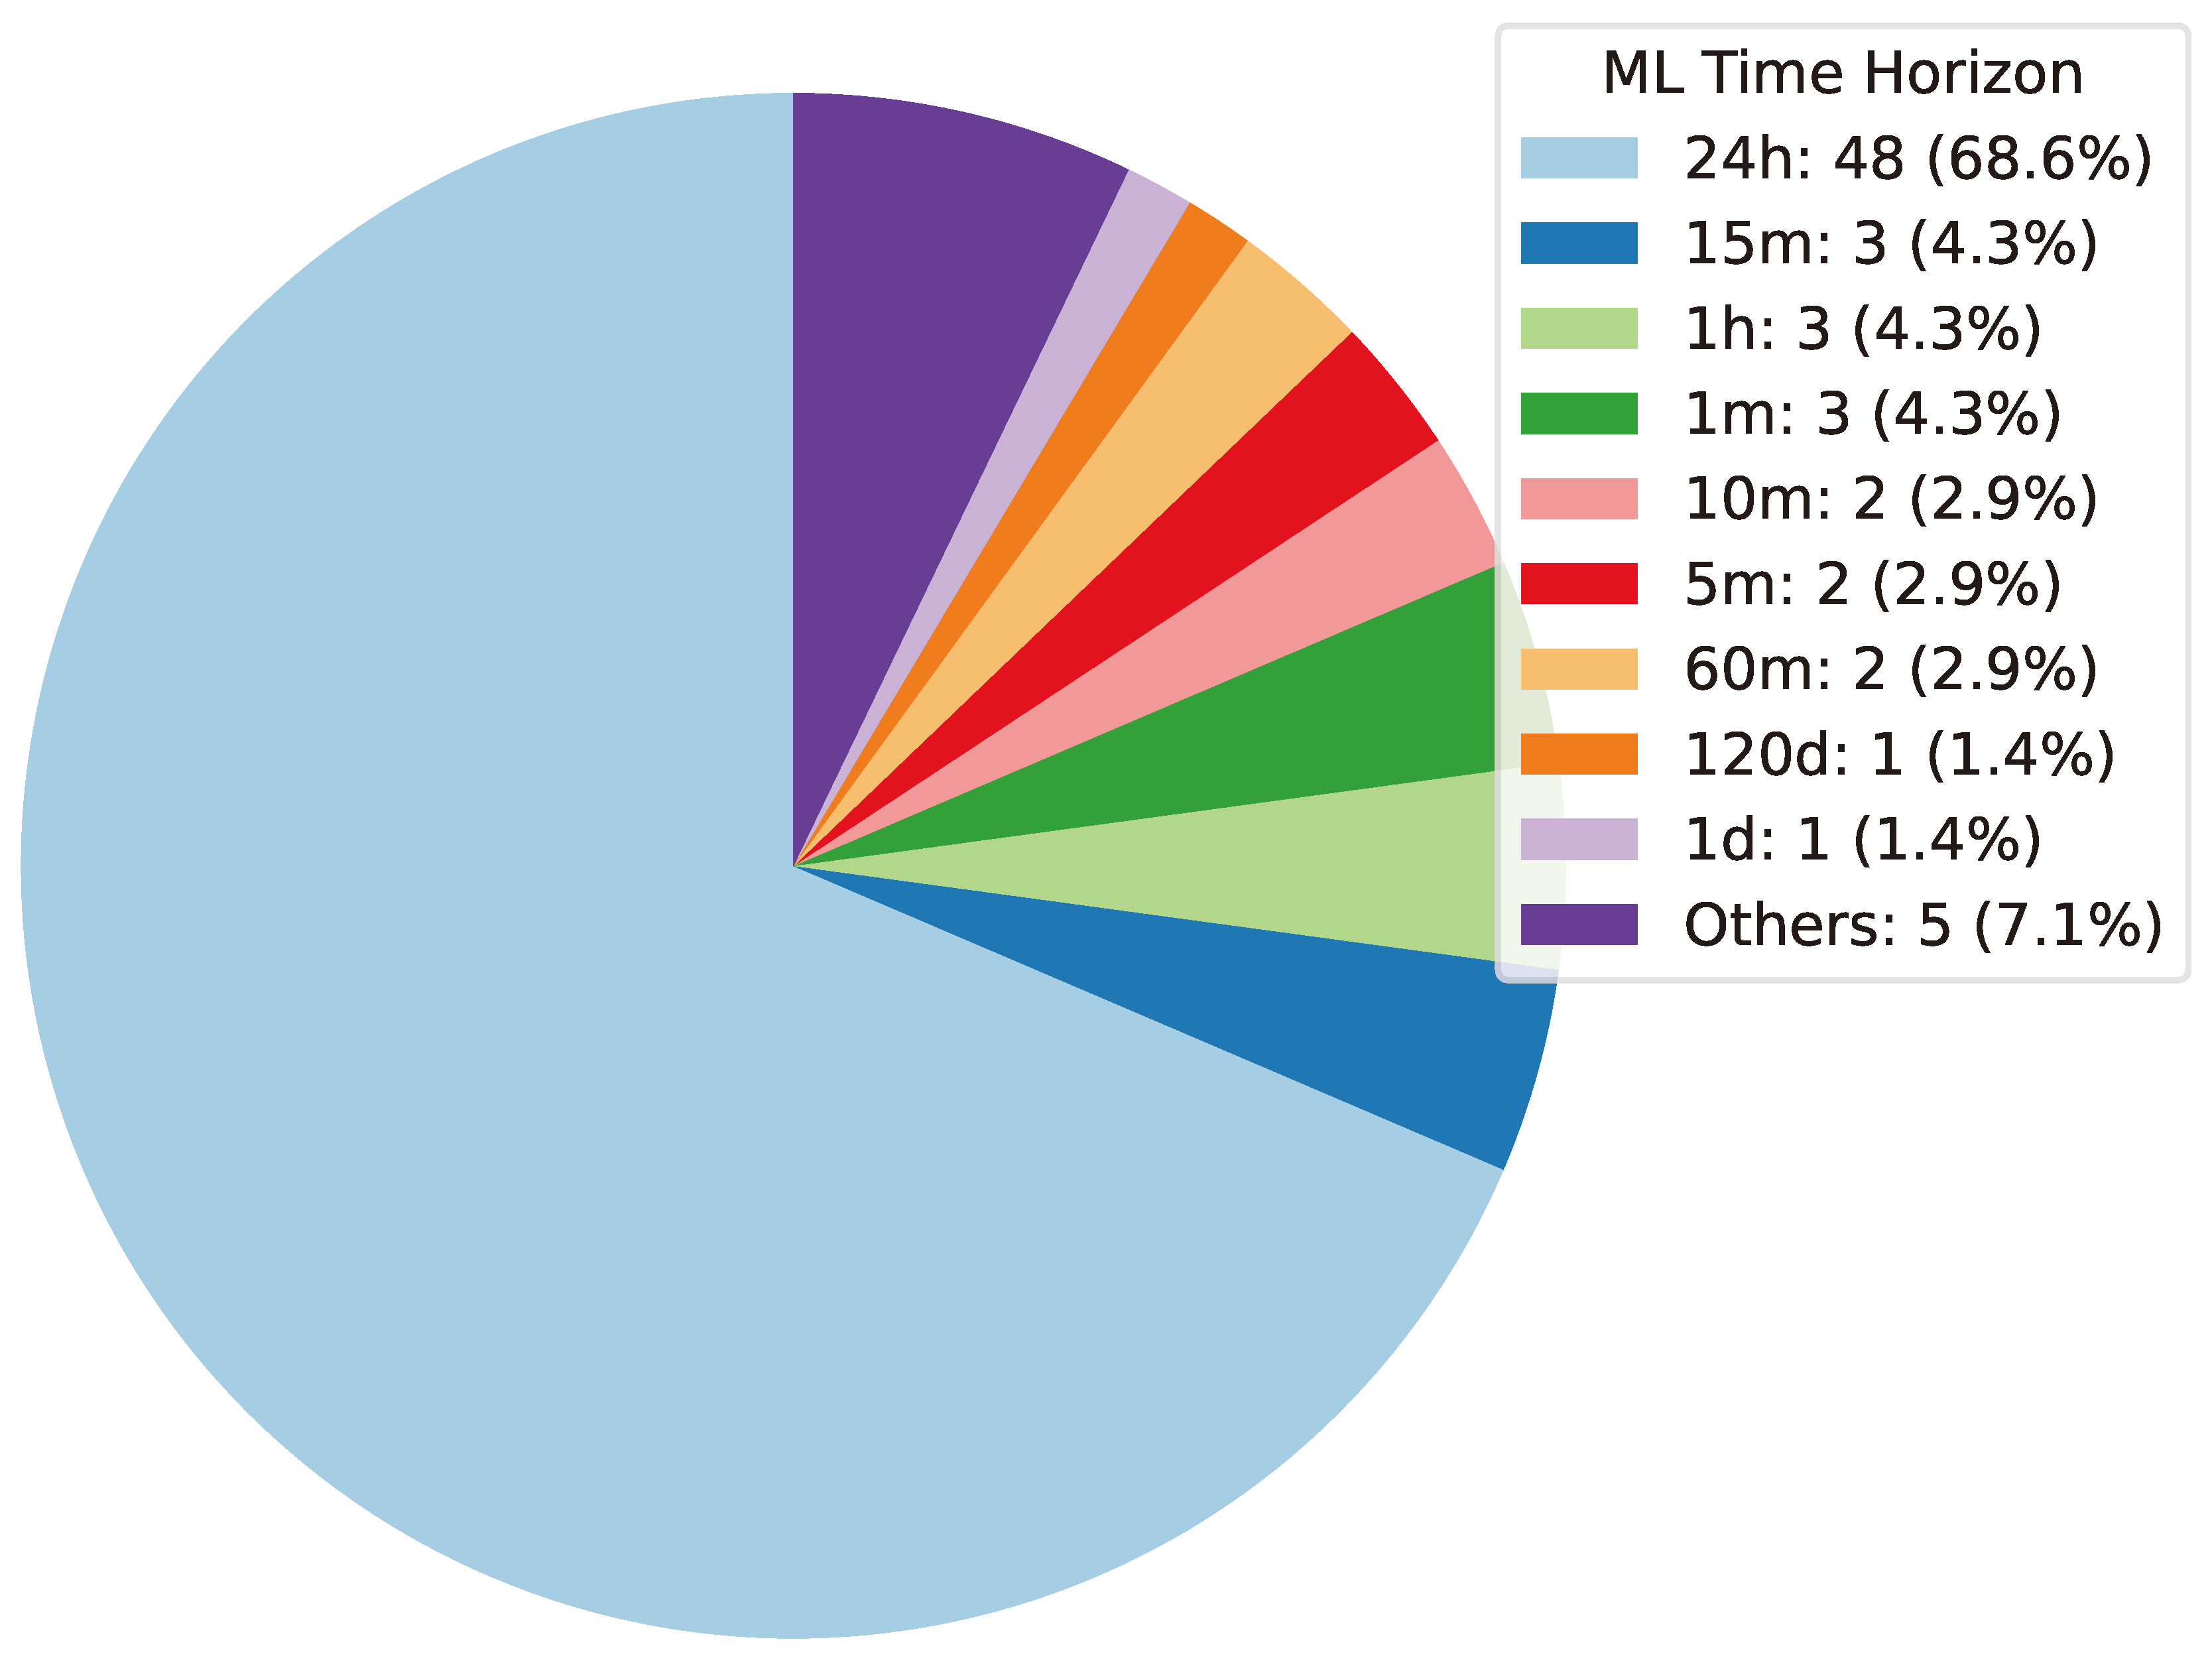
An examination of the time horizon-wise distribution within Machine Learning literature offers insights into the temporal aspects considered in research studies. A pie chart visually represents the prevalence of various time intervals utilized for analysis. Figure 8 reveals that the 24-hour time horizon dominates the distribution, constituting 68.6% of the literature surveyed. Meanwhile, shorter intervals such as 1 hour, 1 minute, and 15 minutes each represent 4.3% of the literature. This distribution underscores the significance of different time horizons in Machine Learning research and highlights the emphasis on analyzing data across various temporal scales.
Figure 8.
Time horizon-wise distribution in Machine Learning literature: proportional representation of time intervals in recent research papers
Figure 8.
Time horizon-wise distribution in Machine Learning literature: proportional representation of time intervals in recent research papers
5.2. Studies Utilizing Machine Learning for Cryptocurrency Forecasting
Cryptocurrency markets are known for their volatility and complexity, making accurate forecasting a challenging task. In recent years, researchers have turned to Machine Learning techniques to analyze historical data and predict future price movements in cryptocurrency markets. This subsection delves into a variety of Machine Learning methods applied in cryptocurrency prediction research. It covers traditional algorithms such as Support Vector Machine, Random Forest, linear regression, and Support Vector Regression models, alongside ensemble methods and time series prediction techniques like Prophet and boosting models. Researchers utilize a wide range of strategies to detect trends and patterns in cryptocurrency data. Exploring these methodologies helps develop reliable forecasting models that provide valuable insights into the ever-changing cryptocurrency markets, supporting investors and stakeholders in making well-informed decisions. This subsection highlights the complexities of Machine Learning applications in cryptocurrency forecasting and emphasizes the burgeoning trends in this swiftly advancing field.
5.2.1. Support Vector Machine, Random Forest, Linear Regression and Support Vector Regression Models
In the realm of cryptocurrency forecasting, a consistent thread weaves through several notable studies, offering a glimpse into the evolving landscape of predictive analytics. One such foundational study was conducted by Nor et al. [27] laid a sturdy foundation in 2018 by embarking on an extensive exploration encompassing seven major cryptocurrencies, such as Bitcoin, Ether, Litecoin, NEM, Ripple, and Stellar. Leveraging Machine Learning techniques, specifically Support Vector Machines, they examined daily trading data to predict price movements within a 24-hour horizon. Remarkably, their SVM-based classifier displayed exceptional performance, boasting a remarkable 95% accuracy rate—a testament to the power of ML. Furthermore, their commitment to robustness shone through their adaptation to varying data sample sizes for each cryptocurrency.
Shifting our focus exclusively to Bitcoin, Majid et al. [28] embraced both Statistical and Deep Learning methodologies in their 2019 cryptocurrency forecasting study. Centering their analysis on closing price data, they harnessed Support Vector Machines, Random Forest, and DL models, all within the familiar 24-hour prediction window. It’s noteworthy that the Random Forest model distinguished itself by yielding the smallest root mean square error and mean absolute percentage error values within their Bitcoin-exclusive dataset.
Building upon these insights, Franco et al. [29] ventured into cryptocurrency forecasting in 2019, echoing Nor et al.[27] temporal scope of a 24-hour prediction window. However, they introduced a unique twist by incorporating sentiment data alongside price data for Bitcoin, Ether, Ripple, and Litecoin. Employing support Vector machines and Random Forests as Machine Learning classifiers, supplemented by Deep Learning models, they conducted meticulous evaluations. While SVM and Random Forest excelled with price data, an intriguing revelation emerged—the Multi-Layer Perceptron model, asserting itself as the top performer with an impressive accuracy of 0.72 and a precision score of 0.76.
Support vector machines have been a prominent option among researchers for cryptocurrency price prediction. Ismail et al. [27] utilized SVM on price data for Bitcoin, Ether, Litecoin, and others, achieving forecasts with Mean Absolute Percentage Error metrics. Similarly, Cohen et al. [30] applied Support Vector Machines to cryptocurrency price forecasting, though specific cryptocurrencies and evaluation metrics are not mentioned. The time horizon is 24 hours. Alahmari et al. [31]applied Support Vector Regression for BTC, XRP, and ETH price predictions. Their evaluation criteria included mean absolute error, mean squared error, root mean squared error, and R-squared. The use of SVR is similar to previous studies.
Hakan et al. [32] conducted a cryptocurrency forecasting study centered on Bitcoin. Their approach incorporated price data, technical indicators, and various classifiers, including Support Vector Machines and Random Forests. They also assessed model performance using metrics like Accuracy, Mean Absolute Error, and Root Mean Square Error. Their research dataset encompassed a significant sample size, contributing to their findings.
Khedmati et al. [33] focused their study on Bitcoin, utilizing closing price data and Statistical models to predict price movements within a 24-hour time horizon. Their evaluation metrics included Root Mean Square Error and Mean Absolute Percentage Error, and despite a relatively small dataset, their study provided valuable insights into the accuracy of Bitcoin price predictions. In the year 2020, Saad et al. [31] included Bitcoin, Ripple, and Ether in their study on cryptocurrency forecasting. They exclusively utilized Support Vector Regression by integrating price data with external economic indicators. Their study used a 24-hour prediction horizon and evaluated performance using metrics like Mean Absolute Error, Mean Squared Error, Root Mean Square Error, and R-squared, which were consistent with previous studies.
In a unique departure from conventional methodologies, Alireza et al. [34] introduced sentimental data as input features exclusively for Bitcoin forecasting. Their Machine Learning-based neural network achieved impressive accuracy, contributing to a reduction in prediction errors.
Lokesh et al. [35] conducted a cryptocurrency forecasting study concentrating on Bitcoin. Their research encompassed Linear Regression and DL algorithms With a 24-hour time horizon, they emphasized the growing prominence of DL techniques in cryptocurrency forecasting.
In 2020, Vidyulatha et al. [36] undertook a comprehensive study in the domain of cryptocurrency forecasting, with a specific focus on Bitcoin. Their research incorporated historical price data and applied Linear Regression in conjunction with Statistical Models, extending the time horizon to 120 days for price prediction. Their dataset encompassed a substantial sample size of 2,191 data points for Bitcoin. Remarkably, the study aimed to leverage BTC information to enhance future price movement predictions. Notably, they introduced a time series analysis Statistical model to forecast Bitcoin prices over the subsequent four months. The study’s outcomes revealed the superior performance of Statistical models in comparison to the LR model, underscoring the efficacy of incorporating time series analysis techniques for accurate and robust cryptocurrency price predictions.
In 2021, Patrick et al. [37] conducted a focused study on Bitcoin price prediction. They used a wide range of input features, including technical indicators, blockchain data, and sentimental data, and applied Machine Learning models such as Random Forest, Gradient Boosting Classifiers, Logistic Regression, and Deep Learning models. The study assessed various time horizons, from 1 minute to 60 minutes. Their evaluation metric was accuracy, and they had an extensive dataset with 403,440 minute-level data points for Bitcoin. The findings revealed that Recurrent Neural Networks (RNNs) and Gradient Boosting Classifiers consistently provided more accurate predictions, with the choice between Gated Recurrent Unit and Long Short-Term Memory depending on the prediction horizon. Additionally, tree-based models, like GBC and Random Forest, showed notable differences in predictive accuracy primarily on the 5-minute prediction horizon, where GBC outperformed RF. These results highlight the importance of model selection and prediction horizon in cryptocurrency forecasting, especially for Bitcoin.
In 2021, Mohamed et al. [38] conducted a cryptocurrency prediction study, focusing on multiple cryptocurrencies, including BTC, ETC, and more. They employed price data as their primary input feature and utilized Support Vector Machines in conjunction with other Deep Learning models for a 24-hour time horizon. Their evaluation metric was accuracy, and for each cryptocurrency, they had a dataset comprising 1826 data samples. Notably, the paper introduced an enhanced Scatter Search Algorithm approach to optimize SVM. Through comprehensive experiments, the proposed SCA approach outperformed both the standard SVM method and the SVM-PSO method, achieving the highest accuracy among all methods analyzed. This highlights the effectiveness of their novel approach to cryptocurrency price prediction.
Table 3.
Comparison to find the best classifier [38]
Table 3.
Comparison to find the best classifier [38]
| Classifiers | BTC | ETH | LTC | XRP | XEM | XLM |
|---|---|---|---|---|---|---|
| SVM | 78.90 | 95.50 | 82.40 | 70.00 | 47.70 | 58.70 |
| SVM-PSO | 90.40 | 97.00 | 92.10 | 82.80 | 57.80 | 64.50 |
| SVM-eSCA | 91.21 | 97.44 | 92.31 | 84.07 | 58.86 | 66.23 |
In 2021, Erdinc et al. [39] focused on cryptocurrency price prediction, considering various cryptocurrencies including BTC, ETC, and more. Their study utilized price data as input features and employed a range of Machine Learning models, including SVM and other Deep Learning models, with a time horizon of 24 hours. Notably, the authors proposed an enhanced SCA (Sine Cosine Algorithm) approach to optimize SVM for cryptocurrency prediction. They compared this approach with the standard SVM method and the SVM-PSO (Particle Swarm Optimization) method. The experiments conducted indicated that the proposed SCA approach outperformed all other methods in terms of accuracy, highlighting its effectiveness in enhancing cryptocurrency price prediction [38].
In 2021, Mohamed et al. [39] conducted a comprehensive study on cryptocurrency price prediction. They considered several cryptocurrencies, including BTC, ETH, and more. They utilized price data as input features. The authors employed SVM along with other Deep Learning models and adopted a 24-hour time horizon for their predictions. Notably, they proposed an enhanced SCA (Sine Cosine Algorithm) approach to optimize SVM and compared it to the standard SVM method and SVM-PSO (Particle Swarm Optimization) method. The results of their experiments unequivocally demonstrated that the proposed SCA approach achieved the highest accuracy among all the methods considered in their analysis, highlighting its efficacy in enhancing cryptocurrency price prediction [39].
In 2021, Andrew et al. [40] conducted a cryptocurrency forecasting study focusing on three major cryptocurrencies: Bitcoin, Ether, and Ripple. They utilized price data as the primary input feature and considered a 24-hour time horizon for predicting price movements. To build predictive models, the researchers employed a diverse set of Machine Learning classifiers, including Linear Regression, Support Vector Machines, k-nearest Neighbors, Decision Trees, Random Forest, AdaBoost, and XGBoost, along with other Deep Learning models. The main evaluation metric used in their analysis was accuracy. Their dataset consisted of a total of 1579 data samples for each cryptocurrency. Interestingly, the study found that Support Vector Machines provided the most accurate classifications when forecasting the sign of next-day returns, achieving a log return of 3.72, which corresponds to a rate of return of approximately 41.3% on a $100 investment [40].
In 2021, Ashutosh et al. [41] conducted a cryptocurrency price prediction study with a focus on Bitcoin. Their analysis incorporated price data as input features and employed various regression models, including Linear Regression, Theil-Sen Regression, and Huber Regression, in addition to other Deep Learning models. The study utilized a 24-hour time horizon for predicting BTC prices and evaluated model performance using metrics such as accuracy, R-squared, and Mean Squared Error. Notably, the research found that all the models exhibited similar levels of accuracy, with Linear Regression standing out for its superior execution time. However, the authors acknowledged that factors such as Twitter sentiment analysis, gold price analysis, economic crises, parameter settings, and differing policies and laws across countries could potentially impact the results [41].
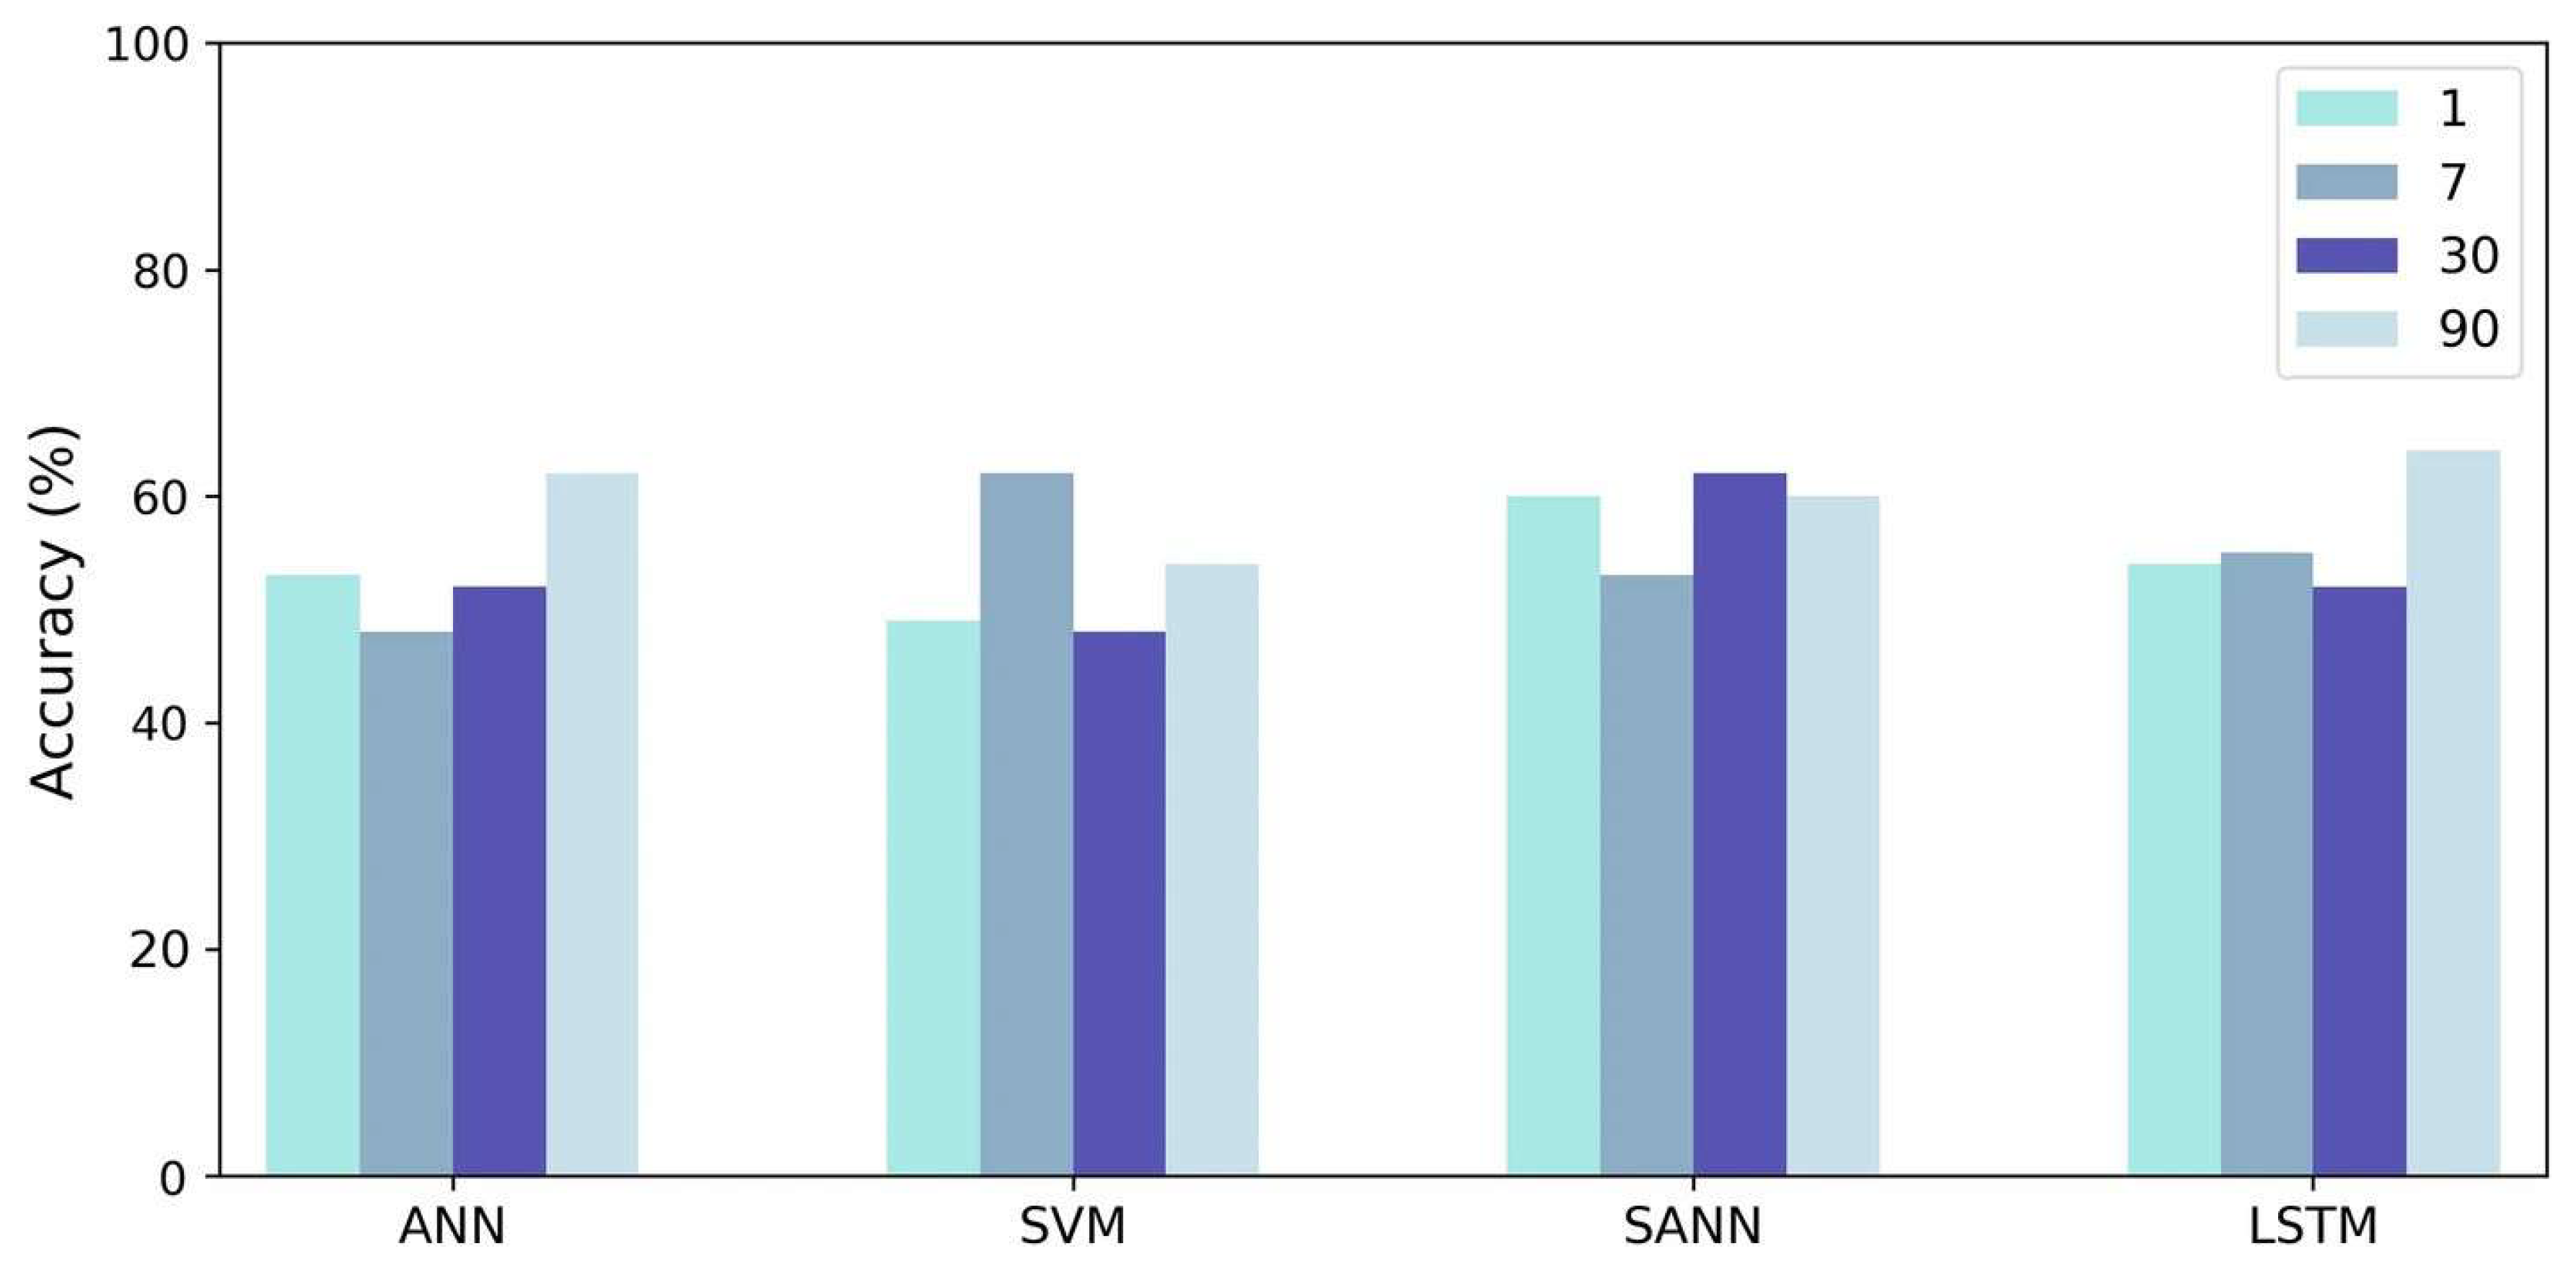
In a parallel effort, Mudassir et al. [42] delved into cryptocurrency forecasting, extending their analysis to various time horizons, including 1 day, 7 days, 30 days, and 90 days, exclusively focusing on Bitcoin. They employed Support Vector Machines and Deep Learning models while adopting metrics such as Mean Absolute Error and Root Mean Square Error for evaluation. Their dataset included a substantial sample size, enabling robust analysis.
Figure 9.
Accuracy of the classification models for nth day forecast in Interval III [42]
Figure 9.
Accuracy of the classification models for nth day forecast in Interval III [42]
Martin-Barreiro et al. [43] utilized Support Vector Machines for multi-cryptocurrency price forecasting, including Binance Coin, Bitcoin, Cardano, Dogecoin, Ether, and Ripple. The forecasting time horizon was 24 hours. Evaluation metrics included Mean Absolute Percentage Error, RMSE, and Normalized RMSE. The study did not specify the number of data samples used, and the training/testing split was 75/25. SVM proves to be a robust technique for devising profitable trading strategies, demonstrating its ability to provide accurate results both before and during the current pandemic. Our findings are valuable for stakeholders seeking to understand cryptocurrency dynamics and make informed investment decisions, particularly during periods of uncertainty such as the COVID-19 pandemic.
Rena et al. [44] conducted multi-currency forecasting, considering Bitcoin, Ether, Ripple, Cardano, Dogecoin, Polkadot, and Litecoin. Their approach involved Support Vector Machines for predictions with a 24-hour time horizon. Evaluation metrics included accuracy, precision, recall, F1-score, Sharpe Ratio, Sortino Ratio, Conditional Expected Quadratic Return, and Return Loss. The study reported 181 data samples for each currency but did not mention the training/testing split.The proposed multi-source data effectively aids in forecasting cryptocurrency price movements. Furthermore, the proposed portfolio strategy outperforms traditional approaches in terms of out-of-sample Sharpe ratio, Sortino ratio, and certainty equivalent return. Importantly, these conclusions are robustly verified in our testing. Valdés-Aguirre et al. [29] integrated price data and sentiment analysis using Support Vector Machines and Random Forest for forecasting BTC, ETH, XRP, and LTC prices. Their evaluation criteria included accuracy, precision, recall, and F1-score metrics. This approach extends the analysis to consider market sentiment alongside historical data.The MLP emerged as the top-performing model for BTC, achieving an accuracy exceeding 0.72 and a precision of 0.76, significantly outperforming random predictions. SVM and RF also demonstrated superior performance when utilizing market data. However, incorporating Twitter data alone did not contribute to predicting market movements across SVM and RF models; in fact, its inclusion appeared to degrade their performance. Nevertheless, it marginally enhanced precision in the MLP model.
Rabbania et al. [45] employed regression models, including Linear Regression, Gradient Boosting Regression, Support Vector Regression, and Random Forest Regression, for BTC, ETH, ZEC, and LTC price forecasting. They evaluated the models using metrics like Mean Squared Error, Mean Absolute Percentage Error, Mean Absolute Error, Akaike Information Criterion, and Bayesian Information Criterion (BIC).
Pinellas et al. (2020) explored Support Vector Regression, Linear Regression, K-nearest neighbors, and Decision Tree Regression for short-term cryptocurrency forecasting. They evaluated their models based on Root Mean Squared Error, Accuracy, Area Under the Curve, and F1-score metrics [46]. Azizi et al. (2020) and Azizi et al. (2019) explored Bayesian models alongside SVM and RF for BTC price prediction, with a focus on RMSE and MAPE metrics [28,33]. Their work is relevant to price prediction methodologies. Anbarasi et al. (2022) [47] adopted a straightforward Linear Regression model to predict cryptocurrency prices. Focusing on BTC, ETH, LTC, MKR, and BNB, this study targeted both short-term and long-term forecasting without specifying a time horizon. The evaluation was based on commonly used metrics, with a 70/30 training-testing data split.
Amirhosseini et al. [48] integrated sentiment data with Machine Learning, employing K-Nearest Neighbors, Logistic Regression, Gaussian Naive Bayes, Support Vector Machine, and Extremely Randomized Trees models to predict BTC prices over a 24-hour horizon. The F1 score served as the primary evaluation metric, emphasizing model precision and recall. They trained on 80% of the data, reserving 20% for testing.
Johari et al. [49] conducted research into cryptocurrency forecasting, concentrating on AVAX, XRP, SOL, DOGE, MATIC, and SHIB. Their approach involved utilizing Linear Regression, Stochastic Gradient Descent Regression, and Random Forest Regression as forecasting methodologies. The time horizon for predictions in this study was 24 hours. The models’ performance was assessed using multiple metrics, including Mean Absolute Error, Root Mean Squared Error, and Mean Percentage Error .
Godinho et al. [50] conducted multi-currency forecasting, considering BTC, ETH, and LTC. Their models included Linear Regression, Random Forest, and Support Vector Machine. With a 24-hour time horizon, their evaluation involved a variety of metrics, focusing on the accuracy of predictions.The trading strategies are constructed through model assembling. The ensemble approach, where five models generate identical signals (Ensemble 5), demonstrates the highest performance for Ethereum and Litecoin. It achieves annualized Sharpe ratios of 80.17% and 91.35%, along with annualized returns (after proportional round-trip trading costs of 0.5%) of 9.62% and 5.73%, respectively. Geetha et al. [51] explored an array of regression models for Bitcoin price prediction. These models included Linear Regression, Gradient Boosting Regression, Random Forest, Decision Trees, Adaboost Regression (AdaboostR), Ridge Regression (Ridge), and Lasso Regression (Lasso). This study did not specify a particular time horizon but evaluated predictions using metrics such as Root Mean Squared Error, R-squared, Mean Absolute Error, and E (unclear without further context). No details were provided regarding data samples and the training/testing split.
Arpitha et al. [36] utilized Linear Regression to predict Bitcoin prices over a 120-day time horizon. Although they didn’t specify the evaluation metric used, their dataset comprised 2,191 BTC data samples. Jatto et al. [52] focused on Bitcoin price forecasting using Support Vector Machines and K-Nearest Neighbors models. Their predictions had a 24-hour time horizon. Evaluation metrics included accuracy, standard deviation, mean, RMSE, ROC, and AUC. The study’s dataset consisted of 2,760 BTC data samples, with an 80/20 training/testing split. Bhat et al. [53] employed Linear Regression and Support Vector Regression for short-term Bitcoin price forecasting with a 1-hour time horizon. The primary evaluation metric used was accuracy. Their dataset encompassed 29,592 BTC data samples. Lee et al. [54] explored Bitcoin price prediction using various models, including Bayesian Neural Networks (BNN), Support Vector Regression, and Support Vector Machines. The forecasting time horizon was 24 hours. The evaluation focused on RMSE and Mean Absolute Percentage Error. They had access to 1,213 BTC data samples and did not mention a specific training/testing split.
Das et al. [55] investigated Bitcoin price forecasting using various models, including Adaptive Neuro-Fuzzy Inference System, Random Forest, Support Vector Regression, Multivariate Adaptive Regression Splines, and Lasso Regression. Their predictions were made with a 24-hour time horizon. The study did not provide specific evaluation metrics but reported a dataset size of 2,237 BTC data samples with an 80/20 training/testing split. Bhosale et al. [56] explored classification models, including Support Vector Machine, Linear Regression, K-Means Clustering, Naive Bayes, Random Forest, K-Nearest Neighbors, and Decision Trees, for Bitcoin price forecasting with a 1-minute time horizon. The study did not provide specific details on the dataset, data samples, or the training/testing split.
Qusef et al. [57] conducted multi-currency forecasting, encompassing Bitcoin, Ether, and Litecoin. Their approach involved Support Vector Machines, K-nearest neighbors, and Light Gradient Boosting Machines as forecasting methodologies. The time horizon for predictions was 24 hours, and the evaluation criteria included the F1 score and accuracy. They reported 17 data samples for each currency, although the training/testing split was not specified.
Vijayakumar et al. [58] employed Linear Regression models for cryptocurrency forecasting, covering Bitcoin, Dash, Litecoin, Dogecoin, Ether, and Monero. The time horizon for predictions was 24 hours. The evaluation was based on Mean Squared Error, but details about data samples and the training/testing split were not provided.
Neha et al. [53] cast an exclusive spotlight on Bitcoin, meticulously examining price data within a 1-hour prediction horizon. Their arsenal included Linear Regression, Support Vector Regression, and various Statistical models. Notably, their extensive dataset, exclusive to Bitcoin, marked a standout feature.
Prakash et al. [35] utilized price data and blockchain data as input for models. They used the LR model for BTC with a 24-hour time horizon, evaluating using Accuracy. Qusef et al. [57] used Price Data for BTC, ETH, and LTC, applying SVM, KNN, and LGBM models with a 24-hour time horizon. They evaluated using F1 and Accuracy. [59] focused on Price Data for ETH, LTC-BTC, and ZEC-BTC with a 4-hour time horizon. They used EGB, and RF models, evaluating using Accuracy.
Ioannis et al. [46] expanded their research to encompass BTC, ETH, and XRP. They employed a range of ML classifiers and assessed model performance with metrics including Root Mean Square Error and Accuracy. Their dataset consisted of a substantial number of data samples, enabling a comprehensive analysis of their models’ performance. In 2020, Lekkala et al. [60] conducted a comprehensive study focused on Bitcoin price prediction over a 24-hour time horizon. Their analysis encompassed the application of various Machine Learning algorithms, including LASSO, Decision Trees, and K-Nearest Neighbors, with the primary objective of enhancing predictive accuracy. Notably, they leveraged both price data and blockchain data as input features, ensuring a holistic approach to cryptocurrency forecasting. The evaluation of their models centered on the accuracy metric, facilitating rigorous performance assessment. Impressively, their findings highlighted that Linear Regression exhibited superior efficiency compared to other algorithms. Building on this insight, they successfully implemented the LASSO algorithm, emphasizing its effectiveness in reducing time complexity and further improving Bitcoin price prediction accuracy. This research by Lekkala et al. [60] contributes valuable insights into algorithm selection and its impact on cryptocurrency forecasting, particularly underscoring the significance of the LASSO algorithm in achieving superior predictive outcomes.
In 2020, several research studies focused on cryptocurrency forecasting, collectively contributing to a comprehensive understanding of this evolving field. Tri et al. [61] conducted a study that concentrated on predicting cryptocurrency prices, primarily Bitcoin, using the Adaptive Neuro-Fuzzy Inference System and Statistical models. Their research assessed model performance with metrics such as Root Mean Square Error and Mean Squared Error. Notably, they examined a 24-hour time horizon for forecasting BTC prices, similar to many prior studies. Afif et al. [61] utilized Price Data for BTC and employed the ANFIS model with a 24-hour time horizon. They evaluated using RMSE and MSE. Gessl et al. [62] incorporated RF on external economic, price, and blockchain data to predict BTC and LONA prices, emphasizing R-squared, Mean Absolute Error, and Mean Squared Error. Kaushik et al. [63] applied Random Forest for short-term price forecasting of BTC, emphasizing Mean Squared Error and R-squared as their evaluation metrics. KP et al. [64] employed the Random Forest model for short-term Bitcoin price forecasting with a 24-hour time horizon. Evaluation criteria included Mean Squared Error, Mean Absolute Error, and Root Mean Squared Error. The study had access to BTC price data and utilized 4,700 data samples.
5.2.2. Ensemble Strategies Based
Ensemble learning methods have shown promise in cryptocurrency forecasting, as evidenced by recent studies. For instance, the ensemble approach combines various models to enhance predictive accuracy. Gyameraha et al. (2019) [65] explored cryptocurrency price forecasting, particularly focusing on BTC. Their approach involved utilizing Random Forest and Support Vector Regression as forecasting methodologies. RF is an ensemble learning method known for its ability to handle complex relationships in data, while SVR is a powerful tool for regression tasks, often used in financial forecasting. The time horizon for predictions in this study was 24 hours. The models were evaluated using multiple metrics, including Mean Absolute Percentage Error, Root Mean Squared Error, Mean Absolute Error, and R-squared. Similarly, Ensemble techniques, including Random Forest, AdaBoost, XGBoost, and others, have been employed to improve prediction accuracy. The MAPE, RMSE, MAE, and R-squared values for the stacking ensemble model were 0.0191%, 15.5331 USD, 124.5508 USD, and 0.9967 respectively.
Lyu et al. [40] integrated multiple ensemble methods for forecasting BTC, ETH, and XRP prices, emphasizing accuracy . These ensemble models combine the strengths of various algorithms. Their analysis indicates that AdaBoost and XGBoost produce the most inaccurate classifications in the context of our study. In contrast, the Support Vector Machine (SVM) model, when utilized with a probability-based trading strategy, demonstrates a log return of 3.72. This translates to an approximate rate of return of 41.3%. Consequently, an initial investment of $100 would yield a profit of $41.30. Zhang et al.[66] harnessed ensemble models, including Logistic Regression, SVM, Random Forest, XGBoost, and LightGBM, while incorporating technical indicators for BTC price forecasting [66]. Their approach blends ensemble techniques and technical indicators. Balci et al.[67] explored a comprehensive set of Machine Learning models, including Support Vector Regression, Decision Tree Regression, Random Forest Regression, Linear Regression, Logistic Regression, and Gaussian Process Regression (GPR), to forecast the prices of major cryptocurrencies (BTC, ETH, ADA, XRP). Their analysis encompassed a 24-hour time horizon and utilized the Root Mean Squared Error as the evaluation metric. Remarkably, they trained individual models for each currency to capture unique market dynamics. The ARIMA model, commonly used by economists, is found to be unsuitable for cryptocurrency prediction. In contrast, the LSTM architecture, a deep learning model designed for time series prediction and classification, performs more effectively in this domain. Notably, the MM-LSTM architecture, an enhancement of LSTM, exhibits a lower RMSE value compared to traditional machine learning algorithms frequently employed in regression studies. However, machine learning methods such as Gaussian Process Regressor and Logistic Regressor demonstrate very successful results in cryptocurrency prediction. Similarly, Weinhardt et al. (2022) introduced lagged data analysis with Logistic Regression, Random Forest, and Gradient Boosting Classifier for predicting cryptocurrency prices. They employed a wide range of evaluation metrics, including Mean Return, Sharpe Ratio, and Value at Risk, demonstrating the versatility of ML in cryptocurrency forecasting [68]. All employed models produce statistically viable predictions, with average accuracy values across all cryptocurrencies ranging from 52.9% to 54.1%. These accuracy values increase to a range of 57.5% to 59.5% when calculated on the subset of predictions with the top 10% highest model confidence per class and day. Our analysis shows that a long-short portfolio strategy based on the predictions of the employed LSTM and GRU ensemble models yields an annualized out-of-sample Sharpe ratio of 3.23 and 3.12, respectively, after accounting for transaction costs. In comparison, the buy-and-hold benchmark market portfolio strategy yields a Sharpe ratio of only 1.33.
Similarly, Gregorio et al. (2023) integrated external economic data into their models, leveraging LR, SVM, and RF. They evaluated their approach using Recall, Accuracy, Precision, and F1-score metrics, concentrating on BTC price predictions [69]. The inclusion of external factors adds complexity to the forecasting process. Sentiment analysis and the incorporation of textual data have gained popularity. Souza et al. (2022) employed LightGBM, XGBoost, and LR models to predict BTC, ETH, BNB, ADA, and XRP prices, emphasizing accuracy, Sharpe Ratio, and Return on Investment [70]. Analyzing market sentiment provides a unique perspective on price movements. Technical indicators, coupled with ML, have been explored extensively. Ongan et al. (2020) employed Support Vector Machines, Naïve Bayes, Random Forest, and Logistic Regression on BTC price data, focusing on metrics such as F-statistic and AccuracyStat [32]. Technical indicators offer valuable insights into short-term price trends.
Uddin et al. (2021) utilized KNN, LR, Naïve Bayes, RF, SVM, and Ensemble Gradient Boosting with various time intervals for BTC price forecasting [39]. They evaluated models using the Sharpe Ratio and Mean Return. KNN, a distance-based method, allows for flexible predictions. Several studies have expanded their focus beyond a single cryptocurrency. Kate et al. [71] applied KNN, RF, and Support Vector Regression to predict the prices of XRP, BTC, LTC, ETH, and XMR. This multi-currency approach provides a broader view of the cryptocurrency market.
Table 4.
Average ensemble performance against individual models ranked by RMSE in ascending order [71]
Table 4.
Average ensemble performance against individual models ranked by RMSE in ascending order [71]
| Ensemble | RMSE | MAE | MAPE | R2 |
|---|---|---|---|---|
| LSTM | 0.0222 | 0.0173 | 3.86% | 0.73 |
| GRU, LSTM | 0.0225 | 0.0174 | 3.89% | 0.73 |
| HYBRID, LSTM | 0.0225 | 0.0174 | 3.89% | 0.73 |
| HYBRID, GRU, LSTM | 0.0226 | 0.0175 | 3.90% | 0.73 |
| LSTM, KNN | 0.0227 | 0.0175 | 3.92% | 0.73 |
| GRU, LSTM, KNN | 0.0227 | 0.0176 | 3.91% | 0.72 |
| GRU, LSTM, TCN | 0.0227 | 0.0176 | 3.92% | 0.72 |
| LSTM, TCN | 0.0227 | 0.0176 | 3.93% | 0.72 |
| HYBRID, LSTM, KNN | 0.0227 | 0.0175 | 3.92% | 0.72 |
| HYBRID, GRU and more | 0.0227 | 0.0175 | 3.91% | 0.72 |
Asgarim et al. (2022) [72] utilized a multi-model ensemble approach for Bitcoin price prediction, incorporating models such as Multilayer Perceptron, Linear Regression, Bayesian Ridge Regression (BRR), Random Forest Regression, Lasso Regression, Support Vector Regression, and Differential Evolution (DE). Their predictions had a 24-hour time horizon, with evaluation based on Mean Squared Error. The study reported 1,002 BTC data samples but did not specify the training/testing split. Many researchers have combined ML models with traditional technical indicators for cryptocurrency forecasting. Zhang et al. (2020) utilized Logistic Regression, Support Vector Machines, Random Forest, XGBoost, and LightGBM, while also considering technical indicators [66]. The inclusion of technical indicators adds a layer of insight into price predictions.
Samuel et al. [65] honed their research, concentrating solely on Bitcoin’s cryptocurrency forecasting. They introduced the concept of ensemble models, with a meta-learner encompassing two base learners: Random Forest and Generalized Linear Model via penalized maximum likelihood, alongside Support Vector Regression with a linear kernel. Their meticulous analysis, employing various evaluation metrics, unearthed the ensemble model’s prowess, yielding impressive MAPE, RMSE, MAE, and R2 values.
Further expanding the horizon, Kwon et al. [54], also in 2019, navigated cryptocurrency forecasting through the prism of Deep Learning and Machine Learning. Their Long Short-Term Memory DL model and Gradient Boosting ML classifier embraced a 10-minute prediction window, spanning multiple cryptocurrencies. Impressively, LSTM consistently demonstrated superior predictive capabilities across all cryptocurrencies.
Meanwhile, Malekia et al. [45] conducted a comprehensive study involving various cryptocurrencies, including BTC, ETH, ZEC, and LTC. Their research primarily employed price data and diverse Machine Learning classifiers, evaluating models with metrics such as Mean Squared Error and Mean Absolute Percentage Error. Notably, their innovative approach involved using the Lasso Regression algorithm to forecast BTC prices when direct price information was unavailable. Hammoudeh et al. (2020) [42] incorporated Blockchain Data and Price Data for BTC with various time horizons (1d, 7d, 30d, 90d) for SVM with other DL methods. They evaluated using MAE, RMSE, MAPE, Accuracy, F1, AUC, and ROC.
5.2.3. Time Series Forecasting with Prophet and Boosting Models
Time series forecasting, employing Prophet and boosting models, has emerged as a prevalent Machine Learning approach in cryptocurrency forecasting, showcasing promising results in recent studies. For instance, Iqbal et al. (2021) used Prophet and XG Boosting models for BTC price predictions, focusing on RMSE, Mean Absolute Error, and R-squared [73]. These models offer insights into short-term price fluctuations and trends. Their developed random forest model helps anticipate such regime changes by incorporating features from the analysis of user-generated data from Google Trends, Twitter, and Reddit. Similarly, Lim et al. (2022) utilized the Prophet and XGBoost models for BTC, ETH, and XRP price forecasting. Their evaluation criteria included RMSE [74]. The proposed 1DCNN-GRU model outperformed existing methods, achieving the lowest RMSE values of 43.933 on the BTC dataset, 3.511 on the ETH dataset, and 0.00128 on the XRP dataset. Han et al. (2019) [54] utilized gradient-boosting models for cryptocurrency forecasting, covering BTC, ETH, XRP, BCH, LTC, DASH, ETC, and KRW. Their evaluation criteria included accuracy, recall, precision, and F1-score, with a time horizon of 10 minutes. A substantial dataset with 48,816 samples per currency allowed for robust model training.
Sunny et al. (2021) [75] examined Time Series models, including Prophet, alongside XGBoost for Bitcoin price forecasting. The study did not specify the time horizon or evaluation metric but mentioned using Mean Absolute Percentage Error and R-squared. No information was given regarding data samples or the training/testing split. Dhawale et al. (2020) focused on sentiment analysis for BTC using XGBoost models. Their study delves into the role of sentiment data in predicting cryptocurrency price movements [76].
Abbasib et al. (2022) expanded their focus to BTC and utilized Random Forest, XGBoost, and LightGBM models. Their work is relevant to multi-currency forecasting, similar to Carraro et al. (2023) in the previous section [77]. Zhang et al. (2023) leveraged the Light Gradient Boosting Machine and XGBoost models for price predictions of BTC, ETH, BNB, AVAX, and SOL. Their focus was on accuracy, emphasizing the potential of gradient-boosting techniques in cryptocurrency forecasting [78]. Kolokotronis et al. (2021) used the XGBoost model for Ether price prediction, incorporating blockchain data and technical indicators. Their evaluation criteria included MAE, RMSE, Mean Absolute Percentage Error, and R-squared metrics [79]. This study is relevant to the integration of blockchain data and technical indicators mentioned earlier.
Khasteh et al. (2021) [59] conducted a study in cryptocurrency forecasting with a focus on multiple digital assets, including ETH, LTC-BTC, and ZEC-BTC. Their approach involved employing K-Nearest Neighbors, Extreme Gradient Boosting, and Random Forest as forecasting methodologies. The time horizon for predictions was 4 hours, providing insights into short-term cryptocurrency price movements. The models’ performance was assessed using accuracy as the primary evaluation metric.
Tapan et al. [76] concentrated on Bitcoin price prediction, utilizing sentimental data as input features and the XGBoost algorithm. Their study highlighted the efficacy of XGBoost in predicting Bitcoin price trends within a 24-hour horizon.
In 2021, Dimitrios et al. [79] conducted a cryptocurrency price prediction study focused exclusively on Ether. Their research integrated blockchain data and technical indicators as input features and applied the XGBoost Machine Learning classifier, alongside other Deep Learning models. The analysis was limited to a 24-hour time horizon, with an 80/20 training/testing data split. The study evaluated model performance using metrics such as Mean Absolute Error, Root Mean Squared Error, and R-squared. Notably, the research highlighted the significance of technological features in predicting ETH prices and suggested that Deep Learning approaches outperformed the XGBoost model in this specific forecasting context [79].
In 2021, Mahir et al. [73] conducted a cryptocurrency forecasting study exclusively focusing on Bitcoin. Their research centered on historical price data, employing Machine Learning models such as XGBoost and the Prophet model, alongside Statistical models, to predict BTC price movements within a 24-hour time horizon. For the evaluation of their predictive models, they utilized key metrics including Root Mean Squared Error, Mean Absolute Error, and R-squared. Notably, their study identified Statistical models as the most effective for forecasting BTC prices in the cryptocurrency market, achieving a notable RMSE score of 322.4 and an MAE score of 227.3. These results underscore the robustness and accuracy of Statistical approaches in predicting cryptocurrency prices, particularly for Bitcoin.
Han et al. (2019) [54] used Price Data for multiple cryptocurrencies with a 10-minute time horizon. They applied the GB model and evaluated using Accuracy, Recall, Precision, and F1. Iqbal et al. (2021) [73] focused on Price Data for BTC, using the Prophet and XG Boosting models with a 24-hour time horizon. They evaluated using RMSE, MAE, and R2. Gessl et al. In (2023) [62] incorporated External Economic Data, Price Data, and Blockchain Data for BTC and LONA. They employed the RF model with a 24-hour time horizon and evaluated using R2, MAE, and MSE. Sunny et al. (2021) [75] focused on BTC Price Data and Technical Indicators. They employed ARIMA, Prophet, and XGBoost models and evaluated using MAPE and R2. Lim et al. (2022) [74] used Price Data for BTC, ETH, and XRP, applying the Prophet and XGBoost models. They evaluated models using RMSE.
5.3. Summarized Literature Review of Machine Learning Approaches
In this section, this survey presents a summarized literature review of Machine Learning approaches utilized in cryptocurrency price prediction. The table A1 provides an overview of various methodologies, time horizons, currencies, evaluation metrics, data samples, and training/testing strategies employed in the literature. This summary aims to provide insights into the diverse range of machine-learning techniques applied to analyze cryptocurrency price movements and trends.
6. Use of DL in Cryptocurrency Forecasting
Deep Learning has emerged as a powerful tool for cryptocurrency price prediction, owing to its capability to capture intricate patterns and dependencies in data. The section 6 unfolds into three distinct categories, each offering a specialized perspective on the application and evolution of Deep Learning in cryptocurrency forecasting. Firstly, the detailed analysis and trends in Deep Learning studies (6.1) examine the methodological difficulties and emerging patterns prevalent in recent research endeavors. Secondly, studies utilizing Deep Learning for cryptocurrency (6.1.1) delve into specific case studies and methodologies employed to forecast digital asset prices leveraging Deep Learning architectures. Lastly, the summarized literature review of Deep Learning approaches (6.3) encapsulates a synthesis of existing literature, clarifying key insights and advancements in the field of Deep Learning applied to cryptocurrency forecasting. Together, these subsections provide a comprehensive overview of the landscape, facilitating a deeper understanding of the complexities and innovations driving Deep Learning applications in cryptocurrency forecasting.
6.1. Detailed Analysis and Trends in Deep Learning Studies
In this dedicated section will explore how Deep Learning techniques are utilized to predict changes in the cryptocurrency market. Deep Learning involves using advanced computer algorithms to analyze vast amounts of data, identifying patterns and making forecasts. This study investigation will delve into the specific methods employed, which cryptocurrencies are most commonly studied, and how researchers analyze time-related factors to make accurate predictions. By examining these aspects, this study aims to shed light on the role of Deep Learning in understanding and forecasting trends within the cryptocurrency market.
6.1.1. Methodological Trends in Machine Learning Literature
Deep Learning methodologies serve as fundamental pillars in shaping research endeavors and scholarly studies within the Machine Learning domain. In Figure 10 an examination of the distribution of methodologies specific to Deep Learning sheds light on prevalent trends across various research papers. Among the surveyed studies, Long Short-Term Memory networks emerge as the predominant methodology, featured in 108 research papers, constituting 51.4% of the pie chart. Following LSTM, Gated Recurrent Unit architectures are employed in 32 papers, representing 15.2% of the distribution. RNN employed in 20 papers, representing 9.5%. Multilayer Perceptrons, Artificial Neural Networks, and Convolutional Neural Networks each find application in 14 papers, accounting for 6.7% of the literature per methodology. This distribution underscores the substantial utilization of LSTM networks and GRU architectures in Deep Learning studies, indicating their prominence in addressing various research inquiries and challenges. Furthermore, the presence of MLPs, ANNs, and CNNs reflects the diversity of methodologies employed in advancing Deep Learning applications within academic research.
Figure 10.
Methodology-wise distribution in Deep Learning studies: utilization of various architectures across research papers
Figure 10.
Methodology-wise distribution in Deep Learning studies: utilization of various architectures across research papers
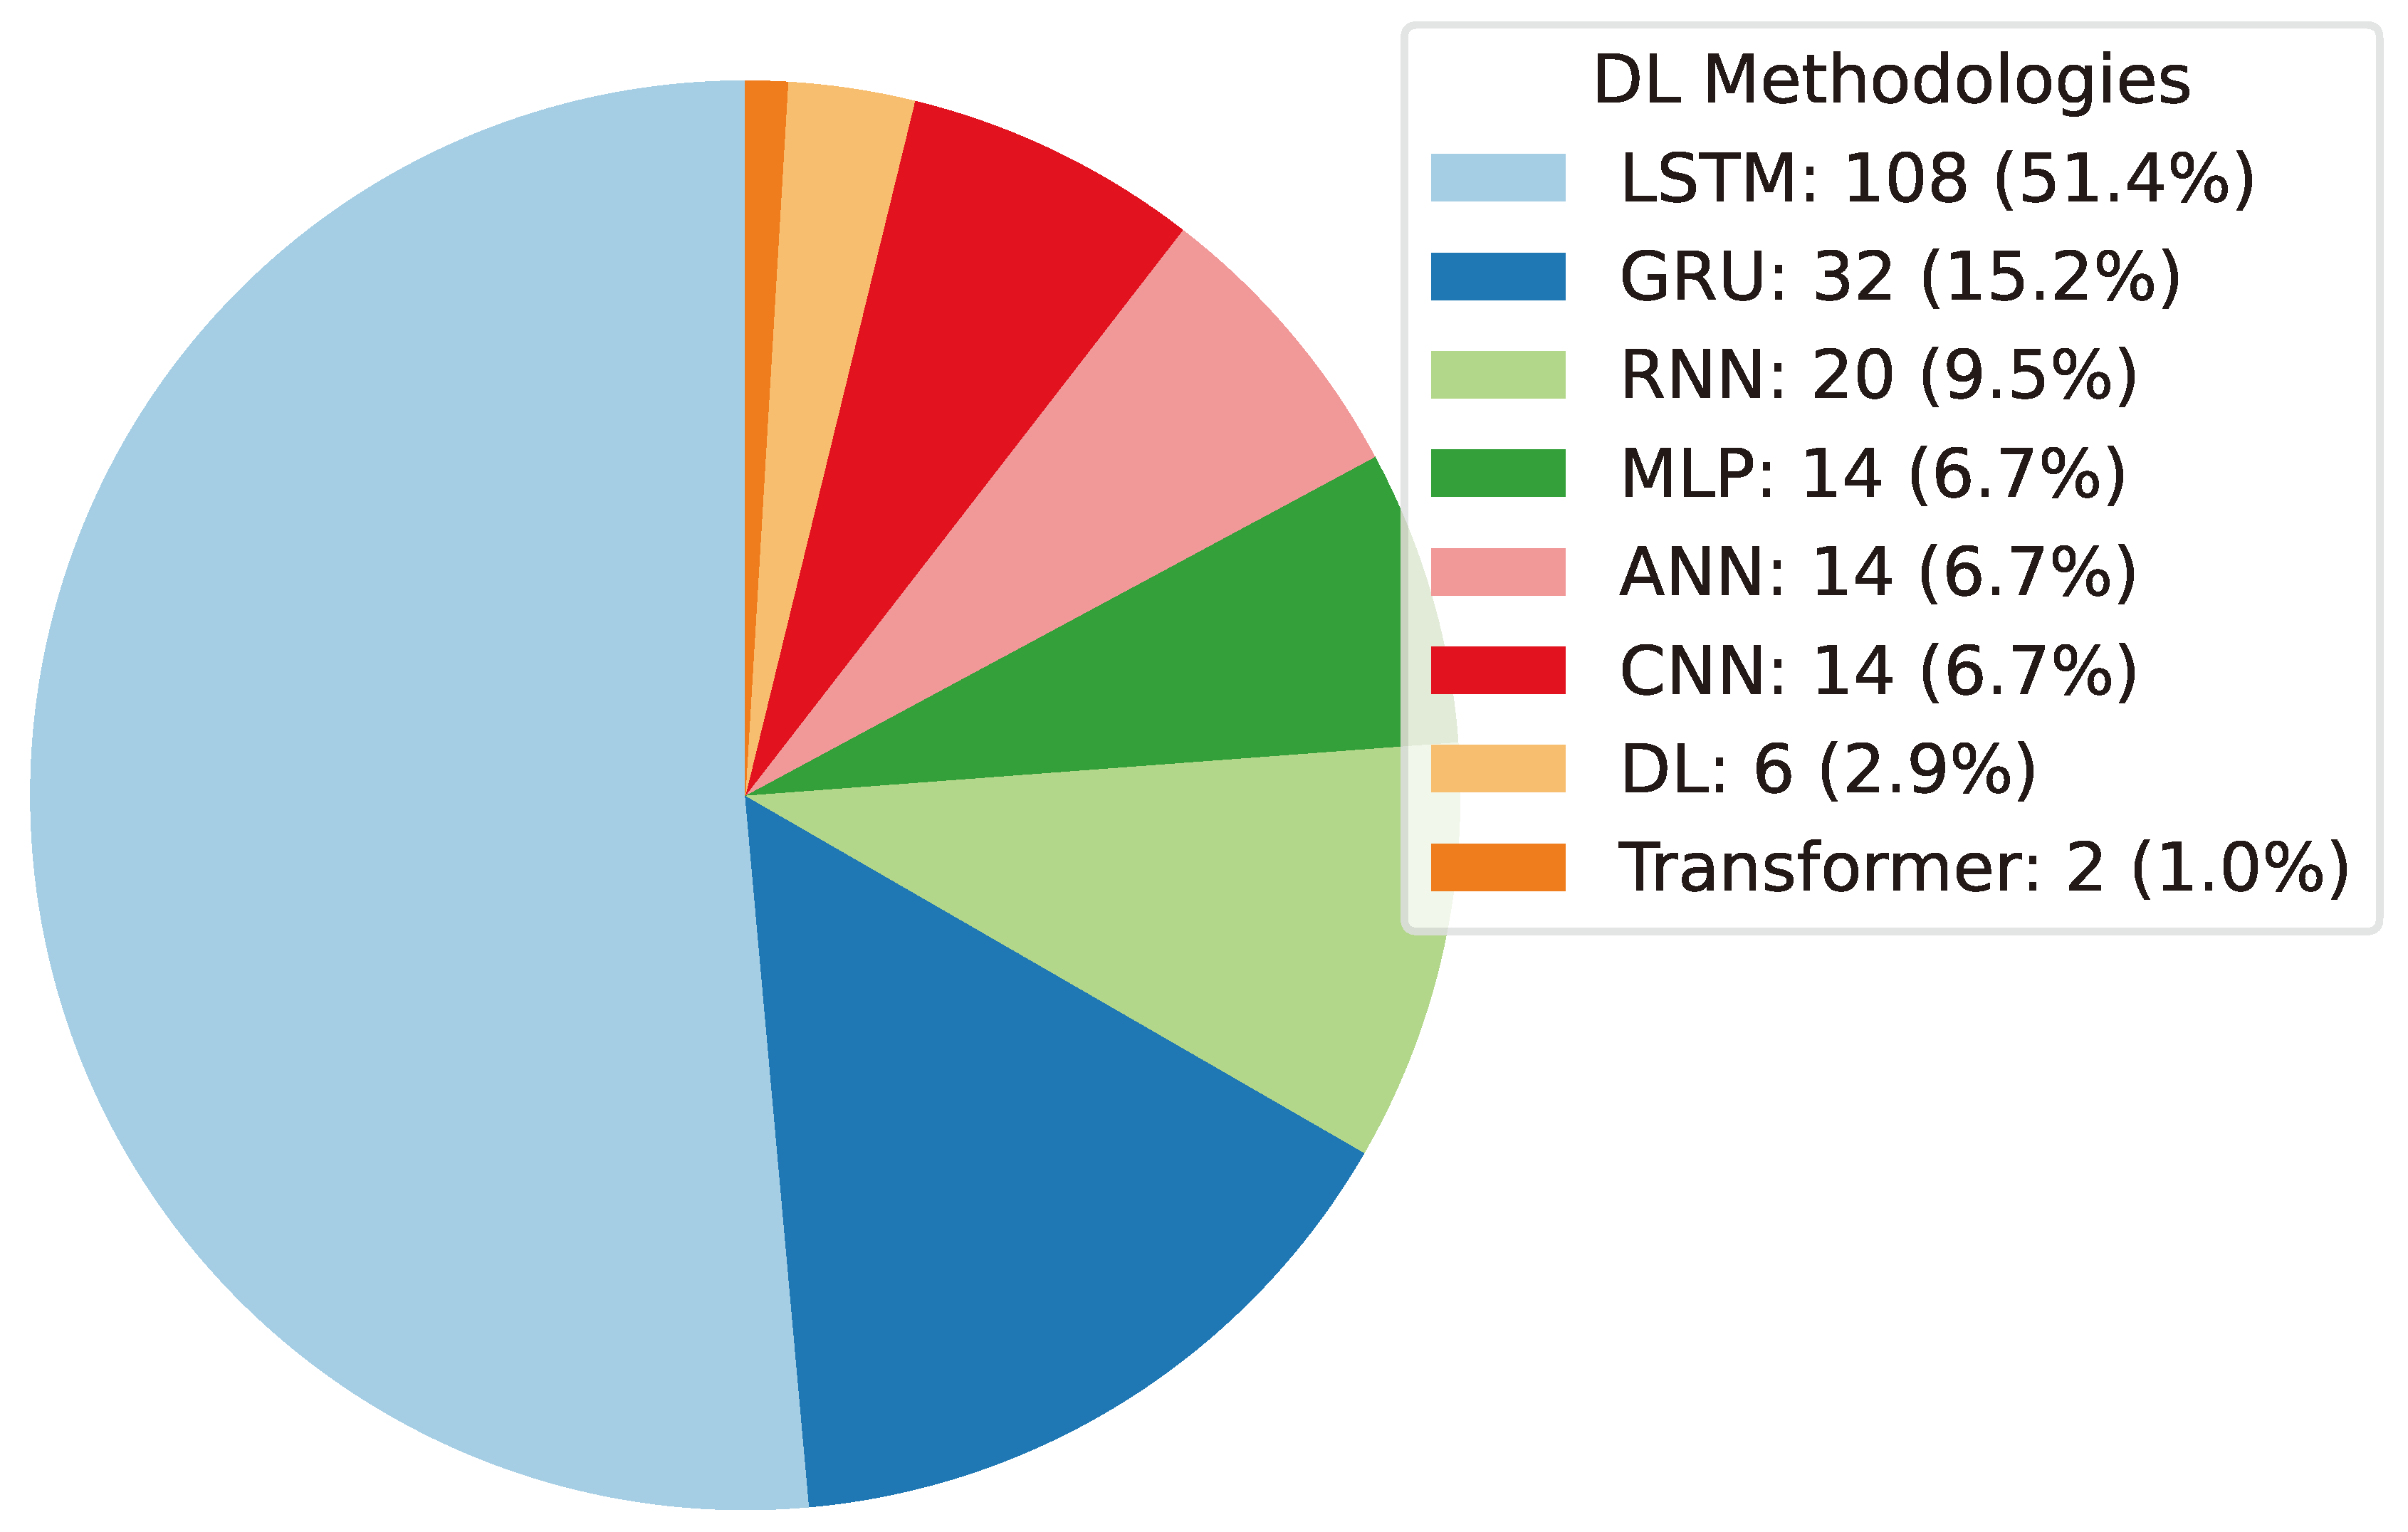
6.1.2. Currency-Wise Distribution in Deep Learning Studies
The currency-wise distribution within Deep Learning studies provides valuable insights into the prevalence of various cryptocurrencies across research papers. Bitcoin emerges as the dominant cryptocurrency, utilized in 39.9% of the surveyed studies. Ether follows with a significant presence, being employed in 14% of the research papers. Litecoin and XRP are also notable, utilized in 6.5% of the studies. This distribution reflects the diverse applications and interests within the intersection of Deep Learning and cryptocurrency domains, offering researchers a glimpse into the prevalent trends and preferences in utilizing cryptocurrencies for Deep Learning experiments and investigations.
Figure 11.
Currency-wise distribution in Deep Learning studies: proportional utilization of cryptocurrencies across research papers
Figure 11.
Currency-wise distribution in Deep Learning studies: proportional utilization of cryptocurrencies across research papers
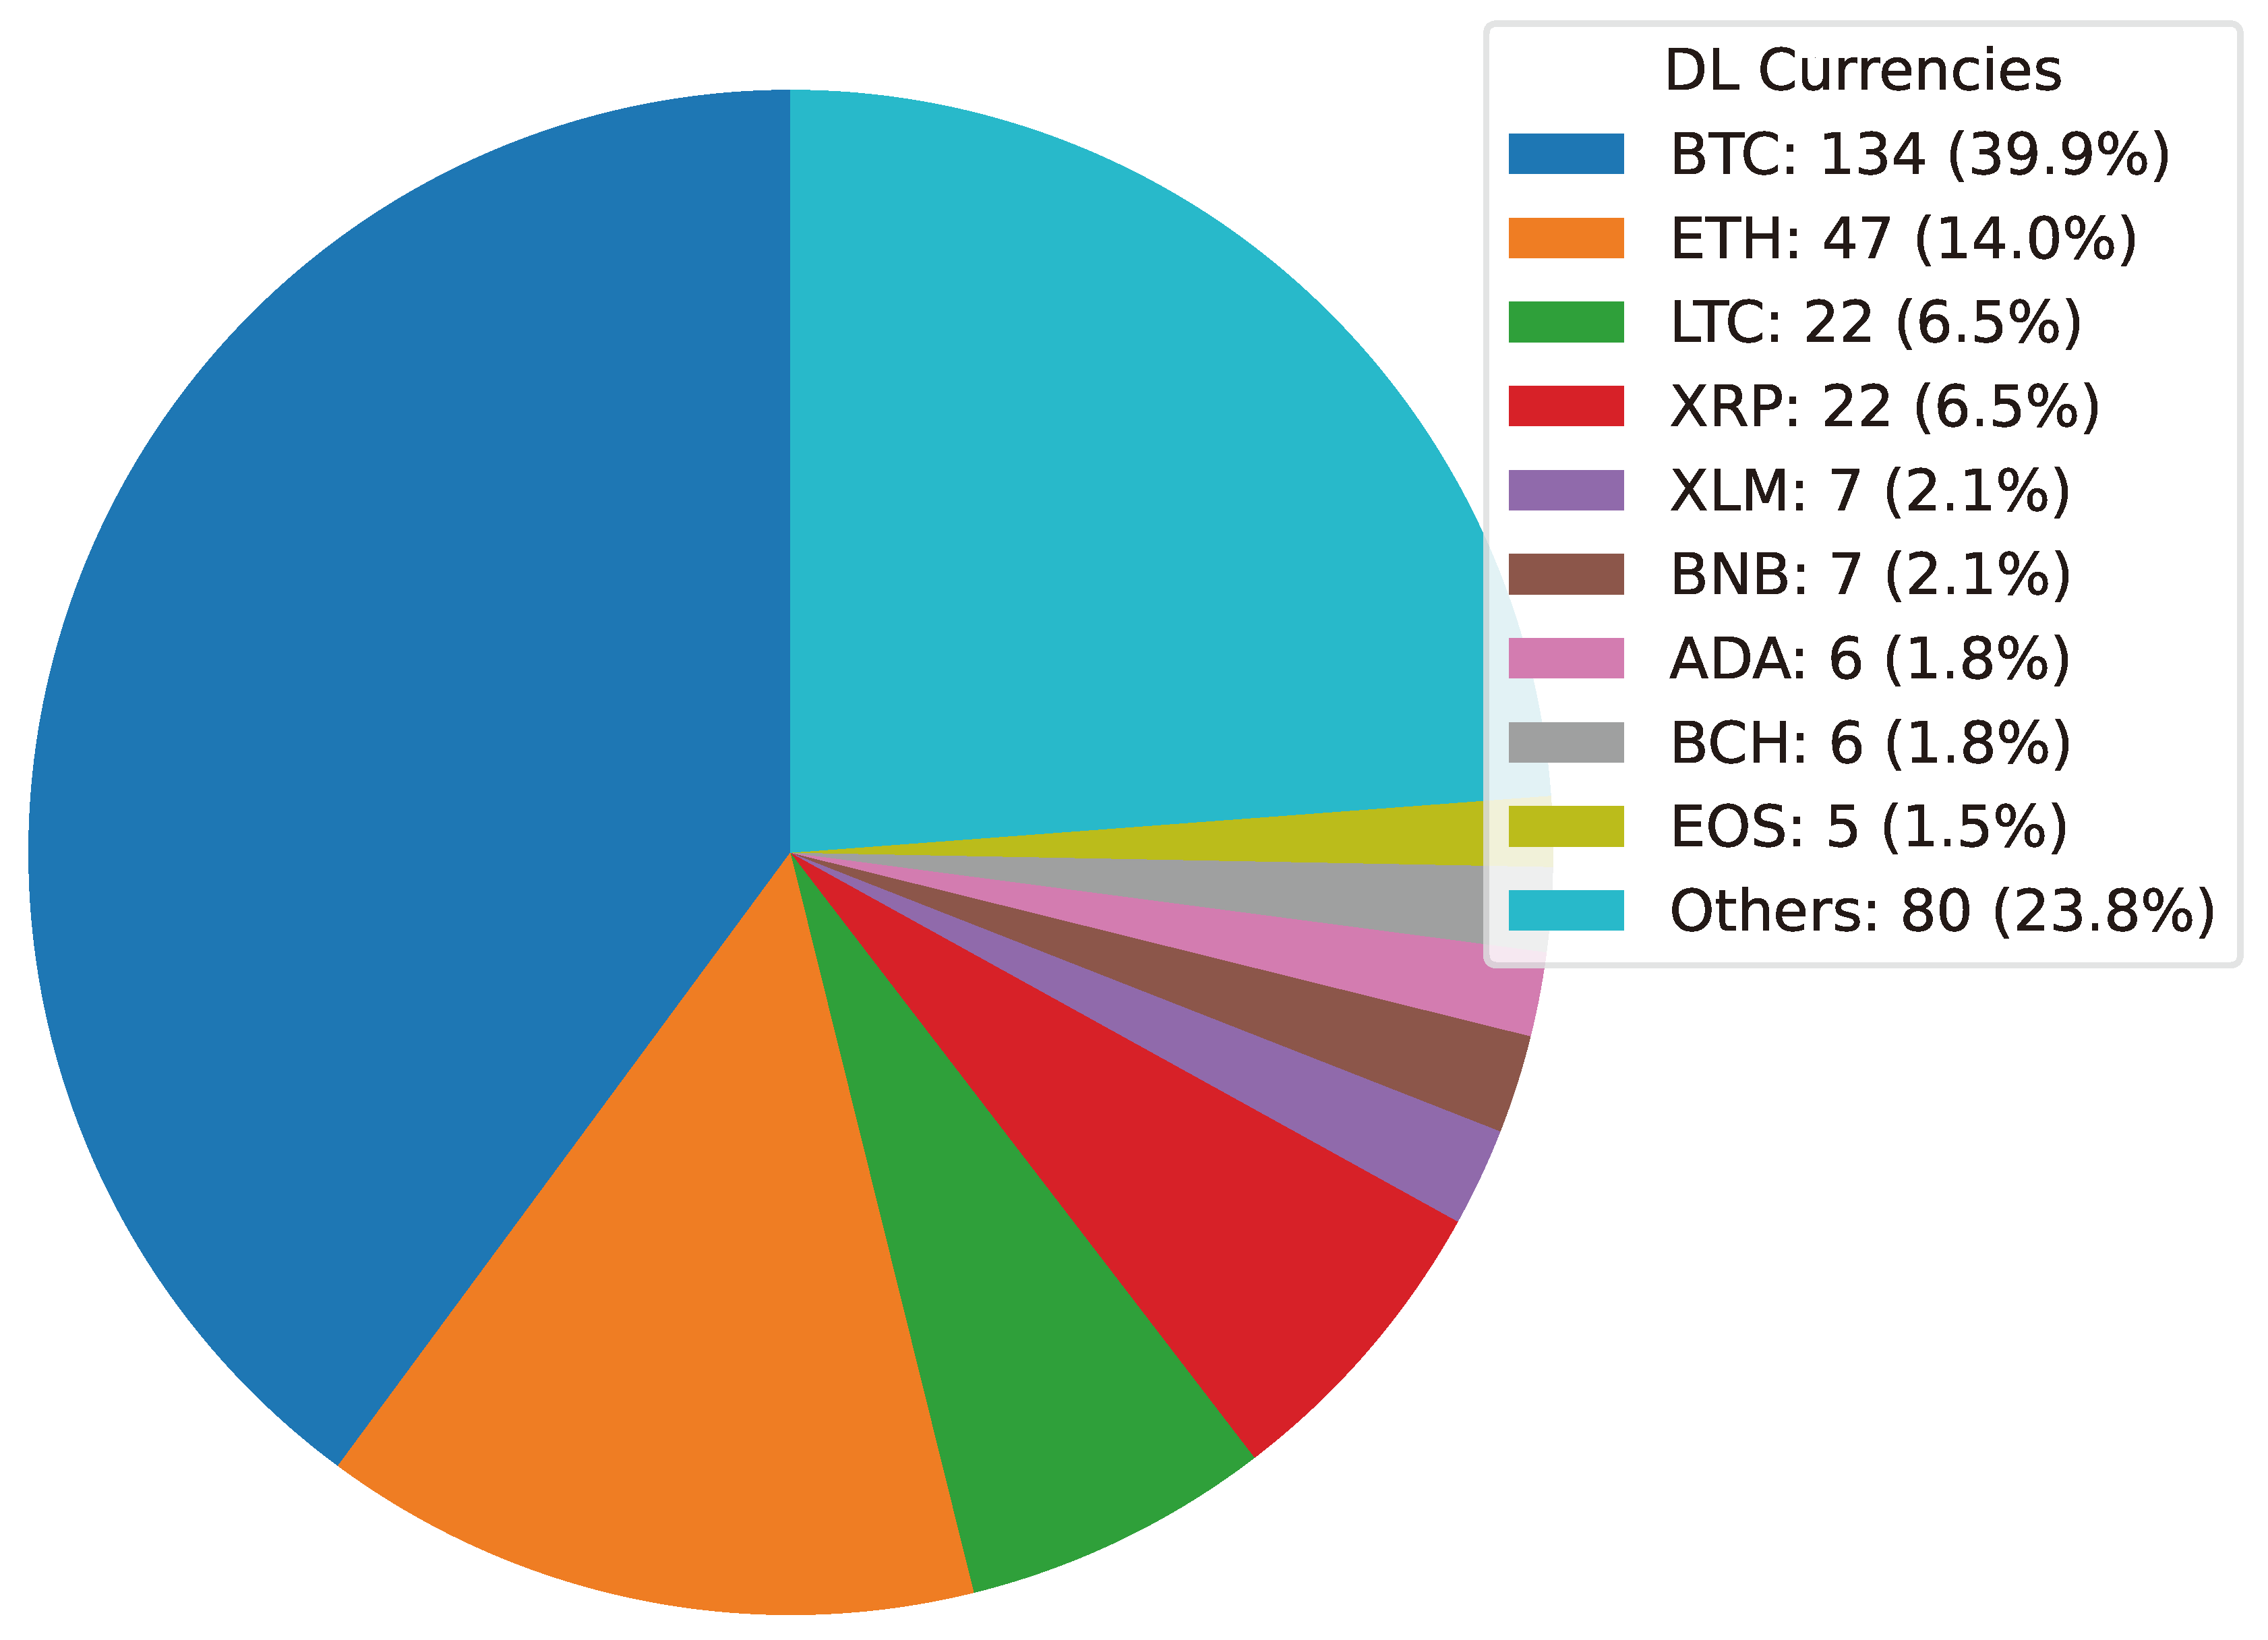
6.1.3. Time Horizon-wise Distribution in Deep Learning Studies
An examination of time horizon-wise distribution within Deep Learning studies reveals patterns in temporal considerations across research endeavors. The analysis indicates that a significant majority of studies, 59.5%, focus on a 24-hour time horizon. Additionally, a smaller proportion of studies delve into shorter time intervals, with 5.8% considering a 1-hour horizon and 5.2% interpreting data at a minute-level granularity. This distribution underscores the importance of temporal considerations in Deep Learning research, highlighting the prevalence of investigations spanning varying time scales. Such insights are crucial for understanding the methodologies and applications within the Deep Learning domain.
Figure 12.
Time horizon-wise distribution in Deep Learning studies: proportional analysis of temporal considerations across research papers
Figure 12.
Time horizon-wise distribution in Deep Learning studies: proportional analysis of temporal considerations across research papers
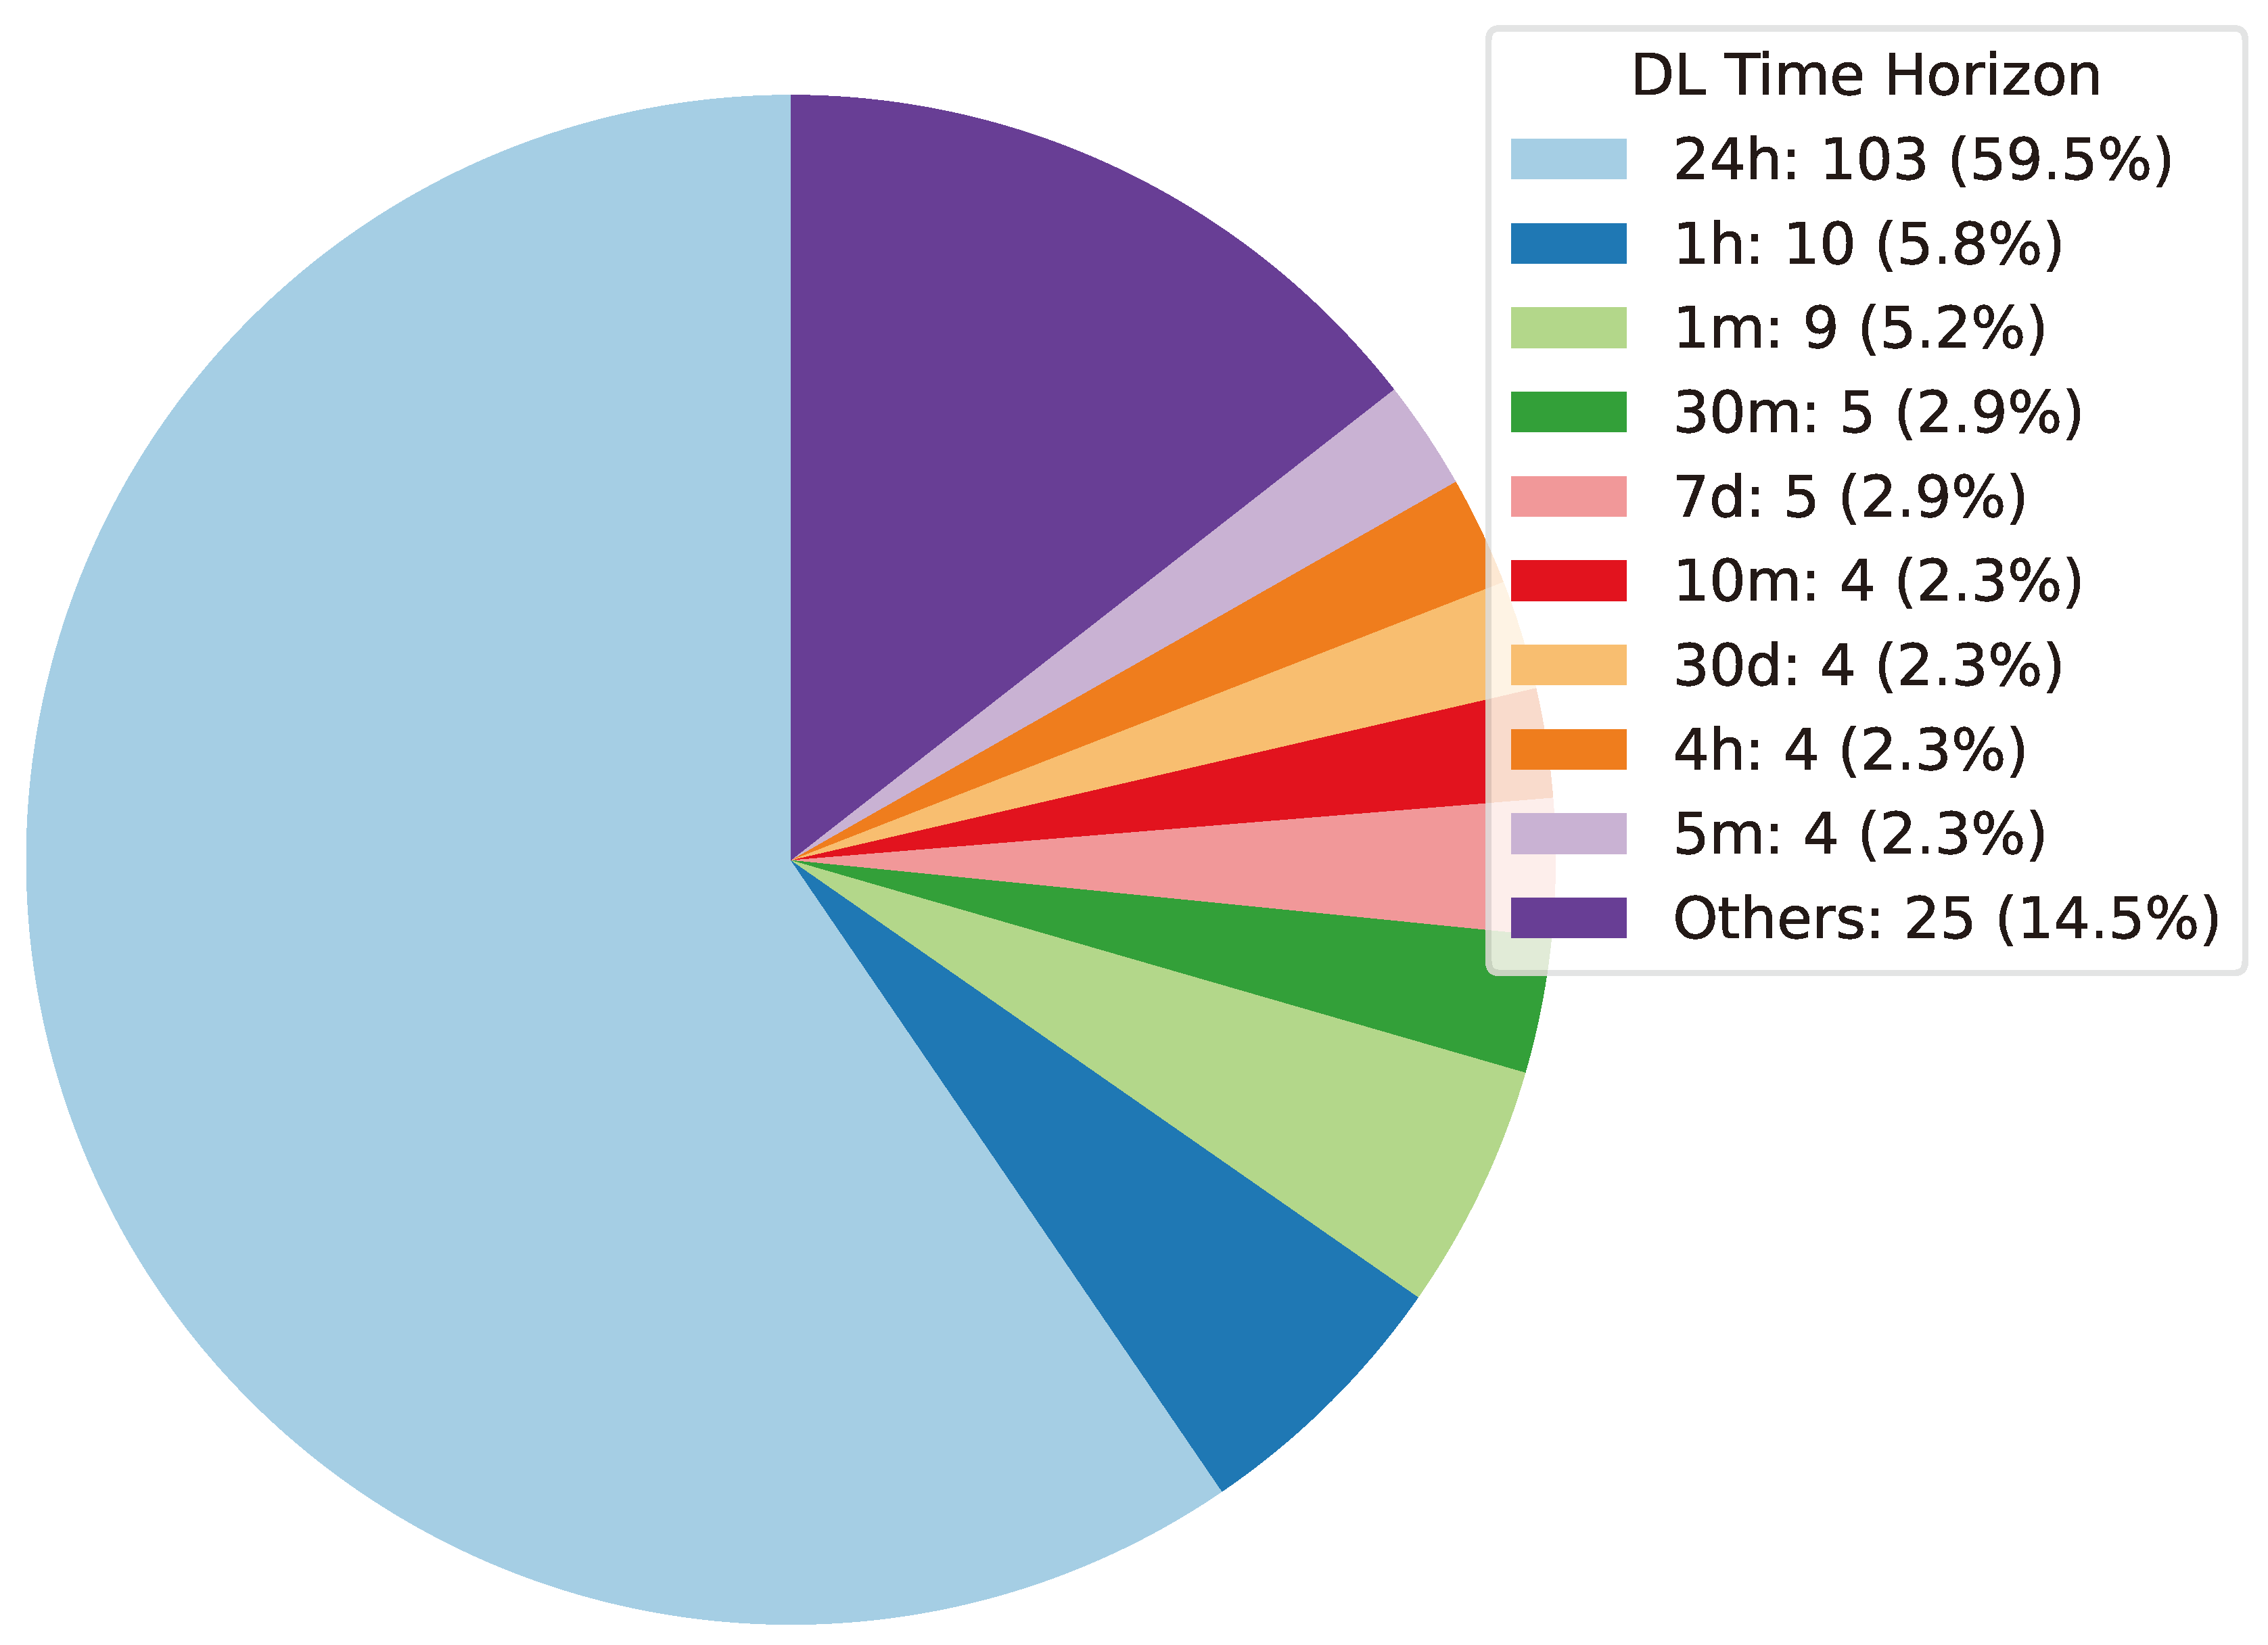
6.2. Deep Learning Techniques Utilized in Cryptocurrency Forecasting
Deep Learning has become a powerful tool in predicting cryptocurrency prices due to its capability to capture complex patterns and dependencies in data. In this survey paper, various applications of DL techniques such as Recurrent Neural Networks, Convolutional Neural Networks, Long Short-Term Memory Networks, Artificial Neural Networks, Multilayer Perceptrons, Gated Recurrent Units, and Transformers are explored for cryptocurrency forecasting.
This study explores the evolution of Deep Learning models, their performance, and the valuable insights they offer in predicting cryptocurrency prices. By thoroughly investigating the use of Deep Learning techniques in cryptocurrency forecasting, this research paper aims to reveal patterns and dynamics within cryptocurrency markets. This will enable more precise predictions in the rapidly changing landscape of digital currencies.
6.2.1. Artificial Neural Network
In 2015, João et al. [80] embarked on a significant study dedicated to cryptocurrency forecasting, with a specific focus on Bitcoin’s historical price. Their research harnessed the capabilities of an Artificial Neural Network as a predictive model for forecasting Bitcoin prices within a 24-hour time frame. This pioneering work marked a significant effort in the field of cryptocurrency price predict ion, employing ANNs as a methodology to address the challenges of short-term price forecasting.
In 2018, Nor et al. [27] and Brandon et al. [81] conducted research studies to predict the prices of various cryptocurrencies within a 24-hour time horizon. Their approach involved utilizing price data as the primary input feature for predicting price values. In the study conducted by Nor et al. [27], the research methodology incorporated the use of Artificial Neural Networks, in addition to other Machine Learning and Deep Learning methods as discussed in Section 5 Section 6. The aim was to forecast the prices of six distinct cryptocurrencies, specifically BTC, ETH, and more. The findings from Nor et al. [81] indicated that ANN yielded the most promising results, particularly in the context of predicting BTC prices. In the research conducted by Brandon et al. [81], their research methodology focused on the implementation of a Deep Learning model for predicting Bitcoin prices. The conclusions drawn by Brandon et al. [81] suggested that their proposed Deep Learning-based model achieved the most favorable results when trained for 10 epochs.
In 2019, Franco et al. [29] conducted an insightful research study aimed at predicting the prices of various cryptocurrencies over a 24-hour time horizon. Their approach was multifaceted, as they integrated both price data and sentimental data into their predictive model. Specifically, they sought to forecast the prices of four distinct cryptocurrencies, namely BTC, ETH, XRP, and LTC. Franco et al.’s research methodology encompassed the utilization of Artificial Neural Networks, alongside a diverse array of Machine Learning and Deep Learning methods discussed in Section 5 Section 6. Their comprehensive analysis led to a compelling conclusion – their proposed Deep Learning model outperformed the other methods employed, particularly in the context of predicting BTC prices. Remarkably, the Deep Learning model they proposed demonstrated exceptional accuracy, surpassing 0.72, and an impressive precision rate of 0.76. This underscores the significance of their findings in the realm of cryptocurrency price prediction, and their research serves as a noteworthy contribution to this field.
That same year, Rini et al. [82] conducted a research study to predict Bitcoin prices within a narrow 1-hour time horizon. Their approach revolved around the incorporation of price data as the primary input feature for their predictive model. Rini et al.’s research methodology was grounded in the application of an Artificial Neural Network. After thorough investigation and analysis, they arrived at a compelling conclusion. Their findings indicated that an ANN-based model utilizing the backpropagation method exhibited greater effectiveness in the prediction of Bitcoin prices, underscoring the potential of this approach for accurate short-term price forecasting.
In 2020, Hakan et al. [32] conducted a comprehensive research study to predict Bitcoin prices. Their approach entailed the utilization of price data in conjunction with technical indicators data as the primary input features for their predictive model. Hakan et al. [32] research methodology encompassed the deployment of Artificial Neural Networks, along with an array of other Machine Learning and Deep Learning methods, as elucidated in Sections III-A and III-B. To assess the performance of their models, they employed a range of key metrics, including the F-statistic, AccuracyStat, Mean Absolute Error, Root Mean Square Error, and Relative Absolute Error (RAE). Their findings revealed that their ANN model performed the best, especially with discrete datasets.
In 2022, Jaehyun et al. [83] and Zubair et al. [84] conducted separate research studies with the common goal of predicting the prices of various cryptocurrencies over a 24-hour time horizon. Their chosen input feature was price data. Jaehyun et al. [83] employed a Deep Learning-based model as their research methodology to predict the prices of BTC, ETH, and more. Their research findings were remarkable, indicating that their proposed Deep Learning-based model achieved results that were 13% to 21% higher compared to alternative methods. On the other hand, Zubair et al. Ababneh2022 implemented an Artificial Neural Network in conjunction with various Machine Learning and Deep Learning models to predict the prices of BTC and ETH. Interestingly, Zubair et al. found that their ANN approach outperformed other Deep Learning and Machine Learning methods, highlighting the efficacy of ANN in this context. Also in 2022, Si Chen et al. [85] conducted a research analysis focused on Bitcoin price movements within a 1-hour time horizon. Notably, they integrated Blockchain data as the primary input feature for their proposed Deep Learning-based model. The performance evaluation of their model was based on two key metrics: the R-squared and Root Mean Square Error. Impressively, their proposed methods yielded an accuracy of 53.4% and a Mean Squared Error score of 1.02. These findings highlight the efficacy of their approach in accurately predicting Bitcoin price movements, making a notable contribution to this field of research.
6.2.2. Multilayer Perceptrons
In 2017, a study conducted by N.I. Indra et al. [86], introduced a Multi-Layer Perceptron base NARX (Nonlinear AutoRegressive with eXogenous inputs) prediction model. This model was specifically designed to forecast Bitcoin’s price over 24 hours. To fuel their model’s predictions, the researchers used historical Bitcoin prices ranging from March 12, 2012, to March 11, 2017. They thoughtfully divided their dataset into three parts: 75% for training, 15% for validation, and another 15% for testing. The results from their validation tests confirmed the model’s accuracy and fitting tests indicated that it performed well in capturing the dynamics of Bitcoin’s price fluctuations.
In 2022, Chuen et al. [74] and Stanley et al. [52] conducted research studies aimed at predicting the price of Bitcoin within a 24-hour time horizon. Their primary input feature was price data. Both research teams employed Multilayer Perceptrons as their research methodology, supplemented with various other Deep Learning methods discussed in Section III-B. [74] proposed an MLP model that demonstrated exceptional performance, achieving a remarkable 99.15% regression accuracy during training and 98.80% accuracy during testing. This performance surpassed that of other implemented algorithms. Meanwhile, Stanley et al. [52] concluded that they found MLP to be an efficient and highly accurate method for predicting the future patterns of this target cryptocurrency. Their research adds to the growing body of evidence supporting the effectiveness of MLP in cryptocurrency price prediction.
In 2023, Andrés et al. [87] and Tiago et al. [88] conducted research studies dedicated to predicting the prices of various cryptocurrencies within a time horizon ranging from 1 to 24 hours. Their chosen research methodology was the Multi-layer Perceptron, accompanied by additional Deep Learning and Statistical models outlined in Sections III-B and III-C. In their respective studies, Andrés et al. [87] incorporated price data to forecast the prices of BTC, ETH, BCH, Tether, LTC, Eos, BNB, BTC SV, XLM, and TRX, whereas Tiago et al. [88] focused solely on predicting BTC prices. [87] found that MLP models consistently delivered the most accurate predictive results. In contrast [88] emphasized the strengths of MLP models, particularly their ability to provide smoother forecasts with reduced fluctuation. However, they acknowledged that MLP models might face challenges in capturing significant price spikes.
6.2.3. Convolutional Neural Network
In 2017, Zhengyao et al. [89] embarked on a research endeavor focused on cryptocurrency portfolio management. Their approach centered on utilizing price data as the primary input feature. To forecast the value of various currencies over a concise 30-minute time horizon, they employed a Convolutional Neural Network . Their selection comprised the 12 most volume-based assets for this purpose. The outcomes of their research revealed the efficacy of their CNN-based trading approach, which yielded lower risk and, consequently, a higher Sharpe ratio when compared to the Predictive Asset Allocation Model. In 2019, Suhwan et al. [90] delved into the prediction of Bitcoin prices over a 24-hour time horizon. Their research hinged on the utilization of blockchain data as the primary input feature. In their quest, they implemented Convolutional Neural Networks alongside other Deep Learning models discussed in Section 6. Suhwan et al. [90] intriguingly concluded that no clear winner emerged among the Deep Learning models studied in their work. They found that the performance of all these models was comparable, emphasizing the versatility and adaptability of CNN and other Deep Learning methods in the cryptocurrency price prediction domain. This continuity over the years showcases the evolving landscape of cryptocurrency research.
In 2019, extending the timeline of cryptocurrency research Yan Li et al. [91] undertook a research study to predict Bitcoin prices over a more extended 3-day time horizon. Their approach was distinct, incorporating both price data and external economic data to enhance their predictive model. To achieve this, they devised a hybrid neural network that combined Convolutional Neural Networks and Long Short-Term Memory networks. Their comprehensive evaluation encompassed various performance metrics, including Mean Absolute Error, Root Mean Square Error, Mean Absolute Percentage Error, Precision, Recall, and the F1 score. [91] arrived at a significant conclusion, suggesting that their CNN-LSTM-based hybrid neural network demonstrated superior effectiveness in predicting both the value and direction of Bitcoin compared to using a single neural network. This approach reflects the dynamic nature of research in the field, where hybrid models show promise in enhancing predictive capabilities.
In 2022, building on the research trends, A. Saran et al. [92] embarked on a study aimed at forecasting the price of Bitcoin. Their unique approach involved utilizing price data optimized by both the Ant Colony and Grasshopper Optimizers, which was subsequently fed into a Convolutional Neural Network . The notable conclusion drawn from their research was that the synergy between a Convolutional Neural Network and optimization algorithms significantly enhanced the efficiency of Bitcoin price prediction. This amalgamation ultimately resulted in higher predictive accuracy, underscoring the potential of combining advanced neural networks with optimization techniques to further improve cryptocurrency price forecasting.
Figure 13.
Graph showing performance of different models [92]
Figure 13.
Graph showing performance of different models [92]
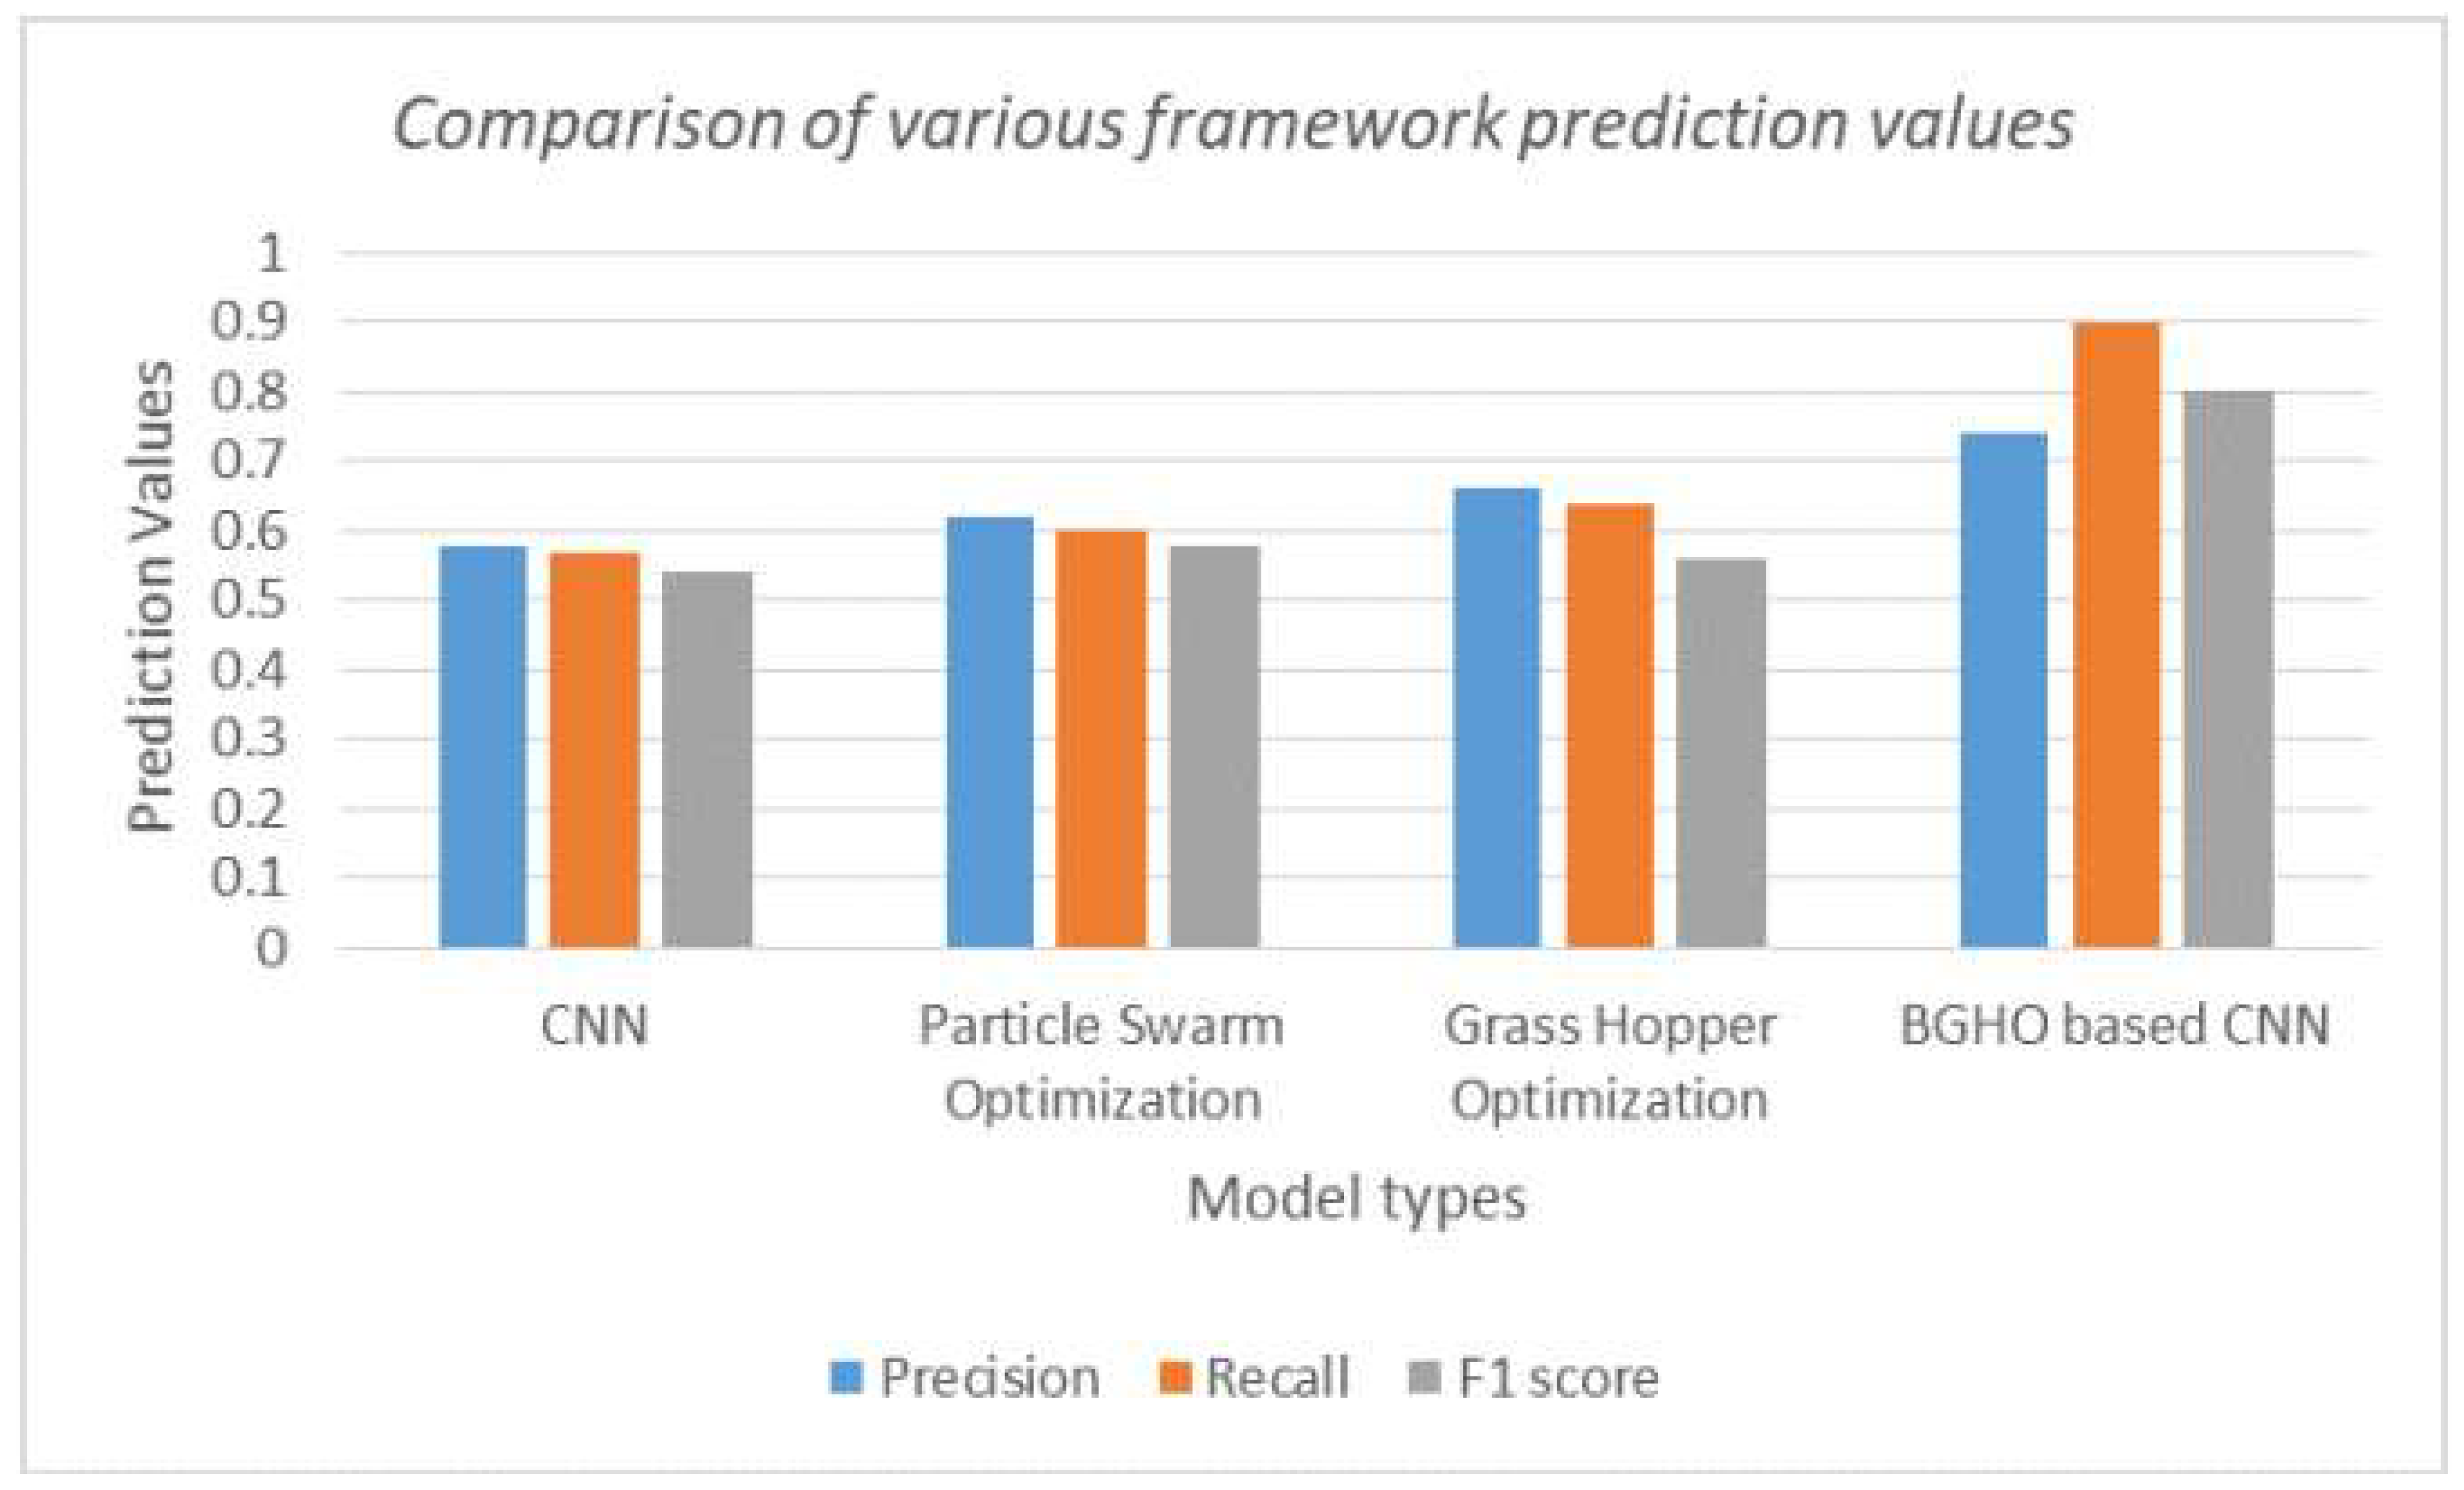
In 2023, the journey of cryptocurrency research continued with Azeez et al. [93]. Their primary goal was to predict the prices of various cryptocurrencies within a 24-hour time frame. To achieve this, they relied on a combination of price data and technical indicators data as input features. Their cryptocurrency focus encompassed BTC, ETH, BNB, LTC, XLM, and DOGE. [93] crafted a research methodology grounded in Convolutional Neural Networks, in addition to exploring other Deep Learning models discussed in Section 6. The comprehensive analysis they conducted led to an intriguing discovery - the CNN model emerged as the most reliable approach. It achieved the lowest Mean Average Percentage Error of 0.08 and a robust variance score of 0.96 on average. These outcomes highlighted the supremacy of CNN over other strategies employed in their research, underscoring the power of Convolutional Neural Networks in cryptocurrency price prediction.
In 2023, cryptocurrency research continued to evolve as Mingyu et al. [94] and Kaijian et al. [95], both dedicated to predicting the prices of diverse cryptocurrencies. They harnessed the power of price data as the primary input feature for their models, aimed at forecasting cryptocurrency values over a 24-hour time horizon. [94] adopted a research methodology centered solely around Convolutional Neural Networks, highlighting the prowess of CNNs in capturing market dynamics and making predictions effectively when market data is fed into them. [95], on the other hand, opted for a more comprehensive approach. Their methodology featured Convolutional Neural Networks along with a range of different Deep Learning models and Statistical models discussed in Section 6 Section 8. While [94] emphasized the efficacy of CNNs, [95]. proposed a versatile method that achieved effective performances in terms of cryptocurrency price predictions. In another 2023 study, Abdellah et al. [96] embarked on a focused investigation with their primary objective to predict the prices of ETH within a 4-hour time horizon. To achieve this, they employed a holistic approach, utilizing price data, technical indicators data, and sentimental data as input features. The dataset gathered comprises OHLC (Open, High, Low, Close) prices recorded at four-hour intervals over one year, spanning from November 2021 to November 2022. [96] adopted Convolutional Neural Networks as their chosen research methodology. Their comprehensive evaluation was based on essential performance metrics, including Accuracy, Precision, Recall, and the F1 score. The findings were resounding, as they concluded that the combination of diverse data types, including price, sentiment, and technical indicators data, significantly enhanced the effectiveness of CNN in forecasting inflection points and trends. Notably, their model achieved an impressive accuracy rate of 98%. They emphasize the power of incorporating multiple data sources for improved predictive accuracy.
6.2.4. Recurrent Neural Network
In 2016, Sean et al. [97] conducted a research study to predict Bitcoin prices within a 24-hour time horizon. Their approach centered on the implementation of Recurrent Neural Networks, coupled with various other Deep Learning algorithms as discussed in Section 6. They utilized both price data and blockchain data as their input features, creating a comprehensive model for their predictions. In contrast, in 2018, Ze Shen et al. [98] ventured into Bitcoin price prediction using a distinct strategy. They solely relied on price data in OHLC (Open, High, Low, Close) format to forecast Bitcoin prices over a 24-hour time horizon. Their research involved deploying Deep Learning techniques, including RNN, alongside other Statistical models as discussed in Section 8. Interestingly, [98] found that the Recurrent Neural Network method outperformed other applied methods in terms of predictive accuracy, as evidenced by their performance metrics, which included Root Mean Square Error and Mean Absolute Error.
In 2020, Aniruddha et al. [99], along with Dane et al. [100], embarked on research endeavors dedicated to predicting cryptocurrency prices. These studies took different approaches [99] hinged their research on price data and blockchain data to predict Bitcoin prices. [100], on the other hand, employed price data and sentimental data to predict the prices of BTC, XRP, and LTC within a 24-hour time horizon. Both studies shared a common research methodology involving Recurrent Neural Networks and various Deep Learning algorithms discussed in Section 6. However, the specific data sources they used set them apart. In their respective conclusions, [100] noted that including Google Trends data did not yield significant performance improvements in their models. These studies enrich our understanding of cryptocurrency price prediction, emphasizing the role of data sources and their impact on predictive outcomes.
In 2021, cryptocurrency research progressed with the works of Daniel et al. [101] and Dante et al. [102] both dedicated to predicting cryptocurrency prices within a 24-hour time horizon. Their common choice for input features was price data, yet the specifics of their approaches varied [101] leveraged OHLCV data and changes in the percentage of the U.S. dollar to predict the prices of an extensive range of cryptocurrencies, including BTC, ETH and more. [102] utilized OHLC data, volume data (from and to), conversion type, and conversion symbol to predict the prices of BTC, ETH and more. Both research studies implemented Recurrent Neural Networks in combination with various Machine Learning algorithms, as discussed in Section 5, and Deep Learning algorithms outlined in Section 6. Notably, [101] achieved impressive accuracy ranging from 88% to 100% in their models, highlighting the power of their approach. On the other hand, [102] surpassed traditional Machine Learning methods with their Deep Learning models, underscoring the efficacy of Deep Learning in cryptocurrency price prediction. These studies contribute to the ever-expanding body of cryptocurrency research, showcasing advancements in accuracy and methodology.
In 2022, the timeline of cryptocurrency research continued to evolve with several significant contributions as Monish et al. [103] and Chuen et al. [74] conducted research aimed at predicting cryptocurrency prices. They approached this task by utilizing the closing price as their primary input feature. Monish et al. [103] stood out by considering both 30-day and 90-day time horizons to predict the price of ETH. Their methodology involved the implementation of Recurrent Neural Networks in conjunction with Deep Learning, Machine Learning, and Statistical models discussed in Section 6, Section 5, Section 8.
Chuen et al. [74] focused on a 24-hour time horizon to predict the prices of three different cryptocurrencies, namely BTC, ETH, and XRP. They also utilized RNN and explored various Deep Learning, Machine Learning, and Statistical models outlined in the relevant Section 6, Section 5, Section 8. Meanwhile, Hashem et al. [104] delved into predicting the price of Bitcoin over a 24-hour time horizon. Their approach involved using price data and market capitalization as input features. They also relied on Recurrent Neural Networks as their chosen methodology, supplemented with other Deep Learning algorithms. n the same year Ema et al. [77], focused on Bitcoin price prediction over a 1-hour time horizon. They utilized price data, specifically OHLCV, as their input features for their model. Adding to the 2022 research landscape, Patnaikuni et al. [105] conducted a study dedicated to predicting the price of Bitcoin within a 24-hour time horizon. Their research methodology involved price data, specifically OHLCV, as input features, which were processed using Recurrent Neural Networks, alongside other Deep Learning and Machine Learning methods as discussed in Section 6, Section 5, Section 8. These studies collectively contribute to the ongoing advancement of cryptocurrency price prediction, showcasing the diversity of approaches and methodologies employed in the field during the year 2022.
In 2023, cryptocurrency research was expanded more with the study of Dzaki et al. [106], J. Sasikumara et al. [107], and K. Tejasri et al. [108]. These studies were dedicated to predicting the prices of Bitcoin, with [106] extending their scope to include ETH in their price-prediction models. Their primary input features consisted of price data and market capitalization data, forming the foundation of their analyses. The common thread in their research methodology was the utilization of Recurrent Neural Networks and other Deep Learning algorithms, as discussed in Section 6. These advanced techniques allow for a more in-depth analysis of cryptocurrency price trends and patterns. Of particular note, K. Tejasri et al. [108] observed that the Recurrent Neural Network proved to be effective in predicting Bitcoin prices over a 24-hour time horizon. Their comprehensive evaluation encompassed critical performance metrics, including Mean Squared Error, Mean Absolute Percentage Error, and Root Mean Square Error. These studies in 2023 continue to contribute to the evolving field of cryptocurrency research, emphasizing the effectiveness of advanced neural network models like RNN in predicting cryptocurrency prices.
In the same year 2023, Madhusekhar Yadla et al. [109] and Tiago et al. [88] contributed to the ongoing exploration of cryptocurrency price prediction. Madhusekhar Yadla et al. [109] focused on predicting Bitcoin prices by leveraging both price data and sentimental data. Their research revealed that Recurrent Neural Networks outperformed Long Short-Term Memory Networks in their predictive models. Simultaneously, Tiago et al. [88] conducted a research study to predict Bitcoin prices over a 24-hour time horizon. Their methodology revolved around RNN, complemented by other Deep Learning and Statistical methods, as discussed in Section 6 and Section 8. They utilized closing prices as their primary input feature. In their respective conclusions, Tiago et al. [88] noted that RNN provided smoother forecasting results but encountered challenges in capturing significant price spikes.
6.2.5. Long Short Term Memory
In 2016, Sean et al. [97] conducted a study to predict Bitcoin’s price. Their research strategy included the utilization of Recurrent Neural Networks and Long Short-Term Memory models. What set their approach apart was the incorporation of both price data and blockchain data as inputs, aimed at enhancing predictive accuracy. To evaluate the model’s performance, Sean et al. [97] divided their dataset into training and testing sets, following an 80/20 ratio. The dataset they employed encompassed a time range spanning from the 19th of August 2013 to the 19th of July 2016. The findings from their study were remarkable, as the LSTM model outperformed other methods, achieving the highest classification accuracy at 52% and a Root Mean Square Error of 8%. This research represented a pivotal moment in cryptocurrency price prediction, showcasing the potential of advanced neural network models in addressing the complex task of forecasting cryptocurrency prices.
In 2018, Kejsi et al. [110] carried out a comprehensive study aimed at predicting the price of Bitcoin. Their approach was notably multifaceted, incorporating price data, blockchain data, and sentimental data to enhance their predictive model. To forecast Bitcoin’s price over varying time horizons (30 days and 60 days), the researchers employed Long Short-Term Memory networks, known for their effectiveness in modeling sequential data. The dataset utilized for their study spanned from 2014 to September 2018, with the last two months reserved for prediction purposes. This temporal division ensured the model’s evaluation of unseen data, a crucial step in assessing its real-world applicability. The researchers used Root Mean Square Error and Mean Absolute Error as performance metrics to gauge the model’s accuracy and precision.
In 2019, Suhwan et al. [90] conducted an insightful study with the primary goal of predicting Bitcoin’s price. To achieve this, they utilized Long Short-Term Memory networks. A distinctive aspect of their research was the utilization of blockchain data, covering the period from November 29, 2011, to December 31, 2018, as a crucial input feature for training the LSTM model. This extensive historical data provided valuable insights into Bitcoin’s price behavior. Their research methodology integrated LSTM alongside other Deep Learning methods discussed in Section 6, reflecting a comprehensive approach to cryptocurrency price prediction. To rigorously assess the model’s performance, [90] adopted a dataset split, allocating an 80% portion for training and 20% for testing. They also conducted backtesting to validate the model’s predictive capabilities. The outcomes of their research revealed that there was no clear standout among the various algorithms employed. However, the results obtained were notably comparable, demonstrating the robustness of these approaches. Particularly noteworthy was the effectiveness of Deep Learning models in predicting Bitcoin’s price, further establishing their relevance in cryptocurrency price prediction.
In the same year,, Do-Hyung et al. [54] delved into the realm of time series classification for cryptocurrency price trends, focusing on a 10-minute time frame. Their study encompassed eight different cryptocurrencies, namely BTC, ETH, and more. The dataset utilized in their research comprised essential metrics, including open, high, low, close, and volume, spanning from June 9, 2017, to May 8, 2018. To classify and analyze these cryptocurrency price trends effectively, their research methodology integrated Long Short-Term Memory networks alongside other Machine Learning algorithms, as discussed in Section 5. This diverse approach aimed to capture the complexities of cryptocurrency markets. In terms of performance evaluation, their study employed crucial metrics such as Accuracy, Recall, Precision, and F1-score. The findings of their research were noteworthy, as they indicated that LSTM outperformed traditional Machine Learning models, resulting in approximately a 7% performance improvement.
Also in 2019, Hector et al. [111] embarked on a study that centered around the prediction of high-frequency trends for Bitcoin, focusing on a 1-minute time frame. To achieve this, they harnessed Long Short-Term Memory networks in combination with various Deep Learning architectures. Their study leveraged technical indicators and OHLC (Open, High, Low, Close) data, encompassing the period from January 1, 2020, to September 30, 2020. The dataset was thoughtfully divided into three segments: 70% for training, 15% for validation, and the remaining 15% for testing. This division allowed for a comprehensive assessment of the model’s performance, encompassing unseen data.
Table 5.
Average testing accuracy bitcoin [111]
Table 5.
Average testing accuracy bitcoin [111]
| Model | Accuracy |
|---|---|
| MLP | 57.84% |
| LSTM | 57.55% |
| CNN | 51.14% |
| CNN-LSTM | 57.29% |
In 2019, Agha et al. [112] conducted a study in which they utilized LSTM, along with other Deep Learning algorithms, to predict Bitcoin prices. Notably, their research demonstrated that LSTM consistently outperformed the alternative methods they employed. The primary performance metric they used for evaluation was Mean Squared Error.
In 2019, Anh-Dung et al. [113] conducted a study focused on predicting the price of Ether using LSTM over a 24-hour time horizon. They employed OHLC data and sentiment data from news sources, covering the period from 30 July 2017 to 5 October 2018. The dataset was divided into an 80% portion for training and the remaining portion for testing. Remarkably, their research revealed that LSTM exhibited strong predictive performance, even when not incorporating sentiment scores from news data.
Takuya et al. [114] conducted research focused on predicting cryptocurrency price trends using OHLC (Open, High, Low, Close) and blockchain data. They considered different time intervals, specifically 1-minute and 30-minute ranges, covering the period from 13 June 2013 to 18 March 2017. In this study, they employed LSTM along with other algorithms and evaluated their models using metrics such as accuracy, recall, precision, and F1-score. Interestingly, LSTM did not emerge as the top-performing model within the implemented methods. The profit rates derived from RSM outperformed those from LSTM; however, they did not surpass those of the buy-and-hold strategy during the testing data period. Consequently, they do not offer a viable basis for algorithmic trading.
In 2019, George et al. [115] conducted a study aiming to examine and predict the price of Bitcoin over a 24-hour time horizon. To accomplish this, they incorporated both blockchain and price data. Their research compared the effectiveness of LSTM and ARIMA models for predicting Bitcoin prices. The study’s conclusion highlighted LSTM as the more proficient model for this specific forecasting task.
Ashwini et al. [116] conducted a study in 2019 to forecast various cryptocurrencies, including Bitcoin, Ether , and Litecoin, over a 24-hour time horizon. Their research findings indicated that the LSTM model consistently outperformed alternative forecasting methodologies, such as Prophet and ARIMA.
Yan Li et al. [91] in 2019 embarked on a research endeavor to predict Bitcoin prices. They harnessed price data and external economic data, covering a dataset ranging from 30 December 2016 to 31 August 2018. The study focused on predicting prices over 3-day intervals. Their findings underscored the effectiveness of a CNN-LSTM hybrid neural network, which emerged as a valuable tool for cryptocurrency price prediction.
Moving into 2020, Ihyak et al. [117] conducted a comprehensive study aimed at forecasting Bitcoin’s price over a 24-hour time horizon. Their chosen methodology for this task was LSTM, and they relied on price data. The dataset utilized in their research extended from 2014 to 2020. To assess the predictive accuracy of their model, they adopted performance metrics such as Root Mean Square Error and Mean Absolute Percentage Error. Impressively, their LSTM-based model achieved outstanding results, boasting an accuracy rate of 97%, a MAPE error of 2.52%, and an RMSE of 329.15.
In 2020, [118,119,120,121,122,123] explored the use of LSTM among other methodologies for cryptocurrency price prediction. [122] delved into the realm of cryptocurrency price prediction, focusing on a very short time horizon of 5 seconds. Their research involved the application of LSTM and other techniques discussed in sections related to Statistical models 8. Notably, LSTM emerged as a promising model within this ultra-short-term context. Other researchers, including [118,119,120,121,122,123], undertook studies to predict cryptocurrency prices over a 24-hour time horizon. These studies also employed LSTM along with various other methodologies discussed in the sections on Machine Learning, Deep Learning, and Statistical models Section 5, Section 6 and Section 8. Among these researchers, some observed that LSTM outperformed alternative algorithms, emphasizing its effectiveness in cryptocurrency price prediction.
In 2020 Mohammed et al. [42] conducted a comprehensive research study focused on predicting Bitcoin prices. Their approach encompassed the utilization of Blockchain data and price data to forecast Bitcoin prices over various time intervals, ranging from 1 day to 90 days. This extensive analysis featured the implementation of Long Short-Term Memory along with other algorithms, as discussed in the respective sections dedicated to Machine Learning and Deep Learning 5 and 6. The dataset under scrutiny spanned from 2013 to 2017 and was segmented into different time chunks to facilitate in-depth analysis. The researchers meticulously divided this dataset into training and testing subsets, following an 80/20 ratio, ensuring a robust evaluation of their predictive models. What sets this study apart is its observation of LSTM’s superior performance in cryptocurrency price prediction. Specifically, LSTM achieved an impressive 65% accuracy rate for next-day Bitcoin price predictions, showcasing its prowess in short-term forecasting. Furthermore, LSTM demonstrated consistent accuracy levels, ranging from 62% to 64%, for forecasts extending from the 7th day to the 90th day. In terms of forecasting accuracy, this study reported Mean Absolute Percentage Error scores, highlighting a remarkable 1.44% for 1-day predictions and a range of 2.88% to 4.10% for the extended horizons, namely from the 7th to the 90th day.
In the same year 2020, Tapan et al. [76] undertook a significant research study aimed at predicting Bitcoin prices. Their approach involved the utilization of Long Short-Term Memory, a popular Deep Learning model, as well as other Machine Learning methodologies, which were discussed in the relevant section on Machine Learning 5. To bolster their predictive models, the researchers leveraged a unique dataset comprising a broad spectrum of tweets. These tweets were categorized into positive, neutral, and negative sentiment groups, each linked to corresponding mapped average Bitcoin prices. This distinctive dataset allowed the researchers to explore the intricate relationship between sentiment expressed in tweets and Bitcoin price predictions.
In 2021, Patrick et al. [37] embarked on a comprehensive research study to forecast Bitcoin prices. Their approach was multifaceted, incorporating technical indicators, sentiment data, and blockchain data to generate predictive models. The study spanned various time horizons, including 1 minute, 5 minutes, 15 minutes, and 60 minutes, thereby catering to different trading strategies and preferences. The performance of these predictive models was evaluated using the accuracy metric. The findings of the study indicated that, particularly for the 60-minute time horizon, Long Short-Term Memory emerged as the top-performing algorithm among all those implemented. This means that LSTM exhibited the highest accuracy when compared to the other algorithms discussed in the sections about Machine Learning and Deep Learning 5 and 6.
In 2021 [124,125] conducted separate research studies to predict the prices of Bitcoin and Dogecoin. They utilized price data as their primary input feature, aiming to forecast cryptocurrency prices using various time horizons and sentiment data. [124] focused on Bitcoin and employed both 1-minute and 1-hour time horizons to capture minute-to-minute and hourly price dynamics. To evaluate the performance of their predictive models, they utilized the Root Mean Square Error as a metric. Their results demonstrated impressive accuracy, with an RMSE score of 0.014 for minute-level data and 0.018 for hourly data, highlighting the precision of their predictive models. [125] concentrated on Dogecoin and adopted a 24-hour time horizon to assess and predict its price dynamics over a longer duration. Like [124] they employed RMSE as their performance evaluation metric, although specific RMSE scores were not provided in the available information. A noteworthy conclusion drawn from both studies was that Long Short-Term Memory emerged as the top-performing algorithm, particularly when focusing on a 60-minute time horizon. LSTM demonstrated the highest accuracy when compared to other Machine Learning and Deep Learning algorithms discussed in the respective studies.
In the same year 2021, Sardar et al. [126] and [127] focused on predicting the price of Bitcoin over a 24-hour time horizon. They employed Long Short-Term Memory along with other Deep Learning and Machine Learning algorithms to enhance their predictive models. [126] evaluated the performance of their models using metrics such as Accuracy, Precision, Recall, and F1, while [127] used metrics like Mean Squared Error, Mean Absolute Percentage Error, Accuracy, and Precision for performance assessment. while [102] extended their study to predict the prices of multiple cryptocurrencies, including BTC, ETH, and more. Similar to the previous studies, they also utilized LSTM models in combination with different Deep Learning and Machine Learning algorithms for price prediction. In [102] study, they employed performance evaluation metrics such as Root Mean Square Error and Mean Absolute Deviation (MAD) to assess their models’ accuracy. Notably, their findings indicated that multivariate LSTM outperformed other models in terms of predictive performance, suggesting its suitability for cryptocurrency price prediction across multiple currencies.
In 2021 Dino et al. [128] conducted a study to forecast Bitcoin’s price over a 24-hour time horizon. They employed Long Short-Term Memory as a primary component of their predictive model. The study used Mean Squared Error as the primary performance metric. Their findings suggested that LSTM is effective in predicting Bitcoin’s price, highlighting its suitability for this specific cryptocurrency. Additionally, Liping et al. [129] and Ashutosh et al. [41] also conducted research studies aimed at predicting the price of Bitcoin. They utilized price data and implemented LSTM along with other algorithms to predict Bitcoin’s price over different time horizons. [41] employed performance evaluation metrics such as Accuracy, R2, and MSE to assess their predictive models. In contrast, [129] primarily used MSE as their performance metric to evaluate the accuracy of their price predictions.
Reem K et al. [130] conducted a research study in 2021, focused on predicting the price of Bitcoin using various predictive models, including Long Short-Term Memory in conjunction with other Deep Learning algorithms. They considered price data for Bitcoin over different time horizons, including 4 hours, 12 hours, and 24 hours. To assess the performance of their predictive models, the researchers utilized several performance evaluation metrics, including Root Mean Squared Error , Mean Absolute Percentage Error, and R-squared. Their study’s results and conclusions indicated that the LSTM-based model performed exceptionally well when forecasting Bitcoin prices over 4-hour intervals. The specific performance metrics for this model included a MAPE of 0.63, RMSE of 0.0009, MSE of 9e-07, MAE of 0.0005, and an impressive R2 value of 0.994. These findings highlighted the effectiveness of LSTM in accurately predicting Bitcoin prices, especially over short-term intervals.
In 2021 Alvin et al. [131] Alvin et al. [Ravichandran2021] researched to predict the price of Bitcoin over a 24-hour time horizon. They implemented LSTM alongside other machine-learning algorithms. Their performance metrics included Mean Absolute Error and Mean Squared Error. The results demonstrated a low error rate of approximately 0.08%, indicating the model’s ability to make accurate price predictions. In the same year, Hari et al. [132] also used LSTM in their research study to forecast the price of Bitcoin over a 24-hour time horizon. They employed various performance metrics such as Accuracy, Recall, Precision, and ST. Their study concluded that utilizing a large dataset with LSTM can significantly enhance the accuracy of Bitcoin price predictions.
Dimitrios et al. [79] implemented LSTM and Machine Learning algorithms to predict the price of Ether over a 24-hour time horizon. They leveraged blockchain data and technical indicators to make their predictions. Performance metrics included Mean Absolute Error, Root Mean Squared Error, Mean Absolute Percentage Error, and R-squared. Their findings indicated that LSTM outperformed the Machine Learning algorithms in forecasting ETH prices. Following this, Olena et al. [133] conducted a study aimed at predicting the prices of both Bitcoin and Ether. They worked with 1-minute-level open price data. Their research concluded that LSTM excelled compared to other algorithms for modeling exchange rates.
As 2022 started, Kamran et al. [134] conducted a study to predict the prices of four different cryptocurrencies, including Bitcoin and Ether. Their research methodology involved using price data and technical indicators as input features. They applied LSTM and various other deep-learning methods. To assess the performance of their models, they used metrics such as Mean Squared Error, Root Mean Squared Error, Mean Absolute Error, and the coefficient of determination. The study’s findings revealed that the LSTM-based strategy was the most effective in predicting cryptocurrency prices.
In 2022, researchers in the field of cryptocurrency analysis continued their endeavors to predict the prices of various cryptocurrencies, with a focus on Bitcoin and Ether. Three notable studies, conducted by [135,136], and [104], stand out in this regard. These studies utilized price data and employed a range of algorithms, including LSTM, as well as other Deep Learning and Statistical models, which were discussed in section 6 section 8. The primary objective of these studies was to forecast cryptocurrency prices, particularly over a 24-hour time horizon. After extensive analysis and experimentation, the researchers observed that LSTM-based strategies were more effective and yielded better results in predicting the prices of these digital assets.
In 2022, Bhaskar [137] conducted a study aimed at predicting cryptocurrency prices, particularly Bitcoin, by utilizing both price data and technical indicators. The methodology involved employing LSTM and other Deep Learning strategies discussed in section 6. This study considered various time horizons, including 3 days, 5 days, and 7 days, to forecast price movements. The performance metrics used to evaluate the models encompassed MAE, RMSE, and MAPE. Additionally, during the same year in 2022, Mamoona et al. [138] conducted a similar research study to predict Bitcoin’s price. Like [137] study, this research also utilized price data and technical indicators. The models employed included LSTM, along with some other Deep Learning methods discussed in section 6, as well as Statistical models discussed in section 8. [138] extended their analysis to time horizons of 7 days, 14 days, and 21 days. Notably, this study explored different combinations of hybrid models, ultimately identifying LSTM as a crucial component of the best-performing model.
In the same year, several research studies were conducted to predict the price of Bitcoin also using sentiment data as their input feature. Zelal et al. [139], L.J et al. [140], and AyÅŸenur et al. [141] focused on leveraging sentiment data to forecast Bitcoin’s price movements over a 24-hour time horizon. They employed LSTM as the primary strategy for predicting Bitcoin’s price based on sentiment data. Concurrently, Huali et al. , Yiyang et al. [143], and Gil et al. [30] undertook research projects that also incorporated sentiment data alongside price data for Bitcoin price prediction. Their primary strategy was the utilization of LSTM, combined with other Deep Learning strategies discussed in the Deep Learning section 6. Notably, both [142] and [143] concluded that LSTM was the most effective algorithm for predicting Bitcoin’s price when using sentiment and price data. Furthermore, in the same year, another study sought to predict the price of Bitcoin by integrating price data, sentiment data, and technical indicators data as input features. Zi et al. [144] implemented a combination of LSTM and GRU, which is further discussed in the Deep Learning section. They applied this strategy to predict Bitcoin’s price over two different time horizons: 30 minutes and 24 hours. The performance metrics used in their study included MSE, MAE, MAPE, and sMAPE, with their findings indicating particularly good results for the shorter time horizon of 30 minutes.
Figure 14.
Data collection and pre-processing steps [139]
Figure 14.
Data collection and pre-processing steps [139]
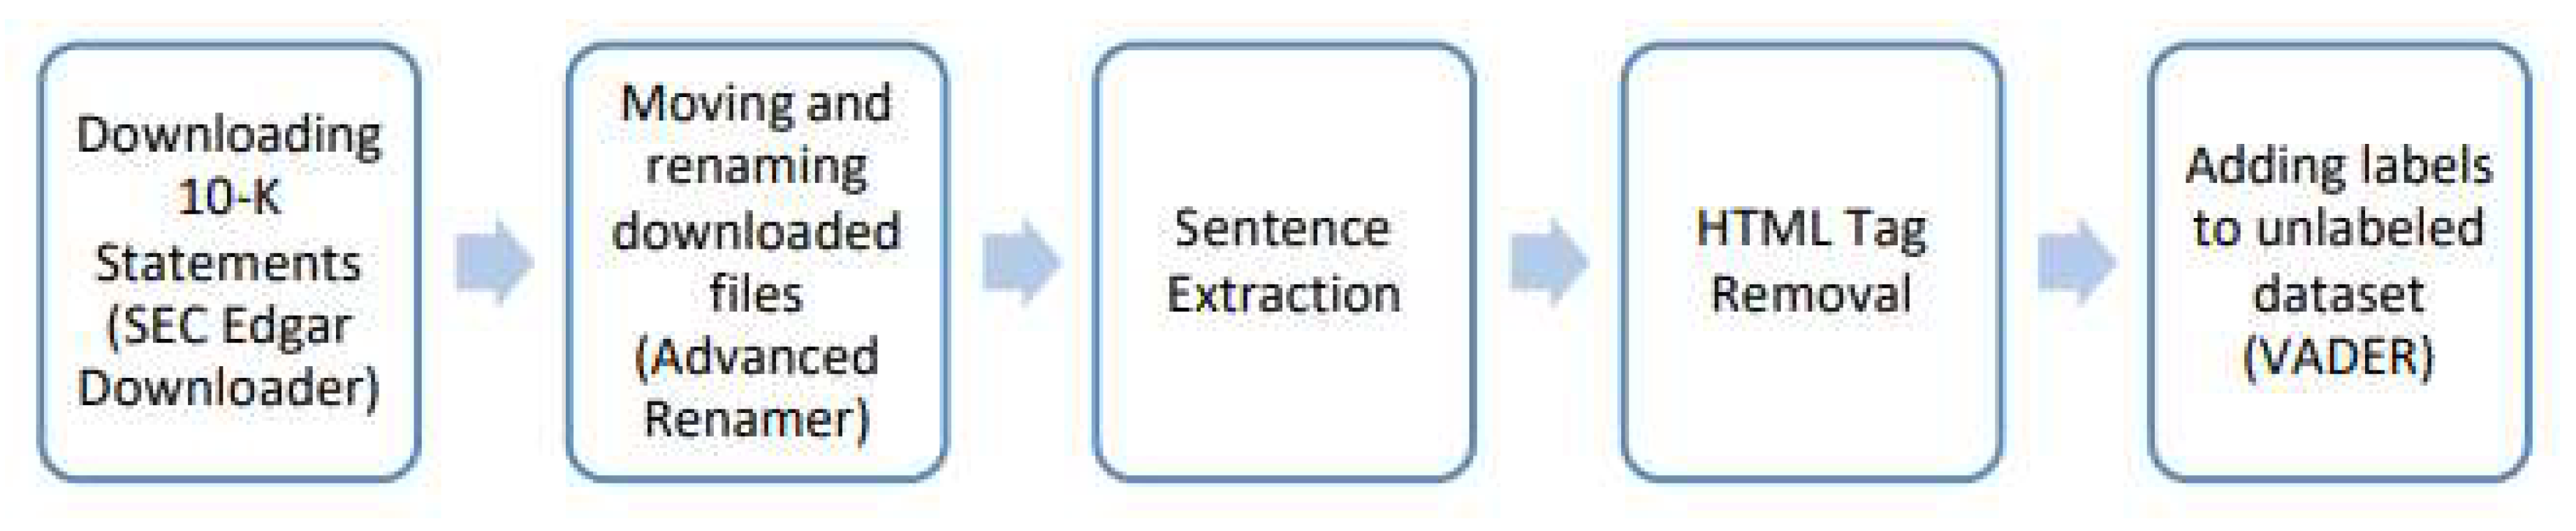
[142] In 2022, several research studies focused on predicting the prices of Bitcoin over various time horizons, with a specific emphasis on the 24-hour period. These studies included authors such as [145], [146], [105], [147], and [148]. While [145] extended their analysis to include cryptocurrencies such as ETH and ADA, [103] specifically targeted Bitcoin price predictions over different timeframes, including 1 day, 7 days, 30 days, and 90 days. The input features for these studies primarily revolved around price data. To predict cryptocurrency prices, the authors employed various strategies, including LSTM and other methodologies discussed in section 6, section 5, and section 8 of their respective research papers. Across these studies, LSTM consistently outperformed the other implemented strategies, showcasing its effectiveness in cryptocurrency price prediction. Notably, [146] reported an impressive accuracy rate of 95.7% and achieved low RMSE scores of 0.05, as well as an error loss of 0.00065.
In 2022, a series of research studies were conducted by authors like [58,63,77,149,150] with a focus on predicting the prices of various cryptocurrencies, with Bitcoin being the primary target. These studies employed a range of Deep Learning and Machine Learning algorithms, but LSTM was prominently featured across different time horizons. Most of these studies were designed to forecast cryptocurrency prices over a 24-hour time horizon, except for [77] and [149], which specifically examined 1-hour price predictions. The input features commonly included OHLC (Open, High, Low, Close) data and trading volume. Among these studies, LSTM emerged as the preferred choice for cryptocurrency price prediction, with some, like [149], reporting remarkable results. For instance, [149] achieved an impressive correlation value of R=96.73% during training and 96.09% during testing when forecasting cryptocurrency prices. Various performance metrics, such as Accuracy, Precision, Recall, F1, MSE (Mean Squared Error), RMSE (Root Mean Squared Error), and NRMSE (Normalized RMSE), were employed to evaluate the models’ performance.
In 2022, Ravikant et al. [151] conducted a research study aimed at predicting the prices of both cryptocurrencies and stocks. They utilized price data, which included open, low, close, high, and volume. Their chosen methodology was LSTM, and their analysis covered cryptocurrencies such as Bitcoin, Ether, and Ripple, as well as stocks like Tesla, TCS, Google, Apple, and Infosys. Performance evaluation was based on metrics including MAE, MSE, RMSE, and R2. Notably, they achieved an RMSE score of 0.061 for cryptocurrencies and 0.029 for stocks.
In 2022, [103,152,153] conducted research studies focused on predicting the prices of Ether over a 24-hour time horizon. While [152] utilized open, low, close, high, and volume as input features, [103,153] exclusively used the close price as their input feature. A common element in their methodologies was the use of LSTM, other than this also discussed in section 6 section 8. The studies employed performance metrics such as MAPE, RMSE, MAE, ME, R2, and MSE, with [103] study demonstrating the best results through the use of LSTM and Bi-LSTM.
In 2022, researchers including [154,155,156] conducted studies aimed at predicting the prices of Bitcoin over a 24-hour time horizon. These studies utilized close prices as their input features for price prediction and employed LSTM as the primary methodology. The performance metrics in these studies focused on RMSE and MSE. Additionally, in 2022, [157] conducted a study to predict Bitcoin prices over both 1-hour and 24-hour time horizons. The study highlighted the importance of tuning hyperparameters, specifically emphasizing the need for small learning rates and dropout values for the 24-hour predictions, while larger values were more suitable for the 1-hour forecasts.
In 2023, a series of research studies were conducted by [49,67,109,158,159] aiming to predict the prices of various cryptocurrencies, primarily over a 24-hour time horizon. These all studies leveraged sentiment analysis and price data as their input to forecast cryptocurrency prices. The methodologies employed in these studies encompassed various Machine Learning and Deep Learning strategies discussed in section 6 and section 5, with LSTM being one of the key methods. The findings from these studies varied, with some indicating that LSTM performed well in certain aspects but was average or relatively less effective when compared to other implemented algorithms. To evaluate the performance of their models, these studies used a range of metrics, including MAPE, MSE, R2, Forecast Bias, MAE, ME, RMSE, and MPE.
In 2023, a set of research studies conducted by [71,88,95,160] aimed to predict the prices of various cryptocurrencies over different time horizons. [160] study focused on a 10-minute time horizon, while [71,88,95] primarily used a 24-hour time horizon to forecast cryptocurrency prices. These studies employed a range of Machine Learning and Deep Learning algorithms, including LSTM, and utilized closing prices as their input features. Among these studies, [71,160] both found LSTM to be the most effective method for predicting cryptocurrency prices. [71] study concluded that LSTM achieved an average RMSE of 0.0222 and MAE of 0.0173, while [160] study determined that the LSTM model was the best approach for predicting both the direction and value of cryptocurrency prices at various time horizons. To evaluate the performance of their models, these studies used a variety of metrics, including RMSE, MAPE, R2, MAE, MAPE, DSTAT, and RMSE.
In 2023, a group of research studies led by [64,78,161,162] focused on predicting the prices of various cryptocurrencies using price data OHLC. These studies employed a 24-hour price time horizon for different cryptocurrencies and explored a range of Machine Learning, Deep Learning, and Statistical models as part of their research, as discussed in section 5, section 6, and section 8. Among these studies, [78] concluded that LSTM was the most effective method for predicting the prices of different cryptocurrencies.
In the same year, 2023, a set of research studies led by [106,107,108] aimed to predict the prices of various cryptocurrencies, primarily focusing on Bitcoin, over a 24-hour time horizon. They employed Recurrent Neural Networks, as discussed in section 6, and LSTM. The input features for their models included price data OHLC and Market Capitalization. These studies evaluated the performance using metrics such as MAPE, RMSE, and MSE. The consensus among these studies is that LSTM outperforms other methods for predicting the prices of Bitcoin and other cryptocurrencies. For instance, in [106], LSTM achieved an RMSE of 0.061 and a MAPE of 5.66% in predicting Bitcoin prices. When predicting ETH, LSTM obtained an RMSE of 0.036 and a MAPE score of 4.58%.
In 2023, Junwei et al. [163] conducted a research study. Their study utilized a combination of price data, technical indicators data, and external economic indicators data as input features to predict the price of Bitcoin. They implemented LSTM along with other Machine Learning algorithms, which are discussed in section 5. One of the key findings of their research was that as the number of past periods for substituted explanatory variables increased, the prediction accuracy of the model decreased. This suggests that the model’s accuracy may be influenced by the historical data used for explanatory variables in predicting Bitcoin prices.
In 2023, several research studies were conducted to predict the prices of various cryptocurrencies, such as BTC, ETH, and LTC. Notably, Phumudzo et al. [164] included all three of these cryptocurrencies in their analysis, whereas Nrusingha et al. [165] focused specifically on Bitcoin. Additionally, Tiya et al. [166] extended their research to cover a wide range of 10 different cryptocurrencies. These studies utilized price data, specifically OHLC (Open, High, Low, Close), as their primary input feature. To predict cryptocurrency prices, they implemented various Deep Learning and Statistical methods, including LSTM. Their choice of performance metrics included RMSE (Root Mean Square Error), MAPE (Mean Absolute Percentage Error), and MAE (Mean Absolute Error).
6.2.6. Gated Recurrent Unit
In 2020, Xiangxi et al.[120] and Dane et al.[100] conducted research studies to predict the prices of different cryptocurrencies. Xiangxi et al. focused on using price data to predict the price of Bitcoin, while Dane et al. utilized both price data and sentimental data to predict the prices of BTC, XRP, and LTC. Their implementations involved the use of GRU along with other deep-learning methods. In 2021, Patrick et al. [37] conducted a research study aiming to predict the price of Bitcoin. They employed technical indicators data, sentimental data, and blockchain data to make predictions over various time horizons, including 1-min, 5-min, 15-min, and 60-min. Their research methodology included GRU, combined with different Machine Learning and Deep Learning methods. The study’s findings indicated that the GRU model produced better predictions, particularly on 15-minute horizons when compared to other methods. In the same year, Basant et al. [125] conducted a research study to predict the price of Dogecoin over a 24-hour time horizon. They used price data and sentimental data as their input features and implemented GRU and LSTM in their research methodology. The study’s conclusion revealed that the best results were achieved by using historical price data, excluding high and low prices, and Twitter sentiment data in the GRU model. The performance metric used in this study was RMSE. Additionally, in 2021, Ashutosh et al.[41] and Reem et al.[130] conducted research studies to predict the prices of Bitcoin. Their research methodologies incorporated GRU along with other Deep Learning and Machine Learning methods, as discussed in section 6 and section 5. The performance metrics used in their studies included RMSE, MAPE, Accuracy, R2, and MSE.
In 2022, several research studies were conducted to predict the prices of different cryptocurrencies over a 24-hour time horizon. Abdussalam et al.[167], Dr. M. TanooJ et al.[150], Chuen et al.[74], Jens et al.[145], and V. Derbentseva et al. [148] all employed GRU (Gated Recurrent Unit) as part of their research methodologies, in addition to other Deep Learning and Machine Learning methods, as discussed in section 6 and section 5. Abdussalam et al.[167] and Dr. M. TanooJ et al.[150] concluded that GRU performs better than other implemented methods in predicting various cryptocurrencies, including BTC, ETH, ADA, and BTC, respectively. In the study by Lim et al. [74], a 1DCNN-GRU model was proposed and found to perform better than existing methods, achieving RMSE scores of 43.933 for BTC, 3.511 for ETH, and 0.00128 for XRP. V. Derbentseva et al. [148] also concluded in their study that GRU is the best method among others, achieving an RMSE of 2.2201 and MAPE of 0.8076. In 2022, Yiyang et al. [143] conducted a research study to predict the price of Bitcoin over both 1-hour and 24-hour time horizons. Their research methodology included the use of price data and sentimental data as input features. In their study, GRU outperformed other models, achieving an F1 score of 0.6720 for dataset 2 without emotion. Furthermore, in 2022, Caglar et al. [152] conducted research to predict the prices of ETH over 15-minute and 30-minute time horizons, utilizing price data. Their research methodology included GRU, along with different Deep Learning-based time series models. GRU achieved the following performance metrics: a MAPE value of 5.57651, an RMSE value of 105.81920, a MAE value of 72.15339, an ME value of 363.47583, and an R2 value of 0.97090.
In 2022, [150] conducted a research study in which they utilized Lagged Data as their input feature for different Deep Learning models, including GRU. The study included the development of a long-short portfolio strategy based on the predictions generated by the GRU model. This portfolio strategy achieved an impressive Sharpe ratio of 3.12, indicating the effectiveness of the GRU-based predictions in enhancing portfolio performance.
In 2023 Haritha et al. [158] conducted a research study to predict the prices of Bitcoin over the 24-hour time horizon. They use price data and sentimental data as input features for different deep-learning models. Their research methodology also includes GRU which achieves MAPE of 3.6%. In the same year, Shruthi et al. [168] also conducted a research study to predict the prices of BTC. Their research methodology includes GRU along with other Deep Learning models. Their research concluded that GRU is best for time series prediction specifically cryptocurrency price prediction. In 2022 Tiya et al. [166], Stefano et al. [162] conducted a research study to predict the prices of different cryptocurrencies over the 24-hour time horizon. [166] utilized the price data to predict the prices of 10 different cryptocurrencies while [162] used price data to predict the price of Bitcoin. Their performance metrics include RMSE, MSE, DA, and MAE. [166] concluded that GRU performs best and can be considered efficient and dependable amongst other implemented methods while [162] also concluded that in case of ensemble based on GRU incorporated with the value of return or baseline prediction brings a huge improvement in results.
Table 6.
Mean square error obtained while prediction [166]
Table 6.
Mean square error obtained while prediction [166]
| Model | MSE |
|---|---|
| LSTM | 0.0006063628663181186 |
| Bi-LSTM | 0.0013169118146140332 |
| GRU | 0.0013169118146140332 |
| Ensemble | 0.0005468361394868078 |
In 2023, Haritha et al. [158] conducted a research study focused on predicting the prices of Bitcoin over a 24-hour time horizon. They utilized both price data and sentimental data as input features for different deep-learning models. Among their research methodologies, they also incorporated the use of GRU, which achieved a MAPE (Mean Absolute Percentage Error) of 3.6%. Similarly, in the same year, Shruthi et al. [168] conducted a research study to predict the prices of Bitcoin. Their research methodology included the use of GRU, along with other Deep Learning models. Their research findings supported the effectiveness of GRU for time series prediction, particularly in the context of cryptocurrency price prediction. In 2022, Tiya et al. [166] and Stefano et al. [162] also conducted research studies aimed at predicting the prices of different cryptocurrencies over a 24-hour time horizon. While [166] used price data to predict the prices of 10 different cryptocurrencies, [162] specifically focused on predicting the price of Bitcoin. The performance metrics utilized in these studies included RMSE (Root Mean Square Error), MSE (Mean Square Error), DA (Directional Accuracy), and MAE (Mean Absolute Error). The research findings of [166] concluded that GRU performed the best among the implemented methods and could be considered efficient and dependable for cryptocurrency price prediction. On the other hand, [162] also emphasized the importance of ensembles based on GRU, particularly when incorporated with return values or baseline predictions, as it led to a significant improvement in results.
6.2.7. Transformers
In 2022, Huali et al. conducted a research study, as detailed in [142], aimed at predicting the prices of BTC and ETH over a 24-hour time horizon. Their approach incorporated both price data and sentiment data as input features into a Transformer model, alongside other Deep Learning methods. The study evaluated the performance using metrics such as MSE, MAPE, and MAE, and the results indicated that the Transformer model, when fed with both price and sentiment data, outperformed other methods for BTC prediction but not for ETH. Furthermore, in 2022, Saikat et al. conducted a research study [169] focused on forecasting the values of SOL, BTC, and ETH. The methodology included the utilization of Transformer models, alongside Deep Learning and Statistical models discussed in section 6 and section 8. In the same year, Dorien et al. [170] conducted a research study to predict Bitcoin spikes, leveraging whale-alert data from Twitter and CryptoQuant data. They implemented the Synthesizer Transformer model in combination with other Deep Learning and Statistical models discussed in section 6 and section 8. The findings of this study indicated that the Synthesizer Transformer model performed better than the other implemented methods.
6.3. Summarized Literature Review of Deep Learning Approaches
In this section, this survey presents a summarized literature review of Deep Learning approaches utilized in cryptocurrency price prediction. The table A2 provides an overview of various methodologies, time horizons, currencies, evaluation metrics, data samples, and training/testing strategies employed in the literature. This summary aims to provide insights into the diverse range of Deep Learning techniques applied to analyze cryptocurrency price movements and trends.
7. Use of DRL in Cryptocurrency Forecasting
This survey looks at how algorithms, specifically using a method called Deep Reinforcement Learning, can help predict what might happen in the world of cryptocurrency. Imagine it as if the computer is learning from its experiences to make better decisions, kind of like how we learn from trying things out. DRL is like giving the computer a smart brain that learns from what it does. In the cryptocurrency world, where things change a lot, this smart brain helps the computer figure out the best strategies over time. Think of DRL as a computer learning to play a game, but instead of a game, it’s learning to understand and predict what might happen in the cryptocurrency market. It gets better by making decisions, getting feedback, and adjusting its strategies based on that feedback.
There are different types of smart algorithms in DRL, like Proximal Policy Optimization, Advantage Actor-Critic, and Deep Q-Network. These algorithms use a kind of computer brain called a neural network to understand patterns and make smart decisions. Just like we learn by looking at old photos, these algorithms learn by looking at old data about the cryptocurrency market. This helps them understand how things changed in the past, so they can make better guesses about what might happen in the future. This survey is like an exploration into how these smart algorithms work, helping us understand how computers can be really useful in predicting what might happen in the exciting world of cryptocurrencies.
The section 7 unfolds into three distinct categories, each offering a specialized perspective on the application and evolution of Deep Reinforcement Learning in various domains. Firstly, the detailed analysis and trends in DRL studies (7.1) scrutinize the methodological intricacies and emerging patterns prevalent in recent research endeavors. Secondly, studies utilizing DRL for various applications (7.2) delve into specific case studies and methodologies employed to solve complex problems leveraging DRL architectures. Lastly, the summarized literature review of DRL approaches (7.3) encapsulates a synthesis of existing literature, distilling key insights and advancements in the field of DRL. Together, these subsections provide a comprehensive overview of the landscape, facilitating a deeper understanding of the complexities and innovations driving DRL applications across different domains.
7.1. Detailed Analysis and Trends in Deep Reinforcement Learning Studies
In this dedicated section, the utilization of deep reinforcement learning techniques to forecast changes in the cryptocurrency market will be explored. Deep reinforcement learning involves the application of advanced computer algorithms to analyze extensive datasets, identifying patterns and making predictions. This study will delve into the specific methodologies employed, the cryptocurrencies most frequently studied, and how researchers incorporate time-related factors to enhance prediction accuracy. By scrutinizing these aspects, this study aims to illuminate the pivotal role of deep reinforcement learning in comprehending and predicting trends within the cryptocurrency market.
7.1.1. Methodology-Wise Distribution in Deep Reinforcement Learning Studies
The distribution of methodologies within Deep Reinforcement Learning studies unveils the prevalent algorithms employed across the studied corpus. Among the examined papers, Proximal Policy Optimization (PPO) emerges as the most utilized methodology, featuring in 50% of the studies with a total of 7 papers. Following closely, Advantage Actor-Critic (A2C) is implemented in 4 papers, representing a significant portion of the distribution. Lastly, Deep Q-Networks (DQN) are utilized in 3 papers, comprising a smaller yet notable fraction of the methodology-wise distribution. This distribution sheds light on the adoption of various Deep Reinforcement Learning algorithms within research endeavors, reflecting the diverse approaches employed to address challenges and advance knowledge in the field.
Figure 15.
Methodology-wise distribution in Deep Reinforcement Learning studies: utilization of Various algorithms across studied corpus
Figure 15.
Methodology-wise distribution in Deep Reinforcement Learning studies: utilization of Various algorithms across studied corpus
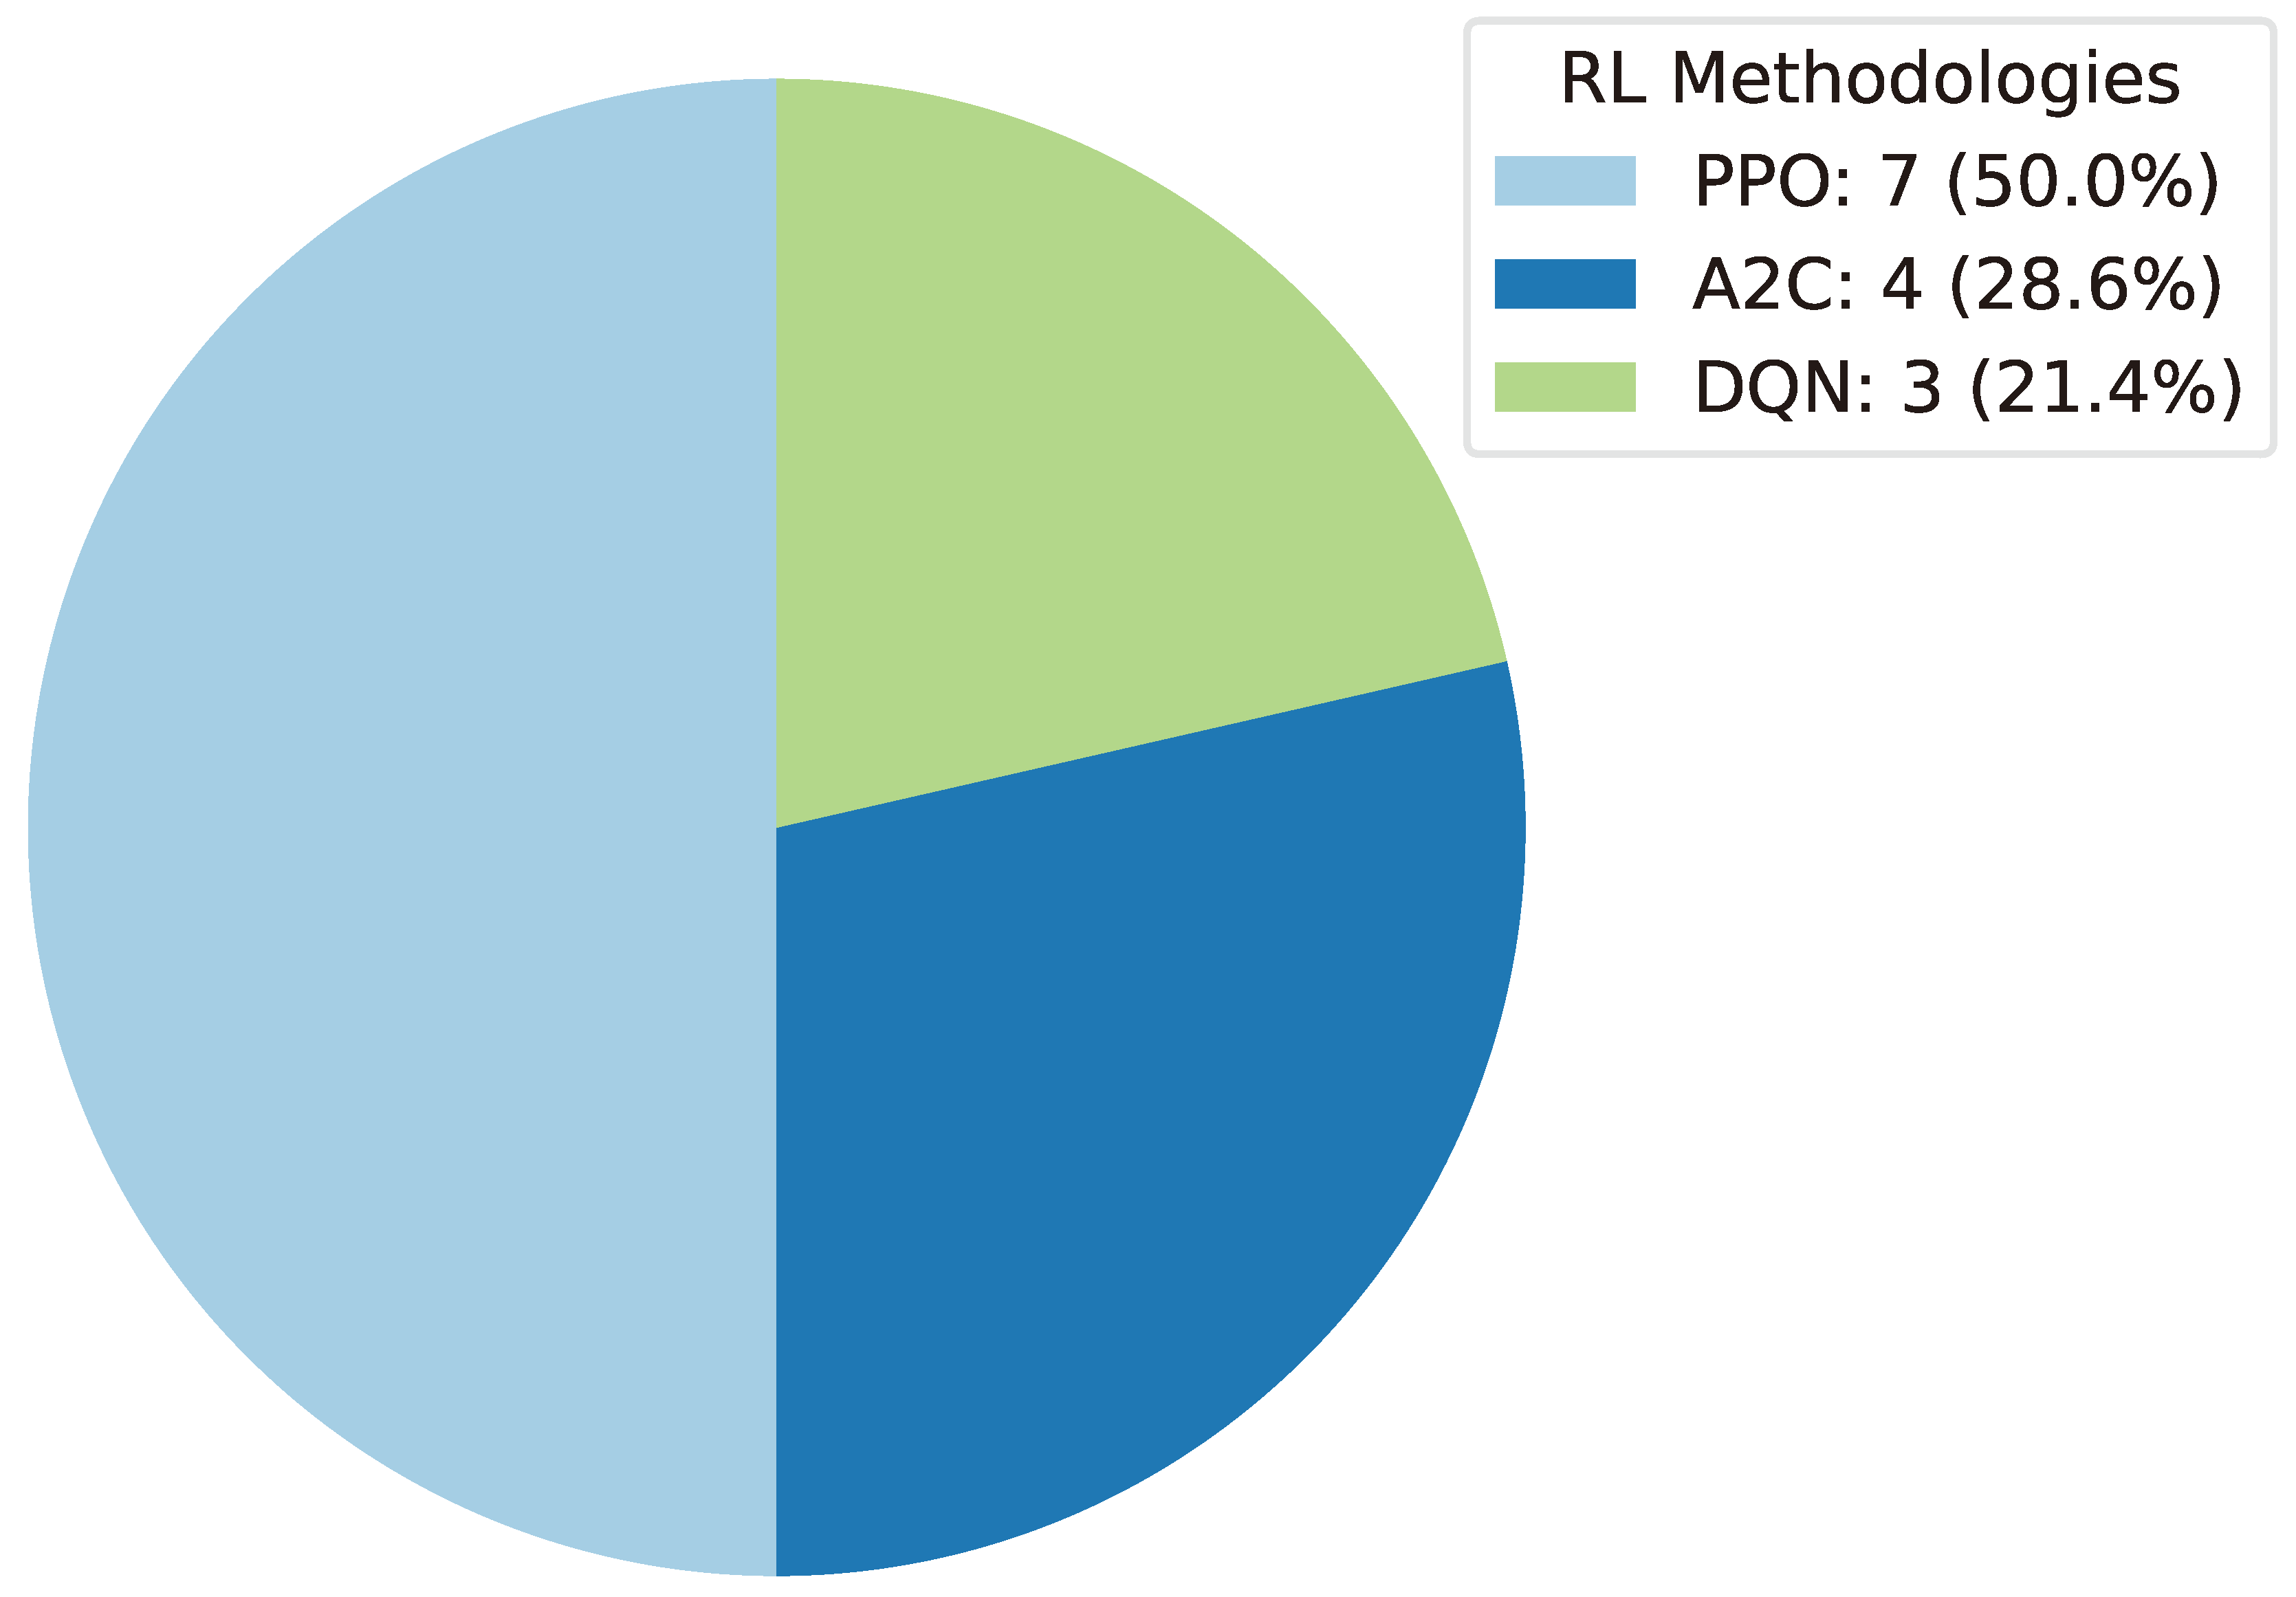
7.1.2. Time Horizon-Wise Distribution in Deep Reinforcement Learning Studies
Analyzing the time horizon-wise distribution within Deep Reinforcement Learning studies reveals significant insights into temporal considerations across research papers. Among the studied corpus, a notable portion of the research, accounting for 31.2%, focuses on a 24-hour time horizon. Additionally, investigations into shorter intervals show distinct proportions: 1-hour and 1-minute time horizons each hold 18.8% of the distribution, while the 15-minute interval accounts for 12.5%. This distribution underscores the importance of temporal granularity in Deep Reinforcement Learning studies and reflects the diverse temporal scales considered in research methodologies. Understanding these temporal considerations is vital for designing effective algorithms and applications within the realm of Deep Reinforcement Learning.
Figure 16.
Time horizon-wise distribution in Deep Reinforcement Learning studies: proportional analysis of temporal considerations across research papers
Figure 16.
Time horizon-wise distribution in Deep Reinforcement Learning studies: proportional analysis of temporal considerations across research papers
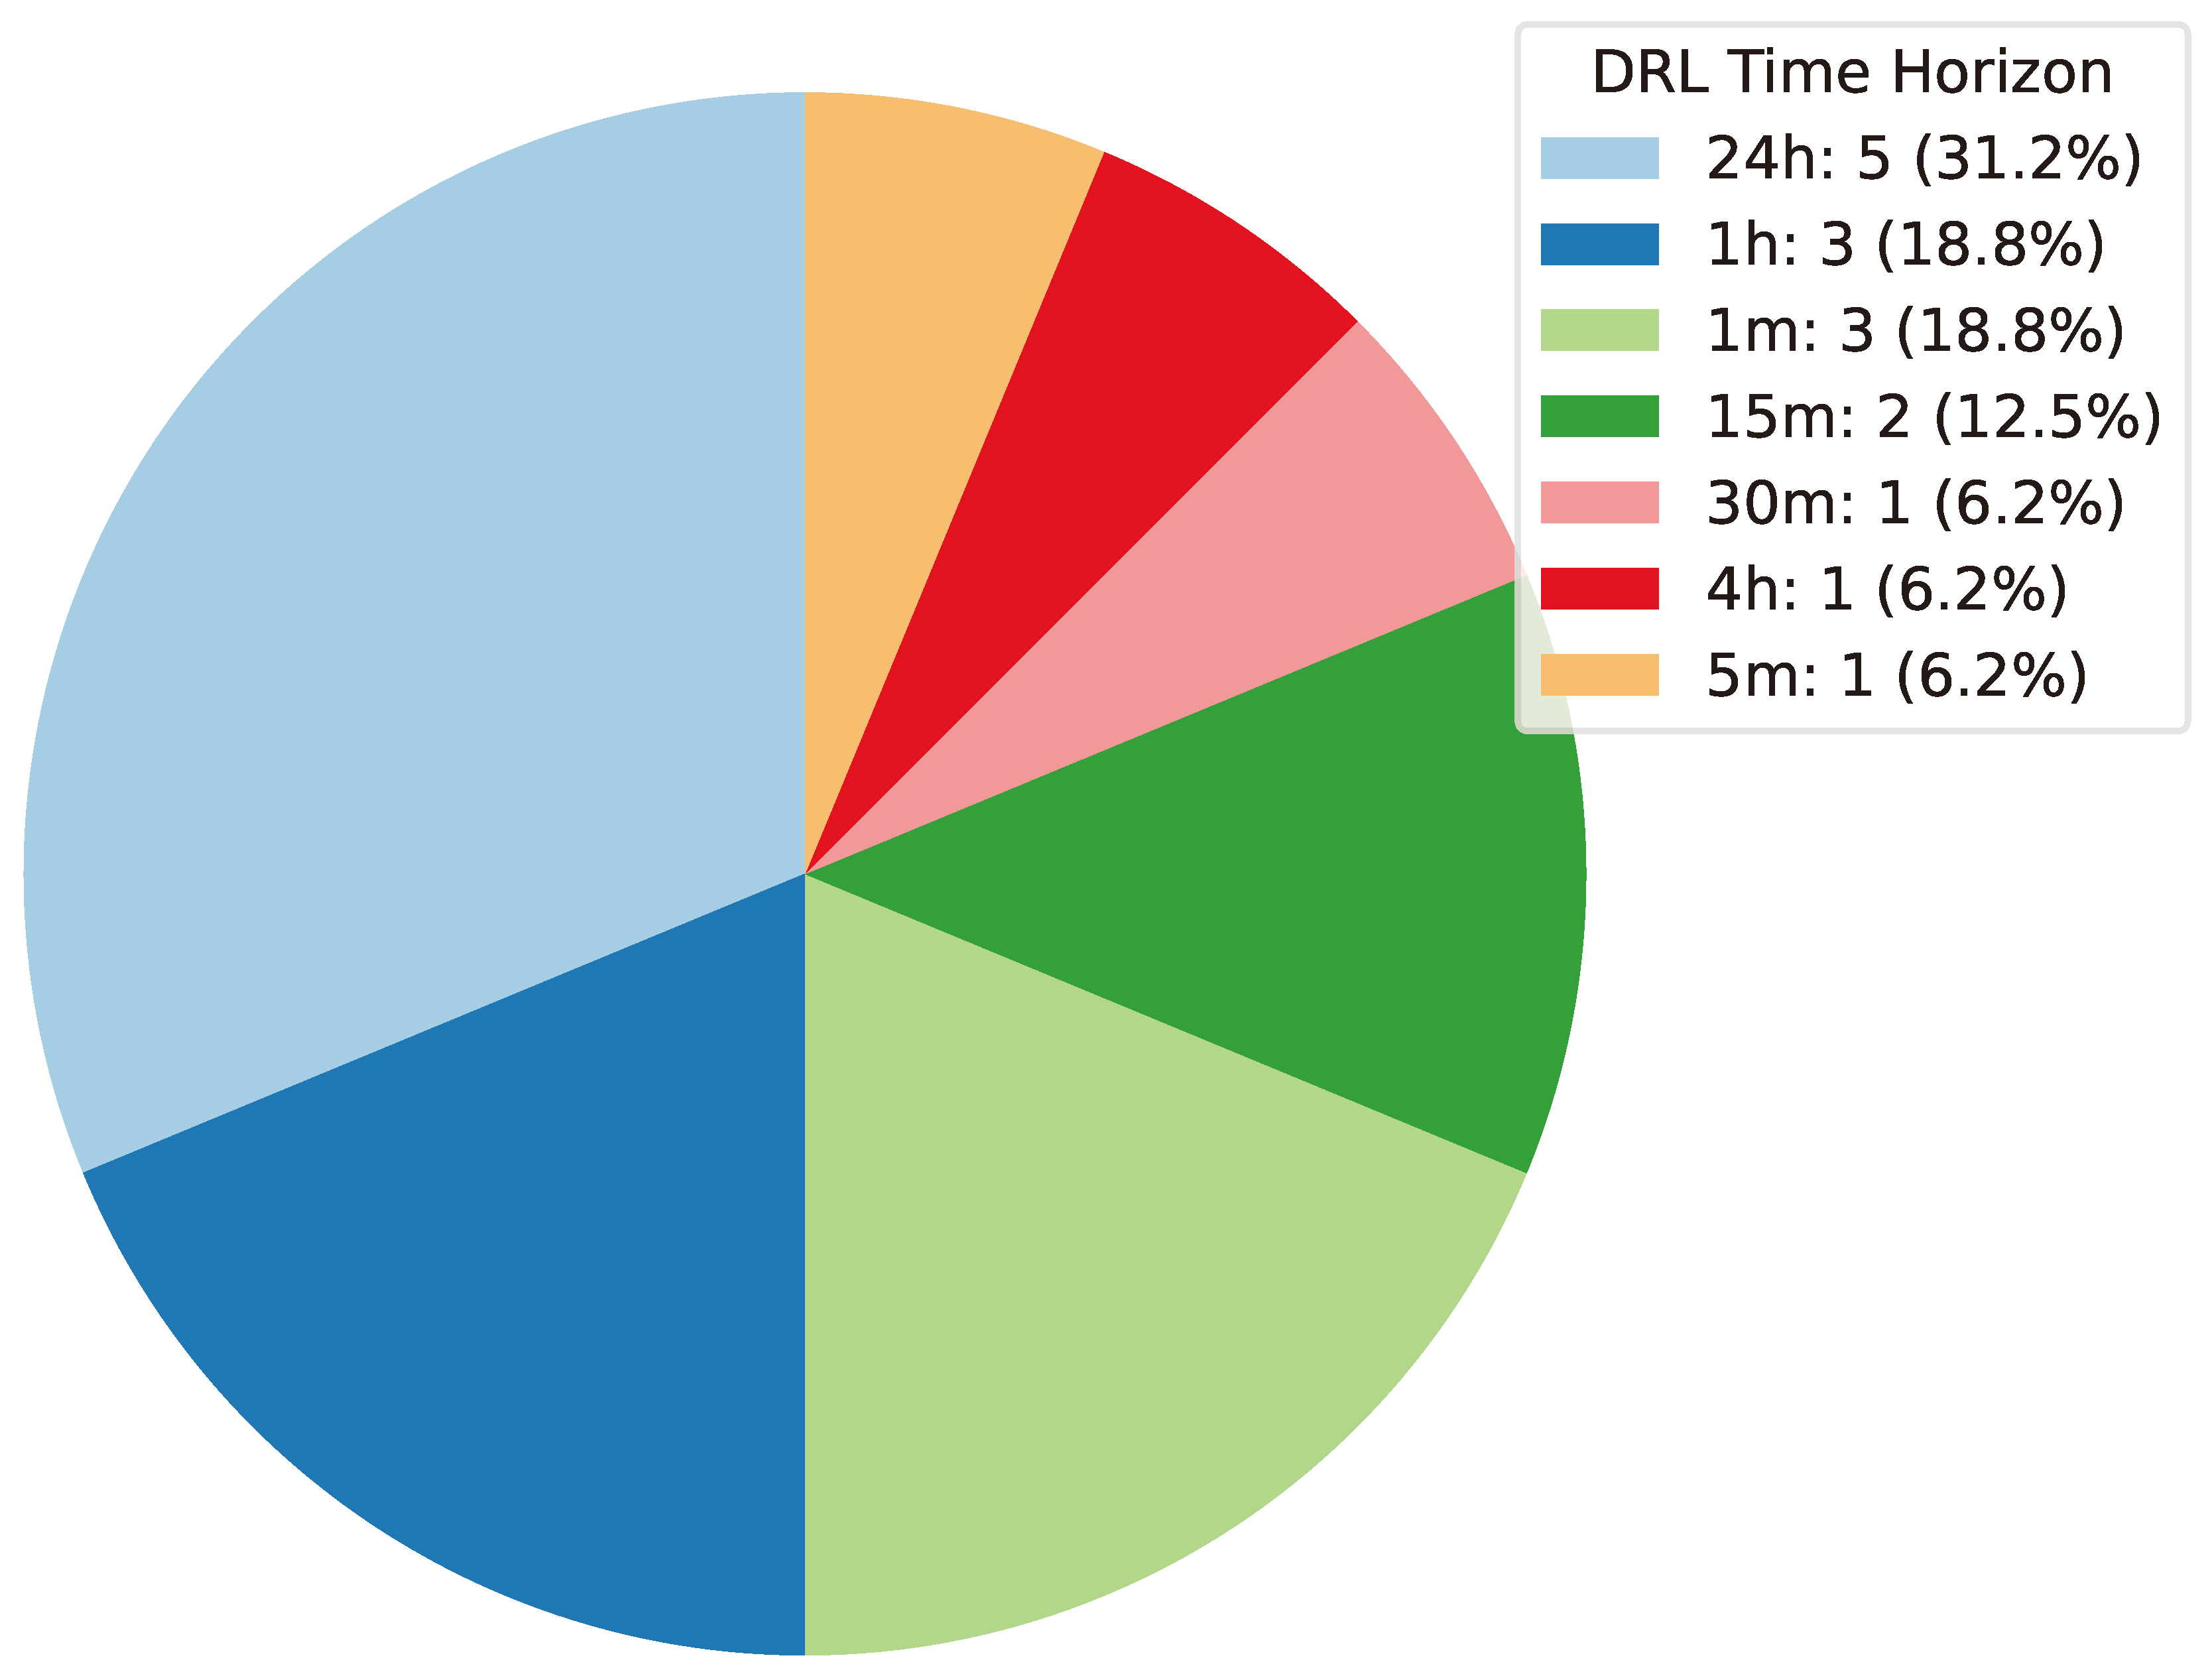
7.2. Studies Utilizing Deep Reinforcement Learning for Cryptocurrency Forecasting
In 2022, Xiao et al. [171] addressed three prominent challenges confronting financial reinforcement learning: the low signal-to-noise ratio of financial data, survivorship bias in historical data, and the issue of model overfitting during backtesting. They introduced the FinRL-Meta library, actively maintained by the AI4Finance community, which follows a DataOps paradigm. The library provides diverse market environments, collecting dynamic datasets from real-world markets and transforming them into gym-style market environments. Additionally, they contribute to knowledge dissemination by reproducing popular papers and deploying libraries on cloud platforms, enabling users to visualize their results and assess relative performance. Multiple Jupyter/Python demos, presented in the form of courses and documentation, contribute to the facilitation of a rapidly growing community.
In 2021, Carlos et al. [172] utilized price and blockchain data as input features, focusing on a 30-minute time horizon. Their approach involved employing self-attention network models, with mean and standard deviations serving as evaluatory metrics to gauge model performance. During the training process, the SA-NET model incurred transaction fees, achieving a profit of 4.3%, and without fees, it earned a profit of 3.4%.
Bo et al. [173] conducted a study in 2023 employing Deep Evolutionary Reinforcement Learning (DERL), Q-learning, evolution strategy, and policy gradient. The investigation centered around BTC with a 1-minute time horizon, utilizing cumulative log returns, maximum margin of returns, and rate of returns for evaluations. Results indicated that the evolution strategy outperformed other methodologies with returns of 59.18%, 25.14%, and 22.72%, showcasing the superior performance of Deep Reinforcement Learning based on an evolution strategy compared to Q-learning and policy gradient.
In 2021, Zeinab et al. [174] incorporated price data, blockchain data, and sentimental data in their study of Litecoin and Monero. With a 24-hour time horizon, they employed MAE, MSE, RMSE, and MAPE as evaluatory metrics. Utilizing 1850 daily samples of LTC and XMR with an 80:20 training and testing split, their proposed scheme demonstrated superior performance compared to other state-of-the-art methods, achieving better accuracy with a lower error rate. Denis et al. [175] focused on Q-learning and DQN methods in 2023, utilizing price data and technical indicators with Bitcoin as the study currency. With a dataset comprising 3726 daily records and an 80:20 training and testing split ratio, their results indicated that all models outperformed a buy-and-hold strategy in the absence of transaction costs, albeit with some instability. Notably, one of the DQN models demonstrated consistent trading behavior and better performance.
In 2022, Pierre et al. [176] explored hierarchical reinforcement learning concepts by employing PPO, A2C, and TradeR models. Across various experiments, their trading agents consistently achieved profits in a realistic environment, even when transaction fees were involved. Jonathan et al. [177], in 2020, employed PPO and A2C models for a trading strategy, utilizing eight days of training data. Their performance evaluation, based on a limit order book from Bitmex, demonstrated the superiority of the A2C algorithm over the PPO agent in terms of both the greatest return and the number of profitable experiments. On average, positive outcomes were observed, as the agent consistently generated profits across most experiments, even in realistic settings that included transaction fees. However, these experiments also revealed behavioral instability. Further research is needed to enhance the explainability of decision-making processes.
Otabek et al. [178] utilized the DRL application neural model in 2020, exploring swing trading, scalping trading, and a double-cross strategy across BTC, LTC, and ETH with hourly time horizons. Their application, observing real-time price fluctuations, achieved notable profits, including 14.4% for BTC, and 74% and 41% net profit for LTC and ETH, respectively, in just one month. In 2022, Yun et al. [179] employed GAF-CNN and PPO using ETH/USD 15-minute data from January 1, 2020, to July 1, 2020. Their experiments revealed that transfer learning is suitable for US stock trading, showcasing the adaptability of models in volatile market conditions.
Shuyang et al. [180], in 2023, applied an ensemble policy and buy-hold strategy for automated cryptocurrency trading. Using hourly data from 01/01/2018 to 06/30/2022, they considered BTC, ETH, and more, employing technical indicators as input features for model training and testing. Their proposed model outperformed the buy-hold strategy, achieving a 0.6832 annualized return and a Sortino ratio of 1.2620 over 208 weekly periods.
Aisha et al. [181], in 2022, employed PPO and CNN-LSTM models with price data and technical indicators for BTC, ETH and more. Their models demonstrated adaptability in volatile market conditions, with BTC achieving the highest accuracy of 88.79% during a market downtrend from May 9, 2021, to July 19, 2021. In their 2023 study, Vasileios et al. explored algorithmic trading strategies using price data, technical indicators, and sentimental data as input features for models TraderNet-CR, DDQN, and PPO, focusing on a 1-hour time horizon with data sourced from coinapi across Bitcoin, Ether, ADA, Litecoin, and Ripple. The primary emphasis was on training TraderNet with the PPO algorithm, also used in the previous TraderNet-CR architecture. The study compared the performance of the integrated algorithm with a value-based method, DDQN, revealing sub-optimal performance in all experiments, except in the Ether market. The evaluation, spanning from 2016 to November 2022, underscores the importance of algorithm selection in designing effective cryptocurrency trading models, with PPO demonstrating more promising results within the specified time horizon and dataset [182].
In their 2023 study, Berend et al.[183] investigated algorithmic trading strategies by leveraging price data and technical indicators with PPO, TD3, and SAC models. The research focused on a 5-minute time horizon, evaluating the performance across various cryptocurrencies, including BTC, ETH, and more. Cumulative return and volatility served as key metrics, and the study also involved rigorous backtesting. The dataset, comprising five-minute-level data from February 2, 2022, to June 27, 2022, was divided into a training period (from February 2, 2022, to April 30, 2022) and a testing period (from May 1, 2022, to June 27, 2022). This research contributes valuable insights into the performance of different reinforcement learning models in cryptocurrency trading scenarios, with a specific focus on short-term time horizons and a diverse set of digital assets[183].
In their 2022 study, Cem et al.[184] employed price data as an input feature for Deep Double Q-Learning Network (DDQN), buy-hold, and cointegration methods, focusing on a 24-hour time horizon across a diverse set of cryptocurrencies including BTC, ETH and more. Metrics such as annualized return and max drawdown were utilized for evaluation. The study revealed the profitability of the Deep Reinforcement Learning strategy combined with the cointegration method in selecting pairs for crypto markets. Notably, the Statistical cointegration methods demonstrated an average annualized return of 2.8%, while the proposed DRL method, applied to the same crypto coins and trading period, exhibited a significantly higher annualized return of 16.95%. This underscores the efficacy of DRL methods in financial and pairs trading, provided the careful selection of pairs and trading periods[184].
In their 2019 study, Giorgio et al.[185] focused on utilizing price data in conjunction with Double Dueling Deep Q-Networks (DD-DQNs) models, employing a 1-minute time horizon specifically for BTC. The investigation encompassed various trading systems, all of which consistently yielded positive returns on average across different combinations of start and end dates for the trading activity. Notably, trading systems based on Double Q-learning and incorporating a Sharpe ratio reward function demonstrated larger return values. The SharpeD-DQN model was further tested over the entire considered period, producing a positive percentage return with an average of 8%. These findings highlight the efficacy of the SharpeD-DQN approach within short-term trading periods, emphasizing its potential as a profitable strategy for BTC in the specified time frame[185].
In their 2023 study, Minh et al.[186] employed price data with Double Dueling Deep Q-Networks , Deep Q-Network (DDQN), and Bayesian Optimization (BO) models, utilizing a 15-minute time horizon specifically for BTC. The evaluation incorporated metrics such as average reward, average standard deviation, and total cumulative reward, revealing that the DDQN setting with the Sharpe ratio as the reward function emerged as the most effective Q-learning trading system. The results presented two viable options for traders: employing the Bayesian Optimization approach for constructing a highly profitable long-term trading strategy or opting for the Deep Reinforcement Learning approach for regularly updating strategies based on new market information, facilitating more effective decision-making in short-term trading scenarios. Furthermore, the DRL settings were highlighted for their ability to address the high-dimensional parameter problem inherent in Bayesian Optimization, enabling the integration of diverse trading strategies, objective functions, and new data to enhance overall performance[186].
In their 2023 study, Thanga et al.[187] employed a comprehensive dataset comprising price data, blockchain data, and sentimental data to develop and evaluate predictive models, including Radial Basis Function Neural Network, Autoregressive Integrated Moving Average, Backpropagation Neural Network, and a proposed Reinforcement Learning (RL) method. The study focused on cryptocurrencies XMR, LTC, ORY, and BTC, utilizing an 80/20 split ratio for training and testing. Metrics such as Mean Squared Error, Mean Absolute Percentage Error, Root Mean Squared Error, and Mean Absolute Error were employed for evaluation. The proposed RL method, integrated with a blockchain framework, demonstrated superior performance when compared to other state-of-the-art strategies in the sector, particularly exhibiting enhanced consistency in predicting the prices of Litecoin and Monero. Despite achieving accurate predictions, the study acknowledged several limitations, including data availability, public trust, human factors, hardware constraints, and processing power, all of which influenced the prediction accuracy and highlighted the challenges associated with cryptocurrency prognosis[187].
In their 2021 study, Stephan et al.[188] utilized price data and various reinforcement learning algorithms, including Proximal Policy Optimization, Advantage Actor-Critic, Asynchronous Advantage Actor-Critic, Augmented Proximal Policy Optimization, Deep Q-Network, and Importance Weighted Actor-Learner Architecture. The study focused on a 4-hour time horizon for BTC, employing an 80/20 split ratio for training and testing within the TensorTrade Python framework. This framework, designed with TensorFlow-like methods, emphasizes cryptocurrency trading and facilitates the creation of specialized trading environments. Notably, the A2C algorithm emerged as the overall winner, outperforming the other algorithms, although the differences were marginal. The study highlighted the potential influence of outcomes by adjusting settings and parameters. The findings underscored the diversity of available reinforcement learning algorithms and the need for careful consideration of their configurations in cryptocurrency trading applications[188].
In their 2020 study, Thomas et al.[189] employed a Direct Reinforcement Learning (DR) approach for the cryptocurrencies BTC, ETH, and more, evaluating performance using the Sortino ratio. The study focused on cumulative returns and risk-adjusted returns, as indicated by the Sharpe and Sortino ratios. The results demonstrated that the DR model consistently outperformed a buy-and-hold approach for all sampled cryptocurrencies, except Ether. The evaluation encompassed five of the largest cryptocurrencies in circulation, namely bitcoin, Ether, litecoin, ripple, and monero, with a sample range from August 26, 2015, to August 12, 2019, totaling 1447 data points. This timeframe allowed for the examination of both well-established cryptocurrencies like bitcoin and relatively newer ones like Ether, providing insights into the effectiveness of the DR model across different cryptocurrency market conditions[189].
In their 2018 study, Yagna et al. [190] implemented a Deep Q-Network model using both price data and bid-ask data for a 1-minute time horizon specifically for BTC. The researchers collected trade, bid, and ask data by subscribing to Bittrex’s WebSocket, covering the date range from November 2nd, 2018, to November 17th, 2018. Utilizing the WebSocket data, the study involved constructing a historical order book, representing a sequence of historical order book states over the specified time period. Subsequently, a minute tick dataset was created using the collected trade data. In total, the dataset for the study comprised 41,830,629 trade, bid, and ask data points, along with 10,945 minute tick data points. This comprehensive dataset facilitated the examination of the DQN model’s performance in the context of high-frequency trading for BTC during the specified timeframe[190].
7.3. Summarized Literature Review of Deep Reinforcement Learning Approaches
In this section, this survey presents a summarized literature review of Deep Reinforcement Learning approaches utilized in cryptocurrency price prediction. The table A3 provides an overview of various methodologies, time horizons, currencies, evaluation metrics, data samples, and training/testing strategies employed in the literature. This summary aims to provide insights into the diverse range of Deep Reinforcement Learning techniques applied to analyze cryptocurrency price movements and trends.
8. Use of Statistical Learning in Cryptocurrency Forecasting
Statistical Models have a rich history in financial forecasting, and cryptocurrency markets are no exception. In this section, we review research that relies on Statistical models, such as autoregressive integrated moving averages, GARCH, and regression analysis, to predict cryptocurrency prices and trends. This survey paper analyzes the efficacy of Statistical approaches, their limitations, and their place in the landscape of cryptocurrency forecasting.
The section 8 unfolds into three distinct categories, each offering a specialized perspective on the application and evolution of Statistical Learning in various domains. Firstly, the detailed analysis and trends in SL studies (8.1) scrutinize the methodological intricacies and emerging patterns prevalent in recent research endeavors. Secondly, studies utilizing SL for various applications (8.2) delve into specific case studies and methodologies employed to solve complex problems leveraging Statistical Learning techniques. Lastly, the summarized literature review of SL approaches (8.3) encapsulates a synthesis of existing literature, distilling key insights and advancements in the field of Statistical Learning. Together, these subsections provide a comprehensive overview of the landscape, facilitating a deeper understanding of the complexities and innovations driving SL applications across different domains.
8.1. Detailed Analysis and Trends in Statistical Learning Studies
In this dedicated section, the application of Statistical Learning techniques to predict changes in the cryptocurrency market will be examined. Statistical Learning involves the use of mathematical models and algorithms to analyze data, identify patterns, and make predictions. This study will delve into the specific methods used, the cryptocurrencies that are commonly analyzed, and how researchers consider time-related factors to improve prediction accuracy. By investigating these aspects, this study aims to highlight the importance of Statistical Learning in understanding and forecasting trends within the cryptocurrency market.
8.1.1. Methodological Trends in Statistical Learning Literature
In the examined literature on cryptocurrency forecasting employing Statistical Learning, a pie chart in Figure 17 analysis reveals the distribution of forecasting methods utilized. ARIMA emerges as the most prevalent method, found in 38 out of the surveyed papers, accounting for approximately 62% of the total papers. Following ARIMA, GARCH is utilized in 13 papers, representing roughly 21% of the total, while the Prophet forecasting model is employed in 8 papers, constituting approximately 13.1% of the total. This breakdown sheds light on the popularity and adoption of different forecasting techniques within the domain of cryptocurrency forecasting utilizing Statistical Learning methodologies.
Figure 17.
Distribution of Forecasting Methods in Cryptocurrency Forecasting Literature Utilizing Statistical Learning.
Figure 17.
Distribution of Forecasting Methods in Cryptocurrency Forecasting Literature Utilizing Statistical Learning.
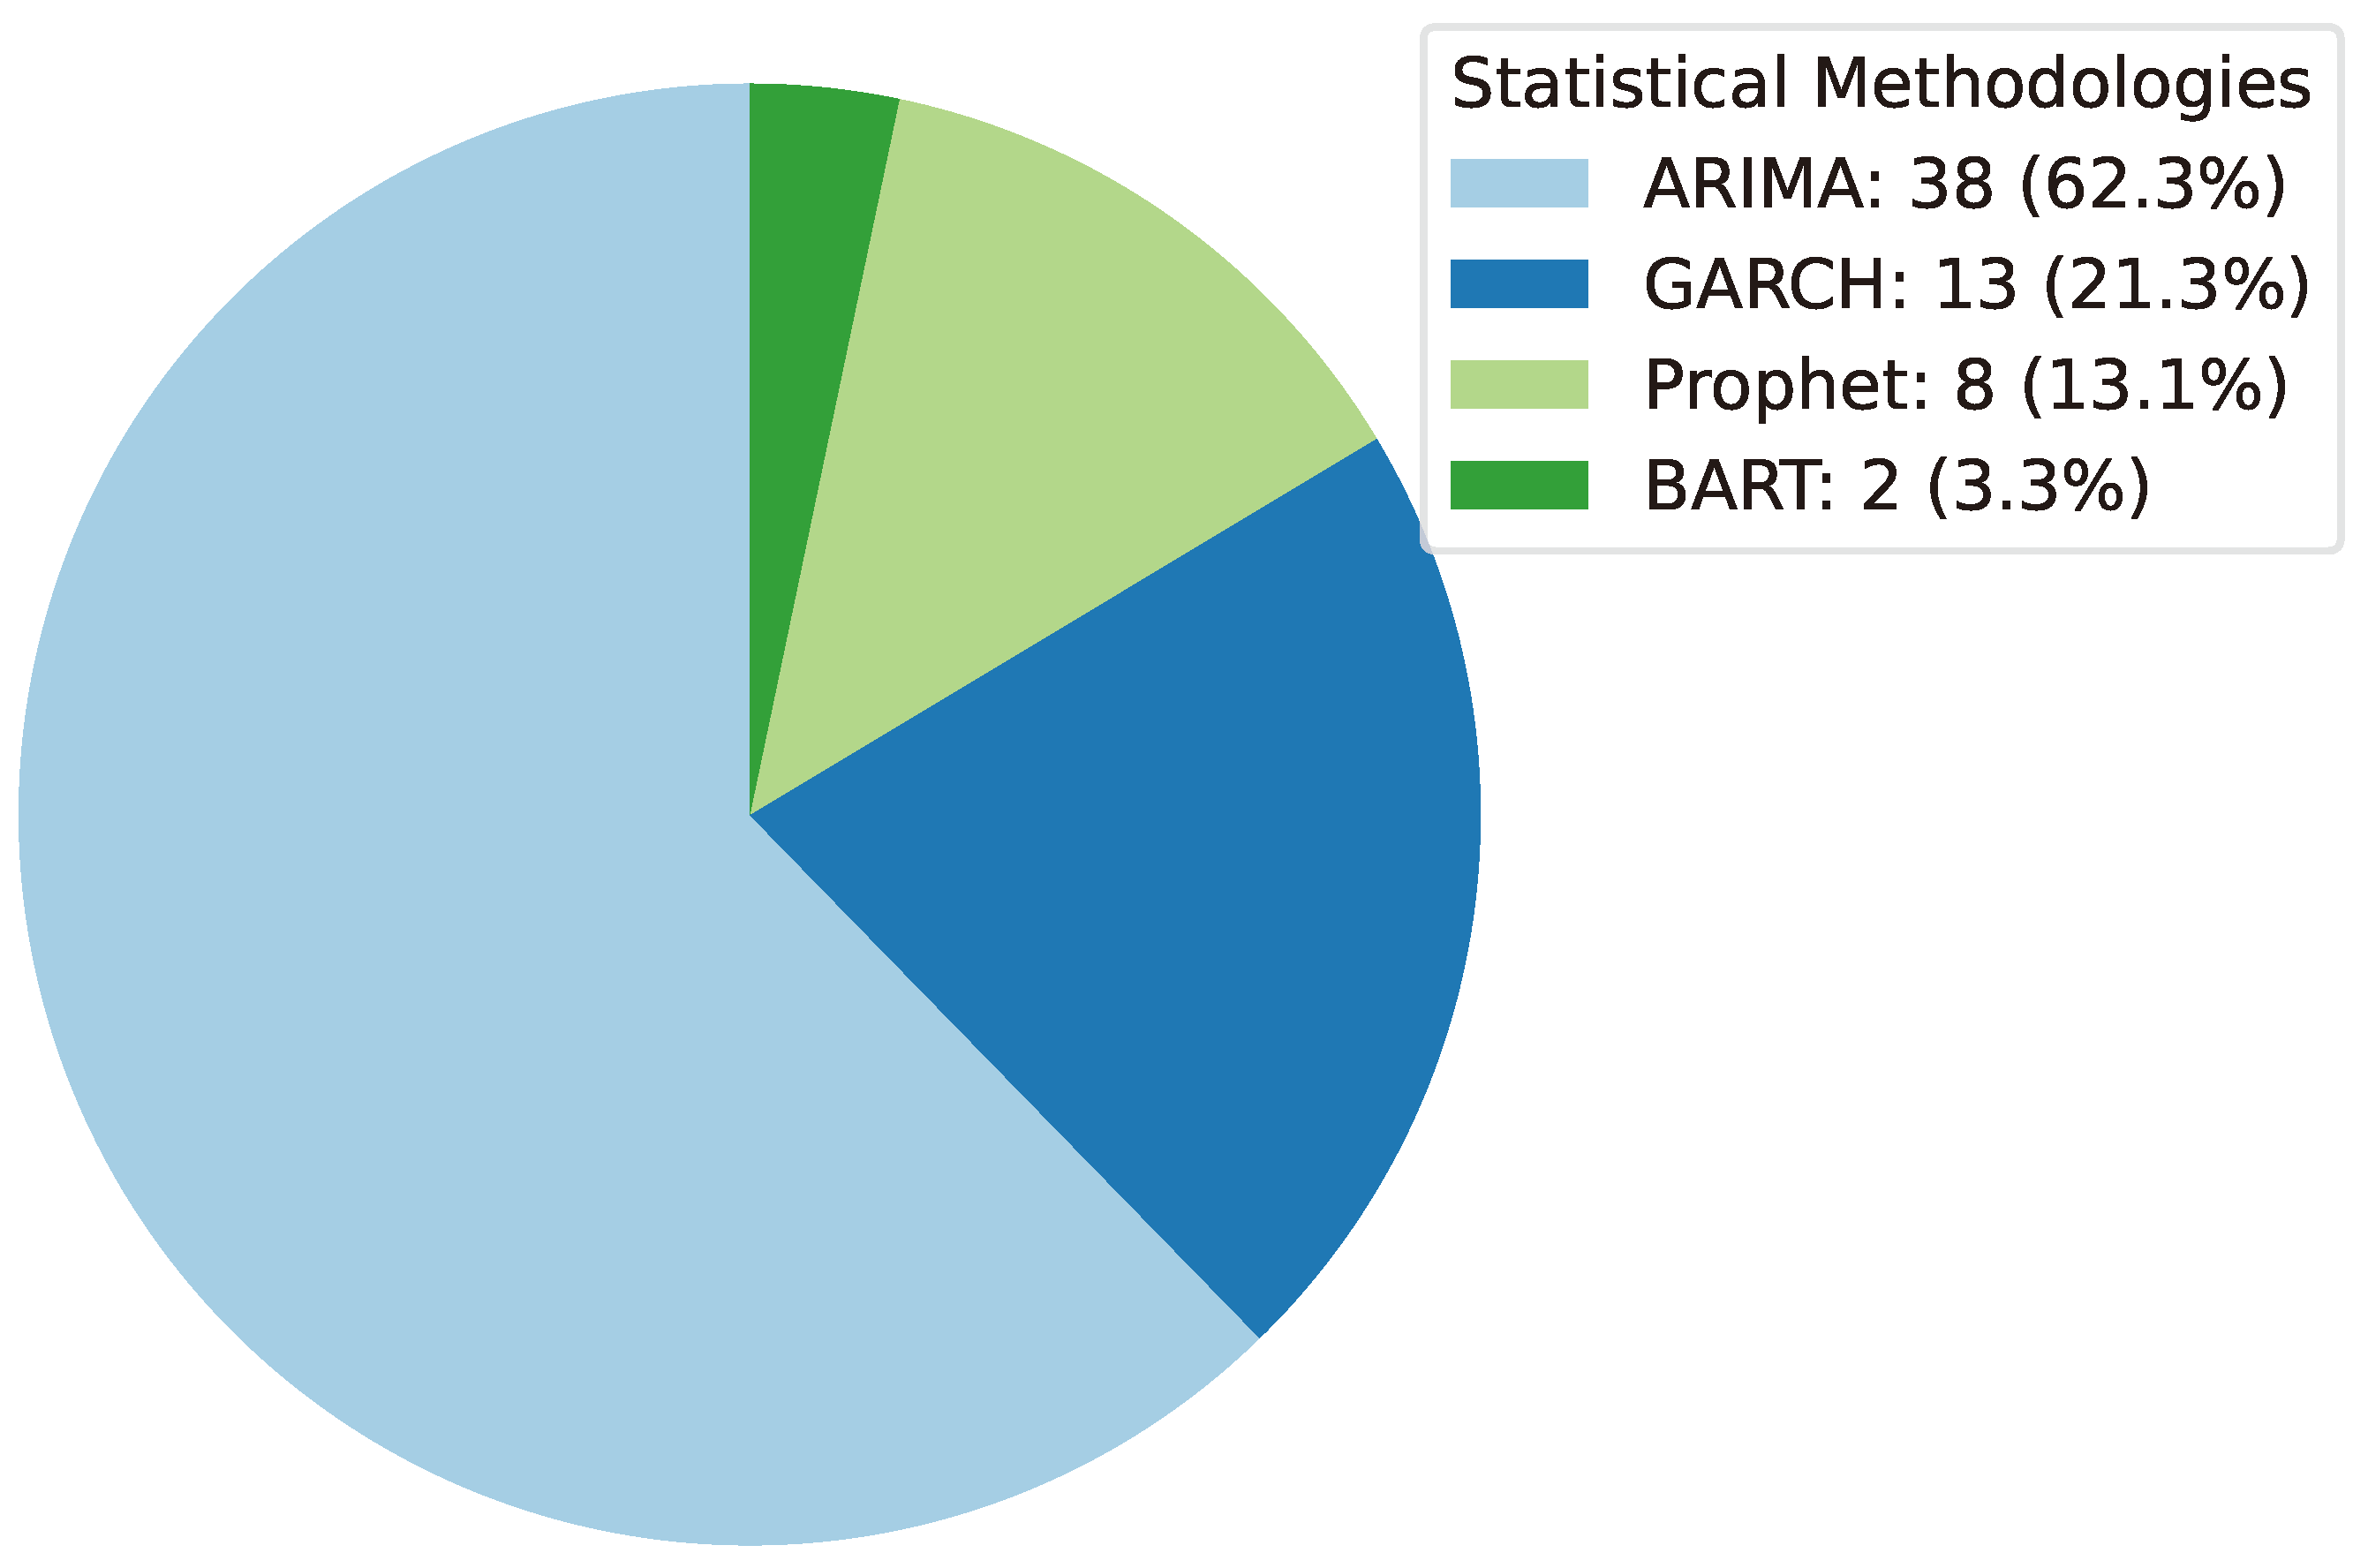
8.1.2. Currency-wise Distribution in Statistical Learning Studies
Examining the currency-wise distribution within Statistical Learning studies provides valuable insights into the utilization of different cryptocurrencies across research papers. Bitcoin (BTC) emerges as the dominant cryptocurrency in the studied corpus, constituting 27.9% of the pie chart. Ether (ETH) follows with a significant presence, being utilized in 12.1% of the research papers. XRP holds a notable proportion, accounting for 7.9% of the distribution. This distribution reflects the diverse applications and interests within the intersection of Statistical Learning and cryptocurrency domains. It highlights the prevalence of certain cryptocurrencies in Statistical Learning studies, offering researchers valuable insights into the trends and preferences in utilizing cryptocurrencies for Statistical analyses and learning methodologies.
Figure 18.
Currency-wise distribution in Statistical Learning studies: proportional utilization of cryptocurrencies across research papers
Figure 18.
Currency-wise distribution in Statistical Learning studies: proportional utilization of cryptocurrencies across research papers

8.1.3. Time Horizon-Wise Distribution in Statistical Learning Studies
The analysis of time horizon-wise distribution within Statistical Learning studies reveals significant insights into the temporal considerations across research papers. A predominant focus on a 24-hour time horizon is observed, representing 73.1% of the distribution. Meanwhile, a smaller yet notable proportion of studies delve into shorter time intervals: 9.6
This distribution underscores the importance of temporal considerations in Statistical Learning studies and reflects the emphasis placed on analyzing data across various temporal scales. Understanding these temporal nuances is critical for developing robust Statistical models and making informed decisions in various domains.
Figure 19.
Time horizon-wise distribution in Statistical Learning studies: proportional analysis of temporal considerations across research papers
Figure 19.
Time horizon-wise distribution in Statistical Learning studies: proportional analysis of temporal considerations across research papers
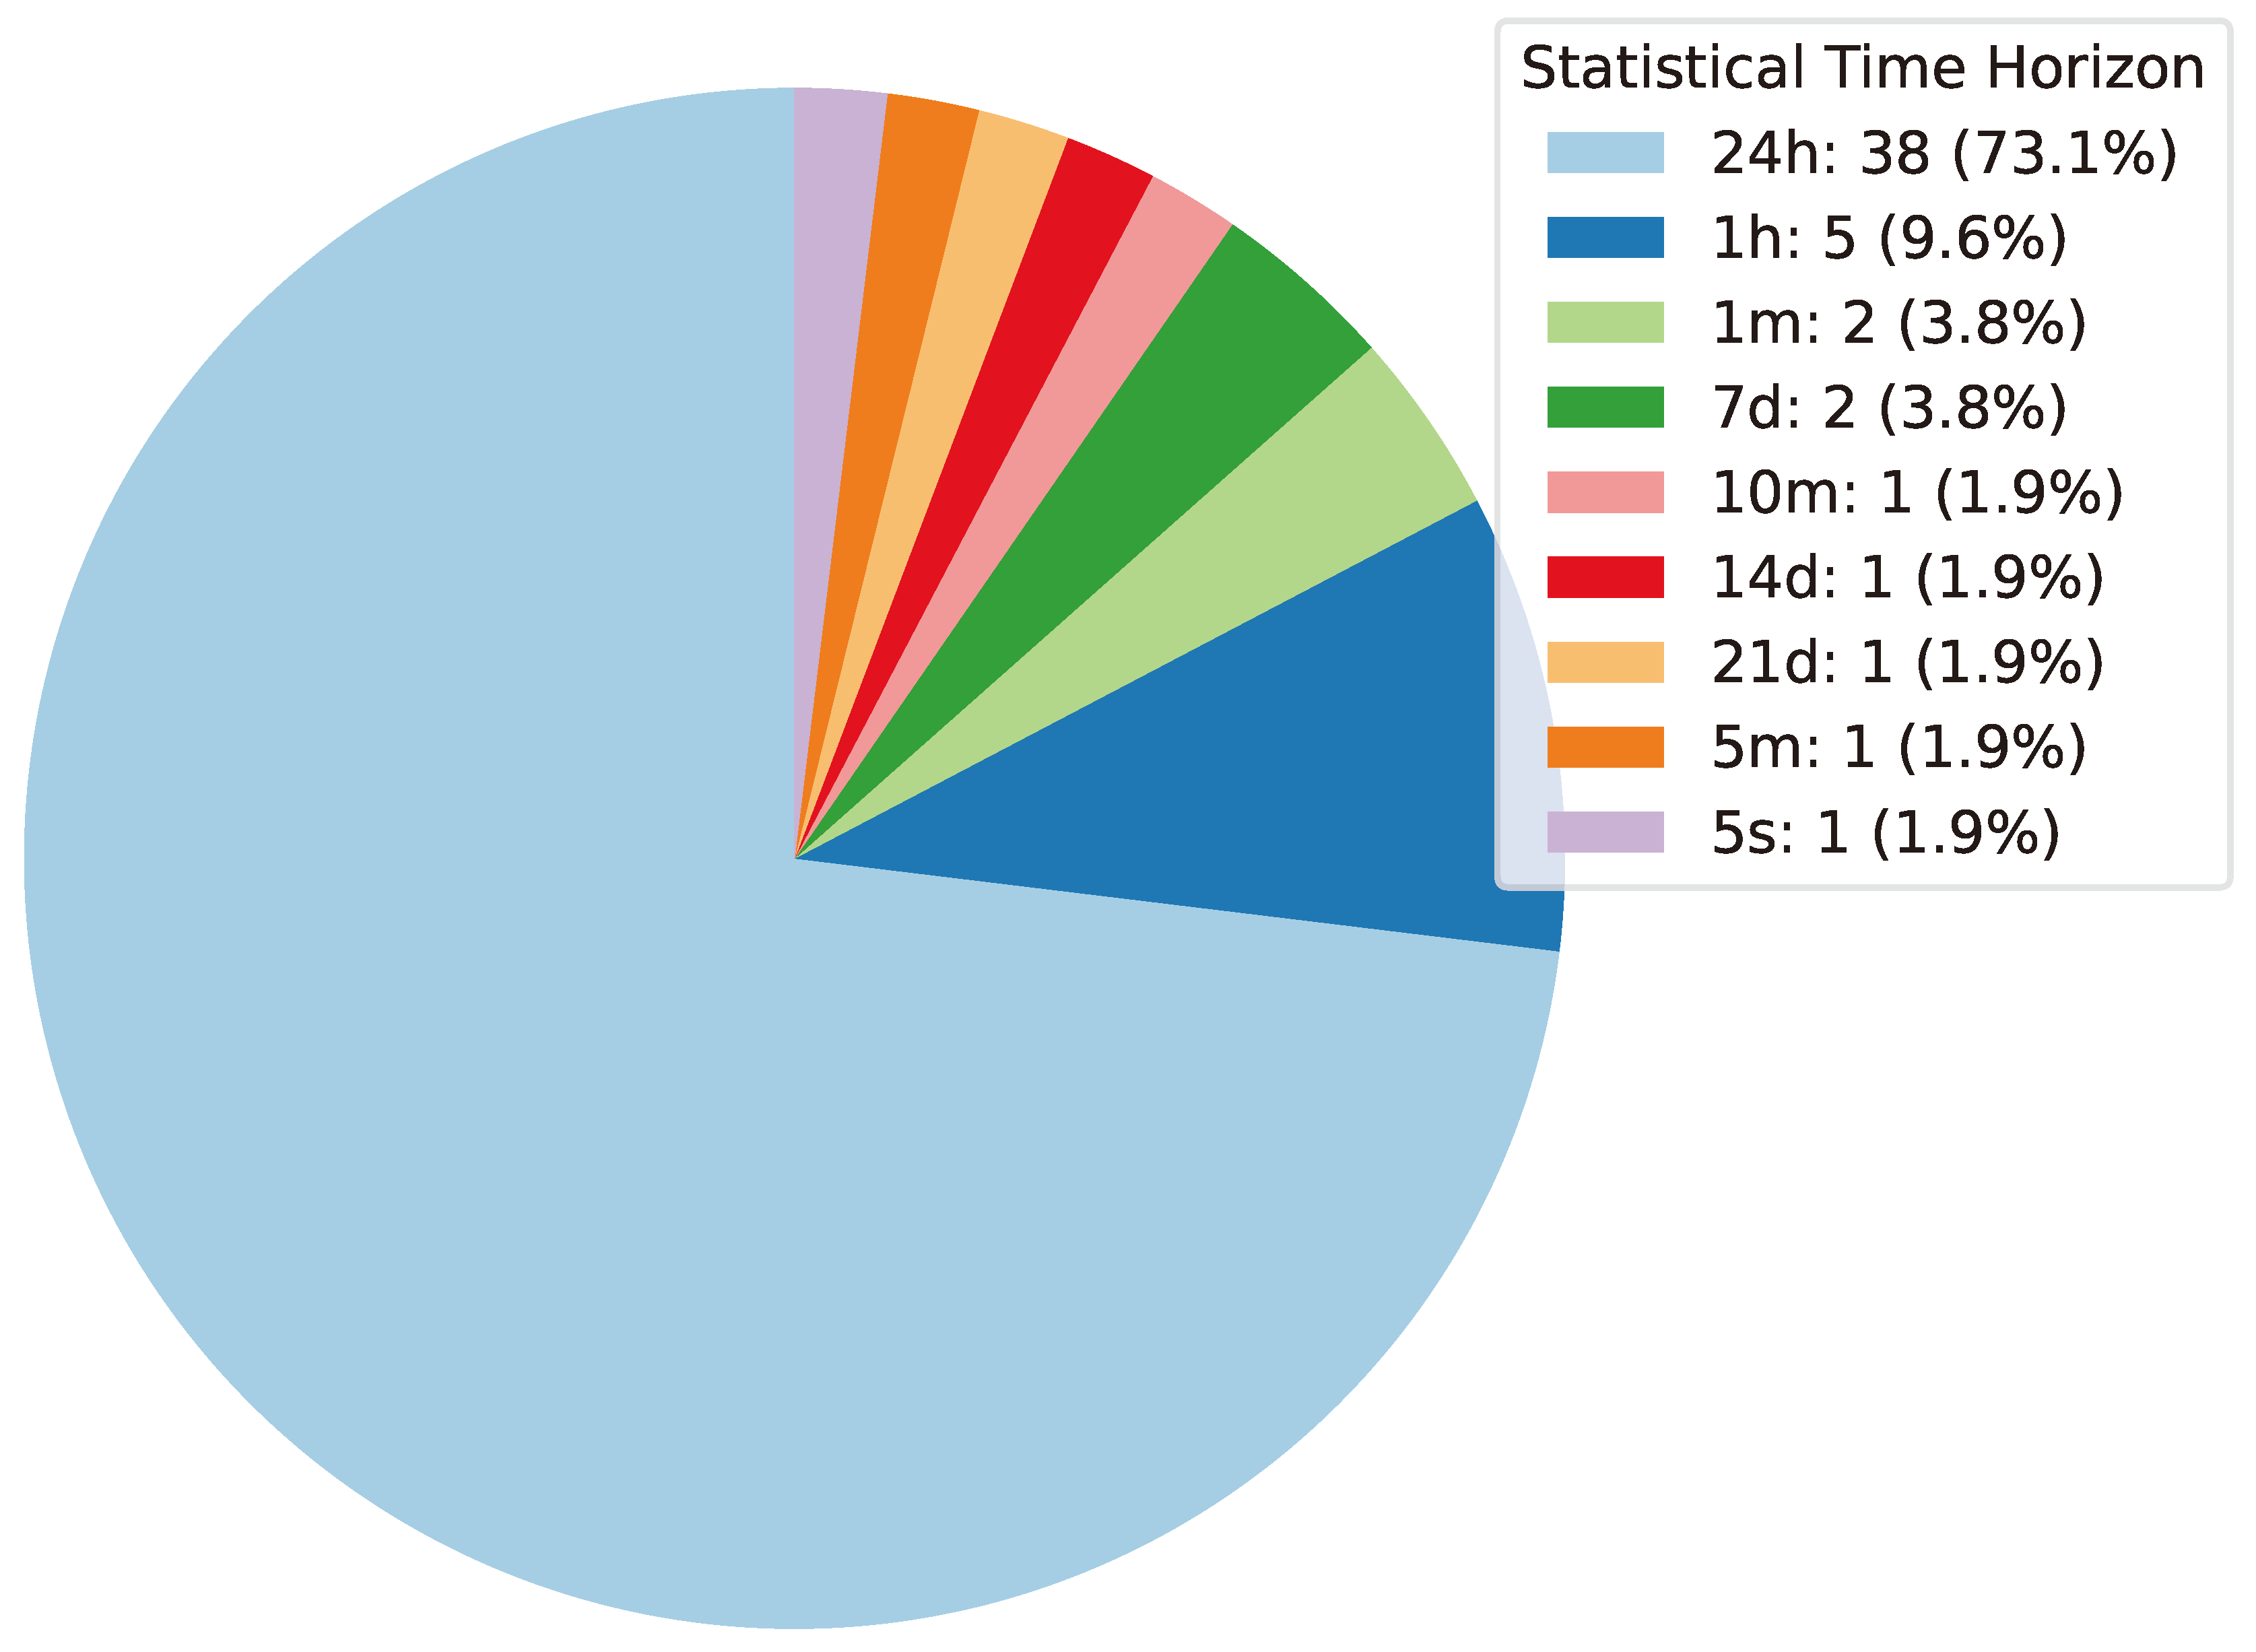
8.2. Studies Utilizing Statistical Learning for Cryptocurrency Forecasting
Statistical Models have a rich history in financial forecasting, and cryptocurrency markets are no exception. In this section, this paper reviews research that relies on Statistical models, such as autoregressive integrated moving averages, GARCH, and regression analysis, to predict cryptocurrency prices and trends. We analyze the efficacy of Statistical approaches, their limitations, and their place in the landscape of cryptocurrency forecasting.
8.2.1. ARIMA-Based Approaches
Jayadi et al. [191] employed ARIMA models for cryptocurrency price prediction with a 24-hour time horizon, focusing on BTC, ETH, BNB, USDT, and ADA. They evaluated their models using MAPE and RMSE.The LSTM method outperforms the ARIMA method in terms of both accuracy metrics and visualization. In a similar vein, Afif et al. citeAfif2020 extended the ARIMA model by incorporating ES and TS components for BTC price prediction, with RMSE and MSE as their evaluation metrics. Both studies centered on time series analysis, making ARIMA a common choice. They emphasized the potential for statistical methods to excel compared to artificial intelligence models in certain contexts.
Iqbal et al. [73] also utilized the ARIMA model but with a specific focus on BTC price prediction over a 24-hour horizon. Their evaluation encompassed RMSE, MAE, and R-squared as key metrics. Dhavale et al. [192] presented a diverse approach by considering various models, including Prophet, ARIMA, LSTM, XGBOOST, SVM, LR, and NB. The specifics of the time horizon, currencies, and evaluation metrics were not provided in the table, but this study explored a wider range of modeling techniques. Ampountolas et al. [193] focused on ARIMA models for BTC with a 24-hour time horizon. They used MAE, RMSE, and MAPE as evaluation metrics, aligning with the time series analysis methods used in Jayadi’s and Afif’s studies.
Azizib et al. [33] utilized ARIMA models for BTC price prediction with a 24-hour time horizon, evaluating using RMSE and MAPE, aligning with the time series analysis approach. Azizi et al. [28] applied ARIMA models for BTC price prediction with a 24-hour time horizon and used RMSE and MAPE as evaluation metrics, aligning with the time series analysis approach. Desai et al. [147] utilized ARIMA models for BTC price prediction with a 24-hour time horizon, evaluating using RMSE and MAE, aligning with the time series analysis approach. Ndunagu et al. [194] considered a wide range of cryptocurrencies BTC, ETH, and more are used in both SM and ARIMA models with various evaluation metrics, including MSE, RMSE, and MAE, maintaining a focus on Statistical and time series analysis methods.
Lim et al [74] used ARIMA models for cryptocurrency price prediction with a 24-hour time horizon, focusing on BTC, ETH, and XRP. They evaluated using RMSE, aligning with the time series analysis approach. Bhattacharyya et al. [121] employed ARIMA models for cryptocurrency price prediction with a 24-hour time horizon, targeting BTC, ETH, and more. They evaluated using Correlation, MPE, MAPE, and RMSE. BALCI [67] considered both price data and sentimental data for ARIMA-based BTC, ETH, ADA, and XRP price prediction with a 24-hour time horizon. They evaluated their models using RMSE, incorporating both price and sentiment data into their analysis.
Zou et al [95] used ARIMA models for price prediction with a 24-hour time horizon, focusing on EU-ETS, SHSE, and BTC. Their evaluation involved MAE, MAPE, DSTAT, and RMSE. Mishra et al [165] concentrated on ARIMA models for BTC price prediction with a 24-hour time horizon, evaluating using RMSE and MAE.
Bianchi et al [153] explored ARIMA, TCN, NBEATS, and TFT models for ETH price prediction with a 24-hour time horizon. Their evaluation metrics included MSE, MAE, RMSE, R2, and MAPE, showcasing a variety of modeling techniques. Convolutional neural networks outperformed other architectures in terms of both accuracy and time objectives. Deep neural networks yield more accurate results for ETH compared to the ARIMA model used as a reference. A step-ahead forecast window size ensures continuous forecast information, ensuring availability despite combined lagged data and model calculation times of less than 1 hour, achievable with two different off-the-shelf computer hardware options. Chatterjee et al [169] applied ARIMA and GARCH models for price prediction for SOL, BTC, and ETH with a 1-hour time horizon. They evaluated using MSE, RMSE, MAE, MAPE, and MASE. LSTM and ARIMA-GARCH performed best in a scenario of low volatility, with LSTM demonstrating superior performance during periods of higher volatility. Additionally, the data exhibits short-term mean-reverting behavior and is adequately approximated by a simple naive walk. Jannat et al [195] incorporated both price data and technical indicators for various cryptocurrencies (BTC, ETH, LTC, USDT) using ARIMA models for price prediction with a 24-hour time horizon. They evaluated using MAE, MSE, RMSE, Mean, and Accuracy.The autoregressive (AR) model exhibits the highest accuracy in predicting the prices of BTC, ETH, LTC, and Tether-token, achieving accuracies of 97.21%, 96.04%, 95.8%, and 99.91%, respectively.
Chaudhari et al [116] used ARIMA models for BTC, ETH, and LTC price prediction with a 24-hour time horizon, evaluating using MSE, RMSE, MAE, MAPE, and R2. Bhatiaa et al [196] applied ARIMA models without specifying the time horizon or currency. They evaluated using Accuracy. Upon evaluation, the LSTM model was found to outperform both the Prophet and the ARIMA model. ROSTAMI et al [197] used Box-Jenkins, AR, MA, ARIMA, ACF, PACF, and GS models for BTC price prediction with a 24-hour time horizon. They evaluated using FE, MFE, MAE, MSE, and RMSE. An average accuracy of 86.424% is observed across 95% of the currencies. Following this validation, forecasting is conducted for these cryptocurrencies, calculating the percentage change in price.
Hua et al [122] applied ARIMA models for BTC price prediction with a 5-second time horizon, without specifying evaluation metrics. Bhat et al [53] utilized ARIMA models for BTC price prediction with a 1-hour time horizon, evaluating using Accuracy. Sharma et al [160] applied ARIMA models for BTC price prediction with a 10-minute time horizon. They evaluated using MAPE, MAE, and RMSE. The ADF and AD tests indicate that BTC prices exhibit characteristics of nonlinearity and nonstationarity. Consequently, classical forecasting methods are deemed unsuitable for predicting BTC prices. Among the tested models, NARX achieves the lowest errors in MAE (23.415), MAPE (14.433%), RMSE (141.941), and MASE (1.149), establishing it as the preferred model for performing a 30-day ahead forecast.
Das et al [55] employed MARS and LASSO models for BTC price prediction with a 24-hour time horizon. They did not specify evaluation metrics. Sunny et al [75] considered price data and technical indicators for BTC price prediction, utilizing ARIMA, Prophet, and XGBoost models, without specifying evaluation metrics.
Thanaya et al. [159] utilized ARIMA models for BTC price prediction with a 24-hour time horizon. They evaluated using RMSE.Emili et al [198] incorporated GARCH models for BTC, ETH, XRP, and LTC price prediction with a 24-hour time horizon. They evaluated using MAE, HMSE, and R2. Duong et al [199] considered sentimental data and price data for BTC price prediction, using VAR models with a 7-day time horizon. Taylor et al. [200] used JRRS models for BTC, ETH and more. Price prediction with a 24-hour time horizon, without specifying evaluation metrics. Dmitriy et al [201] employed ARMA, GARCH, and HAR models for BTC, ES, and GSPC price prediction with a 5-minute time horizon. They evaluated using MAPE and Accuracy.
Haruna et al. [202] explored GARCH and ARIMA models for cryptocurrency price prediction, focusing on BTC, ETH, and BNB. The specifics of evaluation metrics were not provided in the table. Lee et al. [203] concentrated on BSV and GARCH models for cryptocurrency price prediction, specifically targeting BTC, ETH and more. The study did not specify the evaluation metrics. Koutmos et al. [138], Ampountolas et al. [193], Carraro et al. [71], Jannat et al. [195], Lim et al. [74], and Bianchi et al. [153] adopt RMSE and MAE metrics to predict cryptocurrency prices. They do not limit themselves to a single time horizon or currency, showcasing the versatility of their methodologies.
Koutmos et al. explore GARCH models across various timeframes (7 days, 14 days, 21 days) for BTC. Ampountolas et al. consider multiple cryptocurrencies, including BTC, LTSE, and more. Carraro et al. utilize different models for BTC, ETH, and more. Jannat et al. focus on BTC, ETH, LTC, and USDT. Lim et al. forecast prices for BTC, ETH, and XRP. Bianchi et al. extend their analysis to ETH and employ ARIMA, TCN, NBEATS, and TFT models. The common thread is their adoption of traditional Statistical models or neural networks, but they tailor their approaches to suit varying currencies and timeframes.
Jayadi et al. [191] utilize ARIMA models to predict cryptocurrency prices with a 24-hour time horizon for BTC, ETH, BNB, USDT, and ADA. They evaluate their models using MAPE and RMSE. Afif et al. [61] extend ARIMA with ES and TS for BTC price prediction, utilizing RMSE and MSE as evaluation metrics.
Shaikh et al. [204] utilize NNETAR and CSS models for BTC, ETH, XRP, and USDT price prediction, evaluating their models using MAE and RMSE. [124] combine ARIMA models with sentiment analysis for BTC price prediction at different time horizons (1m, 1h). They evaluate the models using RMSE and consider a large dataset of BTC prices. Carraro et al. [71] explore a variety of Deep Learning and advanced models, including LSTM, GRU, HYBRID, KNN, TCN, ARIMA, TFT, RF, and SVR, for cryptocurrency price prediction with a 24-hour time horizon. They consider currencies like BTC, ETH and more. They evaluate their models using RMSE, MAE, MAPE, and R2.
Azizib et al. [33] and Azizi et al. [28] both utilize ARIMA models for BTC price prediction with a 24-hour time horizon and evaluate model performance using RMSE and MAPE, although Azizib et al. [33] have a smaller dataset. ARIMA and Bayesian approaches outperform other univariate models, demonstrating smaller values for RMSE and MAPE.
Desai et al. [147] use ARIMA models for BTC price prediction with a 24-hour time horizon, assessing model performance using RMSE and MAE. They observed remarkable results using LSTMs, which significantly outperformed other models for most sequence tasks, as evidenced by the lower RMSE scores. Increasing the number of epochs to 100 could further refine their model’s performance. Additionally, augmenting the number of lag features beyond 100 may enhance their model’s learning capabilities.
ERGÜN et al. [205] incorporate blockchain data and external economic data into ANFIS models for BTC price forecasting, evaluating their models with RMSE. Ndunagu et al. [194] explore social media and ARIMA models for BTC, ETH, and more, evaluating using MSE, RMSE, and MAE. For all fifteen cryptocurrency datasets used accuracy levels ranged from 88% to 100%. Additionally, we observed that the global COVID-19 pandemic significantly impacted the demand and supply dynamics of cryptocurrencies worldwide.
Lim et al. [74] use ARIMA models for BTC, ETH, and XRP with a 24-hour time horizon and evaluate their models using RMSE. Bhattacharyya et al. [121] employ ARIMA models for a variety of cryptocurrencies and evaluate their models using correlation, MPE, MAPE, and RMSE. BALCI et al. [67] use ARIMA models for BTC, ETH, ADA, and XRP and evaluate model performance with RMSE. Zou et al. [95] explore ARIMA models for EU-ETS, SHSE, and BTC, assessing models with MAE, MAPE, DSTAT, and RMSE. Ampountolas et al. [193] employ ARIMA models for multiple currencies, including BTC, LTSE, N100, GDAXI, FCHI, and SSMI, and assess their models using MAE, RMSE, and MAPE.
8.2.2. Bayesian Additive Regression Trees
Stepanenko et al. [206] investigate the use of Bayesian Additive Regression Trees (BART) for predicting cryptocurrency prices with a 24-hour time horizon. They consider BTC, ETH, and XRP as target currencies and evaluate their models using RMSE. The obtained results demonstrate that the BART algorithm achieves greater accuracy across all investigated time series of cryptocurrencies and subperiods. Specifically, the RMSE for this algorithm over horizons of 14, 21, and 30 days falls within the range of 4%, 6%, and 8%, respectively. Dhavale et al. [192] consider a diverse range of models, including Prophet, ARIMA, LSTM, XGBOOST, SVM, LR, and NB, without limiting certain currencies or evaluation metrics.
Bezkorovainyi et al. [207] applied BART, CART, and ARIMA models for cryptocurrency price prediction without specifying a time horizon. They used RMSE as an evaluation metric, in line with the time series analysis approach. The results demonstrate that the BART algorithm outperforms all investigated time series of cryptocurrencies and subperiods. Specifically, the RMSE for this algorithm over horizons of 14, 21, and 30 days ranged within 4%, 6%, and 8%, respectively.
Carraro et al. [71] took a comprehensive approach, utilizing various models for cryptocurrency price prediction BTC, ETH, and more with a 24-hour time horizon. They used RMSE, MAE, MAPE, and R2 as evaluation metrics, demonstrating a diverse set of modeling techniques. Stepanenko et al. [206] took a different approach by employing Bayesian Additive Regression Trees (BART) for cryptocurrency price prediction, specifically targeting BTC, ETH, and XRP with a 24-hour time horizon. They used the Root Mean Squared Error as their primary evaluation metric. The Bayesian approach represents a divergence from the traditional time series models seen in previous studies.
Koutmos [138] explored GARCH models for cryptocurrency price prediction, with different time horizons (7 days, 14 days, 21 days) for BTC. They employed HMSE and HMAE as their evaluation metrics. This Statistical approach differs from the time series models in the earlier studies.
Xie et al. [208], Dorien et al. [170], and ROSTAMI et al. [197] incorporate alternative evaluation metrics such as correlation, MPE, MASE, precision, and recall for cryptocurrency price forecasting. Xie assesses BTC using LS models and various metrics. ROSTAMI et al. [197] apply Box-Jenkins, AR, MA, ARIMA, ACF, PACF, and GS models to BTC and assess their performance with various error metrics. These papers offer unique perspectives by introducing diverse evaluation criteria for cryptocurrency price prediction, beyond the traditional RMSE and MAE metrics.
Antulov-Fantulin [209] employed GTM models for BTC price prediction with a 1-hour time horizon, evaluating using RMSE and MAE. Xie [208] used LS models for BTC price prediction with a 24-hour time horizon. They evaluated using Correlation, MPE, MAPE, RMSE, SD, and Sharpe Ratio. Leatham [98] used SMA and GARCH models for BTC price prediction with a 24-hour time horizon. They evaluated using RMSE and MAE.
8.2.3. GARCH-Based Models
Koutmos et al. [138] examine GARCH models for cryptocurrency price forecast, assuming various time horizons (7d, 14d, 21d) and evaluating models using HMSE and HMAE. The predictive performance of the best triple hybrid model compared to the best single hybrid model improved by 18.61%, 19.88%, and 20.51% in HMAE, and 20.04%, 19.88%, and 20.51% in HMSE for the selected days-ahead forecasts. The study proceeded with a rolling window scheme to generate one-day-ahead forecasts and assess whether this approach minimizes errors and enhances model performance. Optimistic results were achieved, demonstrating that the predictive performance of the best triple hybrid model improved by 22.86%, 24.63%, and 24.87% in terms of HMAE and 29.70%, 31.05%, and 33.92% in HMSE compared to the best single hybrid model using a fixed window size. Similarly, the rolling window approach resulted in improvements of 29.70%, 31.05%, and 33.92% in HMSE for the best triple hybrid model compared to the best single hybrid model for the selected days-ahead forecasts.
Lahmiri et al. [161] investigate GARCH, EGARCH, and APGARCH models for various cryptocurrencies, assessing RMSE for each currency. Aguayo-Moreno et al. [87] employ GARCH models for cryptocurrencies like BTC, ETH,and more. They consider different time horizons and evaluate with HSE. Their findings revealed that not only do deep learning models enhance the forecasts of GARCH-type models under any distribution assumption, but also that incorporating forecasts from GARCH-type models as informative features can significantly increase the predictive power of the studied deep learning models, namely the DFFNN and LSTM models.
Lahmiri et al. [161] focused on GARCH models for cryptocurrency price prediction with a 24-hour time horizon. They covered a wide range of currencies and used RMSE as their primary evaluation metric, diverging from the time series analysis methods in earlier studies. Aguayo-Moreno et al. [87] explored GARCH models for various cryptocurrencies with time horizons ranging from 1 hour to 24 hours. They used HSE as their evaluation metric, maintaining a focus on Statistical approaches.The MLP models provide the best predictive results, although they do not show statistically significant differences in accuracy compared to the LSTM and LSTM–GARCH versions under the Diebold–Mariano test.
An et al. [170] considered DLST, VR, and GARCH models for BTC price prediction, evaluating using RMSE, F1, Precision, and Recall. The diverse evaluation metrics and modeling techniques set this study apart from traditional time series analysis.
Rubio [88] used GARCH models for BTC price prediction with a 24-hour time horizon, evaluating using MAPE and MAE. Rubio et al. [88], Leatham et al. [98], and Das et al. [55] utilize RMSE and MAE metrics for cryptocurrency price prediction without specifying alternative evaluation metrics. Rubio employs ARCH and GARCH models for BTC, Leatham explores SMA and GARCH for BTC, while Das focuses on MARS and LASSO for BTC. The emphasis on RMSE and MAE remains consistent across these studies, showcasing the importance of these metrics in assessing model accuracy. This research introduces the N-BEATS time series forecasting deep learning model trained on BTC data for the first time. The developed model demonstrates promising results, achieving a MAPE of 2.261% on daily data, 0.388% on hourly data, and 0.096% on up-to-the-minute data. These results slightly exceed those of an ARIMA model and significantly outperform the results of an LSTM model.
8.3. Summarized Literature Review of Statistical Learning Approaches
In this section, this survey presents a summarized literature review of Statistical Learning approaches utilized in cryptocurrency price prediction. The table ?? provides an overview of various methodologies, time horizons, currencies, evaluation metrics, data samples, and training/testing strategies employed in the literature. This summary aims to provide insights into the diverse range of Statistical Learning techniques applied to analyze cryptocurrency price movements and trends.
9. Social Data Exploration in Cryptocurrency Trends
In this part, we’re taking a closer look at how cryptocurrencies are talked about and searched for online. We’re checking out Google to see what people are searching for when it comes to Bitcoin and BTC. We’re also looking at how the prices of BTC connect with what people are saying on Reddit and how they relate to the number of news articles about crypto. And don’t forget Twitter – we’re checking out what people are saying there, especially when it comes to BTC and Bitcoin. To make sense of all this, we’re using different charts to show you the big picture of how people’s online actions, market changes, and cryptocurrency trends all come together.
9.1. Google Trends Bitcoin
Looking at how people search for "Bitcoin" from 2019 to 2024, interesting patterns show up. In 2021, a lot of folks were really curious about Bitcoin because Bitcoin experienced an all-time high in 2021, and the interest came back in 2022. At the end of 2020, there was a big jump in searches, even more than what we saw in 2019, and early 2020. Even though the number of searches for Bitcoin went up and down during this time, the overall trend is that more and more people kept searching for it. This suggests that people are interested in Bitcoin, and their curiosity keeps growing. The data shows some specific times when lots of people were looking up Bitcoin, making it clear that the interest is not slowing down. In conclusion, the analysis of Google Trends data for the keyword "Bitcoin" spanning from February 24, 2019, to Jan 31, 2024, reveals a compelling story of evolving public interest.
Figure 20.
Google Bitcoin Trends Line Chart: Visual representation of search interest in Bitcoin from February 24, 2019, to Jan 31, 2024, indicating fluctuations in public curiosity over the five years.
Figure 20.
Google Bitcoin Trends Line Chart: Visual representation of search interest in Bitcoin from February 24, 2019, to Jan 31, 2024, indicating fluctuations in public curiosity over the five years.
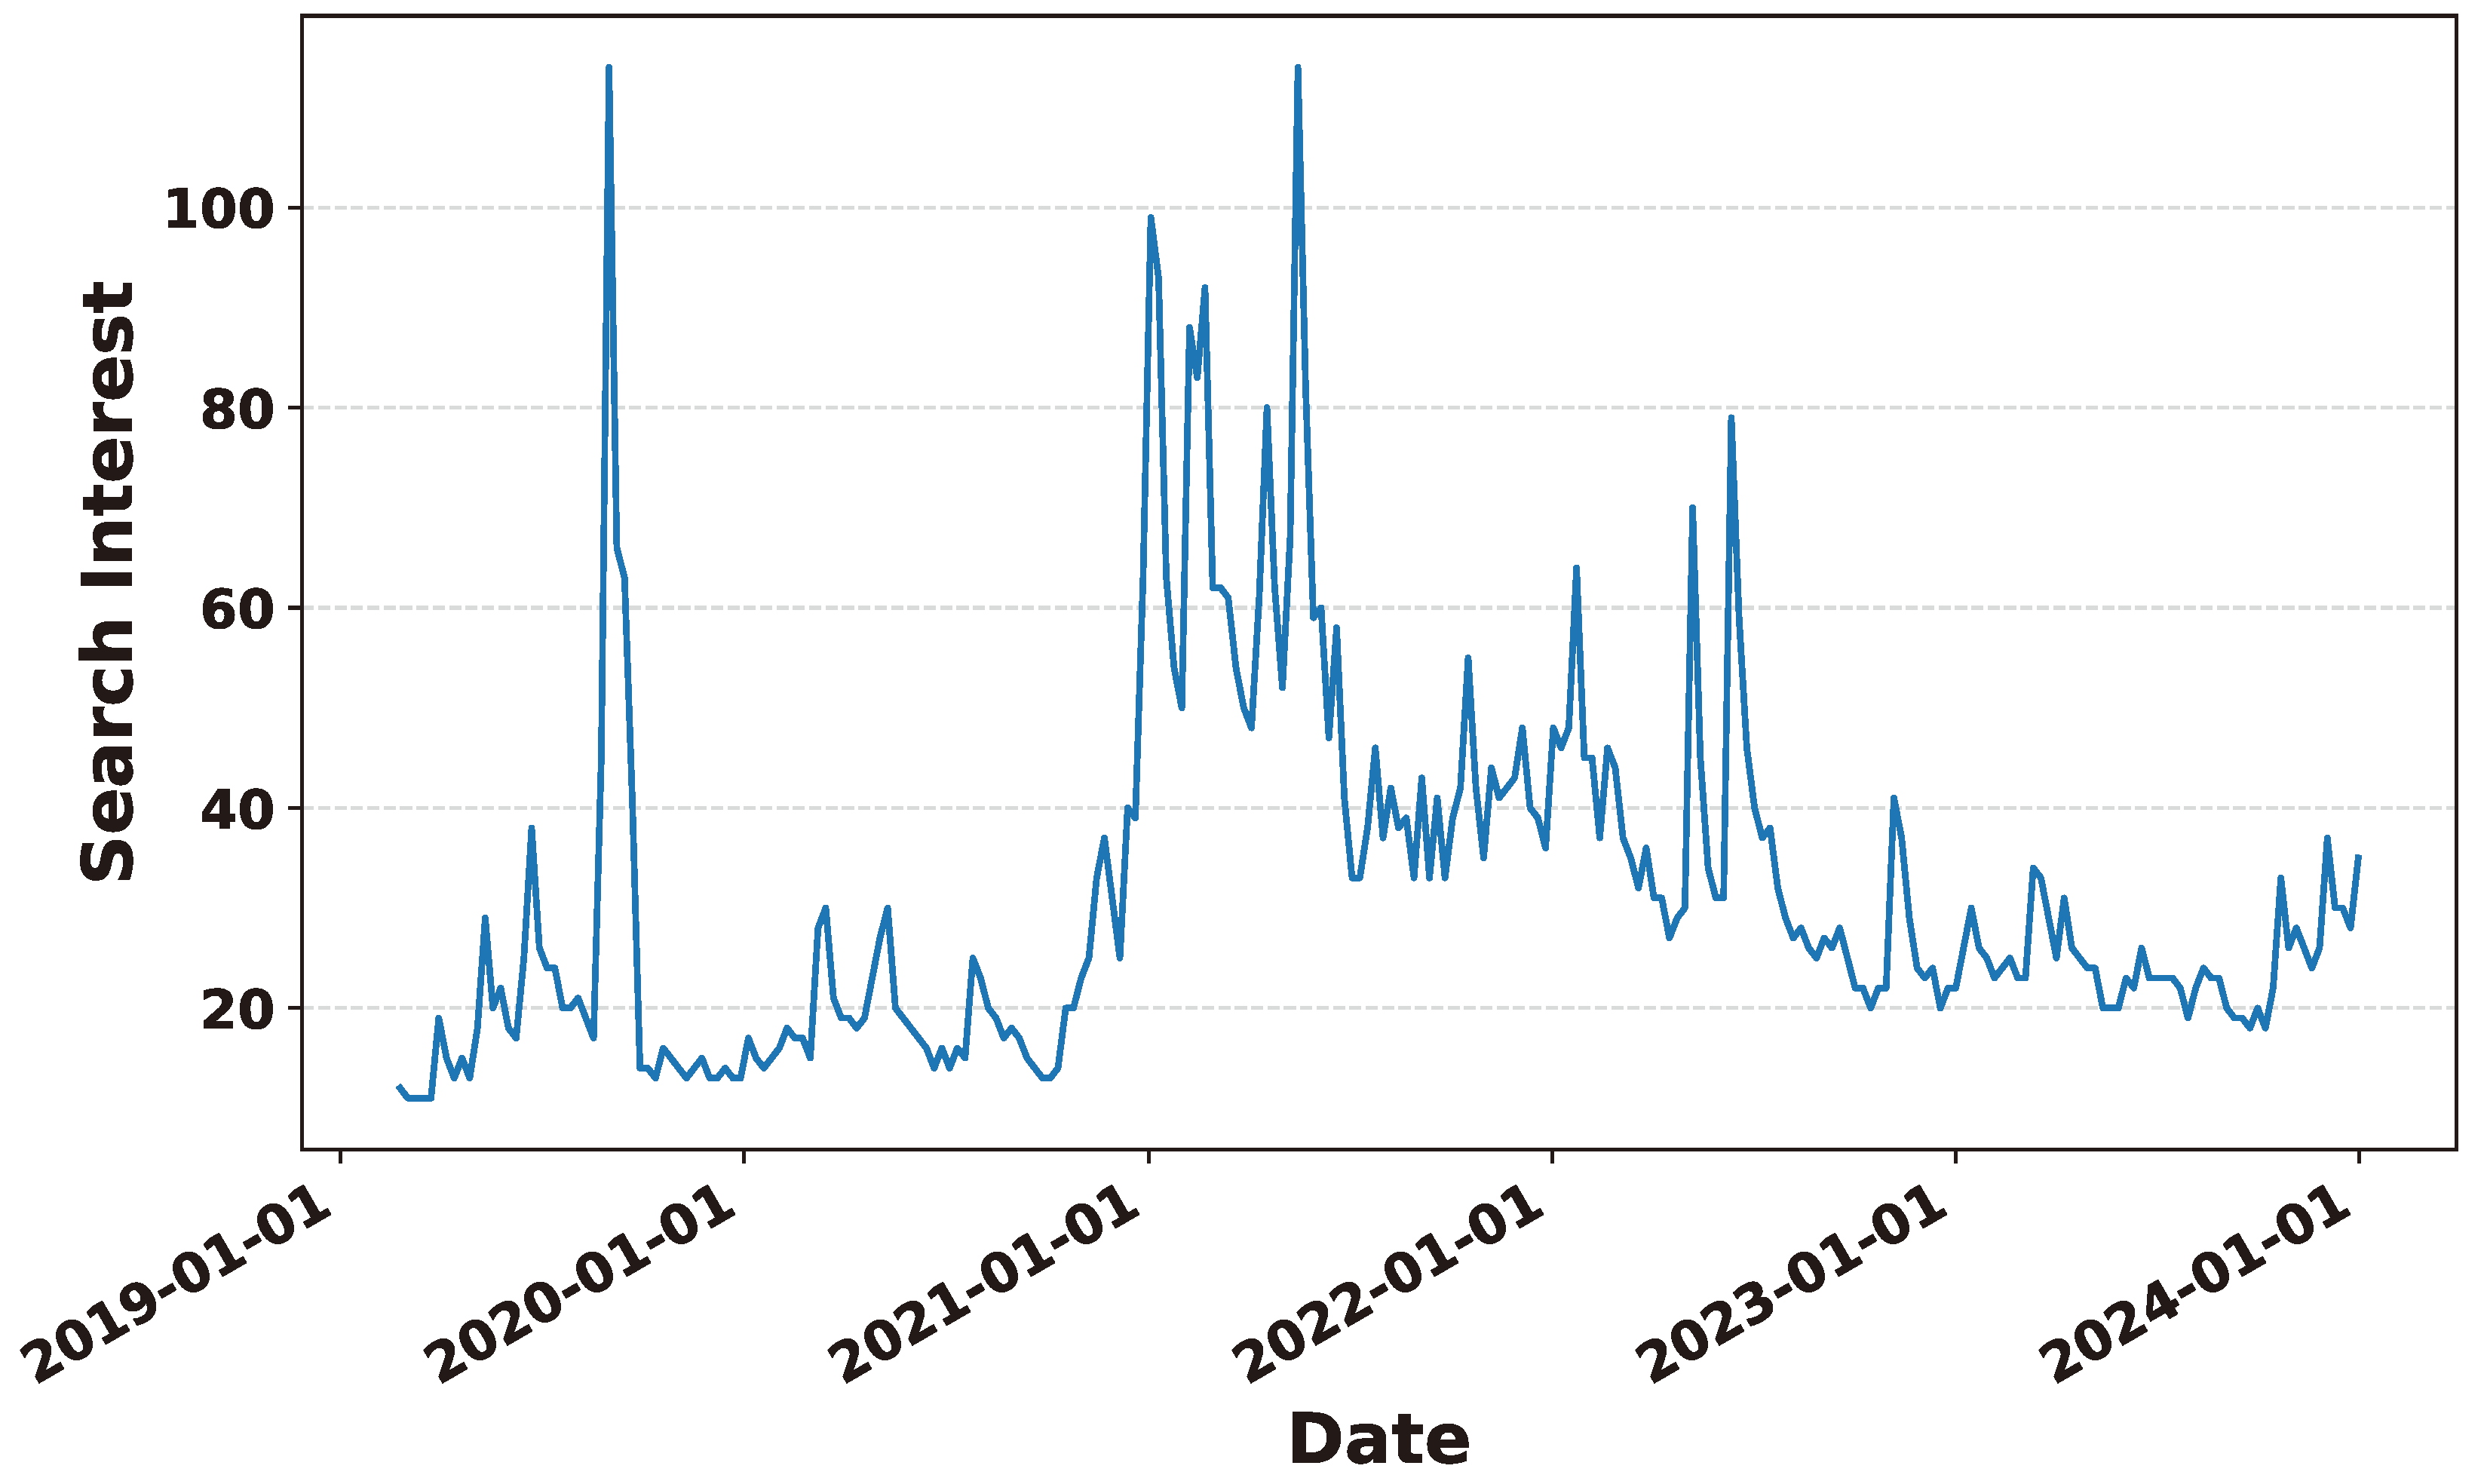
Figure 21.
Google Bitcoin Trends Bar Chart: Illustration of search interest in Bitcoin from February 24, 2019, to Jan 31, 2024, highlighting fluctuations in public interest over the five-year duration through distinct bar representations.
Figure 21.
Google Bitcoin Trends Bar Chart: Illustration of search interest in Bitcoin from February 24, 2019, to Jan 31, 2024, highlighting fluctuations in public interest over the five-year duration through distinct bar representations.
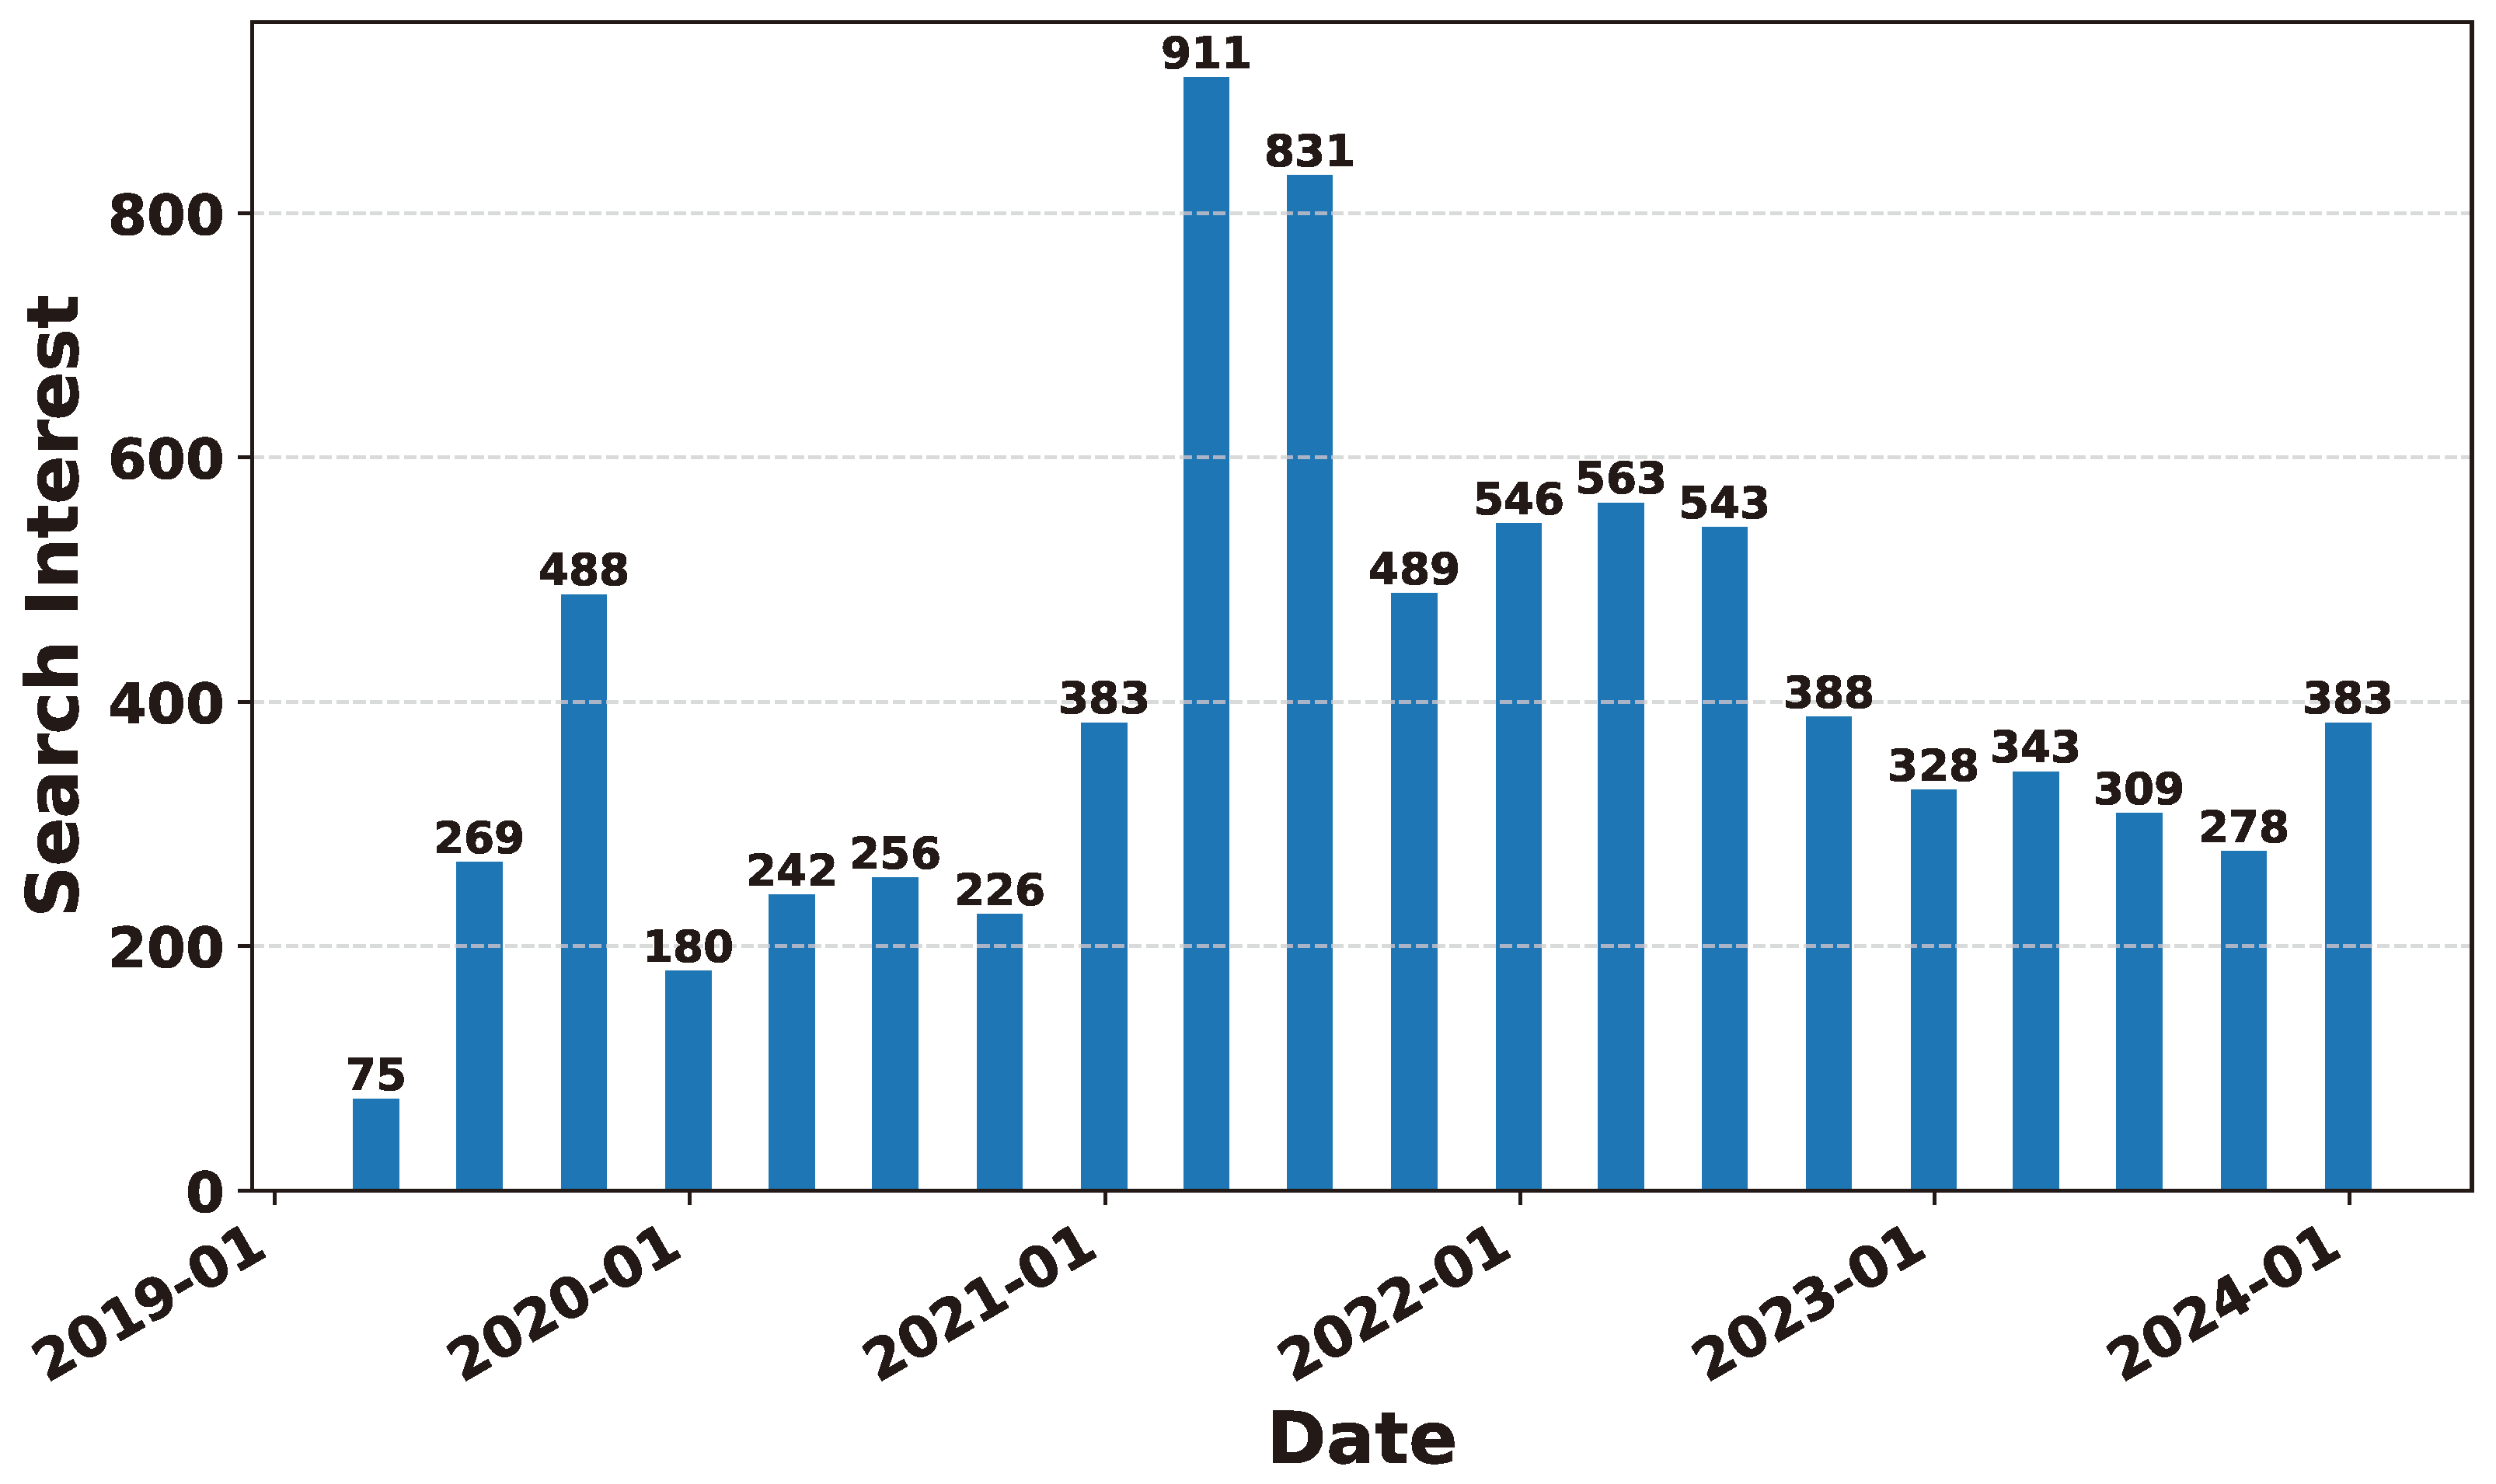
9.2. Google Searches vs. Bitcoin Prices: A Closer Look
The examination of Google Trends data for the keyword "Bitcoin" from February 24, 2019, to Jan 31, 2024, reveals intriguing patterns in online search behavior. Notably, there were significant spikes in Bitcoin searches in the early to mid-2021 period and a resurgence in mid-2022. The conclusion of 2020 witnessed a notable surge, surpassing levels seen in previous years. Despite occasional fluctuations, the overarching trend points to sustained growth in Bitcoin searches during the study period, indicating a dynamic and evolving public interest. The data underscores distinct peaks aligning with specific timeframes, illustrating an overall upward trajectory in searches. Moreover, the heightened Google Trends activity in 2021 correlates with a substantial surge in Bitcoin prices, reaching an all-time high of over 65,000 USD [?]. This surge can be attributed to various factors, including the launch of a Bitcoin ETF in the United States. Events involving Tesla and Coinbase also played a role, with Tesla’s announcement in March 2021 that it had acquired 1.5 billion USD worth of Bitcoin [?] contributing to the increased interest and searches surrounding the cryptocurrency in 2021. This comprehensive analysis sheds light on the complex interplay between online search patterns, market dynamics, and external events, offering valuable insights into the multifaceted nature of Bitcoin’s popularity and public perception. In wrapping up our exploration the correlation analysis between Google search trends and Bitcoin prices highlights a dynamic interplay, showcasing the impact of public interest on cryptocurrency valuation. This exploration enhances our understanding of market behavior and the evolving curiosity surrounding Bitcoin.
Figure 22.
Bitcoin Google Search Trends (Feb 2019 - Jan 2024) This line chart depicts the fluctuating interest in Bitcoin searches over time, highlighting peaks coinciding with key events and market movements.
Figure 22.
Bitcoin Google Search Trends (Feb 2019 - Jan 2024) This line chart depicts the fluctuating interest in Bitcoin searches over time, highlighting peaks coinciding with key events and market movements.
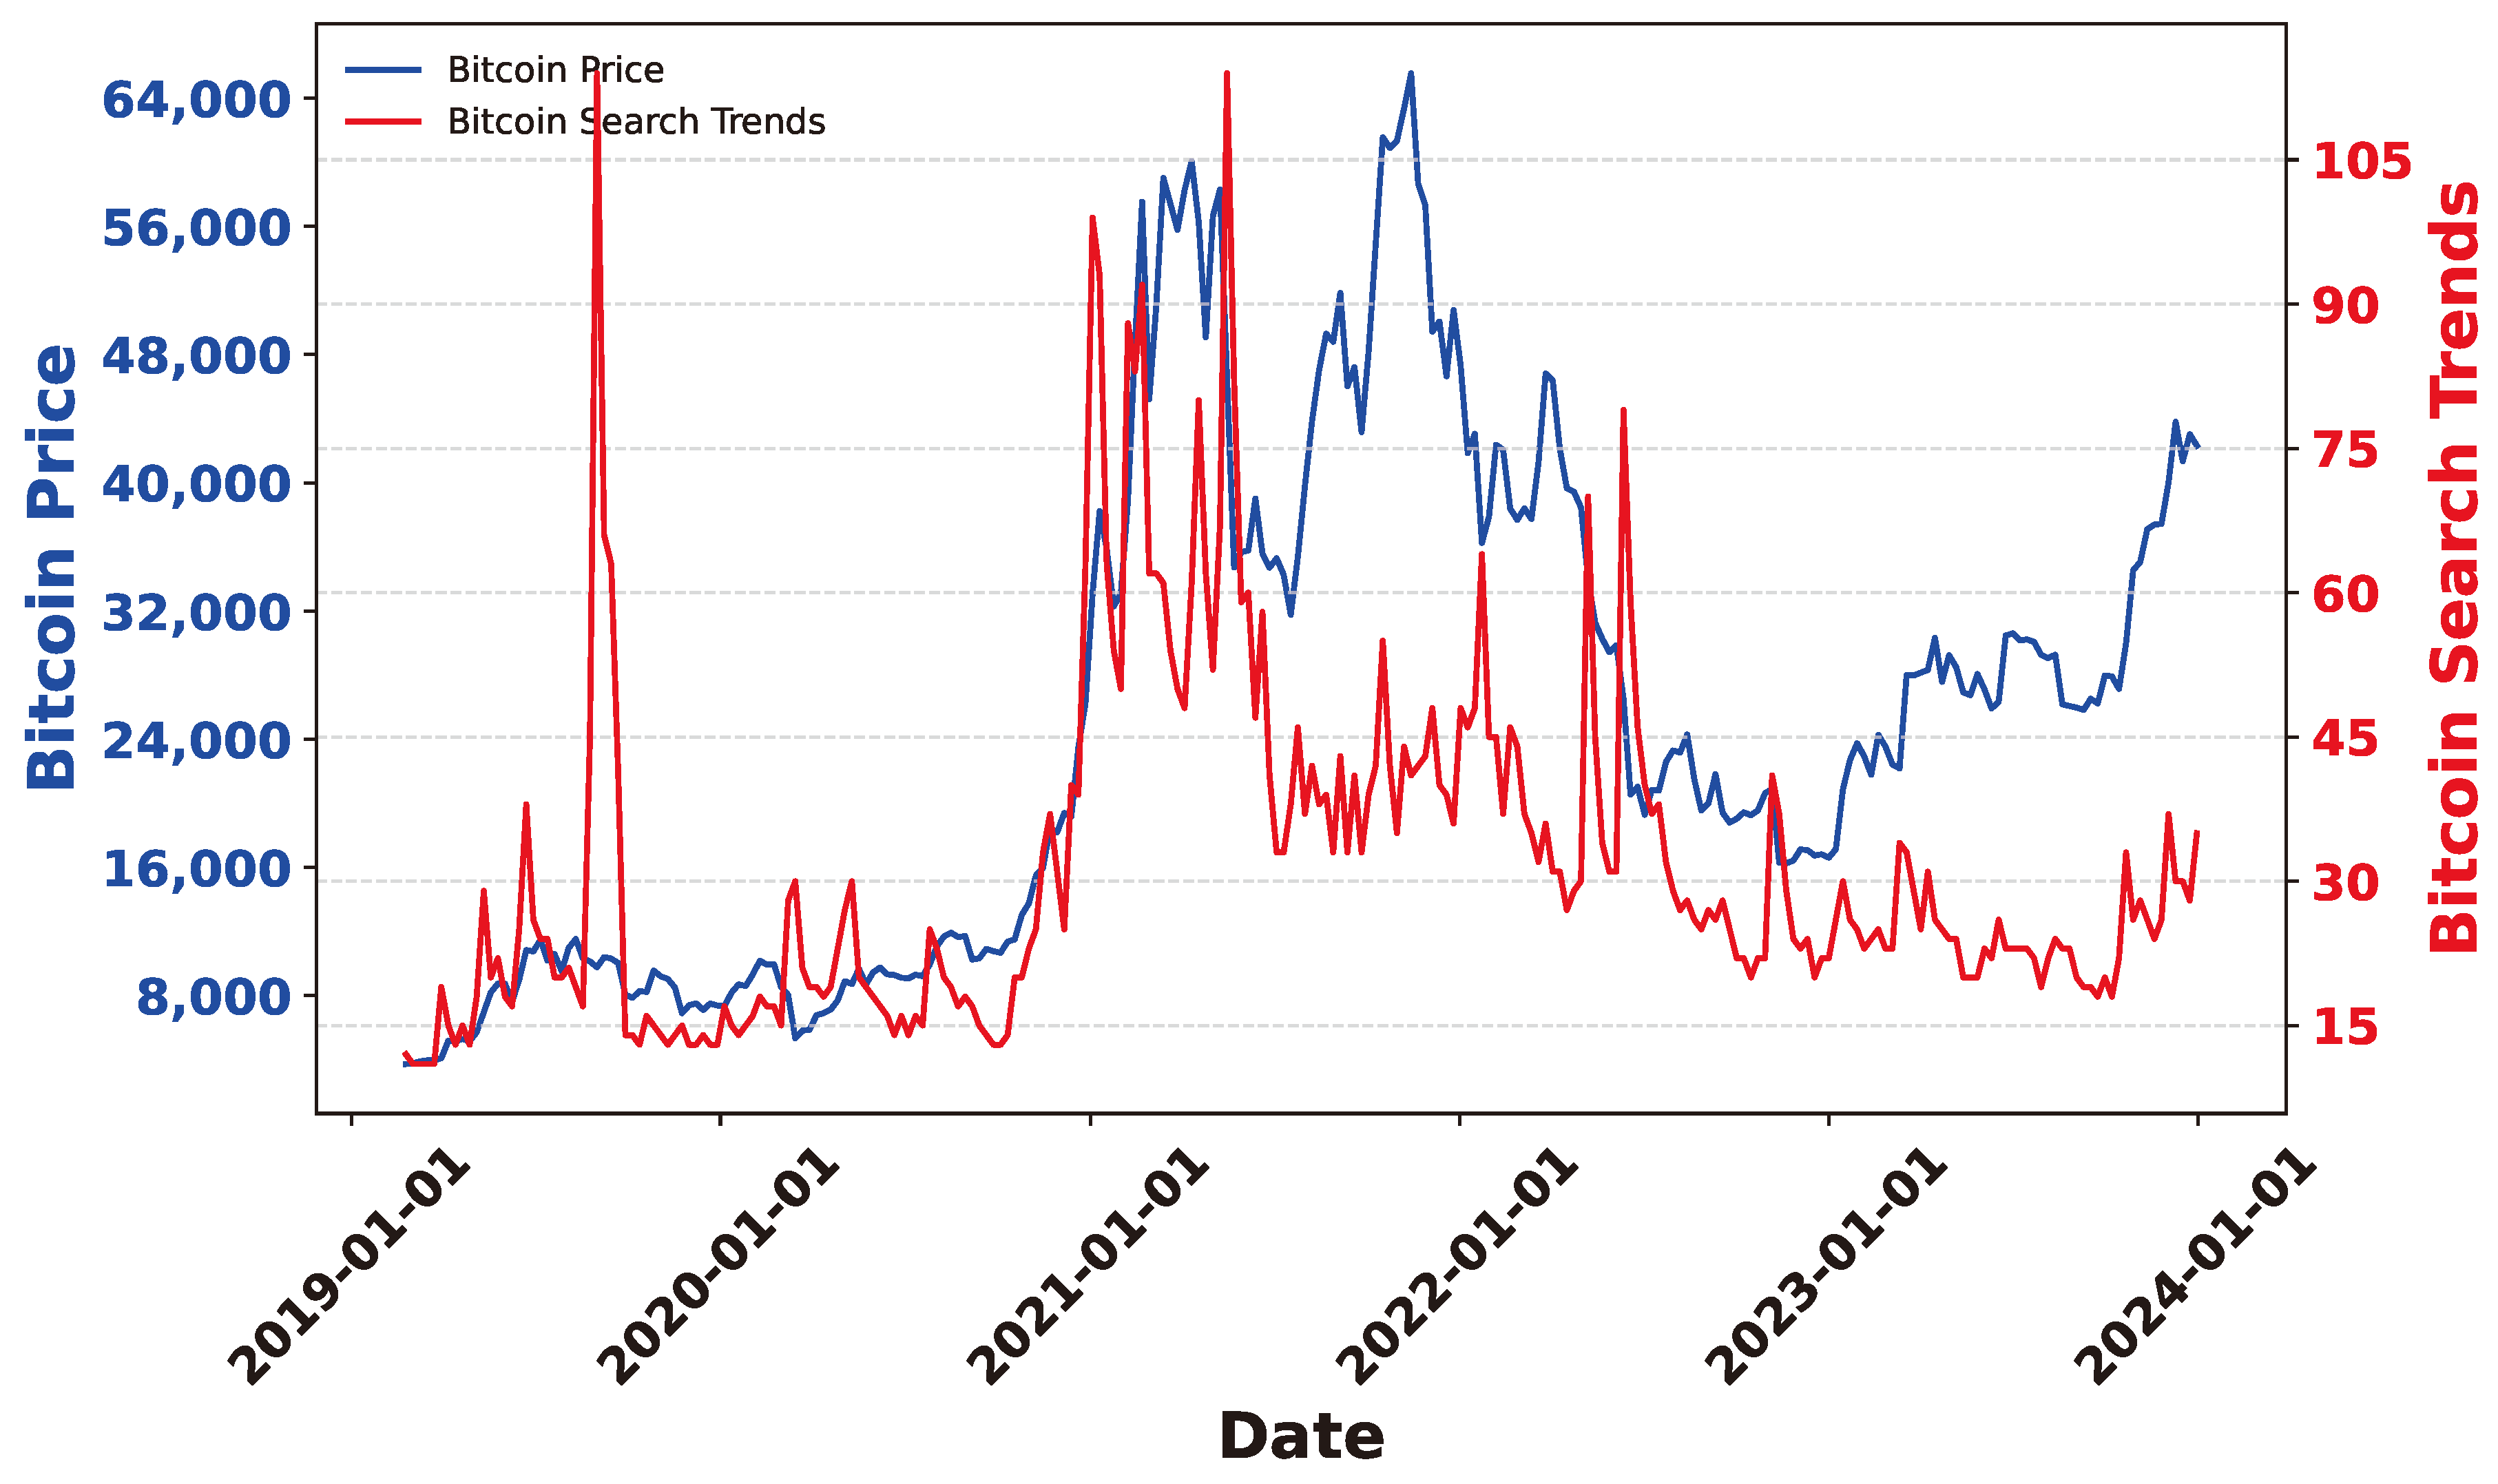
9.3. Bitcoin Prices and Reddit Comments: Spotting Trends
The Reddit data specifically scraped from cryptocurrency-related discussions provides valuable insights into the sentiments, discussions, and trends within the cryptocurrency community. The data of Reddit comments versus Bitcoin prices, spanning from October 31, 2021, to Jan 31, 2024, reveals intriguing dynamics between the two variables. Notably, starting from April 1, 2022, a discernible trend emerges as the prices of Bitcoin begin to decline, coinciding with an increase in Reddit comments discussing the cryptocurrency. This suggests a notable correlation between a decrease in Bitcoin prices and a rise in Reddit discussions. The market landscape underwent significant changes towards the end of 2022. Bitcoin experienced a sharp decline in mid-November 2022, dropping to $16,000 following the collapse of FTX [?], a high-profile crypto exchange. During this period, there was a substantial surge in the number of Reddit comments, indicating a heightened level of engagement and discussion, possibly in response to the noteworthy event affecting the cryptocurrency market. Furthermore, another noteworthy trend is observed in October 2023. As the prices of Bitcoin increased, there was a corresponding rise in the number of Reddit comments. This suggests a consistent pattern where fluctuations in Bitcoin prices influence the level of engagement and discussion on Reddit. Specifically, an increase or decrease in Bitcoin prices appears to trigger a proportional response in terms of Reddit comments and discussions. In summary, the data illustrates a compelling relationship between Bitcoin prices and Reddit comments, with discussions intensifying during periods of price decrease, especially in response to significant market events, and increasing in tandem with rising Bitcoin prices.
Figure 23.
Reddit Comments vs. Bitcoin Prices (Oct 2021 - Jan 2024) This chart shows the relationship between Reddit comments discussing Bitcoin and Bitcoin prices over time, indicating increased discussion during periods of price decline and heightened engagement with rising prices.
Figure 23.
Reddit Comments vs. Bitcoin Prices (Oct 2021 - Jan 2024) This chart shows the relationship between Reddit comments discussing Bitcoin and Bitcoin prices over time, indicating increased discussion during periods of price decline and heightened engagement with rising prices.
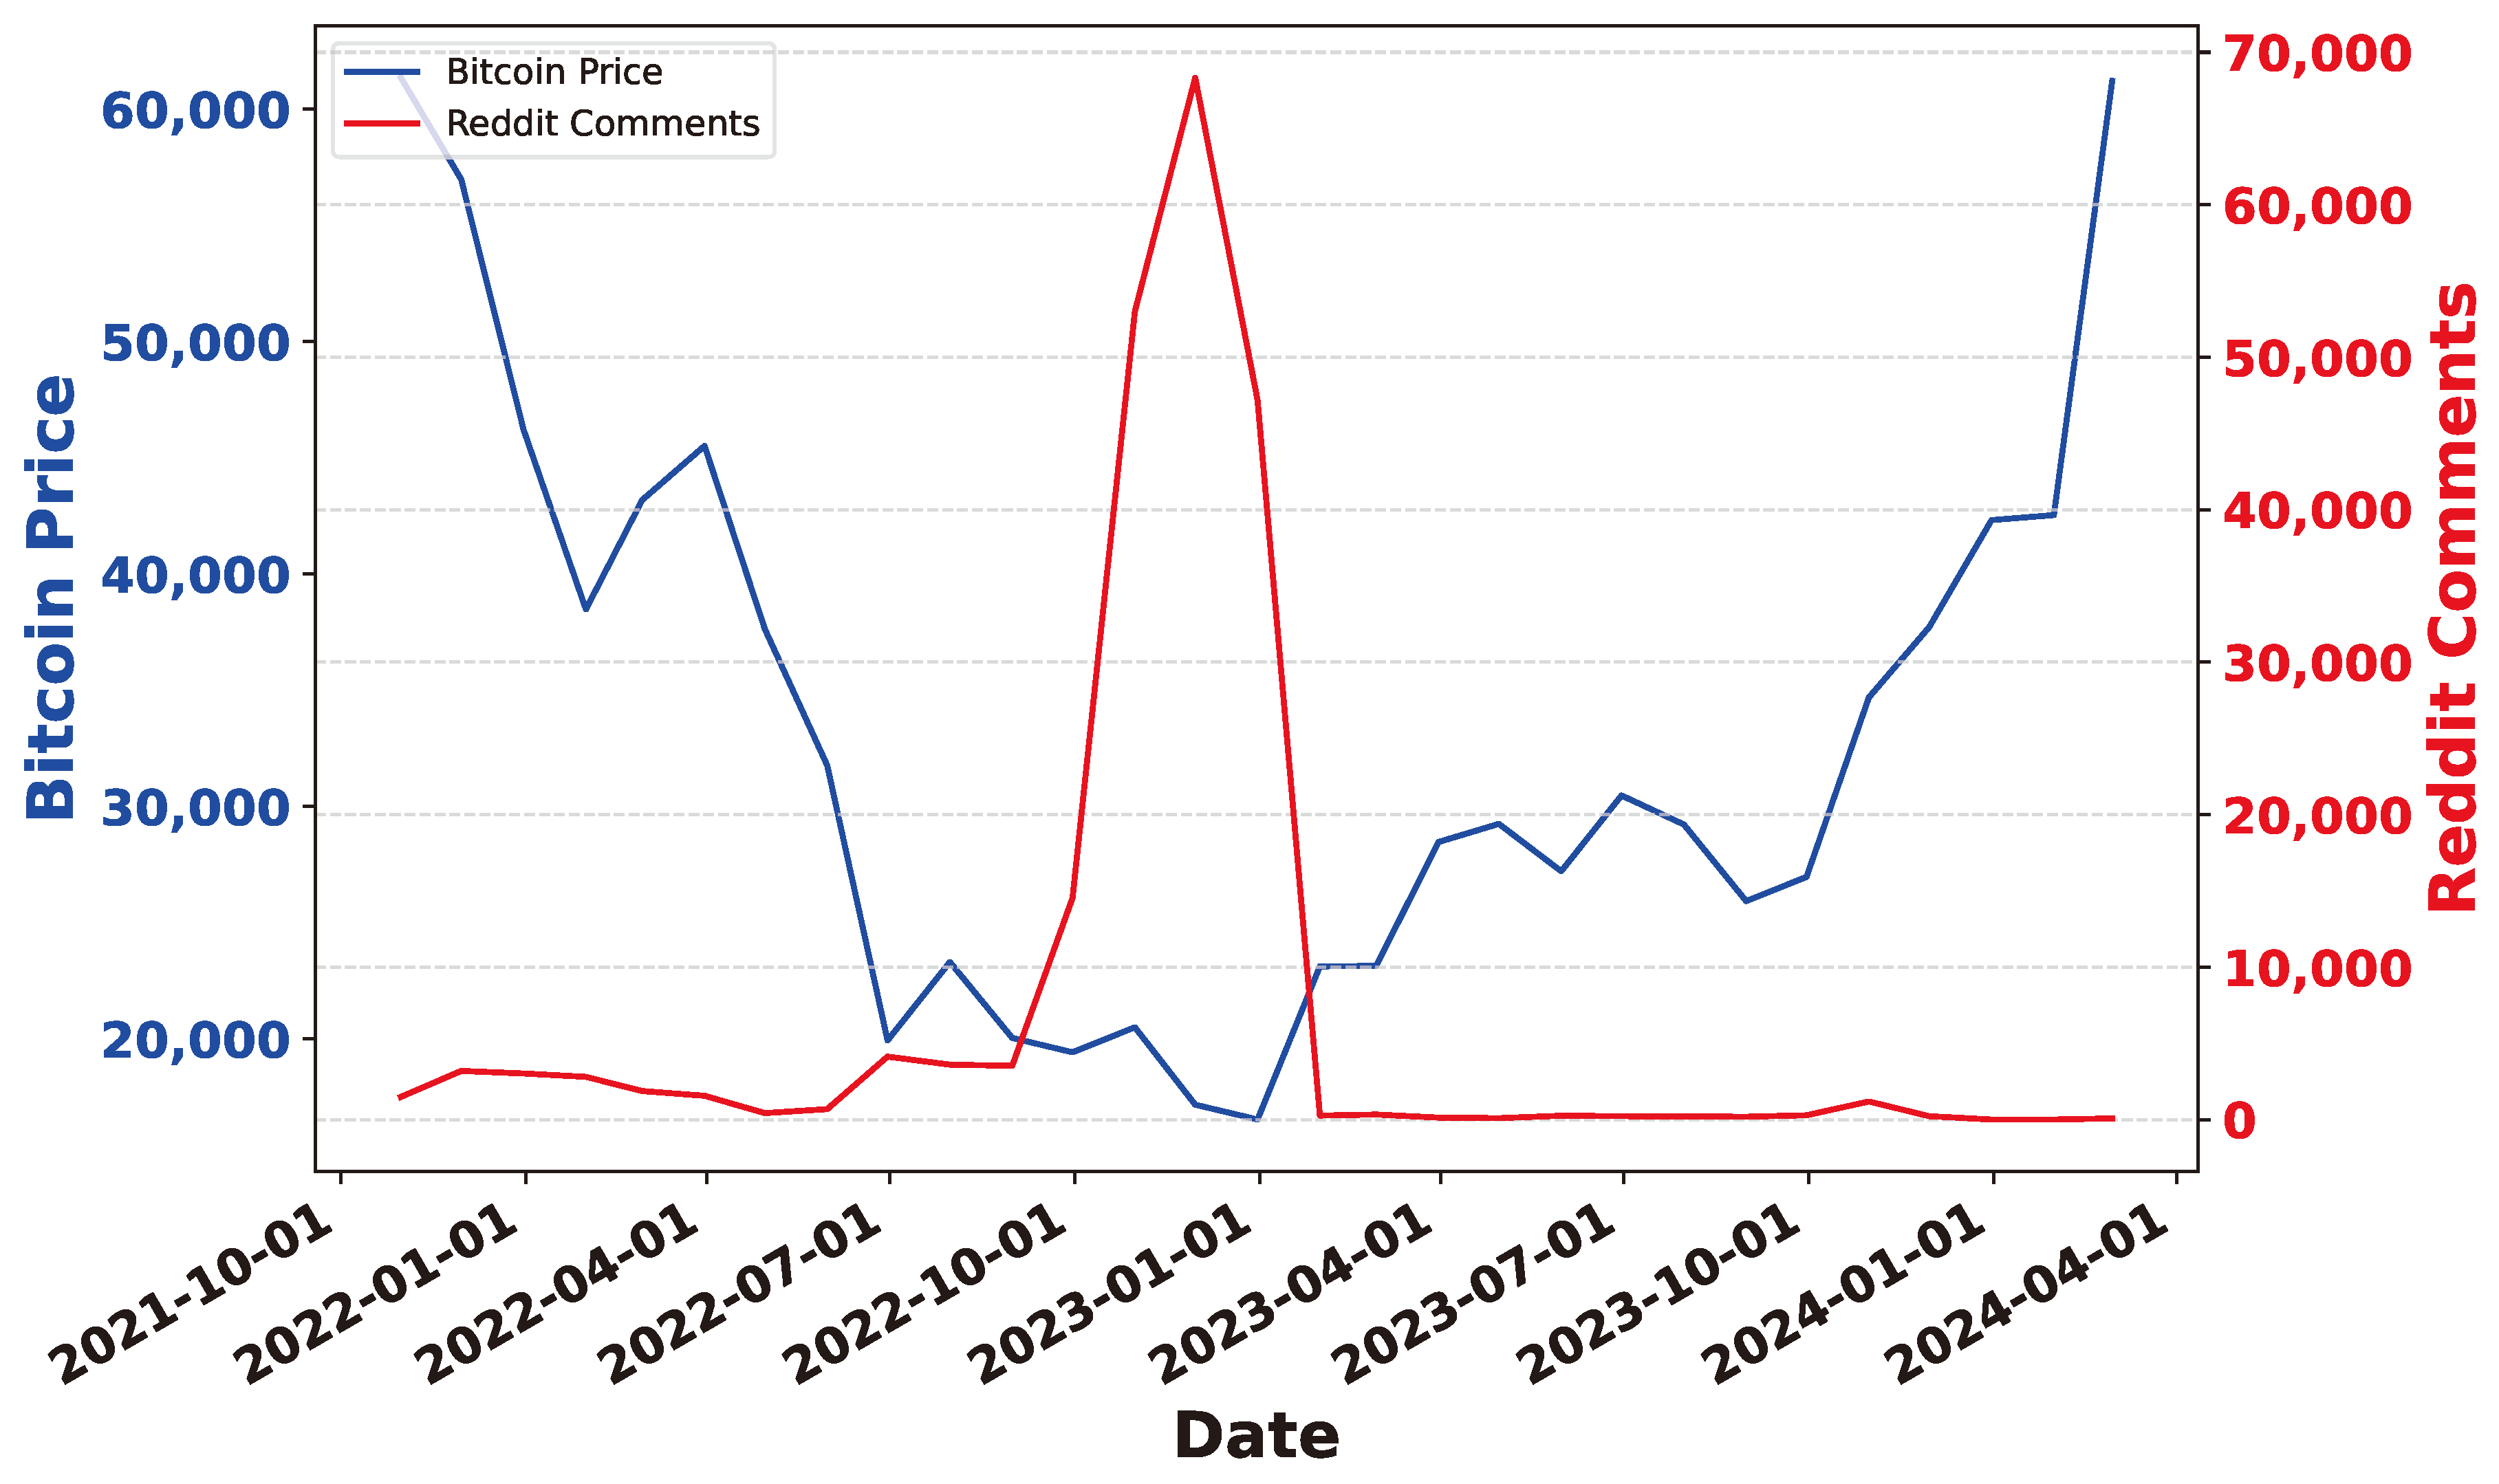
9.4. Bitcon Prices and Cryptocurrencies News: Trends
The analysis of cryptocurrency news articles, spanning from June 2020 to December 2022, reveals a noteworthy correlation with Bitcoin prices. We specifically gathered news articles related to cryptocurrencies. As our news data commences, a substantial increase in Bitcoin prices is observed, accompanied by a corresponding rise in the count of news articles. This trend became particularly pronounced in 2021 when Bitcoin reached its all-time high, aligning with a peak in the number of news articles. Following this peak, as Bitcoin prices declined in January 2022, there was a corresponding decrease in the count of news articles. However, a subsequent increase in Bitcoin prices in April 2022 coincided with a rise in the number of news articles once again. A significant event in the cryptocurrency market was the crash of the FTX exchange [?], leading to a substantial decrease in Bitcoin prices. Correspondingly, this period witnessed a surge in the number of news articles, reflecting heightened media attention and discussions surrounding the market downturn. After this event, a modest movement in both Bitcoin prices and the count of news articles is observed towards the end of 2022, indicating a period of relative stability. In conclusion, the analysis highlights a strong correlation between the fluctuations in Bitcoin prices and the count of cryptocurrency news articles. Peaks in news coverage align with periods of significant price movements, showcasing the interdependence of media attention and cryptocurrency market dynamics. This relationship underscores the influence of external events, market trends, and public perception on the cryptocurrency news landscape. The data suggests that the cryptocurrency news ecosystem is reactive to shifts in Bitcoin prices, reflecting the market’s dynamic nature and the impact of major events on media coverage.
Figure 24.
Bitcoin Prices vs. Cryptocurrency News Articles (Jun 2020 - Dec 2022) This chart illustrates the correlation between Bitcoin prices and the count of cryptocurrency news articles over time, showing increased media coverage during periods of price spikes and significant market events.
Figure 24.
Bitcoin Prices vs. Cryptocurrency News Articles (Jun 2020 - Dec 2022) This chart illustrates the correlation between Bitcoin prices and the count of cryptocurrency news articles over time, showing increased media coverage during periods of price spikes and significant market events.
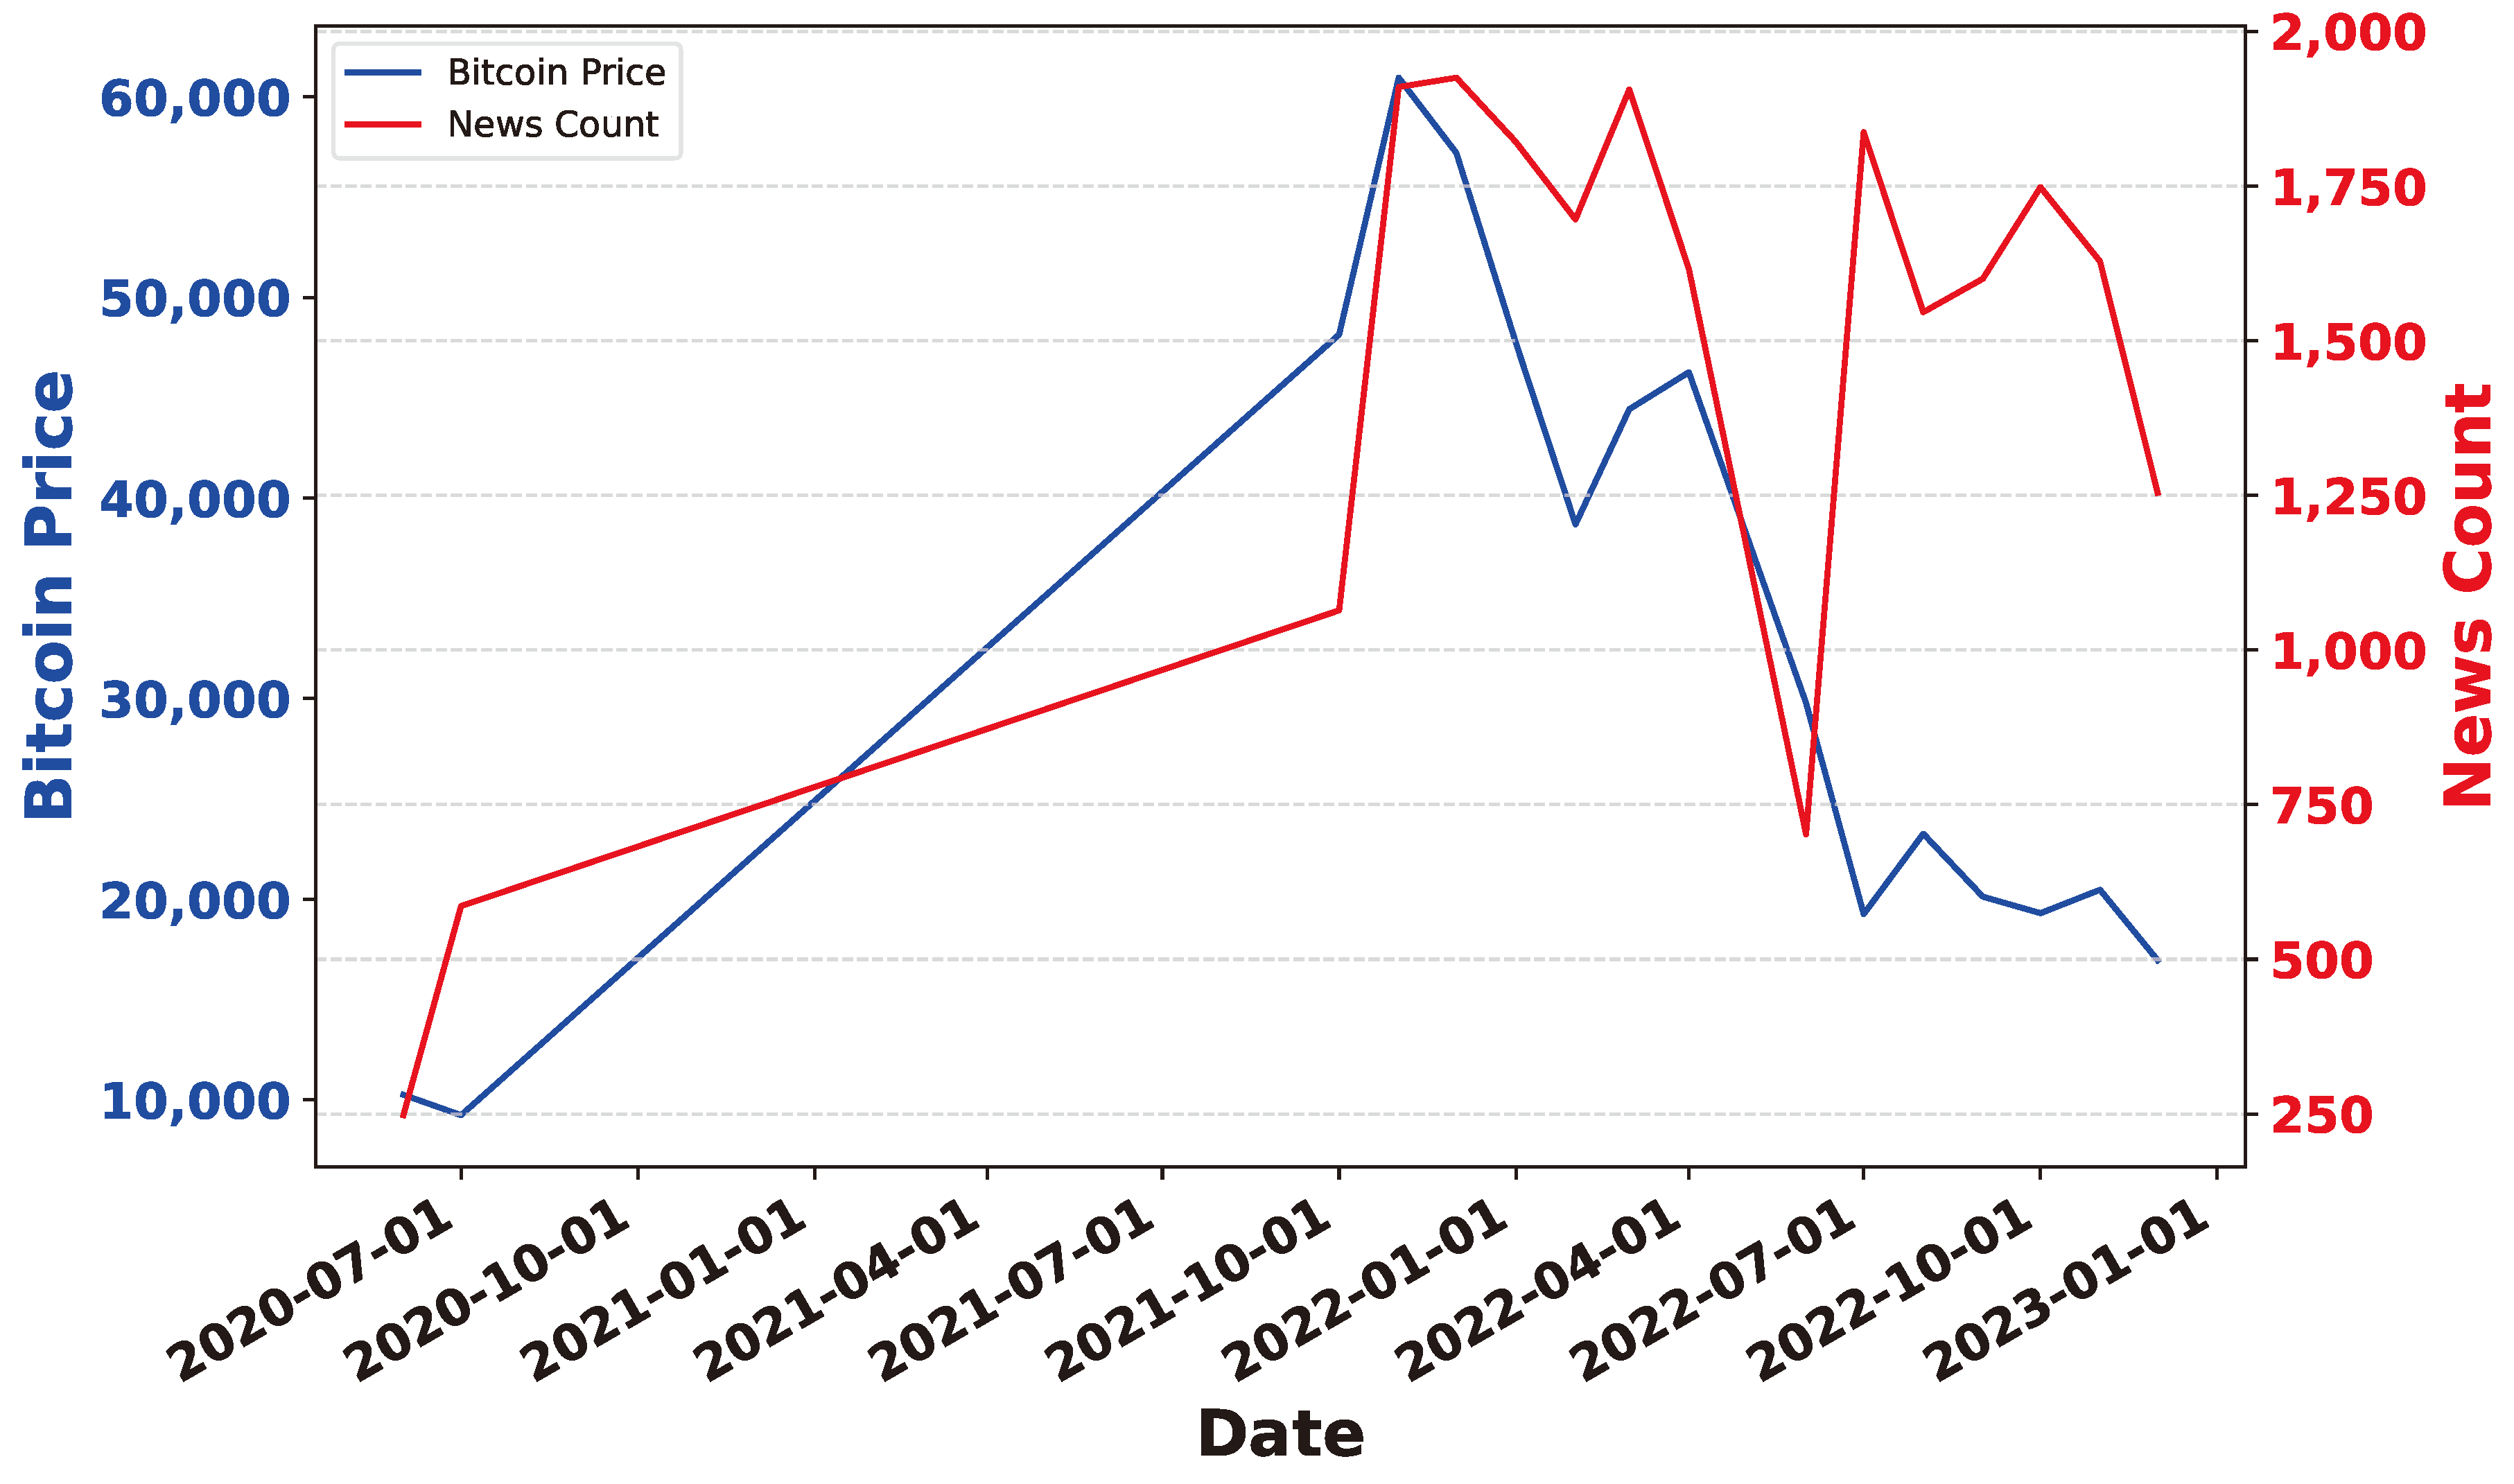
9.5. Cryptocurrency News Trends
The charts illustrate the monthly count of news articles about cryptocurrencies from June 2020 to December 2022. One chart shows this information using bars, and the other uses a line to represent the trends over time. Here’s what it illustrates : In 2020, there were not many articles in June, but the count increased to 586 in July. The trend continued in 2021, with significant peaks in October (1,064 articles) and December (1,925 articles). This upward trend persisted into early 2022, maintaining high counts in January, February, and March. From April 2022 onwards, there were fluctuations in the number of articles, with a noticeable dip in June and a subsequent rise in July (1,837 articles). The counts varied in the following months, showing a dynamic pattern. The highest count during this period occurred in July 2022. Towards the end of 2022, the news article counts displayed a general downward trend, reaching 1,254 articles in December. This suggests a potential shift in the frequency of cryptocurrency-related news during this period. In summary, the chart provides insights into the changing trends in cryptocurrency news, highlighting peaks, fluctuations, and potential shifts in focus over the specified timeframe. The dynamic nature of these counts reflects the evolving the cryptocurrency domain.
Figure 25.
Monthly Cryptocurrency News Articles (Jun 2020 - Dec 2022) This bar chart displays the monthly count of cryptocurrency news articles, with notable peaks in late 2021 and mid-2022, indicating periods of heightened coverage.
Figure 25.
Monthly Cryptocurrency News Articles (Jun 2020 - Dec 2022) This bar chart displays the monthly count of cryptocurrency news articles, with notable peaks in late 2021 and mid-2022, indicating periods of heightened coverage.
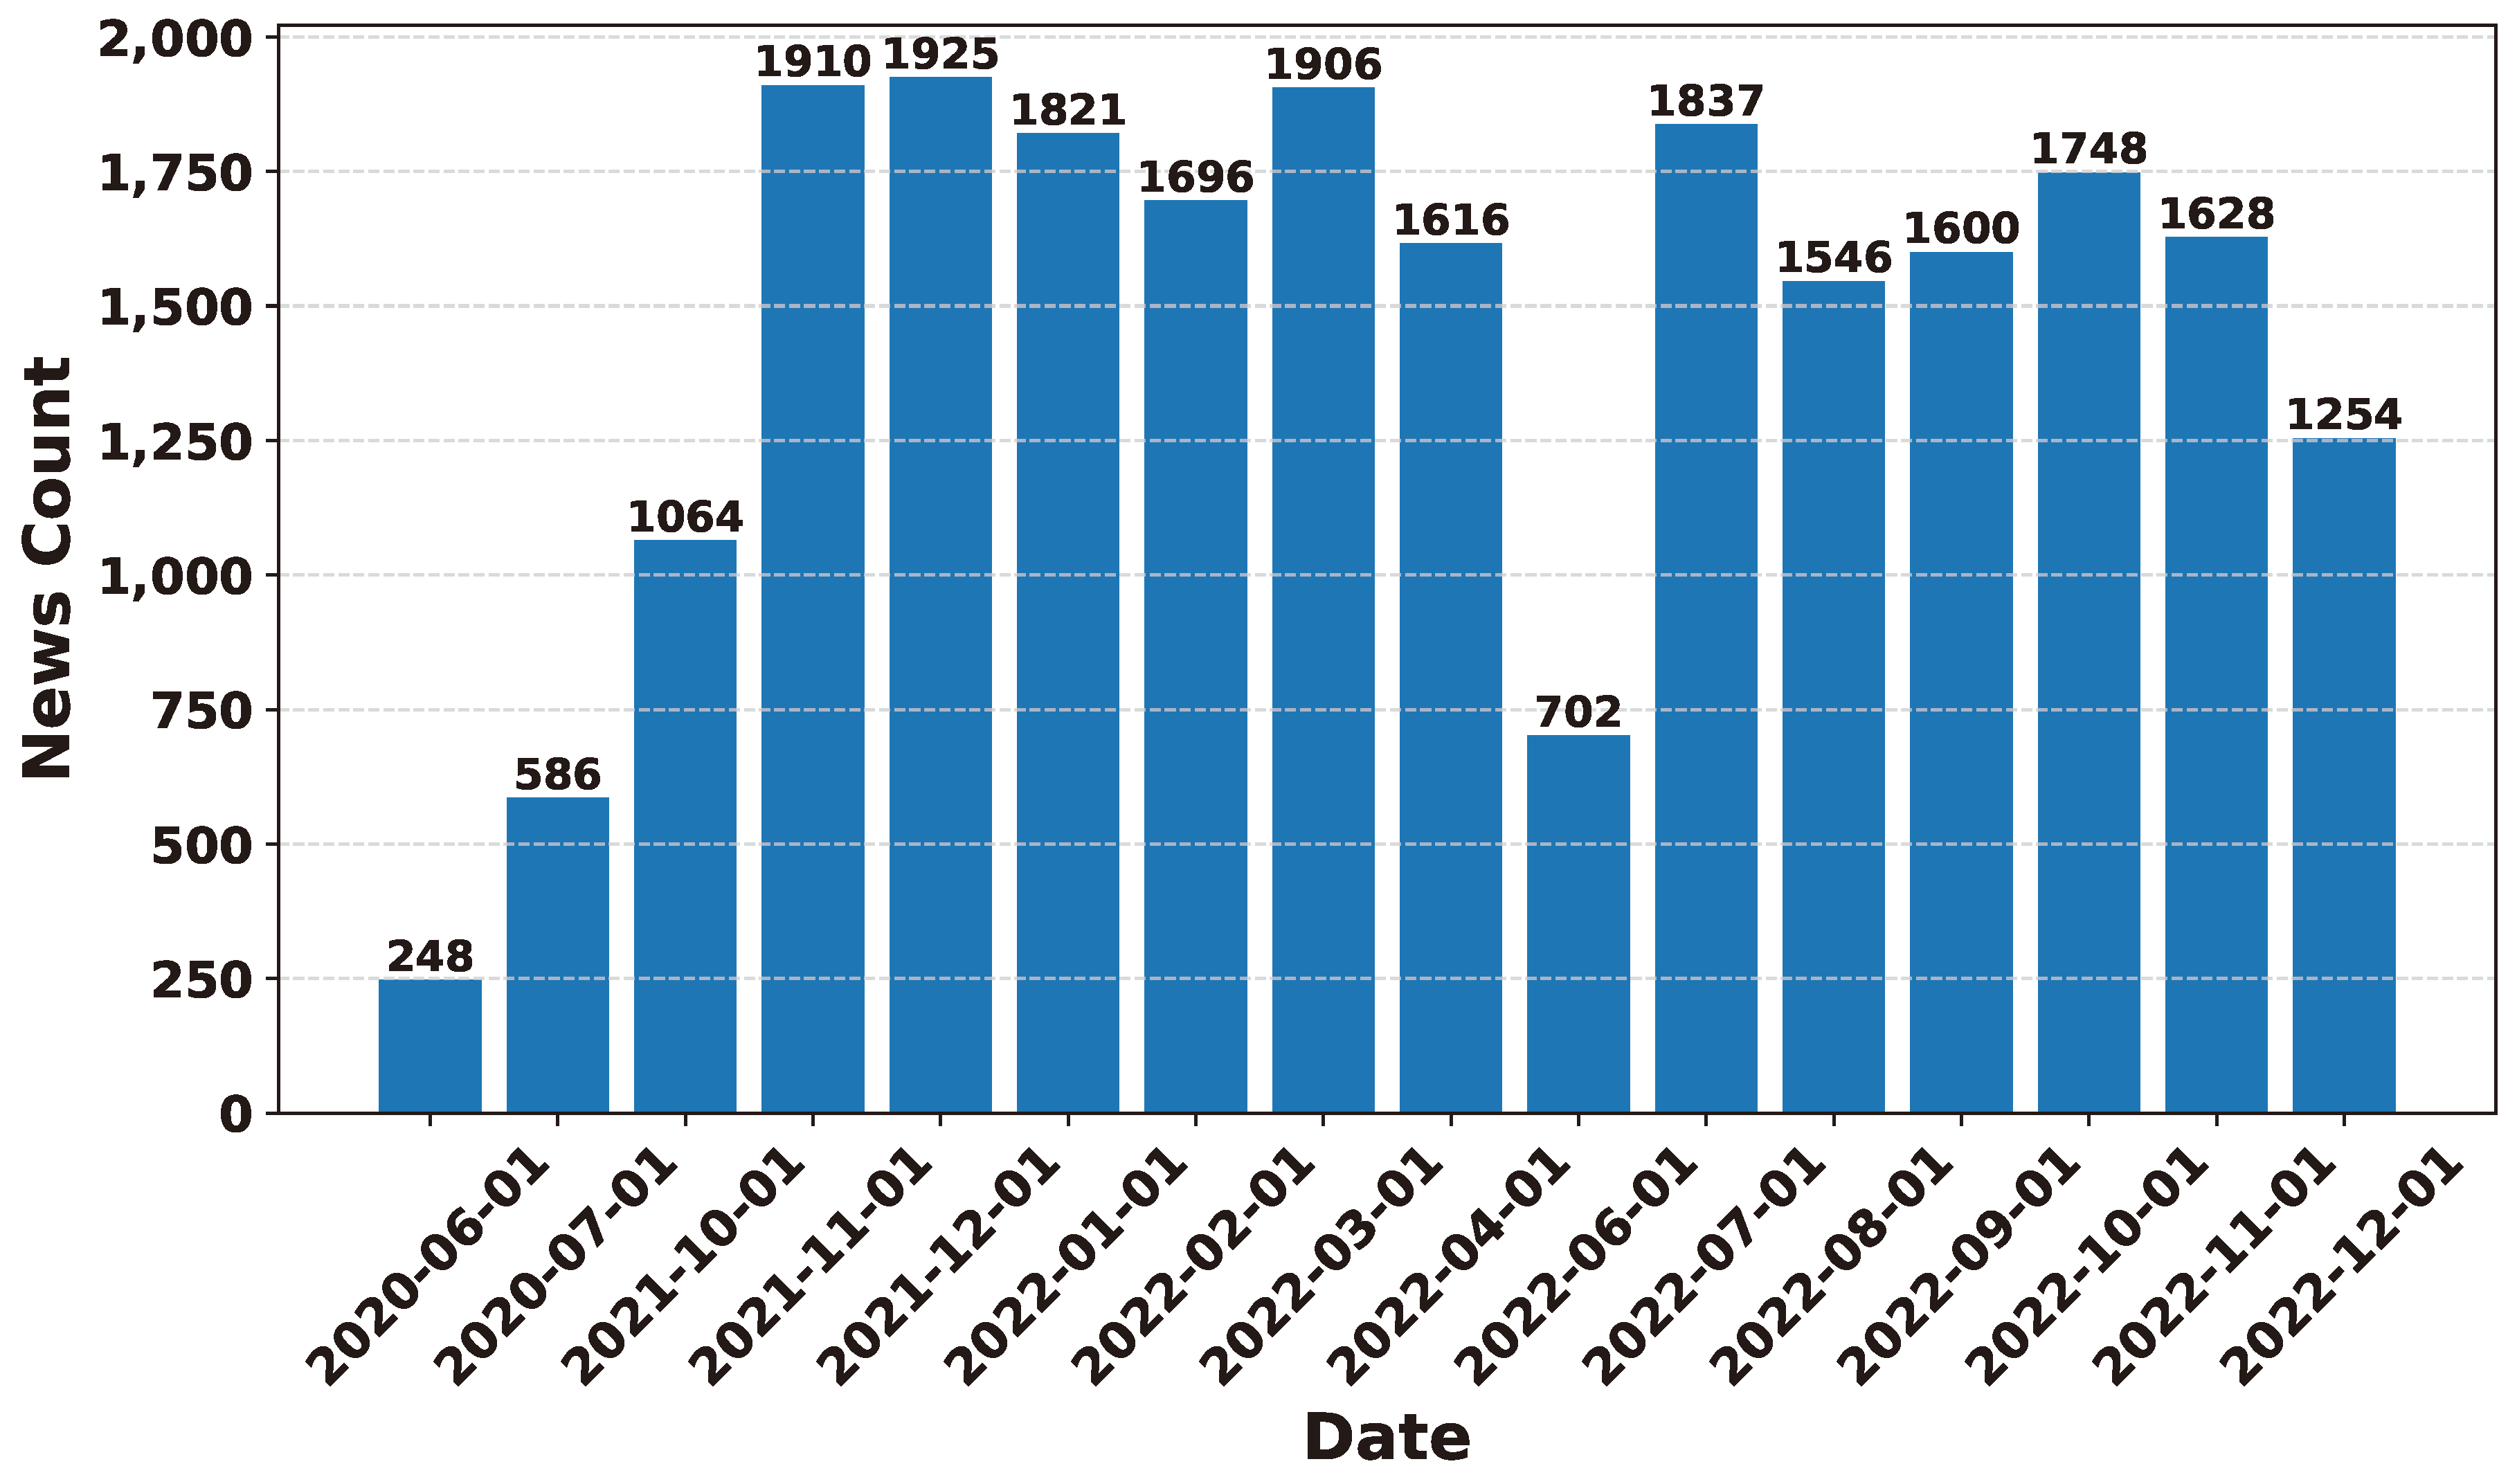
Figure 26.
Monthly Cryptocurrency News Articles (Jun 2020 - Dec 2022) This line chart shows the monthly count of cryptocurrency news articles, highlighting peaks in late 2021 and mid-2022, with potential shifts in coverage towards the end of 2022.
Figure 26.
Monthly Cryptocurrency News Articles (Jun 2020 - Dec 2022) This line chart shows the monthly count of cryptocurrency news articles, highlighting peaks in late 2021 and mid-2022, with potential shifts in coverage towards the end of 2022.
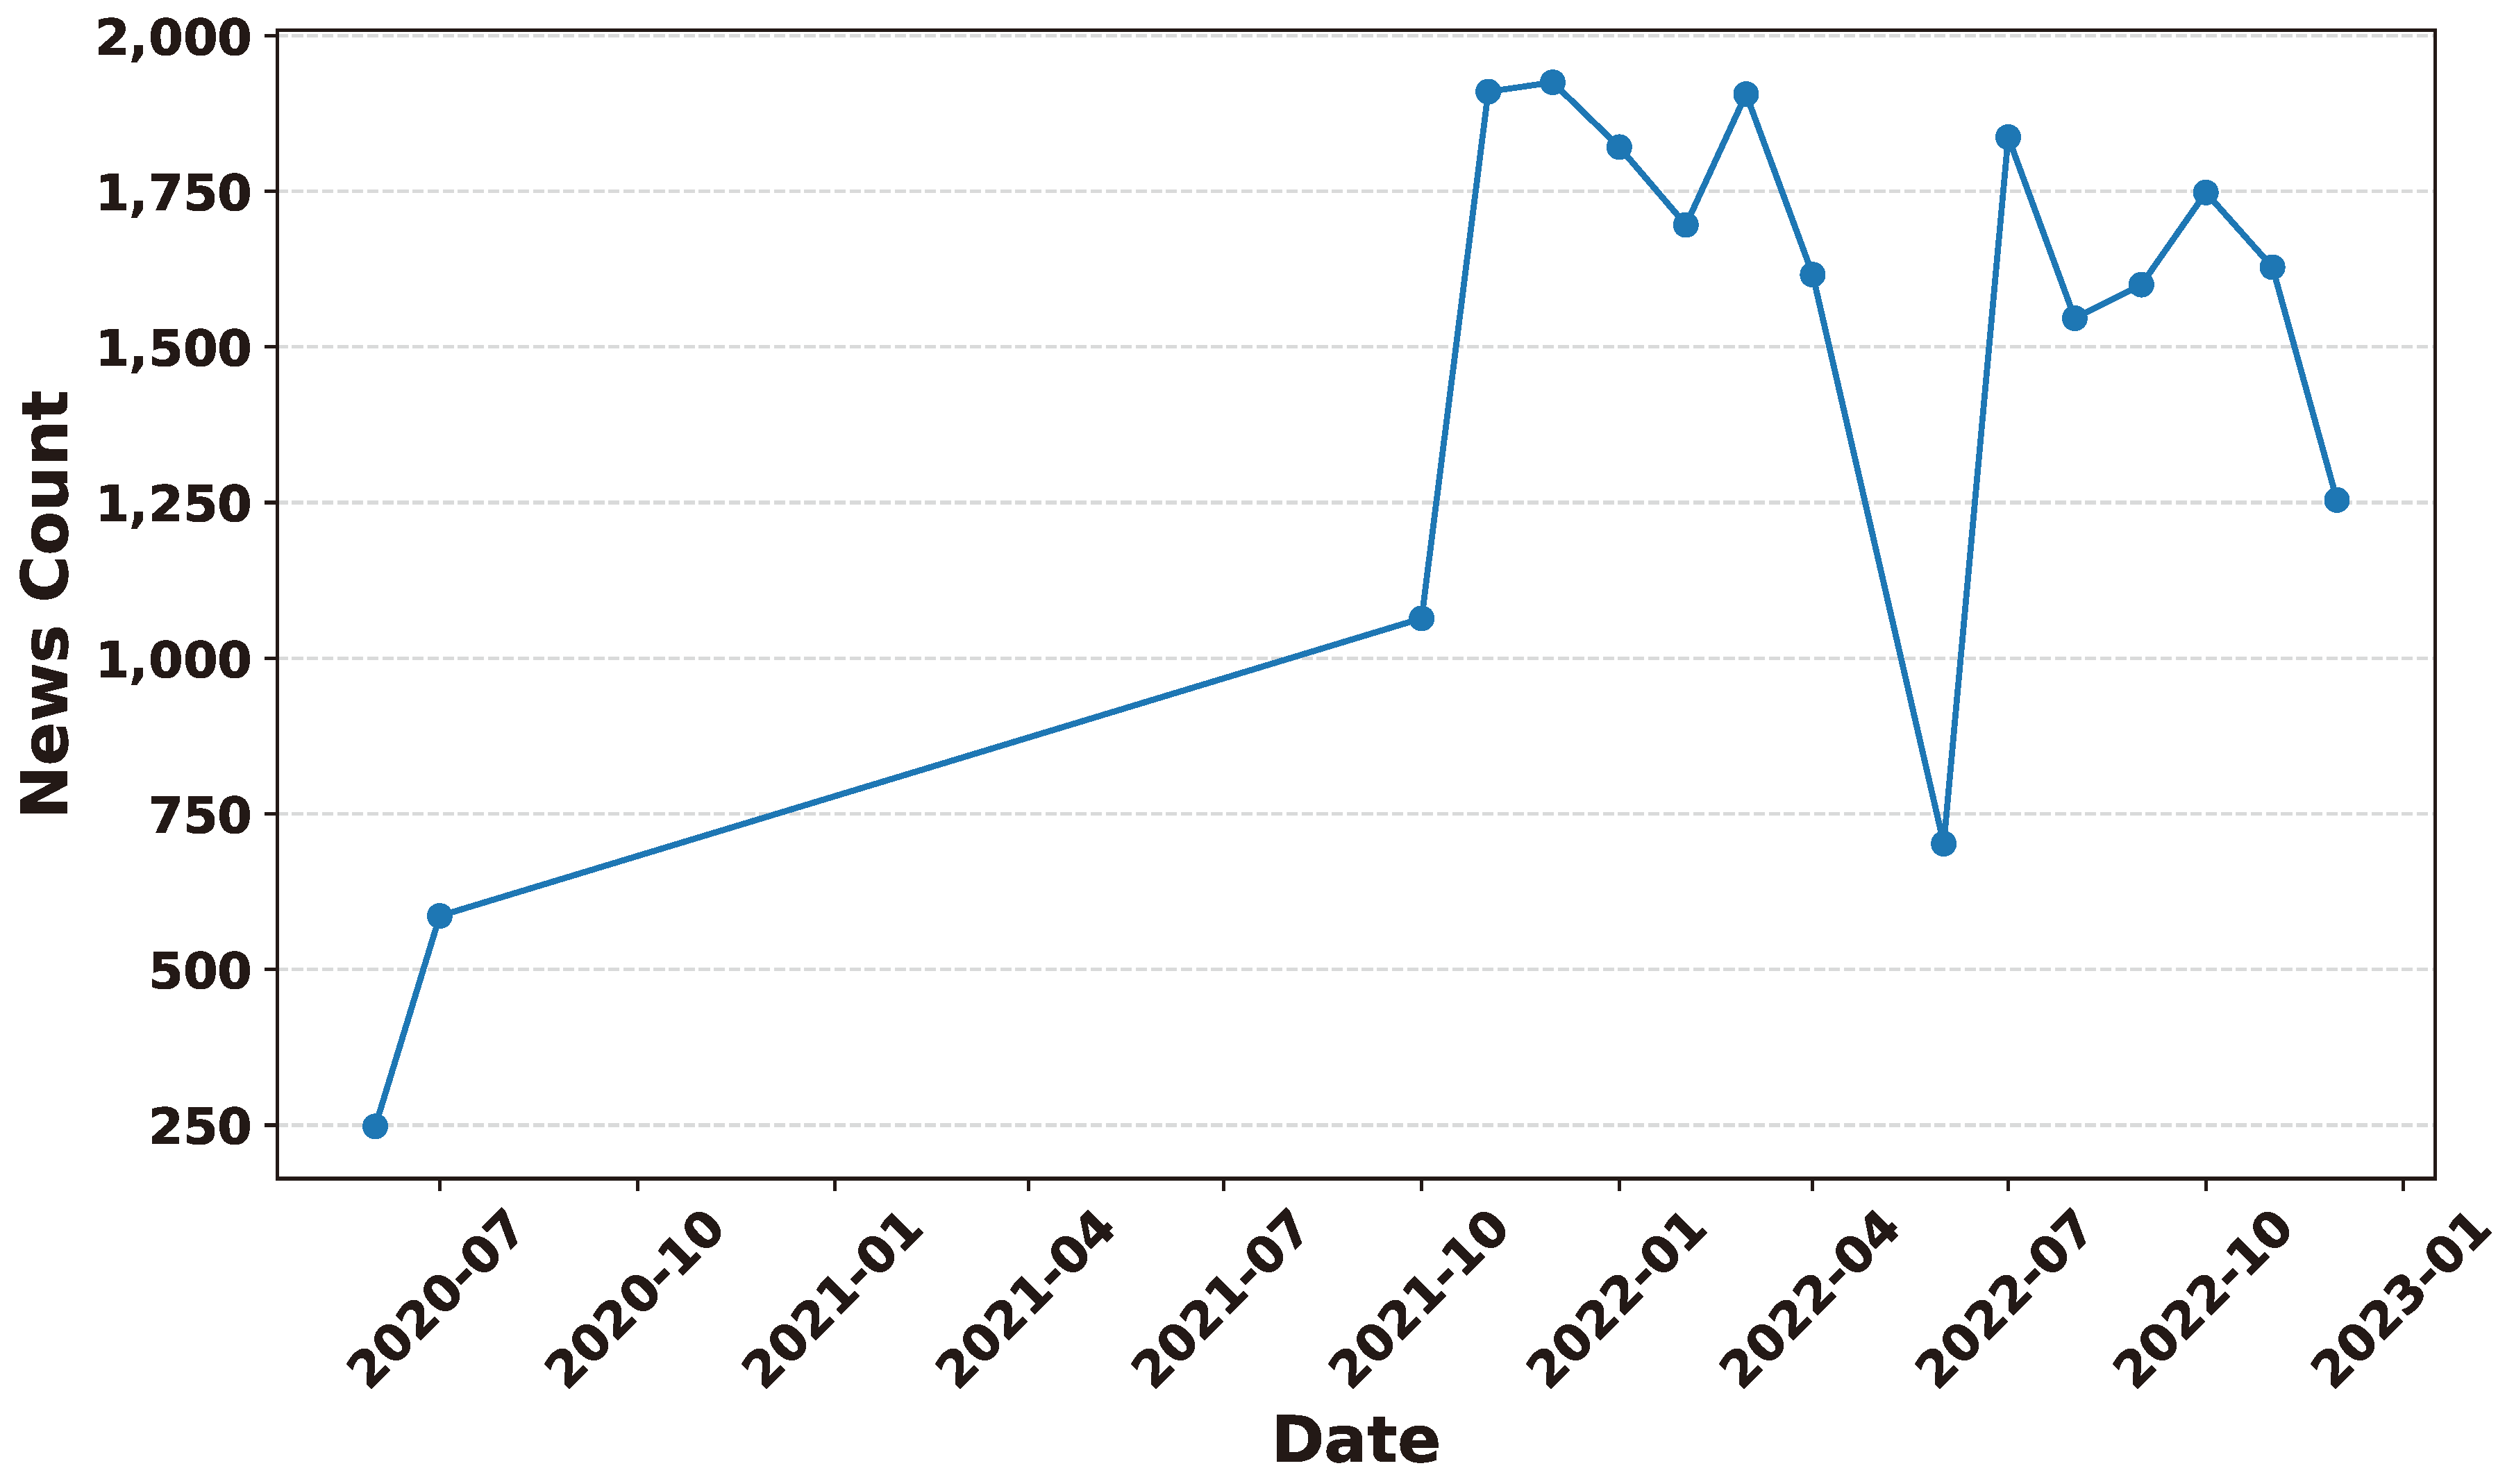
9.6. Twitter Keyword Data
In this research endeavor, a comprehensive word cloud analysis was conducted based on a dataset encompassing various cryptocurrency keywords and corresponding tweet volumes. The dataset spans from April 17, 2022, to December 20, 2022, with a meticulous breakdown of keywords such as bitcoin, BTC, XRP, and others. the total number of tweets for all keywords sums up to 116,882,258. Specifically, the breakdown for Bitcoin and BTC is as follows: Bitcoin: 8.7 million tweets BTC: 9.18 million tweets In conclusion, the large number of tweets we looked at from April 17, 2022, to December 20, 2022, tells us that more and more people are talking about cryptocurrencies. This suggests a clear increase in interest and conversations about digital currencies. The data we gathered shows that on Twitter, more and more folks are getting interested in and talking about cryptocurrencies, making them even more popular in the online world during this time.
Figure 27.
Showcases a word cloud analysis capturing the essence of Twitter discussions surrounding cryptocurrencies.
Figure 27.
Showcases a word cloud analysis capturing the essence of Twitter discussions surrounding cryptocurrencies.
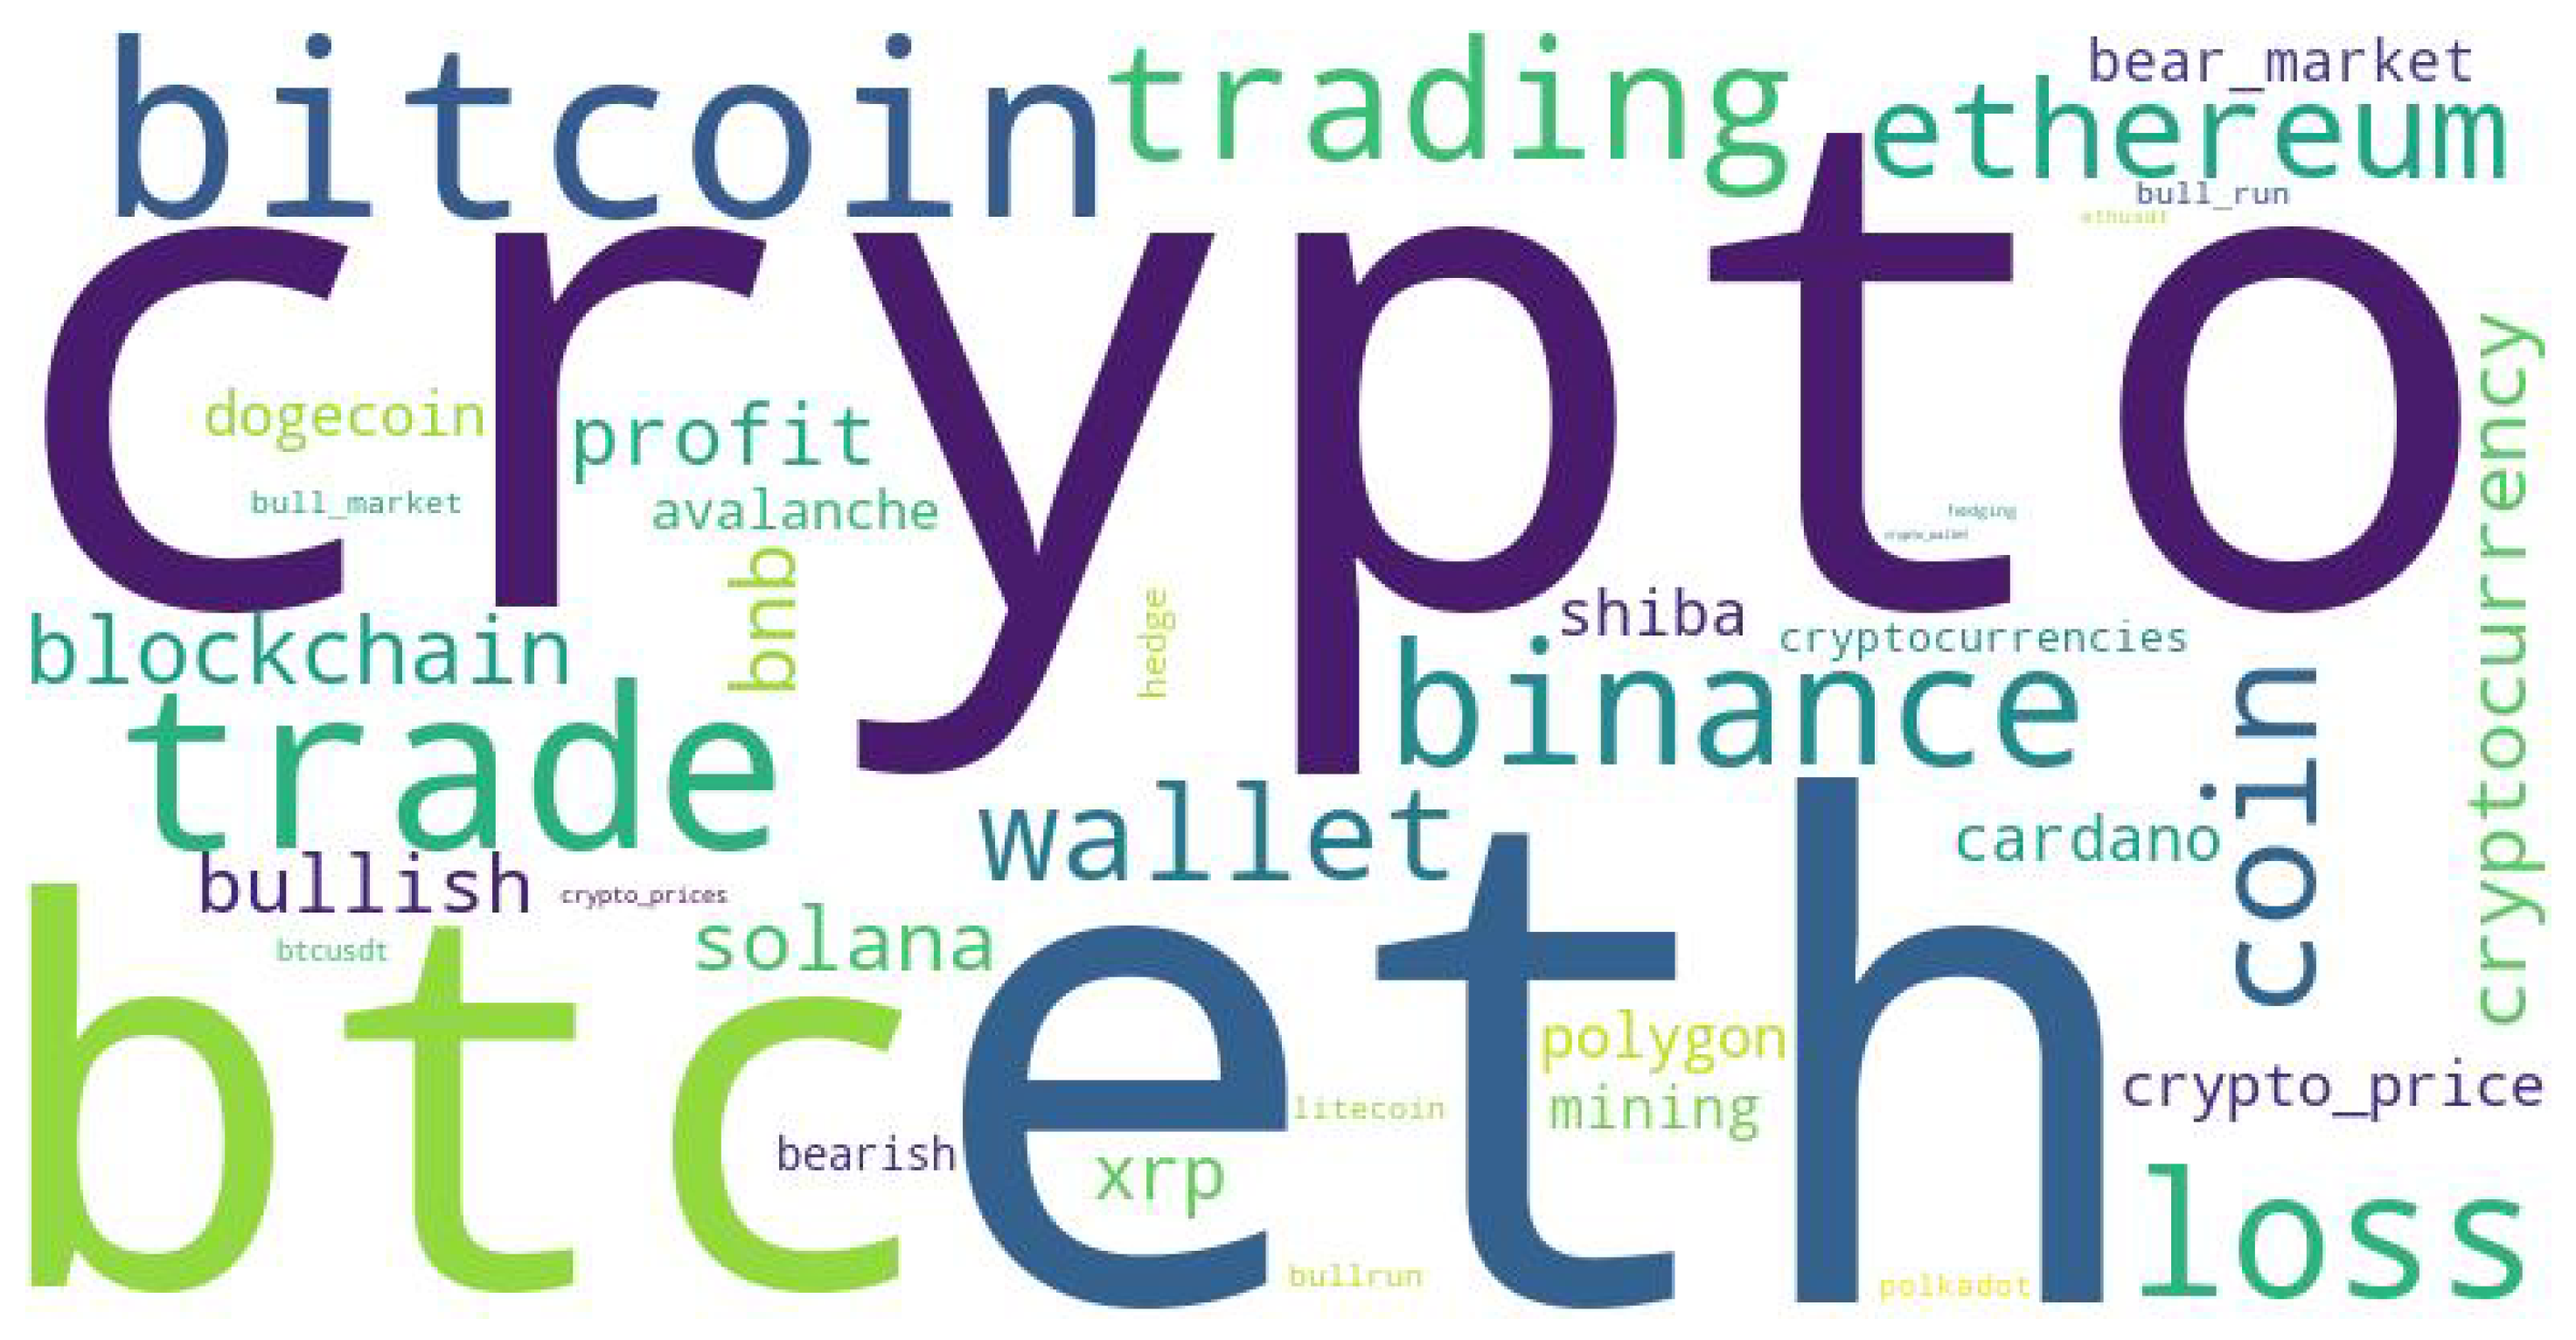
10. Case Study: Investigating the Performance Disparities Between Backtesting and Forward Testing
10.1. Background
Cryptocurrency forecasting algorithms have garnered significant attention in the domain of financial technology, promising insights into the volatile and dynamic world of digital assets. These algorithms, varying from traditional time series models like ARIMA to sophisticated Deep Learning techniques such as LSTM and Transformers, are designed to offer investors a predictive edge, ultimately facilitating more informed trading decisions.
In recent years, a new phenomenon has emerged in cryptocurrency forecasting - a disconnect between the impressive results achieved in controlled backtesting environments and the harsh realities of real-world application. This paradox is not merely a niche concern among cryptocurrency enthusiasts but a matter of profound consequence, impacting the investments, portfolios, and strategies of market participants. In this case, this study will address the performance gap that is causing concern.
10.2. The Problem
The problem, in its essence, revolves around the perplexing variation between backtesting and forward-testing outcomes for cryptocurrency forecasting algorithms. In the controlled environment of backtesting, these algorithms often exhibit remarkable predictive accuracy, effectively capturing historical price trends and inferring profitable trading signals. These positive outcomes in hindsight fueled investment excitement and increased the popularity of these models among traders.
However, the disturbing reality emerges when these algorithms are released into the unforgiving waters of real-time trading scenarios. The forward testing phase, which seeks to simulate real-world conditions with out-of-sample data, frequently yields outcomes far less favorable than anticipated. Algorithmic strategies that seemed like goldmines during backtesting often crumble, resulting in financial losses and scrambled expectations for investors.
10.3. The Objective
The goal of this case study is to investigate the performance differences between cryptocurrency forecasting algorithms in both backtesting and real-world forward-testing scenarios. This case study will seek to understand the complex dynamics that underlie this performance gap.
This study aims to explore the implications of differences for both cryptocurrency investors and the broader field of algorithmic trading and financial technology research. The main objective is to identify the contributing factors towards underperformance observed in forward testing and provide valuable insights and recommendations to address these issues.
By bridging the gap between the exceptional promise of cryptocurrency forecasting algorithms in backtesting and the often humbling reality of their performance in live markets, this study will aspire to empower both investors and researchers with a deeper understanding of the challenges and opportunities in this ever-evolving domain.
10.4. Data Collection
In the domain of cryptocurrency forecasting, the significance of data cannot be overstated. The quality, timeliness, and comprehensiveness of the dataset directly influence the reliability of predictions and the robustness of trading strategies. In this section, this case study will delve into the specifics of data collection, elucidating the choices made and the motivation behind them.
10.4.1. Training Data (January 1, 2017, to July 1, 2022)
For the foundational training of our cryptocurrency forecasting algorithms, this case study harnessed a wealth of historical data. Particularly, this case study utilized the 24-hour price data for Bitcoin sourced from BitMEX. This extended four-year period of training data was meticulously chosen for its substantial coverage of market conditions. By spanning from January 1, 2017, to July 1, 2022, this dataset encompasses a variety of pivotal events in the cryptocurrency world, including bull and bear markets, regulatory developments, and major technological shifts. The reason for this selection was to give the algorithms a rich historical context, allowing them to capture diverse market dynamics and adapt to various conditions.
10.4.2. Backtesting Data (July 1, 2022, to July 1, 2023)
The backtesting phase is designed to simulate the performance of our forecasting models on historical data following the training period. For this critical evaluation, we applied the algorithms to data ranging from July 1, 2022, to July 1, 2023. The choice of this specific time frame stems from our aim to assess the algorithms’ ability to predict cryptocurrency price movements during a recent historical period. This range includes post-training but pre-forward testing data, providing an opportunity to gauge how well the models adapt to changing market conditions.
10.4.3. Forward Testing Data (July 1, 2023, to January, 2024)
To assess the performance of the algorithms in a real-world scenario, this survey conducted forward testing using data collected from January 1, 2023, to January 1, 2024. This forward-looking period encompasses the latest available data at the time of this study. Its selection is deliberate, aiming to evaluate the algorithms under recent, live market conditions. The use of out-of-sample data enables us to gauge the models’ adaptability to dynamic, evolving market factors, reinforcing the real-world validity of our study.
10.4.4. Rationale for Dataset Selection
The rationale for selecting this dataset is multi-faceted. Firstly, the training data’s time span allows the algorithms to absorb and learn from a wide range of market scenarios, promoting adaptability to diverse conditions. By covering both bullish and bearish market cycles and encapsulating significant market events, this dataset equips the algorithms with a robust foundation for forecasting.
The study’s objective was met with a careful selection of backtesting and forward-testing periods. Backtesting utilized recent but historical data to assess algorithm performance in a controlled environment with known historical outcomes. Conversely, forward testing with recent out-of-sample data mirrors real-world applications, allowing us to gauge how well the algorithms perform under the uncertainty and volatility characteristic of live trading.
In summary, the dataset selection is a strategic effort to capture the evolving dynamics of the cryptocurrency market, enabling us to investigate the performance gap between backtesting and real-world implementation with rigor and relevance.
10.5. Algorithm Selection and Rationale
The selection of algorithms for this survey paper arrived at the primary objective of encompassing the breadth and depth of predictive methodologies employed in the domain of cryptocurrency forecasting. This research survey meticulously reviewed a comprehensive 234 research papers to determine the prevailing trends and identify the algorithms that have garnered prominence within the academic and practical cryptocurrency forecasting landscape.
10.5.1. Prominence in Prior Research Literature
The selection process was driven by the collective wisdom of the research community. This study specifically considered the algorithms that consistently appeared in the 234 research papers as prominent choices for cryptocurrency forecasting. These algorithms included:
10.5.2. Long Short-Term Memory
A Recurrent Neural Network variant was renowned for its capacity to capture sequential dependencies in time-series data. LSTM models are widely favored for their ability to model temporal relationships, which is crucial for cryptocurrency price forecasting.
10.5.3. AutoRegressive Integrated Moving Average
A traditional time series model that has been widely applied in cryptocurrency forecasting due to its effectiveness in capturing seasonality and trends in historical data.
10.5.4. Support Vector Classification and Support Vector Regression
Support Vector Classification and Support Vector Regression are both versatile Machine Learning models renowned for their ability to generalize effectively across diverse datasets. Due to this trait, they have become favored options for cryptocurrency prediction tasks.
10.5.5. Random Forest
An ensemble learning method, RF combines multiple decision trees to provide robust and accurate predictions, even when dealing with the noisy and volatile nature of cryptocurrency markets.
10.5.6. Transformers
The inclusion of Transformers is pivotal to ensure that our survey encompasses the most contemporary developments in predictive modeling. Transformers have recently gained prominence for their remarkable performance in various natural language processing tasks and have demonstrated potential in cryptocurrency forecasting due to their self-attention mechanisms and adaptability to non-linear patterns.
10.6. Methodology
The methodology section of our study details the systematic approach, this case study followed to implement, assess, and evaluate the selected cryptocurrency forecasting algorithms during both the backtesting and forward-testing phases. In this comprehensive overview, this case study outlines the specific preprocessing steps for each algorithm’s unique input requirements, the criteria employed for performance evaluation, and the emphasis on real-world relevance.
Investigating performance disparities between backtesting and forward testing. The left figure (Figure 28) illustrates the cumulative profit and loss (PNL) of algorithms during the backtest period, spanning from the middle of 2022 to the middle of 2023. Meanwhile, the right figure (Figure 29) displays the PNL of algorithms during forward testing, covering the last six months of 2023. These figures highlight the challenges and disparities in algorithm performance when transitioning from historical backtesting to real-world forward-testing scenarios.
Figure 28.
The x-axis represents the timeline, denoted by date and time, spanning from the middle of 2022 to the middle of 2023. The y-axis represents the cumulative profit and loss (PNL) for each algorithm studied during the backtest period.
Figure 28.
The x-axis represents the timeline, denoted by date and time, spanning from the middle of 2022 to the middle of 2023. The y-axis represents the cumulative profit and loss (PNL) for each algorithm studied during the backtest period.
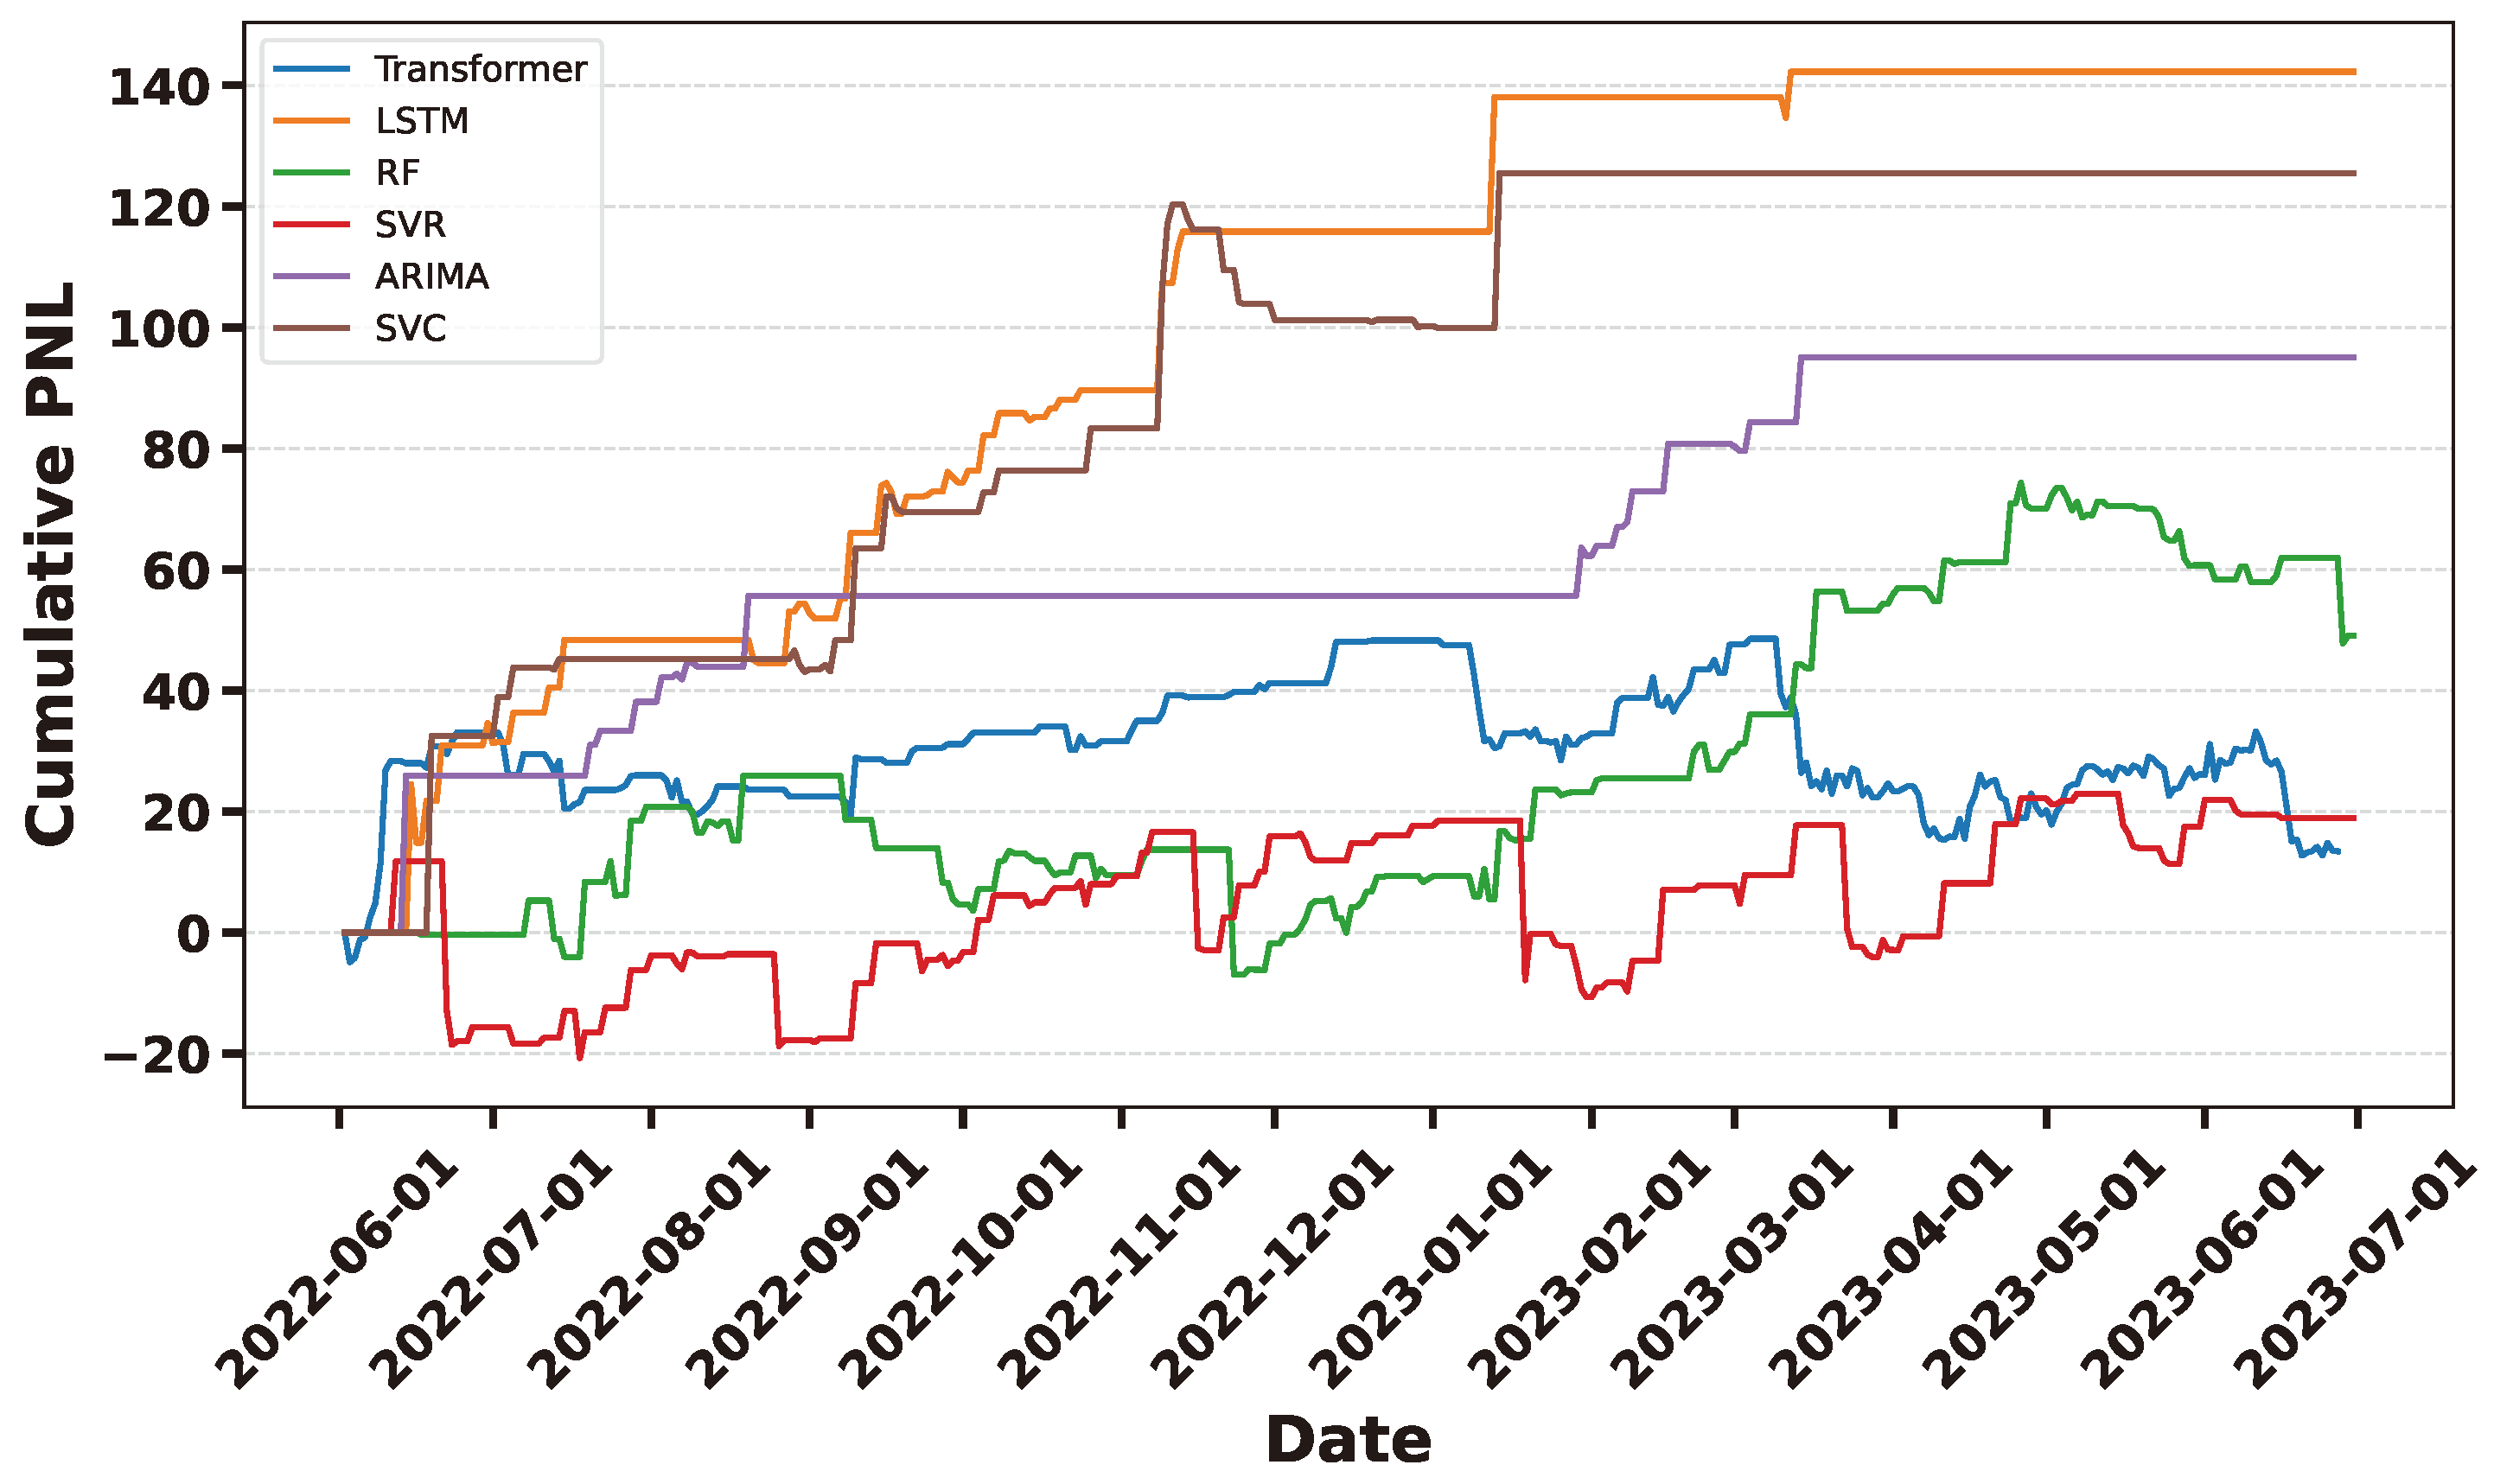
Figure 29.
The x-axis represents the timeline, denoted by date and time, covering the last six months of 2023. The y-axis represents the cumulative profit and loss (PNL) for each algorithm studied during the forward testing period.
Figure 29.
The x-axis represents the timeline, denoted by date and time, covering the last six months of 2023. The y-axis represents the cumulative profit and loss (PNL) for each algorithm studied during the forward testing period.
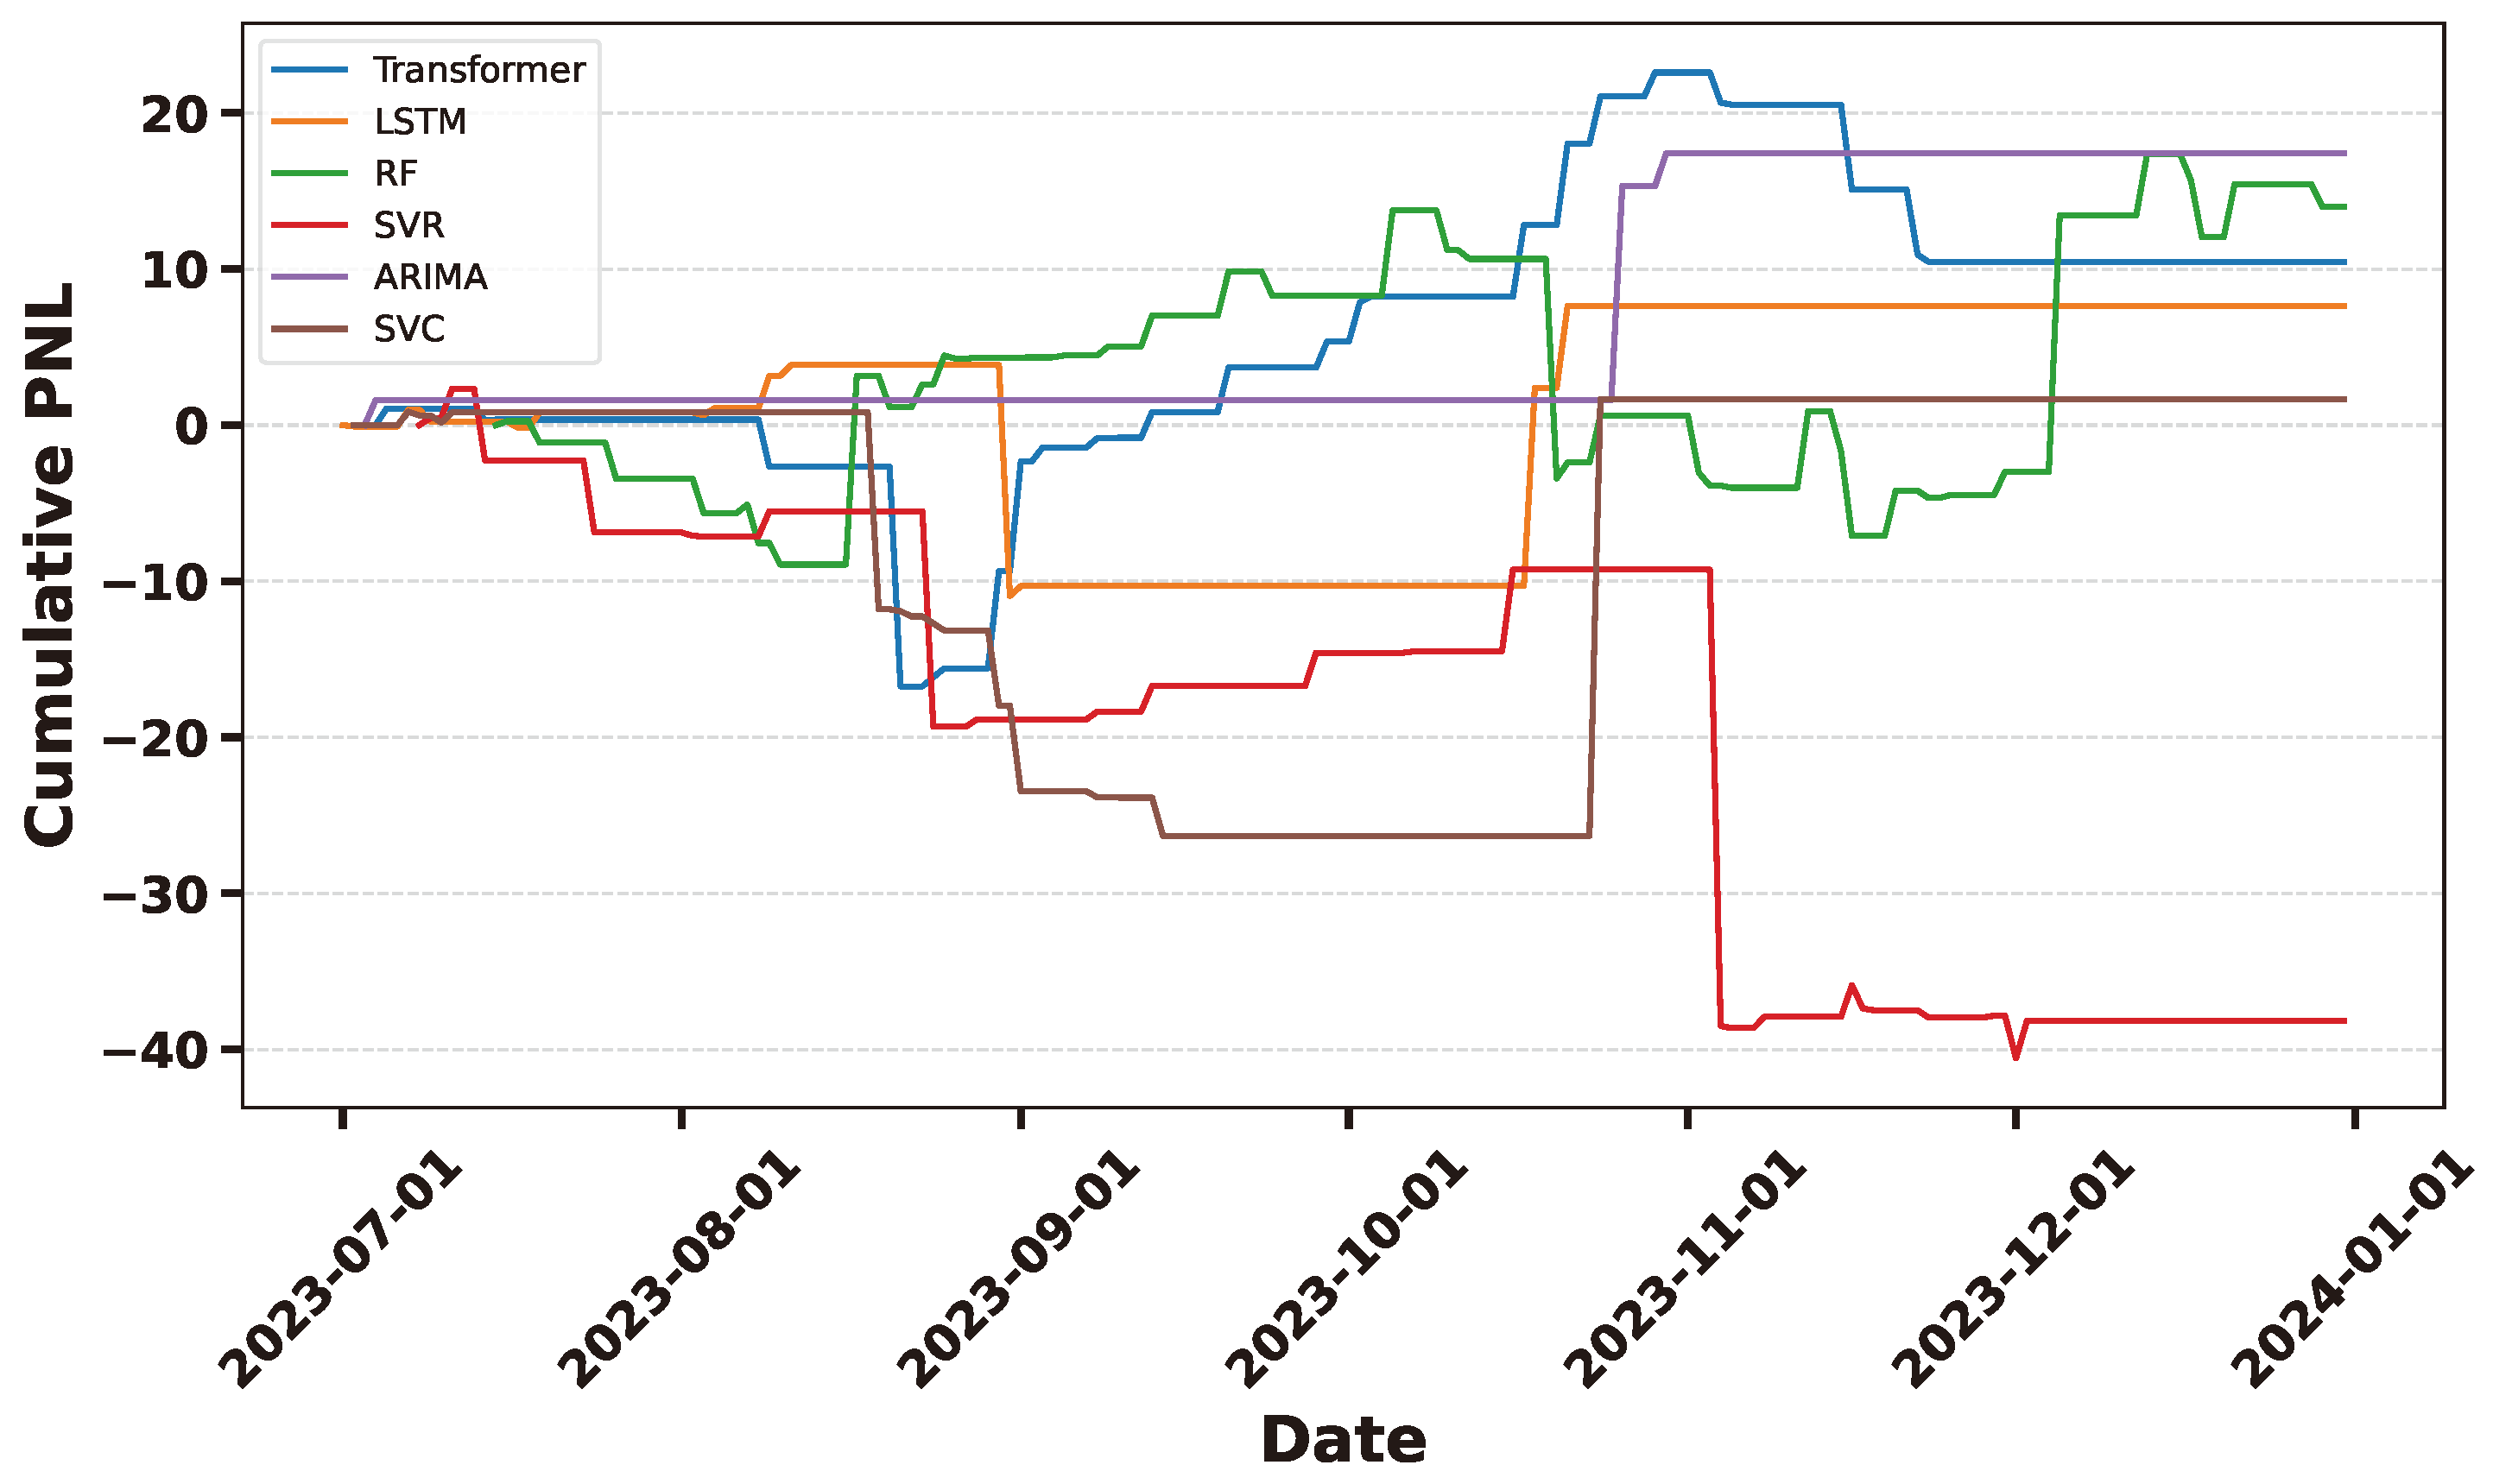
10.7. Data Preprocessing and Customization for Algorithm Inputs
This study methodology begins with rigorous data preprocessing, tailored to accommodate the unique input requirements of each forecasting algorithm. This process involved a series of essential steps to ensure that the dataset was appropriately configured:
- Feature Engineering: This study engaged in feature engineering to craft features specific to the forecasting algorithms’ needs. For instance, for LSTM and Transformers, this study generated sequential data enriched with lag features to capture temporal dependencies. In contrast, ARIMA required time series differencing to achieve stationarity.
- Scaling and Standardization: Given the sensitivity of many algorithms to the scale of input data, this study applied scaling and standardization. SVM and SVR, for example, required standardization to ensure consistent scaling across features. However, this survey noted that LSTM and Transformers did not necessitate standardized data due to their adaptability to varying scales.
- Train-Validation-Test Split: This survey partitioned the dataset into training, validation, and test sets, enabling distinct phases of model development. The forward testing dataset was reserved for simulating real-world scenarios, ensuring a robust evaluation of the models’ performance under out-of-sample conditions.
10.8. Performance Evaluation Criteria
A critical aspect of this study is the definition of performance evaluation criteria. These criteria were selected based on their relevance to real-world trading conditions and included:
- Profit and loss: This study emphasizes a fundamental measure of profitability, detailing how it reflects real-world investment outcomes and is central to evaluating the success of each algorithm.
- Accuracy: The accuracy metric measures the effectiveness of each forecasting algorithm in predicting buy and sell signals accurately. It quantifies the algorithm’s ability to make correct predictions and is particularly relevant for assessing the precision of trading recommendations. High accuracy indicates that the algorithm provides reliable signals for traders and investors.
- Cumulative profit and loss : To evaluate the overall performance of each forecasting algorithm, this study calculated the cumulative PNL. This metric represents the total profit or loss generated over the backtesting and forward-testing periods. The cumulative PNL encapsulates the algorithm’s ability to generate returns and reflects its effectiveness in real-world trading conditions, where sustained profitability is a key consideration.
10.9. Comparative Insights and Analysis
This study provides a detailed comparison of the Cumulative Profit and Loss visualizations for each algorithm, analyzing their performance on both backtesting and forward-testing data. The graphs plot cumulative PNL on the y-axis and time on the x-axis, allowing a clear visual representation of each algorithm’s performance over the evaluation periods. Figure 28 and Figure 29 shows the performance dynamics observed during both backtesting and forward testing phases, spanning mid-2022 to mid-2023. Across various predictive models including Transformer, LSTM, RF, SVR, ARIMA, and SVM, a consistent accumulation of cumulative profit and loss is evident during backtesting. These models collectively showcase notable proficiency in generating gains over the specified period.However, during the forward testing phase conducted over the last six months of 2023, there was a shift in the observed dynamics. While some models continued to maintain their profitability, others struggled to sustain consistent gains. This divergence highlights the challenges and uncertainties that arise when transitioning from historical backtesting to real-world forward-testing scenarios.
11. Findings
In this section, the survey takes a thorough look at a wealth of insights derived from a meticulous review of 234 research papers. Moving forward, the presentation employs engaging visualizations to illuminate these findings, adding accessibility and depth to the analysis.
11.1. Yearly Publication Trends
In this segment of the study, this survey delves into the annual publication trends within the realm of researched papers. As illustrated in Figure 30, the survey provides a visual representation of the yearly publication patterns in the field of cryptocurrency forecasting. This figure vividly portrays the changing landscape, signifying a growing interest in this domain. Notably, there was a significant upswing in research papers related to cryptocurrency forecasting in 2022 and 2023 within the scope of this study.
Figure 30.
Bar chart visualizes the distribution of published papers over the years within the scope of the survey conducted in 2023.
Figure 30.
Bar chart visualizes the distribution of published papers over the years within the scope of the survey conducted in 2023.
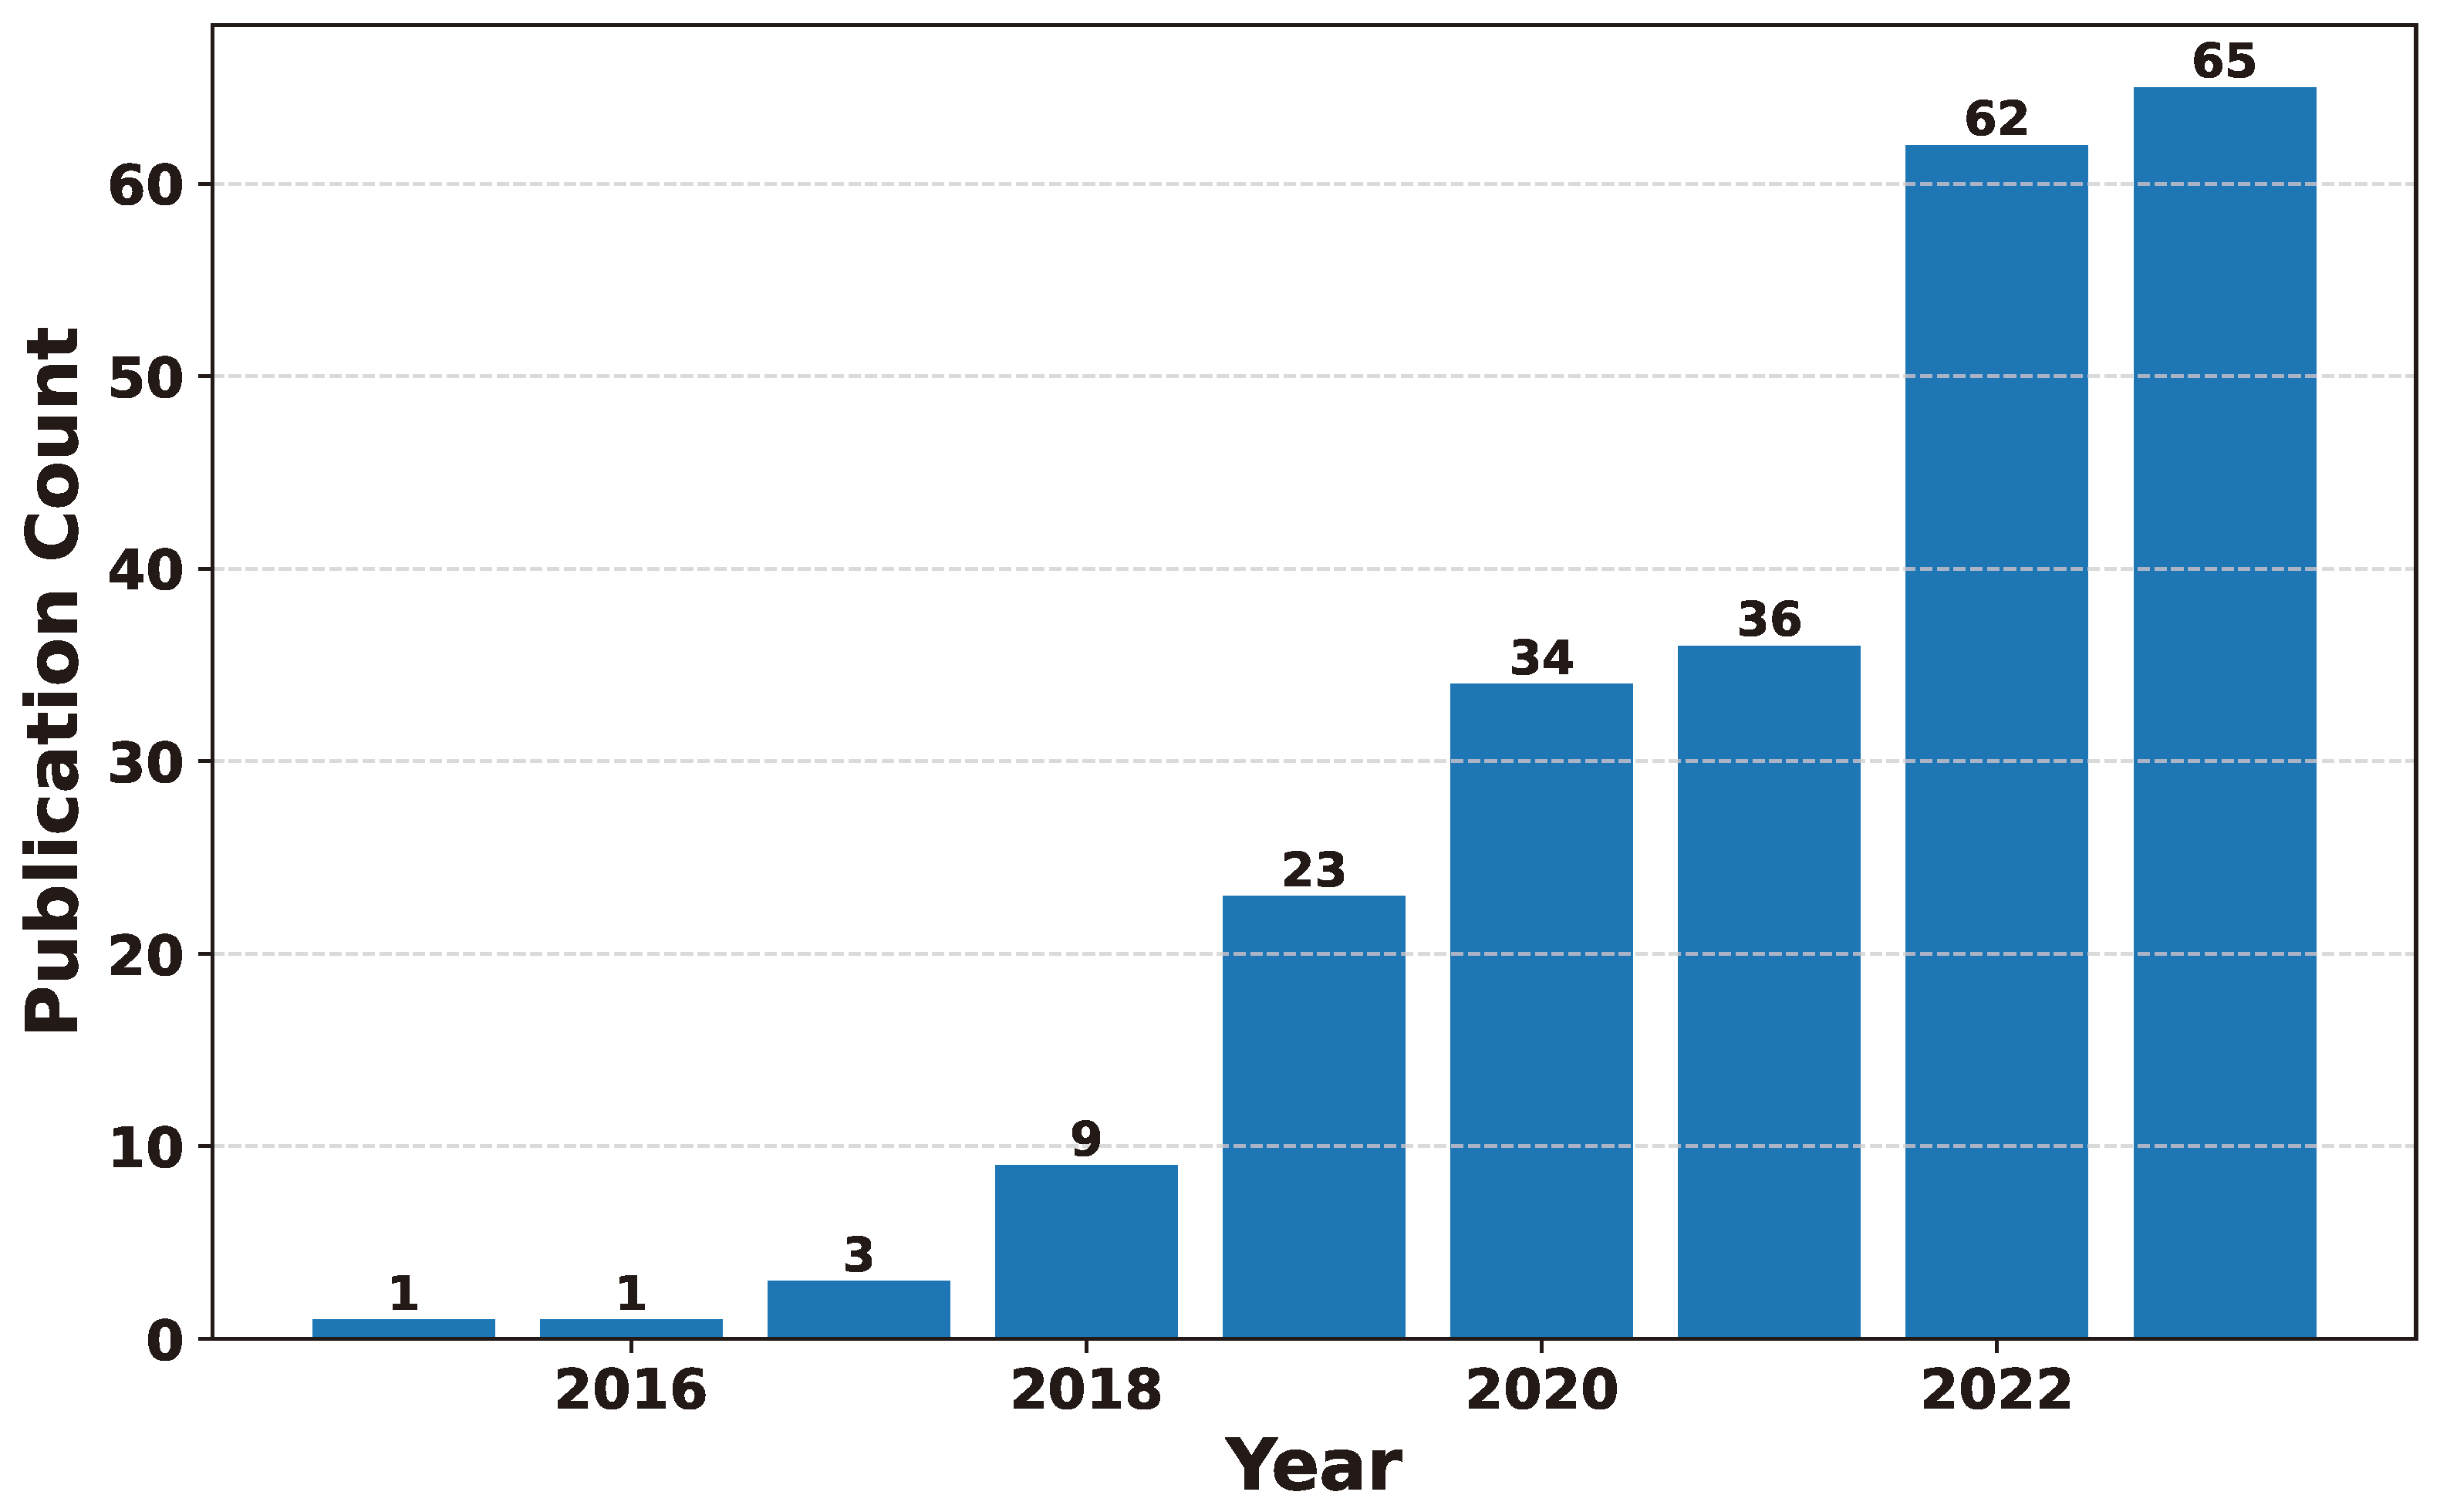
Figure 31 presents a graphical portrayal of the annual distribution of published papers, expressed in percentage terms. This representation succinctly showcases that in 2023, around 27.8% of total publications transpired, indicating a notable zenith in research activity during that specific year. The augmented interest among researchers in cryptocurrency forecasting can be attributed to the pronounced surge in the cryptocurrency market in 2017 [?].
Figure 31.
Pie chart illustrates the proportion of published papers in percentage terms across different years.
Figure 31.
Pie chart illustrates the proportion of published papers in percentage terms across different years.
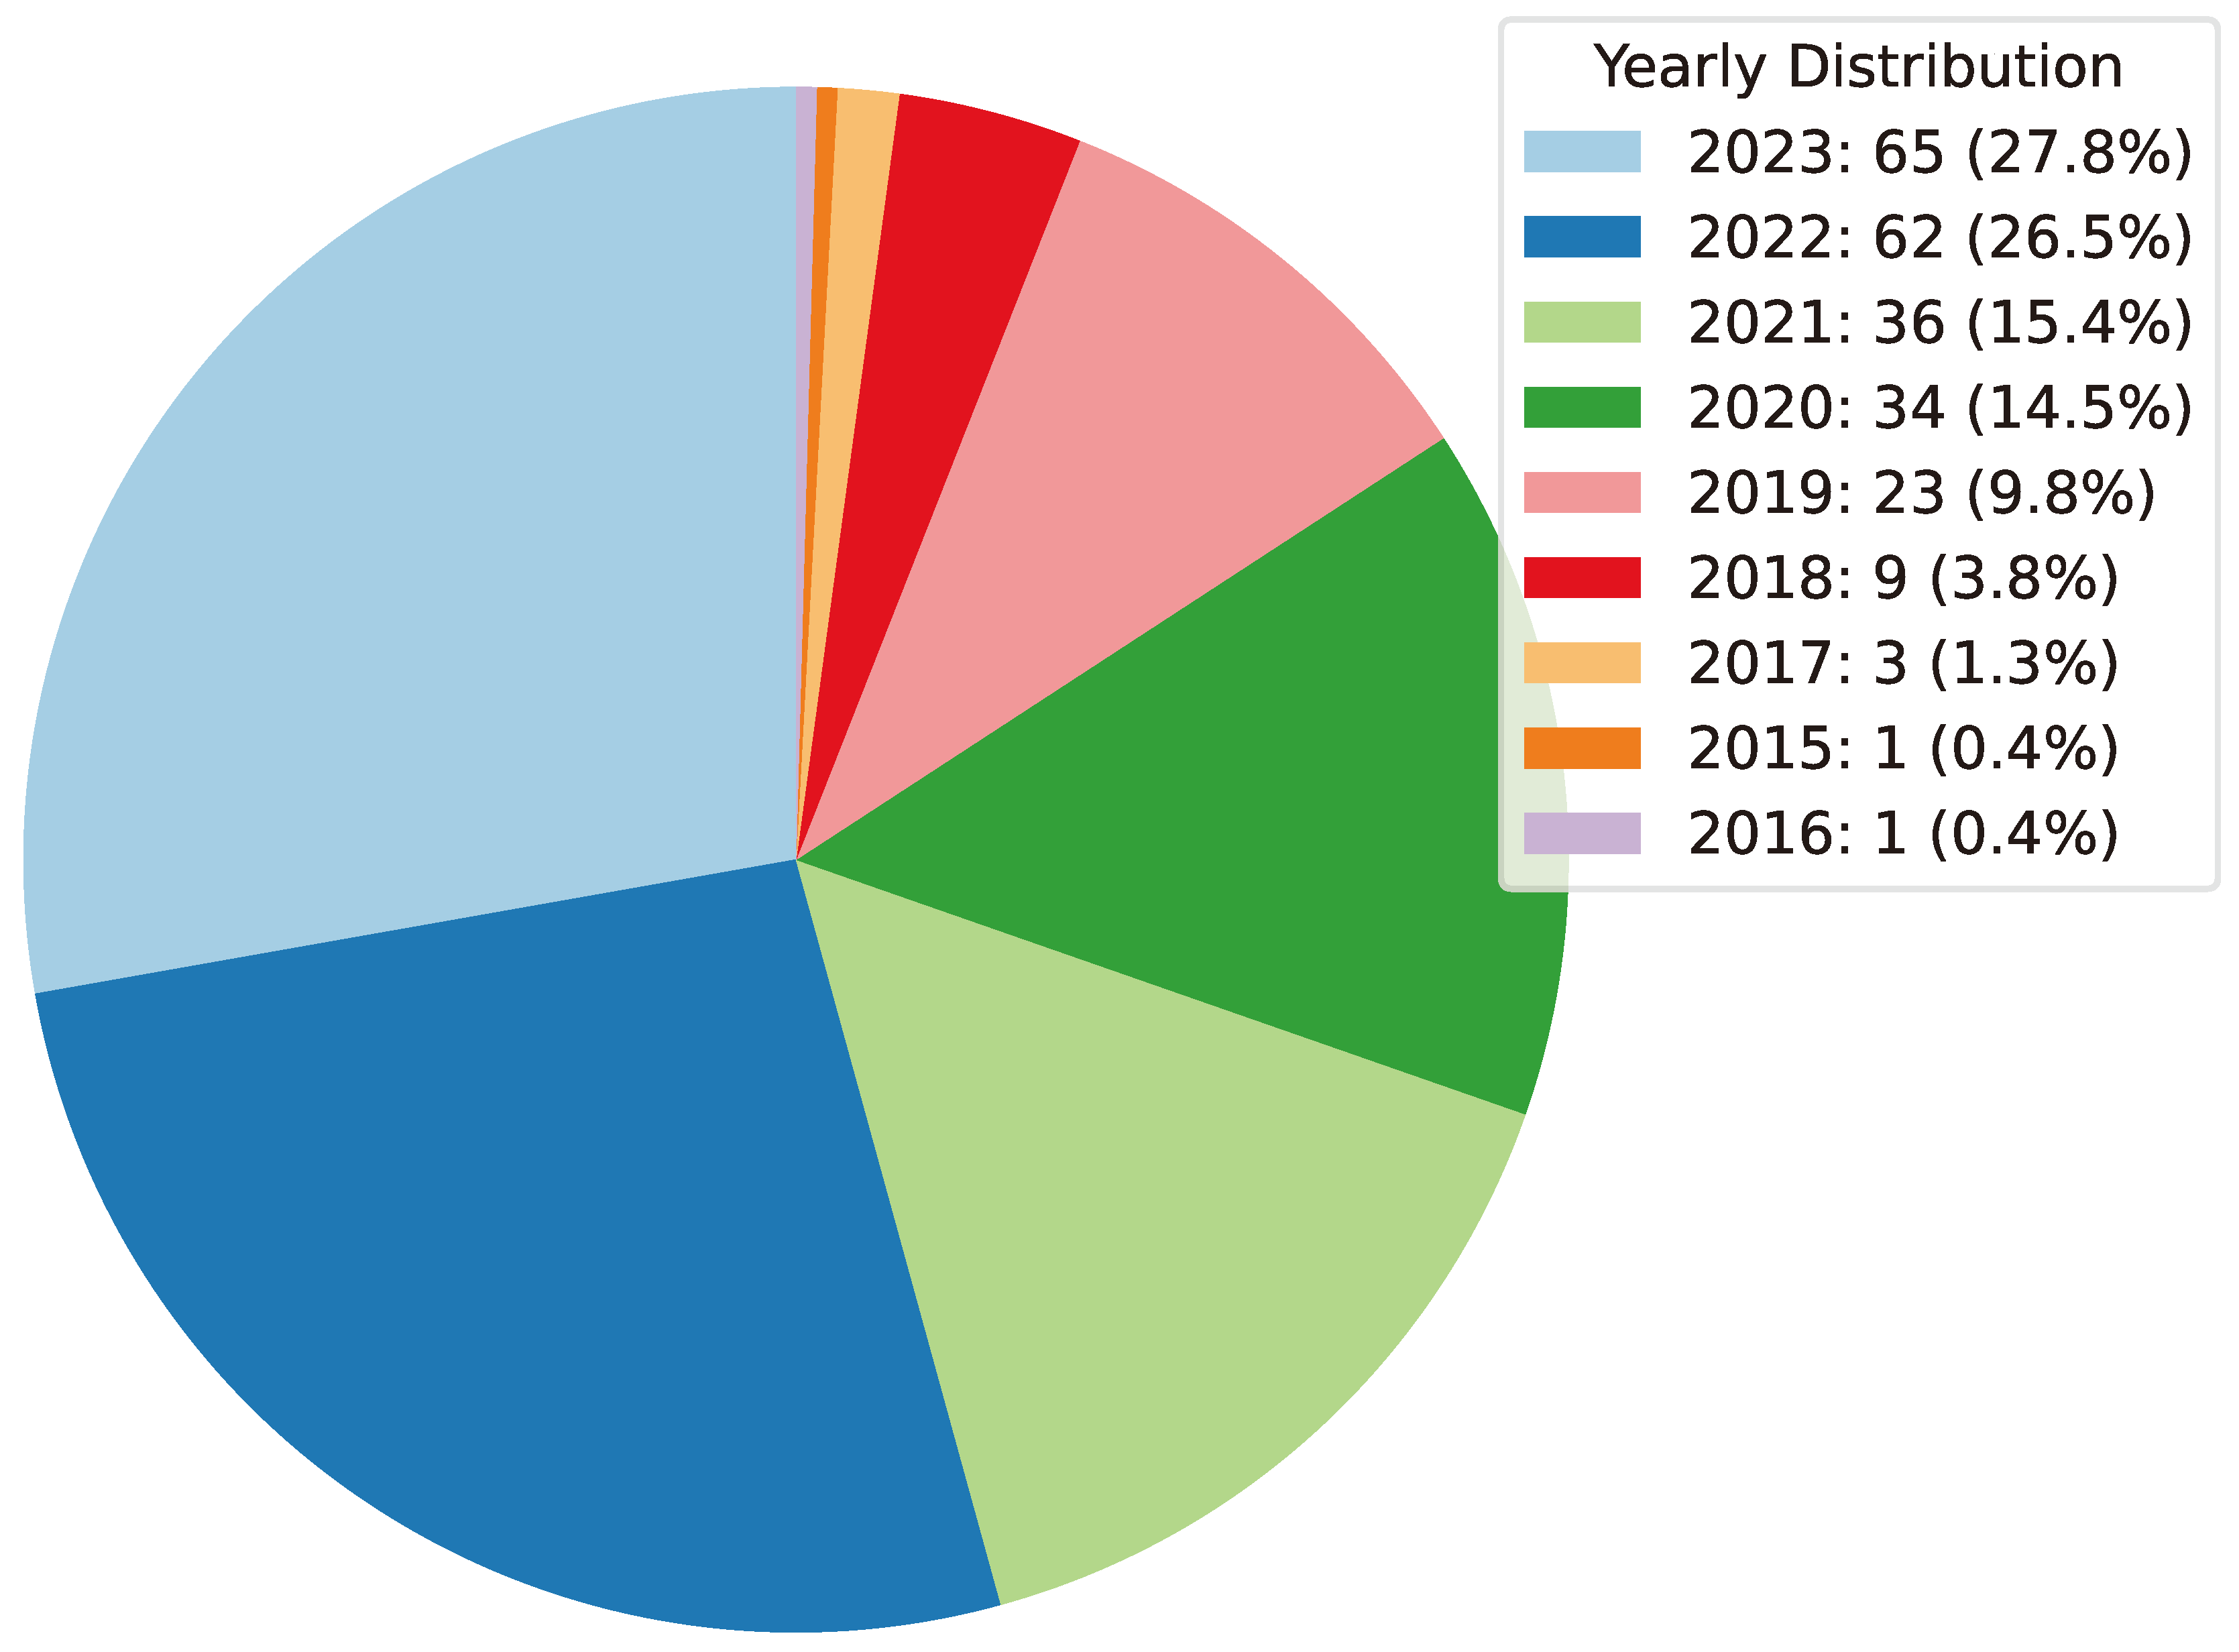
11.2. Methodology Distribution
In this section, the survey conducts a detailed analysis of methodologies employed within the study corpus. Figure 32 presents a detailed visualization, depicting the count of each methodology on the y-axis and corresponding methods on the x-axis. This visual representation enriches the understanding of the specific procedures adopted across the cryptocurrency forecasting research landscape. Notably, Long Short-Term Memory emerges as the most frequently utilized method among the surveyed papers.
Figure 32.
Bar chart provides a comprehensive overview of the methodology distribution across all research papers included in the survey.
Figure 32.
Bar chart provides a comprehensive overview of the methodology distribution across all research papers included in the survey.
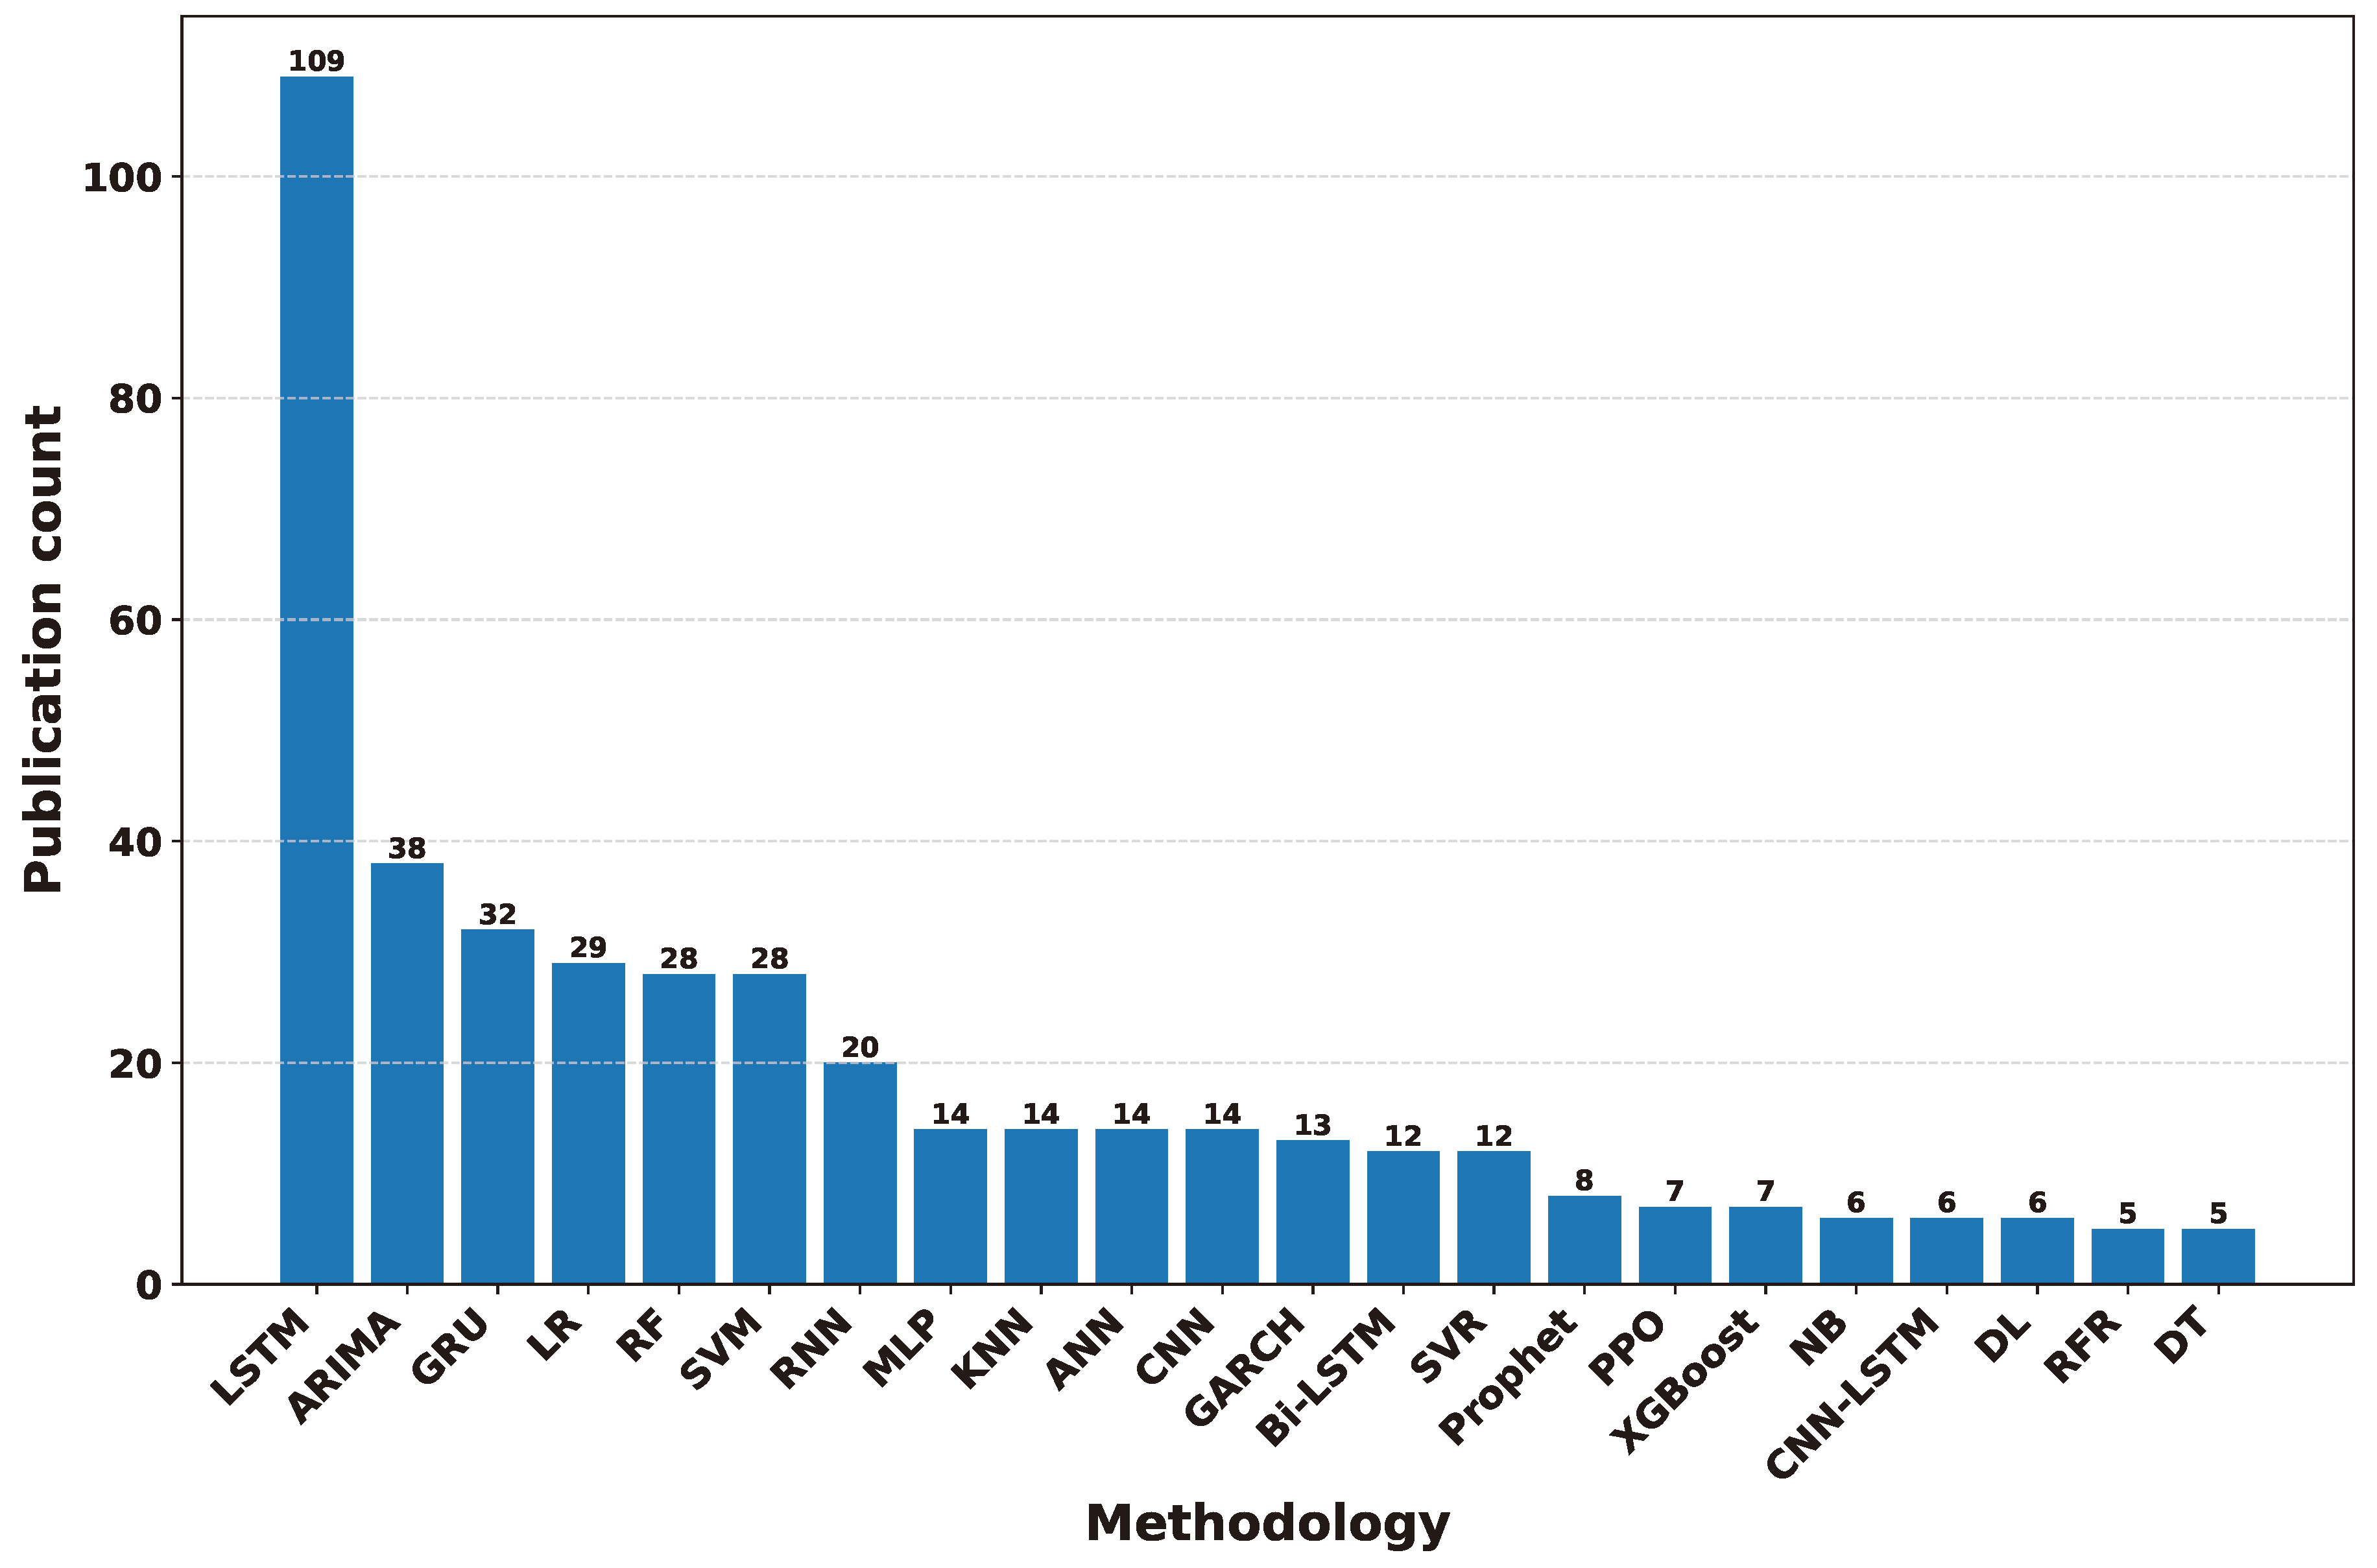
Moreover, this section features graphical depictions of methodologies encapsulated in a word cloud, as exemplified in Figure 33. This visualization benefits to aggregate terminologies extracted from the study corpus, thereby highlighting the prevalence and significance of specific forecasting models. The word cloud visually outlines the prominence of each term, offering insight into the landscape of cryptocurrency forecasting. Noteworthy terms such as Long Short-Term Memory, Autoregressive Integrated Moving Average, Support Vector Machine, Random Forest, Linear Regression, Recurrent Neural Network, Gated Recurrent Unit, Artificial Neural Network, Convolutional Neural Network, Multilayer Perceptron, Proximal Policy Optimization, Advantage Actor-Critic, Generalized Autoregressive Conditional Heteroskedasticity, and k-Nearest Neighbors emerge as focal points within the cryptocurrency forecasting domain.
Figure 33.
Visual representation aggregates terminology extracted from cryptocurrency forecasting research papers, highlighting the prevalence of specific forecasting models such as LSTM, ARIMA, SVM, RF, LR, RNN, GRU, ANN, CNN, MLP, PPO, A2C, GARCH, and KNN.
Figure 33.
Visual representation aggregates terminology extracted from cryptocurrency forecasting research papers, highlighting the prevalence of specific forecasting models such as LSTM, ARIMA, SVM, RF, LR, RNN, GRU, ANN, CNN, MLP, PPO, A2C, GARCH, and KNN.
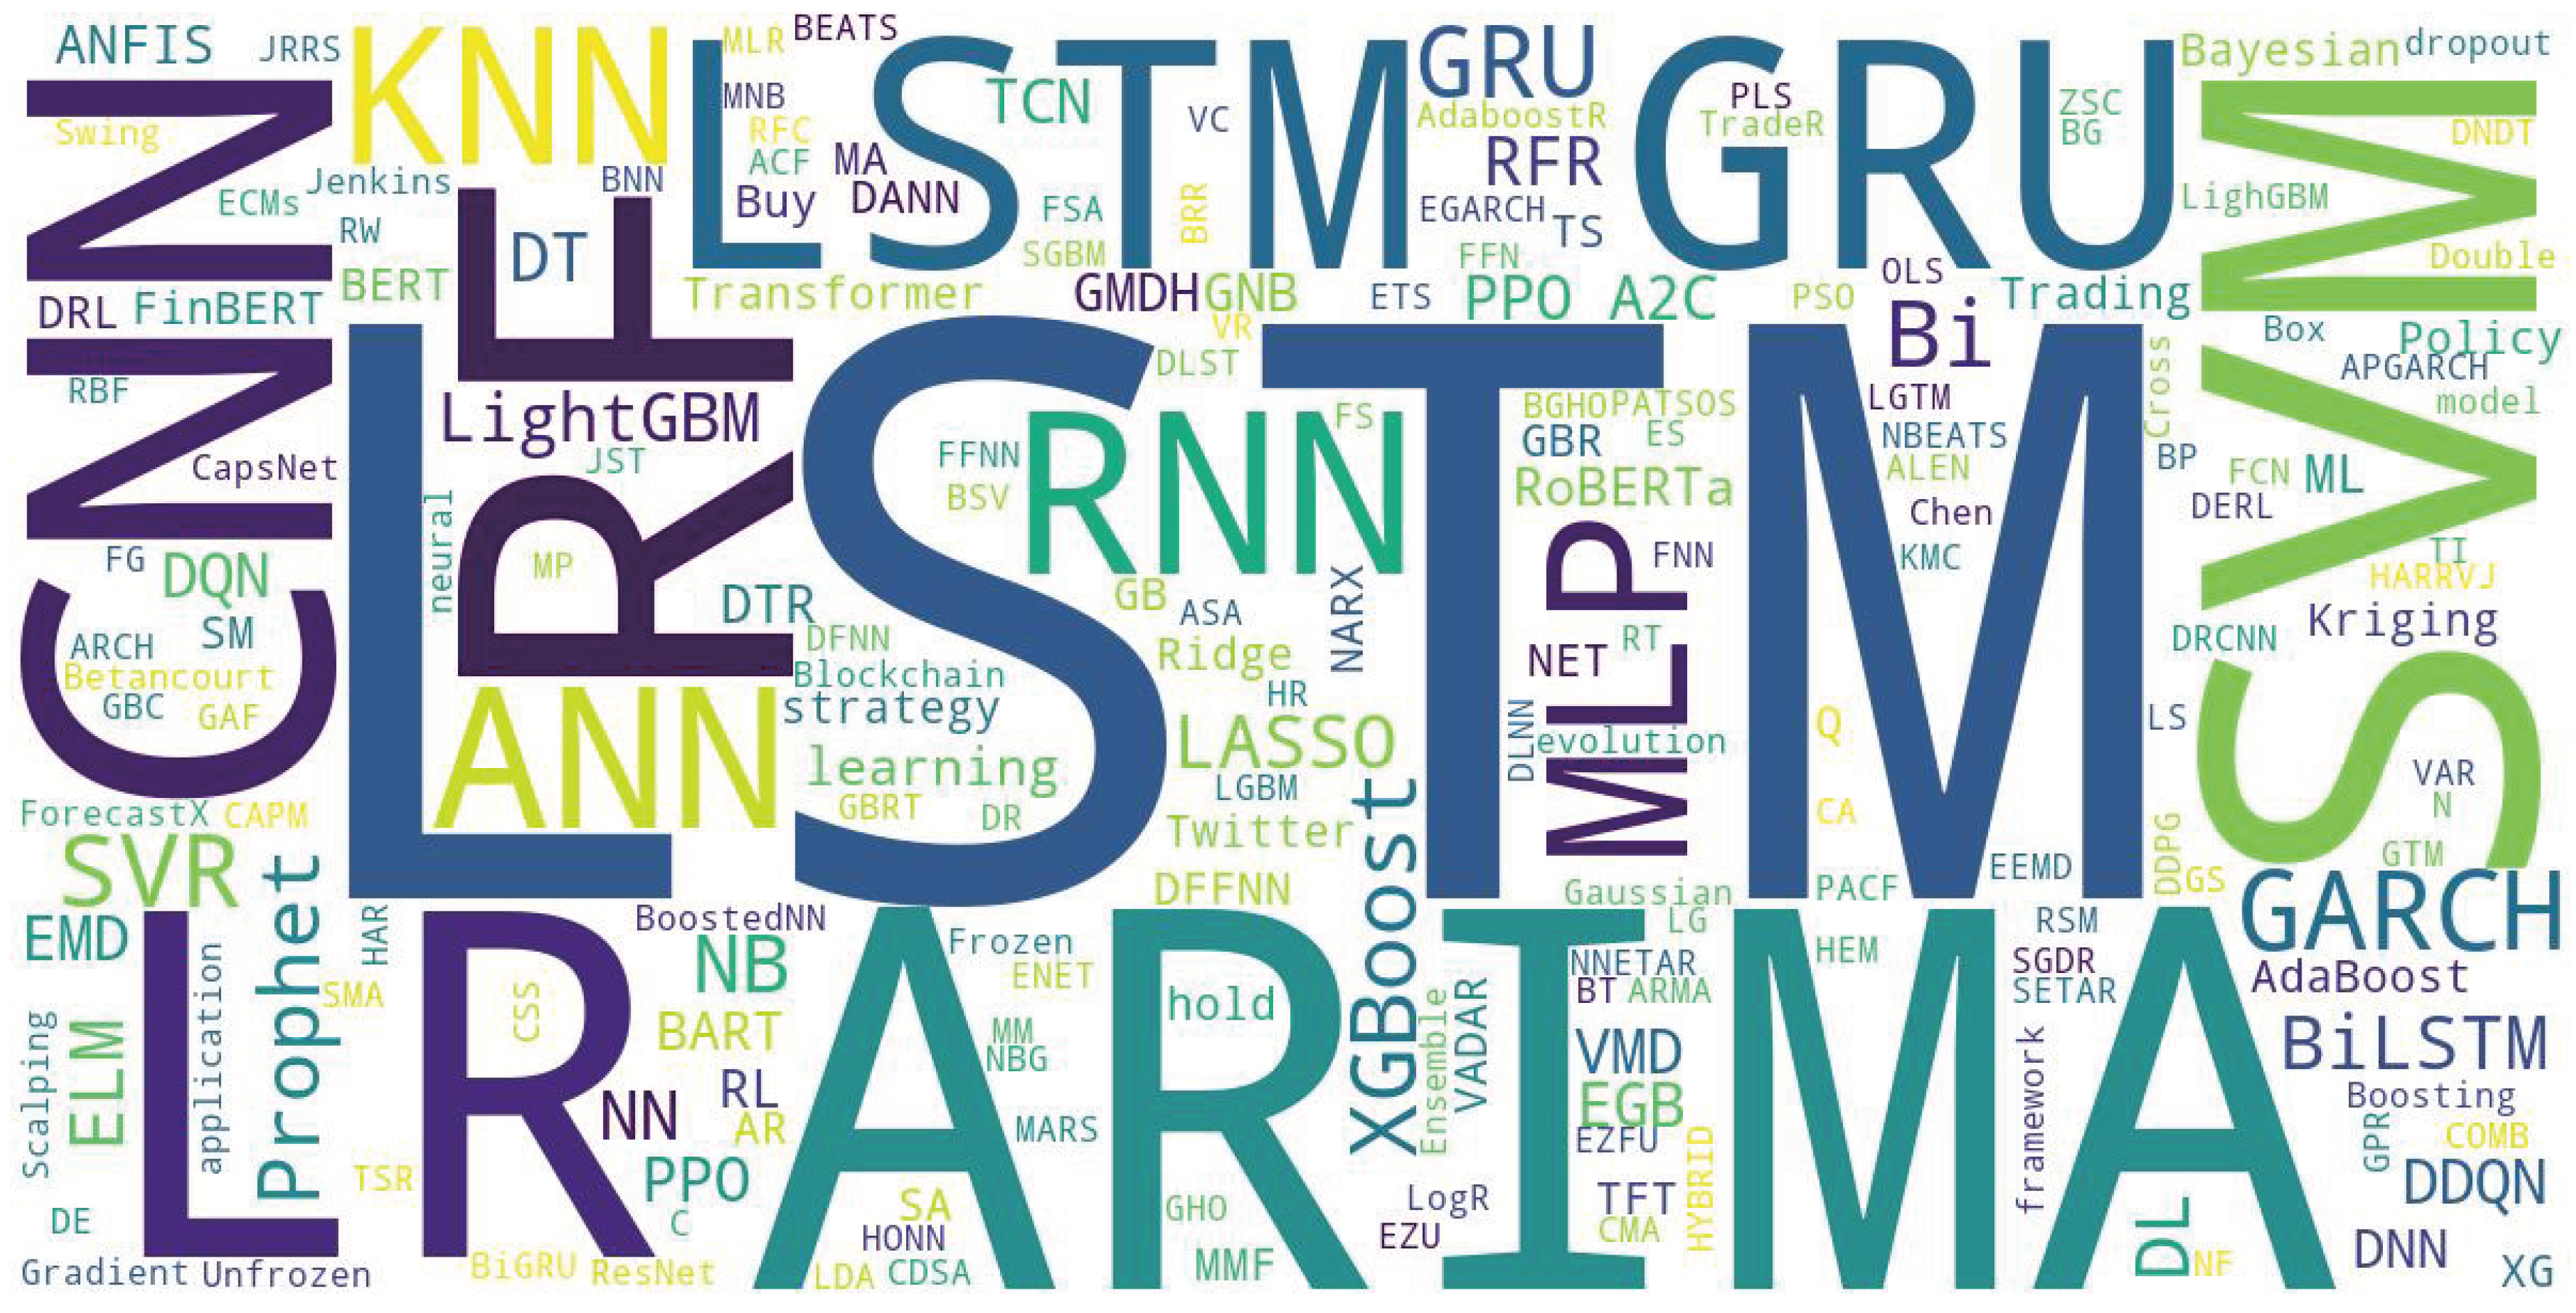
11.3. Time Horizon Distribution
This section presents an in-depth analysis of the time horizons considered in the researched papers. Figure 34 presents a bar chart with time horizon values on the x-axis and the count of each time horizon considered in research surveys on the y-axis. The analysis of this chart reveals a notable trend, indicating that in the majority of research papers, a 24-hour time horizon was considered.
Figure 34.
Bar chart shows the time horizons considered in cryptocurrency forecasting research papers, highlighting a prevalent trend toward a 24-hour time horizon.
Figure 34.
Bar chart shows the time horizons considered in cryptocurrency forecasting research papers, highlighting a prevalent trend toward a 24-hour time horizon.
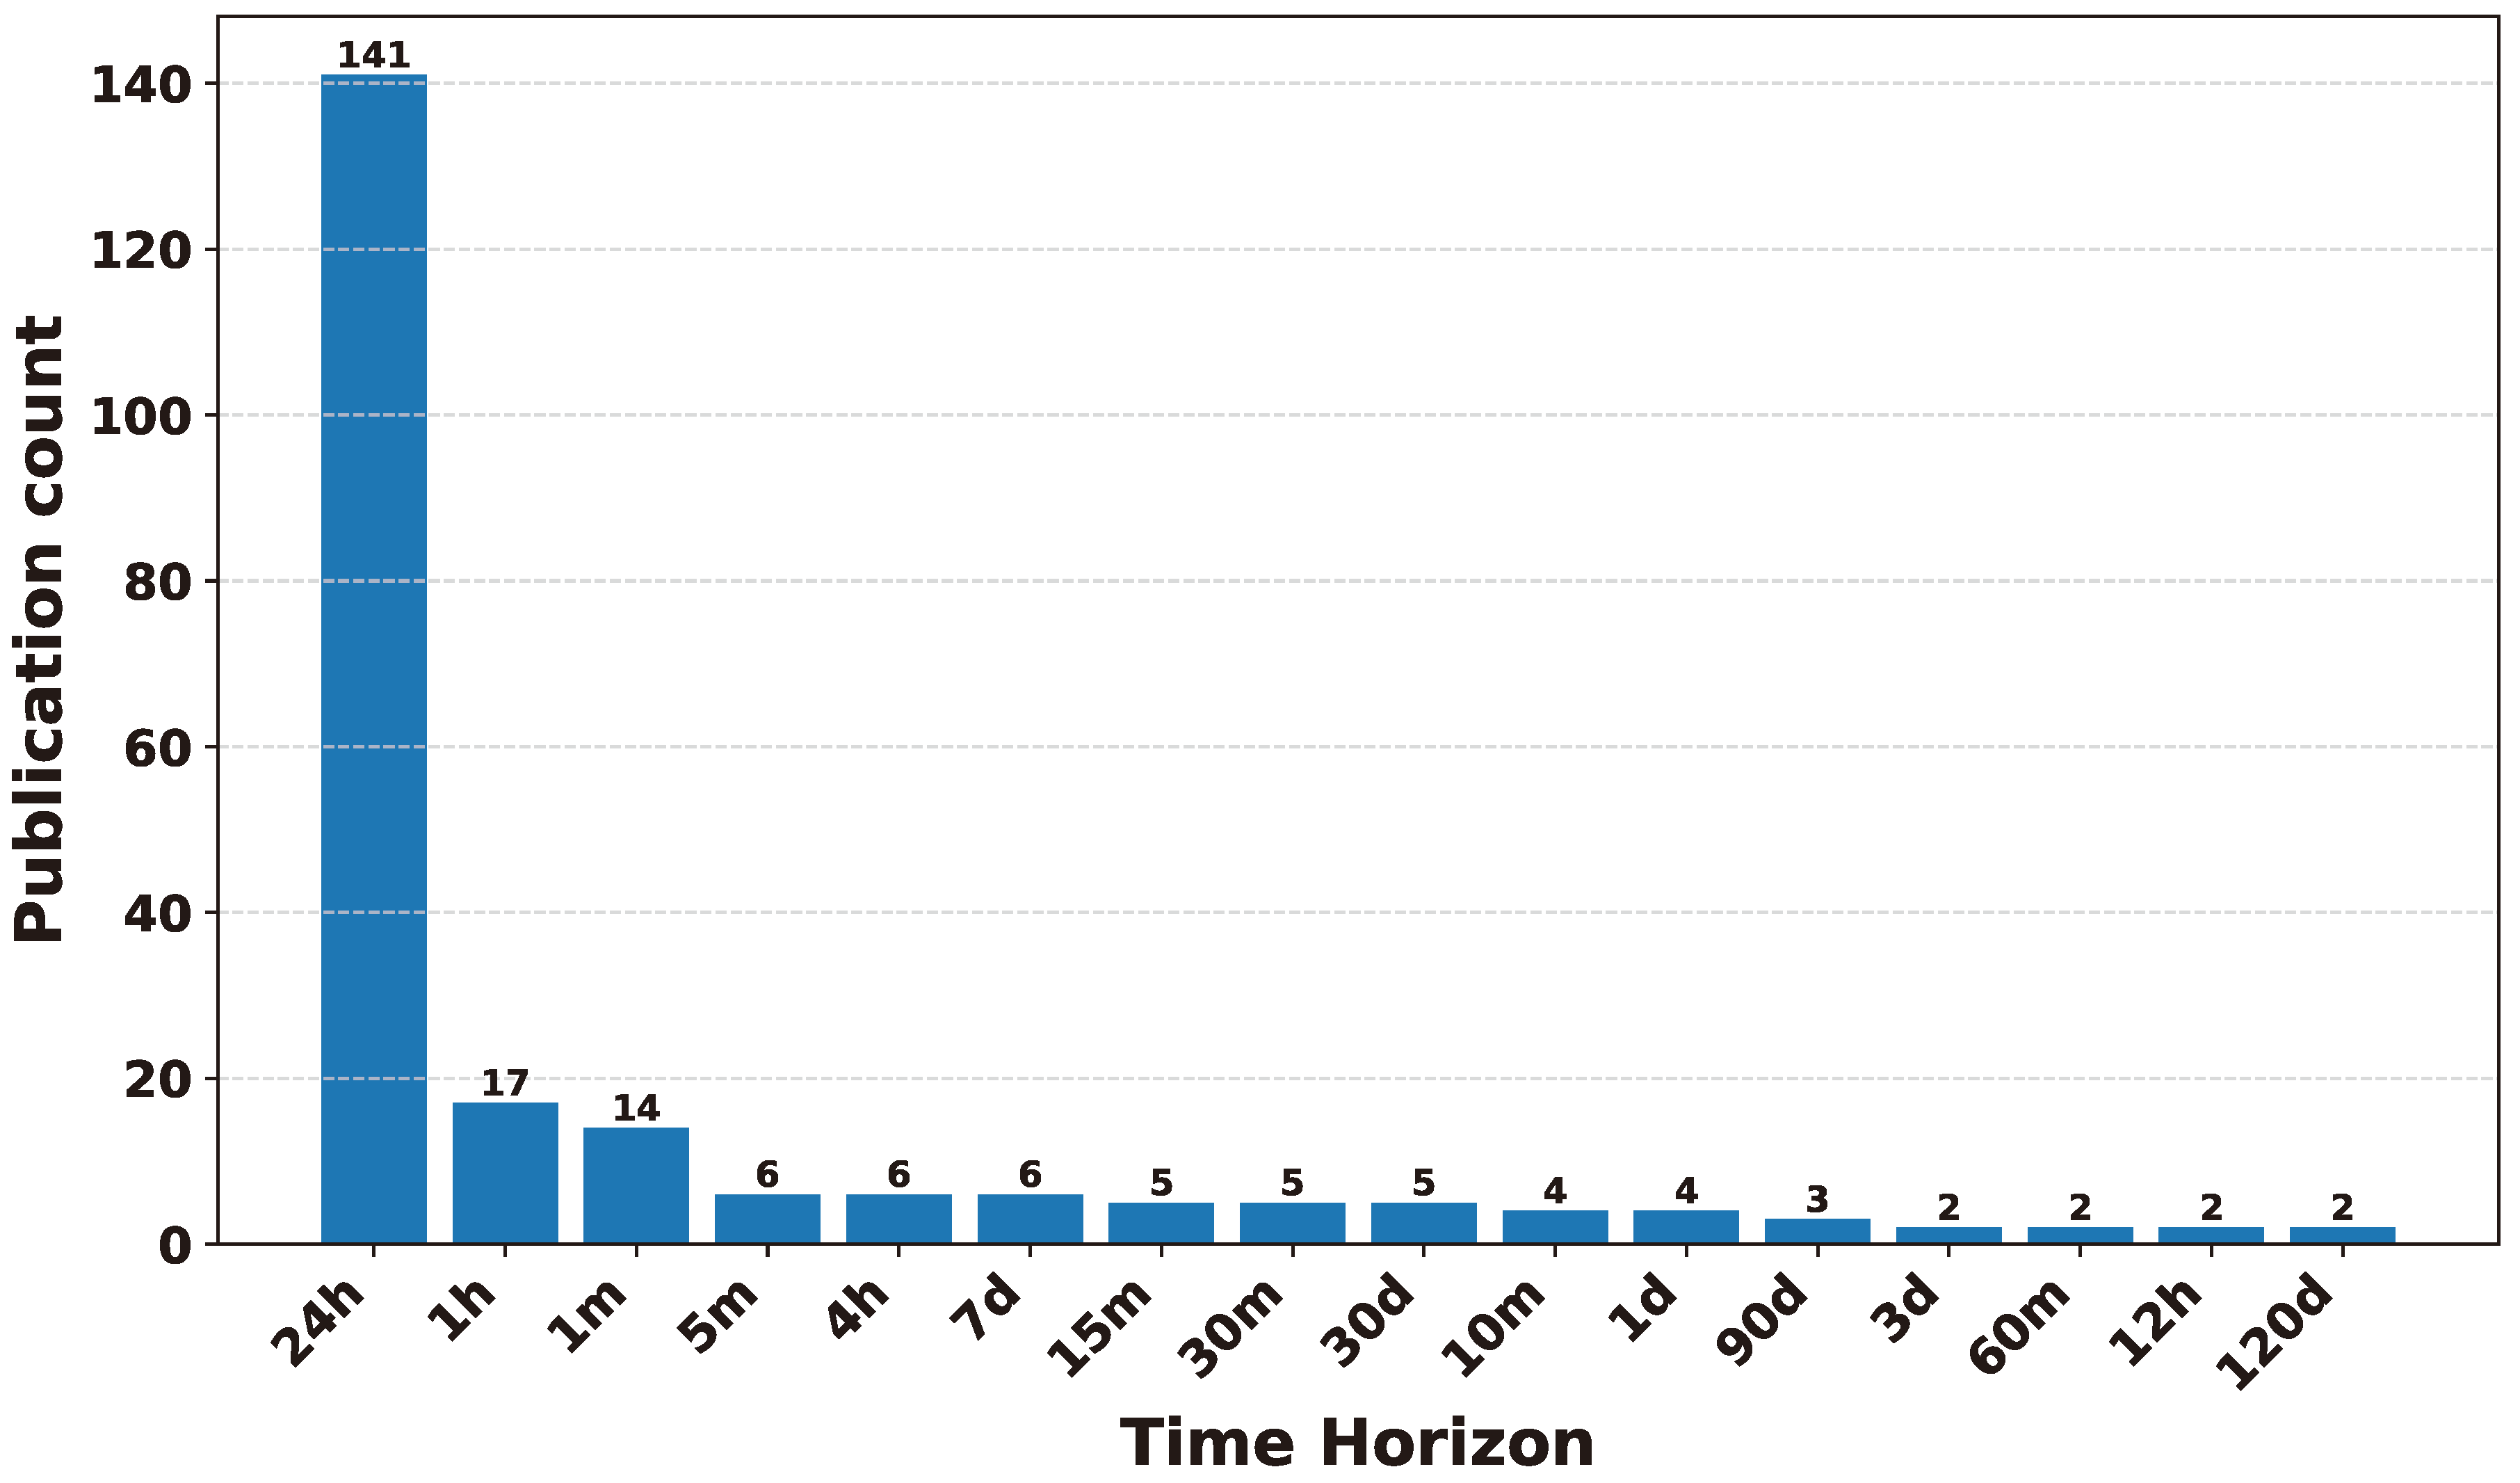
Figure 35 complements this analysis with a pie chart representing the percentage-wise distribution of time horizons across the landscape of cryptocurrency forecasting in the studied research papers. The pie chart highlights that 67.5% of the published research papers considered in this survey focused on the 24-hour time horizon. The second-highest percentage-wise time horizon is 1 hour, accounting for 8.1% of the total research papers studied in this survey.
Figure 35.
Pie chart illustrates the percentage-wise distribution of time horizons across cryptocurrency forecasting research papers.
Figure 35.
Pie chart illustrates the percentage-wise distribution of time horizons across cryptocurrency forecasting research papers.
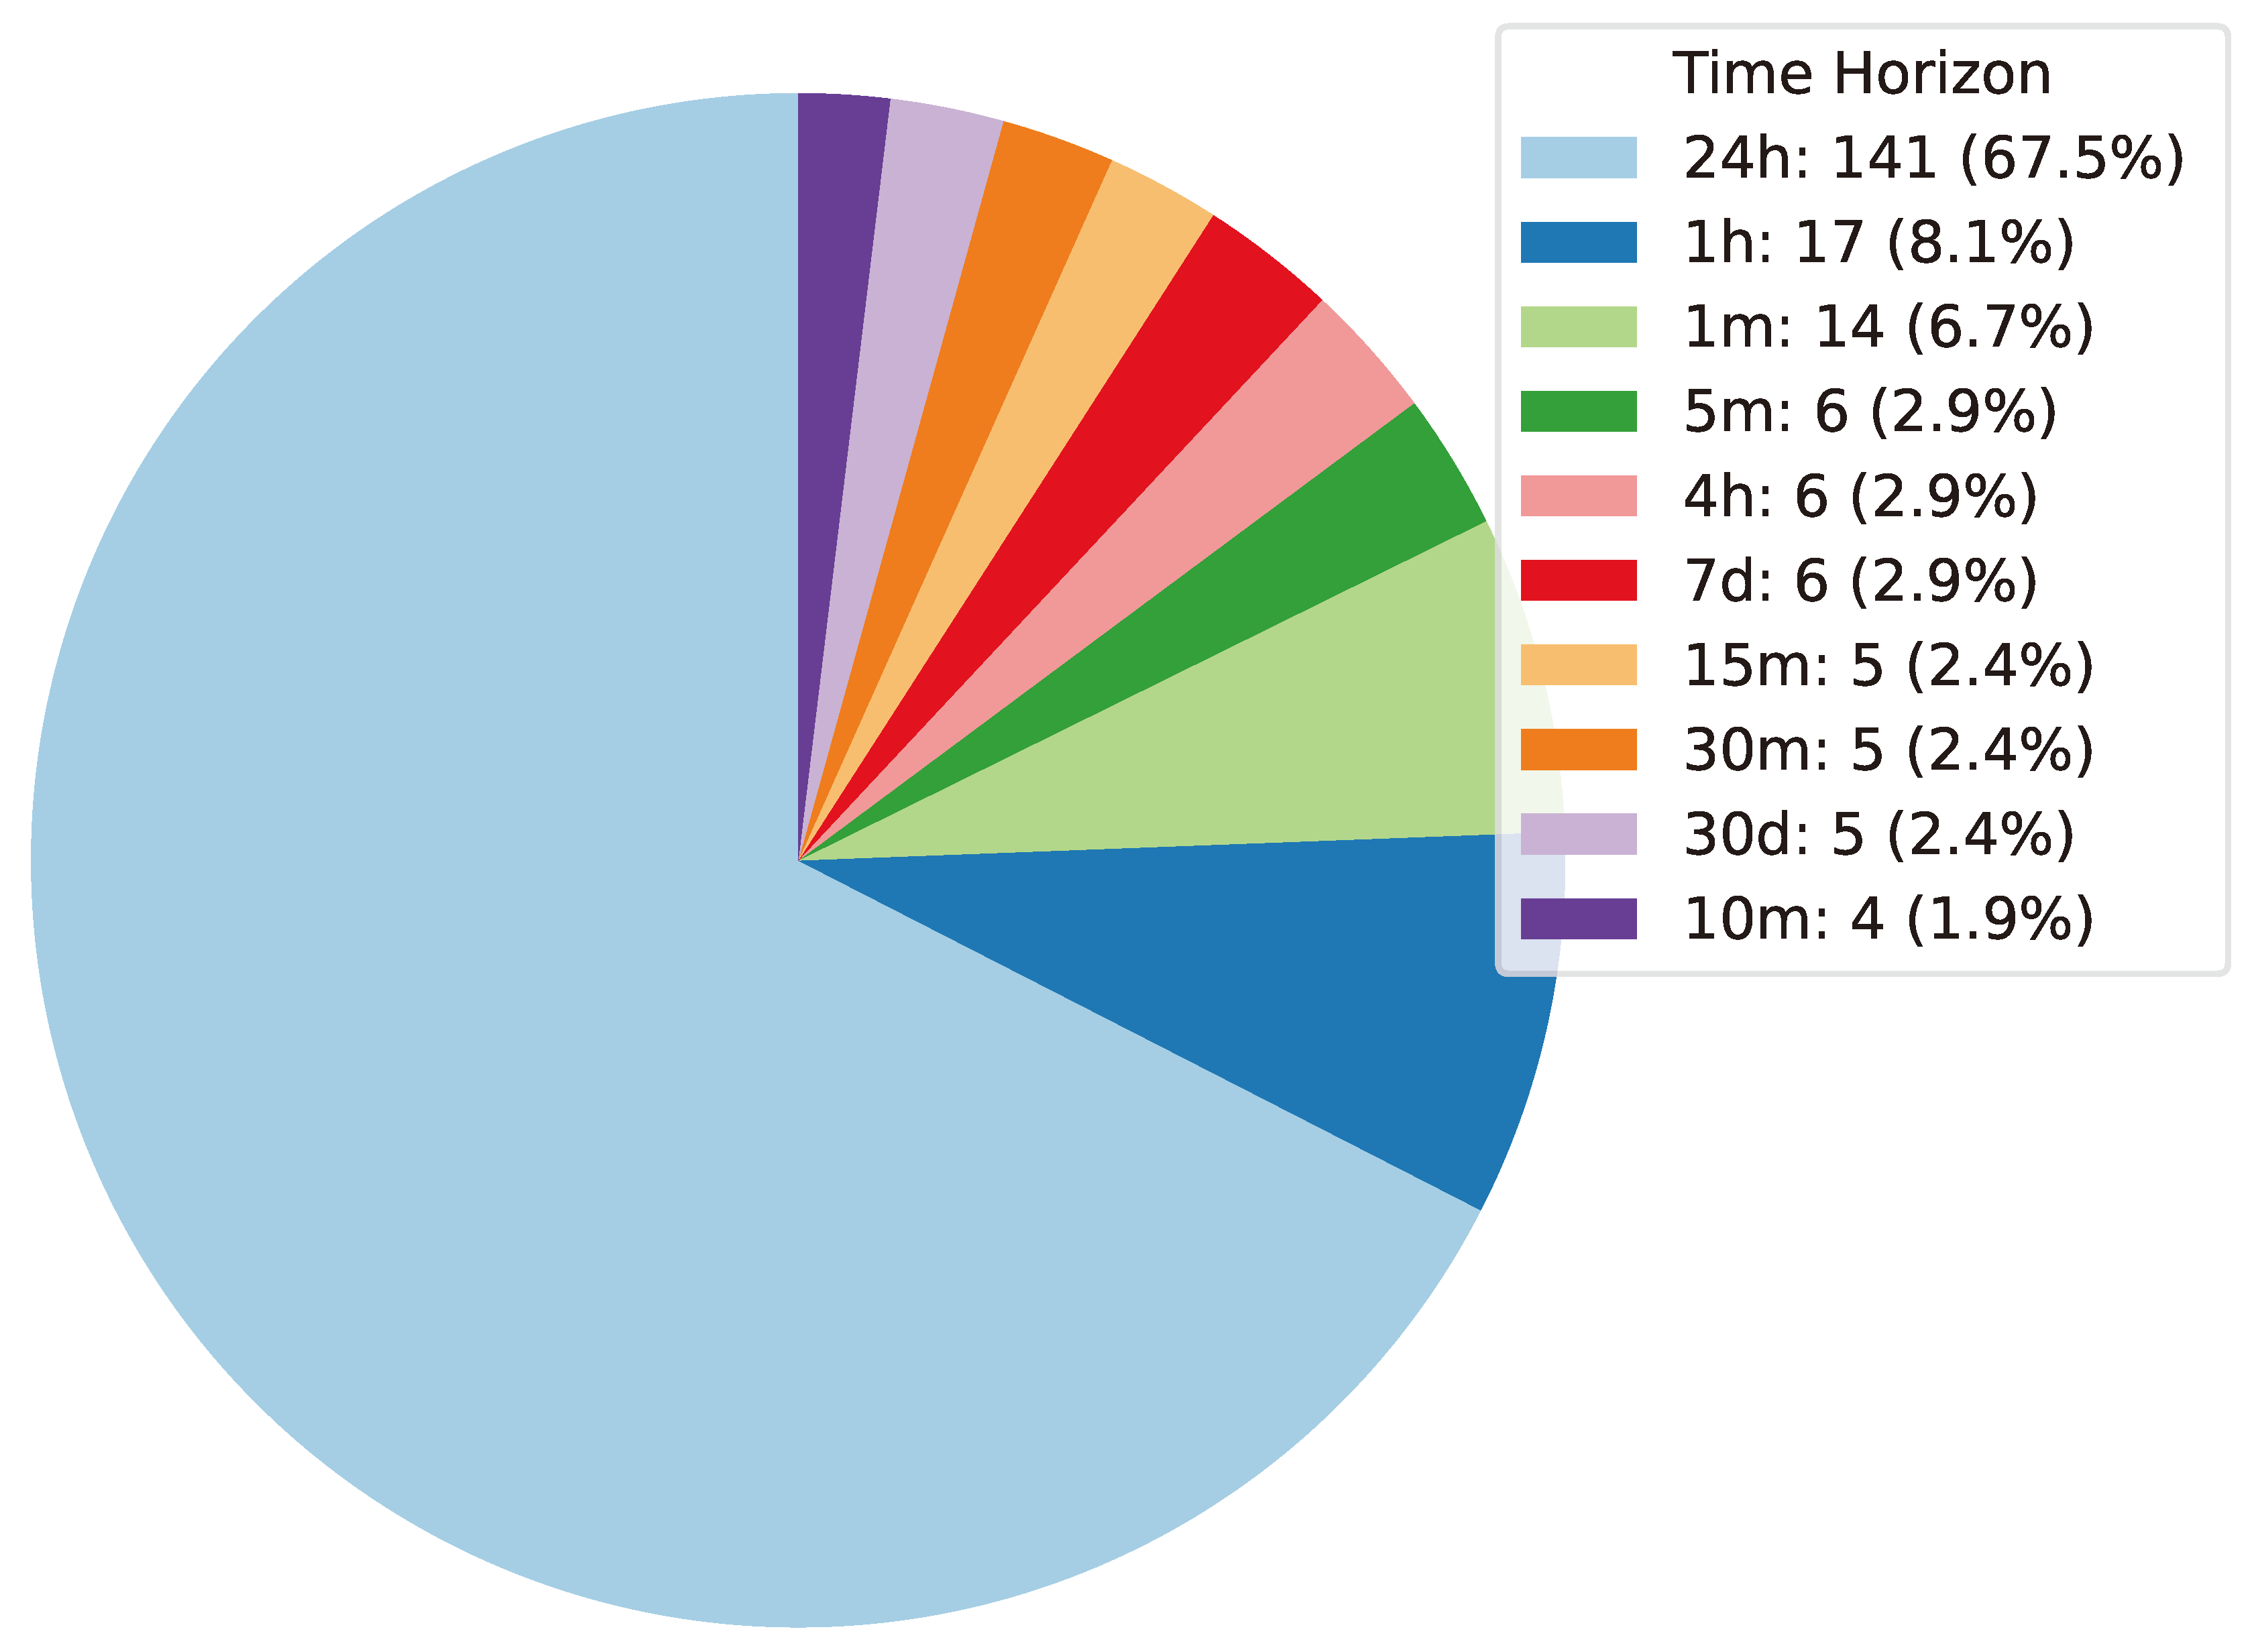
11.4. Evaluation Metrics Distribution Analysis
This section provides a comprehensive analysis of the evaluation metrics employed in the researched papers, emphasizing their crucial role in the field of cryptocurrency forecasting.
Figure 36 presents a bar chart where each bar symbolizes a specific evaluation metric, and its height quantifies the frequency of each metric across the studied research papers. The chart highlights that certain evaluation metrics such as RMSE, MAE, and MAPE were widely utilized in research papers for cryptocurrency forecasting.
Figure 36.
Bar chart illustrates the frequency of evaluation metrics across cryptocurrency forecasting research papers. Metrics like RMSE, MAE, and MAPE were prominently utilized in the surveyed papers, as indicated by the varying heights of the bars.
Figure 36.
Bar chart illustrates the frequency of evaluation metrics across cryptocurrency forecasting research papers. Metrics like RMSE, MAE, and MAPE were prominently utilized in the surveyed papers, as indicated by the varying heights of the bars.
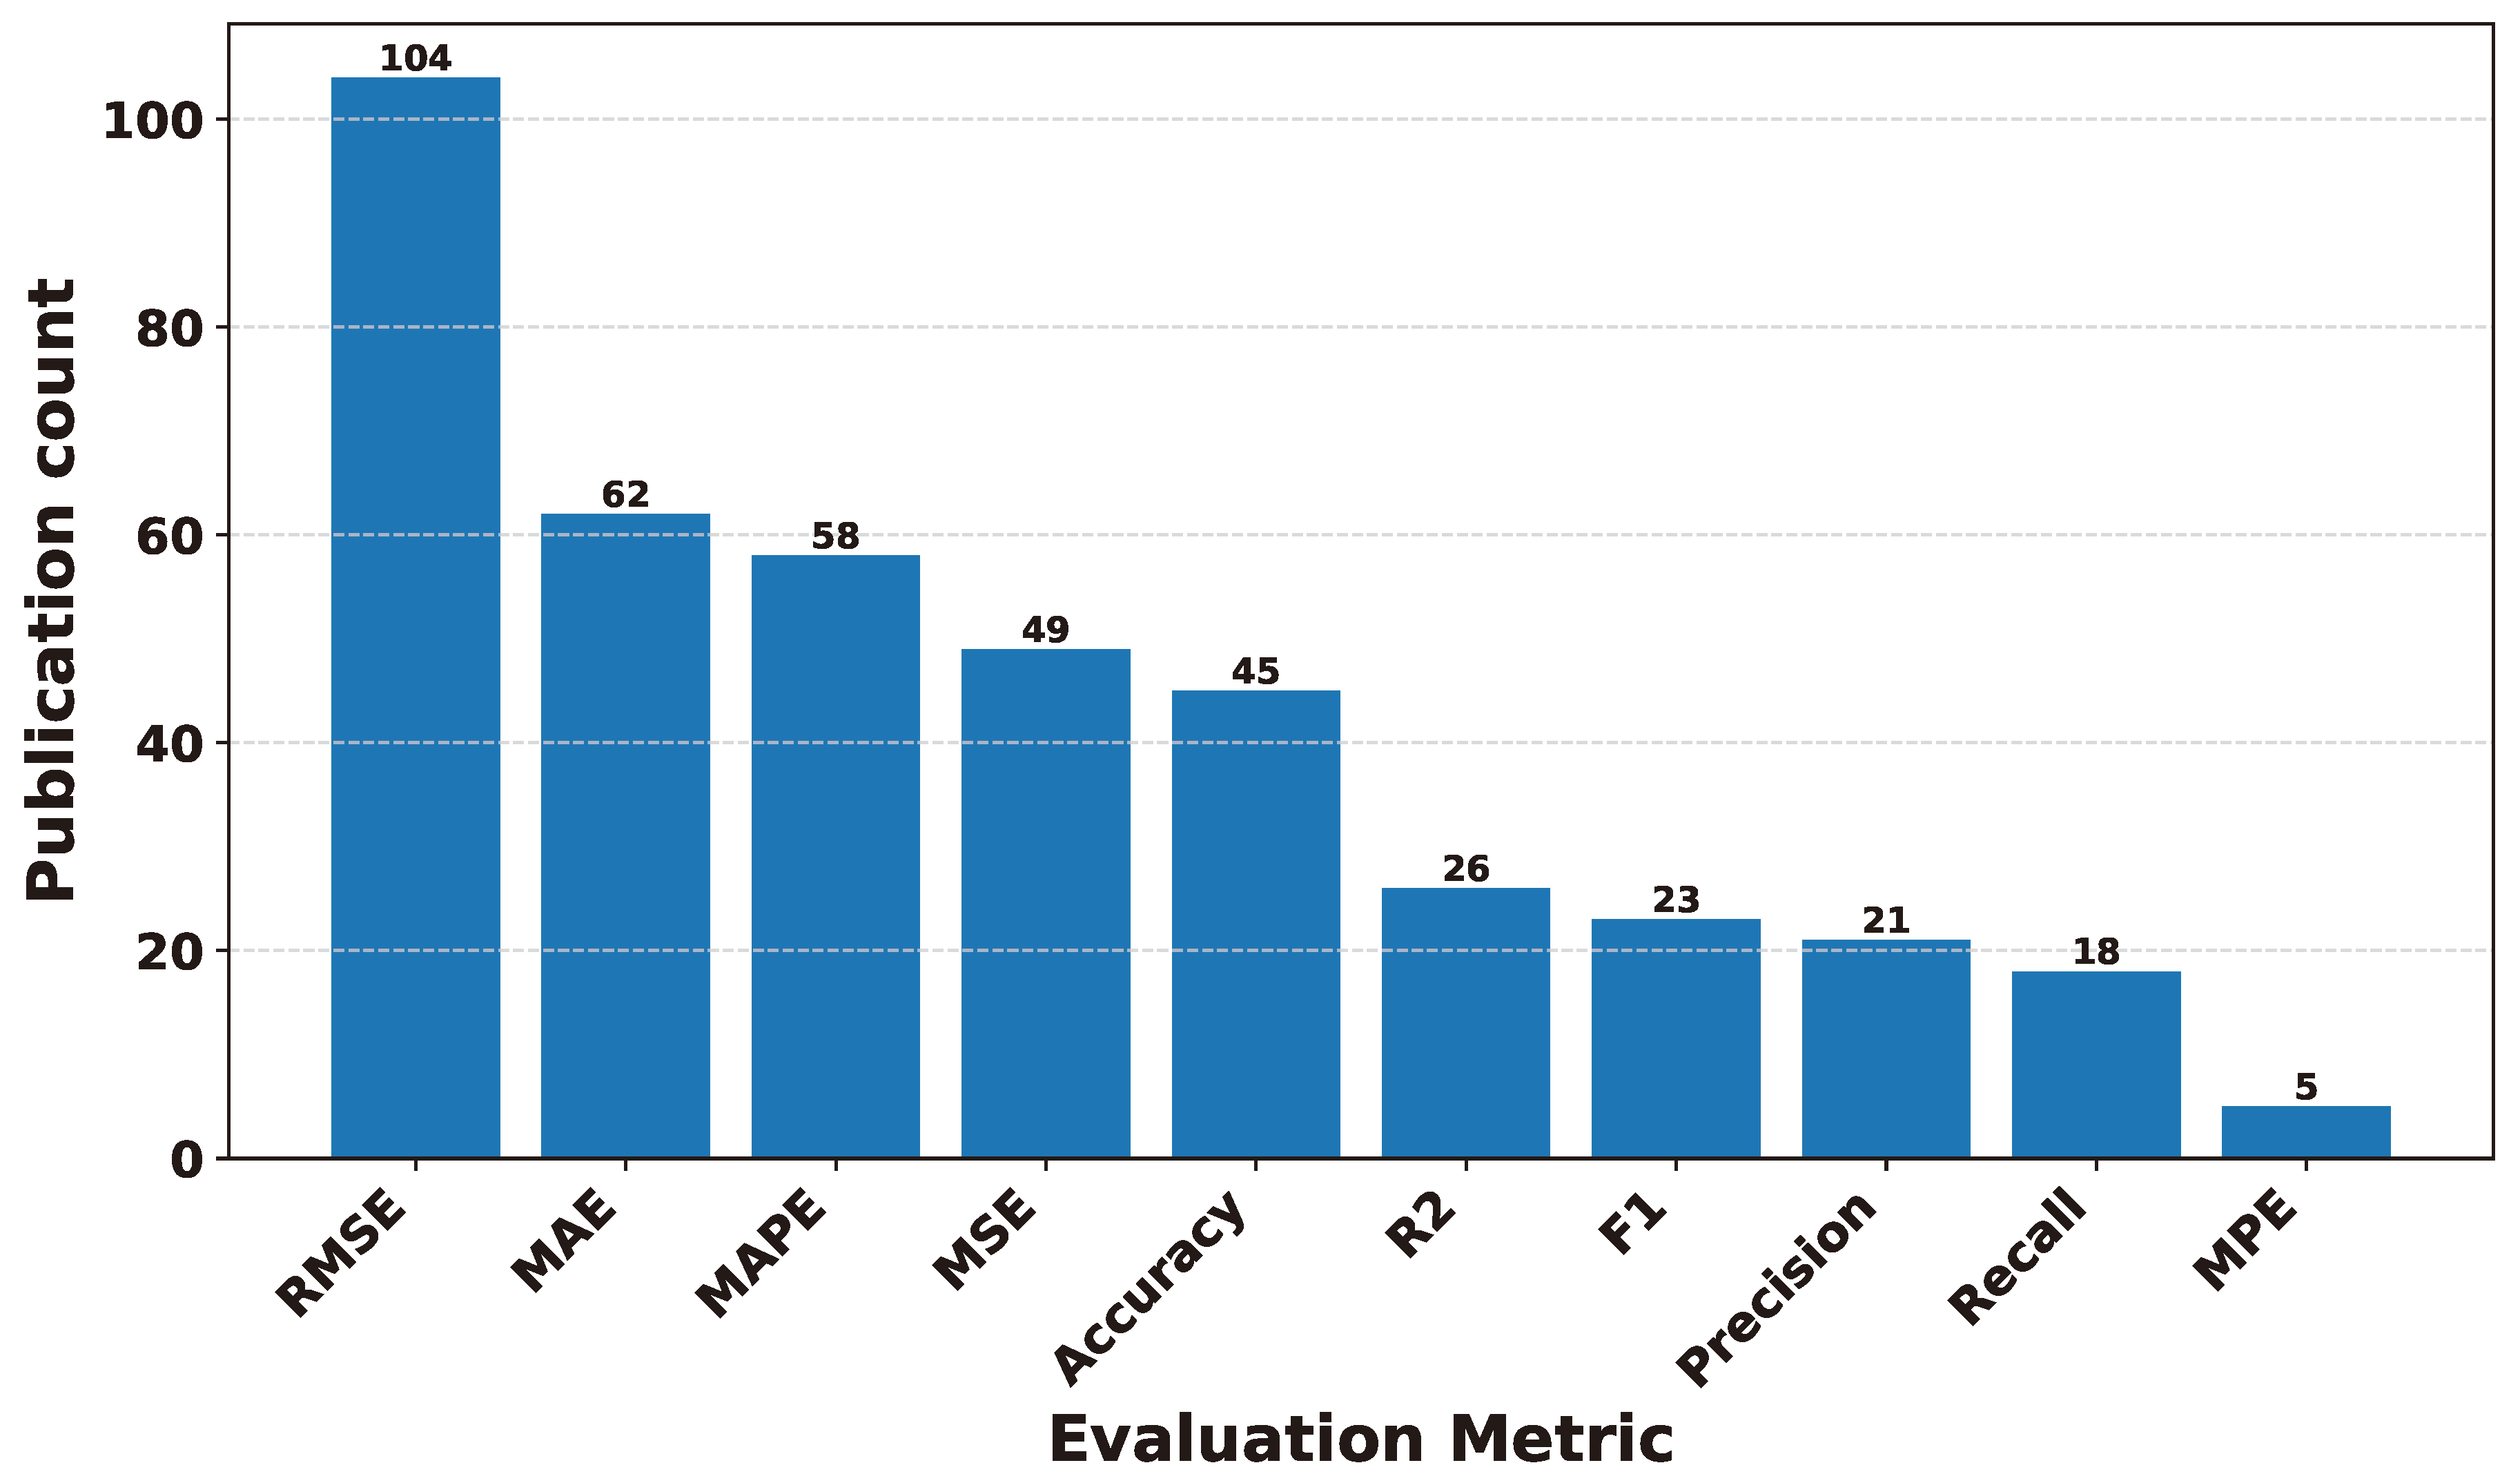
The pie chart in Figure 37 clearly illustrates the distribution of evaluation metrics used across a range of cryptocurrency forecasting research studies. With detailed attention to detail, the chart showcases the prevalence and significance of various metrics in this domain. Notably, the preeminent segment is occupied by the Root Mean Square Error, representing 25.3% of the distribution. RMSE, renowned for its ability to quantify the disparity between predicted and observed values, stands as a cornerstone metric in evaluating the predictive accuracy of forecasting models. Subsequently, the Mean Absolute Error closely follows, commanding a notable 15.1% share of the distribution. MAE’s prominence underscores its utility in providing insights into the average magnitude of errors present in forecasts, thus offering a straightforward measure of model performance.
Additionally, the Mean Absolute Percentage Error emerges as a pivotal metric, comprising 14.1% of the distribution. MAPE’s inclusion highlights its role in assessing forecast accuracy through the calculation of percentage deviations between predicted and actual values, thereby offering a comprehensive understanding of model performance across diverse scales and contexts.
Figure 37.
Pie chart depicts the percentage-wise distribution of evaluation metrics utilized in cryptocurrency forecasting research papers.
Figure 37.
Pie chart depicts the percentage-wise distribution of evaluation metrics utilized in cryptocurrency forecasting research papers.
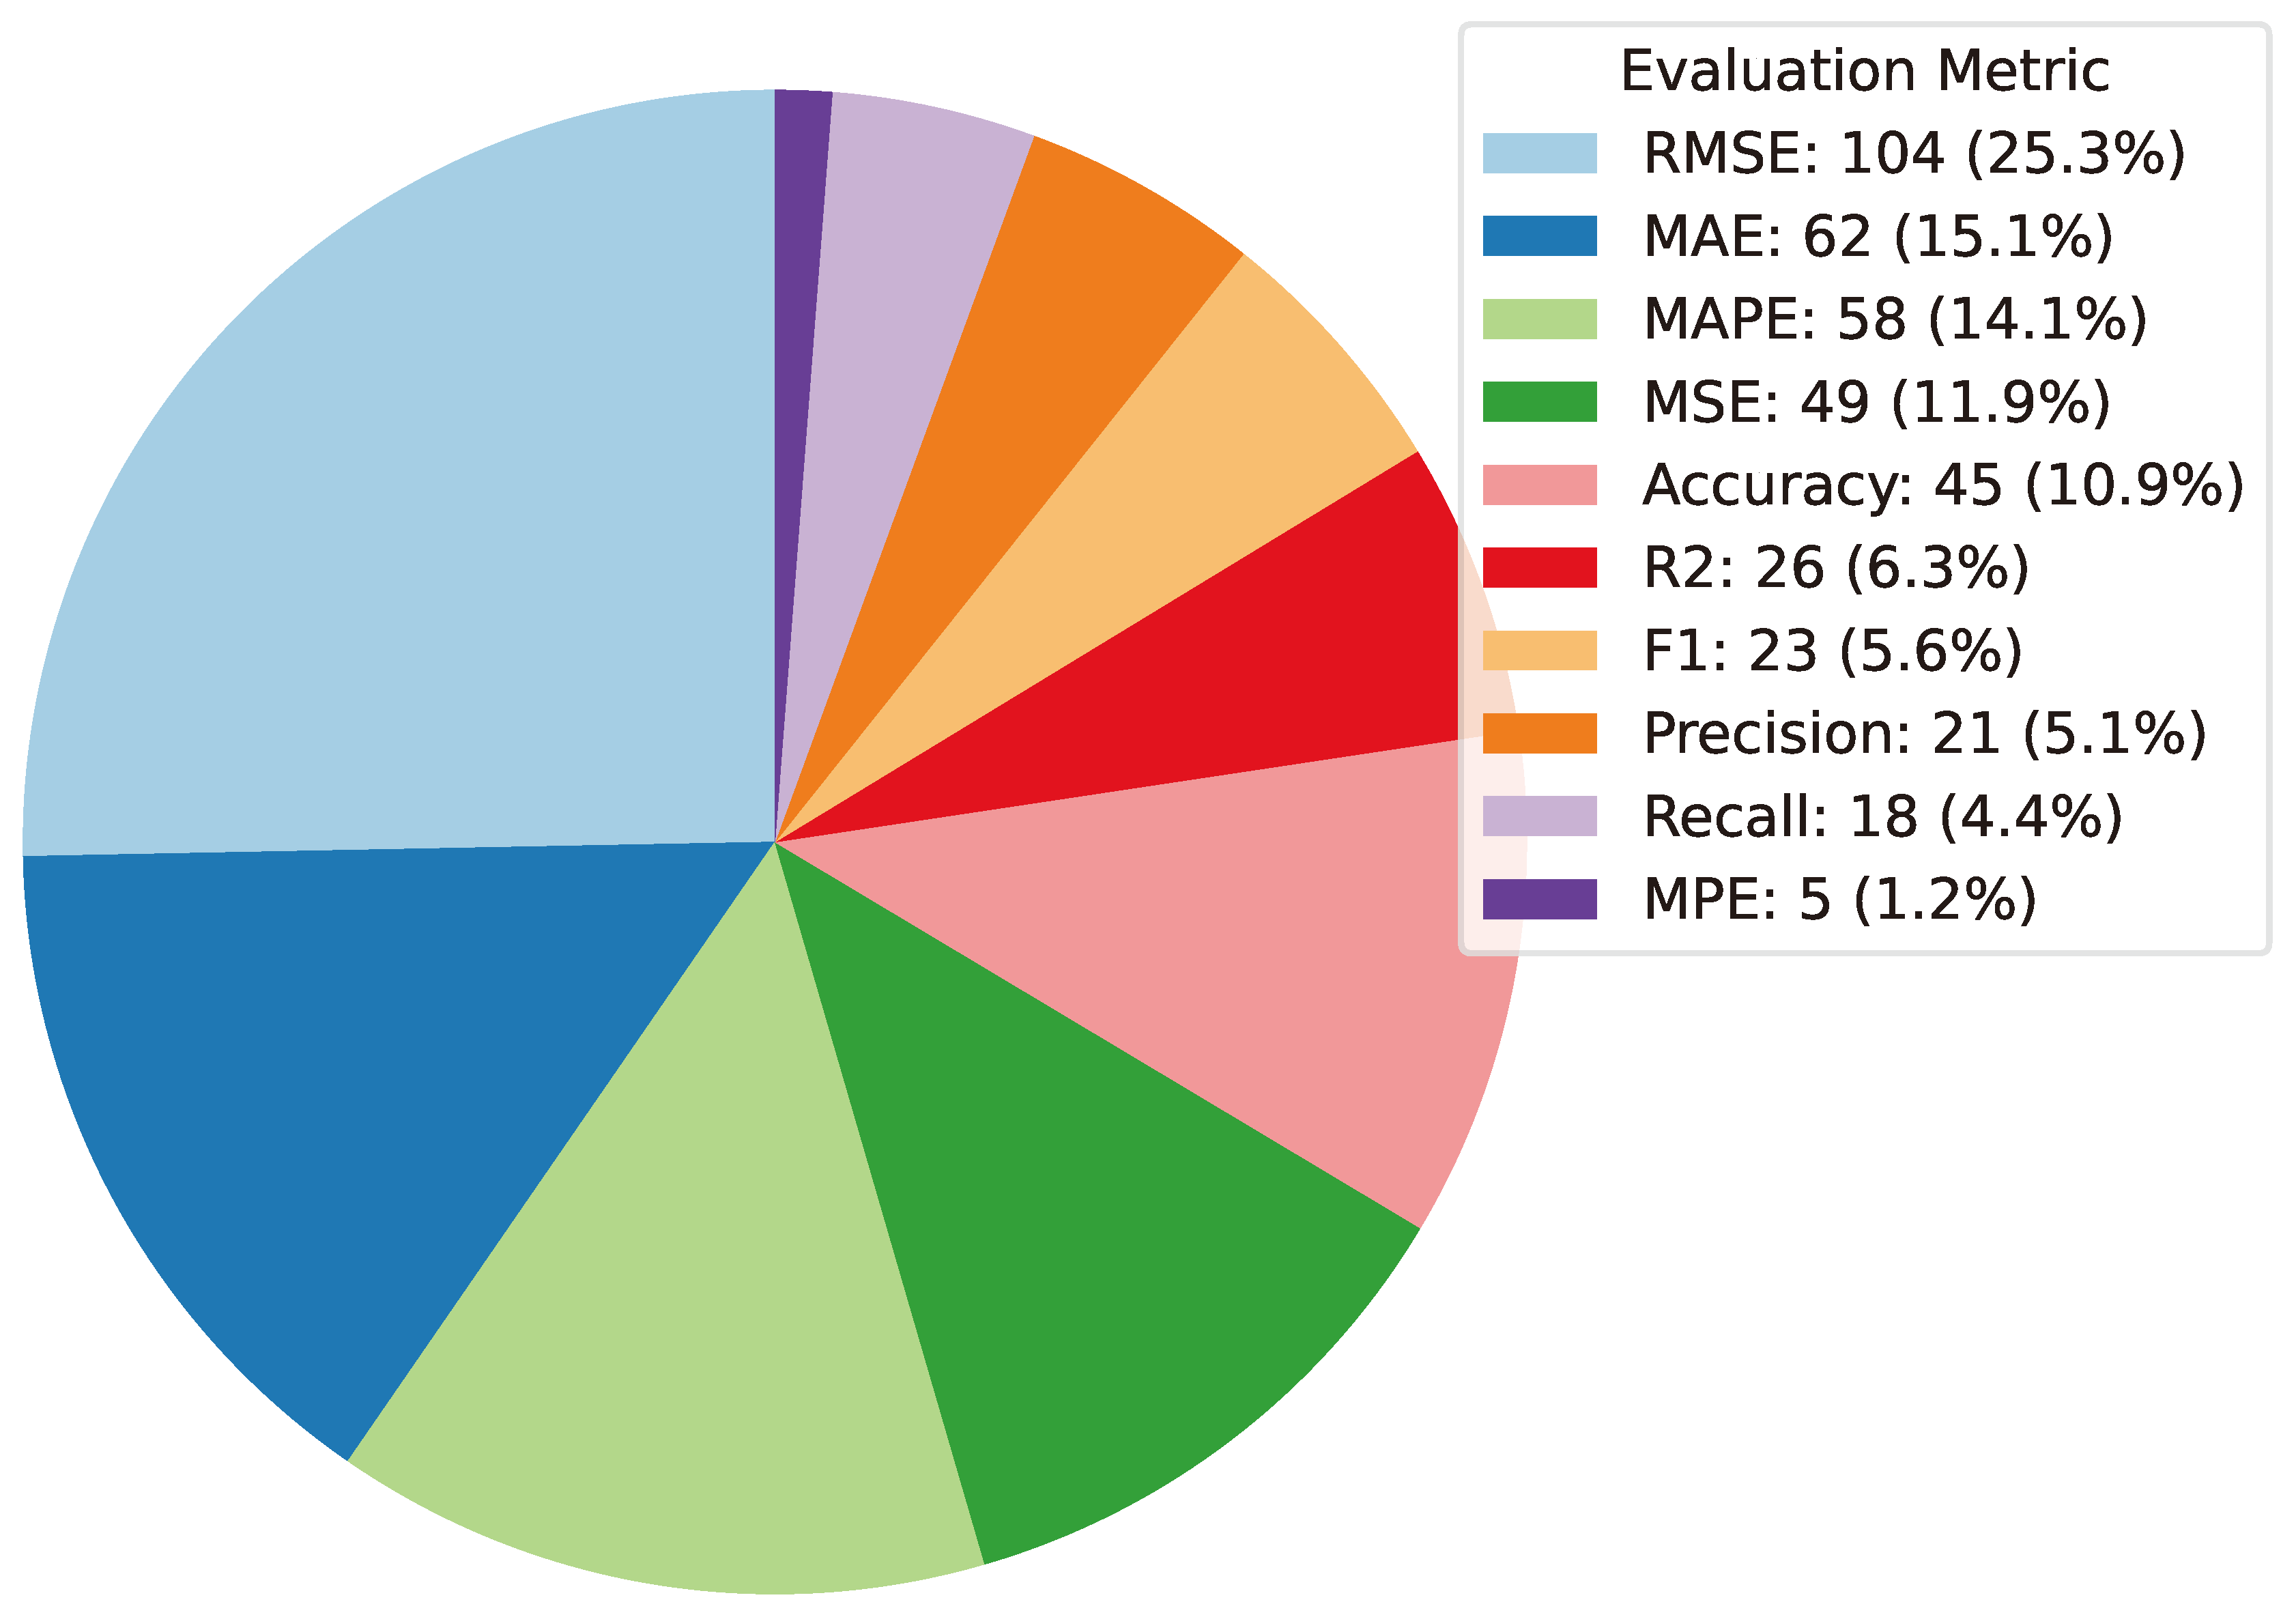
Figure 38 employs line charts to trace the fluctuating popularity of various evaluation metrics utilized in cryptocurrency forecasting research, delineated on an annual basis. The x-axis serves to represent the progression of years, while the y-axis quantifies the prevalence of each evaluatory metric within research papers. Noteworthy is the consistent prominence of RMSE, MAE, and MAPE across the temporal spectrum. These metrics exhibit a persistent pattern of dominance, consistently favored by researchers over successive years. Such steadfast prevalence underscores the enduring significance and reliability of RMSE, MAE, and MAPE in the evaluation of forecasting models within the cryptocurrency domain. This visual representation of yearly trends in metric preference provides valuable insights into the enduring methodologies and preferences shaping cryptocurrency forecasting research practices, offering a nuanced understanding of the evolving landscape in this dynamic field.
Figure 38.
Line charts to track the popularity of different evaluation metrics in cryptocurrency forecasting year by year. The x-axis represents years, and the y-axis represents the counts of each evaluatory metric used in research papers.
Figure 38.
Line charts to track the popularity of different evaluation metrics in cryptocurrency forecasting year by year. The x-axis represents years, and the y-axis represents the counts of each evaluatory metric used in research papers.
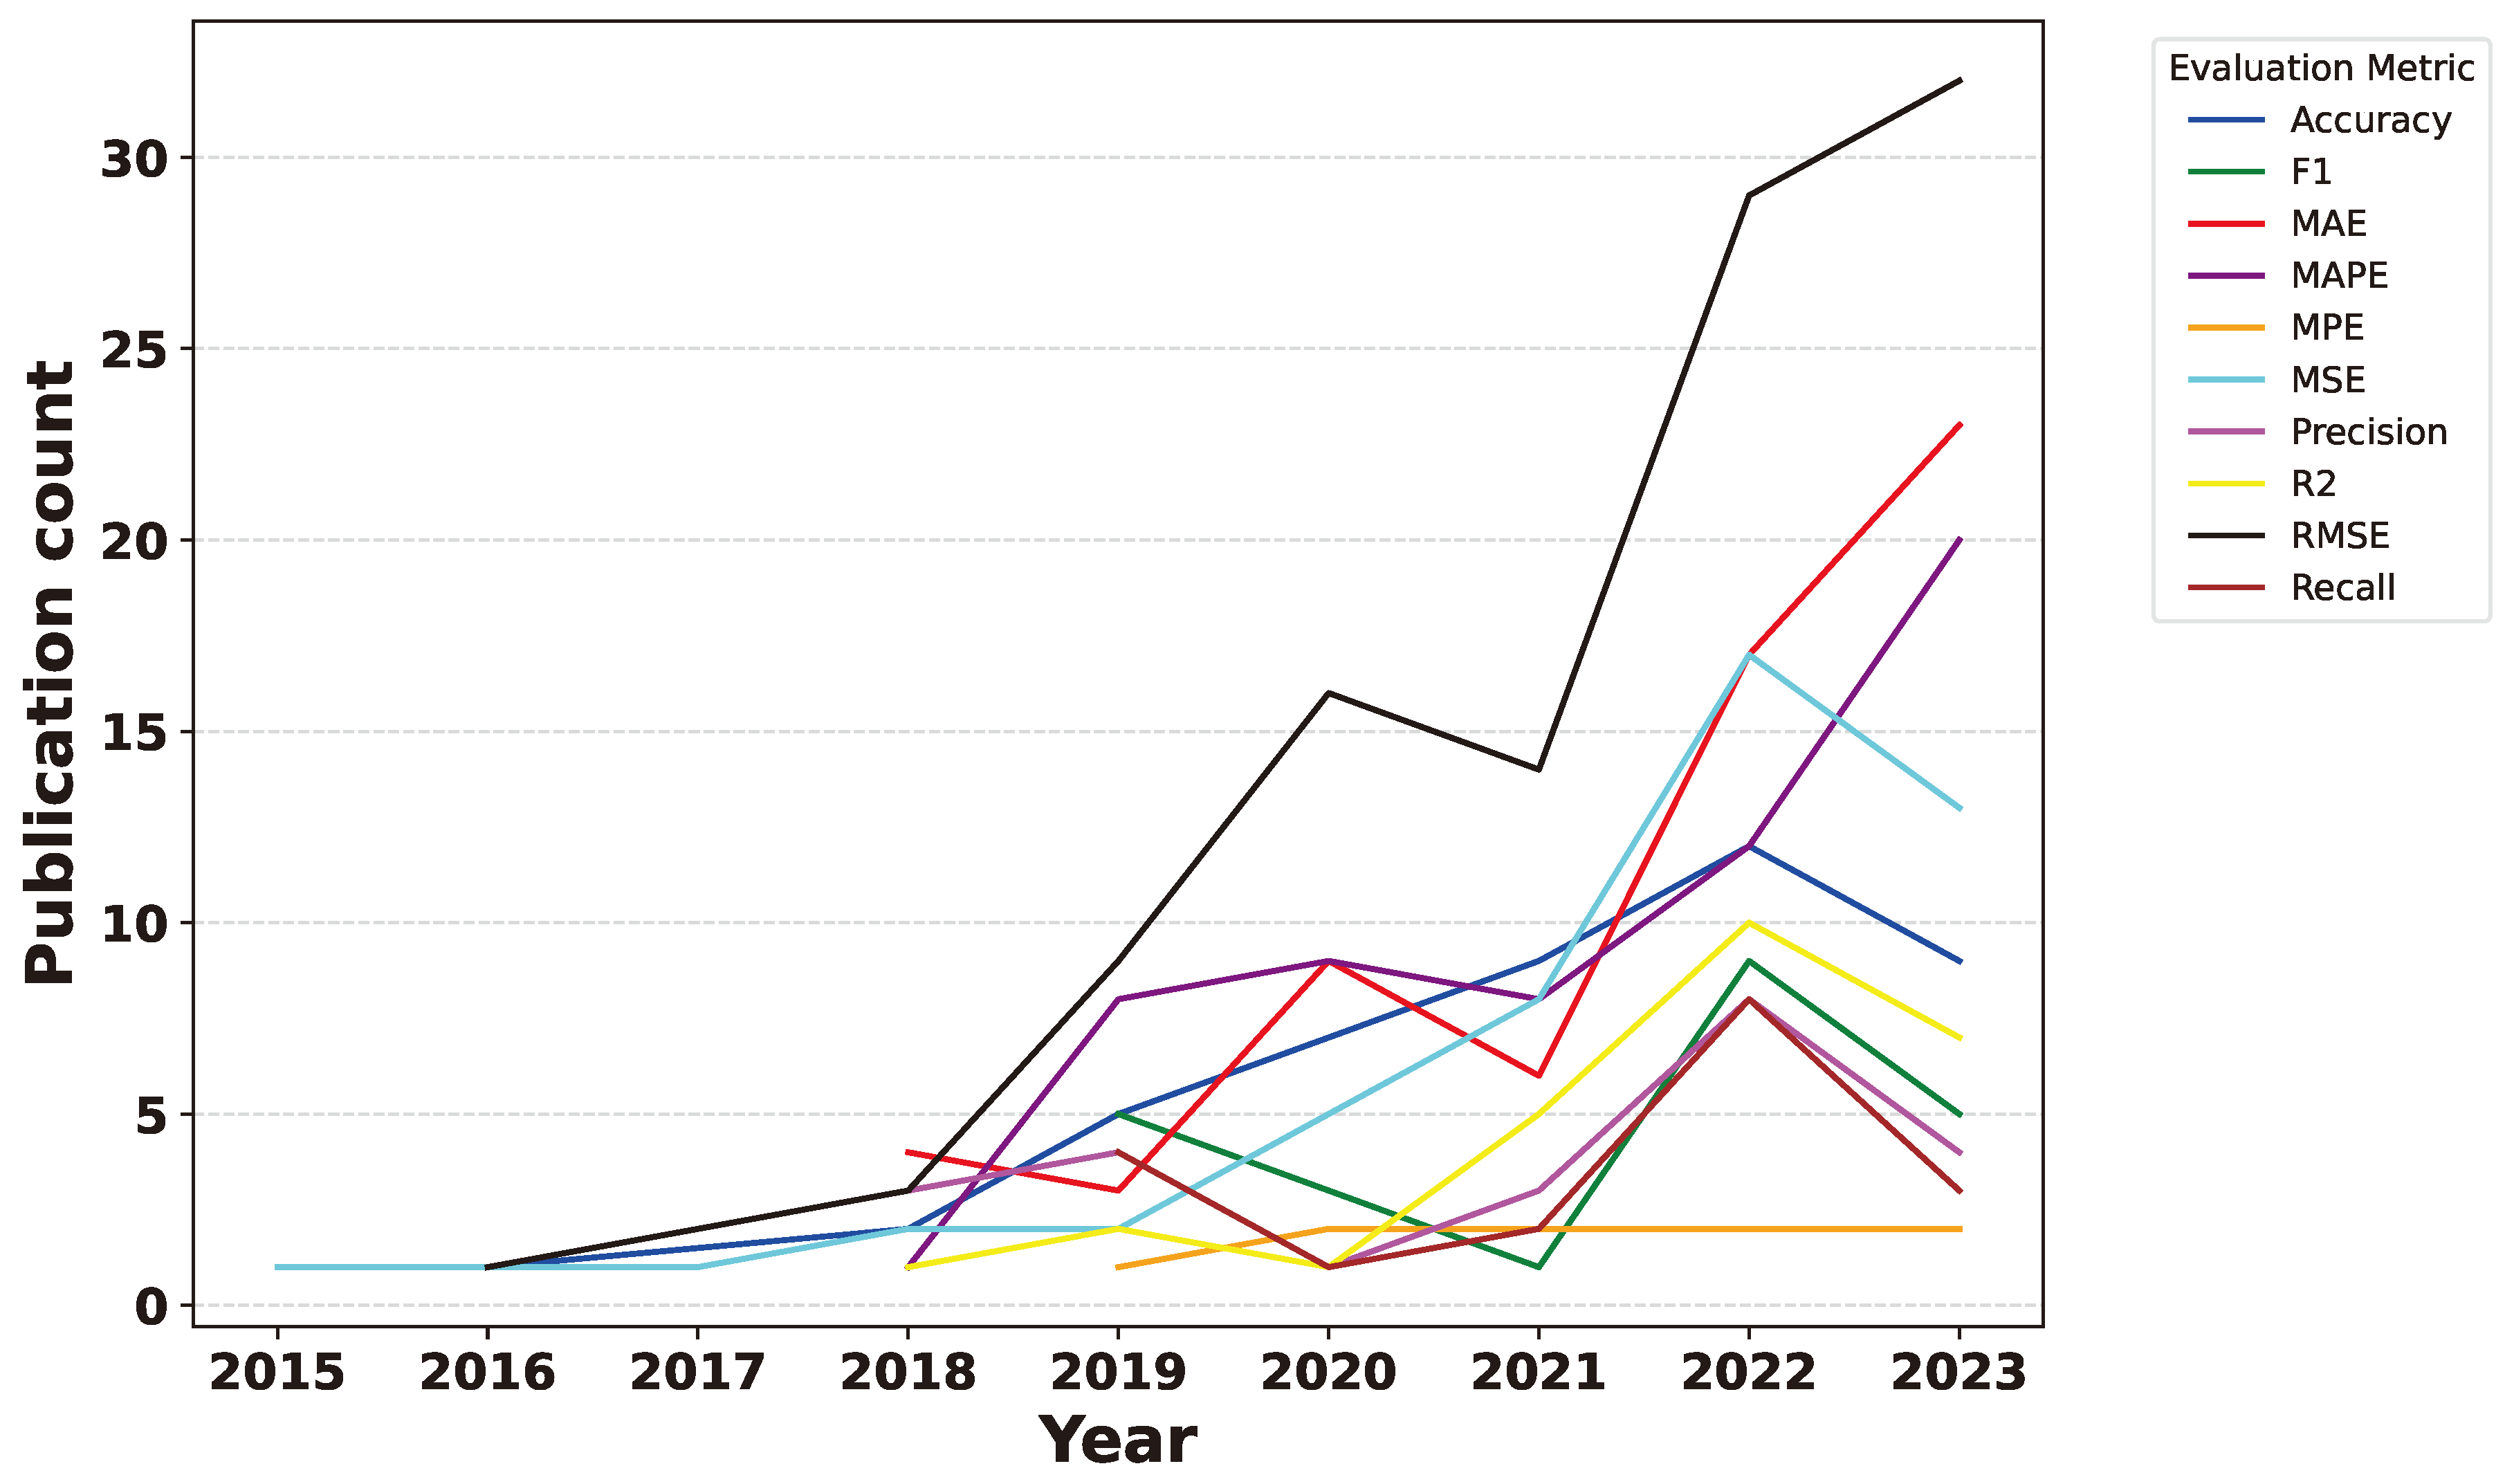
11.5. Input Feature Analysis
In this section, this survey paper will provide a detailed analysis of the input features used across all the research papers. To simplify this analysis, the survey categorizes input features into five different categories. If any research paper includes features that belong to any of the following categories, it will be categorized accordingly within the respective category. This categorization allows for a clear understanding of the prevalent input features used in cryptocurrency forecasting research.
- Price Data: This category includes historical prices of currencies like open, high, low, close, and volume (OHLCV). Researchers use this data to identify price trends and patterns that can assist in forecasting future price movements.
- Sentimental Data: Sentimental data holds information related to market sentiment, including social media sentiment analysis, news sentiment, and other sentiment indicators. Researchers leverage these sentiments to measure market sentiment and its potential impact on cryptocurrency prices.
- Technical Indicators: Technical indicators consist of various metrics and calculations used in technical analysis, such as moving averages, Relative Strength Index, and Moving Average Convergence Divergence. These indicators provide valuable insights into potential price movements.
- Blockchain Data: Blockchain data covers information extracted directly from blockchain networks, such as transaction volumes, block sizes, and other blockchain-specific metrics. Researchers examine this data to understand the underlying blockchain dynamics and its influence on cryptocurrency prices.
- External Economic Data: Factors that can impact cryptocurrency prices from outside sources are classified as external economic factors. These may include macroeconomic indicators, interest rates, and economic news events.
In Figure 39, an overview of the distribution of input categories utilized in cryptocurrency forecasting research is presented. The x-axis delineates the various input categories, while the y-axis quantifies the frequency of each category’s usage across research papers. Remarkably, the graph highlights a predominant reliance on price data among researchers, signifying its widespread usage as a primary input category. Following closely behind price data, sentimental data emerges as the second most utilized category, suggesting its considerable importance in shaping forecasting models. Moreover, technical indicators rank third in terms of utilization, reflecting their significant role in informing predictive analyses within the cryptocurrency domain. This visualization offers valuable insights into the prevailing methodologies and priorities guiding cryptocurrency forecasting research, showcasing the diverse array of input categories leveraged by researchers to enhance forecasting accuracy and robustness.
Figure 39.
Distribution of input categories across research papers is depicted. The x-axis denotes the input categories, while the y-axis represents the count of each category used in the research papers.
Figure 39.
Distribution of input categories across research papers is depicted. The x-axis denotes the input categories, while the y-axis represents the count of each category used in the research papers.
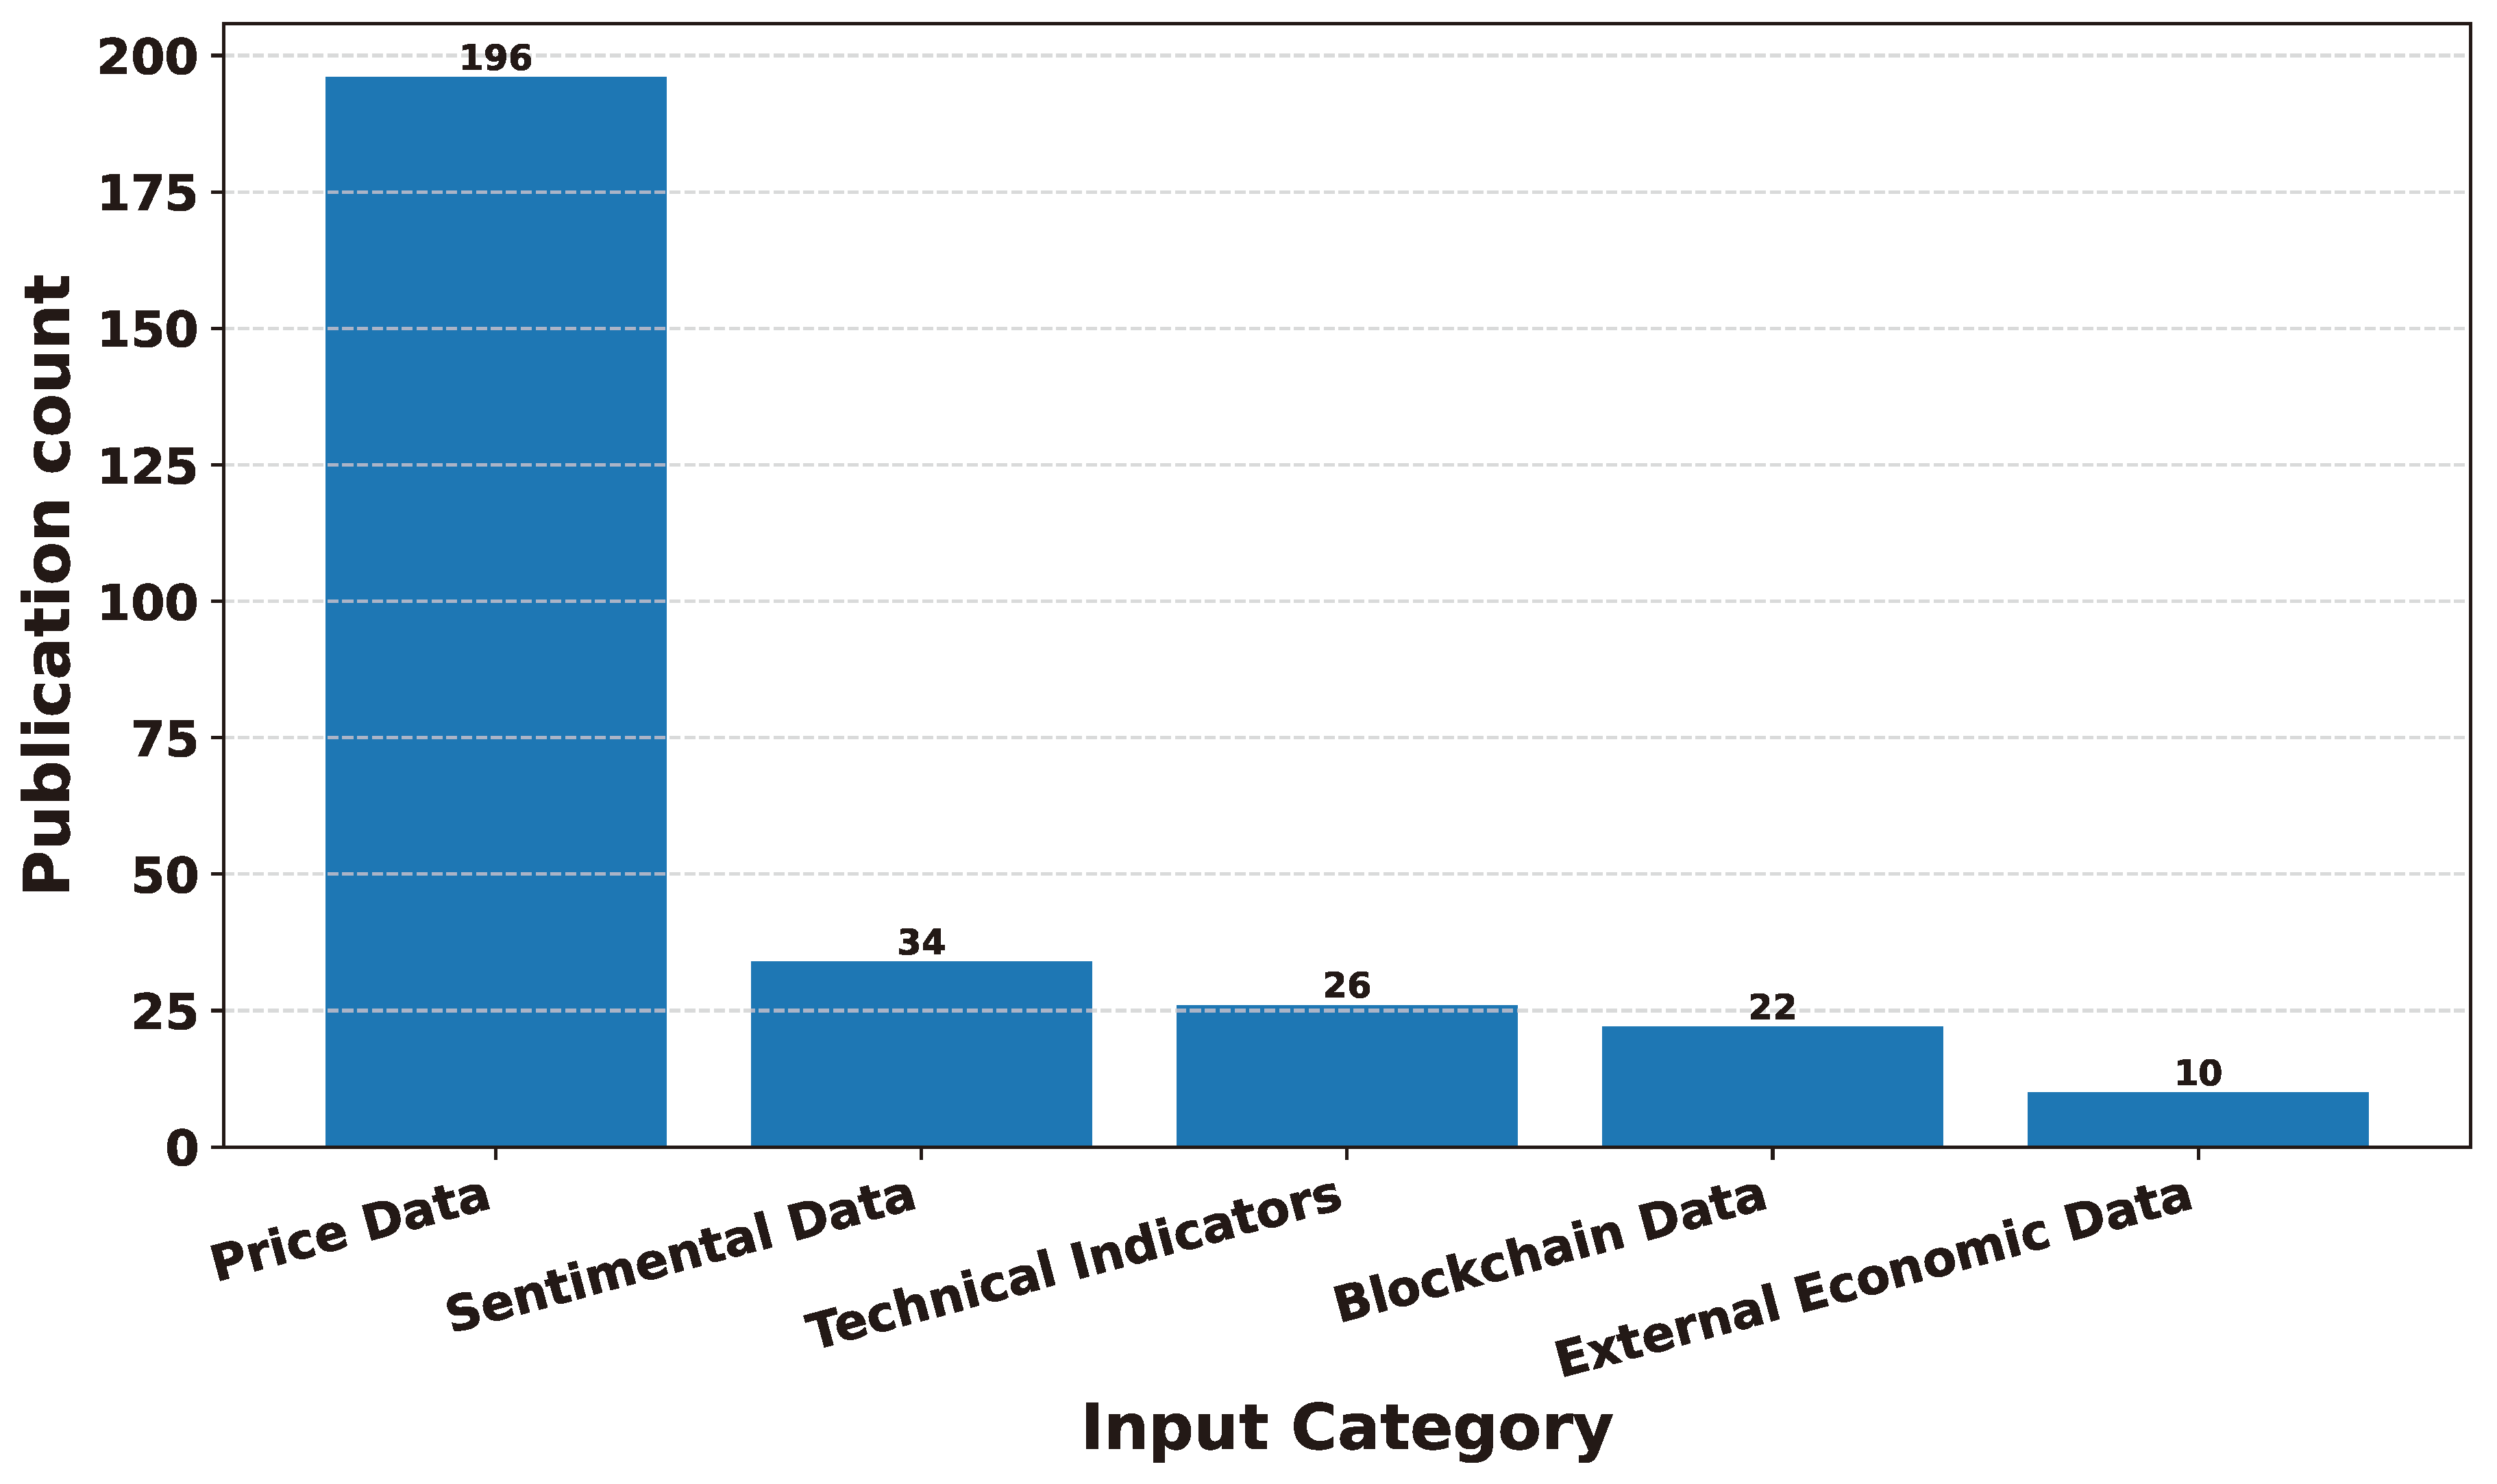
In Figure 40 provides a percentage-wise distribution of input feature categories across the research papers studied in this survey. The chart reveals that the majority of the input features fall under the price data category, constituting a substantial portion of approximately 68.1%. Following closely is the sentimental data category, comprising around 11.8% of the total input features. Technical Indicators make up 9.19% of the input features, while blockchain data accounts for 7.6%. Lastly, the external economic category represents approximately 3.5% of the input features. This visualization shows the majority of each input feature category, highlighting the significant role of historical price data in cryptocurrency forecasting research.
Figure 40.
Pie chart illustrates the percentage-wise distribution of input feature categories in cryptocurrency forecasting research papers.
Figure 40.
Pie chart illustrates the percentage-wise distribution of input feature categories in cryptocurrency forecasting research papers.
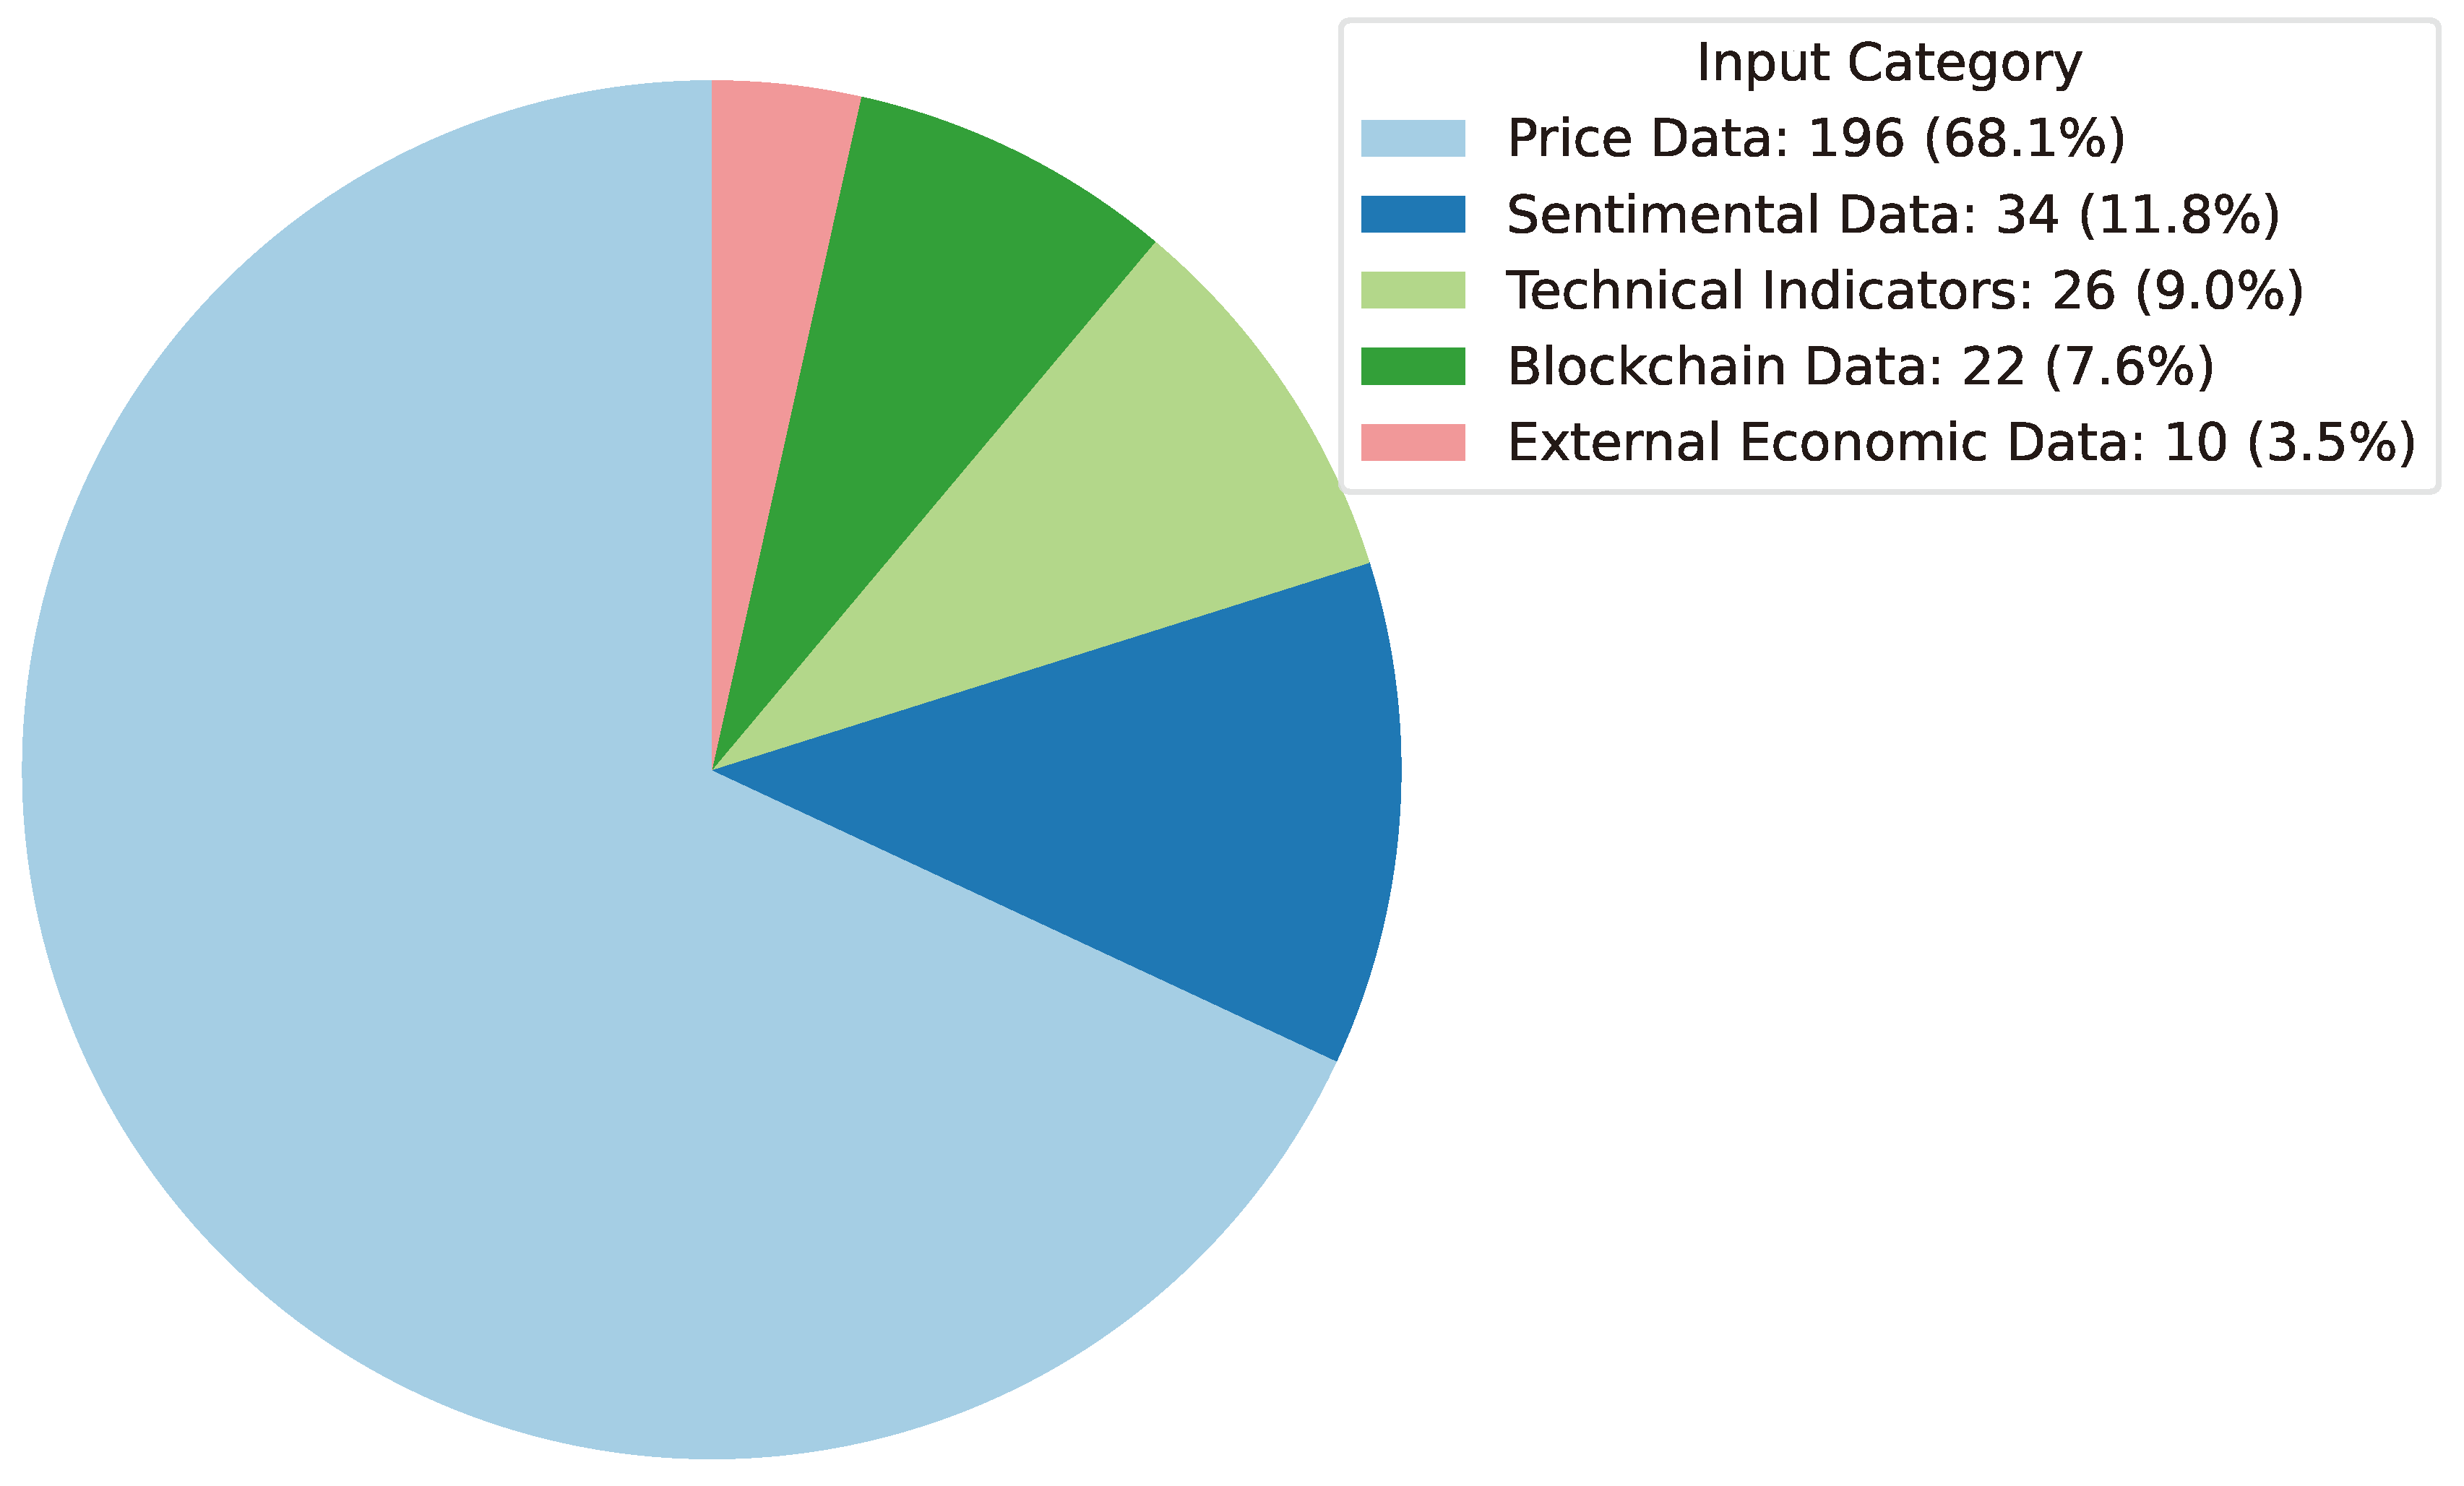
11.6. Currency Analysis
In this section, this research survey will cover a detailed examination of the cryptocurrencies that have been the focal point of analysis in the research papers under consideration. Cryptocurrency markets are diverse, with numerous digital assets available for trading and investment. Researchers often select particular cryptocurrencies for their analyses, driven by factors such as market capitalization, popularity, or unique characteristics of the chosen digital currencies. This section will shed light on which cryptocurrencies have garnered the most attention and analysis within the corpus of research papers, providing insights into the preferences and priorities of cryptocurrency researchers.
In Figure 41, the survey will present a visual representation of the distribution of research papers across various cryptocurrencies. Each bar in the chart corresponds to a specific digital currency, and the height of the bar represents the count of research papers that have focused on that particular cryptocurrency forecasting research. As illustrated in the chart, Bitcoin stands out prominently with the highest bar, signifying that it has been the subject of extensive research and analysis in the surveyed papers. Ether follows closely behind as the second most studied cryptocurrency, with a substantial number of research papers dedicated to its analysis. Ripple and Litecoin also make notable appearances in the chart, signifying their significance in the realm of cryptocurrency forecasting research. This bar chart offers a quick and informative overview of the distribution of research attention among different cryptocurrencies. It highlights the dominance of Bitcoin and the presence of other prominent digital assets in the cryptocurrency research landscape.
Figure 41.
Bar chart visually represents the distribution of research papers across various cryptocurrencies. Each bar corresponds to a specific digital currency, with the height indicating the count of research papers focused on that cryptocurrency.
Figure 41.
Bar chart visually represents the distribution of research papers across various cryptocurrencies. Each bar corresponds to a specific digital currency, with the height indicating the count of research papers focused on that cryptocurrency.
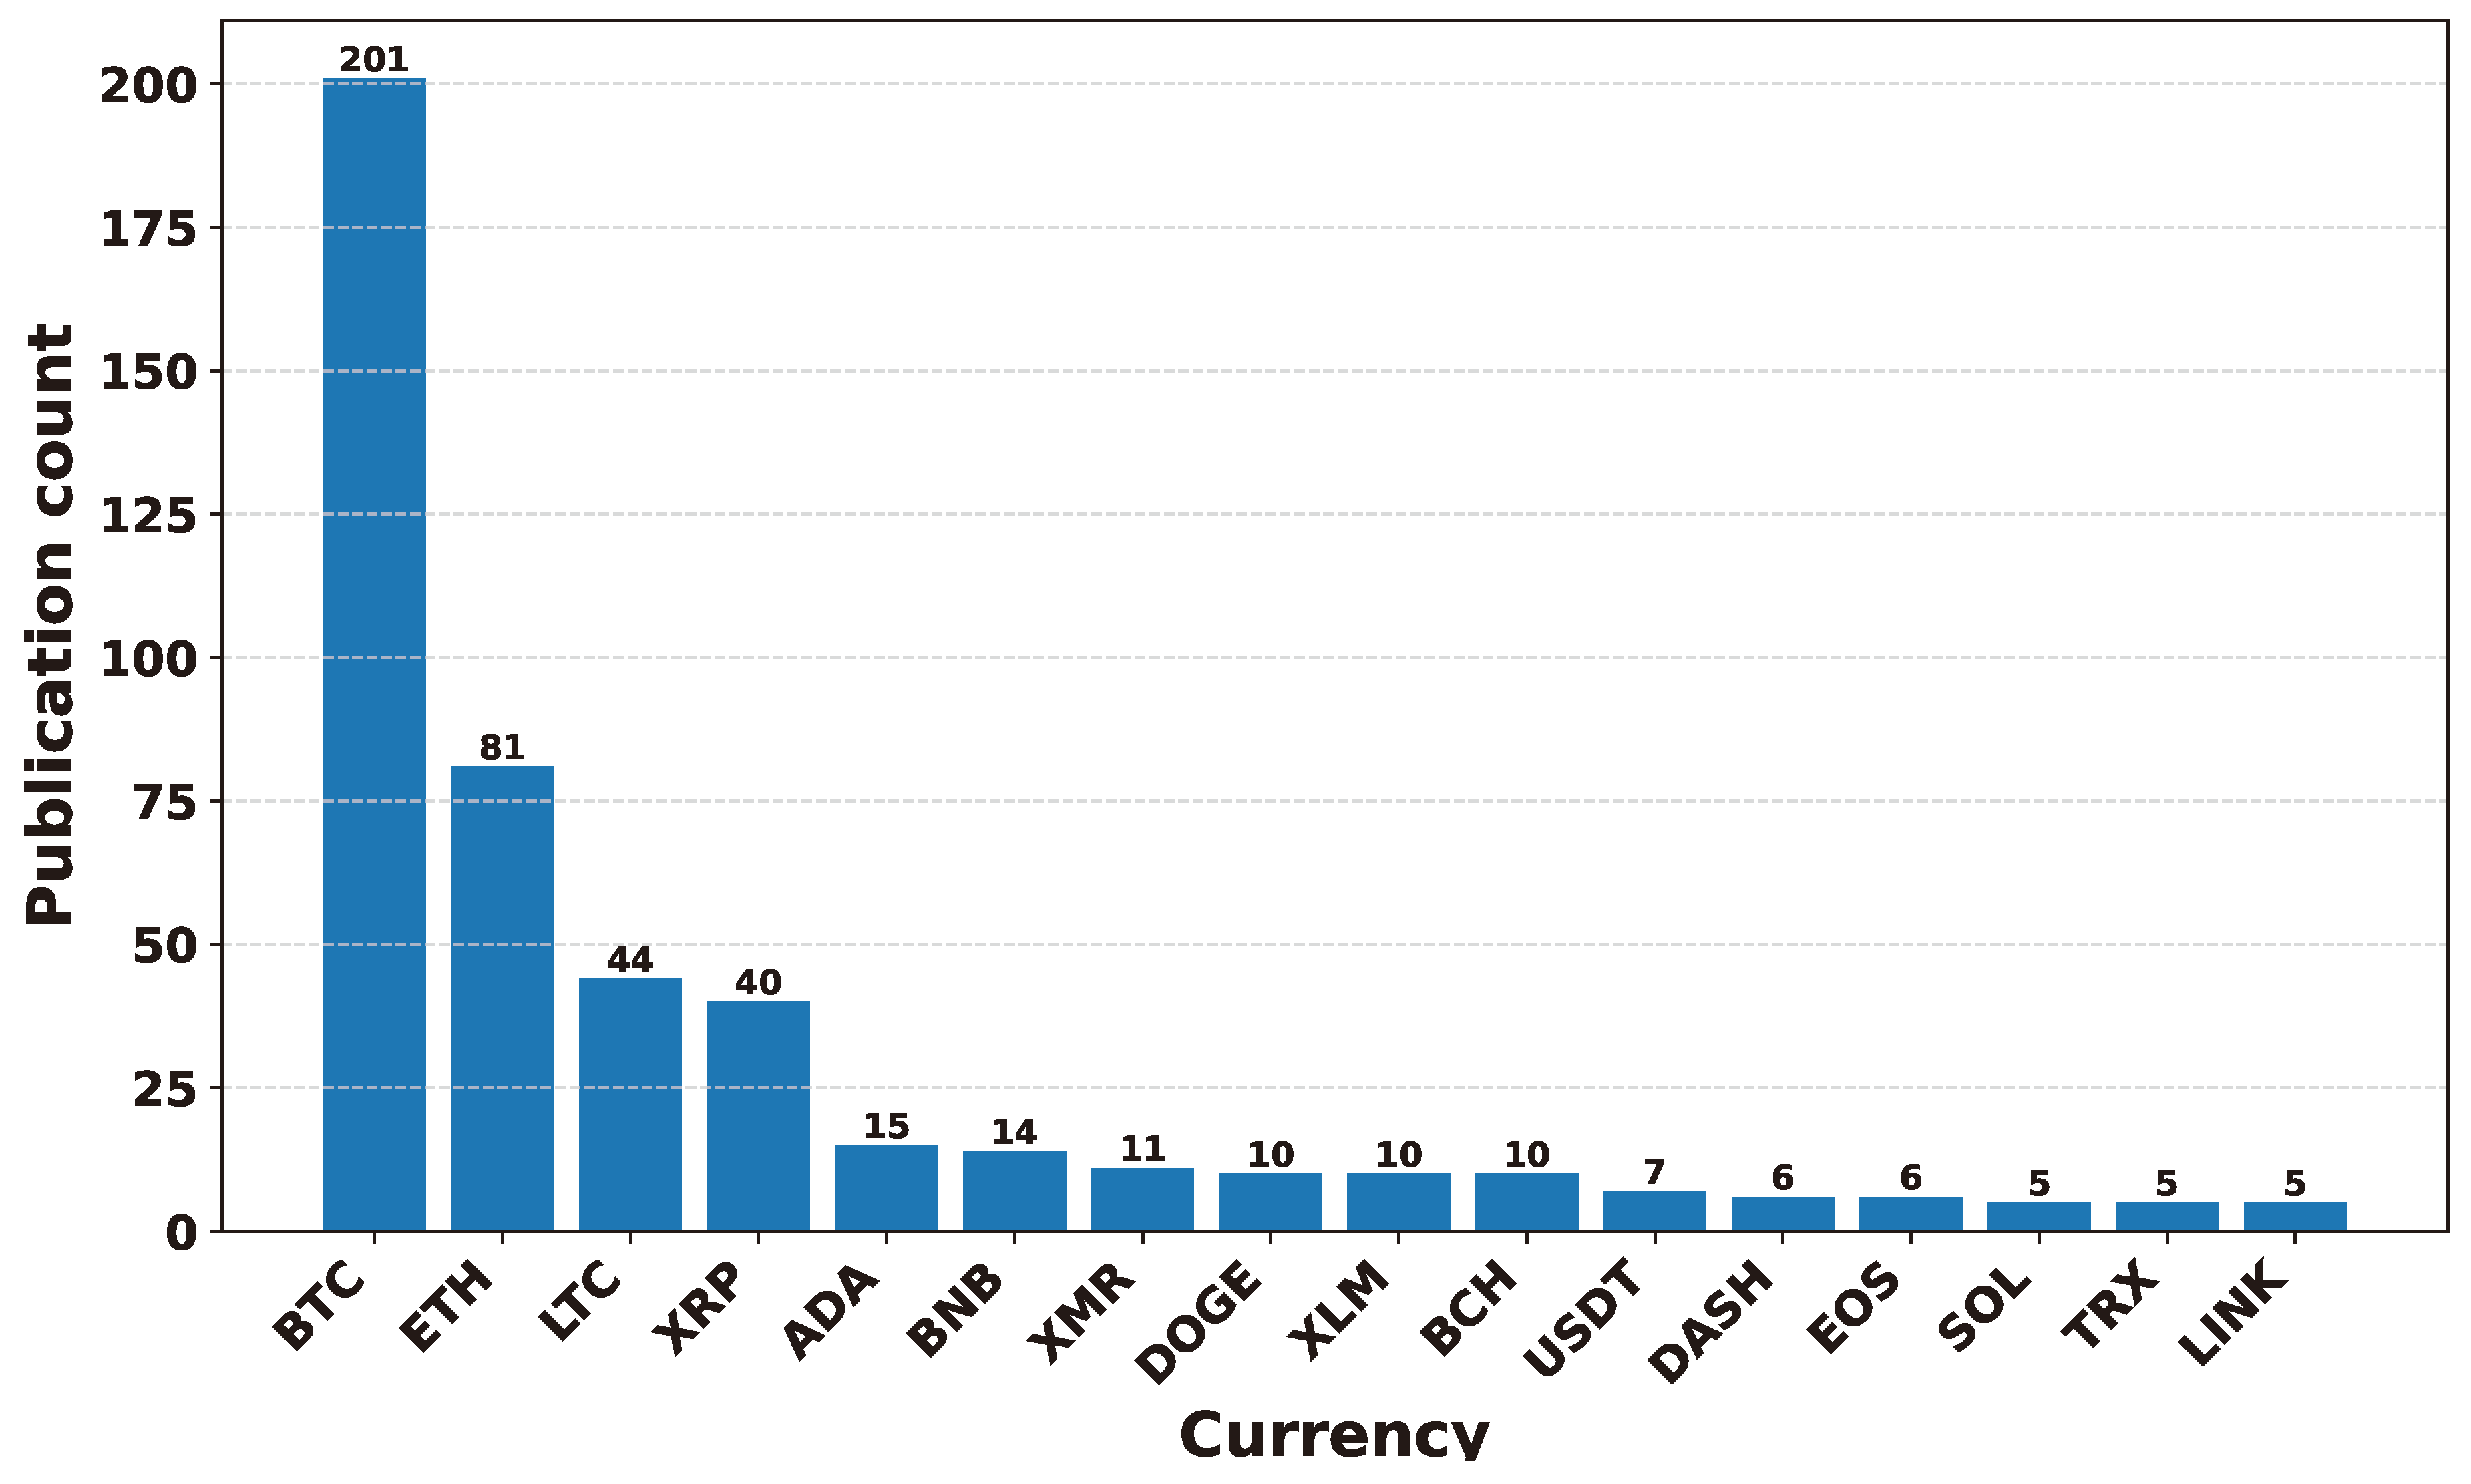
In Figure 42 graphical representation of the percentage-wise distribution of research papers across various cryptocurrencies. Each slice of the pie corresponds to a specific digital currency, and its size is proportional to the percentage of research papers focused on that particular cryptocurrency. As evident from the chart, Bitcoin commands the largest portion of the pie, constituting approximately 46.1% of the research papers in the surveyed corpus. Ether claims the second-largest slice, describing a significant 18.6% of the research papers. Ripple and Litecoin also maintain notable shares, comprising approximately 10.1% and 9.2%, respectively, of the total research papers. This pie chart offers a clear visualization of the distribution of research emphasis among different cryptocurrencies. It highlights the prevalent position of Bitcoin while acknowledging the significant presence of other cryptocurrencies, such as Ether, Ripple, and Litecoin, in the cryptocurrency research landscape.
Figure 42.
Pie chart visually depicts the percentage-wise distribution of research papers across various cryptocurrencies. Each slice represents a specific digital currency, with its size proportional to the percentage of research papers focused on that cryptocurrency.
Figure 42.
Pie chart visually depicts the percentage-wise distribution of research papers across various cryptocurrencies. Each slice represents a specific digital currency, with its size proportional to the percentage of research papers focused on that cryptocurrency.
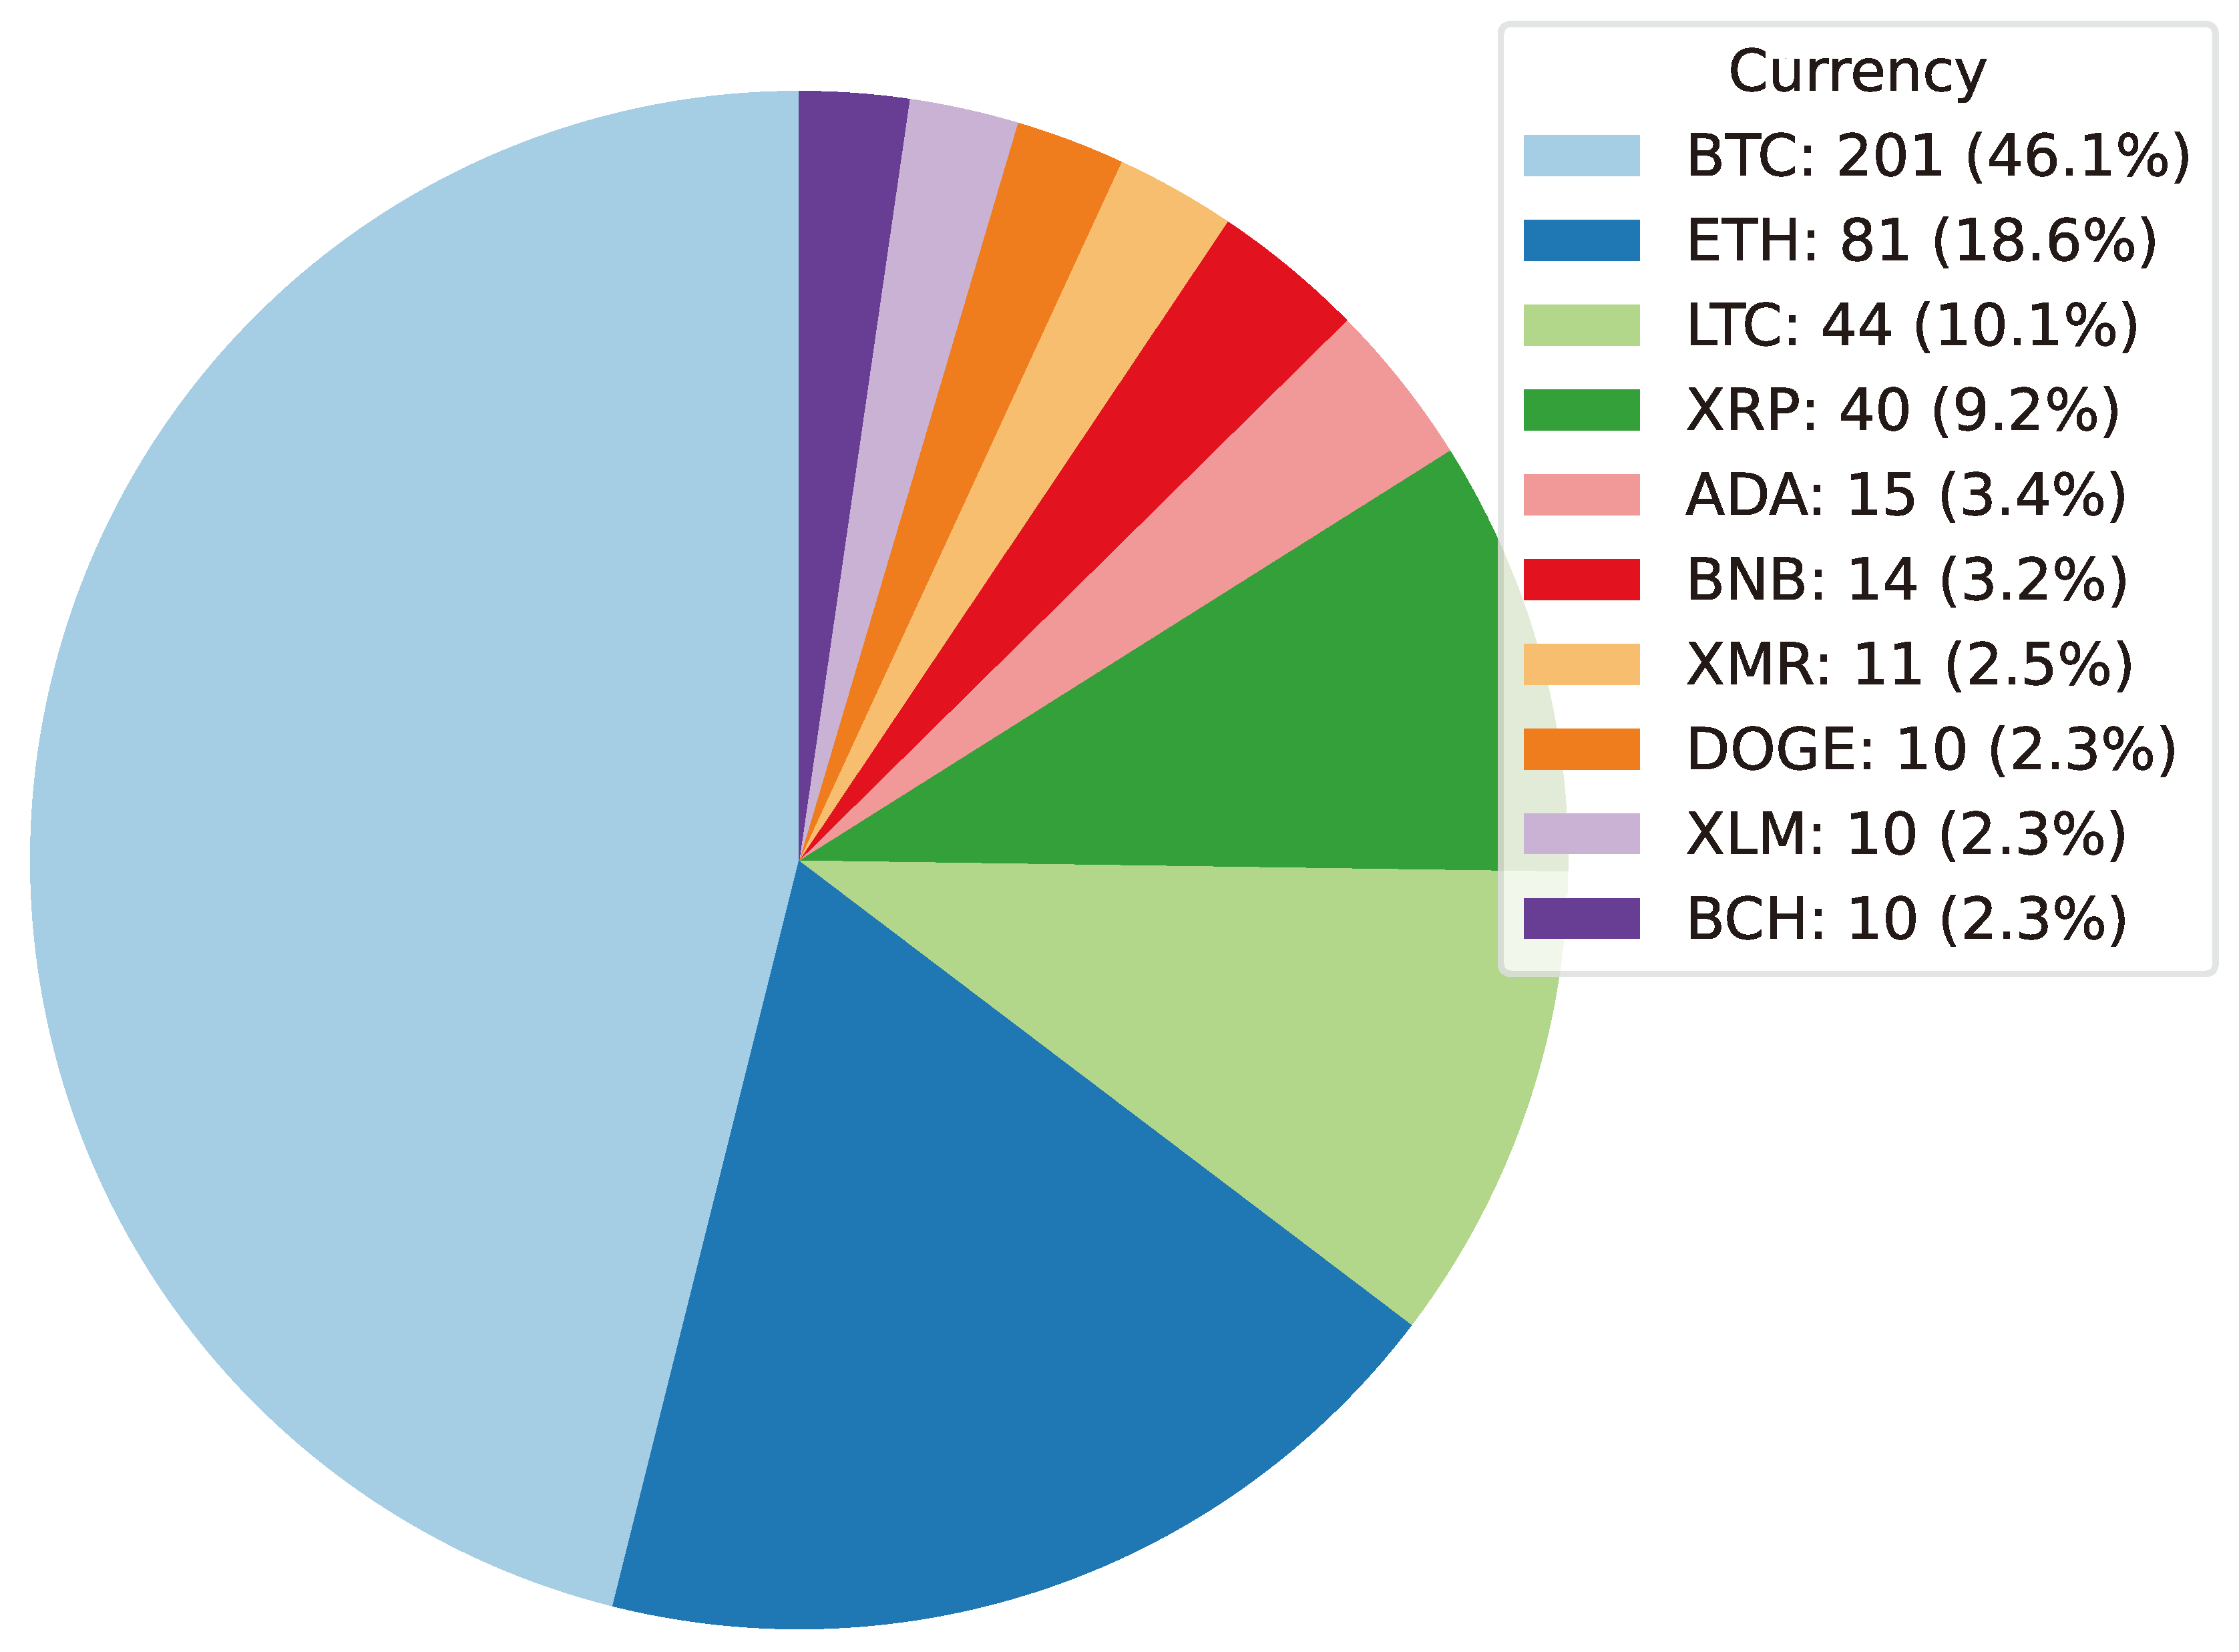
Figure 43 presents a line chart that represents the yearly trends in the selection of cryptocurrencies for research within the surveyed papers. The chart provides valuable insight into how the choice of cryptocurrencies has evolved over the years. As observed from the chart, Bitcoin maintains a consistent position as the most frequently chosen cryptocurrency across all the years covered in the survey. Its count remains substantially higher than that of other cryptocurrencies, showcasing its enduring significance in the field.
Ether emerged as the second most preferred cryptocurrency among researchers, with a noticeable spike in usage in certain years. This spike in Ether’s selection suggests a growing interest in its technology and ecosystem, leading to increased research attention. While Bitcoin and Ether dominate the landscape, other cryptocurrencies, such as Litecoin, and Steller others, show relatively lower counts. These alternative cryptocurrencies do have a presence in research papers, but their adoption is notably less extensive than that of Bitcoin and Ether.
Figure 43.
Line chart tracks the yearly trends in the selection of cryptocurrencies for research across surveyed papers, offering valuable insights into evolving preferences
Figure 43.
Line chart tracks the yearly trends in the selection of cryptocurrencies for research across surveyed papers, offering valuable insights into evolving preferences
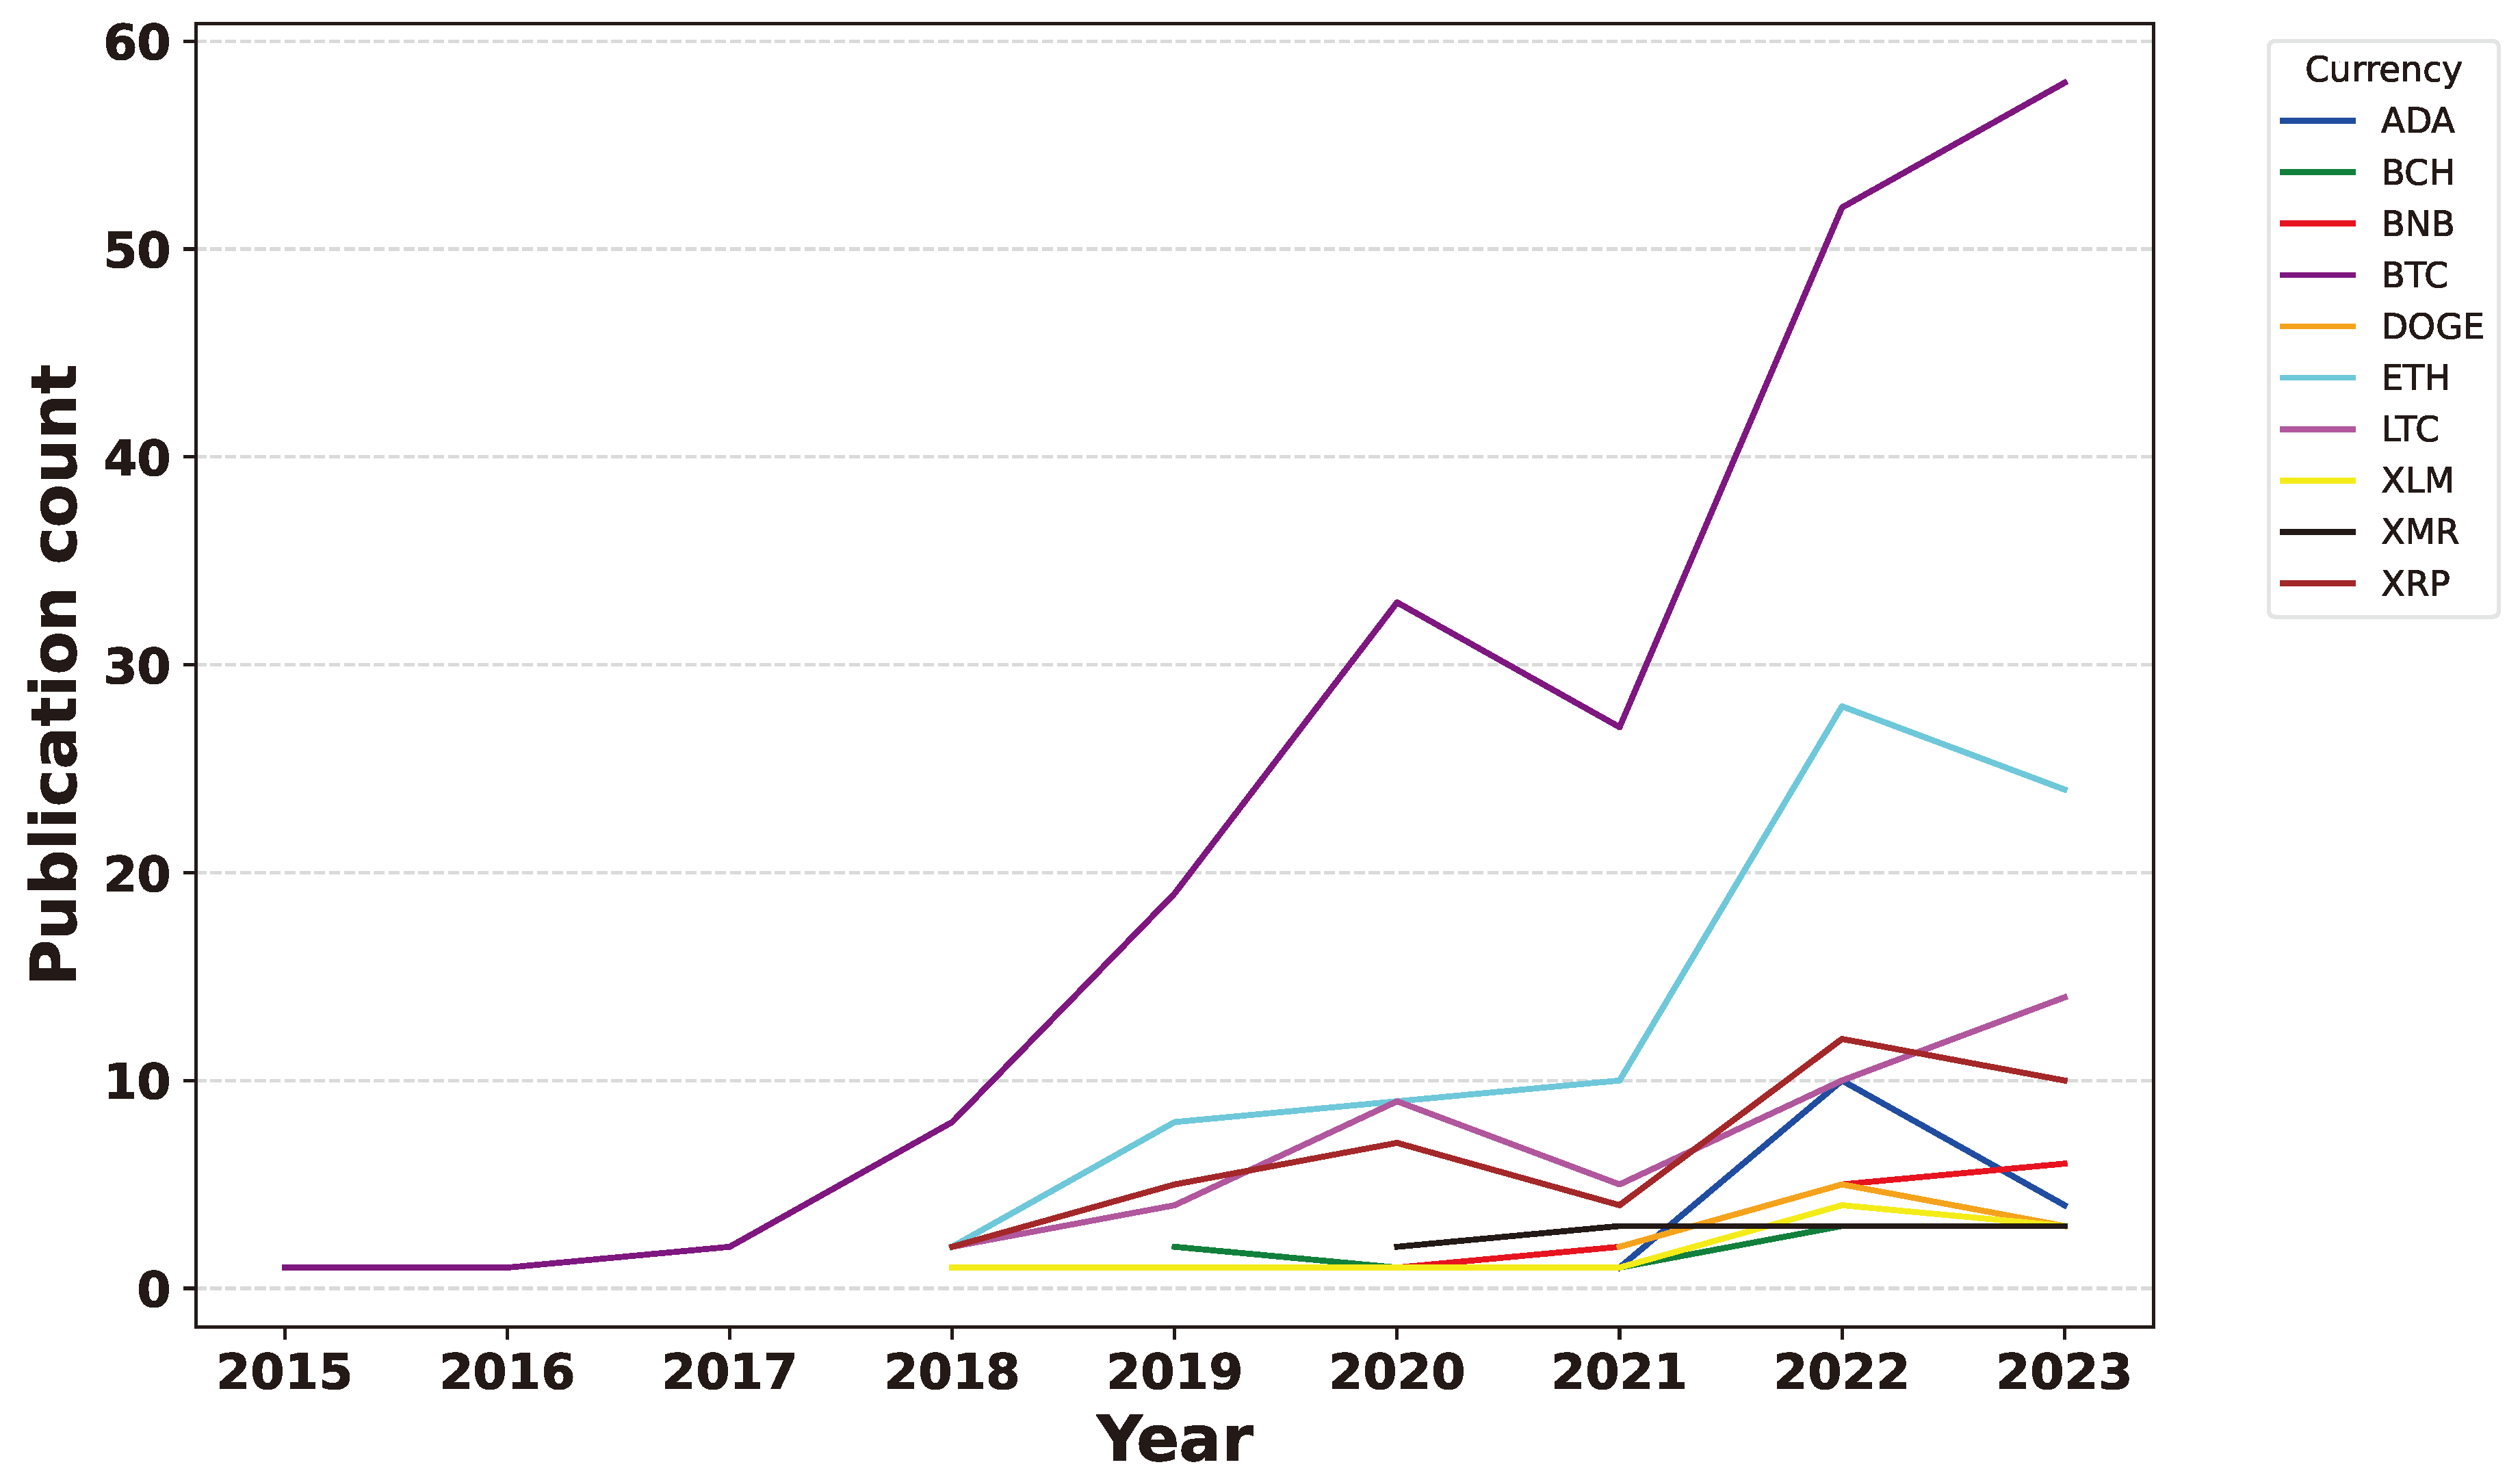
11.7. Learner Type Distribution
In this section, the survey paper classified all the algorithms utilized in the research surveys into different categories. This variety allows us to gain a deeper understanding of which types of learners are especially used across all the research papers related to cryptocurrency forecasting. To facilitate this research, the survey paper used visualizations to present an exhaustive overview of learner usage trends in this field. Let’s analyze which learner types have been favored by researchers in cryptocurrency forecasting. In this survey paper, all algorithms used in the studied research surveys are divided into categories to draw an exhaustive analysis of which learner is used most frequently across all research papers related to cryptocurrency forecasting. These learner categories include:
- Machine Learning : This category encompasses a wide range of traditional Machine Learning algorithms, which are widely used for classification, regression, and clustering tasks.
- Deep Learning : Algorithms falling under this category typically involve neural networks with multiple layers, enabling complex pattern recognition and feature extraction.
- Deep Reinforcement Learning : DRL algorithms integrate Deep Learning with reinforcement learning principles to make sequential decisions and optimize actions in dynamic environments.
- Statistical Models: Statistical models involve the application of Statistical techniques to analyze and forecast cryptocurrency trends, often relying on historical data and probability distributions.
In Figure 44, the survey paper provides a visual representation of the distribution of learner types among the surveyed research papers. This chart offers insights into the dominant learner choices in the field of cryptocurrency forecasting. The distribution exposes that Deep Learning algorithms are the most prominently used, constituting the largest slice of the pie at 50.3%. Following DL, ML at 23.7%, Statistical at 18.2%, and DRL at 7.1%. Other categories collectively make up the remaining percentage, with each contributing less than 1% individually. This analysis provides useful insights into the predominant learner types chosen by researchers in the cryptocurrency forecasting domain, highlighting the substantial adoption of Deep Learning methods.
Figure 44.
Pie chart illustrates the distribution of learner types among surveyed research papers in cryptocurrency forecasting.
Figure 44.
Pie chart illustrates the distribution of learner types among surveyed research papers in cryptocurrency forecasting.
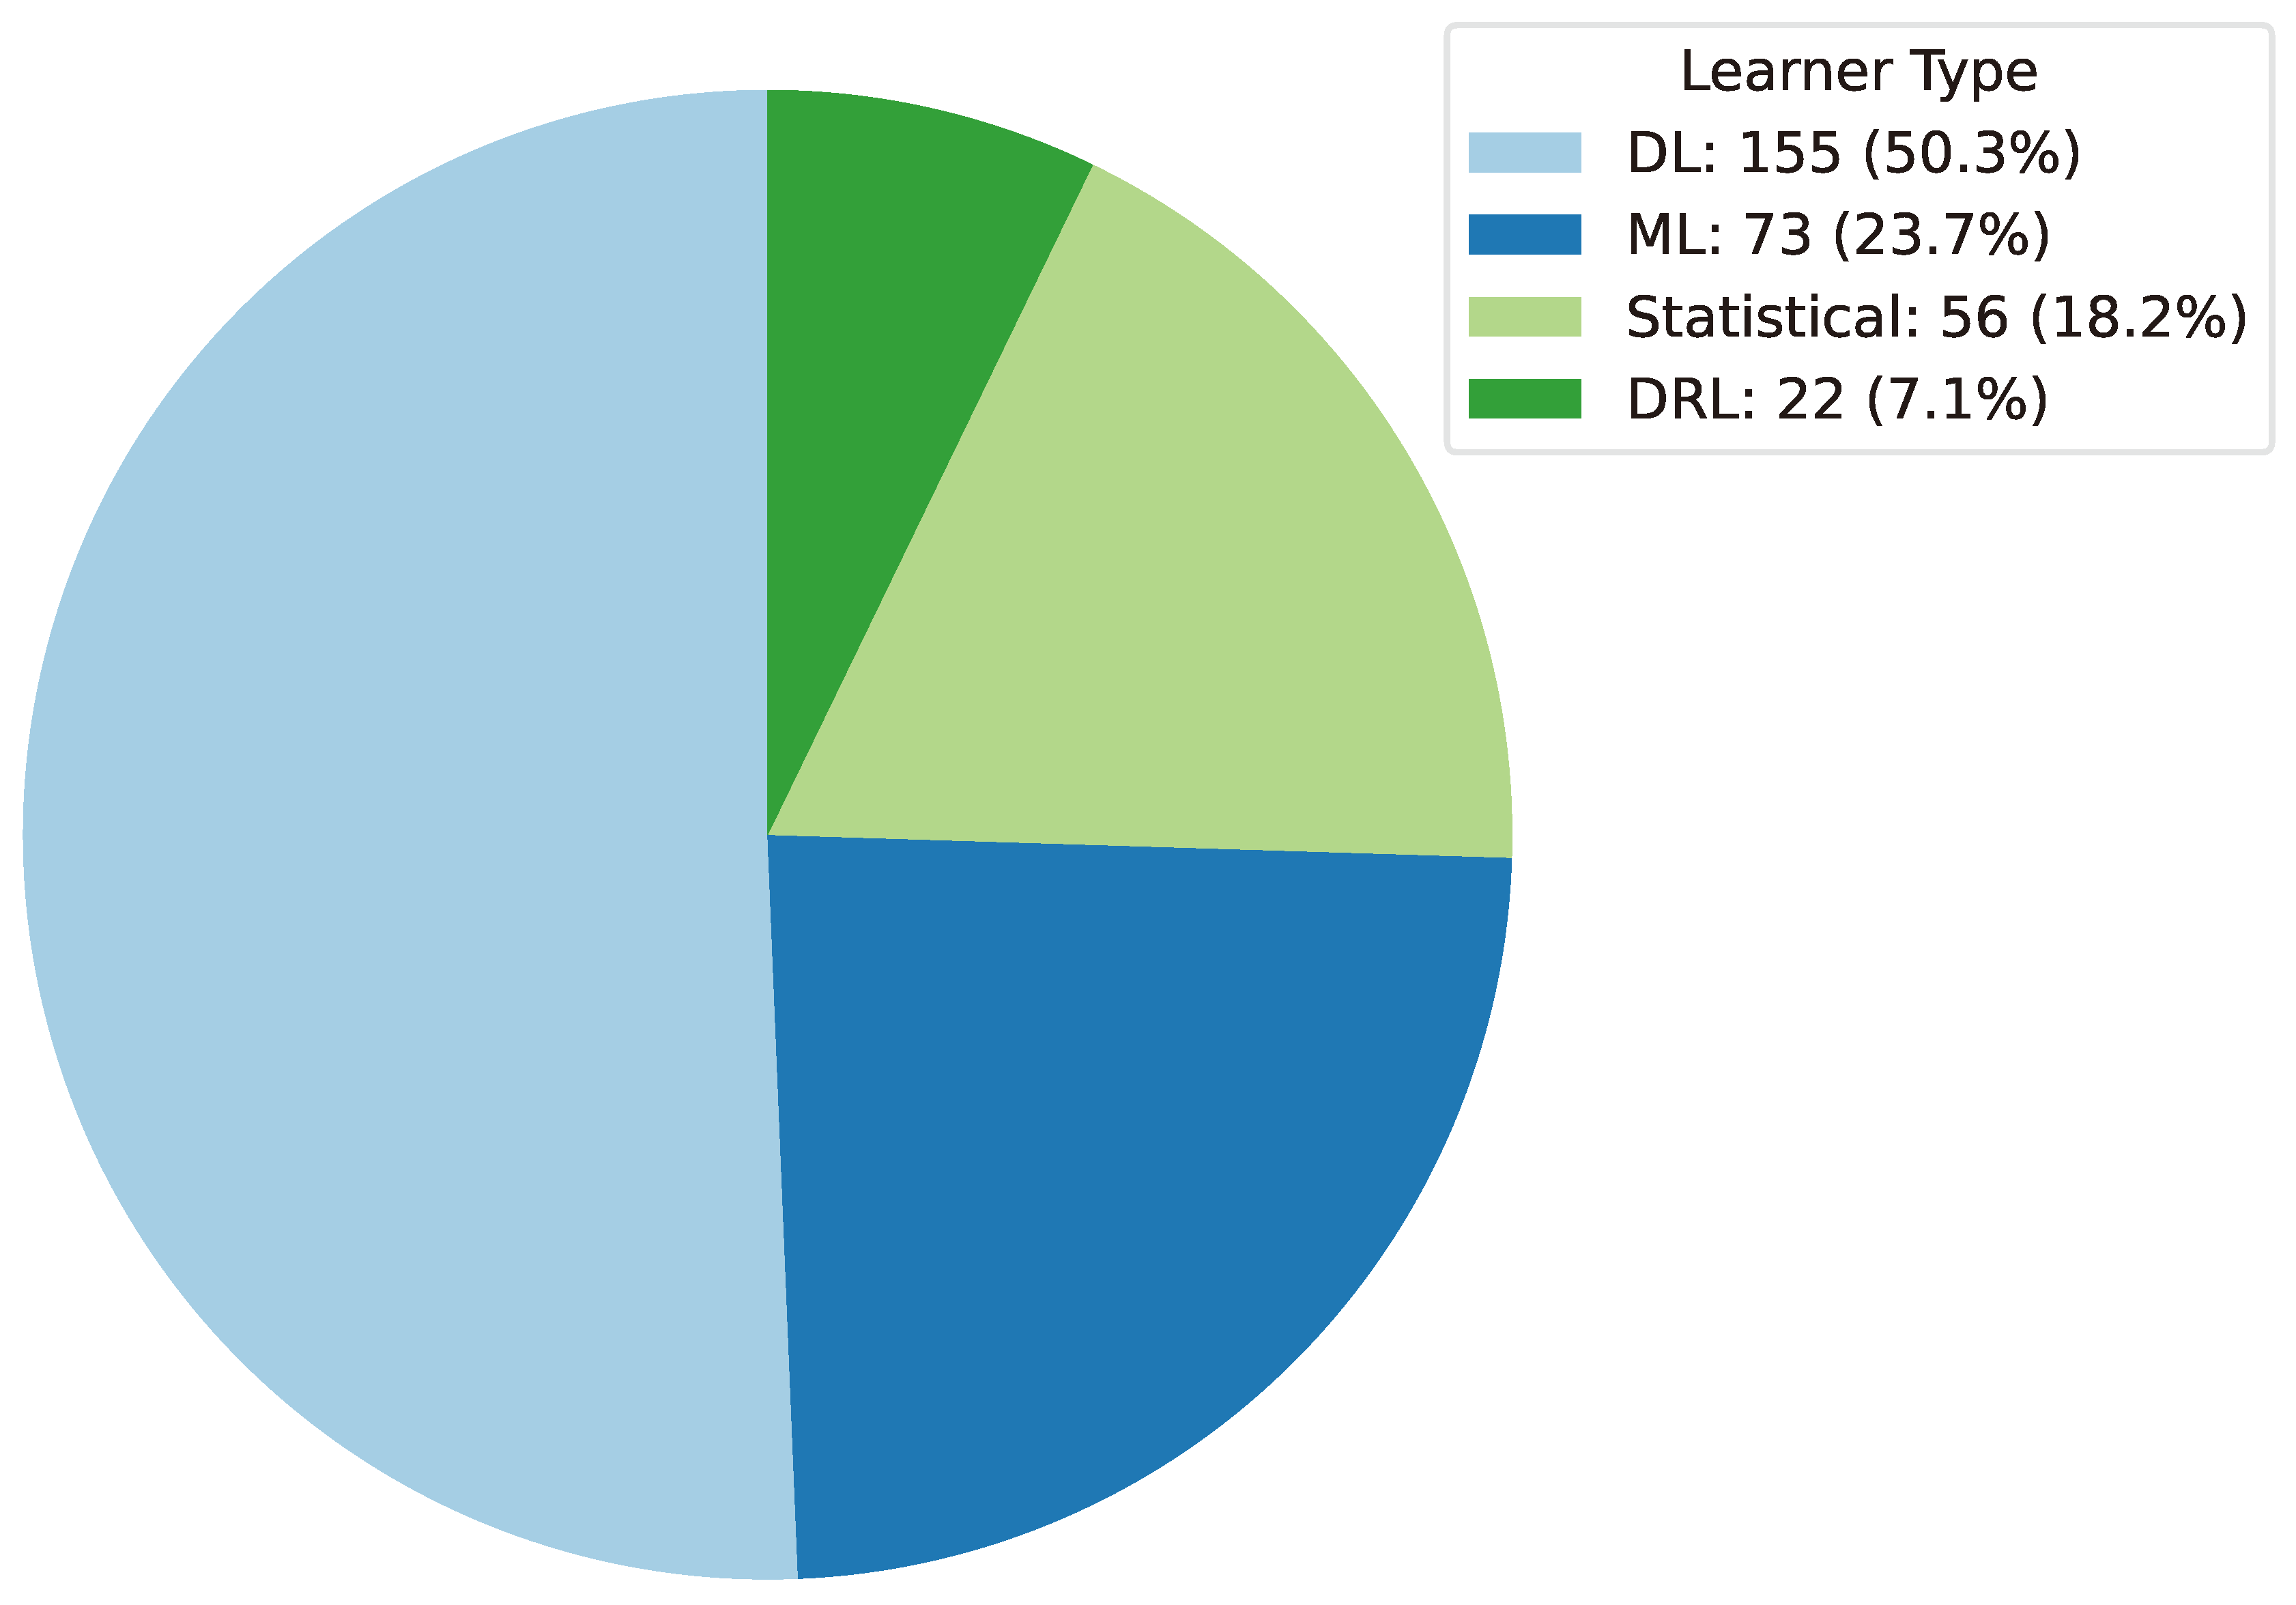
In Figure 45 to gain a deeper understanding of the evolution of learner types used in cryptocurrency forecasting research, this survey presents a stacked bar chart that depicts the distribution of learner types across different years. Each bar represents a specific year, while the segments within each bar are color-coded to denote different learner types. Key observations from the chart demonstrate trends in learner type preferences: Deep Learning has seen consistent use over the years, with a notable surge in 2022. Statistical and Machine Learning models have been a prevalent choice, especially in earlier years. This chart provides valuable insights into changing preferences, highlighting the growing significance of Deep Learning and Machine Learning in recent years in cryptocurrency forecasting research.
Figure 45.
A stacked bar chart illustrating the evolution of learner types used in cryptocurrency forecasting research across different years. Each bar corresponds to a specific year, with segments color-coded to denote different learner types.
Figure 45.
A stacked bar chart illustrating the evolution of learner types used in cryptocurrency forecasting research across different years. Each bar corresponds to a specific year, with segments color-coded to denote different learner types.
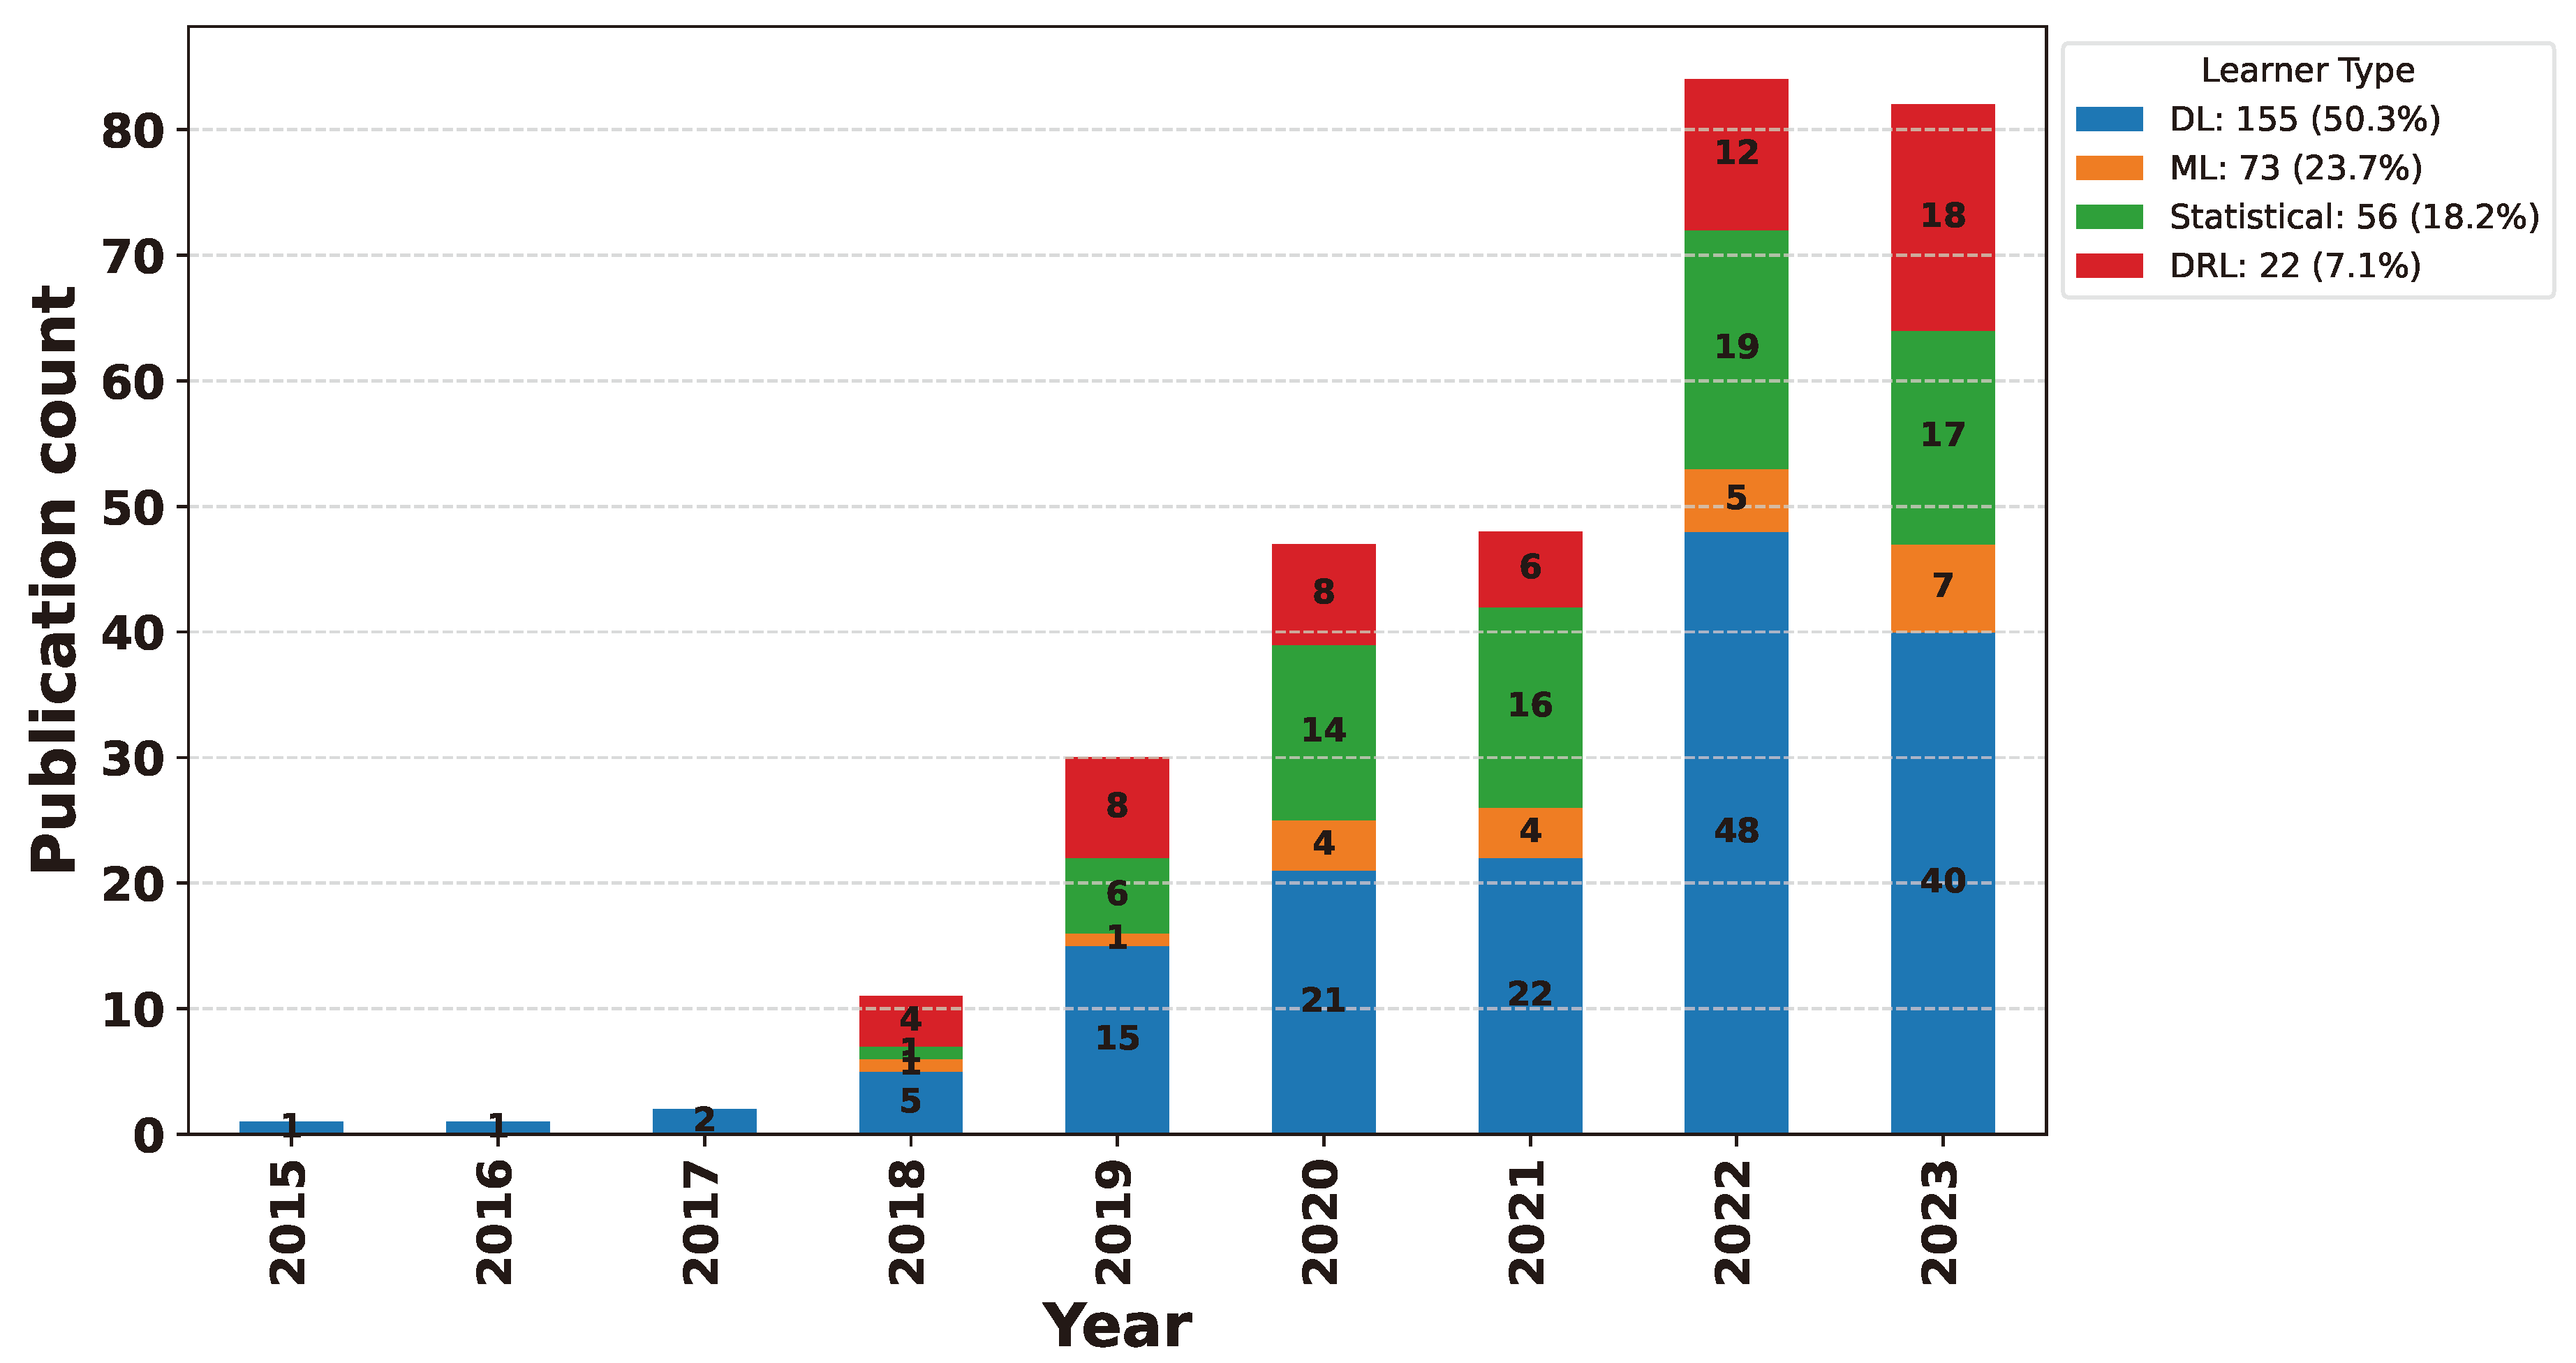
11.8. Train/Test Split Distribution
In this section, the survey delves into the distribution of training and testing split ratios employed in the research papers analyzed within this survey. This survey examines the practices of various researchers to identify the most commonly used training and testing split ratios in the cryptocurrency forecasting domain. Through the utilization of visualization techniques, this survey gain insights into the overall preferences within the research community, shedding light on the standard practices adopted in dividing datasets for model training and evaluation. In Figure 46, the bar chart shows the distribution of training and testing split ratios found in the research papers examined in this survey. Among the various split ratios analyzed, it is evident that the 80/20 split ratio, signifying 80% of data for training and 20% for testing, is the most frequently adopted practice among researchers. Following closely is the 70/30 split ratio, where 70% of the data is allocated for training, and 30% for testing. These findings shed light on the prevailing trends in the selection of training and testing split ratios within the cryptocurrency forecasting research community.
Figure 46.
Bar chart displays the distribution of training and testing split ratios observed in the research papers examined in this survey.
Figure 46.
Bar chart displays the distribution of training and testing split ratios observed in the research papers examined in this survey.

11.9. Training/Testing Data Samples Distribution
In this section, this survey paper delves into the quantity of data samples allocated for training and testing in each research paper. Through the utilization of visualizations, an analysis is conducted to distinguish the prevalent practice concerning the number of data samples used for training and testing purposes in the domain of cryptocurrency forecasting research. In Figure 47, the scatter plot introduced in this section showcases the distribution of training and testing data samples across various research papers. It becomes evident from the plot that a significant portion of studies utilized training and testing data samples falling within the range of 1000 to 3000, concerning the chosen training and testing split ratios. This observation sheds light on the common practices employed by researchers when it comes to the quantity of data samples for cryptocurrency forecasting.
The portion of data samples used for training and testing holds paramount importance in cryptocurrency forecasting research. It directly impacts the performance and reliability of forecasting models. An adequate number of data samples is essential to train models effectively, ensuring they do not suffer from overfitting or underfitting issues. Furthermore, a significant dataset enables models to generalize better to unseen market data and enhances their stability in the face of market changes. It also allows for a more comprehensive evaluation of model performance, reducing the impact of random variations. In the context of cryptocurrency trading and investment, where risk management is critical, larger datasets contribute to more reliable risk assessments, empowering traders and investors to make well-informed decisions. Therefore, the selection of an appropriate number of data samples is a crucial consideration for researchers and practitioners in this field.
Figure 47.
The scatter plot illustrates the distribution of training and testing data samples across various research papers.
Figure 47.
The scatter plot illustrates the distribution of training and testing data samples across various research papers.
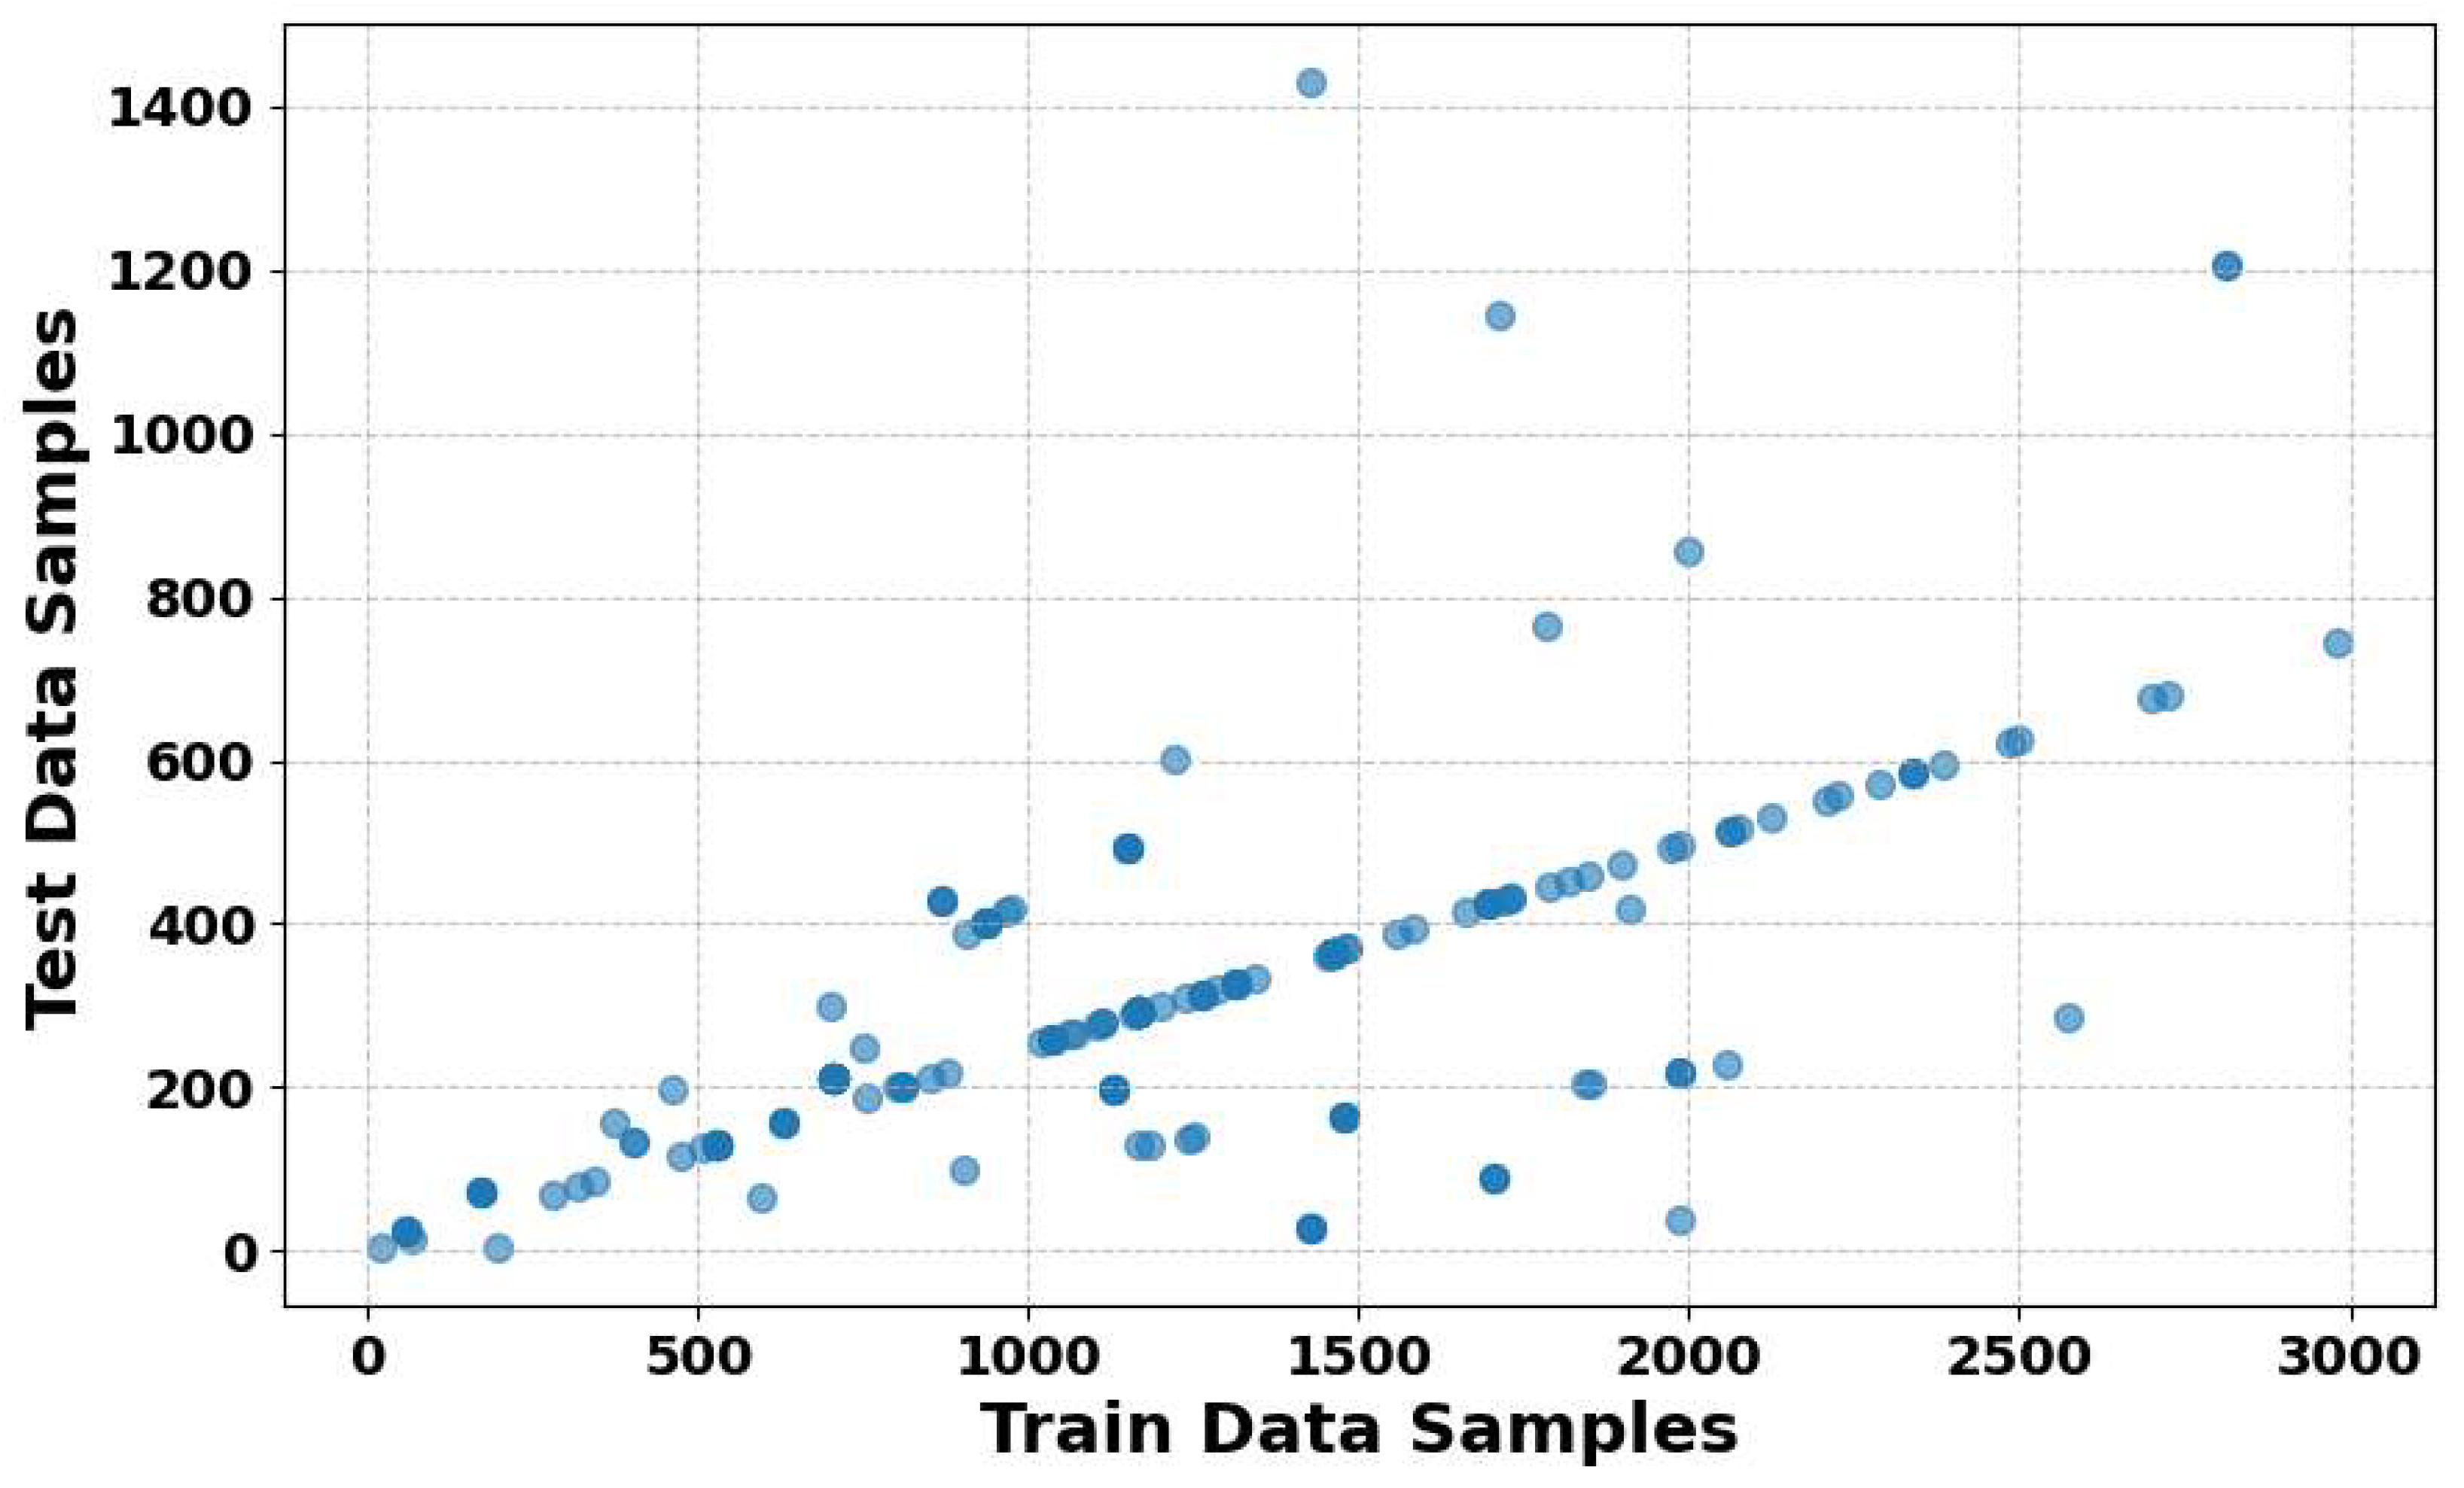
12. Challenges and Open Problems
Cryptocurrency prediction is a challenging task faced by researchers and practitioners who encounter various issues and open problems in their goal of accurate and reliable forecasts. In this section, this survey will delve into the key challenges that hinder the effectiveness of cryptocurrency forecasting models and discuss open problems that remain to be addressed. From issues related to model performance and validation to complexities arising from market dynamics and data limitations, understanding and mitigating these challenges are essential for advancing the state-of-the-art in cryptocurrency forecasting. This survey will explore each challenge in depth, highlighting its significance and proposing potential routes for future research to tackle these critical issues.
12.1. Models Overfitting
Cryptocurrency forecasting often involves complex models trained on historical data. However, overfitting occurs when a model learns to perform well on the training data but fails to generalize to unseen data. In cryptocurrency forecasting, overfitting can lead to inaccurate predictions, as the model may capture noise or random fluctuations in the historical data rather than underlying patterns.
12.2. Survivorship Bias
Survivorship bias occurs when the analysis only considers data from surviving entities, ignoring those that have failed or dropped out. In the context of cryptocurrency forecasting, survivorship bias can skew the analysis by only considering successful cryptocurrencies that have survived until the present day. This can lead to overly optimistic forecasts and a misrepresentation of the risks involved in cryptocurrency investment.
12.3. Backtesting and Forward Testing
Backtesting involves testing a model using historical data to assess its performance. However, a common challenge is that models may perform well on backtesting but fail to perform adequately when applied to new, unseen data (forward testing). This dissimilarity can occur due to changes in market conditions, unforeseen events, or structural shifts in the cryptocurrency market.
12.4. Data Quality and Availability
The quality and availability of data in cryptocurrency forecasting present significant challenges. Cryptocurrency markets are often characterized by limited historical data, data fragmentation across exchanges, and the presence of outliers and anomalies. Additionally, data may be subject to manipulation or inaccuracies, further complicating the forecasting process.
12.5. Model Interpretability and Transparency
Many cryptocurrency forecasting models, particularly those based on Machine Learning and Deep Learning techniques, are often considered black-box models, making it difficult to interpret their predictions. This lack of interpretability raises concerns regarding model transparency, accountability, and the ability to understand the rationale behind forecasting outcomes, limiting their practical utility for decision-making.
12.6. Volatility and Market Dynamics
Cryptocurrency markets are known for their high volatility and dynamic nature, driven by factors such as speculative trading, regulatory developments, technological advancements, and macroeconomic events. Forecasting accurate price movements in such volatile and rapidly evolving markets poses a significant challenge, as traditional forecasting models may struggle to capture the complex interplay of these factors.
12.7. Quantifying Risk and Uncertainty
Effectively quantifying risk and uncertainty is crucial for cryptocurrency investors and traders. However, existing forecasting models often provide point estimates or deterministic predictions without adequately accounting for uncertainty. Incorporating probabilistic methods, such as Bayesian inference or Monte Carlo simulation, can enable the quantification of uncertainty and provide more informative forecasts, enhancing decision-making processes.
12.8. Adaptability to Emerging Trends and Innovations
Cryptocurrency markets are continually evolving, with new cryptocurrencies, trading strategies, and technological innovations emerging regularly. Forecasting models must adapt to these changes and remain relevant in the face of evolving market dynamics. However, developing adaptable and scalable forecasting frameworks that can accommodate emerging trends and innovations remains an ongoing challenge in the field.
12.9. Seasonality Challenges
Seasonality poses a significant challenge in cryptocurrency forecasting, as price patterns may exhibit recurring trends or cycles over specific time intervals. Identifying and accounting for seasonality in cryptocurrency data is crucial for developing accurate forecasting models. However, the presence of irregular and non-linear seasonal patterns, coupled with the inherent volatility of cryptocurrency markets, complicates the modeling and prediction of seasonal effects.
12.10. Stationarity Challenges
Stationarity, or the lack thereof, presents challenges in cryptocurrency forecasting due to the non-stationary nature of cryptocurrency price series. Traditional time series analysis techniques assume stationarity, wherein Statistical properties such as mean and variance remain constant over time. However, cryptocurrency price data often exhibit trends, volatility clustering, and structural breaks, violating the stationarity assumption. Addressing stationarity challenges requires employing advanced time series modeling techniques, such as differencing, detrending, or incorporating regime-switching models, to capture the underlying dynamics of non-stationary cryptocurrency price series.
13. Conclusion
This thorough survey paper extensively examines the complex world of cryptocurrency forecasting, providing a detailed exploration of its challenges, methodologies, and trends. It traces the historical development of cryptocurrency and delves into various forecasting techniques, offering valuable guidance for researchers and investors navigating this rapidly changing landscape. The case study highlights the practical challenges of implementing forecasting strategies and emphasizes the need for reliable models tested in real-world scenarios. Through extensive data analysis and visualization, this paper not only provides an overview of current cryptocurrency forecasting practices but also sets the stage for future exploration and research in this important field. As the cryptocurrency market continues to expand, this paper serves as a guide for stakeholders making informed decisions amid the uncertainties of the future.
Appendix A
Table A1.
Machine Learning-based summarized literature review
| Cite | Input Category | Methodology | Interval | Currency | Metrics | Samples | Train/Test |
|---|---|---|---|---|---|---|---|
| [51] | - | LR, GBR, RF, DT, AdaboostR, Ridge, Lasso | - | BTC | RMSE, RMSE, R2, MAE | - | - |
| [64] | Price Data | RF | 24h | BTC | MSE, MAE, RMSE | BTC:4700 | - |
| [36] | Price Data | LR | 120d | BTC | - | BTC:2191 | - |
| [52] | Price Data | SVM, KNN | 24h | BTC | Accuracy, Std Deviation, Mean, RMSE, ROC, AUC | BTC:2760 | 80/20 |
| [53] | Price Data | LR, SVR | 1h | BTC | Accuracy | BTC:29592 | - |
| [54] | Price Data, Blockchain Data, External Economic Data | BNN, SVR, SVM | 24h | ETH | RMSE, MAPE | ETH:1213 | - |
| [43] | Price Data, External Economic Data, Daily COVID-19 Cases | SVM | 24h | BTC, ETC and more | MAPE, RMSE, NRMSE | - | 75/25 |
| [56] | - | SVM, LR, KMC, NB, RF, KNN, DT | 1m | BTC | - | - | - |
| [75] | Price Data, Technical indicators | ARIMA, Prophet, XGBoost | - | BTC | MAPE, R2 | - | - |
| [57] | Price Data | SVM, KNN, LGBM | 24h | BTC, ETH, LTC | F1, Accuracy | For each currency 17 | - |
| [72] | Price Data, Technical Indicators | MLP, LR, BRR, RFR, LASSO, SVR, DE | 24h | BTC | MSE | BTC: 1002 | - |
| [58] | Price Data | LSTM, LR | 24h | BTC, ETH and more | MSE | - | 80/20 |
| [44] | Price Data, Sentimental Data | SVM | 24h | BTC, ETH,and more | Accuracy, Precision, Recall, F1, SharpeRatio, SortinoRatio, CEQReturn, ReturnLoss | For each currency 181 | - |
| [27] | Price Data | SVM | 24h | BTC, ETH and more | MAPE | BTC:1745, ETH:897, LTC:1745, XEM:1027, XRP:897, XLM:1745 | - |
| [61] | Price Data | ANFIS | 24h | BTC | RMSE, MSE | BTC:1000 | 75/25 |
| [73] | Price Data | Prophet, XG Boosting | 24h | BTC | RMSE, MAE, R2 | - | - |
| [62] | External Economic Data, Price Data, Blockchain Data | RF | 24h | BTC, LONA | R2, MAE, MSE | - | - |
| [68] | Lagged Data | LR, RF, GBC | 24h | - | MR, RS, DR, VaR1, VaR5, CVaR1, CVaR5, AV, SharpeRatio, SortinoRatio, ESR | Top 100 cryptocurrencies:1557 | 62.5/18.5/18.5 |
| [69] | External Economic Data | LR, SVM, RF | 24h | BTC | Recall, Accuracy, Precision, Accuracy, F1 | BTC:1679 | 80/20 |
| [37] | Technical Indicators, Blockchain Data, Sentimental Data | RF, GB, LR | 1m, 5m, 15m, 60m | BTC | Accuracy | BTC:403440 | - |
| [42] | Blockchain Data, Price Data | SVM | 1d, 7d, 30d, 90d | BTC | MAE, RMSE, MAPE, Accuracy, F1, AUC, ROC | BTC:2465 | 80/20 |
| [210] | - | ML, SM | - | - | - | - | - |
| [70] | Price Data, Technical Indicators | LR, LighGBM ,XGBoost | - | BTC, ETH and more | Accuracy, SR, ROI | - | 80/20 |
| [32] | Price Data, Technical Indicators | SVM, NB, RF, LR | - | BTC | F-statistic, AccuracyStat, MAE, RMSE, RAE | BTC:4382 | - |
| [211] | Price Data, Technical Indicators | LR ,SVM, RF, VC | 15m | BTC | Accuracy, Precision, Recall | BTC:35040 | 80/20 |
| [38] | Price Data | SVM | 24h | BTC, ETH and more | Accuracy | For each currency 1826 | - |
| [39] | Price Data | KNN, LR, NB, RF, SVM, EGB | 5m, 10m, 15m, 30m, 60m | BTC | SPR, MR | BTC:72576 | 90/10, 80/20, 70/30 |
| [63] | Price Data | RF | 24h | BTC, ETH, and XRP | MSE, R2 | For each currency 1433 | - |
| [71] | Price Data | KNN, RF, SVR | 24h | BTC, ETH and more | RMSE, MAE, MAPE, R2 | For each currency 1825 | 80/20 |
| [40] | Price Data | LR, SVM, KNN, Gaussian, DR,RF, AdaBoost, XGBoost | 24h | BTC, ETH, XRP | Accuracy | For each currency 1579 | 80/20 |
| [29] | Price Data, Sentimental Data | SVM, RF | 24h | BTC, ETH, and more | Accuracy, Precision, Recall, F1 | For each currency 80 | 70/30 |
| [76] | Sentimental Data | XG, LSTM | - | BTC | - | - | - |
| [63] | Price Data | RF | 24h | BTC | MSE, R2 | BTC:1433 | 85/6/9 |
| [77] | Price Data | RF, Xgboost, LightGBM | 1h | BTC | Accuracy, Precision, Recall, F1 | BTC:2348160 | 70/20/10 |
| [45] | Price Data | LR, GBR,SVR, RFR | - | BTC, ETH,and more | MSE, MAPE, MAE, AIC, BIC | For each currency 365 | - |
| [46] | - | SVR, LR, KNN, DTR | 1h | BTC, ETH, XRP | RMSE, Accuracy, AUC, F1 | For each currency 15880 | 70/30 |
| [78] | Price Data | LGTM, XGBoost | 24h | BTC, ETH and more | - | BTC:1011, ETH:1011 , BNB:1011, AVAX:593, SOL:635 | 80/20 |
| [33] | Price Data | SVM, RF, Bayesian, Kriging | 24h | BTC | RMSE, MAPE | BTC:74 | - |
| [28] | Price Data | Kriging, Bayesian, SVM, RF | 24h | BTC | RMSE, MAPE | BTC:167 | - |
| [31] | Price Data, External Economic Data | SVR | 24h | BTC, XRP, ETH | MAE, MSE, RMSE, R2 | BTC:2270, XRP:2149, ETH:1391 | 80/20 |
| [41] | Price Data | LR TSR ,HR, LSTM, GRU | 24h | BTC | Accuracy, R2, MSE | BTC:1501 | 80/20 |
| [163] | Price Data, Technical Indicators, External Economic Data | RF, LSTM | 24h | BTC | RMSE, MAPE | BTC:2559 | - |
| [66] | Price Data, Technical Indicators | LR, SVM, RF, XGBoost, lightGBM | 24h | BTC | Accuracy, Precision. F1 | BTC:3285 | - |
| [79] | Blockchain Data, Technical Indicators | LSTM, XGBoost | 24h | ETH | MAE, RMSE, MAPE, R2 | ETH:1980 | 80/20 |
| [105] | Price Data | RNN, LSTM, LR | 24h | BTC | - | BTC:1076 | - |
| [131] | Price Data | LR, LSTM | 24h | BTC | MAE, MSE | BTC:1076 | - |
| [194] | Price Data | ML | 24h | BTC, ETH and more | MSE, RMSE, MAE | For each currency 1277 | - |
| [74] | Price Data | Prophet, XGBoost | 24h | BTC, ETH, XRP | RMSE | For each currency 3377 | - |
| [30] | Price Data, Sentimental Data | SVM | 24h | - | - | - | - |
| [54] | Price Data | GB | 10m | BTC, ETH and more | Accuracy, Recall, Precision, F1 | For each currency 48816 | - |
| [50] | Price Data | LR, RF, SVM | 24h | BTC, ETH, LTC | - | For each currency 1297 | 67/33 |
| [84] | Price Data | SETAR,SVR | 24h | BTC, ETH | RMSE, MAE | BTC:2577, ETH:2577 | 80/20 |
| [212] | Price Data | OLS, PLS, LASSO, ENET, GBRT, RF | 24h | - | MSFE, R2, MAE | - | 70/30 |
| [34] | Sentimental Data | TI, ML | - | BTC | - | - | - |
| [213] | Price Data, Technical Indicators | RF, SGBM | 24h | BTC, ETH, XRP | MAPE | BTC:1826, ETH:1826, XRP:1608 | 80/20 |
| [214] | Price Data | KNN, SVM | 1m | BTC, ETH, and more | Accuracy | For each currency 1994400 | 75/25 |
| [101] | Price Data | NB,DT, BG, SVM,RF | 24h | BTC, ETH and more | Sensitivity, Specificity, PPV, NPV, BACC, OA, Kappa, 95% CI | For each currency 918 | 77/23 |
| [35] | Price Data, Blockchain Data | LR | 24h | BTC | Accuracy | - | - |
| [126] | Price Data | SVM | 24h | BTC | Accuracy, Precision, Recall, F1 | - | - |
| [60] | Price Data, Blockchain Data | LASSO,DT, KNN | 24h | BTC | Accuracy | - | - |
| [49] | Price Data, Sentimental Data | LR,SGDR ,RFR | 24h | AVAX, XRP and more | MAE, RMSE, MPE | - | 70/30 |
| [67] | Price Data, Sentimental Data | SVR, DTR, RFR, LR, LogR, GPR | 24h | BTC, ETH and more | RMSE | For each currency 27 | - |
| [47] | Price Data | LR | - | BTC, ETH and more | - | - | 70/30 |
| [48] | Price Data, Sentimental Data | KNN, LR, GNB, SVM, EGB | 24h | BTC | F1 | BTC:2922 | 80/20 |
| [65] | Price Data, Technical Indicators | RF, SVR | 24h | BTC | MAPE, RMSE, MAE, R2 | BTC:2784 | 80/20 |
| [59] | Price Data | KNN,EGB, RF | 4h | BTC, ETH and more | Accuracy | For each currency 1795 | 95/5 |
Table A2.
Deep Learning-based summarized literature review
| Cite | Input Category | Methodology | Interval | Currency | Metrics | Samples | Train/Test |
|---|---|---|---|---|---|---|---|
| [27] | Price Data | NN, SVM, DL | 24h | BTC, ETH and more | MAPE | BTC:1745, ETH:897, LTC:1745, XEM:1027, XRP:897, XLM:1745 | - |
| [89] | Price Data | CNN | 30m | - | FPV, SD, SR, MDD | 12 Most Volume Assets:12528 | 70/30 |
| [118] | Price Data | LSTM | 24h | BTC | MAE | BTC:400 | 80/20 |
| [215] | - | DL | 24h | BTC, ETH and more | RMSE, MAPE | BTC:4007, ETH:1947, USDT:1545, BNB:1336 | 80/20 |
| [83] | Price Data | DL | 24h | BTC, ETH and more | Accuracy, F1 | For each currency 1339 | 70/30 |
| [167] | Price Data | BiLSTM, GRU | 24h | BTC, ETH, ADA | MSE, RMSE, MAE, MAPE, R2 | BTC:2885, ETH:1735, ADA:1735 | - |
| [68] | Lagged Data | RNN, CNN, TCN, LSTM, GRU | 24h | - | MR, RS, DR, VaR1, VaR5, CVaR1, CVaR5, AV, SharpeRatio, SortinoRatio, ESR | Top 100 cryptocurrencies:1557 | 62.5/37.5 |
| [168] | - | LSTM, GRU | - | BTC | RMSE, MAPE | - | - |
| [97] | Price Data, Blockchain Data | RNN, LSTM | 24h | BTC | Sensitivity, Specificity, Precision, Accuracy, RMSE | BTC:1065 | 80/20 |
| [158] | Price Data, Sentimental Data | Bi-LSTM, GRU, FinBERT, GRU | 24h | BTC | MAPE | BTC:376 | - |
| [134] | Price Data, Technical Indicators | LSTM, GRU | 24h | BTC, ETH,and more | MSE, RMSE, MAE, R² | For each currency 2208 | 90/10 |
| [91] | Price Data, External Economic Data | CNN, LSTM | 3d | BTC | MAE, RMSE, MAPE, Precision, Recall, F1 | BTC:203 | 97/3 |
| [122] | Price Data | LSTM, ARIMA | 5s | BTC | - | - | 80/20 |
| [192] | - | LSTM | - | - | - | - | - |
| [37] | Technical Indicators, Blockchain Data, Sentimental Data | LSTM, GRU, FFN | 1m, 5m, 15m, 60m | BTC | Accuracy | BTC:403440 | - |
| [42] | Blockchain Data, Price Data | ANN, ANN, LSTM | 1d, 7d, 30d, 90d | BTC | MAE, RMSE, MAPE, Accuracy, F1, AUC, ROC | BTC:2465 | 80/20 |
| [138] | Technical Indicators, Price Data | LSTM, GRU, BiLSTM | 7d, 14d, 21d | BTC | HMSE, HMAE | BTC:2283 | - |
| [193] | - | ETS-ANN | 24h | BTC | MAE, RMSE, MAPE | For each currency 1461 | 80/20 |
| [136] | - | ANN, LSTM, RNN | - | BTC, ETH, XRP | - | - | - |
| [133] | Price Data | BP, ELM, LSTM | 1m | BTC, ETH | StdDev, MAD, Accuracy | - | 90/10 |
| [32] | Price Data, Technical Indicators | ANN | - | BTC | F-statistic, AccuracyStat, MAE, RMSE, RAE | BTC:4382 | - |
| [151] | Price Data | LSTM | - | BTC,ETH, XRP | MAE, MSE, RMSE, R2 | - | 90/10, 80/20, 70/30, 60/40 |
| [85] | Blockchain Data | DL | 1h | BTC | R2, RMSE | - | - |
| [54] | Price Data | LSTM | 10m | BTC, ETH and more | F1 | For each currency 47952 | - |
| [164] | Price Data | LSTM, GRU, Bi-LSTM | 24h | BTC, ETH, LTC | RMSE, MAPE | For each currency 1826 | 80/20 |
| [100] | Price Data, Sentimental Data | RNN, LSTM, GRU | 24h | BTC, XRP, LTC | RMSE | For each currency 1888 | - |
| [156] | Price Data | LSTM | 24h | BTC | MSE | BTC:1685 | - |
| [86] | Price Data, Technical Indicators | MLP-NARX | 24h | BTC | MSE | BTC:1826 | 70/30 |
| [115] | Blockchain Data, Price Data | LSTM | 24h | BTC | RMSE | - | 70/30, 80/20, 90/10 |
| [123] | Price Data | LSTM-FCN | 24h | BTC, LTC | MSE, RMSE, MAE, MAPE, MPE | BTC:2650, LTC:2650 | - |
| [103] | Price Data | GRU, LSTM | 1d, 7d, 30d, 90d | BTC | - | BTC:2078 | 80/20 |
| [169] | Price Data | ARIMA, GARCH, LSTM, Transformer | 1h | SOL, BTC, ETH | MSE, RMSE, MAE, MAPE, MASE | For each currency 3336 | - |
| [148] | Price Data | GRU, LSTM | 24h | LTC, XRP | RMSE, MAPE, ET | LTC:2849, XRP:2849 | - |
| [63] | Price Data | LSTM | 24h | BTC, ETH, and XRP | MSE, R2 | For each currency 1433 | - |
| [71] | Price Data | LSTM, GRU, HYBRID, TCN,TFT | 24h | BTC, ETH and more | RMSE, MAE, MAPE, R2 | For each currency 1825 | 80/20 |
| [40] | Price Data | MP | 24h | BTC, ETH, XRP | Accuracy | For each currency 1579 | 80/20 |
| [29] | Price Data, Sentimental Data | NN | 24h | BTC, ETH and more | Accuracy, Precision, Recall, F1 | For each currency 80 | 70/30 |
| [76] | Sentimental Data | XG, LSTM | - | BTC | - | - | - |
| [81] | Price Data | DNN | 24h | BTC | Accuracy, MSLE,MSE | BTC:1744 | - |
| [63] | Price Data | RF, LSTM | 24h | BTC | Mean Squared Error (MSE, R2 | BTC:1433 | 85/15 |
| [104] | Price Data | RNN, LSTM | 24h | BTC | MAPE, RMSE | BTC:3377 | 80/20 |
| [112] | - | LSTM, GRU | - | BTC | MSE | - | - |
| [141] | Sentimental Data | CNN, LSTM, BiLSTM | - | BTC | Accuracy, Precision, Recall, F1 | BTC:152398 | - |
| [77] | Price Data | LSTM, RNN | 1h | BTC | Accuracy, Precision, Recall, F1 | BTC:2348160 | 70/30 |
| [152] | Price Data | RNN, LSTM, GRU, Bi-LSTM, Bi-GRU | 15-Min, 30-Min | ETH | MAPE, RMSE, MAE, ME, R2 | ETH:199584, ETH:99792 | 80/20 |
| [161] | Price Data | DFFNNs, LSTM | 24h | BTC, ETH and more | RMSE | For each currency 1461 | 80/20 |
| [46] | - | CNN-LSTM, CNN-Bi-LSTM | 1h | BTC, ETH, XRP | RMSE, Accuracy, AUC, F1 | For each currency 15880 | 70/30 |
| [78] | Price Data | LSTM | 24h | BTC, ETH, and more | - | BTC:1011, ETH:1011 , BNB:1011, AVAX:593, SOL:635 | 80/20 |
| [128] | Price Data | LSTM | 24h | BTC | MSE | BTC:1826 | - |
| [28] | Price Data | ANN | 24h | BTC | RMSE, MAPE | BTC:167 | - |
| [113] | Price Data, Sentimental Data | LSTM | 24h | ETH | MAPE, MANE | ETH:432 | 80/20 |
| [143] | Price Data, Sentimental Data | LSTM, GRU, TCN | 24h,1h | BTC | Accuracy, F1, Precision, Recall | BTC:1448 | 80/20 |
| [103] | Price Data | RNNs,LSTM, Bi-LSTM | 30d, 90d | ETH | MAPE, RMSE, MAE | - | - |
| [216] | Price Data | EMD-LSTM, VMD-LSTM,and its combinations | 24h | BTC | MAE, RMSE | BTC:1098 | 80/20 |
| [149] | Price Data | LSTM | 1h | ETH, XRP and more | MSE, RMSE, NRMSE | BTC:61416 | 70/30 |
| [154] | Price Data | LSTM | 24h | BTC | - | BTC:4017 | 70/30 |
| [150] | Price Data | GRU, LSTM | 24h | BTC | MSE, RMSE | - | 70/30 |
| [41] | Price Data | TSR ,HR, LSTM, GRU | 24h | BTC | Accuracy, R2, MSE | BTC:1501 | 80/20 |
| [137] | Price Data, Technical Indicators | DANN, LSTM | 3d, 5d, 7d | BTC | MAE, RMSE, MAPE | BTC:3142 | - |
| [87] | - | MLP,LSTM | 1h to 24h | BTC, ETH and more | HSE | For each currency 21744 | - |
| [94] | Price Data | CNN | 24h | BTC | RMSPE | - | 60/40 |
| [163] | Price Data, Technical Indicators, External Economic Data | RF, LSTM | 24h | BTC | RMSE, MAPE | BTC:2559 | - |
| [120] | Price Data | MLP, LSTM, GRU | 24h | BTC | MeanRMSE, StdRMSE | BTC:2373 | 80/20 |
| [79] | Blockchain Data, Technical Indicators | LSTM | 24h | ETH | MAE, RMSE, MAPE, R2 | ETH:1980 | 80/20 |
| [147] | Price Data | LSTM | 24h | BTC | RMSE, MAE | BTC:3166 | - |
| [105] | Price Data | RNN, LSTM | 24h | BTC | - | BTC:1076 | - |
| [130] | Price Data | LSTM, GRU | 4h, 12h, 24h | BTC | RMSE, MAPE, R2 | BTC:7962 | 80/20 |
| [131] | Price Data | LSTM | 24h | BTC | MAE, MSE | BTC:1076 | - |
| [194] | Price Data | ML, DL | 24h | BTC, ETH and more | MSE, RMSE, MAE | For each currency 1277 | - |
| [217] | Price Data, Technical indicators | LSTM, ALEN | 1m | BTC | Accuracy, Precision, Recall, F1 | BTC:1549440 | 60/40 |
| [74] | Price Data | RNN, GRU, LSTM, XGBoost | 24h | BTC, ETH, XRP | RMSE | For each currency 3377 | - |
| [121] | Price Data | LSTM, MA, CMA, ANN | 24h | BTC, ETH and more | Correlation, MPE, MAPE, RMSE | For each currency 660 | 80/20 |
| [218] | Price Data, Blockchain Data | DRCNN,DNDT | 24h | BTC | RMSE, MAPE | BTC:3166 | 70/30 |
| [219] | Price Data | GRU, MLP | 24h | BTC | MSE, RMSE, PR, R2 | BTC:531 | 70/30 |
| [67] | Price Data, Sentimental Data | LSTM, MM-LSTM | 24h | BTC, ETH and more | RMSE | For each currency 27 | - |
| [81] | Price Data | DNN | - | BTC | MSE, MSLE | - | - |
| [220] | Price Data | DFFNN | 5m | BTC | RMSE | BTC:231840 | 80/20 |
| [109] | Price Data, Sentimental Data | RNN, LSTM | 1m | BTC | MSE, R2, FB, MAE, ME | BTC:129316 | 92/8 |
| [114] | Price Data, Blockchain Data | RSM, MLP, LSTM | 1m, 30m | BTC | Accuracy, Recall, Precision, F1 | BTC:1980000 | - |
| [93] | Price Data, Technical Indicators | CNN, DFNN,GRU , BT | 24h | BTC, ETH, and more | NSE, EVS, t-test, MAPE | For each currency 1874 | - |
| [95] | Price Data | CNN,RW, MLP, LSTM | 24h | BTC | MAE, MAPE,DSTAT, RMSE | BTC:3107 | 80/20 |
| [221] | Sentimental Data | BART-ZSC, FinBERT, EZU-NB, EZFU | 24h | BTC, ETH | Accuracy, Recall, Precision, F1 | For each currency 536 | 75/25 |
| [155] | Price Data | LSTM | 24h | BTC, ETH and more | RMSE | For each currency 2058 | - |
| [222] | Price Data | CA | 24h | - | - | - | - |
| [223] | Price Data | RNN, LSTM | 24h | BTC | - | - | - |
| [154] | - | LSTM | 24h | BTC | - | BTC:4016 | 70/30 |
| [146] | Price Data | LSTM | 24h | BTC | Accuracy, RMSE | BTC:1460 | 80/20 |
| [49] | Price Data, Sentimental Data | LSTM, RoBERTa | 24h | AVAX, XRP, and more | MAE, RMSE, MPE | - | 70/30 |
| [30] | Price Data, Sentimental Data | ANN, LSTM, FS | 24h | - | - | - | - |
| [54] | Price Data | LSTM, GB | 10m | BTC, ETH, ETH and more | Accuracy, Recall, Precision, F1 | For each currency 48816 | - |
| [125] | Price Data, Sentimental Data | LSTM, GRU | 24h | DOGE | RMSE | DOGE:2168 | - |
| [165] | Price Data | LSTM | 24h | BTC | RMSE, MAE | BTC:275 | - |
| [153] | Price Data | TCN, LSTM,GRU, NBEATS, TFT | 24h | ETH | MSE, MAE, RMSE, R2, MAPE | ETH:2594 | 70/30 |
| [106] | Price Data | RNN , LSTM | 24h | BTC, ETH | MAPE, RMSE | For each currency 2160 | 80/20 |
| [84] | Price Data | ANN, SETAR | 24h | BTC, ETH | RMSE, MAE | For each currency 2577 | 80/20 |
| [96] | Price Data, Sentimental Data | CNN | 4h | ETH | Accuracy, Precision, Recall, F1, Support | ETH:2190 | - |
| [170] | Price Data | DLST, VR, LSTM, GARCH | 24h | BTC | RMSE, F1, Precision, Recall | BTC:2096 | 70/30 |
| [88] | Price Data | ARCH, GARCH, MLP, RNN, LSTM | 24h | BTC | MAPE, MAE | BTC:2798 | - |
| [145] | Price Data | GRU, LSTM | 24h | BTC, ETH, ADA | RMSE, MAD | For each currency 1826 | 80/20 |
| [132] | Price Data | LSTM | 24h | BTC | Accuracy, Recall, Precision, ST | - | 67/33 |
| [101] | Price Data | MLR, RNN | 24h | BTC, ETH, and more | Sensitivity, Specificity, PPV, NPV, BACC, OA, Kappa, 95% CI | For each currency 918 | 77/23 |
| [99] | Price Data, Blockchain Data | RNN, LSTM | 24h | BTC | RMSE | BTC:3520 | - |
| [162] | Price Data | LSTM, GRU, BiGRU, LightGBM | 24h | BTC | RMSE, MSE, DA, MAE | BTC:3282 | - |
| [102] | Price Data | RNN, DLNN, HEM, LSTM | 24h | - | RMSE, MAD | for each currency 1641 | 70/30, 80/20, 90/10 |
| [35] | Price Data, Blockchain Data | LSTM | 24h | BTC | Accuracy | - | - |
| [126] | Price Data | LSTM, CDSA, MLP | 24h | BTC | Accuracy, Precision, Recall, F1 | - | - |
| [116] | Price Data | LSTM | 24h | BTC, ETH, LTC | MSE, RMSE, MAE, MAPE, R2 | - | - |
| [224] | Price Data | CNN, LSTM, BiLSTM | 4h, 9h, 12h, 16h | BTC, ETH , XRP | MAE, RMSE, Accuracy, F1 | For each currency 14592 | - |
| [64] | Price Data | LSTM | 24h | BTC | MSE, MAE, RMSE | BTC:4700 | - |
| [117] | Price Data | LSTM | 24h | BTC | RMSE, MAPE | BTC:2049 | 90/10 |
| [127] | Price Data | ANN, CNN, LSTM, CapsNet | 24h | BTC | MSE, MAPE, Accuracy, Precision | BTC:2551 | 70/30 |
| [36] | Price Data | ARIMA | 120d | BTC | - | BTC:2191 | - |
| [225] | Price Data | ANN-GARCH, HONN | 24h | BTC | MAE, RMSE, MAPE | BTC:2922 | 80/20 |
| [92] | Price Data | CNN, PSO, GHO, BGHO-CNN | - | BTC | RMSE, MAPE, Precision, Recall, F1 | 70/30 | |
| [139] | Sentimental Data | LSTM | - | - | - | - | 80/20 |
| [52] | Price Data | MLP | 24h | BTC | Accuracy, StdDeviation, Mean, RMSE, ROC, AUC | BTC:2760 | 80/20 |
| [110] | Price Data, Blockchain Data, Sentimental Data | LSTM | 30d, 60d | BTC | RMSE, MAE | BTC:1611 | - |
| [160] | Price Data | ARIMA, LSTM | 10m | BTC | MAPE, MAE, RMSE | BTC:52560 | - |
| [226] | Price Data, Blockchain Data | FNN, NARX | 24h | BTC | MAE, MFE, RMSE, MAPE and MASE | BTC:1035 | - |
| [98] | Price Data | SMA, GARCH, RNN | 24h | BTC | RMSE, MAE | BTC:2031 | - |
| [203] | Price Data, Blockchain Data, External Economic Data | ANN, BNN, SVR, SVM | 24h | ETH | RMSE, MAPE | ETH:1213 | - |
| [55] | Price Data | MLP, ANFIS, RF, SVR, MARS, LASSO | 24h | BTC | - | BTC:2237 | 80/20 |
| [80] | Price Data | ANN | 24h | BTC | MSE | - | - |
| [57] | Price Data | SVM,KNN, LGBM | 24h | BTC, ETH, LTC | F1, ccuracy | For each currency 17 | - |
| [129] | Price Data | EEMD, LSTM | 4h | BTC | MSE | BTC:7884 | 70/15/15 |
| [227] | Price Data | LSTM | 120d, 7d, 1d, 1h, 1m | BTC | MSE, RMSE, MAPE, MAE | BTC:1314 | 90/10 |
| [107] | Price Data | RNN, LSTM | 24h | BTC | MSE | BTC: 1826 | - |
| [72] | Price Data, Technical Indicators | MLP, LR, BRR, RFR, LASSO, SVR, DE | 24h | BTC | MSE | BTC: 1002 | - |
| [159] | Price Data, Sentimental Data | LSTM, ARIMA, LR | 24h | BTC | RMSE | BTC: 2922 | 80/20 |
| [58] | Price Data | LSTM, LR | 24h | BTC, ETH and more | MSE | - | 80/20 |
| [108] | Price Data | RNN, LSTM | 24h | BTC | - | BTC: 3408 | 80/20 |
| [157] | Price Data | LSTM | 24h, 1h | BTC | MSE | BTC:36997 | - |
| [140] | Sentimental Data | LSTM | 24h | BTC | RMSE, Accuracy | BTC: 731 | - |
| [201] | Price Data | ARMA, NN, GARCH, HAR | 5m | BTC, ES, GSPC | MAPE, Accuracy | For each currency 630144 | - |
| [82] | Price Data | ANN | 1h | BTC | - | - | - |
Table A3.
Deep reinforcement learning-based summarized literature review
| Cite | Input Category | Methodology | Interval | Currency | Metrics | Samples | Train/Test |
|---|---|---|---|---|---|---|---|
| [228] | Price Data, Blockchain Data | RL | 24h | LTC, XMR | MAE, MAPE, RMSE, MSE | LTC:1276, XMR:1826 | 80/20 |
| [229] | - | DRL | 24h | BTC, ETH and more | CumR, SharpeRatio, SortinoRatio, MD, VAT | For each currency 1429 | - |
| [230] | Price Data, Sentimental Data, Alternative Data | PPO, A2C, DDPG | - | - | - | - | - |
| [231] | Price Data, Blockchain Data | SA-NET, SA-NET-NF, Betancourt and Chen | 30m | - | mean, standard deviations | - | - |
| [232] | Price Data | DERL, Q-learning, evolution strategy, and Policy Gradient | 1m | BTC | CLR, MDD, RR | - | - |
| [228] | Price Data, Blockchain Data, Sentimental Data | RL + Blockchain framework | 24h | LTC, XMR | MAE, MSE, RMSE, MAPE | XMR:1850, LTC:1850 | 80/20 |
| [233] | Price Data, Technical Indicators | Q-learning, DQN | 24h | BTC | - | BTC:3726 | 80/20 |
| [234] | Price Data | PPO, A2C,TradeR | - | - | - | - | |
| [235] | - | PPO, A2C | - | BTC | cumulative return | - | - |
| [236] | - | DRL neural model | 1h | BTC, LTC, ETH | - | - | - |
| [237] | Price Data | PPO, A2C, A3C, APPO, DQN, IMPALA | 4h | BTC | - | - | 80/20 |
| [229] | - | Direct Reinforcement Learning | - | BTC, ETH and more | Sortino | - | - |
| [237] | Price Data | PPO, A2C, A3C, APPO, DQN, IMPALA | 4h | BTC | - | - | 80/20 |
| [229] | - | Direct Reinforcement Learning | - | BTC, ETH and more | Sortino | - | - |
| [85] | Price Data | GAF-CNN, PPO-RL | 15m | ETH | - | - | - |
| [238] | Price Data, Technical Indicators | Ensemble policy, FinRL, Buy-hold | 1h | BTC, ETH,and more | Sortino, Sharpe ratios and more | - | - |
| [239] | Price Data, Technical Indicators | PPO, CNN-LSTM | - | BTC, ETH and more | Accuracy | - | 70/30 |
| [240] | Price Data, Technical Indicators, Sentimental Data | TraderNet-CR, DDQN, PPO | 1h | BTC, ETH,and more | - | - | - |
| [241] | Price Data, Techincal Indicators | PPO, TD3, SAC | 5m | BTC, ETH and more | cumulative return, volatility | - | - |
| [184] | Price Data | DDQN, buy and hold | 24h | BTC, ETH and more | annualized return, max drawdown | - | - |
| [242] | Price Data | DD-DQNs | 1m | BTC | - | - | - |
| [243] | Price Data | D-DDQN, DDQN, BO | 15m | BTC | - | - | 80/20 |
| [244] | Price Data, Blockchain Data, Sentimental Data | RBFNN, BPNN, ARIMA | - | XMR, LTC, ORY, BTC | MSE, MAPE, RMSE, MAE | - | 80/20 |
| [204] | Price Data | NNETAR, CSS | - | BTC, ETH,and more | MAE, RMSE | For each currency 1296 | 80/20 |
| [207] | Price Data | BART, CART, ARIMA | - | BTC, ETH, XRP | RMSE | For each currency 789 | 80/20 |
| [124] | Price Data, Sentimental Data | ARIMA | 1m, 1h | BTC | RMSE | BTC:187200 | 80/20 |
| [191] | Price Data | ARIMA | 24h | BTC, ETH,and more | MAPE, RMSE | For each currency 1328 | 85/15 |
| [61] | Price Data | ARIMA, ES, TS | 24h | BTC | RMSE, MSE | BTC:1000 | 75/25 |
| [73] | Price Data | ARIMA | 24h | BTC | RMSE, MAE, R2 | - | - |
| [245] | Price Data | ECMs | - | BTC | RMSE, MAE, MAPE | - | - |
| [206] | Price Data | BART | 24h | BTC, ETH, XRP | RMSE | BTC:789 | 80/20 |
| [192] | - | Prophet, ARIMA, LSTM, XGBOOST, SVM, LR, NB | - | - | - | - | - |
| [138] | Technical Indicators, Price Data | GARCH | 7d, 14d, 21d | BTC | HMSE, HMAE | BTC:2283 | - |
| [193] | - | ARIMA | 24h | BTC and more | MAE, RMSE, MAPE | For each currency 1461 | 80/20 |
| [160] | Price Data | ARIMA | 10m | BTC | MAPE, MAE, RMSE | BTC:52560 | - |
| [198] | Price Data | GARCH | 24h | BTC, ETH, and more | MAE, HMSE, R2 | For each currency 1458 | 98/2 |
| [197] | Price Data | Box-Jenkins, AR, MA,ARIMA, ACF, PACF, GS | 24h | BTC | FE, MFE, MAE, MSE, RMSE | BTC:2028 | 98/2 |
| [98] | Price Data | SMA, GARCH | 24h | BTC | RMSE, MAE | BTC:2031 | - |
| [196] | Price Data | ARIMA | - | - | Accuracy | - | - |
| [209] | Price Data | GTM | 1h | BTC | RMSE, MAE | BTC:13896 | - |
| [88] | Price Data | ARCH, GARCH | 24h | BTC | MAPE, MAE | BTC:2798 | - |
| [115] | Blockchain Data, Price Data | ARIMA | 24h | BTC | RMSE | - | 70/30, 80/20, 90/10 |
| [169] | Price Data | ARIMA, GARCH | 1h | SOL, BTC, ETH | MSE, RMSE, MAE, MAPE, MASE | For each currency 3336 | - |
| [195] | Price Data, Technical Indicators | ARIMA | 24h | BTC, ETH,and more | MAE, MSE, RMSE, Mean, Accuracy | For each currency 2121 | 80/20 |
| [246] | Price Data | FG | 24h | BTC, ETH, LTC | MAPE, MAE, RMSE | For each currency 14 | - |
| [116] | Price Data | ARIMA | 24h | BTC, ETH, LTC | MSE, RMSE, MAE, MAPE, R2 | - | - |
| [71] | Price Data | LSTM, GRU, HYBRID, KNN, TCN, ARIMA, TFT, RF, SVR | 24h | BTC, ETH and more | RMSE, MAE, MAPE, R2 | For each currency 1825 | 80/20 |
| [161] | Price Data | GARCH, EGARCH, APGARCH | 24h | BTC, ETH and more | RMSE | For each currency 1461 | 80/20 |
| [33] | Price Data | ARIMA | 24h | BTC | RMSE, MAPE | BTC:74 | - |
| [28] | Price Data | ARIMA | 24h | BTC | RMSE, MAPE | BTC:167 | - |
| [87] | - | GARCH | 1h to 24h | BTC, ETH and more | HSE | For each currency 21744 | - |
| [147] | Price Data | ARIMA | 24h | BTC | RMSE, MAE | BTC:3166 | - |
| [205] | Blockchain Data, External Economic Data | ANFIS | 24h | BTC | RMSE | BTC:2858 | 50/50, 60/40, 70/30, 80/20, 90/10 |
| [194] | Price Data | SM, ARIMA | 24h | BTC, ETH and more | MSE, RMSE, MAE | For each currency 1277 | - |
| [74] | Price Data | ARIMA | 24h | BTC, ETH, XRP | RMSE | For each currency 3377 | - |
| [199] | Sentimental Data, Price Data | VAR | 7d | BTC | - | BTC:208 | - |
| [200] | Price Data | JRRS | 24h | BTC, ETH, and more | - | BTC: 1095 ,ETH: 1095, LTC: 730, XRP: 730 | - |
| [201] | Price Data | ARMA, GARCH, HAR | 5m | BTC, ES, GSPC | MAPE, Accuracy | For each currency 630144 | - |
| [202] | Price Data | GARCH, ARIMA | 24h | BTC, ETH, BNB | - | For each currency 1877 | - |
| [203] | Price Data | BSV, GARCH | 24h | BTC, ETH and more | MSE | For each currency 100, 300 | - |
| [55] | Price Data | MARS, LASSO | 24h | BTC | - | BTC:2237 | 80/20 |
| [75] | Price Data, Technical indicators | ARIMA, Prophet, XGBoost | - | BTC | MAPE, R2 | - | - |
| [159] | Price Data, Sentimental Data | ARIMA | 24h | BTC | RMSE | BTC: 2922 | 80/20 |
| [208] | Price Data | LS | 24h | BTC | Correlation, MPE, MAPE, RMSE, SD, SharpeRatio | BTC: 354 | - |
| [122] | Price Data | ARIMA | 5s | BTC | - | - | 80/20 |
| [53] | Price Data | ARIMA | 1h | BTC | Accuracy | BTC:29592 | - |
References
- Minsky, H.P. Stabilizing an Unstable Economy; Yale University Press, 1986.
- Nakamoto, S. Bitcoin: A Peer-to-Peer Electronic Cash System, 2008. White paper, accessed: 2024-11-07.
- Olvera-Juarez, D.; Huerta-Manzanilla, E. Forecasting Bitcoin Pricing with Hybrid Models: A Review of the Literature. International Journal of Advanced Engineering Research and Science 2019, 6. [CrossRef]
- Kervanci, I.; Akay, F. Review on Bitcoin Price Prediction Using Machine Learning and Statistical Methods. Sakarya University Journal of Computer and Information Sciences 2020, 3. [CrossRef]
- Fang, F.; Ventre, C.; M. Basios, e.a. Cryptocurrency Trading: A Comprehensive Survey. Financ Innov 2022, 8. [CrossRef]
- Charandabi, S.E.; Kamyar, K. Survey of Cryptocurrency Volatility Prediction Literature Using Artificial Neural Networks. Business and Economic Research 2022, 12. [CrossRef]
- Yamin, M.A.; Chaudhry, M. Cryptocurrency Market Trend and Direction Prediction using Machine Learning: A Comprehensive Survey. Authorea 2023.
- Biju, A.; Thomas, A.; Thasneem, J. Examining the Research Taxonomy of Artificial Intelligence, Deep Learning and Machine Learning in the Financial Sphere—A Bibliometric Analysis. Qual Quant 2023. [CrossRef]
- Cortes, C.; Vapnik, V. Support-vector networks. Machine learning 1995, 20, 273–297. [CrossRef]
- Drucker, H.; Burges, C.J.; Kaufman, L.; Smola, A.J.; Vapnik, V.N. Support vector regression machines. Advances in neural information processing systems 1997, 9, 155–161.
- Breiman, L. Random forests. Machine Learning 2001, 45, 5–32. [CrossRef]
- Wright, T. The Generalized R Squared and the Generalized R Squared Statistic in Linear Regression Analysis. Journal of Educational and Behavioral Statistics 1994, 19, 385–417.
- Langley, P.; Iba, W.; Thompson, K. An analysis of Bayesian classifiers. Proceedings of the Tenth National Conference on Artificial Intelligence 1992, 1, 223–228.
- Cover, T.; Hart, P. Nearest neighbor pattern classification. IEEE Transactions on Information Theory 1967, 13, 21–27. [CrossRef]
- LeCun, Y.; Bengio, Y.; Hinton, G. Deep learning. Nature 2015, 521, 436–444. [CrossRef]
- Rumelhart, D.E.; Hinton, G.E.; Williams, R.J. Learning representations by back-propagating errors. Nature 1986, 323, 533–536. [CrossRef]
- LeCun, Y.; Bottou, L.; Bengio, Y.; Haffner, P. Gradient-based learning applied to document recognition. Proceedings of the IEEE 1998, 86, 2278–2324. [CrossRef]
- Hochreiter, S.; Schmidhuber, J. Long short-term memory. Neural computation 1997, 9, 1735–1780. [CrossRef]
- Cho, K.; Van Merriënboer, B.; Gulcehre, C.; Bahdanau, D.; Bougares, F.; Schwenk, H.; Bengio, Y. Learning Phrase Representations using RNN Encoder-Decoder for Statistical Machine Translation, 2014.
- Vaswani, A.; Shazeer, N.; Parmar, N.; Uszkoreit, J.; Jones, L.; Gomez, A.N.; Kaiser, .; Polosukhin, I. Attention is all you need. Advances in neural information processing systems, 2017, pp. 5998–6008.
- Mnih, V.; Kavukcuoglu, K.; Silver, D.; Rusu, A.A.; Veness, J.; Bellemare, M.G.; Graves, A.; Riedmiller, M.; Fidjeland, A.K.; Ostrovski, G.; others. Human-level control through deep reinforcement learning, 2015.
- Schulman, J.; Wolski, F.; Dhariwal, P.; Radford, A.; Klimov, O. Proximal policy optimization algorithms, 2017.
- Mnih, V.; Badia, A.P.; Mirza, M.; Graves, A.; Lillicrap, T.; Harley, T.; Silver, D.; Kavukcuoglu, K. Asynchronous methods for deep reinforcement learning, 2016.
- Watkins, C.J.; Dayan, P. Q-learning. Machine learning 1992, 8, 279–292. [CrossRef]
- Box, G.E.; Jenkins, G.M.; Reinsel, G.C.; Ljung, G.M. Time series analysis: forecasting and control; John Wiley & Sons, 2015.
- Bollerslev, T. Generalized autoregressive conditional heteroskedasticity, 1986.
- Hitam, N.A.; Ismail, A.R. Comparative performance of machine learning algorithms for cryptocurrency forecasting. Ind. J. Electr. Eng. Comput. Sci 2018, 11, 1121–1128. [CrossRef]
- Khedmati, M.; Seifi, F.; Azizi, M. Time series forecasting of Bitcoin price based on ARIMA and machine learning approaches. iJARS International Journal of Engineering 2019, 33, 1293–1303.
- Valencia, F.; Gómez-Espinosa, A.; Valdés-Aguirre, B. Price movement prediction of cryptocurrencies using sentiment analysis and machine learning. entropy 2019, 21, 589. [CrossRef]
- Cohen, G. Algorithmic trading and financial forecasting using advanced artificial intelligence methodologies. Mathematics 2022, 10, 3302. [CrossRef]
- Alahmari, S. Predicting the Price of Cryptocurrency using Support Vector Regression Methods. JOURNAL OF MECHANICS OF CONTINUA AND MATHEMATICAL SCIENCES 2020, 15. [CrossRef]
- Pabuçcu, H.; Ongan, S.; Ongan, A. Forecasting the movements of Bitcoin prices: an application of machine learning algorithms. Quantitative Finance and Economics 2020, 4, 679–692. [CrossRef]
- Khedmati, M.; Seifi, F.; Azizi, M.J. Time Series Forecasting of Bitcoin Price Based on Autoregressive Integrated Moving Average and Machine Learning Approaches. International Journal of Engineering 2020, 33, 1293–1303,.
- Salman, M.K.; Ibrahim, A.A. Price Prediction of Different Cryptocurrencies Using Technical Trade Indicators and Machine Learning. IOP Conference Series: Materials Science and Engineering 2020, 928, 032007. [CrossRef]
- Kolla, B. Predicting Crypto Currency Prices Using Machine Learning and Deep Learning Techniques. International Journal of Advanced Trends in Computer Science and Engineering 2020, 9. [CrossRef]
- Vidyulatha, G.; Mounika, M.; Arpitha, N. Crypto Currency Prediction Model using ARIMA. Turkish Journal of Computer and Mathematics Education (TURCOMAT) 2021, 11, 1654–1660.
- Jaquart, P.; Dann, D.; Weinhardt, C. Short-term bitcoin market prediction via machine learning. The Journal of Finance and Data Science 2021, 7, 45–66. [CrossRef]
- Salb, M.; Elsadai, A.; Zivkovic, M.; Bacanin, N. Cryptocurrency Forecasting Using Optimized Support Vector Machine with Sine Cosine Metaheuristics Algorithm, 2021. [CrossRef]
- Akyildirim, E.; Cepni, O.; Corbet, S.; Uddin, G.S. Forecasting mid-price movement of Bitcoin futures using machine learning. Annals of Operations Research 2023, 330, 553–584. [CrossRef]
- Falcon, A.; Lyu, T. Daily Cryptocurrency Returns Forecasting and Trading via Machine Learning. Journal of Student Research 2021, 10. [CrossRef]
- Shankhdhar, A.; Singh, A.K.; Naugraiya, S.; Saini, P.K. Bitcoin Price Alert and Prediction System using various Models. IOP Conference Series: Materials Science and Engineering 2021, 1131, 012009. [CrossRef]
- Mudassir, M.; Bennbaia, S.; Unal, D.; Damiani, E. Time-series forecasting of Bitcoin prices using high-dimensional features: a machine learning approach. Neural Computing and Applications 2020. Online First. [CrossRef]
- Mahdi, E.; Leiva, V.; Mara’Beh, S.; Martin-Barreiro, C. A new approach to predicting cryptocurrency returns based on the gold prices with support vector machines during the COVID-19 pandemic using sensor-related data. Sensors 2021, 21, 6319. [CrossRef]
- Zhou, Z.; Song, Z.; Xiao, H.; Ren, T. Multi-source data driven cryptocurrency price movement prediction and portfolio optimization. Expert Systems with Applications 2023, 219, 119600. [CrossRef]
- Maleki, N.; Nikoubin, A.; Rabbani, M.; Zeinali, Y. Bitcoin Price Prediction Based on Other Cryptocurrencies Using Machine Learning and Time Series Analysis. Scientia Iranica 2020. [CrossRef]
- Livieris, I.E.; Pintelas, E.; Stavroyiannis, S.; Pintelas, P. Ensemble Deep Learning Models for Forecasting Cryptocurrency Time-Series. Algorithms 2020, 13. [CrossRef]
- Duraimurugan, J.; Mahalakshmi, G.; Apirajitha, P.; Anbarasi, N. Cryptocurrency Forecasting Using Linear Regression, 2022.
- Bhatt, S.; Ghazanfar, M.; Amirhosseini, M. Machine learning based cryptocurrency price prediction using historical data and social media sentiment. Computer Science & Information Technology (CS & IT) 2023, 13, 1–11.
- Jain, S.; Johari, S.; Delhibabu, R. Analyzing Cryptocurrency trends using Tweet Sentiment Data and User Meta-Data. arXiv preprint arXiv:2307.15956 2023.
- Sebastião, H.; Godinho, P. Forecasting and trading cryptocurrencies with machine learning under changing market conditions. Financial Innovation 2021, 7, 1–30. [CrossRef]
- Gopya Sri Arumalla, Nalini T, G. BITCOIN PRICE FLUCTUATION ANALYSIS AND PREDICTION USING MACHINE LEARNING, 2023.
- Ziweritin, S. Height-end Multi-layer Perceptron and Machine Learning Methods of Forecasting Bitcoin Price Time Series. Authorea Preprints 2023.
- Mangla, N. Bitcoin Price Prediction Using Machine Learning, 2019.
- Kwon, D.H.; Kim, J.B.; Heo, J.S.; Kim, C.M.; Han, Y.H. Time Series Classification of Cryptocurrency Price Trend Based on a Recurrent LSTM Neural Network. J. Inf. Process. Syst. 2019, 15, 694–706.
- Jana, R.; Ghosh, I.; Das, D. A differential evolution-based regression framework for forecasting Bitcoin price. Annals of Operations Research 2021, 306, 295–320. [CrossRef]
- Auti, A.; Patil, D.; Zagade, O.; Bhosale, P.; Ahire, P. Bitcoin Price Prediction Using Svm. Int. J. Eng. Appl. Sci. Technol 2022, 6, 226–229. [CrossRef]
- Al Hawi, L.; Sharqawi, S.; Al-Haija, Q.A.; Qusef, A. Empirical evaluation of machine learning performance in forecasting cryptocurrencies. Journal of Advances in Information Technology 2023, 14. [CrossRef]
- Dhande, A.; andShivang Parnami, S.D.; Vijayakumar, K.P. Cryptocurrency Price Prediction Using Linear Regression and Long Short Memory (LSTM), 2022.
- Asgari, M.; Khasteh, H. Profitable strategy design for trades on cryptocurrency markets with machine learning techniques. arXiv preprint arXiv:2105.06827 2021.
- Reddy, L.S.; Sriramya, D. A Research On Bitcoin Price Prediction Using Machine Learning Algorithms. International Journal of Scientific & Technology Research 2020, 9, 1600–1604.
- Septiarini, T.; Taufik, M.; Afif, M.; Masyrifah, A. A comparative study for Bitcoin cryptocurrency forecasting in period 2017-2019. Journal of Physics: Conference Series 2020, 1511, 012056. [CrossRef]
- Parra-Moyano, J.; Partida, D.; Gessl, M. Your sentiment matters: A machine learning approach for predicting regime changes in the cryptocurrency market. The 56th Hawaii International Conference on System Sciences. HICSS 2023. Hawaii International Conference on System Sciences (HICSS), 2023, pp. 920–929.
- Siddharth, D.; Kaushik, J. Cryptocurrency price prediction using deep learning and machine learning. Technical report, EasyChair, 2022.
- Suresh, M.; SC, A.; MS, A.S.; Karan, R.S.; KP, V.B. BITCOIN PRICE FORECASTING USING LSTM. International Research Journal of Modernization in Engineering Technology and Science 2023.
- Gyamerah, S.A. Are Bitcoins price predictable? Evidence from machine learning techniques using technical indicators, 2019, [arXiv:q-fin.ST/1909.01268].
- Yao, S.; Ma, D.; Zhang, Y. Prediction of Bitcoin Price Movements Based on Machine Learning Method and Strategy Construction, 2020. Available as PDF.
- Balcı, F. Improving the prediction accuracy in deep learning-based cryptocurrency price prediction. Academic Platform Journal of Engineering and Smart Systems 2023, 11, 47–61. [CrossRef]
- Jaquart, P.; Köpke, S.; Weinhardt, C. Machine learning for cryptocurrency market prediction and trading. The Journal of Finance and Data Science 2022, 8, 331–352. [CrossRef]
- Dimitriadou, A.; Gregoriou, A. Predicting Bitcoin prices using machine Learning. Entropy 2023, 25, 777. [CrossRef]
- Toledo, J.d.M.; Souza, D.Y. Signal Prediction in Cryptocurrency Tradeoperations: A Machine Learning-Based Approach. Available at SSRN 4062476 2022. [CrossRef]
- Murray, K.; Rossi, A.; Carraro, D.; Visentin, A. On forecasting cryptocurrency prices: A comparison of machine learning, deep learning, and ensembles. Forecasting 2023, 5, 196–209. [CrossRef]
- Asgari, M.H.; Madanchi Zaj, M.; Daneshvar, A.; Manzoor, D. Bitcoin price forecasting by applying combination of stacking method and Differential Evolution Algorithm. International Journal of Finance & Managerial Accounting 2024, 9, 93–118.
- Iqbal, M.; Iqbal, M.S.; Jaskani, F.H.; Iqbal, K.; Hassan, A. Time-Series Prediction of Cryptocurrency Market using Machine Learning Techniques. EAI Endorsed Transactions on Creative Technologies 2021, 8. [CrossRef]
- Kang, C.Y.; Lee, C.P.; Lim, K.M. Cryptocurrency price prediction with convolutional neural network and stacked gated recurrent unit. Data 2022, 7, 149. [CrossRef]
- Kumar, A.; Sunny, S. Comparative analysis of machine learning models for predicting bitcoin price rate. International Research Journal of Modernization in Engineering, Technology and Science 2021, 3, 234–238.
- Nair, K.; Pawle, A.; Trisal, A.; Krishnan, S. Bitcoin Price Prediction Using Sentimental Analysis - A Comparative Study of Neural Network Model for Price Prediction, 2022. [CrossRef]
- Koosha, E.; Seighaly, M.; Abbasi, E. Predicting the Top and Bottom Prices of Bitcoin Using Ensemble Machine Learning. Advances in Mathematical Finance and Applications 2023, 8, 895–913.
- Liao, C.; Lu, K.; Zhang, J. Cryptocurrency price tendency analysis using conventional statistical model and machine learning approach. Proceedings of the International Conference on Financial Innovation, FinTech and Information Technology, FFIT 2022, October 28-30, 2022, Shenzhen, China, 2023.
- Kolokotronis, D. Ethereum forecasting by utilizing machine and deep learning. PhD thesis, Tilburg University, 2021.
- Almeida, J.; Tata, S.; Moser, A.; Smit, V. Bitcoin prediciton using ANN. Neural networks 2015, 7, 1–12.
- Ly, B.; Timaul, D.; Lukanan, A.; Lau, J.; Steinmetz, E. Applying deep learning to better predict cryptocurrency trends. Midwest Instruction and Computing Symposium, 2018.
- Sovia, R.; Yanto, M.; Budiman, A.; Mayola, L.; Saputra, D. Backpropagation neural cryptocurrency bitcoin prices, 2019.
- Park, J.; Seo, Y.S. A deep learning-based action recommendation model for cryptocurrency profit maximization. Electronics 2022, 11, 1466. [CrossRef]
- Ahmad, Z.; Almaspoor, Z.; Khan, F.; Alhazmi, S.E.; El-Morshedy, M.; Ababneh, O.; Al-Omari, A.I. On fitting and forecasting the log-returns of cryptocurrency exchange rates using a new logistic model and machine learning algorithms. AIMS Math 2022, 7, 18031–18049. [CrossRef]
- Chen, S. Cryptocurrency financial risk analysis based on deep machine learning. Complexity 2022, 2022, 2611063. [CrossRef]
- Indera, N.; Yassin, I.; Zabidi, A.; Rizman, Z. Non-linear autoregressive with exogeneous input (NARX) Bitcoin price prediction model using PSO-optimized parameters and moving average technical indicators. Journal of fundamental and applied sciences 2017, 9, 791–808. [CrossRef]
- García-Medina, A.; Aguayo-Moreno, E. LSTM–GARCH hybrid model for the prediction of volatility in cryptocurrency portfolios. Computational Economics 2024, 63, 1511–1542. [CrossRef]
- Pratas, T.E.; Ramos, F.R.; Rubio, L. Forecasting bitcoin volatility: exploring the potential of deep learning. Eurasian Economic Review 2023, 13, 285–305. [CrossRef]
- Jiang, Z.; Liang, J. Cryptocurrency portfolio management with deep reinforcement learning. 2017 Intelligent systems conference (IntelliSys). IEEE, 2017, pp. 905–913.
- Ji, S.; Kim, J.; Im, H. A comparative study of bitcoin price prediction using deep learning. Mathematics 2019, 7, 898. [CrossRef]
- Li, Y.; Dai, W. Bitcoin price forecasting method based on CNN-LSTM hybrid neural network model. The journal of engineering 2020, 2020, 344–347. [CrossRef]
- Kumar, A.S.; Priyanka, S.; Dhanashree, K.; Praveen, V.; Rekha, R. Efficient binary grasshopper optimization based neural network algorithm for bitcoin value prediction. International Journal of Nonlinear Analysis and Applications 2022, 13, 53–60.
- Oyedele, A.A.; Ajayi, A.O.; Oyedele, L.O.; Bello, S.A.; Jimoh, K.O. Performance evaluation of deep learning and boosted trees for cryptocurrency closing price prediction. Expert Systems with Applications 2023, 213, 119233. [CrossRef]
- Hao, M.; Lenskiy, A. Short-Term Volatility Prediction Using Deep CNNs Trained on Order Flow. arXiv e-prints 2023, pp. arXiv–2304.
- He, K.; Yang, Q.; Ji, L.; Pan, J.; Zou, Y. Financial time series forecasting with the deep learning ensemble model. Mathematics 2023, 11, 1054. [CrossRef]
- El Zaar, A.; Benaya, N.; Bakir, T.; Mansouri, A.; El Allati, A. Prediction of US 30-years-treasury-bonds movement and trading entry point using the robust 1DCNN-BiLSTM-XGBoost algorithm. Expert Systems 2024, 41, e13459. [CrossRef]
- McNally, S. Predicting the price of Bitcoin using Machine Learning. PhD thesis, Dublin, National College of Ireland, 2016.
- Shen, Z.; Wan, Q.; Leatham, D.J. Bitcoin Return Volatility Forecasting: A Comparative Study of GARCH Model and Machine Learning Model, 2019.
- Dutta, A.; Kumar, S.; Basu, M. A gated recurrent unit approach to bitcoin price prediction. Journal of risk and financial management 2020, 13, 23. [CrossRef]
- Vanderbilt, D.; Xie, K.; Sun, W. AN APPLIED STUDY OF RNN MODELS FOR PREDICTING CRYPTOCURRENCY PRICES. Issues in Information Systems 2020, 21.
- Oyewola, D.; Dada, E.; Ndunagu, J.; Emmanuel, D.E. Predicting COVID-19 impact on demand and supply of cryptocurrency using machine learning. International Journal of Applied Mathematics Electronics and Computers 2021, 9, 52–66. [CrossRef]
- Miller, D.; Kim, J.M. Univariate and multivariate machine learning forecasting models on the price returns of cryptocurrencies. Journal of Risk and Financial Management 2021, 14, 486. [CrossRef]
- Monish, S.; Mohta, M.; Rangaswamy, S. Ethereum Price Prediction Using Machine Learning Techniques–A Comparative Study. International Journal of Engineering Applied Sciences and Technology 2022, 7, 137–142.
- Nematallah, H.F.; Hesham Sedky, A.A.; Mahar, K.M. Bitcoin Price Trend Prediction Using Deep Neural Network. Webology 2022, 19.
- Patnaikuni Vasavi, C.D.R. BTC Price Prediction Using Deep Learning Algorithms. IJFANS International Journal of Food and Nutritional Sciences 2022.
- Gunarto, D.M.; Sa’adah, S.; Utama, D.Q. Predicting cryptocurrency price using rnn and lstm method. Jurnal Sisfokom (Sistem Informasi dan Komputer) 2023, 12, 1–8. [CrossRef]
- Sasikumar, J.; Mitha, R.M. Prediction model for bitcoin price avail of machine learning, 2023.
- K.TEJASRI.; REDDY, S.G.; P.MURALI.; P.RAJESH.; PAVAN, P. LSTM BASED BITCOIN PRICE PREDICTION SYSTEM USING RNN, 2023.
- MadhusekharYadla.; Tenali, M.A.S. Performance Analysis of Forecasting Price Prediction of Crypto-Currency using Deep Learning algorithm, 2023.
- Struga, K.; Qirici, O. Bitcoin Price Prediction with Neural Networks., 2018.
- Hector Villafuerte, Thomas Passaro, Y.Z. High-frequency Trend Prediction of BTC Exchange Rates Using Technical Indicators and Deep Learning Architectures, 2019.
- Khan, A.S.; Augustine, P. Predictive analytics in cryptocurrency using neural networks: A comparative study. International Journal of Recent Technology and Engineering 2019, 7, 425–429.
- Vo, A.D.; Nguyen, Q.P.; Ock, C.Y. Sentiment analysis of news for effective cryptocurrency price prediction. International Journal of Knowledge Engineering 2019, 5, 47–52. [CrossRef]
- Shintate, T.; Pichl, L. Trend prediction classification for high frequency bitcoin time series with deep learning. Journal of Risk and Financial Management 2019, 12, 17. [CrossRef]
- Swankie, G. Examining the price dynamics of the cryptocurrency market and predicting bitcoin price through the application of statistical analysis and deep learning. MSc Financial Technology 2019, p. 9.
- Chaudhari, A. Forecasting cryptocurrency prices using machine learning. PhD thesis, Dublin, National College of Ireland, 2020.
- Informatika, P.S.M.T. BTC Price Prediction Using Long Short Term Memory (LSTM), 2020.
- Mahar, K.; Narejo, S.; Zaki, M.A. Bitcoin price prediction app using deep learning algorithm. 2nd international conference on computational sciences and technologies, 2020, pp. 56–60.
- Gadey, R.S.; Thakur, N.; Charan, N.; Reddy, R.O. Price prediction of bitcoin using machine learning. International Journal of Engineering Applied Sciences and Technology 2020, 5, 502–506. [CrossRef]
- Jiang, X. Bitcoin price prediction based on deep learning methods. Journal of Mathematical Finance 2019, 10, 132–139. [CrossRef]
- Osifo, E.; Bhattacharyya, R. Cryptocurrency trading-pair forecasting, using machine learning and deep learning technique. Using Machine Learning and Deep Learning Technique (March 5, 2020) 2020.
- Hua, Y. Bitcoin price prediction using ARIMA and LSTM. E3S web of conferences. EDP Sciences, 2020, Vol. 218, p. 01050.
- Gangas, D.A. Deep Learning for cryptocurrency assets: Employing series forecasting models for price prediction and uncertainty quantification, 2020.
- Toriola, A.J. Prediction of Bitcoin Prices Using Deep learning and Sentiment Analysis Based on Bitcoin Tweets. PhD thesis, Dublin, National College of Ireland, 2021.
- Agarwal, B.; Harjule, P.; Chouhan, L.; Saraswat, U.; Airan, H.; Agarwal, P. Prediction of dogecoin price using deep learning and social media trends. EAI Endorsed Transactions on Industrial Networks and Intelligent Systems 2021, 8, e2–e2. [CrossRef]
- Sharifi, A.M.; Khalili Damghani, K.; Abdi, F.; Sardar, S. A hybrid model for predicting bitcoin price using machine learning and metaheuristic algorithms. Journal of applied research on industrial engineering 2022, 9, 134–150.
- Tavakoli, M.; Doosti, H.; Chesneau, C. Capsule Network Regression Using Information Measures: An Application in Bitcoin Market. Advances in Mathematical Finance and Applications 2022, 7, 37–48.
- Arnaut, D.; Bećirović, D. The Potential for Forecasting Cryptocurrency Price Movements Using the LSTM Method. E-business technologies conference proceedings, 2021, Vol. 1, pp. 120–124.
- Yang, L. Next-day bitcoin price forecast based on artificial intelligence methods. arXiv preprint arXiv:2106.12961 2021.
- Alkhodhairi, R.K.; Aljalhami, S.R.; Rusayni, N.K.; Alshobaili, J.F.; Al-Shargabi, A.A.; Alabdulatif, A. Bitcoin candlestick prediction with deep neural networks based on real time data. CMCCOMPUTERS MATERIALS & CONTINUA 2021, 68, 3215–3233.
- Ho, A.; Vatambeti, R.; Ravichandran, S.K. Bitcoin price prediction using machine learning and artificial neural network model. Indian Journal of Science and Technology 2021, 14, 2300–2308. [CrossRef]
- Andi, H.K. An accurate bitcoin price prediction using logistic regression with LSTM machine learning model. Journal of Soft Computing Paradigm 2021, 3, 205–217. [CrossRef]
- Liashenko, O.; Kravets, T.; Repetskyi, Y. Neural Networks in Application to Cryptocurrency Exchange Modeling. IT&I Workshops, 2020, pp. 350–360.
- Pakizeh, K.; Malek, A.; Karimzadeh Khosroshahi, M.; Hamidi Razi, H. Assessing machine learning performance in cryptocurrency market price prediction. Journal of Mathematics and Modeling in Finance 2022, 2, 1–32.
- Dosiadis, I. Cryptocurrency price prediction using LSTM neural networks, 2024.
- Ansari, S.A.; Yasin, M.; Junaidi, M.N.A.; Hashmi, M.J. Artificial Intelligence-Based Analysis of Cryptocurrency Prices. Mathematical Statistician and Engineering Applications 2023, 72, 1516–1524.
- Tripathi, B.; Sharma, R.K. Modeling bitcoin prices using signal processing methods, bayesian optimization, and deep neural networks. Computational Economics 2023, 62, 1919–1945. [CrossRef]
- Zahid, M.; Iqbal, F.; Koutmos, D. Forecasting Bitcoin volatility using hybrid GARCH models with machine learning. Risks 2022, 10, 237. [CrossRef]
- Mustafaoglu, Z.S.; Bogumill, N. LSTM-based analysis of company sentiments regarding cryptocurrencies. Metamorphosis 2022.
- Sibel Kervancı, I.; Akay, F. LSTM Hyperparameters optimization with Hparam parameters for Bitcoin Price Prediction. Sakarya University Journal of Computer and Information Sciences 2023, 6, 1–9.
- Sarıkaya, A.; Aslan, S. Deep Learning and Machine Learning Based Sentiment Analysis on BitCoin (BTC) Price Prediction. NATURENGS 2022, 3, 1–17. [CrossRef]
- Zhao, H.; Crane, M.; Bezbradica, M. Attention! Transformer with sentiment on cryptocurrencies price prerediction, 2022.
- Li, Y. Sentiment-based Bitcoin Movement Prediction with Deep Learning. Proceedings of the International Conference on Information Economy, Data Modeling and Cloud Computing, ICIDC 2022, 17-19 June 2022, Qingdao, China, 2022.
- Ye, Z.; Wu, Y.; Chen, H.; Pan, Y.; Jiang, Q. A Stacking Ensemble Deep Learning Model for BTC Price Prediction Using Twitter Comments on BTC, 2022.
- OmaMageswari, M.; Peroumal, V.; Ghosh, R.; Goswami, D. Gated Recurrent Unit and Long Short-Term Memory Based Hybrid Intrusion Detection System, 2022.
- Wardak, A.B.; Rasheed, J. Bitcoin cryptocurrency price prediction using long short-term memory recurrent neural network. Avrupa Bilim ve Teknoloji Dergisi 2022, pp. 47–53.
- Devi, S.; Noronha, S.; Jagtap, A.; Desai, S. Bitcoin Price Predictor using Deep Learning. Available at SSRN 4132181 2022. [CrossRef]
- Zakhwan, M.; Rafik, M.; Shah, N.M.; Khairuddin, A.S.B.M. Comparative Analysis of Cryptocurrency Price Prediction Using Deep Learning. AIJR Proceedings 2022, pp. 63–74.
- Ammer, M.A.; Aldhyani, T.H. Deep learning algorithm to predict cryptocurrency fluctuation prices: Increasing investment awareness. Electronics 2022, 11, 2349. [CrossRef]
- Kumar, D.T.; Sai, Y.O.; K.Geetardha.; Sandhya, P.; Reddy, E.M. DESIGN AND IMPLEMENTATION OF CRYPTOCURRENCY PREDICTION MODEL USING GRU ALGORITHM, 2022.
- Suryawanshi, R.; Takavane, T.; Shah, T.; Mathur, R. Stocks and Cryptocurrency Price Prediction Using Long Short Term Memory, 2022.
- Caglar Gurkan1, M.P. Time Series Forecasting of ETH Prices Using Deep Learning Methods, 2022.
- Lopes, E.J.C.; da Costa Bianchi, R.A. Short-term prediction for ethereum with deep neural networks. Anais do I Brazilian Workshop on Artificial Intelligence in Finance. SBC, 2022, pp. 1–12.
- Khobragade, A.K.; Keskar, O.C.; Deshmukh, P.G.; Chopade, R.M. Forecasting of Cryptocurrency Values Using Machine Learning. International Journal Of Scientific & Technology, Marathwada Mitra Mandals College of Engineering, Pune 2022, 10.
- Fleischer, J.P.; von Laszewski, G.; Theran, C.; Parra Bautista, Y.J. Time series analysis of cryptocurrency prices using long short-term memory. Algorithms 2022, 15, 230. [CrossRef]
- Kim, J.H.; Sung, H. Understanding bitcoin price prediction trends under various hyperparameter configurations. Computers 2022, 11, 167. [CrossRef]
- I. Sibel Kervancı, M.F.A. LSTM Hyperparameters optimization with Hparam parameters for BTC Price Prediction, 2022.
- Haritha, G.; Sahana, N. Cryptocurrency price prediction using twitter sentiment analysis. CS & IT conference proceedings. CS & IT Conference Proceedings, 2023, Vol. 13.
- Singh, G.; Indra, B. ‘Bitcoin price prediction and recommendation system using deep learning techniques and Twitter sentiment analysis. Int. Res. J. Eng. Technol.(IRJET) 2023, 10, 1–23.
- Latif, N.; Selvam, J.D.; Kapse, M.; Sharma, V.; Mahajan, V. Comparative performance of LSTM and ARIMA for the short-term prediction of bitcoin prices. Australasian Accounting, Business and Finance Journal 2023, 17, 256–276. [CrossRef]
- Amirshahi, B.; Lahmiri, S. Hybrid deep learning and GARCH-family models for forecasting volatility of cryptocurrencies. Machine Learning with Applications 2023, 12, 100465. [CrossRef]
- Sossi-Rojas, S.; Velarde, G.; Zieba, D. A machine learning approach for bitcoin forecasting. Engineering Proceedings 2023, 39, 27.
- Chen, J. Analysis of bitcoin price prediction using machine learning. Journal of Risk and Financial Management 2023, 16, 51. [CrossRef]
- Seabe, P.L.; Moutsinga, C.R.B.; Pindza, E. Forecasting cryptocurrency prices using LSTM, GRU, and bi-directional LSTM: a deep learning approach. Fractal and Fractional 2023, 7, 203. [CrossRef]
- Tripathy, N.; Hota, S.; Mishra, D. Performance analysis of bitcoin forecasting using deep learning techniques. Indonesian Journal of Electrical Engineering and Computer Science 2023, 31, 1515–1522. [CrossRef]
- Joy, T.; Benny, L.; Varghese, J.; Philip, T. Cryptocurrency Price Prediction Using Deep Learning, 2023.
- Aljadani, A. DLCP2F: a DL-based cryptocurrency price prediction framework. Discover Artificial Intelligence 2022, 2, 20. [CrossRef]
- Shruthi, C.; Anbarasu, S.; Sabarish, J.; others. Crytocurrency price prediction using machine learning. World Journal of Advanced Engineering Technology and Sciences 2023, 8, 251–257. [CrossRef]
- Chatterjee, S. Forecasting Efficiency in Cryptocurrency Markets, 2022.
- Herremans, D.; Low, K.W. Forecasting Bitcoin volatility spikes from whale transactions and CryptoQuant data using Synthesizer Transformer models. arXiv preprint arXiv:2211.08281 2022.
- Liu, X.Y.; Xia, Z.; Rui, J.; Gao, J.; Yang, H.; Zhu, M.; Wang, C.; Wang, Z.; Guo, J. FinRL-Meta: Market environments and benchmarks for data-driven financial reinforcement learning. Advances in Neural Information Processing Systems 2022, 35, 1835–1849. [CrossRef]
- Betancourt, C.; Chen, W.H. Reinforcement learning with self-attention networks for cryptocurrency trading. Applied Sciences 2021, 11, 7377. [CrossRef]
- Bo Xu, X.S. High-Frequency Quantitative Trading of Digital Currencies Based on Deep Reinforcement Learning Models with Fusion Evolutionary Strategies, 2023.
- Shahbazi, Z.; Byun, Y.C. Improving the cryptocurrency price prediction performance based on reinforcement learning, 2021.
- Wikner, A. Bitcoin Trading using Reinforcement Learning: An Analysis of Q-Learning and DQN Algorithms on Daily Timeframes., 2023.
- Motard, P. Hierarchical Reinforcement Learning for Algorithmic Trading, 2022.
- Sadighian, J. Extending deep reinforcement learning frameworks in cryptocurrency market making. arXiv preprint arXiv:2004.06985 2020.
- Sattarov, O.; Muminov, A.; Lee, C.W.; Kang, H.K.; Oh, R.; Ahn, J.; Oh, H.J.; Jeon, H.S. Recommending cryptocurrency trading points with deep reinforcement learning approach. Applied Sciences 2020, 10, 1506. [CrossRef]
- Tsai, Y.C.; Szu, F.M.; Chen, J.H.; Chen, S.Y.C. Financial vision-based reinforcement learning trading strategy. Analytics 2022, 1, 35–53. [CrossRef]
- Wang, S.; Klabjan, D. An Ensemble Method of Deep Reinforcement Learning for Automated Cryptocurrency Trading, 2024.
- Peng, A.; Ang, S.L.; Lim, C.Y. Automated cryptocurrency trading bot implementing DRL. Pertanika Journal of Science and Technology 2022, 30, 2683–2705. [CrossRef]
- Kochliaridis, V.; Kouloumpris, E.; Vlahavas, I. Combining deep reinforcement learning with technical analysis and trend monitoring on cryptocurrency markets. Neural Computing and Applications 2023, 35, 21445–21462. [CrossRef]
- Gort, B.J.D.; Liu, X.Y.; Sun, X.; Gao, J.; Chen, S.; Wang, C.D. Deep reinforcement learning for cryptocurrency trading: Practical approach to address backtest overfitting. arXiv preprint arXiv:2209.05559 2022.
- GÜRKAN, C.K. PAIRS TRADING IN CRYPTOCURRENCY MARKET USING DEEP REINFORCEMENT LEARNING, 2022.
- Lucarelli, G.; Borrotti, M. A deep reinforcement learning approach for automated cryptocurrency trading, 2019.
- Tran, M.; Pham-Hi, D.; Bui, M. Optimizing automated trading systems with deep reinforcement learning. Algorithms 2023, 16, 23. [CrossRef]
- Mariappan, L.T.; Pandian, J.A.; Kumar, V.D.; Geman, O.; Chiuchisan, I.; Năstase, C. A forecasting approach to cryptocurrency price index using reinforcement learning. Applied Sciences 2023, 13, 2692. [CrossRef]
- Akkerman, S. Automatically trading small market capitalization cryptocurrencies using reinforcement learning, 2021.
- Koker, T.E.; Koutmos, D. Cryptocurrency trading using machine learning. Journal of Risk and Financial Management 2020, 13, 178. [CrossRef]
- Patel, Y. Optimizing market making using multi-agent reinforcement learning. arXiv preprint arXiv:1812.10252 2018.
- Pasak, S.; Jayadi, R. Investment decision on cryptocurrency: comparing prediction performance using ARIMA and LSTM. Journal of Information Systems and Informatics 2023, 5, 407–427. [CrossRef]
- Bhattad, S.; Sunnymon, S.; Vaz, D.; Dhavale, C. Review of Machine Learning Techniques for Cryptocurrency Price Prediction. Technical report, EasyChair, 2023.
- Ampountolas, A. Comparative analysis of machine learning, hybrid, and deep learning forecasting models: evidence from European financial markets and bitcoins. Forecasting 2023, 5, 472–486. [CrossRef]
- Oyewola, D.O.; Dada, E.G.; Ndunagu, J.N. A novel hybrid walk-forward ensemble optimization for time series cryptocurrency prediction. Heliyon 2022, 8. [CrossRef]
- Bitto, A.K.; Mahmud, I.; Bijoy, M.H.I.; Jannat, F.T.; Arman, M.S.; Shohug, M.M.H.; Jahan, H. CryptoAR: scrutinizing the trend and market of cryptocurrency using machine learning approach on time series data. Indonesian Journal of Electrical Engineering and Computer Science 2022, 28, 1684–1696. [CrossRef]
- Mittal, R.; Gehi, R.; Bhatia, M. Forecasting the price of cryptocurrencies and validating using ARIMA. International Journal of Information Systems & Management Science 2018, 1.
- Rostami, M.; Bahaghighat, M.; Zanjireh, M.M. Bitcoin daily close price prediction using optimized grid search method. Acta Universitatis Sapientiae, Informatica 2021, 13, 265–287. [CrossRef]
- Angelini, G.; Emili, S. Forecasting Cryptocurrencies: A Comparison of GARCH Models. Available at SSRN 3195704 2018. [CrossRef]
- Nasir, M.A.; Huynh, T.L.D.; Nguyen, S.P.; Duong, D. Forecasting cryptocurrency returns and volume using search engines. Financial Innovation 2019, 5, 1–13. [CrossRef]
- Trucíos, C.; Taylor, J.W. Forecasting Value-at-Risk and Expected Shortfall of Cryptocurrencies using Combinations based on Jump-Robust and Regime-Switching Models. Available at SSRN 3751435 2020. [CrossRef]
- Manevich, V.; Ignatov, D. Machine Learning, Neural Networks and Econometric Models for Prediction the Realized Volatility of Bitcoin and E-Mini S&P500. Neural Networks and Econometric Models for Prediction the Realized Volatility of Bitcoin and E-Mini S&P500 2023.
- Yahaya, H.U.; Oyinloye, J.S.; Adams, S.O. Modeling and Forecasting Cryptocurrency Returns and Volatility: An Application of GARCH Models. Universal Journal of Finance and Economics 2022, 2, 497. [CrossRef]
- Kim, J.M.; Jun, C.; Lee, J. Forecasting the volatility of the cryptocurrency market by GARCH and Stochastic Volatility. Mathematics 2021, 9, 1614. [CrossRef]
- Khan, F.U.; Khan, F.; Shaikh, P.A. Forecasting returns volatility of cryptocurrency by applying various deep learning algorithms. Future Business Journal 2023, 9, 25. [CrossRef]
- Karabıyık, B.K.; Ergün, Z.C. Forecasting Bitcoin Prices With The Anfis Model. Dicle Üniversitesi İktisadi ve İdari Bilimler Fakültesi Dergisi 2021, 11, 295–315. [CrossRef]
- Derbentsev, V.; Datsenko, N.; Stepanenko, O.; Bezkorovainyi, V. Forecasting cryptocurrency prices time series using machine learning approach. SHS Web of Conferences. EDP Sciences, 2019, Vol. 65, p. 02001.
- Derbentsev, V.; Datsenko, N.; Stepanenko, O.; Bezkorovainyi, V. Forecasting cryptocurrency prices time series using machine learning approach. SHS Web of Conferences. EDP Sciences, 2019, Vol. 65, p. 02001.
- Xie, T. Forecast bitcoin volatility with least squares model averaging. Econometrics 2019, 7, 40. [CrossRef]
- Guo, T.; Antulov-Fantulin, N. Predicting short-term Bitcoin price fluctuations from buy and sell orders. arXiv preprint arXiv:1802.04065 2018.
- Kervanci, I.; AKAY, F. Review on Bitcoin Price Prediction Using Machine Learning and Statistical Methods. Sakarya University Journal of Computer and Information Sciences 2020, 3. [CrossRef]
- Hafid, A.; Hafid, A.S.; Makrakis, D. Bitcoin price prediction using machine learning and technical indicators. International Symposium on Distributed Computing and Artificial Intelligence. Springer, 2023, pp. 275–284.
- Cakici, N.; Shahzad, S.J.H.; Bedowska-Sójka, B.; Zaremba, A. Machine learning and the cross-section of cryptocurrency returns. International Review of Financial Analysis 2024, 94, 103244. [CrossRef]
- Derbentseva, V.; Babenko*b, V.; Khrustalevc, K.; Obruch, H.; Khrustalovac, S. Comparative Performance of Machine Learning Ensemble Algorithms for Forecasting Cryptocurrency Prices, 2021.
- Kurbucz, M.T.; Pósfay, P.; Jakovác, A. Predicting the price movement of cryptocurrencies using linear law-based transformation. arXiv preprint arXiv:2305.04884 2023.
- El-Berawi, A.S.; Belal, M.A.F.; Abd Ellatif, M.M. Adaptive deep learning based cryptocurrency price fluctuation classification. International Journal of Advanced Computer Science and Applications 2021, 12. [CrossRef]
- Luo, C.; Pan, L.; Chen, B.; Xu, H. Bitcoin Price Forecasting: An Integrated Approach Using Hybrid LSTM-ELM Models. Mathematical Problems in Engineering 2022, 2022, 2126518. [CrossRef]
- Li, Y.; Zheng, Z.; Dai, H.N. Enhancing bitcoin price fluctuation prediction using attentive LSTM and embedding network. Applied Sciences 2020, 10, 4872. [CrossRef]
- Lamothe-Fernández, P.; Alaminos, D.; Lamothe-López, P.; Fernández-Gámez, M.A. Deep learning methods for modeling bitcoin price. Mathematics 2020, 8, 1245. [CrossRef]
- Lamothe-Fernández, P.; Alaminos, D.; Lamothe-López, P.; Fernández-Gámez, M.A. Deep learning methods for modeling bitcoin price. Mathematics 2020, 8, 1245. [CrossRef]
- Lahmiri, S.; Bekiros, S. Deep learning forecasting in cryptocurrency high-frequency trading. Cognitive Computation 2021, 13, 485–487. [CrossRef]
- Duygu Ider, S.L. Forecasting Cryptocurrency Returns from Sentiment Signals: An Analysis of BERT Classifiers and Weak Supervision. arXiv preprint arXiv:2204.05781 2022.
- Puzyrev, V. Deep convolutional autoencoder for cryptocurrency market analysis. arXiv preprint arXiv:1910.12281 2019.
- Kiranashree, B.; Anusha, K.; Deepthi, M.; Suryakala, R.; Shashank, E. Price Prediction of Bitcoins. International Journal of Modern Developments in Engineering and Science 2023, 2, 8–10.
- Pintelas, E.; Livieris, I.E.; Stavroyiannis, S.; Kotsilieris, T.; Pintelas, P. Investigating the problem of cryptocurrency price prediction: a deep learning approach, 2020.
- Seo, M.; Kim, G. Hybrid forecasting models based on the neural networks for the volatility of bitcoin. Applied Sciences 2020, 10, 4768. [CrossRef]
- Loh, E.C.; Ismail, S. Emerging trend of transaction and investment: bitcoin price prediction using machine learning. International Journal 2020, 9. [CrossRef]
- Ateeq, K.; Al Zarooni, A.A.; Rehman, A.; Khan, M.A. A Mechanism for Bitcoin Price Forecasting using Deep Learning. International Journal of Advanced Computer Science and Applications 2023, 14. [CrossRef]
- ZEINAB SHAHBAZI, Y.C.B. Improving the Cryptocurrency Price Prediction Performance Based on Reinforcement Learning, 2021.
- Thomas E. Koker, D.K. Cryptocurrency Trading Using Machine Learning, 2020.
- Liu1, X.Y.; Xia1, Z.; Rui2, J.; Gao3, J.; Yang1, H.; Zhu4, M.; Wang5, C.D.; Wang6, Z.; Guo7†, J. FinRL-Meta: Market Environments and Benchmarks for Data-Driven Financial Reinforcement Learning, 2022.
- Carlos Betancourt, W.C. Reinforcement Learning with Self-Attention Networks for Cryptocurrency Trading, 2021.
- Bo Xu, X.S. High-Frequency Quantitative Trading of Digital Currencies Based on Deep Reinforcement Learning Models with Fusion Evolutionary Strategies, 2023.
- Becker, D.M. Bitcoin Trading using Reinforcement Learning An Analysis of Q-Learning and DQN Algorithms on a Daily Timeframe., 2023.
- Motard, P. Hierarchical Reinforcement Learning for Algorithmic Trading, 2022.
- Sadighian, J. Extending Deep Reinforcement Learning Frameworks in Cryptocurrency Market Making, 2020.
- Sattarov, O.; Muminov, A.; Lee, C.W.; Kang, H.K.; Oh, R.; Ahn, J.; Oh, H.J.; Heung Seok Jeon 1, . Recommending Cryptocurrency Trading Points with Deep Reinforcement Learning Approach, 2020.
- Stephan Akkerman, U.s.o.N.A.; Klein, D. Automatically trading small market capitalization cryptocurrencies using reinforcement learning, 2021.
- Shuyang Wang, D.K. An Ensemble Method of Deep Reinforcement Learning for Automated Cryptocurrency Trading, 2023.
- Aisha Peng, S.L.A.; Lim, C.Y. Automated Cryptocurrency Trading Bot Implementing DRL, 2022.
- Vasileios Kochliaridis, Eleftherios Kouloumpris, I.V. Combining deep reinforcement learning with technical analysis and trend monitoring on cryptocurrency markets, 2023.
- Gort1, B.J.D.; Liu1, X.Y.; Gao, J.; Chen, S.; Wang, C.D. Deep Reinforcement Learning for Cryptocurrency Trading: Practical Approach to Address Backtest Overfitting, 2023.
- Giorgio Lucarelli, M.B. A Deep Reinforcement Learning Approach for Automated Cryptocurrency Trading, 2019.
- Minh Tran, Duc Pham-Hi, M.B. Optimizing Automated Trading Systems with Deep Reinforcement Learning, 2023.
- Mariappan, L.T.; Pandian, J.A.; Kumar, V.D.; Geman, O.; Chiuchisan, I.; Năstase, C. A Forecasting Approach to Cryptocurrency Price Index Using Reinforcement Learning, 2023.
- Kim, J.M.; Cho, C.; Jun, C. Forecasting the price of the cryptocurrency using linear and nonlinear error correction model. Journal of Risk and Financial Management 2022, 15, 74. [CrossRef]
- Yang, Y.; Xiong, J.; Zhao, L.; Wang, X.; Hua, L.; Wu, L. A Novel Method of Blockchain Cryptocurrency Price Prediction Using Fractional Grey Model. Fractal and Fractional 2023, 7, 547. [CrossRef]
Disclaimer/Publisher’s Note: The statements, opinions and data contained in all publications are solely those of the individual author(s) and contributor(s) and not of MDPI and/or the editor(s). MDPI and/or the editor(s) disclaim responsibility for any injury to people or property resulting from any ideas, methods, instructions or products referred to in the content. |
© 2024 by the authors. Licensee MDPI, Basel, Switzerland. This article is an open access article distributed under the terms and conditions of the Creative Commons Attribution (CC BY) license (http://creativecommons.org/licenses/by/4.0/).
Copyright: This open access article is published under a Creative Commons CC BY 4.0 license, which permit the free download, distribution, and reuse, provided that the author and preprint are cited in any reuse.


