
Submitted:
21 June 2025
Posted:
23 June 2025
You are already at the latest version
Abstract
In this note, we make a comparison between a novel machine learning method, Long Short-Term Memory (LSTM), and two trading strategies using technical analysis: Exponential Moving Average (EMA) crossing and Moving Average Convergence/Divergence with Average Directional Index (MACD+ADX). The purpose is to use trading signals to maximize profits in the Bitcoin digital commodity. The comparison was motivated by the approval of the first spot Bitcoin exchange-traded funds (ETFs) by the U.S. Securities and Exchange Commission (SEC) on January 9, 2024. The results show that the LSTM algorithm delivers a cumulative return of approximately 65.23% over a testing period of less than nine months, significantly outperforming both the EMA and MACD+ADX strategies, as well as the baseline buy-and-hold approach typically followed by fundamental investors. Our work highlights the potential for further integration between machine learning and technical analysis in the evolving landscape of cryptocurrency markets.
Keywords:
Technical Analysis
; Machine Learning
; LSTM
; Bitcoin
1. Introduction
Machine learning is widely used across science and engineering to extract patterns from data and identify similar structures in other datasets. In finance, various techniques—such as neural networks and regression—have been applied to support decision-making, though their suitability is sometimes debated. In particular, machine learning (ML) can be applied to financial trading data to train regression models on daily closing prices, aiming to detect conditions for buying or selling positions. On the other hand, technical analysis (TA), often considered a heuristic tool, is widely used to identify buy or sell signals in financial assets such as commodities or stocks. These tools are based on empirical observations rather than formal mathematical models.
In this note, we employ two technical analysis (TA) strategies: Exponential Moving Average (EMA) crossovers and a combination of Moving Average Convergence/Divergence with the Average Directional Index (MACD+ADX). The machine learning (ML) method applied is Long Short-Term Memory (LSTM). The primary objective of this work is to compare the trading signals generated by TA and ML approaches in terms of cumulative returns on Bitcoin trading. To ensure a fair comparison under realistic market conditions, both approaches are integrated into a statistical learning framework in which model parameters are optimized in-sample and evaluated out-of-sample.
The purpose is to use the trading strategies to maximize profits in the Bitcoin digital commodity. Both trading approaches use the same dataset for training and a separate dataset for testing. The training dataset consists of price data from January 1, 2021, to January 9, 2024, while the testing dataset covers the period beginning with the approval of the first spot Bitcoin exchange-traded funds (ETFs) by the U.S. Securities and Exchange Commission (SEC) https://www.cftc.gov/PressRoom/PressReleases/7231-15 on January 10, 2024, and ending on December 31, 2024.
One of the main objectives of this work is to address a gap in the literature by examining the effects of shifting market dynamics triggered by the release of the Bitcoin ETF. On the one hand, we evaluate the performance of trading strategies trained prior to this structural change and tested afterward, during the artificial turbulence generated by this economic event. Despite the shift in dynamics, the results show surprisingly high cumulative returns across all trading strategies. In particular, the LSTM-based trading strategy outperforms the classical buy-and-hold approach typically followed by fundamental investors [1].
In Section 2, we present a brief literature review. Section 3 describes the LSTM algorithm and the technical analysis strategies implemented in this paper. Section 4 presents the main results of this work, while Section 5 provides a discussion of these results. Finally, Section 6 offers a general conclusion and mentions possible venues for future work.
2. Literatura Review
Bitcoin has traditionally been considered a speculative asset [2]. However, recent studies have shown that its behavior more closely resembles that of a commodity due to its fixed supply. In [3], Bitcoin was compared to oil and gold through volatility models, arguing that its dynamics are similar, although showing that Bitcoin exhibits more extreme dynamics due to demand shocks. Nevertheless, there is no clear and definitive consensus. The authors of [4] question and deeply debate whether Bitcoin can be considered an asset, a currency, a commodity, a technological product, or something else. New arguments have emerged, suggesting that the cost of mining Bitcoin should be considered in determining whether it qualifies as a commodity. In [5], this aspect is addressed, finding that the effect is not sufficient to fully explain Bitcoin’s dynamics, and suggesting that new drivers should be integrated. In [6], the authors go beyond these classifications and define Bitcoin under a new conceptual category: a digital commodity, implying that it is a commodity generated through human labor, but constrained to the world of bits and bytes, without any real added value. Nonetheless, beyond this interesting discussion, in this work we focus on Bitcoin in terms of profitability within trading strategies.
Traditionally, technical analysis serves as an auxiliary tool for determining optimal moments to buy or sell financial stocks. This trading strategy involves evaluating a set of assumptions about market trends to guide investment decisions. Efforts have been made to integrate technical analysis with other areas of investment management, such as portfolio theory. For instance, Santos et al. [7] reconcile Markowitz’s theory with strategies based on technical indicators. Their approach extends technical analysis beyond timing decisions, aiming to optimize both the quantity of shares or capital allocated to each transaction and the timing of buy or sell actions. Nti et al. [8] present an excellent review of one hundred and twenty-two (122) studies conducted between 2007 and 2018 related to machine learning strategies for financial market prediction. The review specifically focuses on approaches based on technical analysis, fundamental analysis, and the combination of both schools of thought. A study covering 60 years of historical data from the FT30 index has shown that simple technical analysis strategies, such as the Moving Average Convergence–Divergence (MACD) and the Relative Strength Index (RSI), can outperform the classic buy-and-hold paradigm typically followed by fundamental analysis practitioners[9]. These strategies are also examined across five indices from OECD countries, likewise showing that they can outperform the basic buy-and-hold strategy under certain specific parameter settings of the indicators [10].
Li et al. [11] provide a review of various attempts to integrate technical analysis into financial time series forecasting. In the reviewed works, technical analysis signals are used as inputs (features) to predictive models. The study by Singh et al. [12] also falls into this category, where technical indicators are used as inputs to an LSTM model to forecast the S&P 500 index. A similar attempt to enhance technical analysis through machine learning has been applied to the sectors comprising the S&P 500. However, two critical limitations of that work are worth noting: it does not compare performance against the traditional buy-and-hold strategy, nor does it explicitly define how the algorithm learns from the technical analysis outcomes. Moreover, the study by Macedo et al. [13] proposes a hybrid model that applies genetic algorithms to identify the most suitable technical indicator to follow. However, this approach, which is more closely aligned with operations research, is not adopted in the present work. On the contrary, our objective is to combine the strengths of both predictive modeling and classical technical analysis.
Recently, there has been growing interest in applying trading strategies to the cryptocurrency market due to its arbitrage opportunities, which have been shown to be greater than those in traditional markets. Fang et al. [14] discuss the approaches adopted in recent years by reviewing a set of 146 papers, which implement both econometric and machine learning techniques in the development of trading strategies. In this emerging line of research, there are also attempts to combine machine learning methods with classical technical analysis. In [15], technical indicators are used as features within LSTM and GRU neural network architectures, demonstrating superior performance compared to the buy-and-hold baseline approach. The authors of [16] have also extended the application of technical trading strategies to the context of cryptocurrencies. In their study, they analyze 10 altcoins, excluding Bitcoin, and test the Variable Moving Average (VMA) oscillator strategy. Their results are promising, paving the way for further extensions in this area. Strategies more closely related to the fields of optimization and automated trading have also been proposed. In [17], a new normalized decomposition-based multi-objective particle swarm optimization (N-MOPSO/D) algorithm is implemented, demonstrating strong performance in terms of Return on Investment (ROI), Sortino Ratio (SOR), and the number of trades (TR). However, the comparative analysis is limited, as it does not include the buy-and-hold baseline based on cumulative returns.
On the other hand, in financial time series analysis, traditional statistical and econometric approaches often face challenges when modeling non-stationary variables or capturing complex dependencies[18]. Fortunately, deep learning techniques are well-suited to identifying and managing these intricate patterns[19]. Garcia-Medina and Aguayo-Moreno [20] investigate this approach to forecast the volatility of various cryptocurrencies within the framework of a hybrid LSTM-GARCH model. Similarly, Garcia-Medina and Toan [21] examine the main determinants of Bitcoin prices using data mining techniques and a predictive classification model based on LSTM.
In sum, we aim to test a series of technical trading indicators in the context of Bitcoin analysis. Our primary contribution lies in the integration of these techniques into a statistical learning framework, where model parameters are optimized in-sample and applied out-of-sample. This approach enables a fair comparison of indicators under realistic market conditions. Specifically, we compare the performance of technical trading strategies with a method for forecasting the direction of Bitcoin prices, building on the methodology presented in previous works by one of the authors [20,21]. Beyond the integration of technical and forecasting-based strategies, a key contribution of this study is the evaluation of model performance under different market conditions, induced by the creation of the Bitcoin ETF.
3. Materials and Methods
3.1. Data
Raw price data were downloaded from the free Binance H https://www.binance.com. As mentioned in the introduction, the study period spans from January 1, 2021, to December 31, 2024. The data were split on January 10, 2024, to account for the change in market dynamics following the approval of the first spot Bitcoin ETF by the SEC.
3.2. Machine Learning: LSTM Deep Learning Models
Deep learning methods have become increasingly important in recent years, supported by the growing accessibility of computational resources needed for such processing. Artificial Neural Networks (ANNs) are a class of machine learning models influenced by various mathematical disciplines. They can be interpreted as function approximation aimed at achieving statistical generalization[22].
ANNs are made up of units called neurons that exchange information. Each neuron receives an input vector x, which may come from other connected neurons. This input is combined with a set of weights w, learned during training, and passed through an activation function to produce an output signal . This process can be described as:
where b is a bias term. A common and simple type of ANN is the MultiLayer Perceptron (MLP), which includes an input layer, one or more hidden layers, and an output layer, with each node representing a neuron.
Recurrent Neural Networks (RNNs) are a more advanced type of neural network designed to handle sequential data. They use hidden states to retain and summarize past information. RNNs introduce cycles in their structure, allowing them to maintain memory over time.
At each time step t, the network receives an input and computes a hidden state , which depends on both the current input and the previous hidden state . This structure enables the network to pass information through time steps, allowing it to model temporal dependencies in the data.
The LSTM model, introduced by [23], was designed to handle long-term dependencies in sequential data. It uses special components called gates to control the flow of information at each time step, allowing the network to retain only the relevant information for future predictions. This structure addresses common issues in training traditional RNNs, particularly with gradient computation. Unlike standard RNNs, each LSTM unit contains several internal layers: a memory cell (), an input gate (), a forget gate (), and an output gate ().
Figure 1 illustrates the general structure and functioning of an LSTM unit.
This diagram illustrates the input , the hidden state , and at time t, which controls the quantity of information retained or discarded in the cell state. The functioning of an LSTM unit can be mathematically represented by the following equations:
Here, U and W represent weight matrices, b the bias term, and the symbol * denotes element-wise multiplication[20,24].
3.2.1. Classification Metrics
In classification tasks, predictions can be compared to the actual class labels. The outcomes of these comparisons are summarized in the confusion matrix, which includes four possible scenarios: true positives (TP), true negatives (TN), false positives (FP), and false negatives (FN). The following metrics are implemented to quantify the quality of the classification forecast in the price of bitcoin.
- Accuracy =
- Sensitivity, recall or true positive rate (TPR)
- Specificity, selectivity or true negative rate (TNR)
- Precision or Positive Predictive Value (PPV)
- False Omission Rate (FOR)
- Balanced Accuracy (BA)
- F1 score .
3.2.2. Bitcoin’s price direction
The task of detecting Bitcoin’s price direction was approached using deep learning. The first step involved splitting the data into training, validation, and test datasets. The selected training period spans from January 20, 2021, to January 9, 2024, while the test period covers January 10, 2024, to December 31, 2024. Furthermore, a sequential split of 80% for training and 20% for validation was applied within the original training period (independent of the test dataset). The original data were then transformed into a supervised learning format, where each input sample consists of 96 consecutive historical days used to predict the following day. Because we are interested in predicting the direction of Bitcoin (BTC), the time series is not demeaned. Instead, returns are computed and labeled with a value of 1 if positive, and 0 if negative. In this way, the deep learning model is fed a binary time series of zeros and ones, representing upward and downward movements in the raw price of Bitcoin.
An important component of a deep learning model is the selection of the activation function. For the output layer, the sigmoid function is used, as the task involves binary classification of price direction (upward/downward). Another key element is the choice of the stochastic gradient descent algorithm. In this work, we adopt the Adam optimizer, which uses adaptive estimates of first- and second-order moments. Specifically, we implement the variant proposed by [25], which incorporates long-term memory of past gradients to improve the optimizer’s convergence properties.
The number of epochs—i.e., the number of times the learning algorithm passes through the entire training dataset—is determined using an early stopping procedure. The batch size is selected from a predefined grid: 32, 64, 128, 256. We also explore two learning rates, 0.001, 0.0001, and apply dropout regularization with rates in 0.3, 0.5, 0.7. Due to the stochastic nature of deep learning models, we set a random seed and report the average results across ten different random initializations of the parameters to ensure robustness. The proposed architecture of the neural network is illustrated in Figure 2, where a dropout layer is included for regularization, along with a final dense layer that produces the binary forecast.
3.3. Technical analysis: EMA cross-strategy
The EMA Cross strategy is a trend-following trading method that uses two exponential moving averages (EMAs) of different lengths to generate buy and sell signals based on momentum shifts. The two EMAs are computed using the closing prices of the asset, in this case, Bitcoin. Typically, a shorter-term EMA (e.g., 12-period) and a longer-term EMA (e.g., 26-period) are used. A buy signal occurs when the shorter-term EMA crosses above the longer-term EMA, indicating a potential upward trend. Conversely, a sell signal is triggered when the shorter-term EMA crosses below the longer-term EMA, suggesting a downward trend.
The strategy is optimized through a grid search over various combinations of short and long EMA window lengths, selecting the pair that yields the highest cumulative return on the training data. As with the LSTM forecasting approach, historical Bitcoin price data from 2021-01-01 to 2024-01-09 is used for training. The strategy is then evaluated on the out-of-sample period from 2024-04-14 to 2024-12-31. This testing period aligns with the LSTM model’s requirements, as it necessitates a 95-day window before generating forecasts.
3.4. Technical analysis: MACD+ADX
The MACD + ADX strategy is a hybrid approach that combines two technical indicators to enhance signal reliability. The MACD detects momentum and potential trend reversals by comparing two EMAs of the asset’s price. A buy signal is generated when the MACD line crosses above the signal line, and a sell signal is generated when it crosses below. The ADX measures the strength of a trend; values above 25 typically indicate a strong trend, while values below suggest a weak or non-trending market. The strategy generates a trade signal only when both indicators align—for example, a MACD buy signal confirmed by a strong ADX reading.
Parameter optimization is performed using a grid search over ranges for the MACD short EMA (e.g., 5–20), MACD long EMA (e.g., 10–30), signal line EMA (e.g., 5–15), and ADX window size (e.g., 10–20). Each parameter combination is evaluated on historical performance, and the one with the highest return is selected as optimal. As with the EMA strategy, the model is trained on Bitcoin data from 2021-01-01 to 2024-01-09 and tested on data from 2024-04-14 to 2024-12-31 .
It is important to mention that these trading strategies do not include transaction costs (brokerage fees, slippage, etc.), which significantly impact real-world performance. Neither uses risk management features like stop-loss orders.
4. Results
The comparative cumulative returns of the different strategies are summarized in Table 1. Among them, the LSTM strategy achieved the highest cumulative return. This strong performance may be attributed to its classification accuracy of 0.5611, as shown in Table 2, which is notably above the baseline of 0.5. The Buy & Hold strategy tends to perform well during sustained uptrends, while the MACD+ADX strategy outperforms the EMA-based strategy by incorporating trend strength into its trading signals.
Figure 3 displays the performance of the optimized LSTM-based trading strategy. This approach generates a high frequency of trades, reflecting the model’s high sensitivity to short-term price fluctuations. The strategy seeks to capitalize on small price movements, often taking profits over relatively short holding periods. While this can lead to increased trading activity and potential for quick gains, it may also result in higher exposure to market noise.
Figure 4 illustrates the execution of trades based on the optimized MACD+ADX strategy. The optimal parameters identified are: MACD Short = 17, Long = 21, Signal = 15, and ADX = 13. The figure shows that the price of Bitcoin gains significant upward momentum from October to December, a trend effectively captured by the strategy due to its incorporation of price strength via the ADX component. The strategy triggers a limited number of trades during this period, emphasizing quality over quantity and aligning well with strong directional movements in the market.
Figure 5 presents the execution of trades using the optimized EMA crossover strategy. The strategy employs a 6-day period for the short-term EMA and a 95-day period for the long-term EMA. A buy signal is generated when the short-term EMA crosses above the long-term EMA, indicating a potential upward trend. Conversely, a sell signal—used to close the previous long position—is triggered when the short-term EMA crosses below the long-term EMA. Similar to the MACD+ADX approach, this strategy results in a relatively low number of trades, focusing on capturing significant market movements rather than frequent signals.
5. Discussion
Both trading approaches are treated as machine learning algorithms and evaluated using a training set and a test set under identical conditions. As expected, the results are positive, meeting the baseline for potential real-world implementation. The technical analysis strategies perform well, yielding cumulative returns comparable to the standard buy-and-hold approach, which is widely favored by fundamental investors due to its simplicity and ease of implementation. These results support the reliability and effectiveness of technical analysis in trading. On the other hand, the LSTM-based strategy, which is grounded in a data-driven and more complex scientific framework, demonstrates superior performance, as anticipated. A natural next step would be to investigate the performance of hybrid models that combine LSTM with traditional strategies—such as EMA or MACD+ADX—to assess whether such integration can enhance predictive power and trading outcomes.
Author Contributions
“The authors contributed equally to this work. All authors have read and agreed to the published version of the manuscript.”
Funding
This research received no external funding
Data Availability Statement
The data presented in this study are available in https://github.com/agarciam/Technical-Analysis-Meets-Machine-Learning-Bitcoin-Evidence/.
Conflicts of Interest
The authors declare no conflicts of interest.
References
- Graham, B.; McGowan, B. The intelligent investor; HarperBusiness Essentials New York, 2003.
- Baur, D.G.; Hong, K.; Lee, A.D. Bitcoin: Medium of exchange or speculative assets? Journal of International Financial Markets, Institutions and Money 2018, 54, 177–189. [Google Scholar] [CrossRef]
- Gronwald, M. Is Bitcoin a Commodity? On price jumps, demand shocks, and certainty of supply. Journal of international money and finance 2019, 97, 86–92. [Google Scholar] [CrossRef]
- White, R.; Marinakis, Y.; Islam, N.; Walsh, S. Is Bitcoin a currency, a technology-based product, or something else? Technological forecasting and social change 2020, 151, 119877. [Google Scholar] [CrossRef]
- Baldan, C.; Zen, F. The bitcoin as a virtual commodity: Empirical evidence and implications. Frontiers in artificial intelligence 2020, 3, 21. [Google Scholar] [CrossRef]
- Rotta, T.N.; Paraná, E. Bitcoin as a digital commodity. New Political Economy 2022, 27, 1046–1061. [Google Scholar] [CrossRef]
- Santos, A.A.; Torrent, H.S. Markowitz meets technical analysis: Building optimal portfolios by exploiting information in trend-following signals. Finance Research Letters 2022, 49, 103063. [Google Scholar] [CrossRef]
- Nti, I.K.; Adekoya, A.F.; Weyori, B.A. A systematic review of fundamental and technical analysis of stock market predictions. Artificial Intelligence Review 2020, 53, 3007–3057. [Google Scholar] [CrossRef]
- Chong, T.T.L.; Ng, W.K. Technical analysis and the London stock exchange: testing the MACD and RSI rules using the FT30. Applied Economics Letters 2008, 15, 1111–1114. [Google Scholar] [CrossRef]
- Chong, T.T.L.; Ng, W.K.; Liew, V.K.S. Revisiting the Performance of MACD and RSI Oscillators. Journal of risk and financial management 2014, 7, 1–12. [Google Scholar] [CrossRef]
- Li, A.W.; Bastos, G.S. Stock market forecasting using deep learning and technical analysis: a systematic review. IEEE access 2020, 8, 185232–185242. [Google Scholar] [CrossRef]
- Singh, A.; Bhardwaj, G.; Srivastava, A.P.; Bindra, A.; Chaudhary, P.; et al. Application of neural network to technical analysis of stock market prediction. In Proceedings of the 2022 3rd International Conference on Intelligent Engineering and Management (ICIEM). IEEE; 2022; pp. 302–306. [Google Scholar]
- Macedo, L.L.; Godinho, P.; Alves, M.J. A comparative study of technical trading strategies using a genetic algorithm. Computational Economics 2020, 55, 349–381. [Google Scholar] [CrossRef]
- Fang, F.; Ventre, C.; Basios, M.; Kanthan, L.; Martinez-Rego, D.; Wu, F.; Li, L. Cryptocurrency trading: a comprehensive survey. Financial Innovation 2022, 8, 13. [Google Scholar] [CrossRef]
- Goutte, S.; Le, H.V.; Liu, F.; Von Mettenheim, H.J. Deep learning and technical analysis in cryptocurrency market. Finance Research Letters 2023, 54, 103809. [Google Scholar] [CrossRef]
- Grobys, K.; Ahmed, S.; Sapkota, N. Technical trading rules in the cryptocurrency market. Finance Research Letters 2020, 32, 101396. [Google Scholar] [CrossRef]
- Omran, S.M.; El-Behaidy, W.H.; Youssif, A.A. Optimization of Cryptocurrency Algorithmic Trading Strategies Using the Decomposition Approach. Big Data and Cognitive Computing 2023, 7, 174. [Google Scholar] [CrossRef]
- Dixon, M.; Klabjan, D.; Bang, J.H. Implementing deep neural networks for financial market prediction on the Intel Xeon Phi. In Proceedings of the Proceedings of the 8th workshop on high performance computational finance, 2015, pp.
- Fischer, T.; Krauss, C. Deep learning with long short-term memory networks for financial market predictions. European journal of operational research 2018, 270, 654–669. [Google Scholar] [CrossRef]
- García-Medina, A.; Aguayo-Moreno, E. LSTM–GARCH hybrid model for the prediction of volatility in cryptocurrency portfolios. Computational Economics 2024, 63, 1511–1542. [Google Scholar] [CrossRef] [PubMed]
- García-Medina, A.; Luu Duc Huynh, T. What drives bitcoin? An approach from continuous local transfer entropy and deep learning classification models. Entropy 2021, 23, 1582. [Google Scholar] [CrossRef] [PubMed]
- Goodfellow, I.; Bengio, Y.; Courville, A.; Bengio, Y. Deep learning; Vol. 1, MIT press Cambridge, 2016.
- Hochreiter, S.; Schmidhuber, J. Long short-term memory. Neural computation 1997, 9, 1735–1780. [Google Scholar] [CrossRef] [PubMed]
- Kim, H.Y.; Won, C.H. Forecasting the volatility of stock price index: A hybrid model integrating LSTM with multiple GARCH-type models. Expert Systems with Applications 2018, 103, 25–37. [Google Scholar] [CrossRef]
- Reddi, S.J.; Kale, S.; Kumar, S. On the convergence of adam and beyond. arXiv preprint arXiv:1904.09237 2019.
Figure 1.
General structure of an LSTM unit[20,21]. The memory gate is represented as , the input gate is denoted by , the forget gate is indicated as , and the output gate is as .
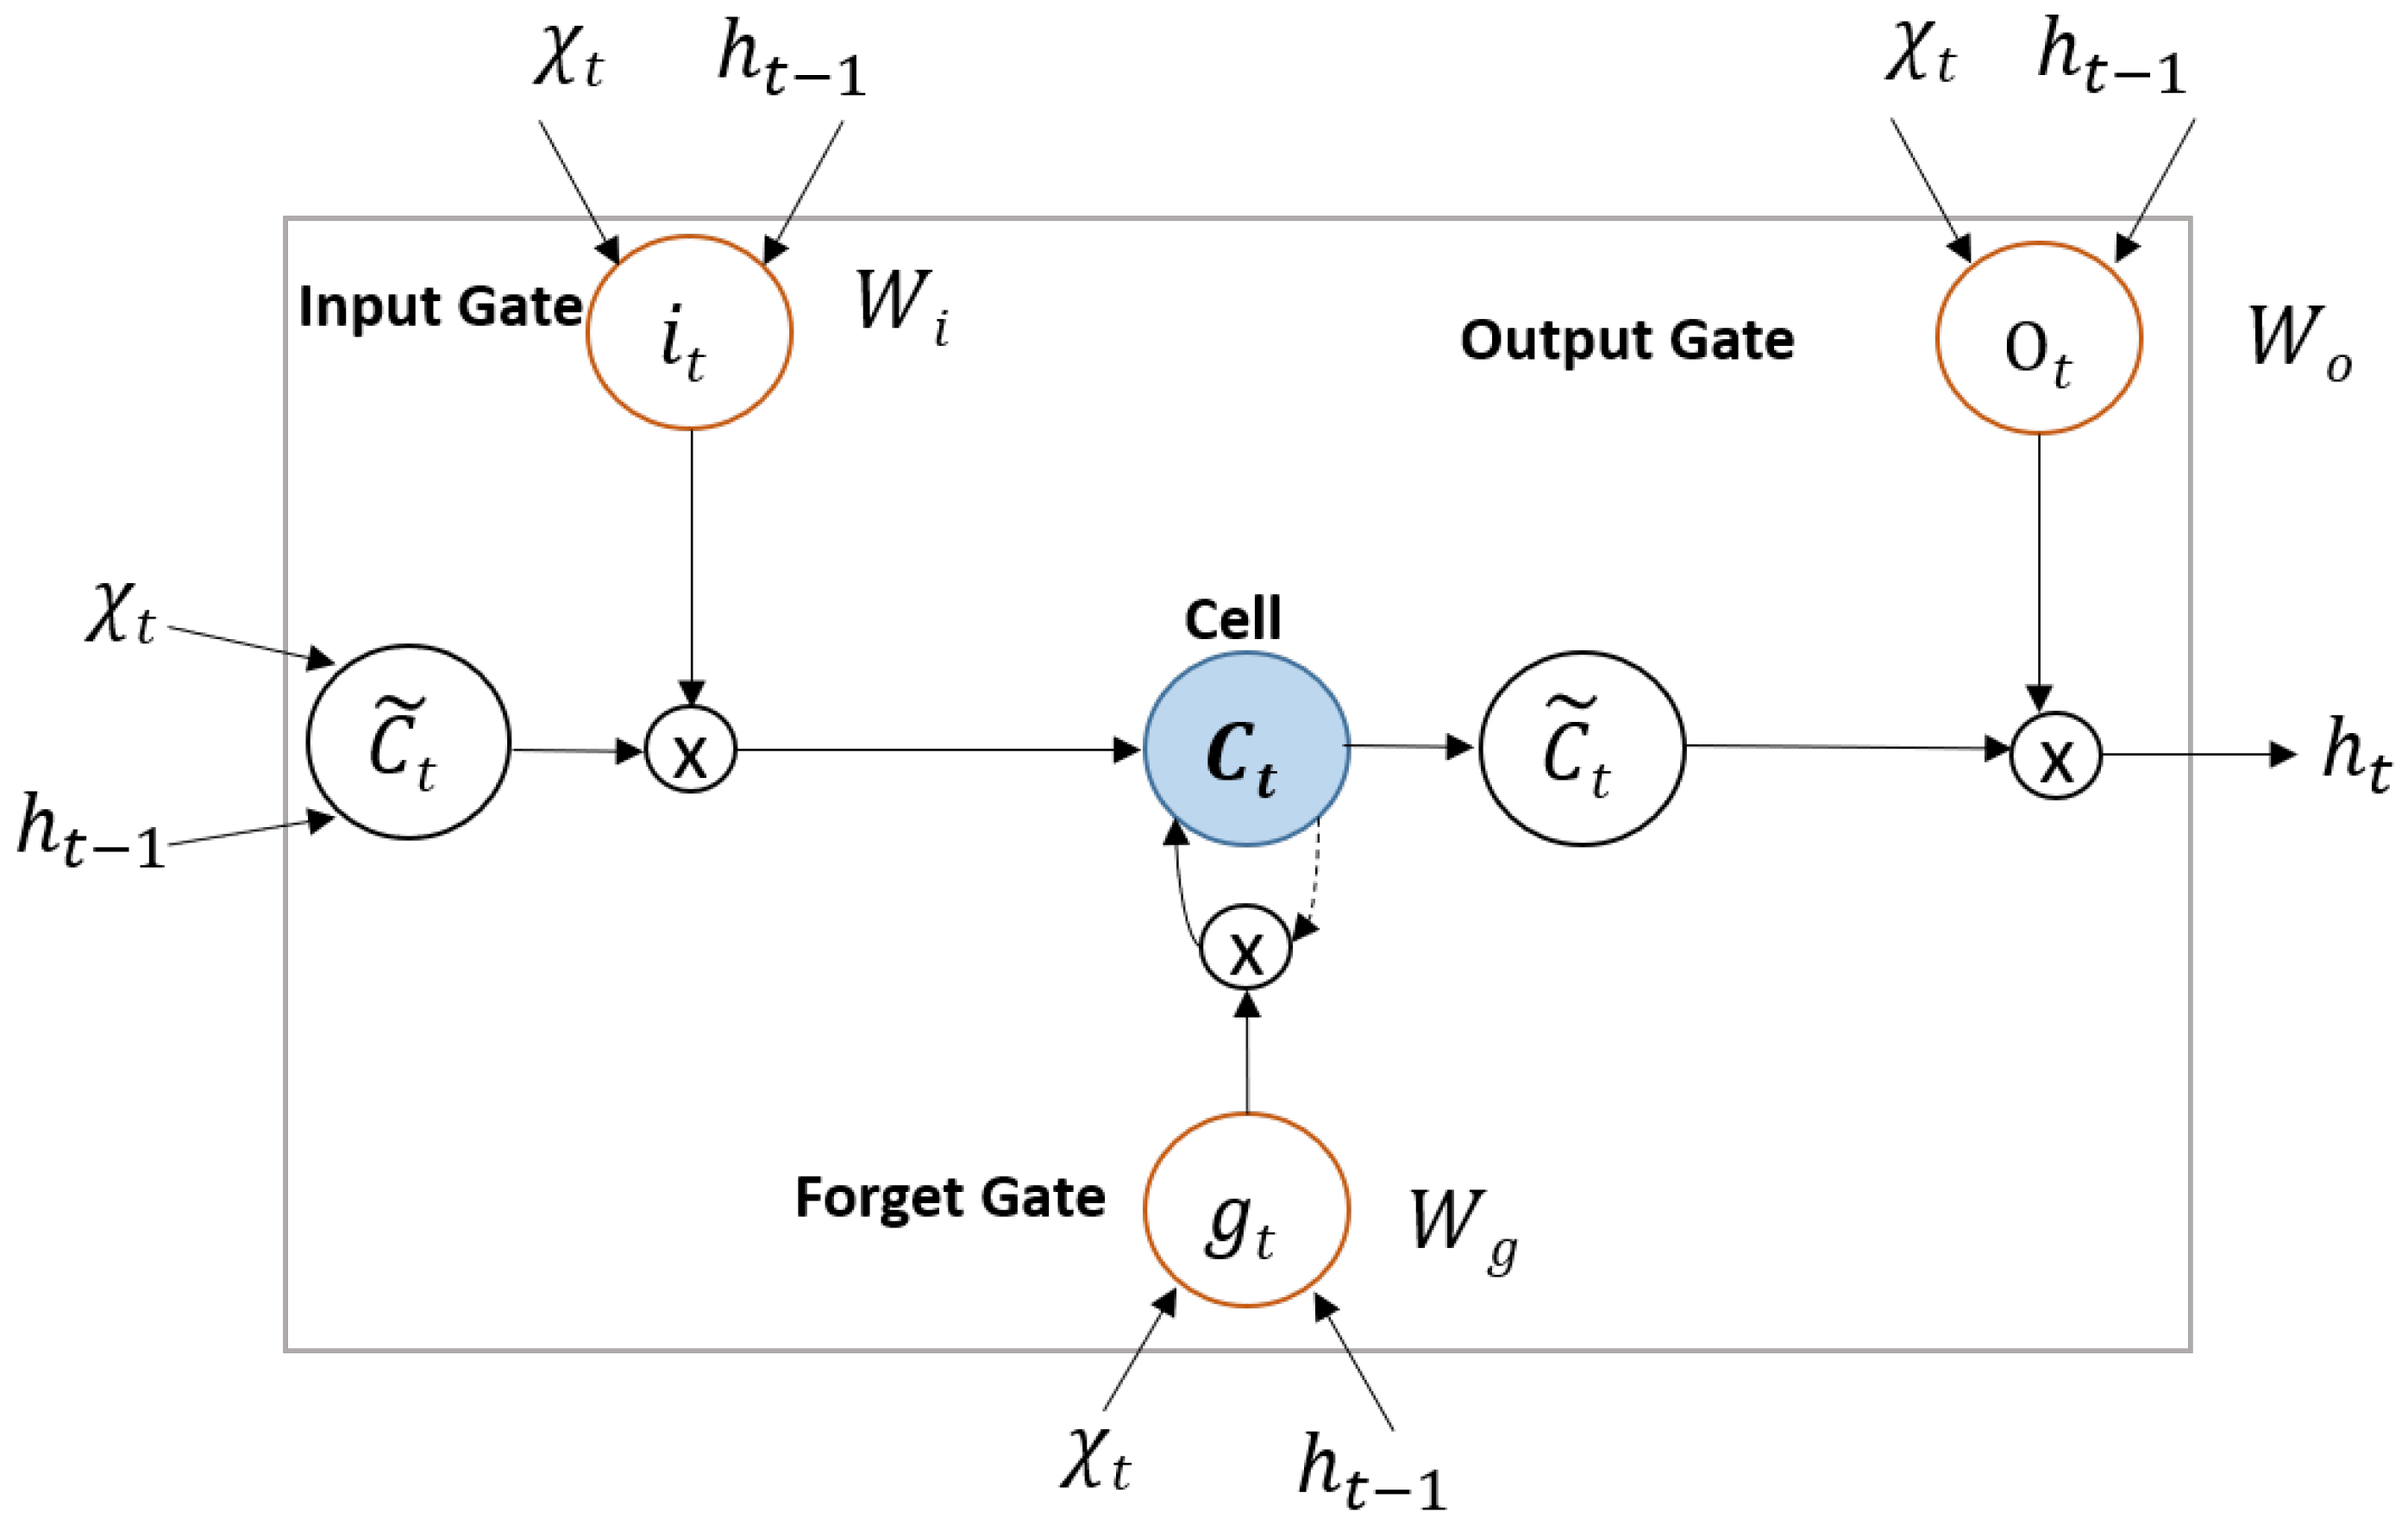
Figure 2.
Model architecture.
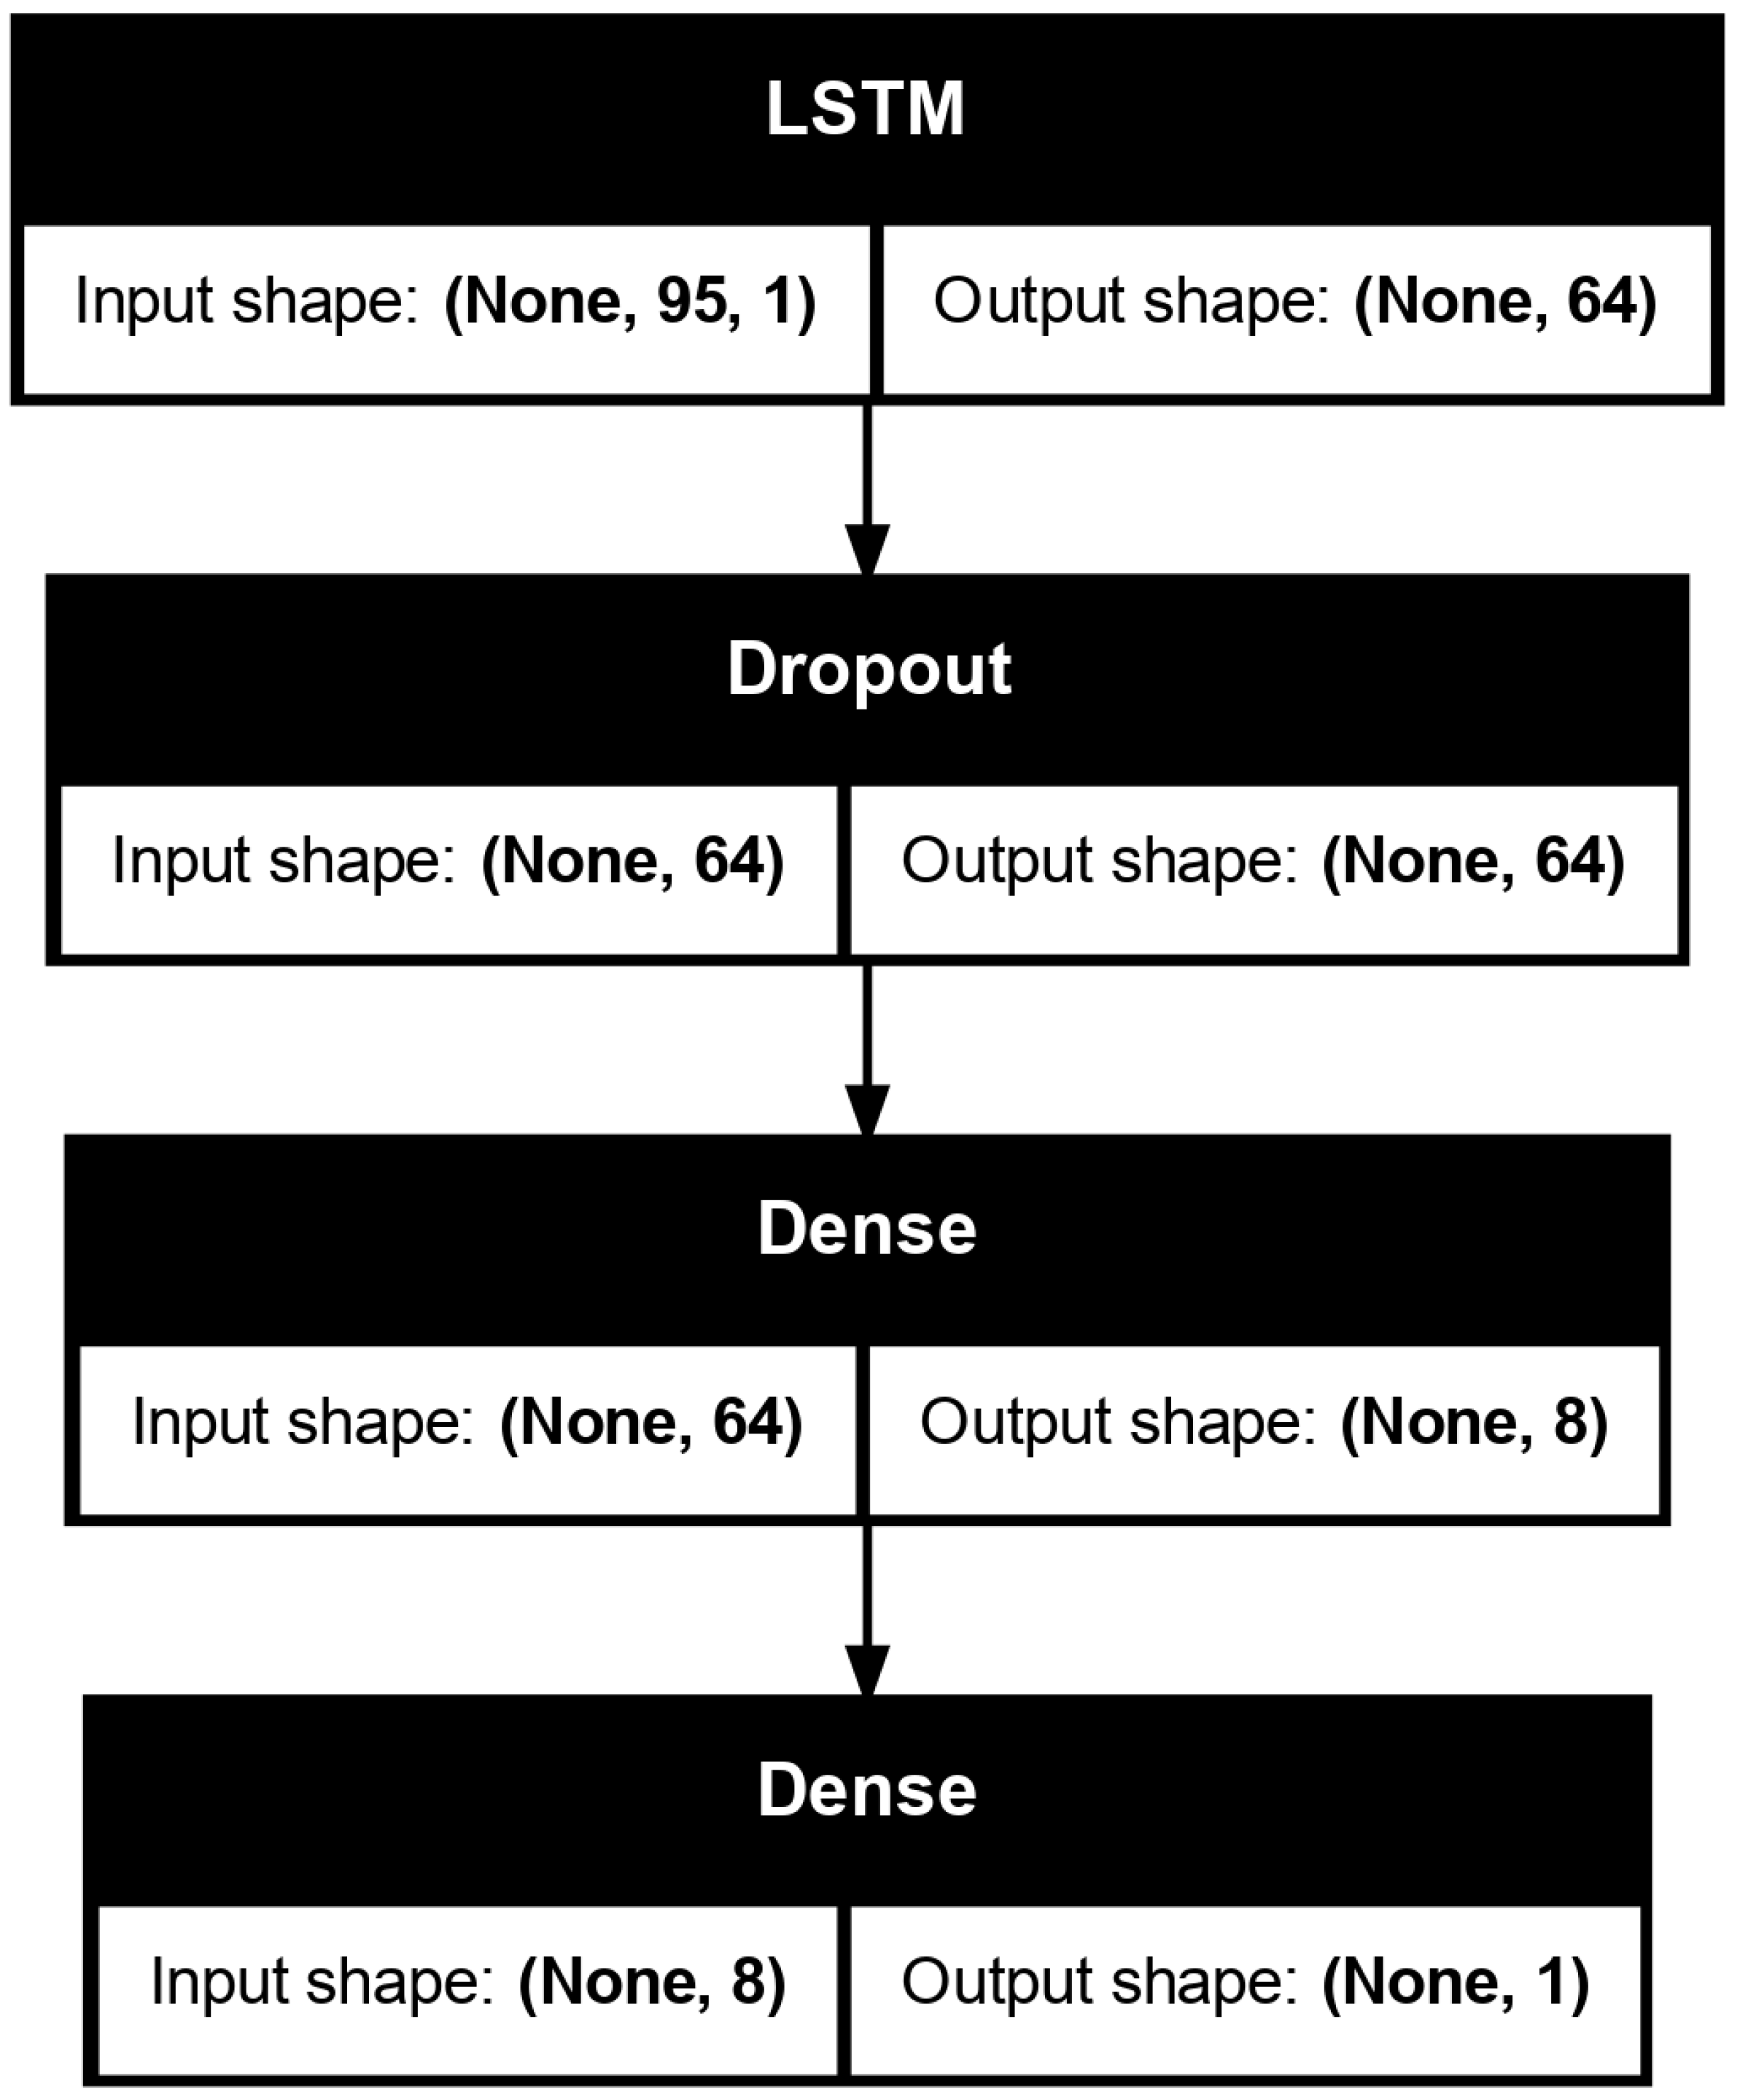
Figure 3.
LSTM strategy.
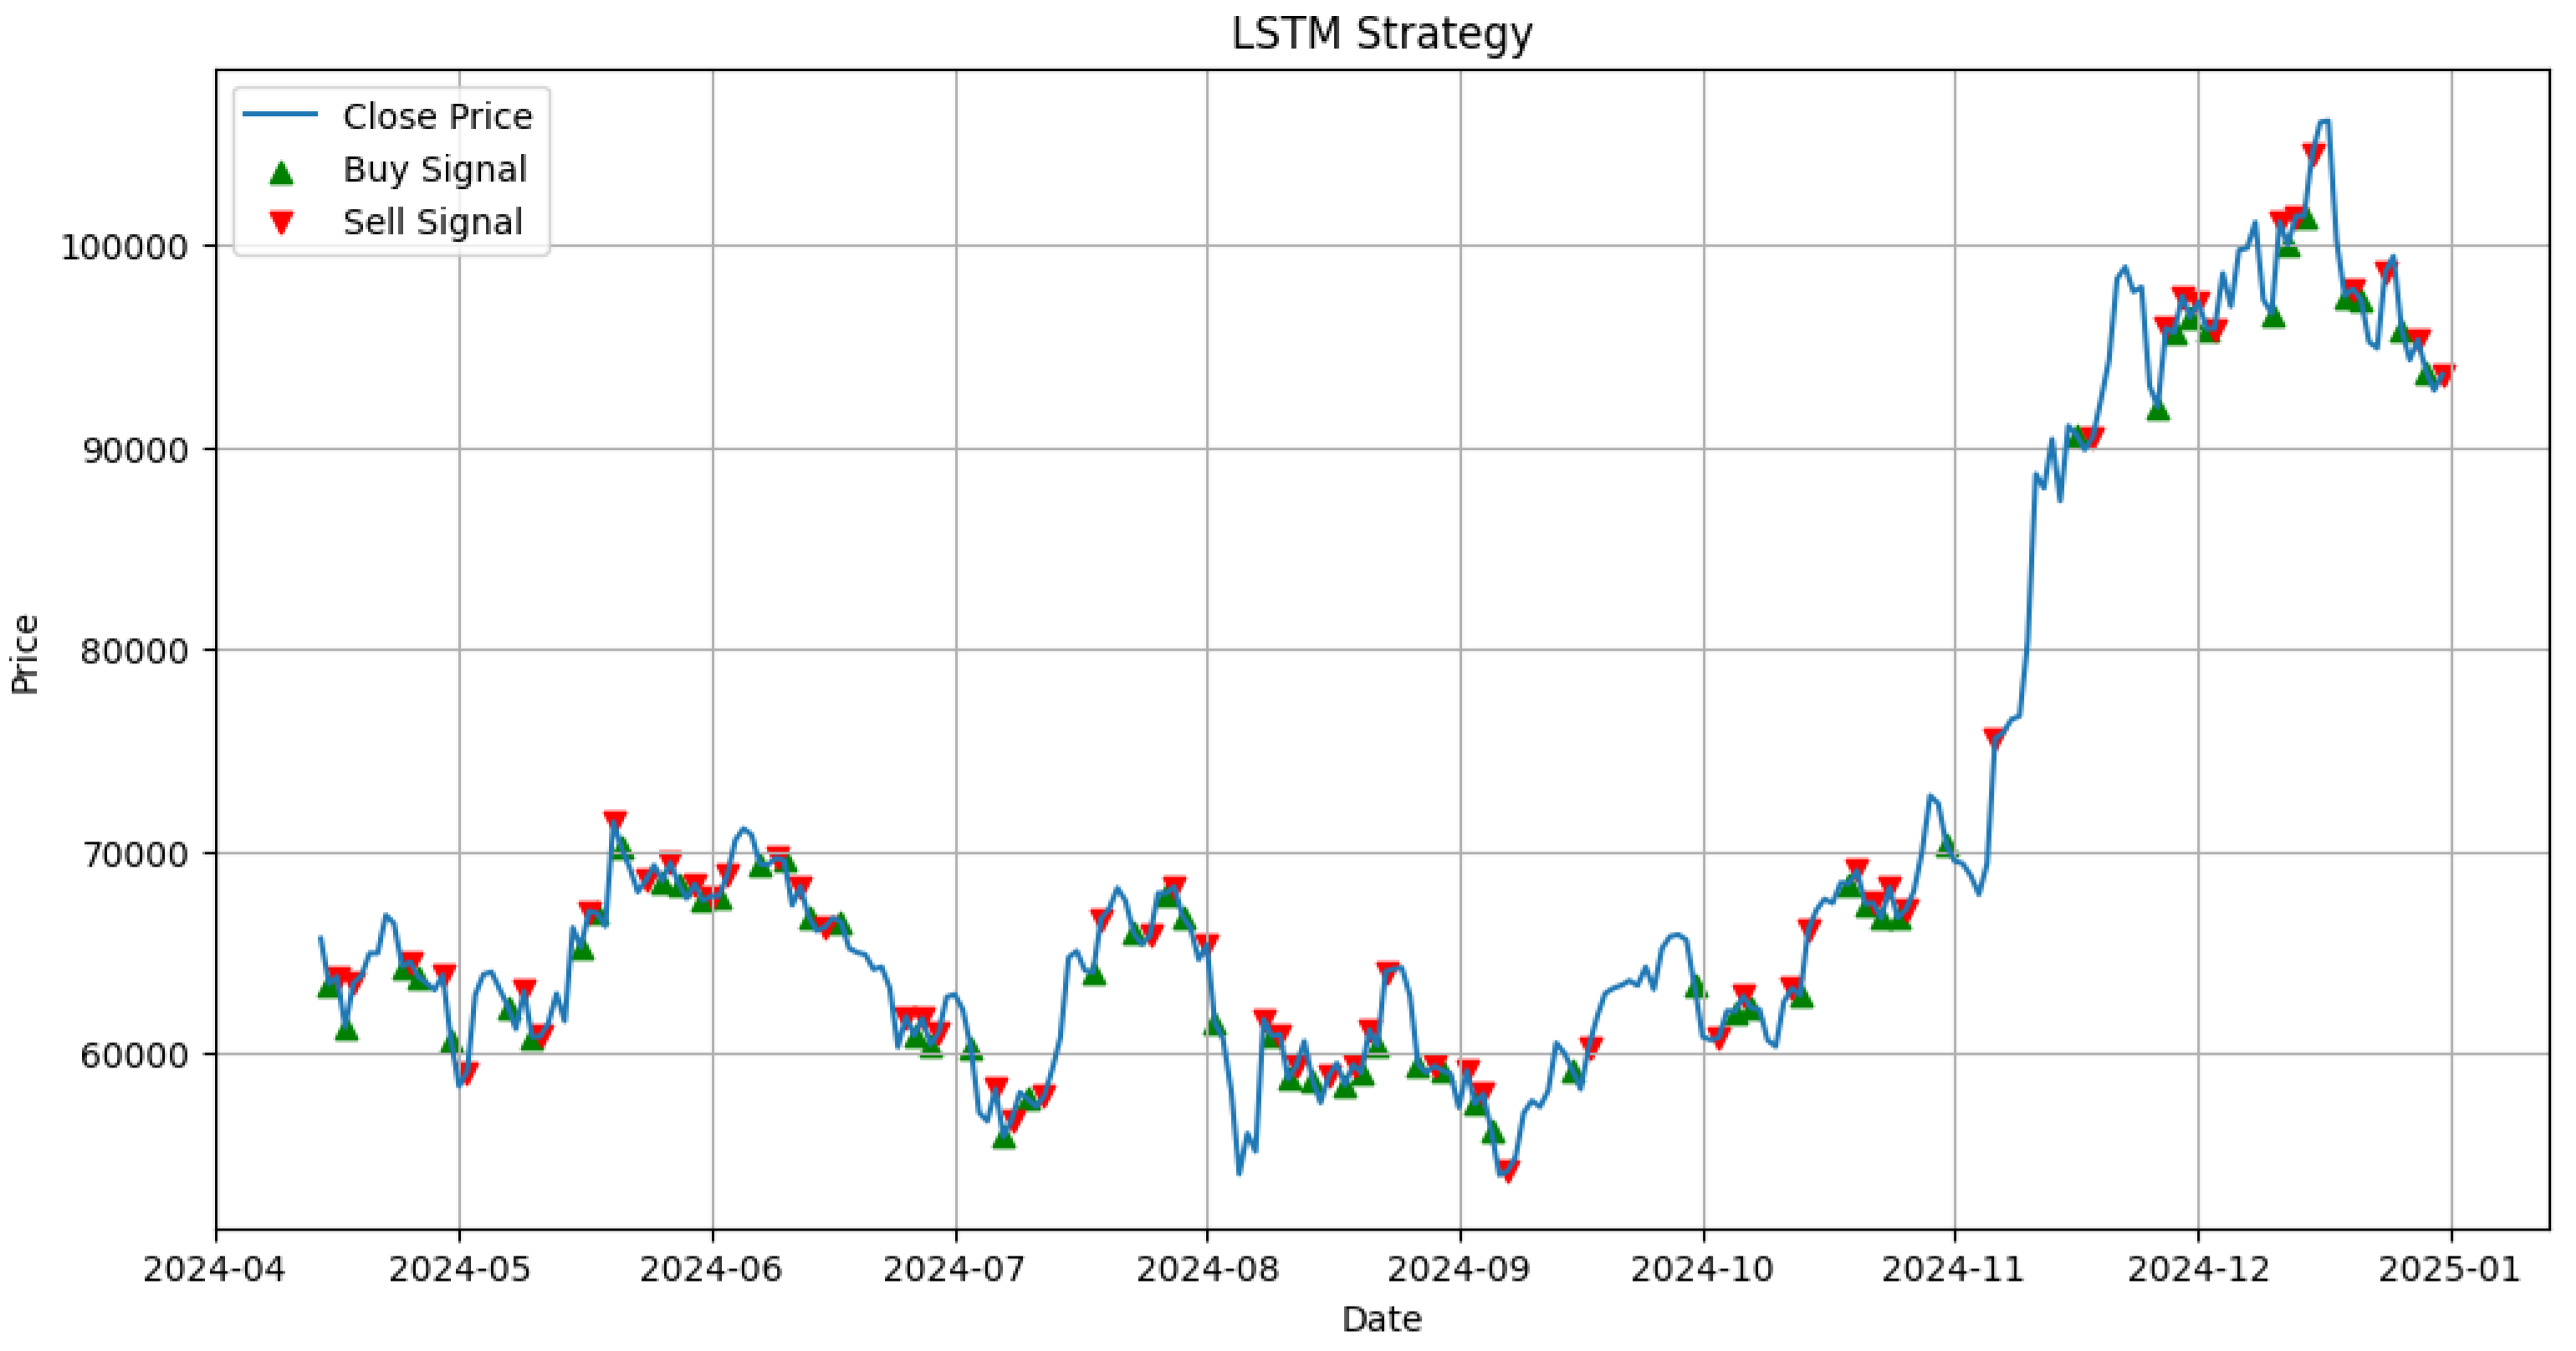
Figure 4.
MACD+ADX strategy.
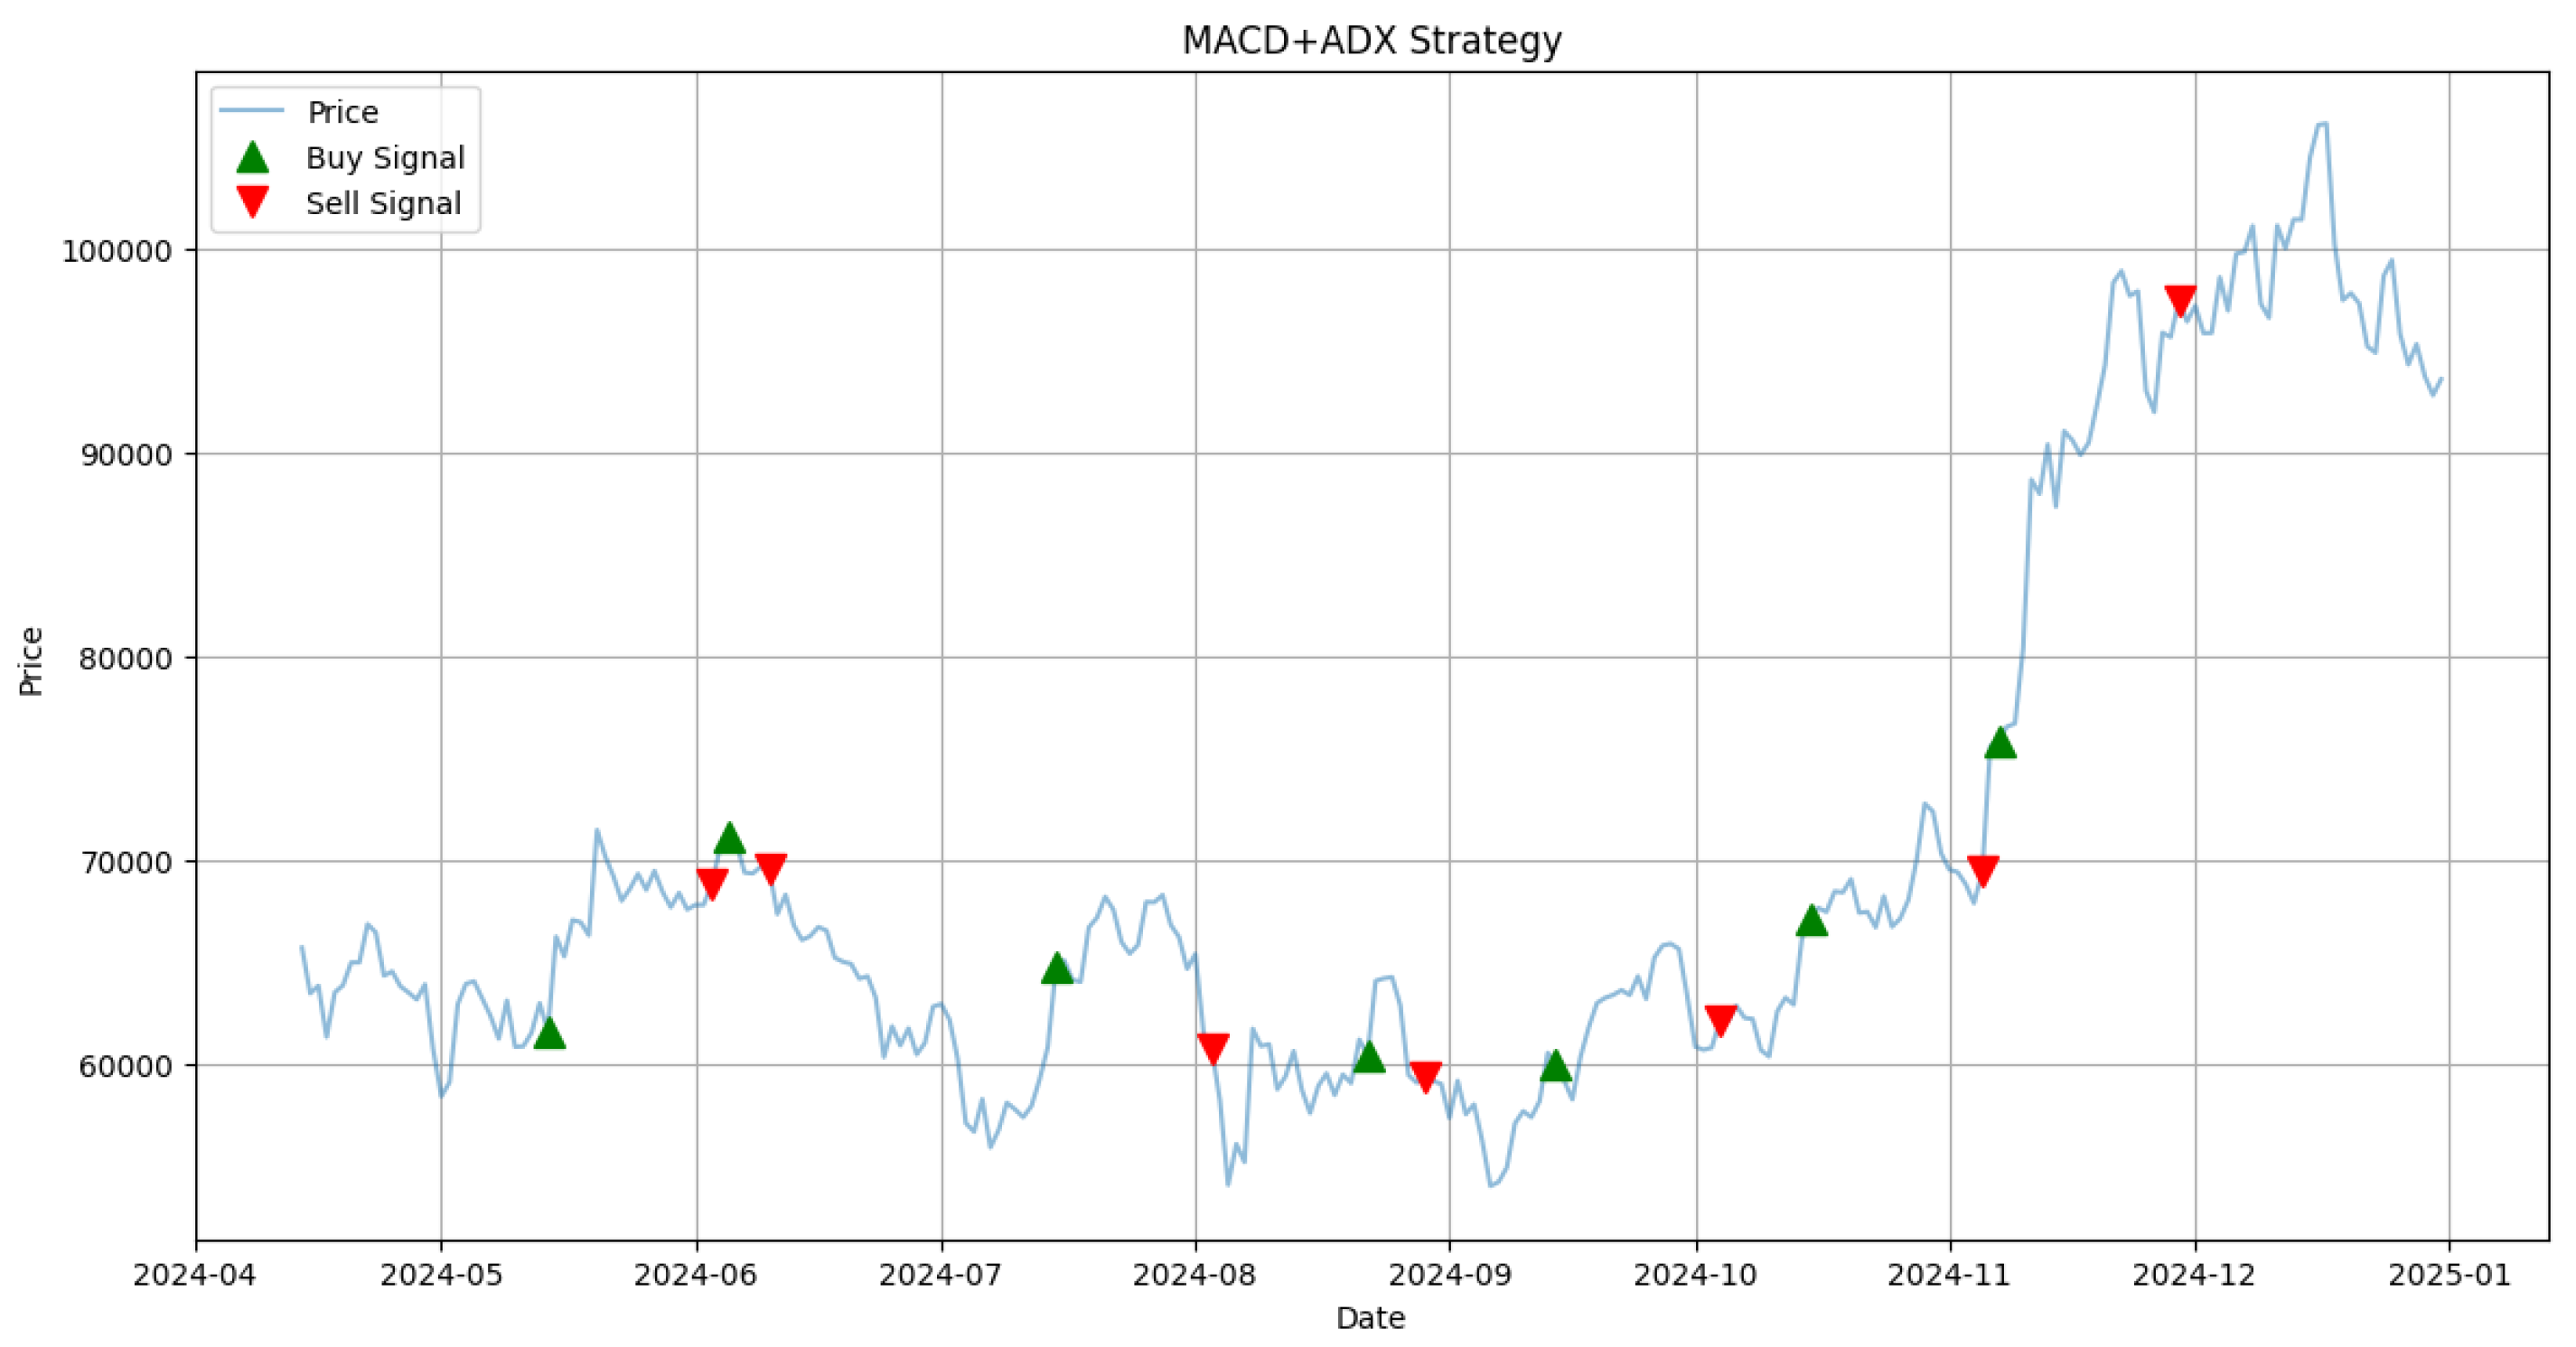
Figure 5.
EMA crossing strategy.
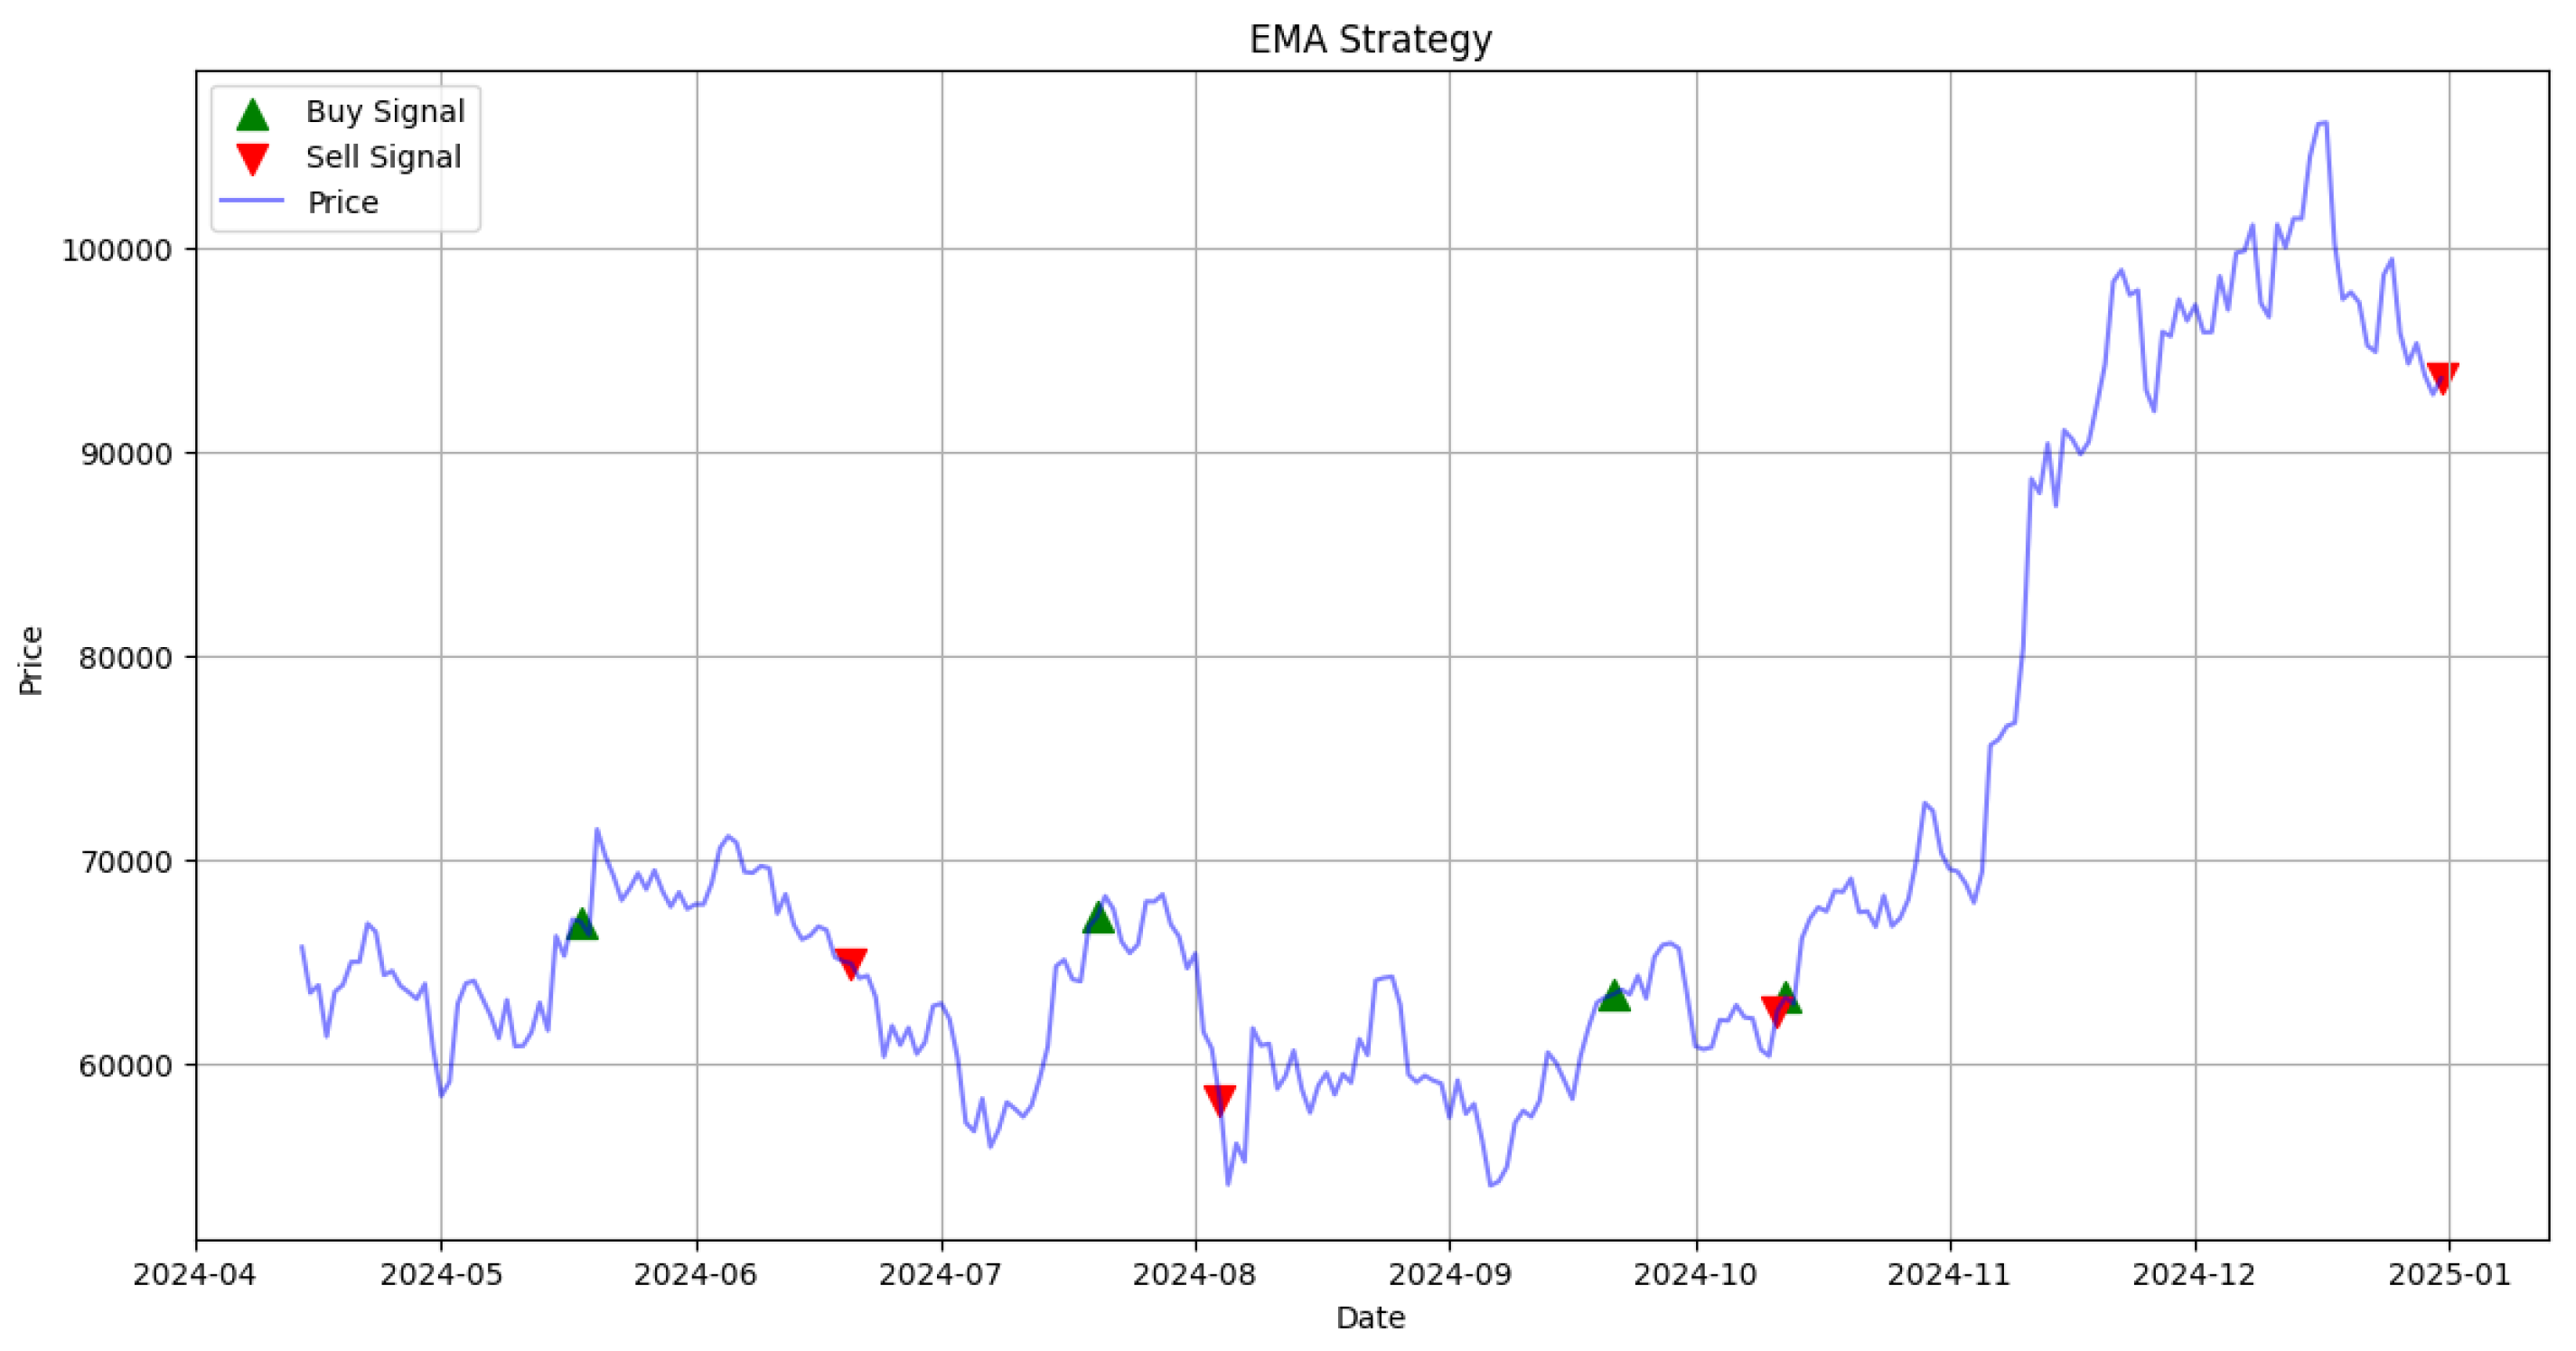

Table 1.
Cumulative return for each trading strategy.
| Case | Cumulative Return |
|---|---|
| LSTM | 65.23% |
| Buy & Hold | 42.51% |
| MACD + ADX | 35.45% |
| EMA | 26.07% |
Table 2.
Classification Metrics
| Value | |
|---|---|
| Metric | |
| Accuracy | 0.5611 |
| TPR | 0.4887 |
| TNR | 0.6357 |
| PPV | 0.5804 |
| FOR | 0.4533 |
| BA | 0.5622 |
| F1 Score | 0.5306 |
Disclaimer/Publisher’s Note: The statements, opinions and data contained in all publications are solely those of the individual author(s) and contributor(s) and not of MDPI and/or the editor(s). MDPI and/or the editor(s) disclaim responsibility for any injury to people or property resulting from any ideas, methods, instructions or products referred to in the content. |
© 2025 by the authors. Licensee MDPI, Basel, Switzerland. This article is an open access article distributed under the terms and conditions of the Creative Commons Attribution (CC BY) license (http://creativecommons.org/licenses/by/4.0/).
Copyright: This open access article is published under a Creative Commons CC BY 4.0 license, which permit the free download, distribution, and reuse, provided that the author and preprint are cited in any reuse.


