
Submitted:
27 November 2024
Posted:
29 November 2024
You are already at the latest version
Abstract
Crohn’s Disease (CD) is a chronic inflammatory bowel disease affecting the gastrointestinal tract. The search continues for new markers for assessing the activity of CD. Among them, pro-inflammatory and anti-inflammatory cytokines appear promising.We performed the analysis of cytokine concentrations in blood serum using the Bio-Plex Multiplex system (Bio-Rad) and their correlations with radiological parameters assessed by magnetic resonance enterography (MRE), fecal calprotectin levels measured quantitatively by ELISA and clinical evaluation according to the Crohn’s Disease Activity Index (CDAI). Our study has found that measuring cytokine serum concentrations can be a valuable tool in the diagnosis and treatment of CD. Positive correlations were reported between contrast enhancement on DCE-MRE and the concentrations of PDGF-BB and RANTES. Also, a positive correlation was found between delayed-phase of DCE and IL-10 concentration, a strong negative correlation between delayed-phase of DCE and IL-12 concentration, and a strong positive correlation between delayed-phase of DCE and RANTES concentrations. A strong positive correlation was also observed between the thickness of the intestinal wall on T2-weighted images and RANTES concentration. Therefore, concentrations of PDGF-BB, RANTES, IL-10 and IL-12 are promising markers of CD activity. The study also demonstrated significant correlations between the severity of disease activity assessed by the CDAI and the concentrations of IL-5, IL-8, and IL-9, as well as positive correlations between the levels of fecal calprotectin and the concentrations of IL-1RA and VEGF. Therefore, the levels of IL-5, IL-8, IL-9, VEGF and IL-1RA may be useful markers in the diagnosis and clinical assessment of disease activity.
Keywords:
Crohn’s Disease (CD)
; inflammatory markers
; cytokines
; calprotectin
; magnetic resonance enterography (MRE)
; CDAI
1. Introduction
Crohn’s disease (CD) is a chronic condition with a complex and not fully understood etiology. It is classified as inflammatory bowel disease (IBD) [1,2,3,4]. Chronic inflammation in CD results from the impaired regulation of the immune response in individuals with genetic predispositions who are exposed to environmental factors [5].Many tests are applied to diagnose and monitor CD treatment. They also include invasive procedures, such as colonoscopy with sample collection, which is the basic examination for establishing the final diagnosis and assessment of the disease severity. In the diagnostic process, especially in unclear clinical cases, laboratory findings and imaging diagnosis are also useful in differential diagnosis, assessment of the extent and severity of the inflammatory process, selection of optimal pharmacotherapy, or a decision on surgical treatment [6]. The search continues for additional diagnostic tools that could be widely available but not burdensome for patients [6,7,8]. Such tools can include the determination of cytokine levels. Acting as intercellular mediators, this diverse group of proteins affects the course of the inflammatory response by influencing the proliferation and stimulation of immune cells [9]. The impaired balance between pro- and anti-inflammatory cytokines plays a fundamental role in immune disorders underlying the inflammatory process in the intestinal wall [10]. Being markers of inflammation, cytokines may be crucial for the differential diagnosis of CD and may also be used to determine the disease severity/activity and to predict the course or risk of exacerbation in patients [4,6,11,12,13]. Among new methods of diagnostic imaging, magnetic resonance enterography (MRE) is of great importance since it is also a good tool for monitoring patients with CD. The examination is characterized by excellent tissue contrast and high spatial resolution, which allows for obtaining precise information about the morphology of the intestinal wall and changes outside the intestinal lumen. MRE is characterized by high sensitivity (> 90%) in detecting active inflammation in the course of CD and is often useful in the preoperative assessment and making decisions about the radicality of treatment [14].The aim of the study was to analyze the serum concentrations of selected inflammatory markers and their correlations with MRE parameters in patients with CD.
2. Materials and Methods
Forty-seven patients were enrolled in the study, including 24 patients with CD (study group; Group S) and 23 patients from the control group (Group C).
2.1. Characteristics of the Study and Control Groups
Group S consisted of 24 patients, including 14 women (58%) and ten men (42%) aged 22 to 78 years (mean age 45 years [SD+-15.8], mean BMI 22.1 kg/m² [SD+- 4.27]). Patients were either in remission or presented with varying degrees of inflammatory activity, which was determined by the Crohn’s Disease Activity Index (CDAI). Patients were admitted on an elective basis for surgical treatment of complications or on an expedited basis due to exacerbation of CD or suspected sudden complications of the disease. The clinical characteristics and the basic laboratory findings of the study group are given in Table 1.
A commercial fecal calprotectin test was performed in all 24 patients from the study group (Group S). The concentration of calprotectin exceeded the normal range (50μg/g) in 20 patients (83.33%). The results are given in Table 2.
Serological tests for the presence of ANCA antibodies (pANCA and cANCA) were performed in most patients and pANCA antibodies were found in 6 (20.8%) subjects, while cANCA antibodies were not found in any patient (Table 3).
MRE was performed in 17 out of 24 patients from Group S. Some patients also underwent additional examinations, such as colonoscopy, upper gastrointestinal endoscopy, rectoscopy, abdominal CT, abdominal X-ray and abdominal ultrasound. The diagnosis was confirmed in all patients by histopathological examination of postoperative material or samples obtained during colonoscopy (lesions in the colon or ileum).
Group C consisted of 23 patients who consented to the study, including 17 women (73.91%) and six men (26.09%) aged 50 to 85 years (mean age 65 years [SD+-9.98]) with no history of IBD, cancer, or severe internal diseases. This group was recruited from patients eligible for surgery of varicose veins of the lower limbs or inguinal hernias. The characteristics of Group C are given in Table 4.
The analysis showed that BMI, age and body weight in Group S were significantly lower than in Group C, while height was higher in Group S. The analysis of histograms also showed that Group C did not include patients under 40 years of age, who constituted about 50% of Group S. No significant difference in the sex distribution was observed between the groups. The comparison of the groups is given in Table 5.
2.2. Determination of Serum Concentrations of Selected Markers of Inflammation
To determine selected markers of inflammation in blood serum, the Bio-Plex technique was applied (Bio-Rad, Laboratories, Hercules, CA, USA). The Bio-PlexTM 200 System and Bio-Plex Manager™ software version 5.0 (Bio-Rad, Laboratories, Hercules, CA, USA) were used to read the data. Measurements were carried out in accordance with the manufacturer’s instructions. The Bio-Plex method is based on using a set of magnetic beads that differ in the shade of red that corresponds to the specificity of the antibodies covering them that are directed to specific cytokines. Each shade of red corresponds to a specific cytokine. During incubation, bead-bound cytokines were detected using biotinylated antibodies stained with a streptavidin-phycoerythrin complex. After each step of the reaction, a 96-well microplate containing the bead mixture was rinsed using an ELx 50 magnetic washer (BioTek Instruments, Winooski, VT, USA). Quantitative measurements of cytokine concentrations were made based on the obtained median fluorescence of individual groups of beads for a given sample and the curves obtained for a series of dilutions of appropriate standards using the company software.
The serum cytokine concentrations were measured at least twice. For the final statistical calculations, the mean of the determinations was considered. If the standard deviation (SD) from the sample exceeded the assumed values, the sample was determined again. The software automatically determined the minimum and maximum detection levels of the analyzed analytes based on the data. If the concentration of the analyte was below the lower limit of quantification (LLOQ), its value was assumed to be equal to the LLOQ for a given analyte (cytokine). The following cytokine panel was determined in the samples: IL-1β, IL-1RA, IL-2, IL-4, IL-5, IL-6, IL-7, IL-8, IL-9, IL-10, IL-12 (p70), IL-13, IL-15, IL-17A, eotaxin, FGF-basic, G-CSF, GM-CSF, IFN-γ, IP-10, MCP-1 (MCAF), MIP-1α, MIP-1β, PDGF-BB, RANTES, TNF-α and VEGF.
2.3. MRE in the Study Group
In Group S, MRE examinations were finally performed in 17 out of 24 patients (eight women; 47.1% and nine men; 52.9%). The remaining seven patients were disqualified from the study due to clinically diagnosed bowel obstruction confirmed by CT scans and the need for urgent surgery, while some patients refused the examination or MRE was discontinued due to the patient’s discomfort.
Since not all patients underwent MRE, the histogram analysis was used to assess the consistency of the obtained data (17 patients were examined in relation to the entire Group S). In all cases, similar distributions of cytokine concentrations were observed, which supports the homogeneity of the groups. Histograms are given in Figure 1.
2.4. Statistical Analysis
Assessment of the normality of the distribution for quantitative variables was performed using the Shapiro-Wilk test. In the case of IL-15 and FGF, one missing data was observed in each case in the study group. The missing data were replaced with the values matched based on the random forest algorithm from the MissForest library for the R language. The normalized root mean square error (NRMSE) was 0.02. Quantitative data are presented as the median with a quartile range due to the low sample size and failure to meet the normal distribution. A nonparametric Mann-Whitney U test was used to compare the groups. The relationships between the variables were analyzed using the Spearman correlation coefficient. Qualitative variables are presented as the percentage of cases in which a given feature was found. The values of p <0.05 were considered statistically significant. The results were developed in R using the RStudio environment (RStudio Team 2020; RStudio: Integrated Development for R. RStudio, PBC, Boston, MA URL http://www.rstudio.com/ and Microsoft Excel 365).
3. Results
For clarity, the results of serum inflammatory biomarker concentrations were divided into two subsets, i.e., the results of interleukins (ILs) and other cytokines (Table 6 and Table 7). Except for IL-5, IL-12 and IL-15, the levels of most cytokines and soluble receptor antagonist (IL-1RA) were significantly higher in Group S than in Group C. Significantly higher concentrations of eotaxin, IFN-γ, IP-10, MCP-1, MIP-1β, PDGF-BB, RANTES, TNF-α and VEGF in Group S were reported compared to Group C. The concentrations of FGF-Basic, G-CSF, GM-CSF and MIP-1α did not differ significantly.
Next, we analyzed the correlations between cytokines, which indicated that most of the cytokine concentrations were positively correlated. After stratification into groups, no significant trend reversal was found in the form of a change in the direction of correlation from strongly positive to strongly negative, which suggests no significant effect in the mechanism of cytokine action between the groups. Cytokine correlations are shown in the heat maps (Figure 2, Figure 3 and Figure 4).
Spearman’s correlation coefficient was used to analyze the relationships between the concentrations of all cytokines and the following radiological parameters (MRE):
- -
- enhancement of the intestinal wall assessed using DCE;
- -
- enhancement of the intestinal wall assessed using delayed-phase of DCE;
- -
- thickness of the intestinal wall on T2 images;
- -
- diffusion restriction assessed using apparent diffusion coefficient (ADC) maps (mm/s).
The analysis showed a positive correlation between contrast enhancement on DCE and the concentrations of PDGF-BB and RANTES. A positive correlation was also observed between contrast enhancement in the delayed phase and IL-10 concentration. A strong negative correlation was found between contrast enhancement in the delayed phase and IL-12 concentration. A strong positive correlation was reported between contrast enhancement in the delayed phase and RANTES concentrations. A strong positive correlation was also observed between the thickness of the intestinal wall on T2 images and the concentration of RANTES and a tendency to a positive correlation between the thickness of the intestinal wall and the concentrations of IL-10. However, no significant relationships were observed between diffusion restriction and the cytokines.
Next, we performed the analysis of the correlations between the values of CDAI and the cytokines and radiological parameters. Significant correlations were found between the CDAI values and the levels of IL5, IL-8 and IL-9. Other cytokines and all radiological parameters did not correlate significantly with the CDAI. Significant correlations are shown in Figure 5.
A similar analysis was performed between calprotectin concentrations and the cytokines, CDAI values and radiological parameters. Positive correlations were found between calprotectin concentrations and the levels of IL-1RA and VEGF. In addition, a tendency to a positive correlation was observed between the level of calprotectin and the diffusion restriction on DWI (p = 0.06). Significant correlations are given in Figure 6.
4. Discussion and Conclusions
The search for new diagnostic and therapeutic methods in CD is very important because this chronic and incurable gastrointestinal disease characterized by alternating periods of exacerbation and remission mainly affects young people. In this group of patients, absorption disorders often occur and lead to weight loss. In addition, patients with active disease often limit their food intake due to abdominal pain, nausea and discomfort after consumption of certain products, which leads to an insufficient supply of iron and malnutrition. Similarly, our patients were mainly young subjects who significantly differed in age and weight from the controls.Acute phase protein (CRP) and calprotectin are commonly used markers of inflammation in CD, which allows the monitoring of the disease course and response to treatment. CRP is produced in the liver in response to inflammation induced by IL-1, IL-6 and TNF-α. Despite certain limitations (lack of specificity), it is useful in assessing disease activity. In correlation with other markers, it allows monitoring the course of CD and response to treatment. Calprotectin, on the other hand, is a protein formed in the liver with the participation of cytokines, whose blood concentration changes as a result of response to inflammation. Calprotectin is commonly used as a biomarker in CD and in differentiating CD from irritable bowel syndrome (IBS), which has a different pathogenesis despite similar symptoms. It has been proven that increasing calprotectin levels in routine tests predict disease progression regardless of the presence of symptoms and location of CD. Stable normal calprotectin levels are also considered to be a positive prognostic marker for maintaining clinical remission. Other studies have suggested that calprotectin levels may be a non-invasive marker of mucosal healing. Research is conducted on other biomarkers that can potentially be used in clinical decision-making [6,15,16,17,18]. In recent years, cytokines have been considered promising biomarkers since long-term follow-ups have shown that this group of proteins plays a vital role in the pathogenesis of CD, particularly as regards the disproportion between pro-inflammatory and anti-inflammatory cytokines [6,15,19,20]. The assessment of their concentrations can be useful for establishing an appropriate diagnosis and assessing the severity of disease activity. Additionally, it can be a potential prognostic tool for predicting the course of the disease and facilitating the development of new therapeutic methods, including biological treatment [21,22,23]. According to the literature, it is clinically more useful to determine several biomarkers at the same time, and their combined assessment can be an effective tool for monitoring patients. It might replace invasive testing in the future or reduce the number of tests. Among the promising cytokines, interleukin 6 (IL-6) is crucial. It has a pro-inflammatory activity. Many authors, such as Nikolaus et al. [24] found elevated serum levels of IL-6 in patients with active CD. Similarly, in the group of our patients, the concentrations of IL-6 were significantly higher compared to the controls. There are also reports that the assessment of IL-6 can be used as a biomarker in predicting response to biological therapy, although study results are inconclusive [25,26]. However, this is an interesting point for further research since IL-6 has been the focus of attention for many years (the possibility of targeted anti-IL-6 therapy in patients with severe CD) [27]. Cytokine regulatory networks have important implications for the development and progression of the disease [24], which is demonstrated by the failure of IL-10 in treating CD. Initially, IL-10 supplementation had beneficial effects in mouse models and clinical trials showed that recombinant IL-10 was safe and well tolerated in humans. Unfortunately, the effect of clinical trials in humans was disappointing. Based on current research, IL-10 supplementation cannot be a universal treatment method in CD, but it can provide the expected effect in a well-selected small group of patients [28]. In our subjects, the levels of IL-10 were significantly higher compared to the control group, which shows how important it is to determine the concentration of cytokines because in these patients IL-10 supplementation would certainly not be beneficial and could even exacerbate the already ongoing inflammation. Another interesting biomarker is RANTES, a chemokine synthesized by T lymphocytes, which has a pro-inflammatory effect. Ansari et al. [29] found that the concentrations of RANTES were elevated in CD. However, significantly higher levels of RANTES were noted in ulcerative colitis (UC) compared to CD. Therefore, it seems important to consider the concentration of RANTES in differential diagnosis (UC vs. CD) and when inflammatory changes in the intestinal wall are suspected.This study showed correlations between RANTES and MRE parameters indicative of inflammation in the intestinal wall, such as wall thickening and contrast enhancement on DCE. A similar correlation was found between platelet-derived growth factor (PDGF) and enhancement of the intestinal wall on DCE, which is in line with the literature data related to increased PDGF levels in patients with active CD [30]. These correlations indicate that it is worth considering the assessment of PDGF and RANTES levels in a group of patients with suspected inflammatory bowel changes. The concentration of RANTES seems crucial in correlation with contrast enhancement of the intestinal wall and its thickness. As we know, the clinical severity of the disease does not always correlate with the symptoms reported by patients and the CDAI. It may be useful to determine disease activity using other non-invasive markers that can precede the clinical manifestation of the disease and the symptoms reported by patients. Thus, cytokines, such as RANTES and PDGF-BB, can support radiological monitoring of CD, allowing for a more comprehensive assessment of patients.The literature shows the correlations of individual biomarkers with disease activity measured using the CDAI. To date, there has not been sufficiently strong evidence that the determination of the level of a single interleukin could be a sufficient tool to assess CD activity. However, determining several biomarkers is more clinically useful and reliable and their combined assessment can be an effective tool for monitoring patients. Bourgonje et al. [26] proved that the combined assessment of four biomarkers (serum amyloid A, IL-6, IL-8 and eotaxin 1) reliably predicted disease activity in correlation with endoscopic assessment. In another study, Słowińska-Solnica et al. [31] showed that combined assessment of biomarkers offered better results in the diagnosis of CD than each of these markers alone. The best results were obtained by assessing IL-23, CRP, IL-6 and IL-17 together. Also, more accurate results were obtained for the combined assessment of IL-6 and CRP than for each biomarker separately. In addition, there have been some findings that the concentration of IL-6 correlated well with the CDAI and its concentration could predict a clinical response during biological therapy [21,31]. Surprisingly, no correlation was found between the CDAI and IL-6 levels in the study group. However, correlations were reported between IL5, IL-8 and IL-9 levels and the CDAI, which could contribute to a broader use of these interleukins to monitor patients with CD. In the case of IL-8, next to the demonstrated correlation with the CDAI, an additional advantage is its high accuracy in differentiating patients with IBD from IBS [32]. Scaioli et al. [33] focused on the correlation between the calprotectin concentration in the stool with the CDAI. Their study showed that patients with a CDAI value from 100-150 had an increased probability of increased fecal calprotectin levels and asymptomatic mucosal inflammation. Their study also found that asymptomatic patients with a CDAI = 120 had a 60% chance of having endoscopically/histologically evident active disease. Therefore, the authors of the study showed that it could be useful to analyze a group of patients with a CDAI value ranging from 100 to 150. Our study showed positive correlations of calprotectin levels with selected cytokine concentrations (IL-1RA, VEGF), which confirms the importance of calprotectin as a biomarker of inflammation in CD. However, we found no correlation between calprotectin concentrations and the CDAI. IL-1RA is an IL-1R receptor antagonist mainly produced together with IL-1 to prevent overstimulation and inflammatory response. The correlation we demonstrated suggests that it is worth considering the assessment of IL-1RA in CD, although the IL-1RA/IL-1 ratio is probably a more reliable factor. Casini Raggi et al. [34] suggested that the impaired imbalance between Il-1RA and IL-1 could indicate a disturbance in homeostasis and the ratio was strongly correlated with disease severity. This finding is significant since it has also been previously reported that the concentration of IL-1RA needed to be about 100 times higher compared to IL-1 to effectively inhibit IL-1 signaling [35,36].In our opinion, it was essential to demonstrate a correlation between the growth factor involved in the formation of the blood vessel network, such as VEGF, and the concentration of calprotectin. VEGF is a protein considered to be the most potent factor promoting angiogenesis. One paper showed that serum VEGF levels correlated well with the clinical picture of patients and the parameter could also be used to predict response to anti-TNF-α therapy. Eder et al. (2015) [37] suggested that VEGF could be an additional marker of CD activity and the assessment of its concentration in blood serum could be useful in optimizing the treatment with anti-TNF-α and in selecting patients who could benefit from this therapy. Therefore, our demonstration of the correlation between VEGF and fecal calprotectin levels is another evidence for the possible use of this growth factor as a biomarker in CD.When monitoring patients with CD, attention should be paid to the course of the disease, its activity and endoscopic surveillance since the long-term course of the disease increases the risk of carcinogenesis and patients with IBD are also affected with colorectal cancer, usually at a younger age than the general population [38]. It is believed that chronic inflammation in the intestinal wall is one of the crucial factors in the pathogenesis of colorectal cancer and adenocarcinoma of the small intestine. It has been proven that the ongoing inflammatory process and the imbalance between the initiation and inhibition of the inflammatory response affected neoplastic transformation, cell proliferation, angiogenesis and metastasis. It is also believed that many of the interleukins associated with CD, including IFN-γ, IL-1, IL-2, IL-6, IL-8 and IL-17, play an essential role in carcinogenesis [39,40,41,42].Further research is warranted on the mechanism of action of individual cytokines and their importance in CD since they allow the improvement of existing therapies and the creation of new ways for regulating cytokine pathways that emerge during clinical trials. It is important to search for new diagnostic methods and specific markers that could speed up the diagnosis of this group of patients, contribute to a quick accurate diagnosis, facilitate therapeutic decisions and could also be a prognostic factor for the further course of the disease. The search continues for methods of patient monitoring, which would be characterized by non-invasiveness and would allow for frequent follow-ups. Examinations should be extended to include dynamic assessment of the cytokine networks during the disease course. It is also essential to observe how patients react to a specific therapy, which may make it easier to select patients for each treatment. Such a personalized medicine approach tailored individually to the patient’s needs seems to have the best chance of achieving the intended long-term goals and the expected clinical results [23].
5. Conclusions
The analysis of inflammatory marker concentrations and their correlations with radiological parameters in patients with CD indicates the following:
1. Determination of cytokine concentrations, such as IL-1β, IL-2, IL-4, IL-6, IL-7, IL-8, IL-9, IL-10, IL-13, IL-17, eotaxin, IFN-γ, IP-10, MCP-1, MIP-1β, PDGF-BB, RANTES, TNF-α VEGF and IL-1RA, can be a valuable tool in the diagnosis and assessment of CD activity. These markers can help diagnose the disease and monitor its course.
2. The concentrations of PDGF-BB, RANTES, IL-10 and IL-12 showed correlations with radiological parameters assessed by MRE, which characterize active inflammation. These cytokines have a particular potential as markers for the assessment of CD activity.
3. MRE parameter values showed no significant correlation with fecal calprotectin levels or disease severity as assessed by the CDAI. None of these indicators can be used as a single indicator of CD activity.
Research on the mechanisms of cytokine action in CD may lead to finding more effective treatment methods and contribute to faster diagnosis. Combined assessment of many inflammatory markers, including cytokines, with imaging results may be more effective in assessing disease activity. This can lead to the development of more precise diagnostic tools that may potentially reduce the need for invasive examinations.
Institutional Review Board Statement
The study was approved by the Bioethics Committee of the Medical University of Silesia (Resolution No. PCN/0022/KB1/98/I/18/19 of 12th November 2019).
Conflicts of Interest
The authors declare no conflicts of interest.
References
- Sairenji T, Collins K, Evans D. An Update on Inflammatory Bowel Disease. Primary Care: Clinics in Office Practice. 2017, 44, 673–692.
- Alatab S, et al. GBD 2017 Inflammatory Bowel Disease Collaborators, The global, regional, and national burden of inflammatory bowel disease in 195 countries and territories, 1990–2017: a systematic analysis for the Global Burden of Disease Study 2017. The Lancet Gastroenterology& hepatology. 2020, 5, 17–30.
- Odze, R. A contemporary and critical appraisal of 'indeterminate colitis'. Mod Pathol 2015, 28, 30–46. [Google Scholar] [CrossRef]
- Baumgart, D. Crohn’s Disease and Ulcerative Colitis—From Epidemiology and Immunobiology to a Rational Diagnostic and Therapeutic Approach. Springer, New York, 2012.
- Baumgart D, Sandborn W. Crohn’s disease. Lancet volume 2012, 380, 1590–1605.
- Eder, P. Przydatność biomarkerów w ocenie aktywności nieswoistych chorób zapalnych jelit - wskazówki praktyczne. Gastroenterologia kliniczna 2018, 10, 52–63. [Google Scholar]
- Olivera PA, Silverberg MS. Biomarkers That Predict Crohn’s Disease Outcomes. J Can Assoc Gastroenterol. 2023, 7, 59–67. [Google Scholar] [CrossRef]
- Srinivasan, AR. Treat to target in Crohn’s disease: A practical guide for clinicians. World J Gastroenterol. 2024, 30, 50–69. [Google Scholar] [CrossRef]
- Zhang J, An J. Cytokines, inflammation and pain. Int Anesthesiol Clin. 2007, 45, 27–37. [Google Scholar] [CrossRef]
- Velikova TV, Miteva L, Stanilov N, Spassova Z, Stanilova SA. Interleukin-6 compared to the other Th17/Treg related cytokines in inflammatory bowel disease and colorectal cancer. World J Gastroenterol. 2020, 26, 1912–1925. [Google Scholar] [CrossRef]
- Lichtenstein G, McGovern D. Using Markers in IBD to predict disease and treatmenr outcomes: rationale and a review of current status. The Americal Journal of Gastroenterology Supplements. 2016, 3, 17–26. [Google Scholar] [CrossRef]
- Bennike T, Birkelund S, Stensballe A, Andersen V. Biomarkers in inflammatory bowel diseases: current status and proteomics identification strategies. World J Gastroenterol. 2014, 20, 3231–3244. [Google Scholar] [CrossRef] [PubMed]
- Voskuil, MD. Predicting (side) effects for patients with inflam- matory bowel disease: The Promise of pharmacogenetics. World J Gastroeneterol 2019, 25, 2539–2548. [Google Scholar] [CrossRef] [PubMed]
- Moy M, Sauk J, Gee M "The Role of MR Enterography in Assessing Crohn’s Disease Activity and Treatment Response". Gastroenterology Research and Practice 2016, 13, 8168695.
- Kennedy NA, Jones G-R, Plevris N, et al. Association between level of fecal calprotectin and progression of Crohn’s disease. Clin Gastroenterol Hepatol Off Clin Pract J Am Gastroenterol Assoc. 2019, 17, 2269–2276. [Google Scholar]
- D’Amico F, Bonovas S, Danese S, et al. Review article: faecal calprotectin and histologic remission in ulcerative colitis. Aliment Pharmacol Ther. 2020, 51, 689–698. [Google Scholar] [CrossRef]
- Røseth AG, Schmidt PN, Fagerhol MK. Correlation between faecal excretion of indium-111-labelled granulocytes and calprotectin, a granulocyte marker protein, in patients with inflammatory bowel disease. Scand J Gastroenterol. 1999, 34, 50–54. [Google Scholar] [CrossRef]
- Louis, E. Fecal calprotectin: towards a standardized use for inflammatory bowel disease management in routine practice. J Crohns Colitis. 2015, 9, 1–3. [Google Scholar] [CrossRef]
- Guan Q, Zhang J. Recent Advances: The Imbalance of Cytokines in the Pathogenesis of Inflammatory Bowel Disease. Mediators Inflamm. 2017, 2017, 4810258. 160. Friedrich M, Pohin M, Powrie F. Cytokine Networks in the Pathophysiology of Inflammatory Bowel Disease. Immunity 2019, 50, 992–1006.
- Cornish J, Wirthgen E, Däbritz J. Biomarkers predictive of response to thiopurine therapy in inflammatory bowel disease. Front Med (Lausanne) 2020, 7, 8. [Google Scholar]
- Caviglia G, Rosso C, Stalla F, et al. On-Treatment Decrease of Serum Interleukin- 6 as a Predictor of Clinical Response to Biologic Therapy in Patients with Inflammatory Bowel Diseases. J Clin Med. 2020, 9, 800. [Google Scholar]
- Friedrich M, Pohin M, Powrie F. Cytokine Networks in the Pathophysiology of Inflammatory Bowel Disease. Immunity. 2019, 50, 992–1006. [Google Scholar] [CrossRef] [PubMed]
- Colombel JF, D'haens G, Lee WJ, Petersson J, Panaccione R. Outcomes and Strategies to Support a Treat-to-target Approach in Inflammatory Bowel Disease: A Systematic Review. J Crohns Colitis. 2020, 14, 254–266. [Google Scholar] [CrossRef] [PubMed] [PubMed Central]
- Nikolaus S, Waetzig GH, Butzin S, et al. Evaluation of interleukin-6 and its soluble receptor components sIL-6R and sgp130 as markers of inflammation in inflammatory bowel diseases. Int J Colorectal Dis. 2018, 33, 927–936. [Google Scholar] [CrossRef] [PubMed]
- Caviglia G, Rosso C, Stalla F, et al. On-Treatment Decrease of Serum Interleukin- 6 as a Predictor of Clinical Response to Biologic Therapy in Patients with Inflammatory Bowel Diseases. J Clin Med. 2020, 9, 800. [Google Scholar] [CrossRef] [PubMed]
- Bourgonje A, von Martels, Gabriëls R, et al. A combined set of four serum inflammatory biomarkers reliably predicts endoscopic disease activity in inflammatory bowel disease. Front Med. 2019, 6, 251.
- Danese S, Vermeire S, Hellstern P, et al Randomised trial and open-label extension study of an anti-interleukin-6 antibody in Crohn’s disease (ANDANTE I and II). Gut 2019, 68, 40–48. [CrossRef]
- Marlow G, van Gent D, Ferguson L. Why interleukin-10 supplementation does not work in Crohn’s disease patients. World J Gastroenterol. 2013, 19, 3931–3941. [Google Scholar] [CrossRef]
- Ansari N, Abdulla J, Zayyani N, Brahmi U, Taha S, Satir AA. Comparison of RANTES expression in Crohn’s disease and ulcerative colitis: an aid in the differential diagnosis? J Clin Pathol. 2006, 59, 1066–1072. [Google Scholar] [CrossRef]
- Krzystek-Korpacka M, Neubauer K, Matusiewicz M, Platelet-derived growth factor-BB reflects clinical, inflammatory and angiogenic disease activity and oxidative stress in inflammatory bowel disease. Clinical Biochemistry 2009, 42, 1602–1609. [CrossRef]
- Słowińska-Solnica K, Pawlica-Gosiewska D, Gawlik K, Owczarek D, Cibor D, Pocztar H, Mach T, Solnica B. Serum Inflammatory markers in the diagnosis and assessment of Crohn’s disease activity. Archives of Medical Science 2021, 17, 252.
- Neubauer K, Matusiewicz M, Bednarz-Misa I, Gorska S, Gamian A, Krzystek- Korpacka M. Diagnostic potential of systemic eosinophil-associated cytokines and growth factors in IBD. Gastroenterol Res Pract. 2018, 2018, 7265812. [Google Scholar]
- Scaioli E, Cardamone C, Scagliarini M, Zagari RM, Bazzoli F, Belluzzi A. Can fecal calprotectin better stratify Crohn’s disease activity index? Ann Gastroenterol. 2015, 28, 247–252. [Google Scholar]
- Casini-Raggi V, Kam L, Chong YJ, Fiocchi C, Pizarro TT, Cominelli F. Mucosal imbalance of IL-1 and IL-1 receptor antagonist in inflammatory bowel disease. A novel mechanism of chronic intestinal inflammation. J Immunol. 1995, 154, 2434–2440. [Google Scholar] [CrossRef]
- Rogler, G. Singh A, Kavanaugh A., Rubin T.D. Extraintestinal manifestations of Inflammatory Bowel Disease: Current Concepts, Treatment and Implications for Disease Treatment. Review in basic and clinical gastroenterology and hepatology 2021, 161, 1118–1132. [Google Scholar]
- Feuerstein J, Cheifetz A. Crohn Disease: Epidemiology, Diagnosis, and Management. Mayo Clinic Proceedings. 2017, 92, 1088–1103. [Google Scholar] [CrossRef]
- Eder P, et al. Association of serum VEGF with clinical response to anti-TNFα therapy for Crohn’s disease. Cytokine 2015, 76, 288–293.
- American Society for Gastrointestinal Endoscopy Standards of Practice Committee. Shergill A, Lightdale J, Bruining D, Acosta R, Chandrasekhara V, Chathadi K, Decker G, Early D, Evans J, Fanelli R, Fisher D, Fonkalsrud L, Foley K, Hwang J, Jue T, Khashab M, Muthusamy V, Pasha S, Saltzman J, Sharaf R, Cash B, DeWitt J. The role of endoscopy in inflammatory bowel disease. Gastrointest Endosc. 2015, 81, 1101–1121. [Google Scholar]
- Jess T, Gamborg M, Matzen P et al. Increased risk of intestinal cancer in Crohn’s disease: a meta-analysis of population-based cohort studies. Am. J. Gastroenterol. 2005, 100, 2724–2729. [Google Scholar] [CrossRef]
- Keller D, Windsor A, Cohen R et al. Colorectal cancer in inflammatory bowel disease: review of the evidence. Tech Coloproctol 2019, 23, 3–13. [Google Scholar] [CrossRef]
- Carmine, Stolfi; et al. Role of TGF-Beta and Smad7 in Gut Inflammation, Fibrosis and Cancer. Biomolecules. 2021, 11, 17. [Google Scholar]
- Cotton J, Platnich J, Muruve D, Jijon H, Buret A, Beck P. Interleukin-8 in gastrointestinal inflammation and malignancy: induction and clinical consequences. International Journal of Interferon, Cytokine and Mediator Research 2016, 8, 13–34. [Google Scholar]
Figure 1.
Comparison of cytokine concentration distributions of 17 patients with complete data (including MRE) versus Group S (the total group of 24 patients).The study was approved by the Bioethics Committee of the Medical University of Silesia (Resolution No. PCN/0022/KB1/98/I/18/19 of 12th November 2019).
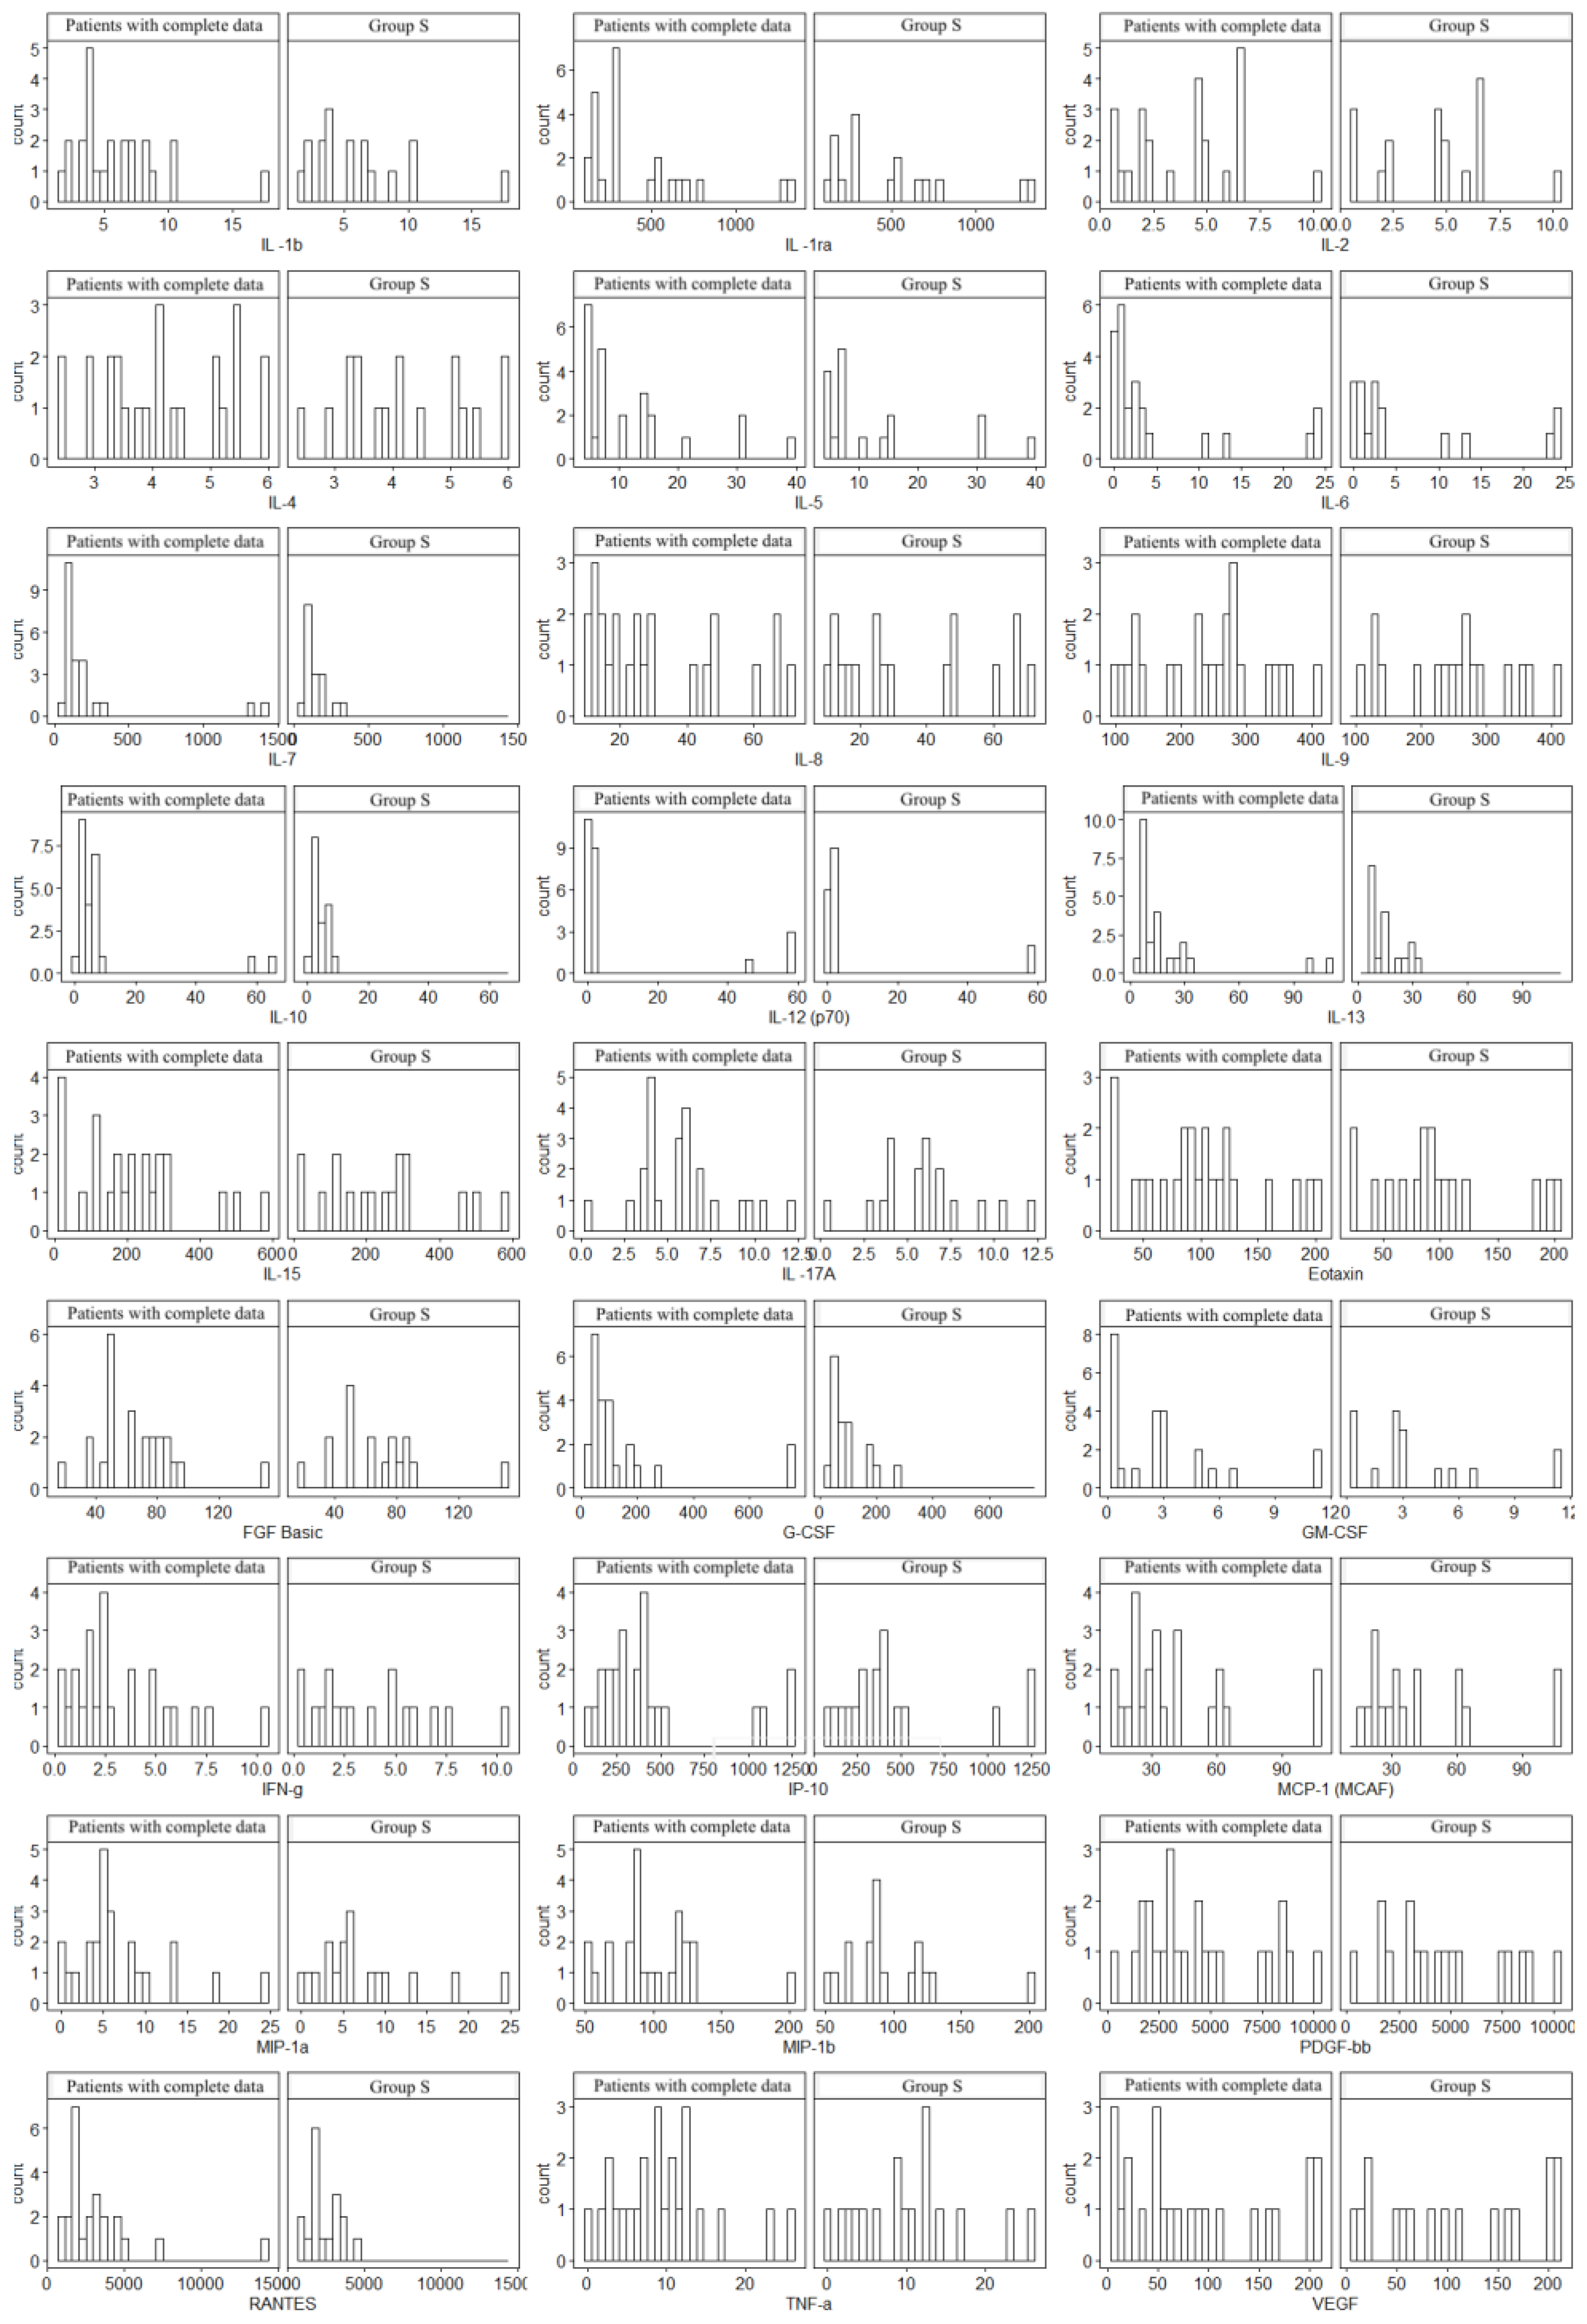
Figure 2.
Correlation values of the cytokines and IL-1RA in the control and study groups.The data are presented as a heat map with hierarchical grouping. The figure shows only statistically significant correlations at p<0.05. The numbers inside the fields represent Spearman’s correlation coefficients.
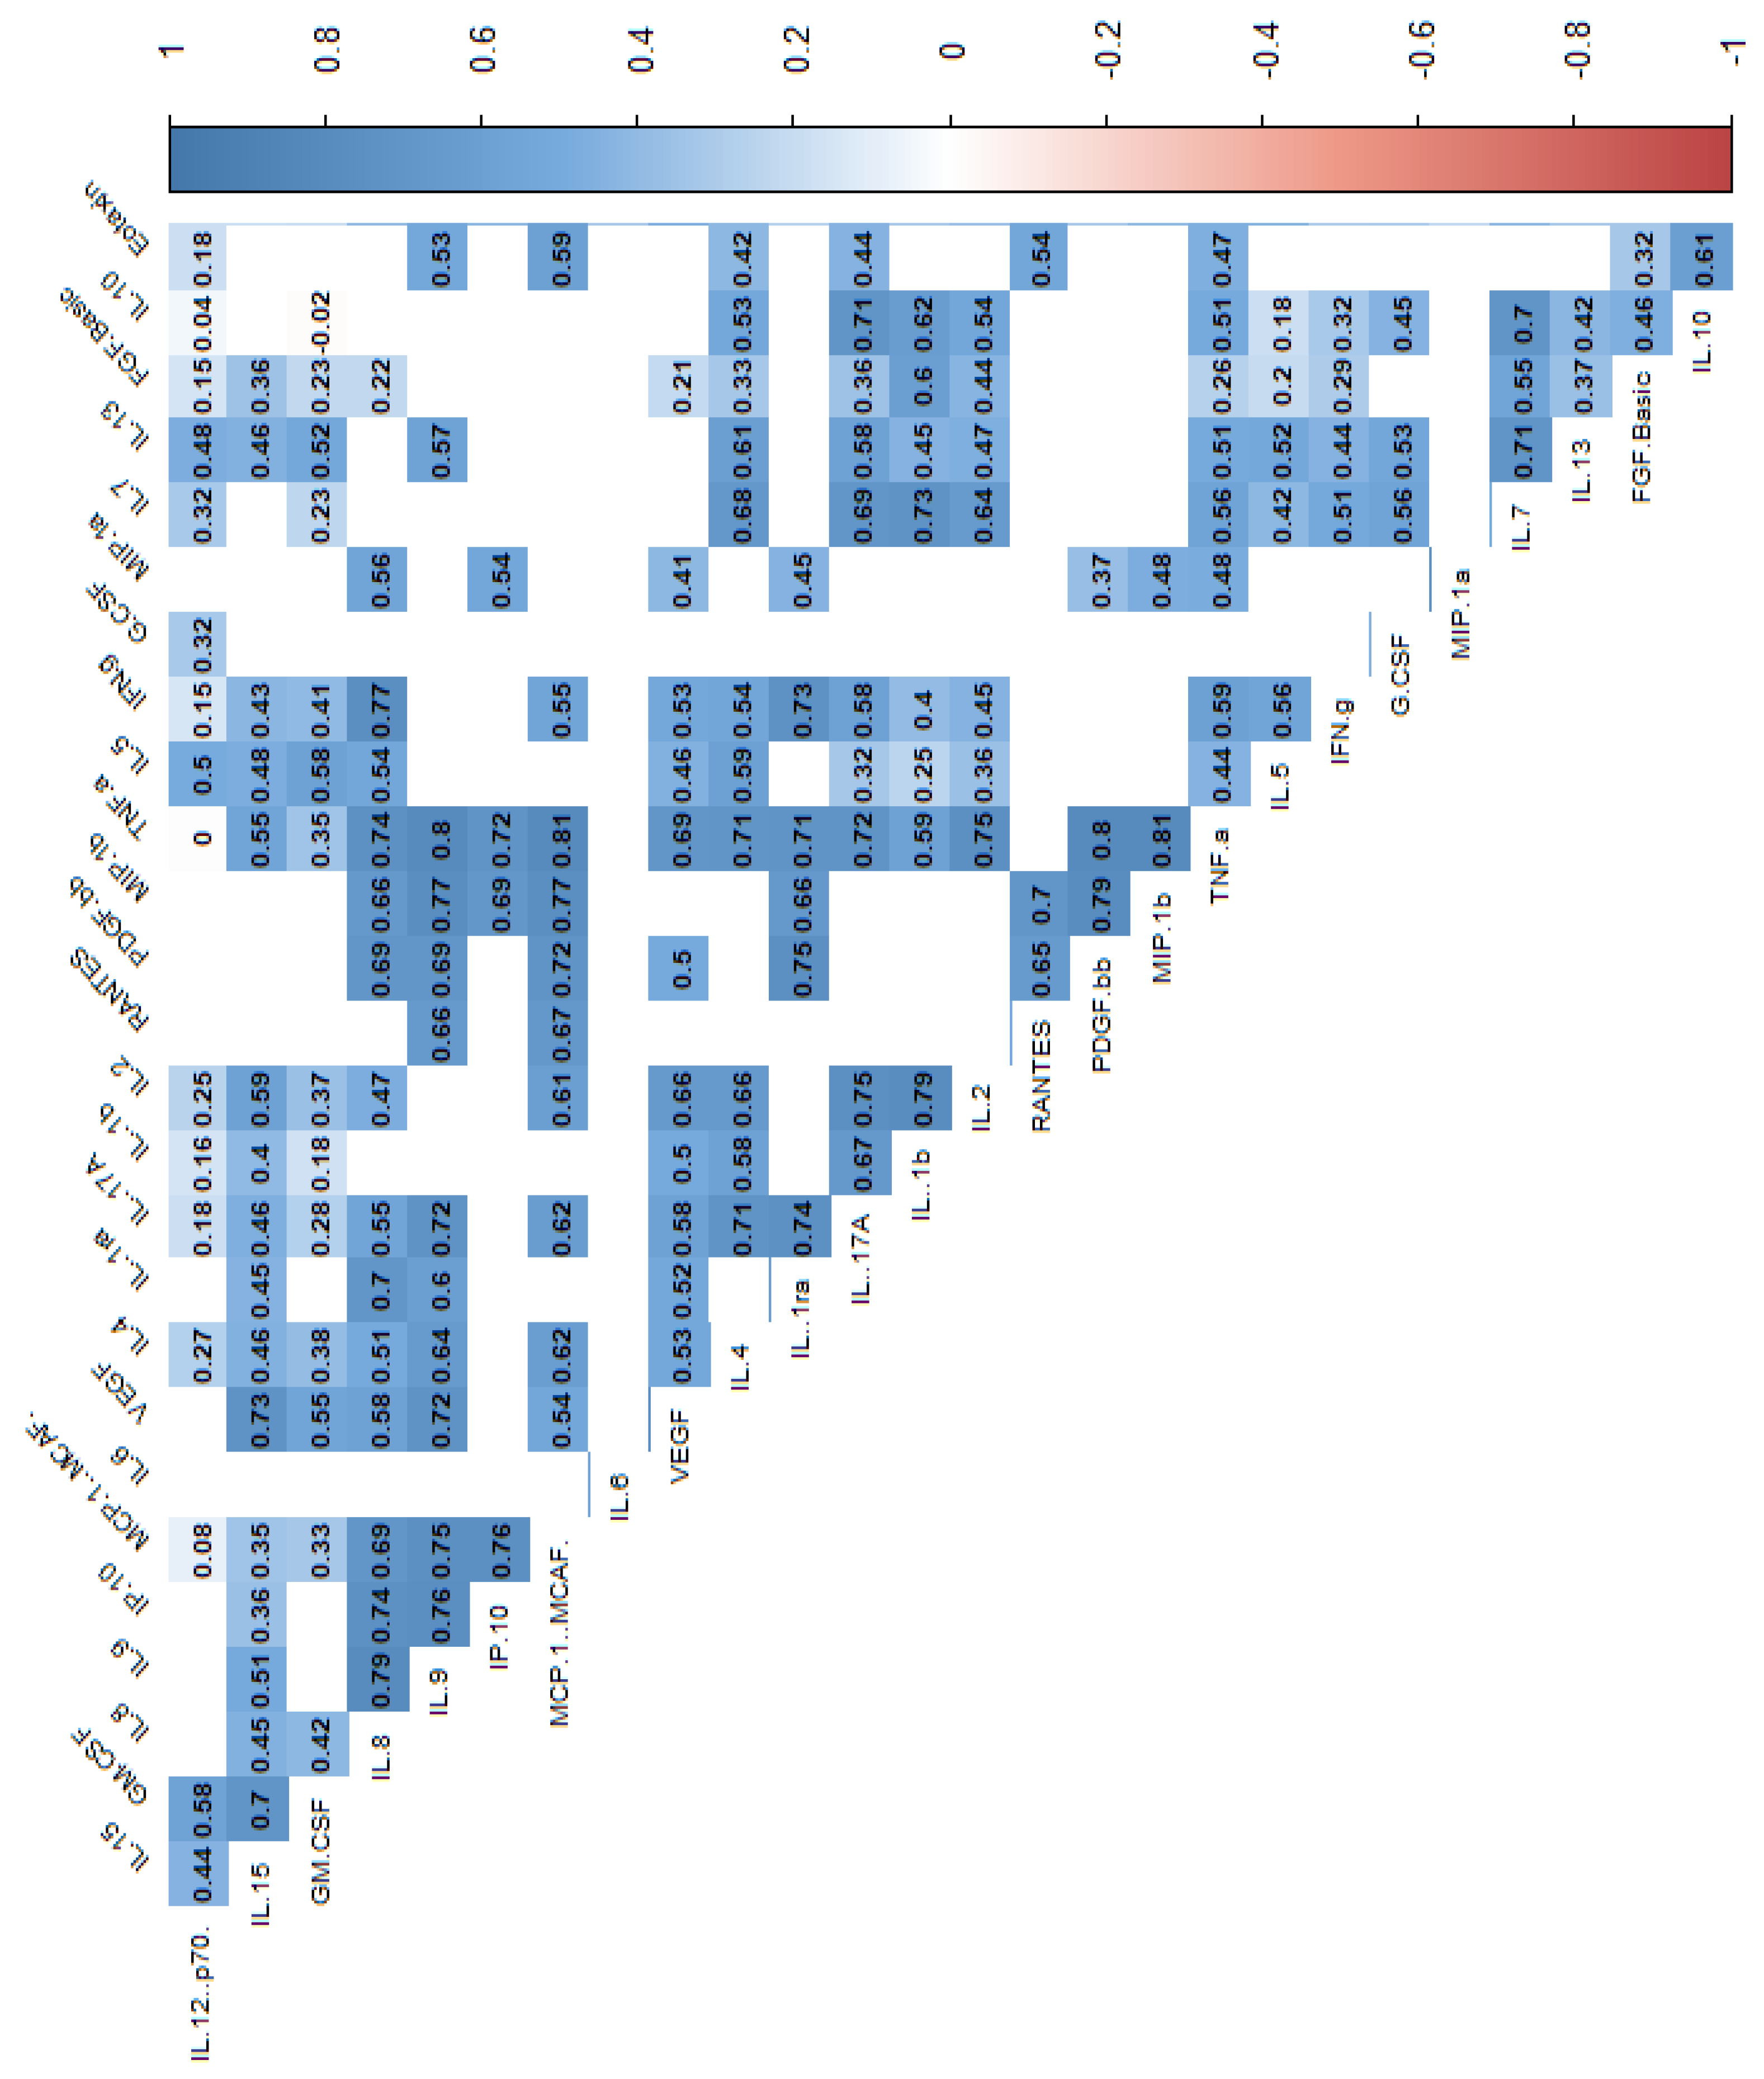
Figure 3.
Correlation values of the cytokines and IL-1RA in the study group.The data are presented as a heat map with hierarchical grouping. The figure shows only statistically significant correlations at p<0.05. The numbers inside the fields represent Spearman’s correlation coefficients.
Figure 3.
Correlation values of the cytokines and IL-1RA in the study group.The data are presented as a heat map with hierarchical grouping. The figure shows only statistically significant correlations at p<0.05. The numbers inside the fields represent Spearman’s correlation coefficients.
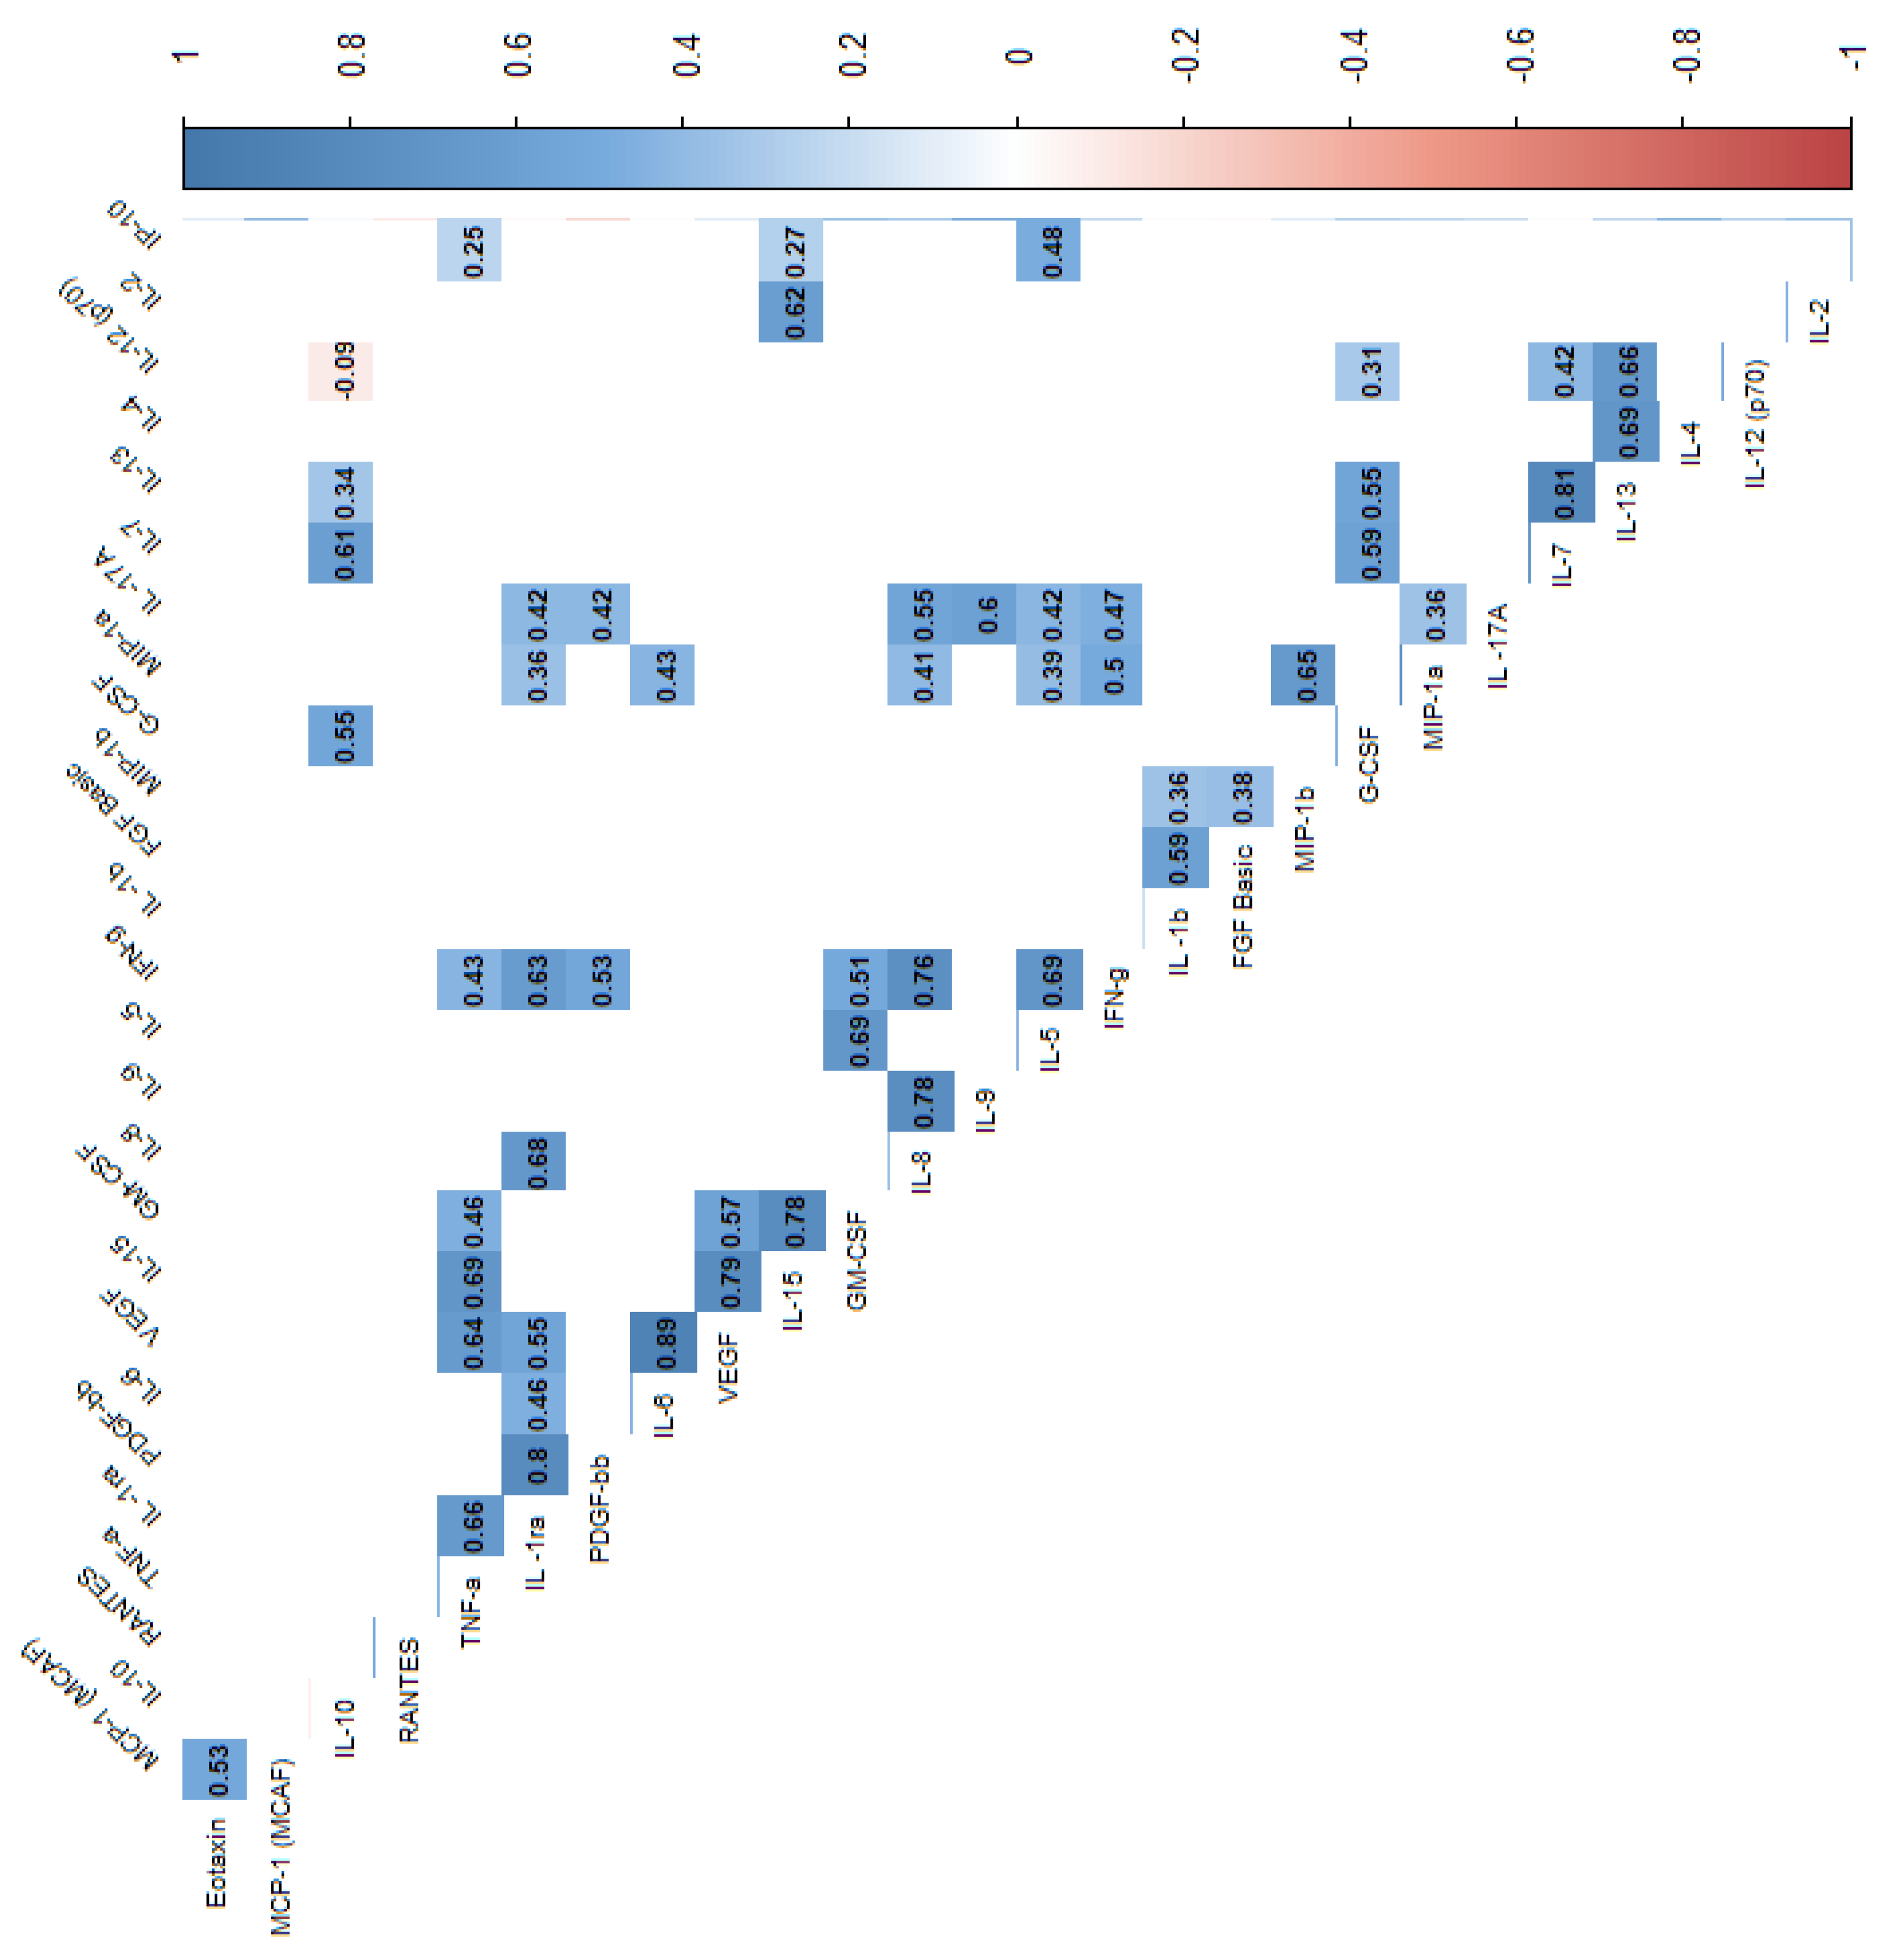
Figure 4.
Correlation values of the cytokines and IL-1RA in the control group The data are presented as a heat map with hierarchical grouping. The figure shows only statistically significant correlations at p<0.05. The numbers inside the fields represent Spearman’s correlation coefficients.
Figure 4.
Correlation values of the cytokines and IL-1RA in the control group The data are presented as a heat map with hierarchical grouping. The figure shows only statistically significant correlations at p<0.05. The numbers inside the fields represent Spearman’s correlation coefficients.
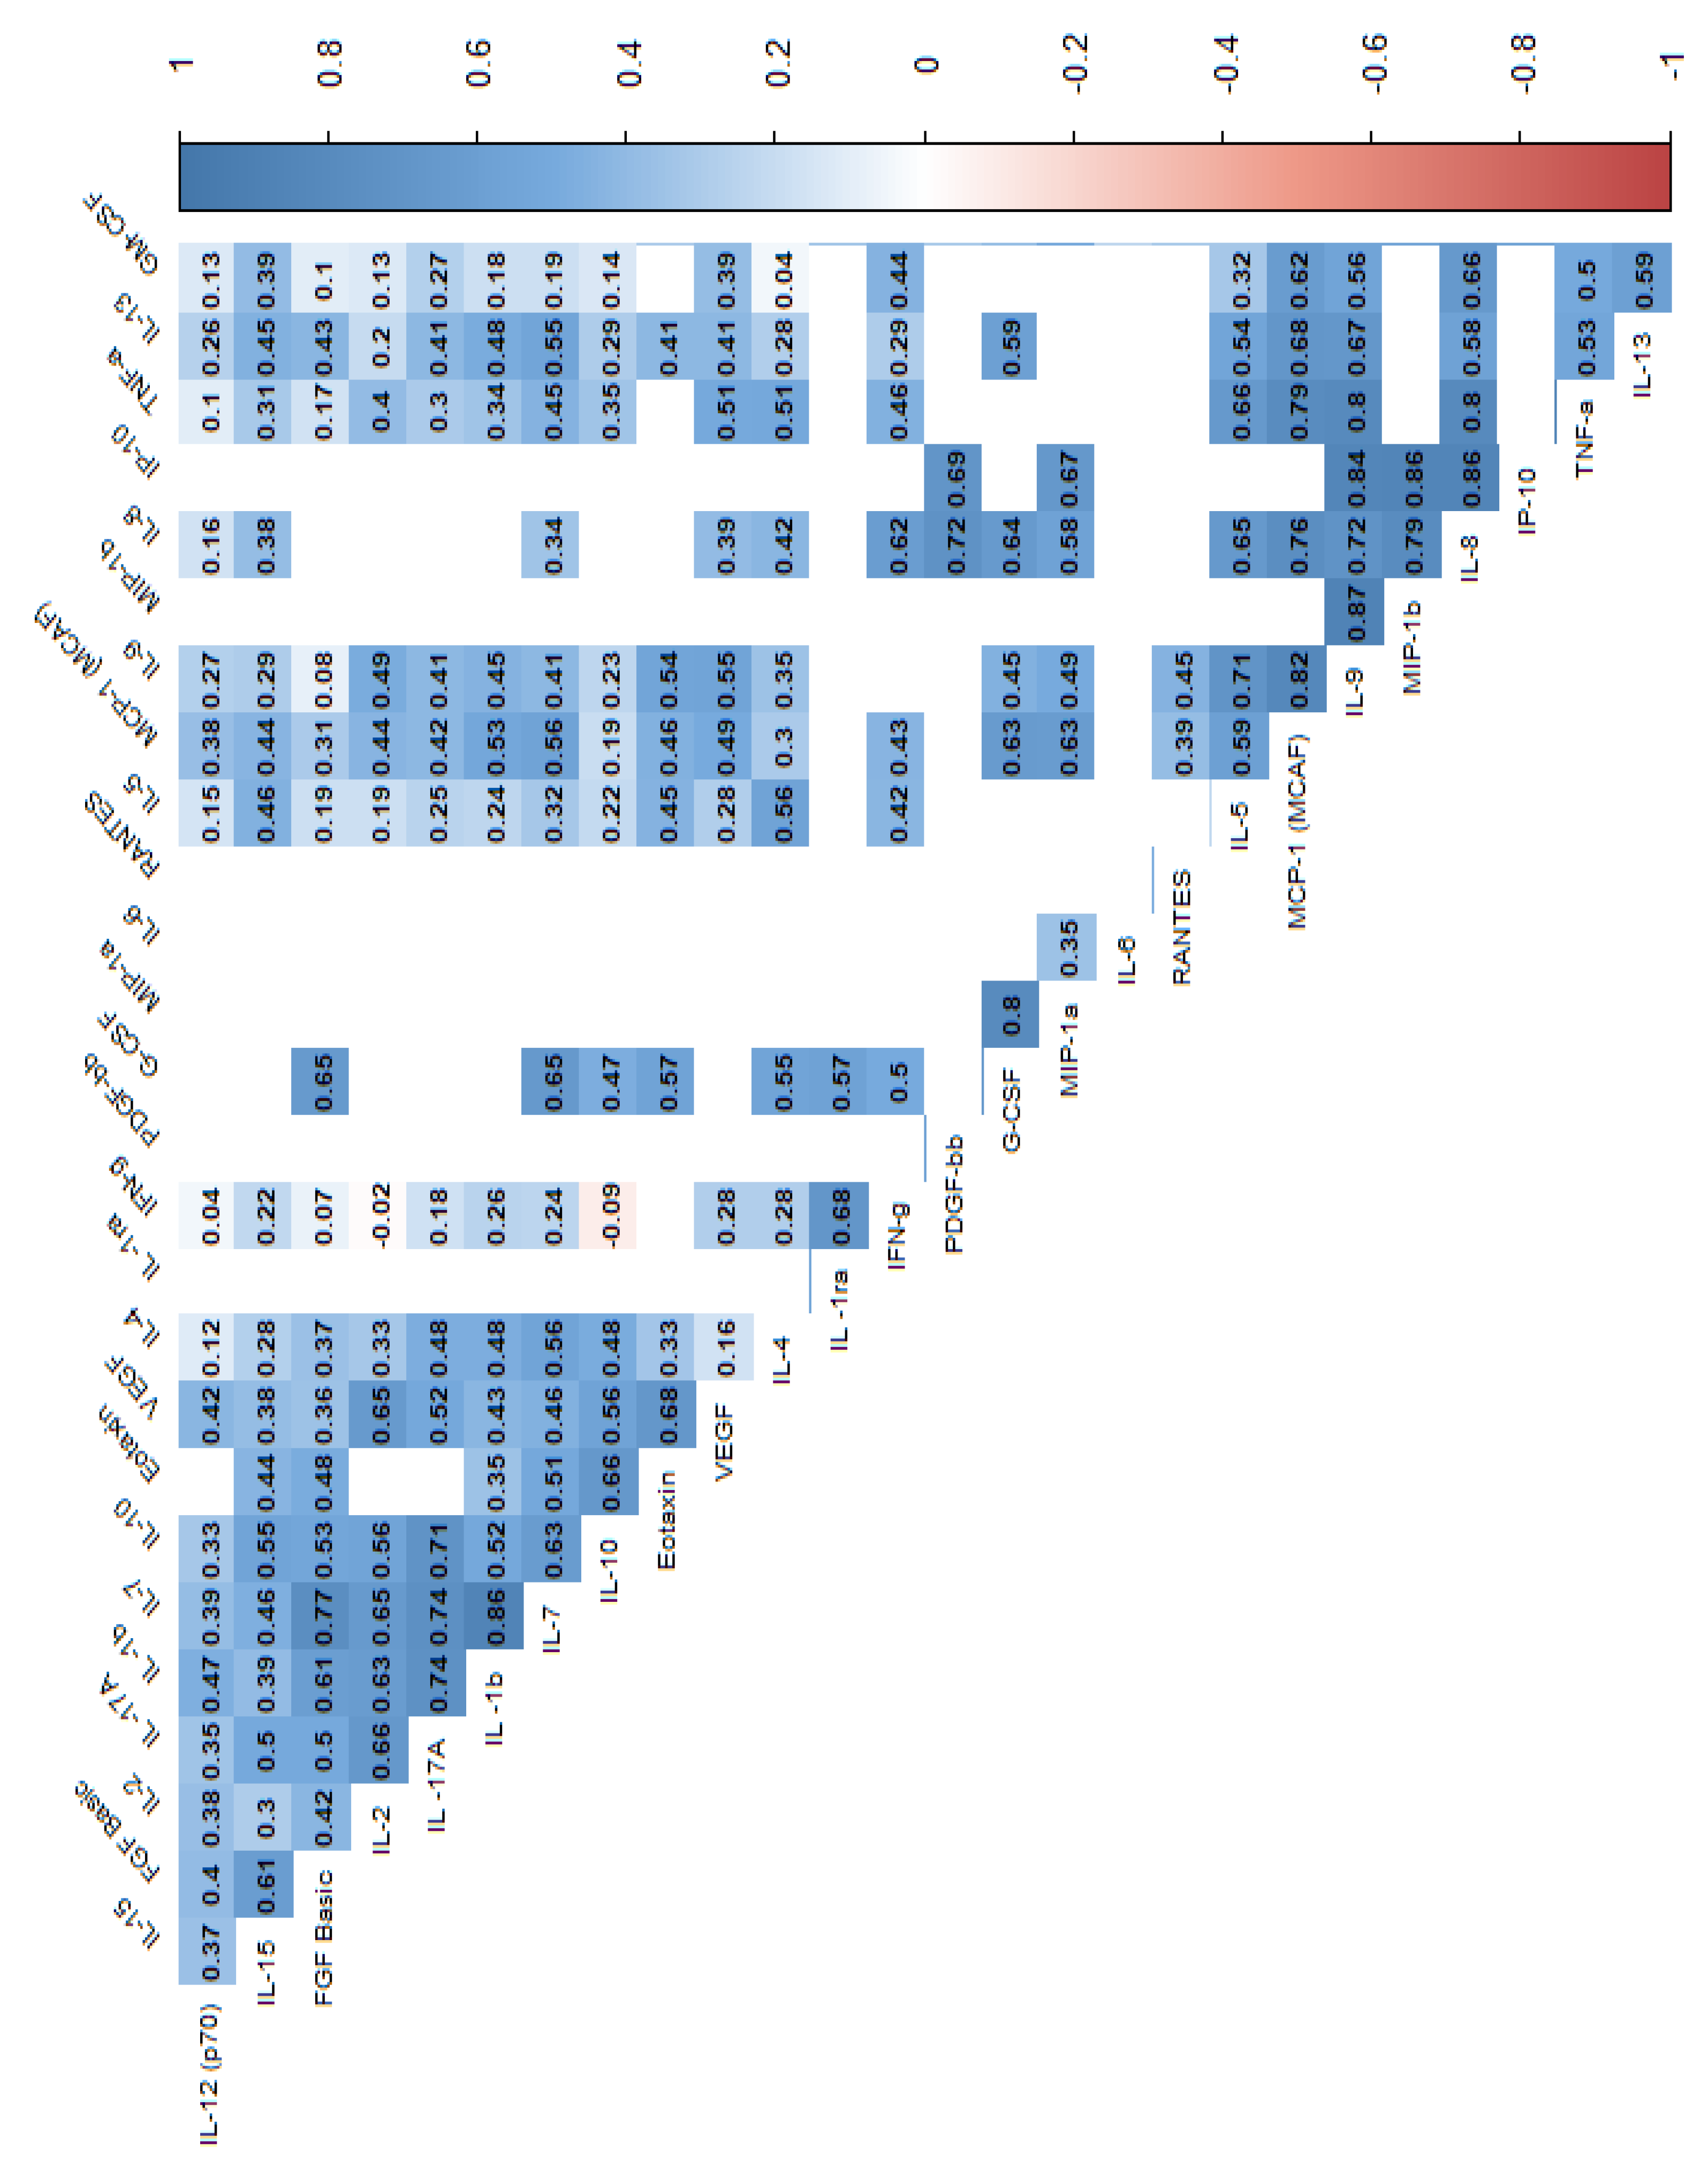
Figure 5.
Significant correlations between radiological parameters and the CDAI and the cytokines. R – Spearman’s correlation coefficient, p - p-value (test probability).
Figure 5.
Significant correlations between radiological parameters and the CDAI and the cytokines. R – Spearman’s correlation coefficient, p - p-value (test probability).
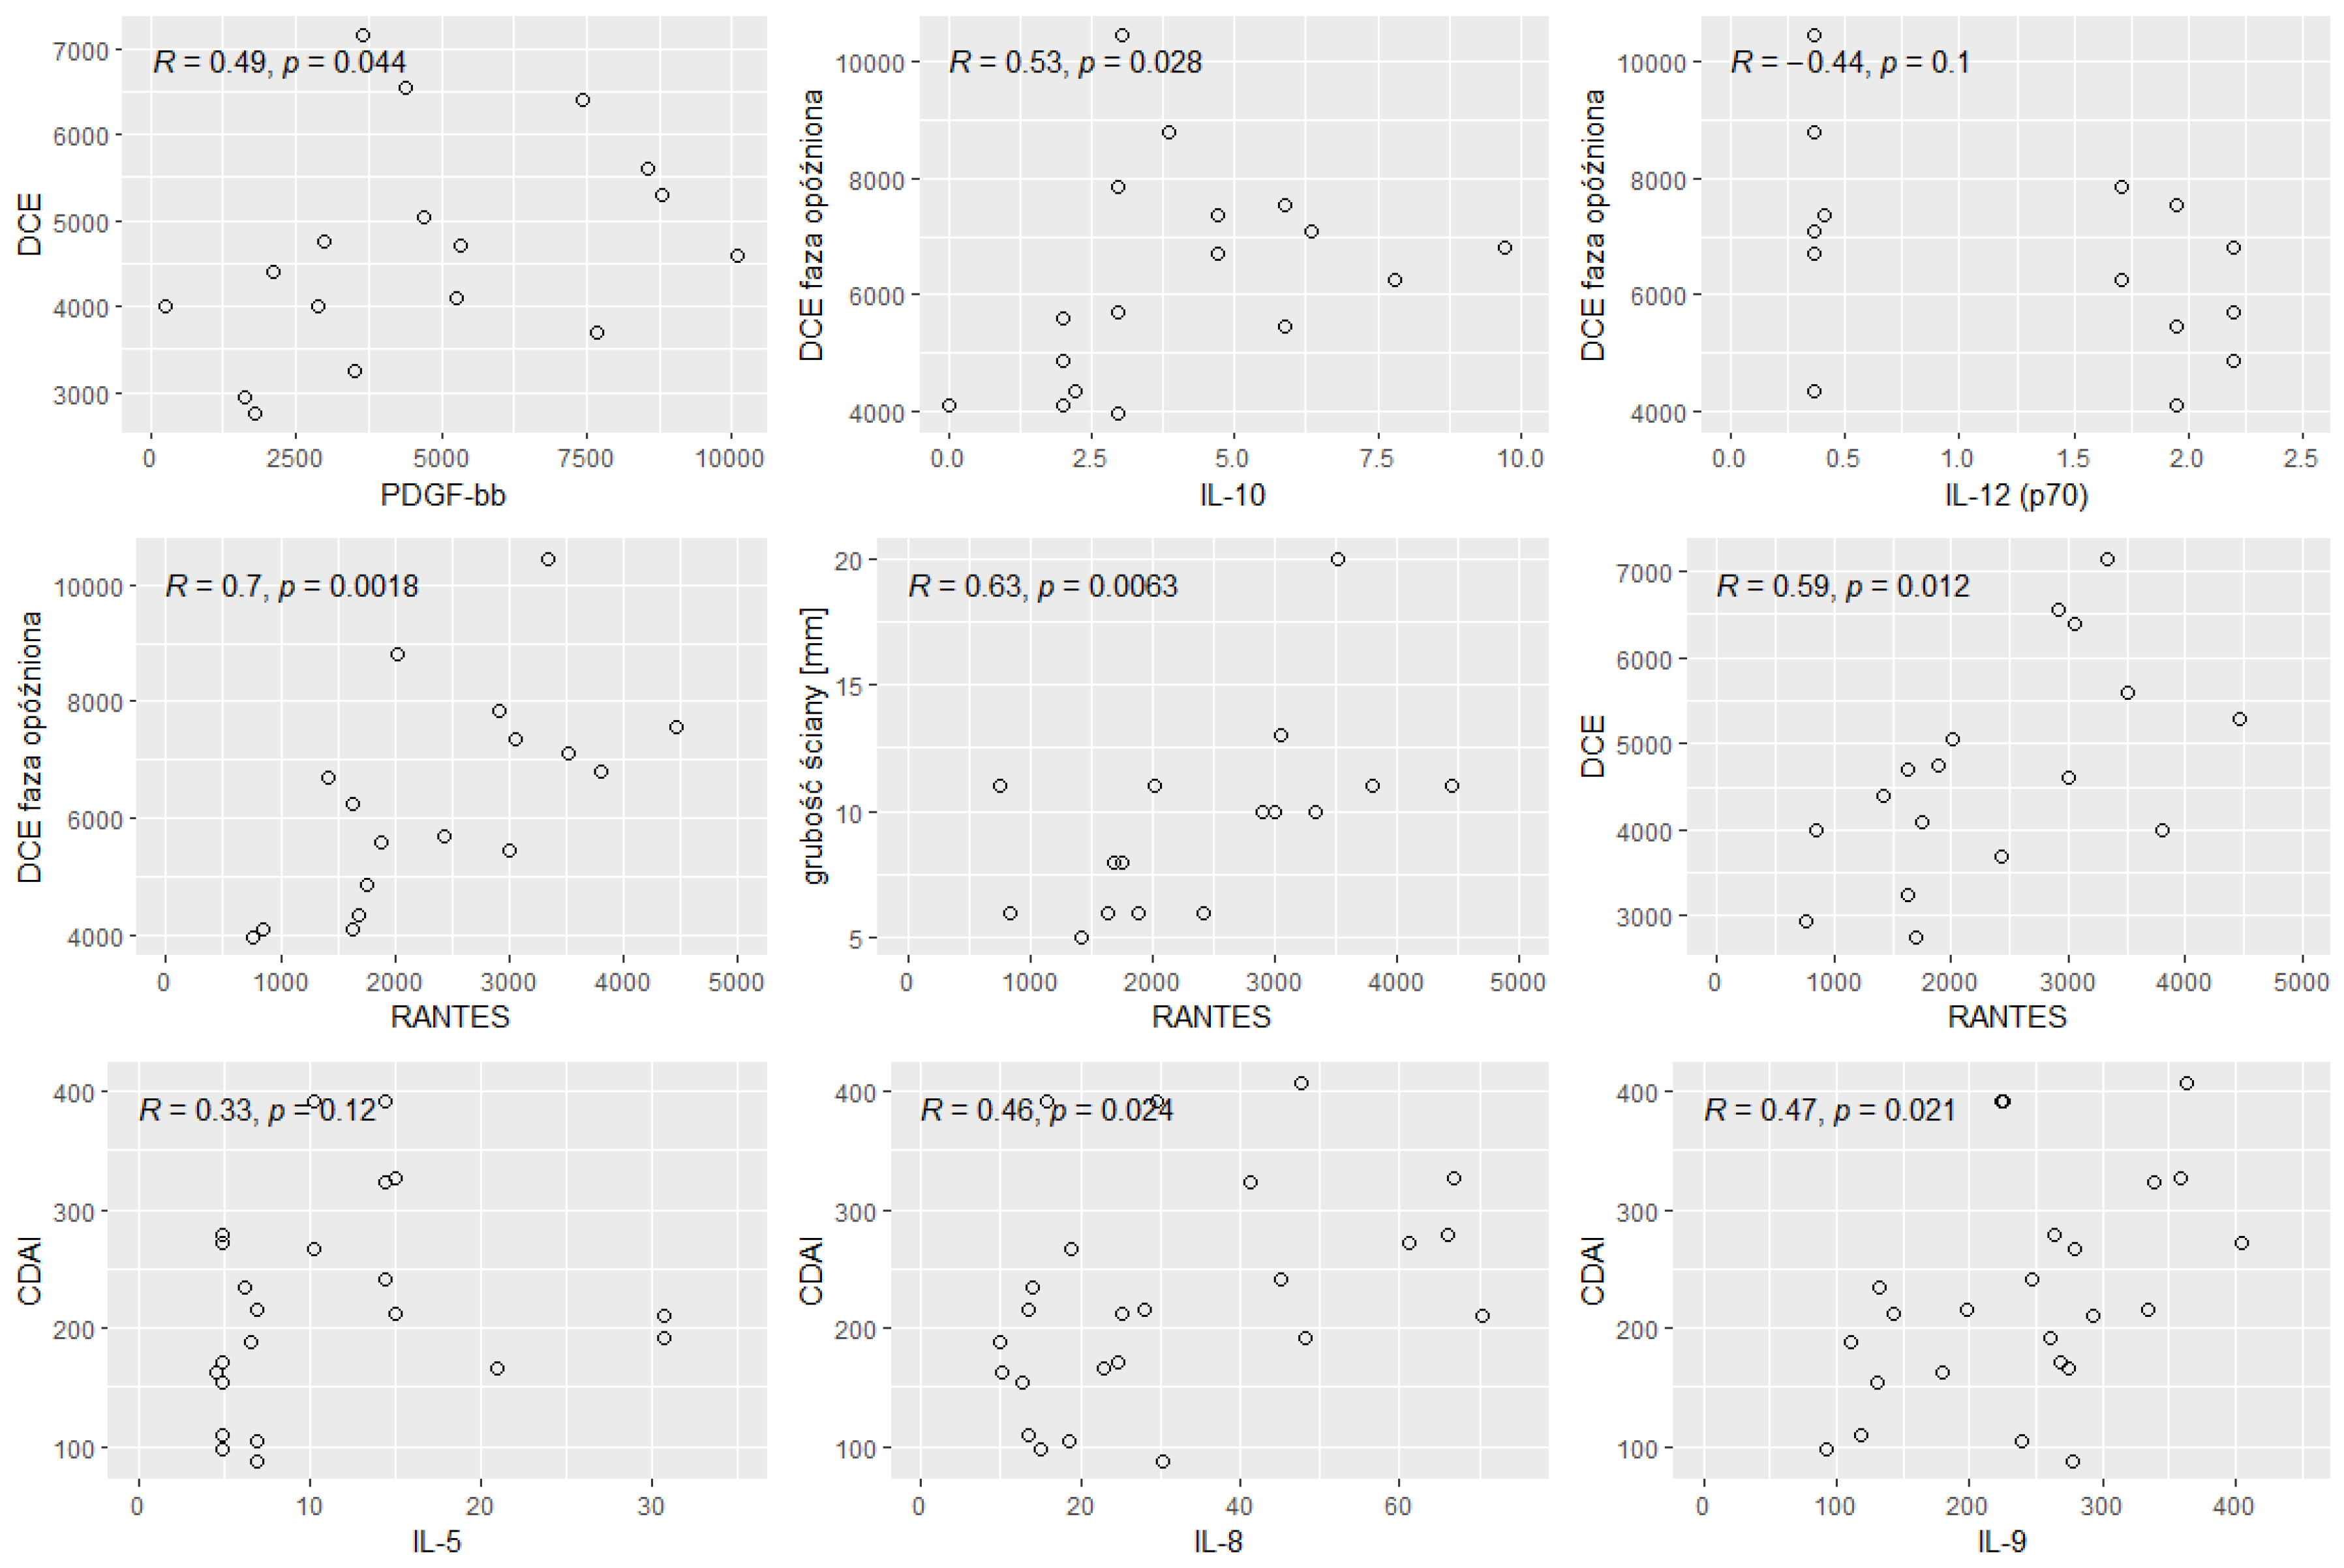
Figure 6.
Significant correlations between the cytokines and radiological parameters and the level of calprotectin. R- Spearman’s correlation coefficient, p - p-value (test probability).
Figure 6.
Significant correlations between the cytokines and radiological parameters and the level of calprotectin. R- Spearman’s correlation coefficient, p - p-value (test probability).
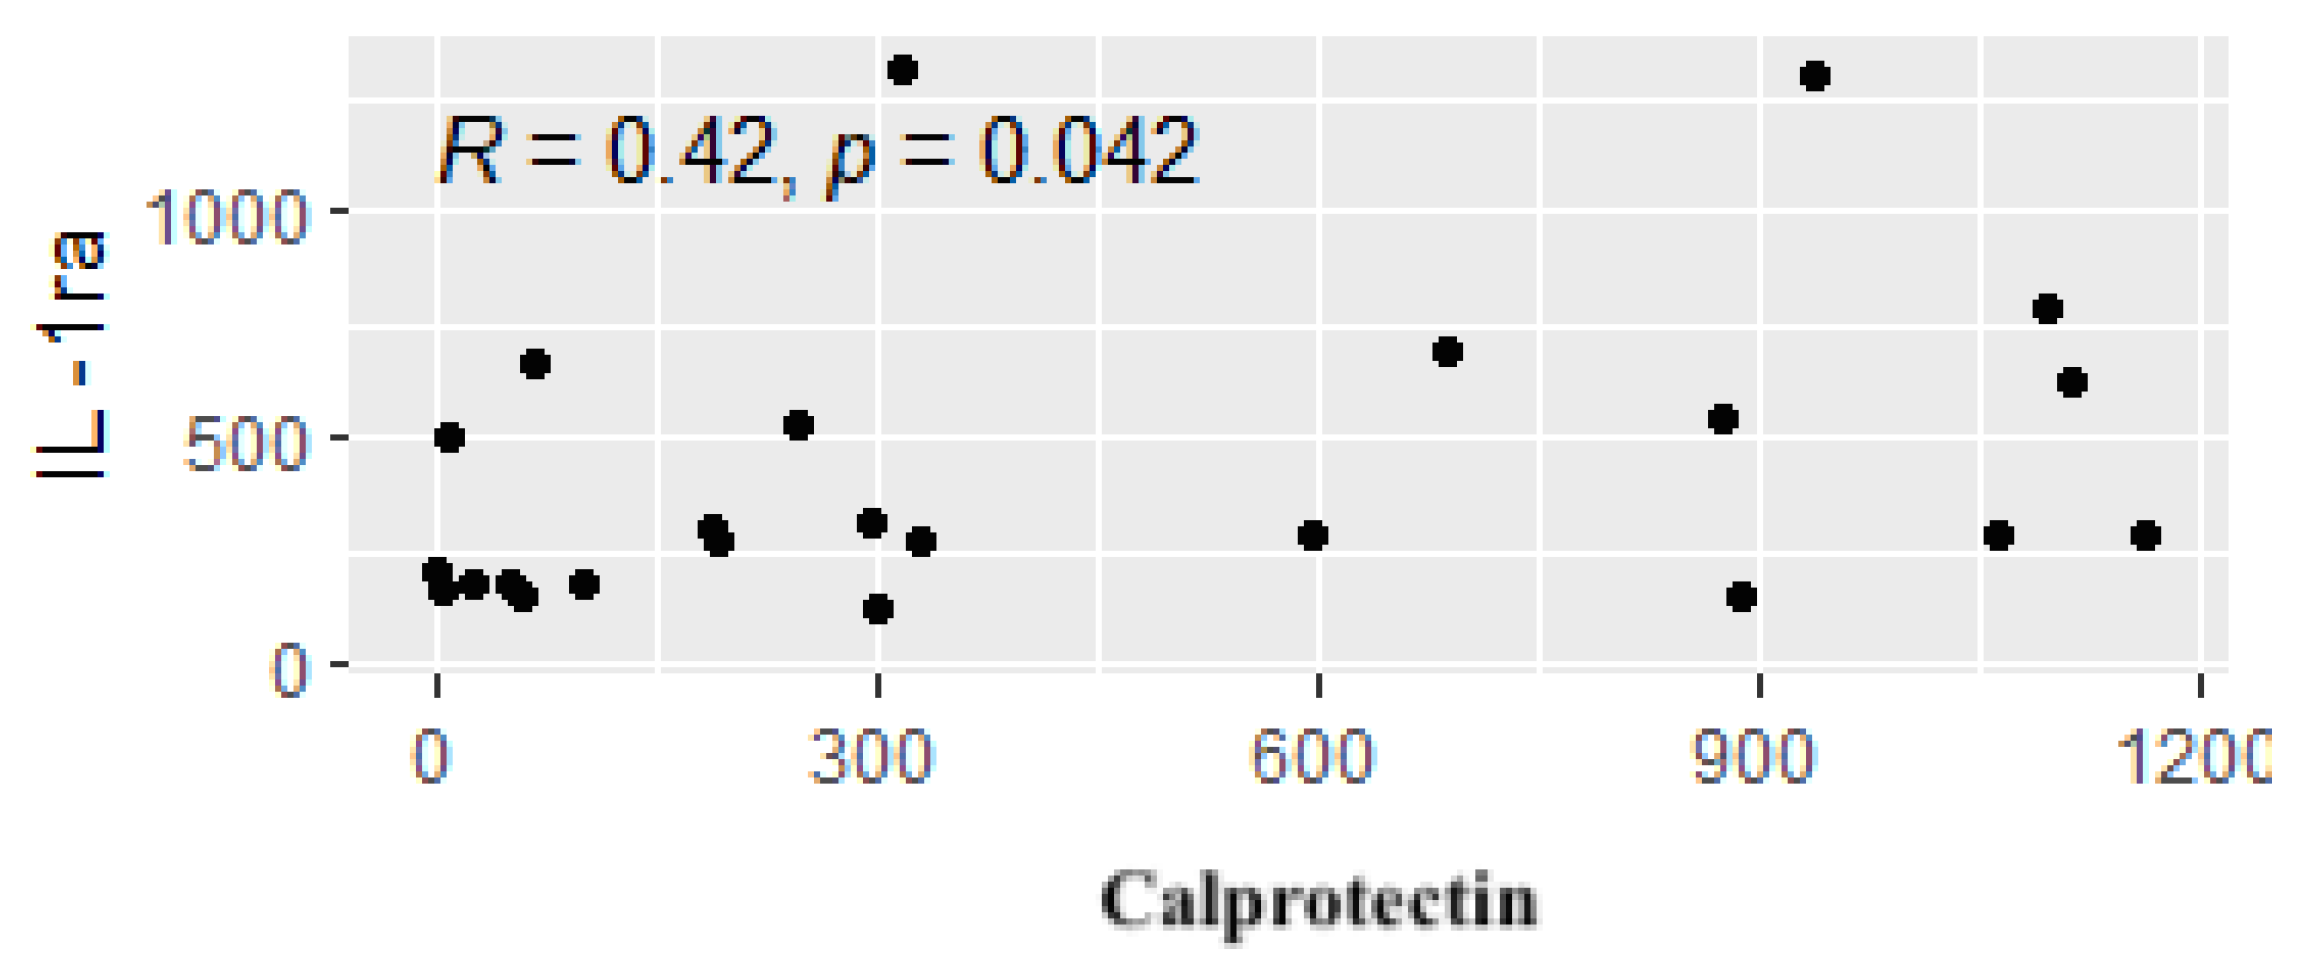
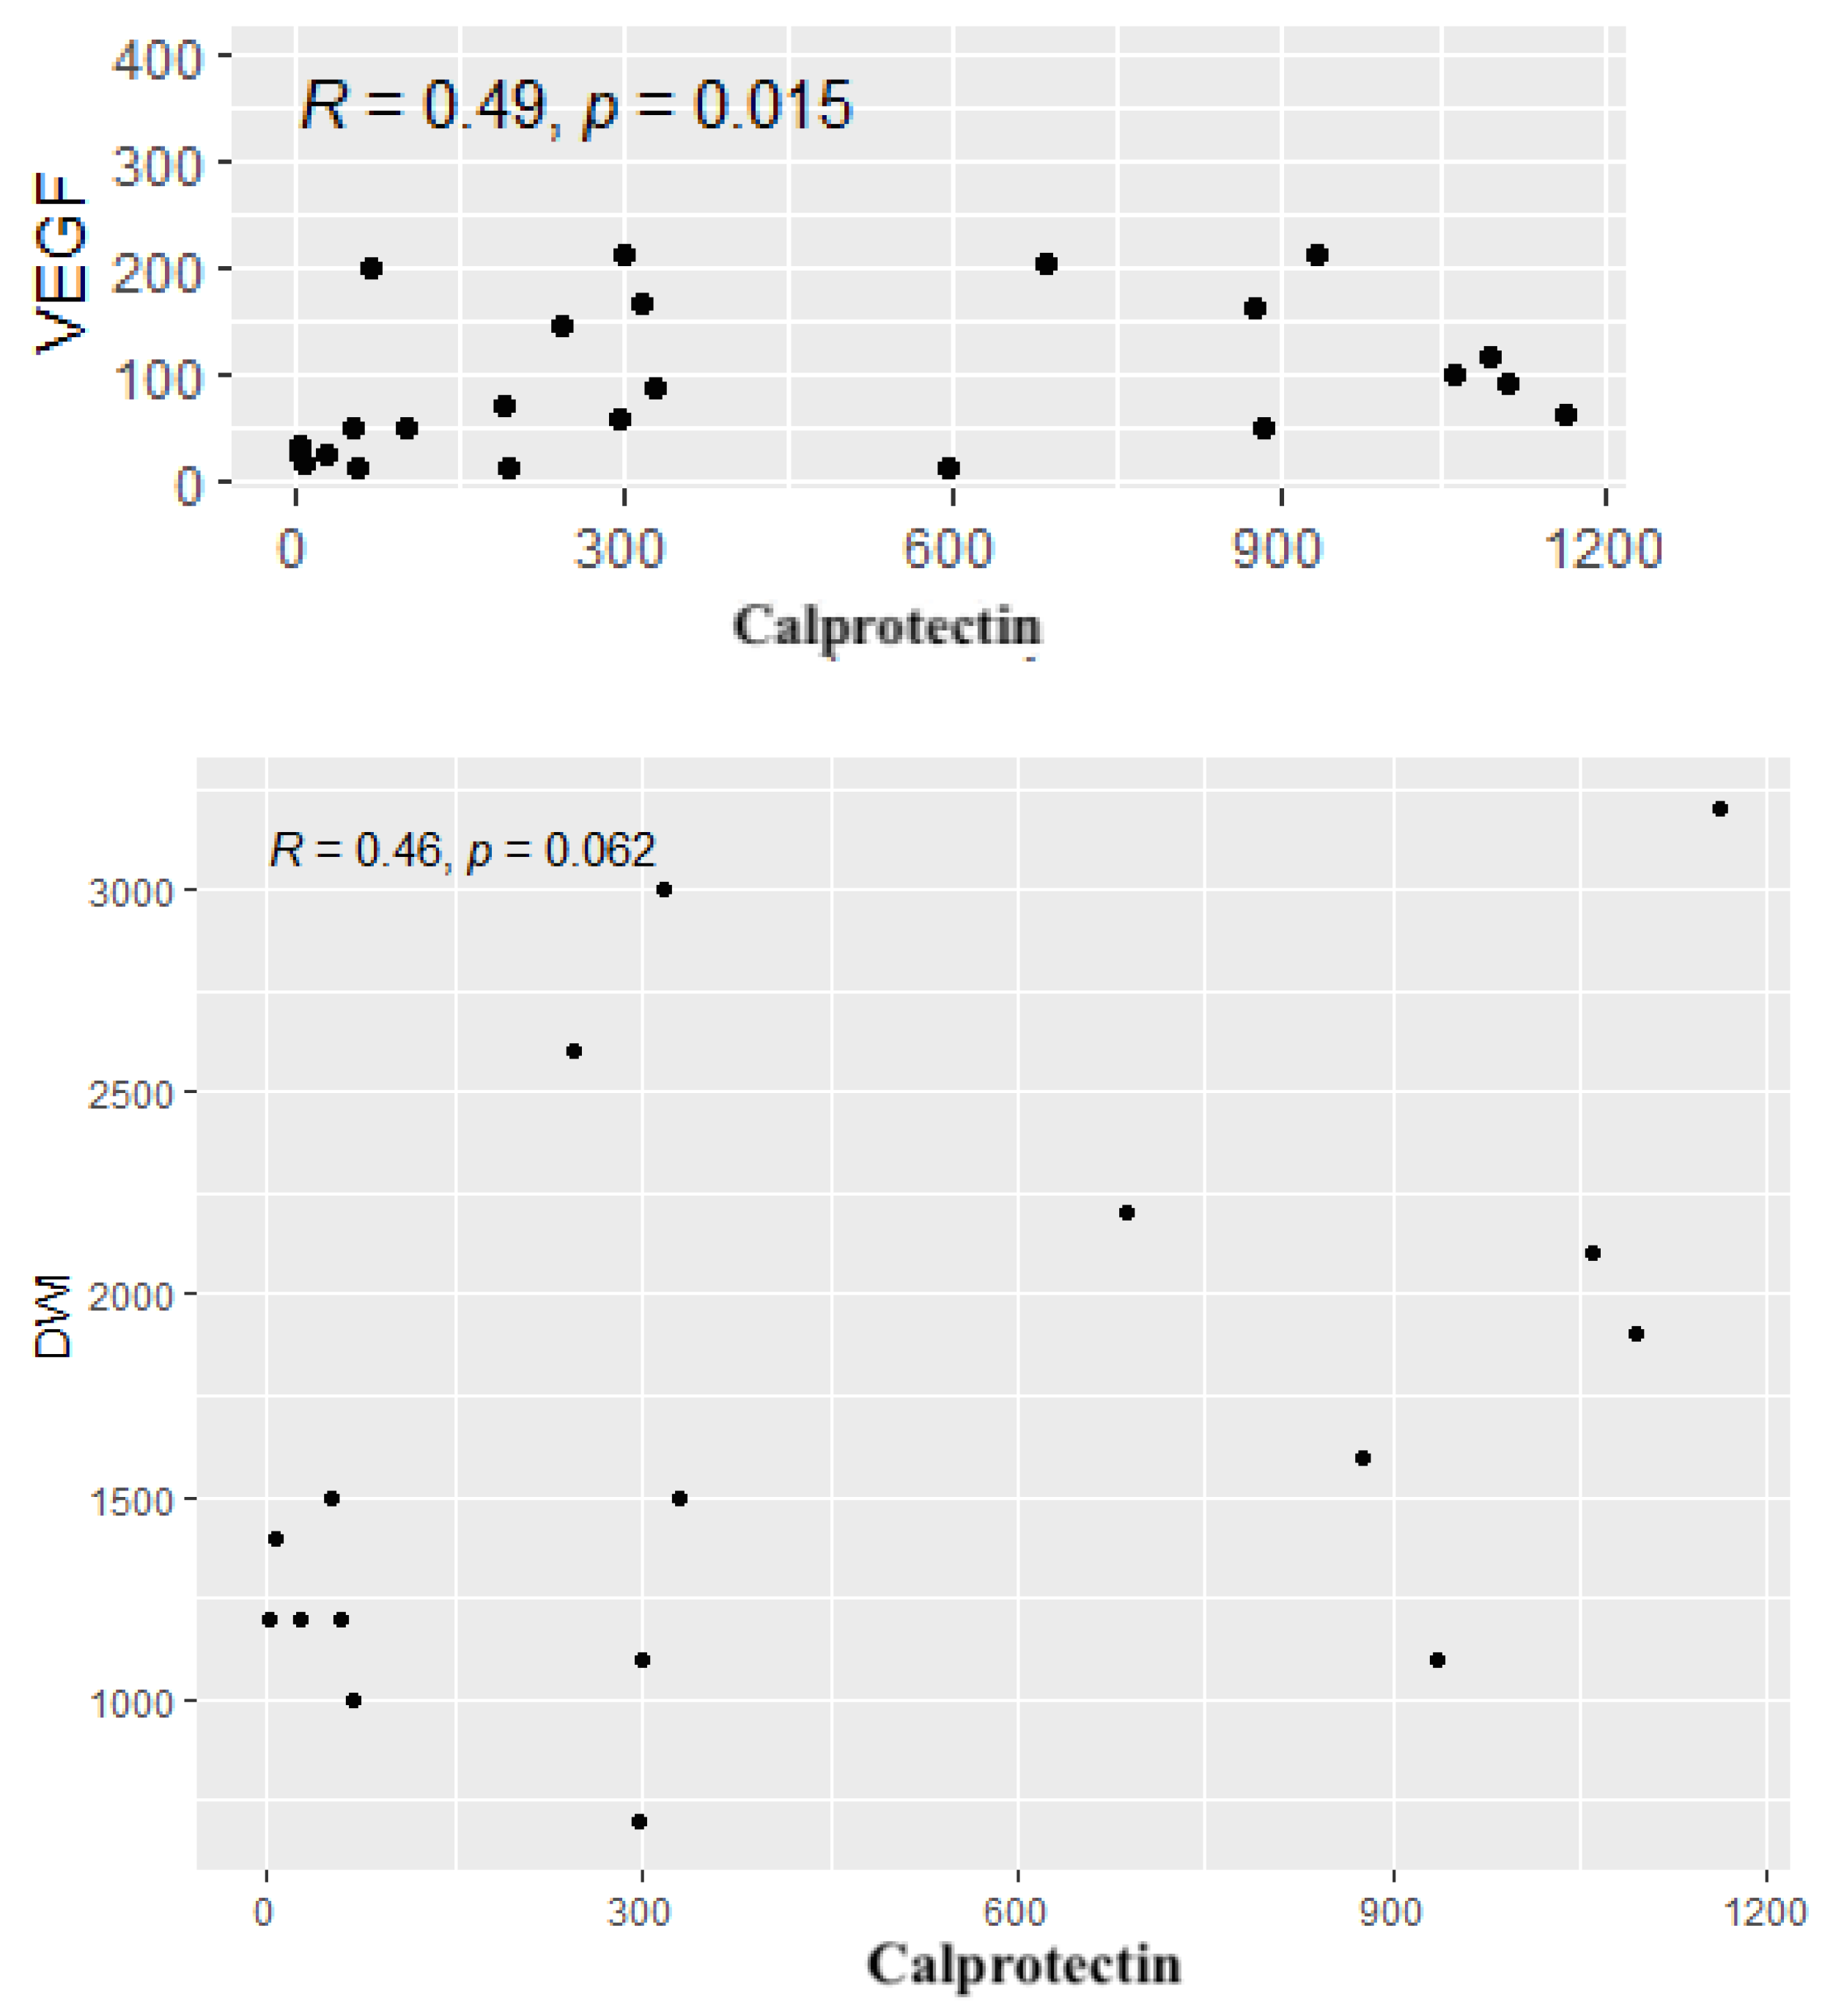

Table 1.
Clinical characteristics and the basic laboratory findings of the study group.
| Variable | N | min | max | median | q1 | q3 | mean | SD | SE |
|---|---|---|---|---|---|---|---|---|---|
| Age (years) | 24 | 22 | 78 | 43.5 | 31.5 | 57.8 | 45 | 15.8 | 3.23 |
| BMI (kg/m²) | 24 | 13.5 | 32 | 21.8 | 19.5 | 24.1 | 22.1 | 4.27 | 0.871 |
| Height (m) | 24 | 1.57 | 1.94 | 1.7 | 1.63 | 1.76 | 1.7 | 0.099 | 0.02 |
|
Body weight (kg/m²) |
24 | 35 | 107 | 62 | 56.8 | 71.8 | 66 | 16.3 | 3.32 |
| CDAI | 24 | 88 | 408 | 214 | 165 | 274 | 226 | 92.5 | 18.9 |
| WBC | 24 | 3.65 | 25.1 | 7.04 | 4.96 | 9.66 | 8.06 | 5.02 | 1.02 |
| Hematocrit | 24 | 25.7 | 47.4 | 36 | 30.5 | 40.5 | 35.6 | 6.12 | 1.25 |
| ESR | 18 | 5 | 71 | 16 | 11.2 | 27.2 | 21.5 | 17.1 | 4.04 |
| CRP | 24 | 1 | 195 | 22.7 | 7.48 | 76.6 | 48.7 | 53.7 | 11 |
SD - standard deviation; SE- standard error; q1- first quartile, q3 - third quartile.
Table 2.
Calprotectin concentrations in the study group.
| Variable | n | min | max | median | q1 | q3 | mean | SD | SE |
|---|---|---|---|---|---|---|---|---|---|
| Calprotectin (μg/g) | 24 | 1.57 | 1162 | 299 | 65.9 | 878 | 442 | 418 | 85.4 |
Table 3.
The presence of pANCA and cANCA antibodies in the study group.
| pANCA | Negative | 17 | 70.80% |
| Positive | 6 | 20.80% | |
| No data | 2 | 8.33% | |
| cANCA | Negative | 22 | 91.70% |
| Positive | 0 | 0.00% | |
| No data | 2 | 8.33% |
Table 4.
General characteristics of the control group.
| Variable | n | min | max | median | q1 | q3 | mean | SD | SE |
|---|---|---|---|---|---|---|---|---|---|
| Age (years) | 23 | 50 | 85 | 64 | 59.5 | 71.5 | 65.4 | 9.98 | 2.08 |
| BMI (kg/m2) | 23 | 20.1 | 44.1 | 24.3 | 23.4 | 27.6 | 26 | 4.85 | 1.01 |
| Height (m) | 23 | 1.52 | 1.83 | 1.67 | 1.62 | 1.72 | 1.67 | 0.077 | 0.016 |
| Body weight (kg) | 23 | 50 | 120 | 71 | 63.5 | 79 | 72.3 | 14.2 | 2.96 |
| Hematocrit | 23 | 29.9 | 45.8 | 41.8 | 40.1 | 43.7 | 41.4 | 3.48 | 0.726 |
| WBC | 23 | 3.56 | 10.8 | 7.32 | 5.42 | 8.3 | 6.94 | 1.84 | 0.383 |
SD - standard deviation; SE- standard error; q1- first quartile, q3 - third quartile.
Table 5.
Comparison of the basic parameters of the study and control groups.
| Variable | Study group (n=24) | Control group (n=23) | p | ||||
|---|---|---|---|---|---|---|---|
| Median | Q1 | Q3 | median | Q1 | Q3 | ||
| Age (years) | 43.50 | 31.00 | 58.50 | 64.00 | 59.00 | 72.00 | 0.00 |
| Height (m) | 1.70 | 1.63 | 1.77 | 1.67. | 1.61 | 1.72 | 0.42 |
| Body weight (kg) | 62.00 | 56.50 | 72.50 | 71.00 | 63.00 | 79.00 | 0.08 |
| BMI (kg/m2) | 21.85 | 19.42 | 24.20 | 24.30 | 23.26 | 27.89 | 0.00 |
| WBC | 7.04 | 4.84 | 9.67 | 7.32 | 5.38 | 8.36 | 0.99 |
| Hematocrit | 36.05 | 30.35 | 40.50 | 41.80 | 39.70 | 43.70 | 0.00 |
Table 6.
Comparison of interleukin concentrations in the study Group (S) and the Group (C).
| Variable | Group S | Group C | p | ||||
|---|---|---|---|---|---|---|---|
| median | Q1 | Q3 | median | Q1 | Q3 | ||
| IL-1β | 5.19 | 3.84 | 7.55 | 2.18 | 1.06 | 3.84 | 0.00 |
| IL -1RA | 284.59 | 180.45 | 583.97 | 123.75 | 36.21 | 162.93 | 0.00 |
| IL-2 | 4.52 | 1.96 | 6.19 | 0.62 | 0.56 | 0.68 | 0.00 |
| IL-4 | 4.12 | 3.28 | 5.16 | 2.92 | 2.44 | 3.35 | 0.00 |
| IL-5 | 6.86 | 4.92 | 14.70 | 5.61 | 4.98 | 6.86 | 0.26 |
| IL-6 | 1.48 | 0.82 | 3.75 | 0.18 | 0.18 | 0.20 | 0.00 |
| IL-7 | 124.25 | 92.72 | 181.64 | 72.30 | 46.62 | 151.49 | 0.01 |
| IL-8 | 25.00 | 14.53 | 46.35 | 2.82 | 0.07 | 20.46 | 0.00 |
| IL-9 | 254.19 | 161.49 | 286.77 | 109.76 | 63.56 | 147.18 | 0.00 |
| IL-10 | 4.28 | 2.96 | 6.34 | 1.01 | 0.02 | 4.42 | 0.00 |
| IL-12 (p70) | 1.71 | 0.36 | 2.20 | 1.71 | 1.71 | 1.95 | 0.52 |
| IL-13 | 11.47 | 7.97 | 23.99 | 8.40 | 4.60 | 10.89 | 0.03 |
| IL-15 | 198.06 | 110.02 | 283.01 | 123.78 | 110.02 | 130.65 | 0.08 |
| IL-17A | 5.54 | 3.96 | 6.90 | 0.55 | 0.55 | 2.92 | 0.00 |
Cytokine concentrations are expressed in pg/ml.
Table 7.
Comparison of the concentrations of other cytokines in Group S and Group C.
| Variable | Group S | Group C | p | ||||
|---|---|---|---|---|---|---|---|
| Median | Q1 | Q3 | median | Q1 | Q3 | ||
| Eotaxin | 95.94 | 61.92 | 123.45 | 53.49 | 19.03 | 101.17 | 0.02 |
| FGF-Basic | 65.08 | 50.87 | 81.77 | 51.64 | 34.32 | 76.54 | 0.29 |
| G-CSF | 75.52 | 50.31 | 140.06 | 76.56 | 55.85 | 124.26 | 0.95 |
| GM-CSF | 2.49 | 0.50 | 4.01 | 1.87 | 1.66 | 1.97 | 0.45 |
| IFN-γ | 2.35 | 1.51 | 5.00 | 0.49 | 0.45 | 1.75 | 0.01 |
| IP-10 | 362.55 | 226.93 | 449.42 | 49.38 | 26.27 | 278.70 | 0.00 |
| MCP-1 (MCAF) | 30.98 | 22.12 | 49.05 | 1.67 | 1.51 | 11.25 | 0.00 |
| MIP-1α | 5.35 | 4.08 | 8.78 | 4.68 | 2.75 | 6.82 | 0.24 |
| MIP-1β | 90.65 | 81.13 | 120.84 | 33.82 | 17.09 | 48.03 | 0.00 |
| PDGF-BB | 3580.42 | 2190.98 | 6371.61 | 292.35 | 65.40 | 1226.16 | 0.00 |
| RANTES | 2615.87 | 1662.23 | 3657.45 | 855.64 | 515.59 | 1780.38 | 0.00 |
| TNF α | 8.88 | 4.82 | 12.09 | 0.35 | 0.31 | 0.35 | 0.00 |
| VEGF | 64.97 | 28.26 | 152.46 | 17.53 | 15.34 | 21.92 | 0.00 |
Cytokine concentrations are expressed in pg/ml. p - p-value (test probability), Q1 - first quartile, Q3 - third quartile.
Disclaimer/Publisher’s Note: The statements, opinions and data contained in all publications are solely those of the individual author(s) and contributor(s) and not of MDPI and/or the editor(s). MDPI and/or the editor(s) disclaim responsibility for any injury to people or property resulting from any ideas, methods, instructions or products referred to in the content. |
© 2024 by the authors. Licensee MDPI, Basel, Switzerland. This article is an open access article distributed under the terms and conditions of the Creative Commons Attribution (CC BY) license (http://creativecommons.org/licenses/by/4.0/).
Copyright: This open access article is published under a Creative Commons CC BY 4.0 license, which permit the free download, distribution, and reuse, provided that the author and preprint are cited in any reuse.


