1. Introduction
In the space age that has now begun, the exploration of deep space is the inevitable path for the development of human science and technology, and the precise spatial positioning of deep space vehicles is the basis for all their exploration work. Due to the limitations of current technology, the main range of activities of humans and man-made spacecraft is still near-Earth space. When it is necessary to go to deep space, traditional space exploration technology will face failure due to the rapid increase in detection distance, so it is urgent to explore a new space exploration method that can be applied to deep space [
1].
In the 6-DOF positioning system in three-dimensional space, it is necessary to combine the translation and rotation of the three coordinate axes and achieve the spatial positioning of the target. According to the different physical quantities measured, spatial positioning and navigation mainly have three technical routes: angle measurement, distance measurement, and speed measurement. Among them, the angle measurement method is for the measurement of rotation, and it is also the most mature space detection technology at present, the current position of the spacecraft can be calculated by combining the angular measurement value with celestial ephemeris information. For translation, there are two kinds of implementation method: distance measurement and speed measurement. Usually, in the near-Earth space range, laser and radio based distance measurement methods are commonly used. And for targets in deep space, due to the large distance scale, the time delay effect of distance measurement technique cannot be ignored, so it is more appropriate to choose the speed measurement technique route for navigation [
2].
Due to the energy attenuation, channel delay, sight obstruction and other problems that caused by the light-year level spatial scale in the deep space environment, almost all active detection methods and artificial light sources are not suitable for deep space exploration tasks, and only passive signal source detection methods can be considered. Compared with existing astronomical observation technologies, large astronomical telescopes can perform high-precision spectral detection, but their disadvantages are large volume and weight, and lack of real-time performance. Considering the cost and capacity limitations of current aerospace engineering, traditional large telescope systems are also difficult to be equipped as general-purpose components on deep space vehicles. Therefore, for the future expansion direction of deep space vehicles, the core requirements of spectral velocimetry navigation technology include: passive detection, device miniaturization and lightweight, quasi real-time processing, and relatively high measurement accuracy.
It can be seen that spatial heterodyne spectral velocimetry technology is an essential core capability for spacecraft autonomous navigation in the future. And the universal target source that can be used as a reference in space should be a star with stable radiation. Therefore, this paper mainly studies the theoretical feasibility and practical measurement scheme of spatial heterodyne spectral velocimetry technology based on stellar light sources, and evaluates the approximate measurement accuracy and main error sources of this scheme through specific experimental data. The subsequent contents of this paper includes: characteristic analysis of solar spectrum, the spatial heterodyne spectral velocimetry theory, experimental verification scheme based on solar absorption spectrum, experimental data processing and analysis, research results and discussion.
2. Characteristic Analysis of Solar Spectrum
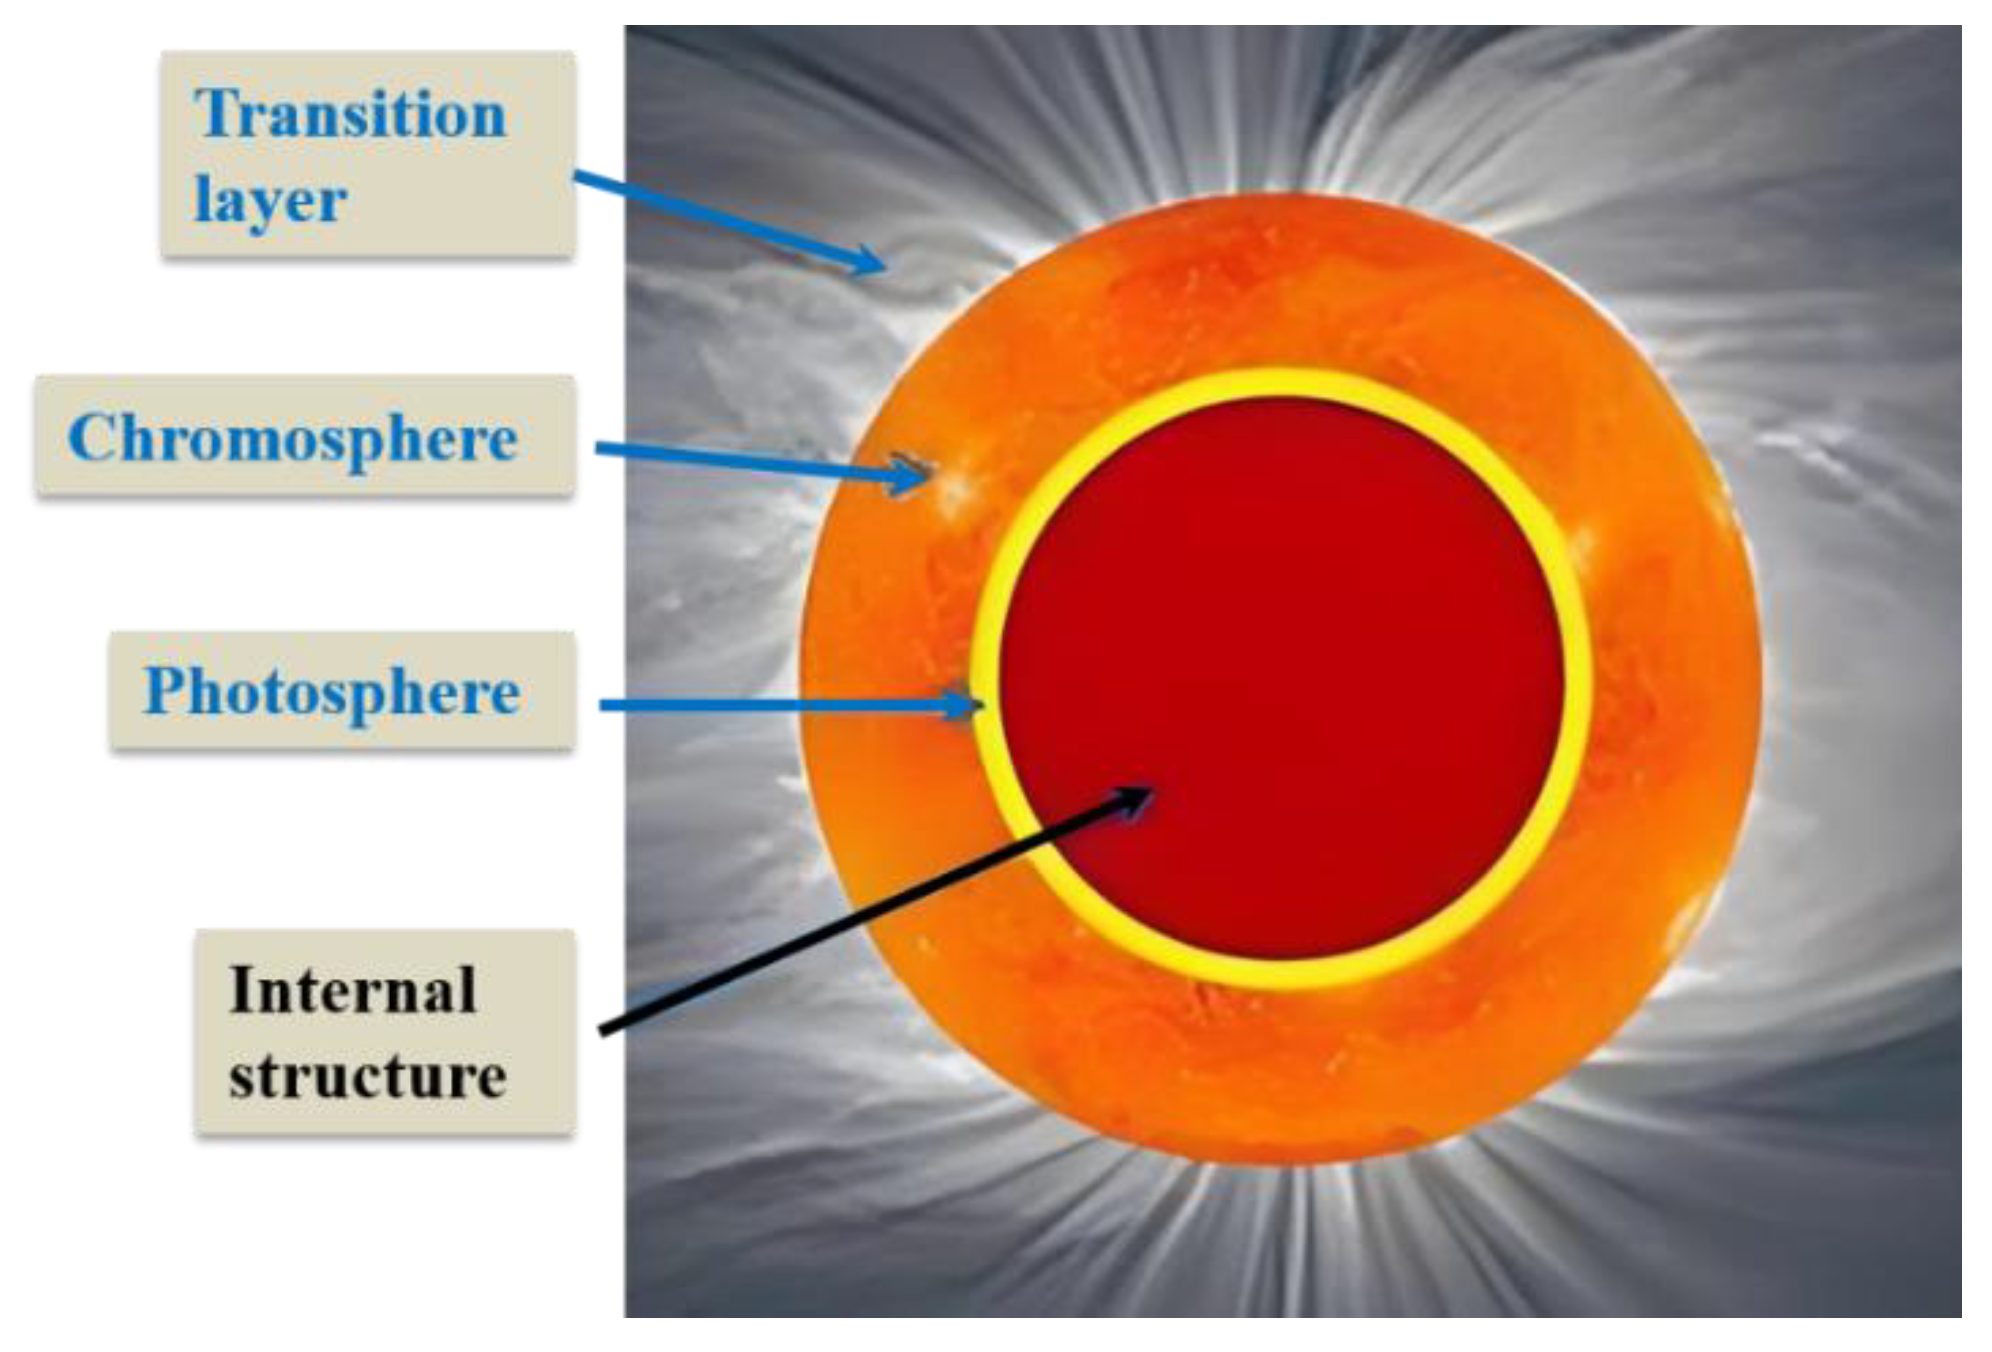
For deep space navigation, considering the distance scale and signal source stability in the universe, the types of targets that can be used as reference objects are very limited. The most typical ones are stars that can produce stable radiation, such as the sun; on the other hand, considering the current detection capabilities, technological level, and accumulation of observation data of human beings, the sun is undoubtedly the most suitable research object. Therefore, we can make a preliminary analysis based on the spectral characteristics of the sun and establish a typical stellar target spectral model. The structure of the sun can be roughly divided into the inner layer (unobservable) and the outer atmosphere (observable), and the solar atmosphere can be further divided into the photosphere, chromosphere and transition layer (also called the corona) [
3], as shown in
Figure 1.
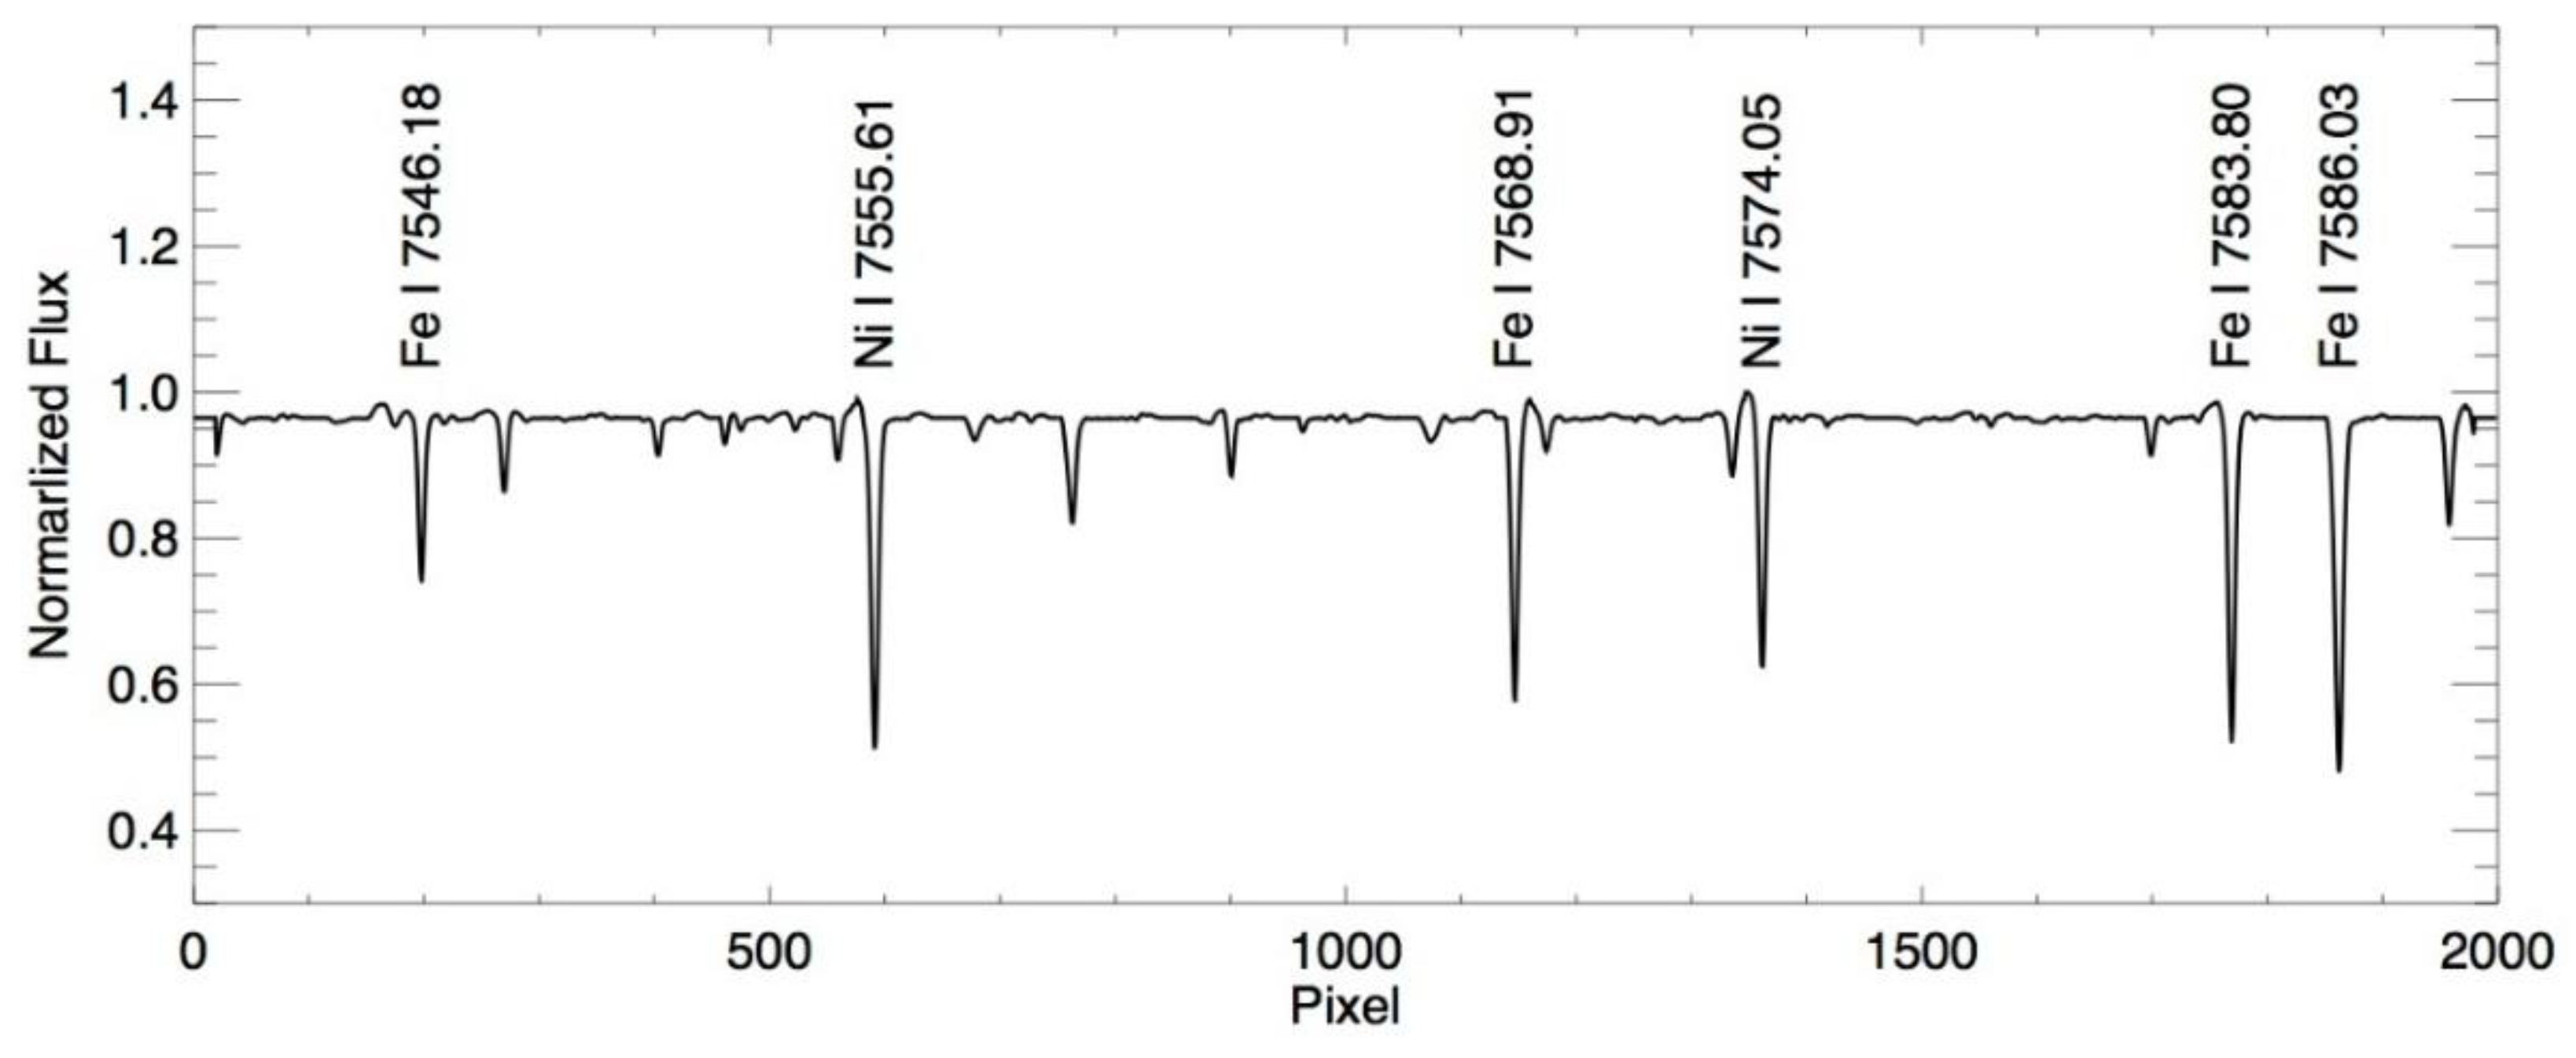
According to the existing relevant research results and experimental data, it is concluded that the frequent eruptive activities on the surface of the sun lead to significant spectral instability in the chromosphere and transition layer. Only the photosphere has relatively good spectral stability, as shown in
Table 1. Therefore, it is more appropriate to choose the spectral line characteristics of the photosphere as the reference target. As for the photosphere spectrum, due to the back and forth reflection and scattering from the outer atmosphere, the overall spectral distribution is relatively uniform, and only exhibits absorption peaks when emitted by specific element spectral bands (such as iron, nickel, etc.), as shown in
Figure 2.
Because the generation and evolution paths of stars are consistent with their basic structures, it can be inferred from the atmospheric structure model and observational data of the sun that the stable spectra of most stars should be absorption lines. Therefore, the miniaturization of spectral velocimetry instruments based on stellar absorption lines is a challenge that must be overcome in the future development of deep space exploration technology.
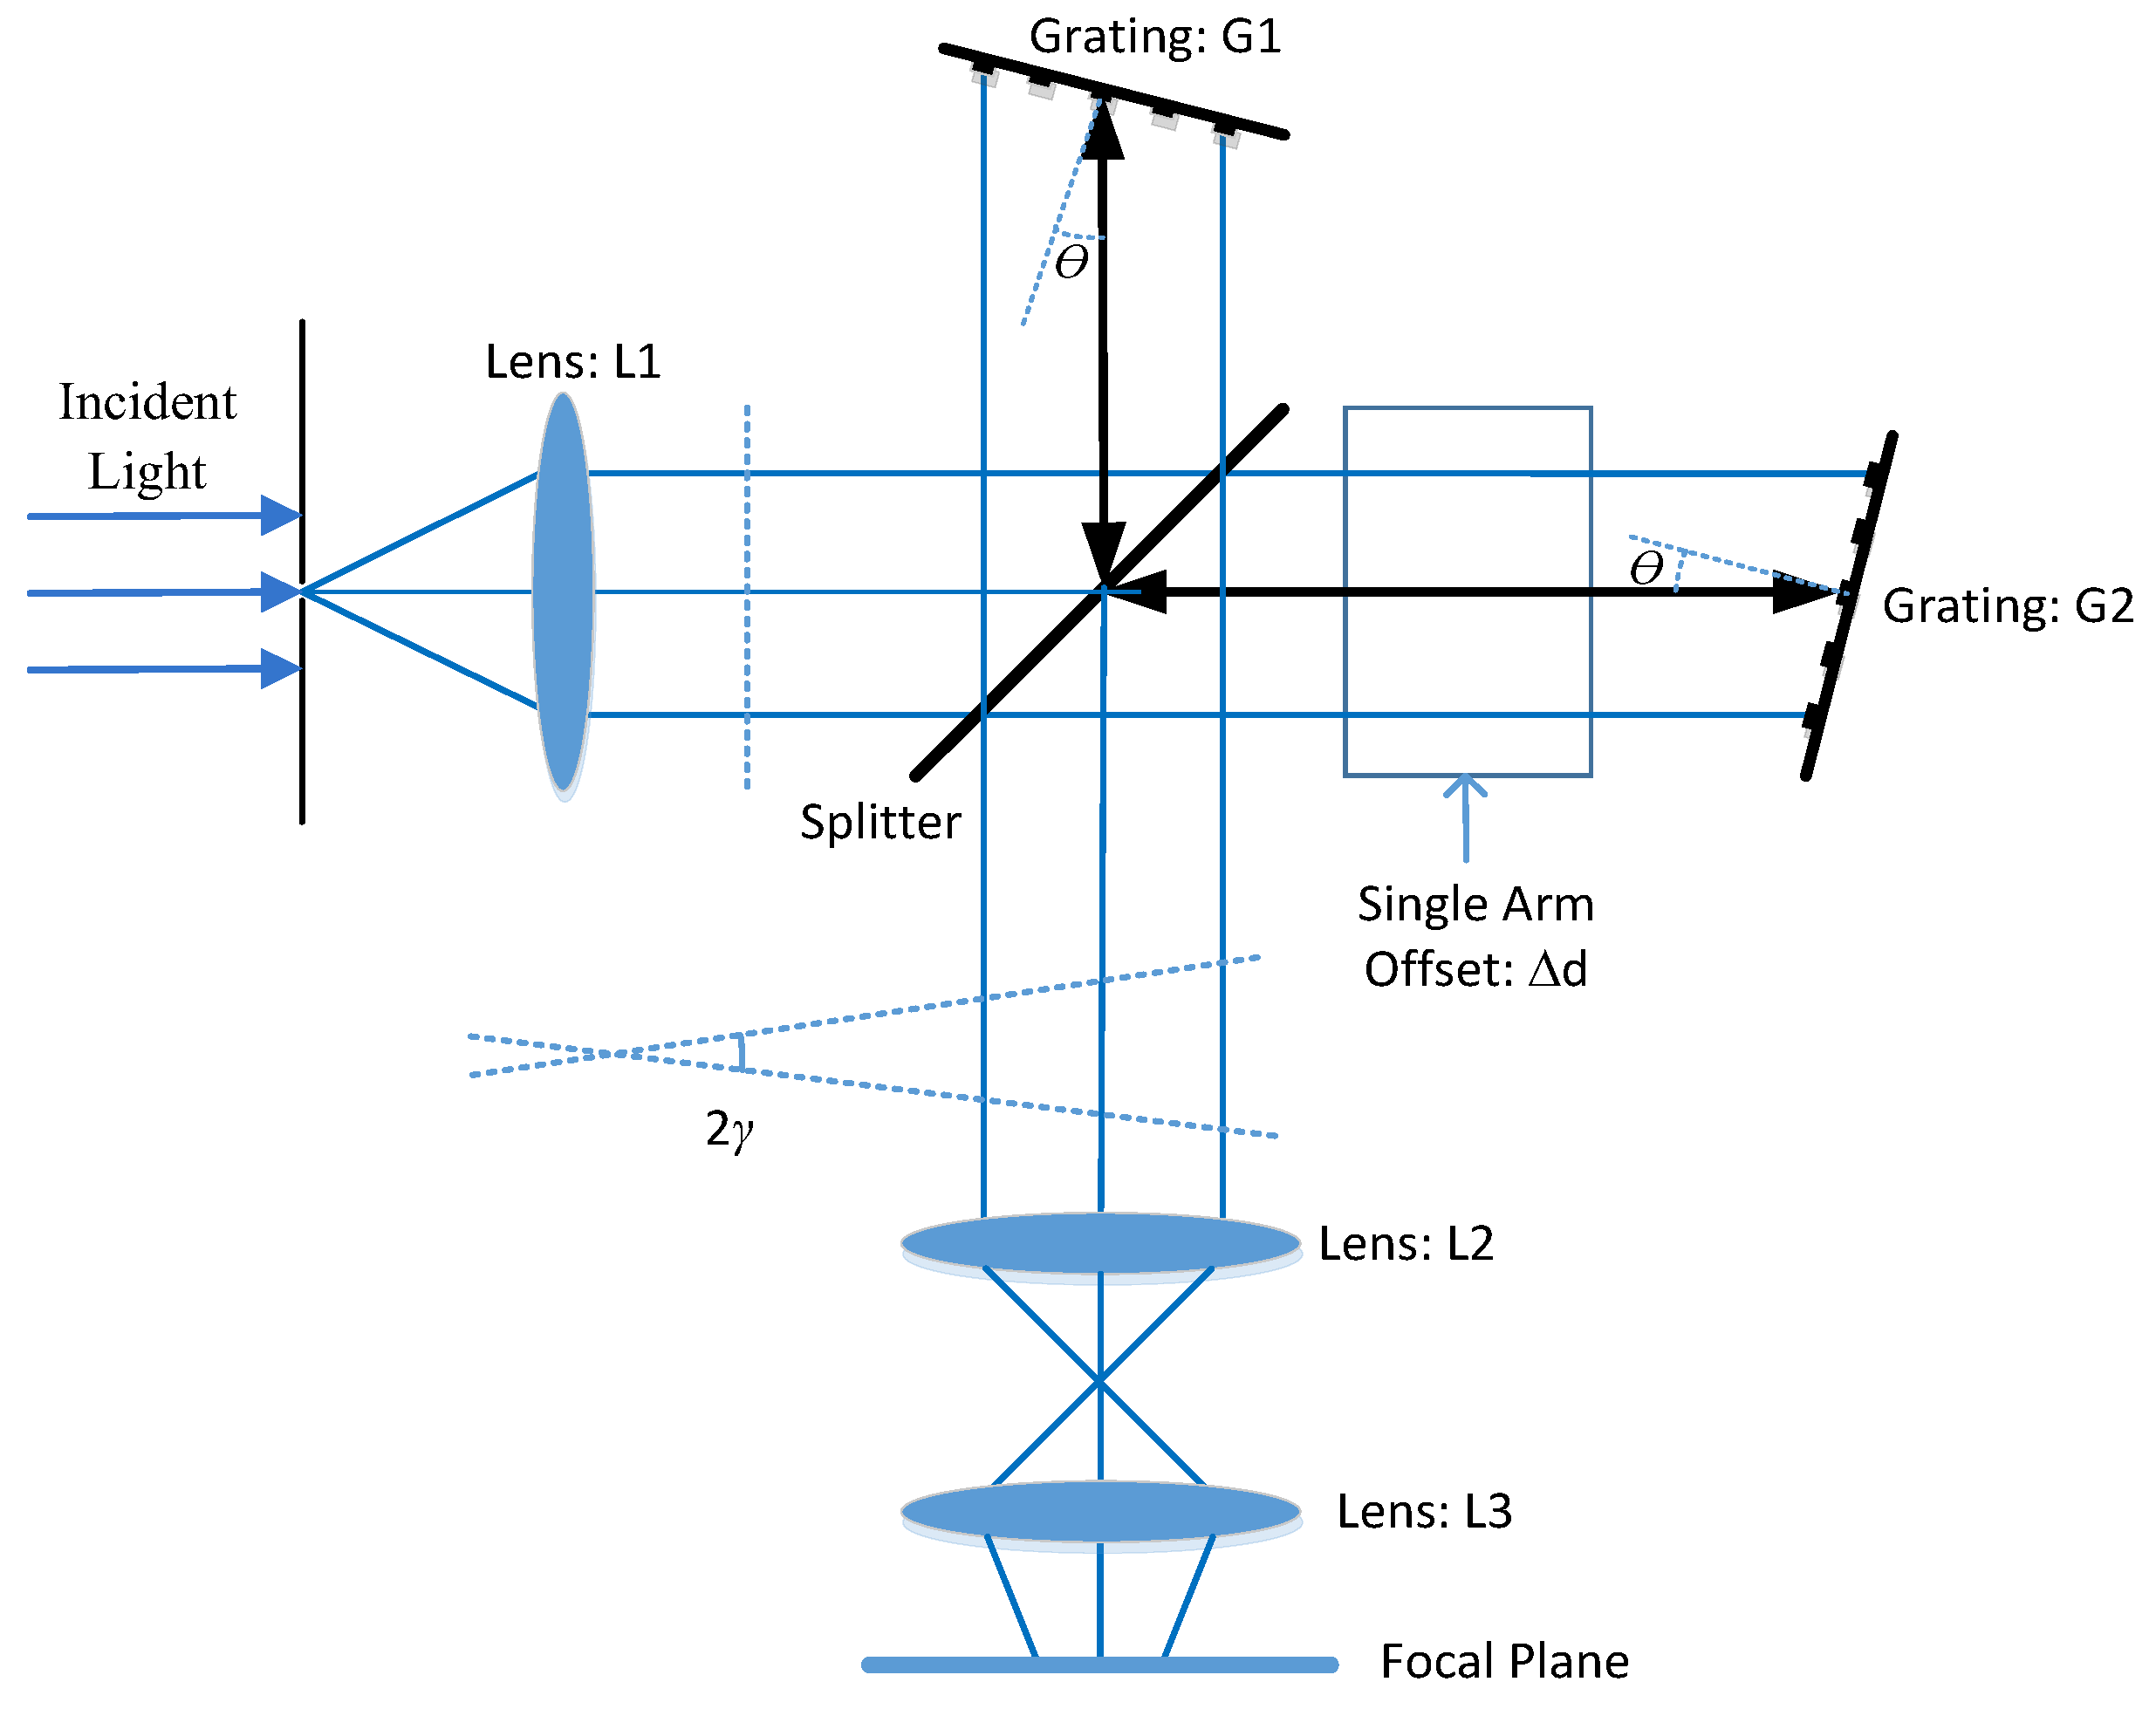
3. The Spatial Heterodyne Spectral Velocimetry Theory
Among the existing optical measurement techniques, interferometry method has the highest resolution. Spatial heterodyne spectral velocimetry technology as a new type of ultra-high resolution remote sensing detection technology, has many advantages in optical characteristics. On the basis of the traditional Michelson interferometer, two tilted gratings are used to replace its plane mirror, and the arm length of one end of the original moving mirror is fixed, which is the Spatial Heterodyne Spectroscopy (SHS); and then expanding the two optical paths to form a fixed distance offset, which is called Doppler Asymmetric Spatial Heterodyne (DASH) interferometer [
6,
7], as shown in
Figure 3. This improvement can eliminate the mechanical errors of moving parts, and can take into account both small volume size and high spectral resolution, which is suitable for measurement work in deep space environments.
In the field of astronomy, E.J. Mierkiewicz et al. developed the PBO-SHS loaded on the telescope terminal in 2004, which was the first time used the spatial heterodyne measurement technology for the spectral radiation detection of interstellar matter [
8]. Even the Laser Interferometer Gravitational-wave Observatory (LIGO), which achieved the first observation and complete confirmation of Einstein's predicted gravitational waves in human history in 2015, also adopted a spatial heterodyne optical structure [
9]. This shows that the spatial heterodyne spectral measurement technology has a high measurement resolution and is capable of handling high-precision measurement application scenarios.
Comparing the parameters and indicators of some typical large-aperture astronomical telescopes, as shown in
Table 2. It is found that the pure spectral resolution of the equipment is only on the order of 10
^5; but the highest measurement accuracy is on the order of 1~0.01m/s, which means the actual measurement resolution can reach 10
^8~10
^10 (the speed of light in vacuum compared to the speed measurement accuracy). For deep space exploration instruments with dimensions are much smaller than astronomical telescopes, in order to achieve the same level of speed measurement accuracy, it is necessary to understand how to achieve high level of signal resolution.
Some scholars have proposed a “three-stage amplification” theory for spatial heterodyne spectral velocimetry technology [
10], which achieves ultra-high velocimetry accuracy of DASH interferometers through the series superposition of three levels (optical amplification, measurement amplification, and analytical amplification), and points out the prerequisites and applicable scope of each amplification level. The first-order amplification effect is called optical amplification, which is achieved through the blazed grating in the DASH interferometer. According to calculations, for the visible spectra of the sun, optical amplification can generally reach the order of 10
^3~10
^4. As for the DASH interferometer itself, it is used the characteristics of the blazed grating that enable the instrument to significantly reduce the device size, achieve miniaturization and lightweight while ensuring a high spectral resolution.
The second-order amplification effect is called measurement amplification, which is achieved by the optical path difference between the two unequal reflection arms in the DASH interferometer. The spatial heterodyne spectral velocimetry technology adopts the inherent physical manifestation of the phase measurement method. It can be imagined that extending the interference fringes into a "spring" in three- dimensions (its projection on the XY plane is the energy amplitude curve of the interference fringes). The stretching or compression of the "spring" corresponds to the change in the spatial frequency of the fringe image. When a very small stretching or compression action causes a shift of in the cross section of the first coil, then a shift of will occur in the M-th coil, and is directly related to the change in spatial frequency. Therefore, a more accurate spatial frequency change can be obtained by measuring the phase shift at the far end of the "spring", which is equivalent to amplifying the resolution of the signal analysis by M times. This is also the reason why an additional optical path difference is introduced to change the core optical components from standard SHS structure to DASH structure. According to data simulation and experimental tests, the amplification effect caused by the asymmetric arm path difference at this stage can generally reach the order of 10^2~10^3.
The third-order amplification is the analytical process of the fringe signal by Fourier transform, which can usually achieve amplification factors of 10
^2~10
^5 order. The actual effect is related to specific parameters such as the number of calculation points, processing algorithm, and signal shape. The amplification principle and constraints of this level are easily overlooked in the usual processing flow. In actual measurements, the collection of physical quantity data to be measured is discrete and finite, so that the analytical spectrum interval will limit the resolution of data calculation being like a scale. Therefore, the analytical processing method adopted will affect the processing accuracy of the measurement results. Based on the conclusions and experimental data obtained from multiple references [
11,
12,
13,
14,
15,
16], it is often assumed that using the interference fringes of emission line spectral imaging for calculation as default, resulting in multiple sampling points being taken for comprehensive processing in the corresponding Fourier transform. This is equivalent to a weighted averaging multiple sets of measurement data, so that the accuracy of the measured data can be much smaller than resolution limit corresponding to the spectrum interval.
The "three-stage amplification" theory explains the origin and implementation method of the high measurement accuracy in spatial heterodyne spectral velocimetry technology from the underlying mechanism. On the one hand, the theory proves that the cascade cooperation through the three-stage amplification effect is sufficient to produce a measurement resolution extensions of more than 10^9 orders for the physical quantity to be measured, thereby realizing high-precision velocimetry for miniaturized instruments. On the other hand, since the "three-stage amplification" theory is derived from the target model of emission spectrum, but the stellar targets that deep space vehicles need to detect in actual engineering are absorption spectra (characteristic information is reflected by absorption peaks). Therefore, it further points out the adaptability problem of high-precision signal analysis of absorption spectrum target sources with the spatial heterodyne spectral velocimetry technology.
4. Experimental Verification Scheme Based on Solar Absorption Spectrum
From the above analysis, it can be seen that the absorption spectra may not meet the linear amplification law of the phase value (the sub-items would return after 360°) and the equivalent positioning principle of multi-point weighting. So it may not be able to achieve the requirements of the second and third order of amplification effects. Therefore, the author proposed the Background Light Synchronous Elimination (BLSE) method to convert absorption spectral line into equivalent emission spectra for measurement [
17], so as to achieve the original high measurement accuracy that spatial heterodyne spectral velocimetry technology should have.
4.1. Basic Principle Architecture of the Experimental Scheme
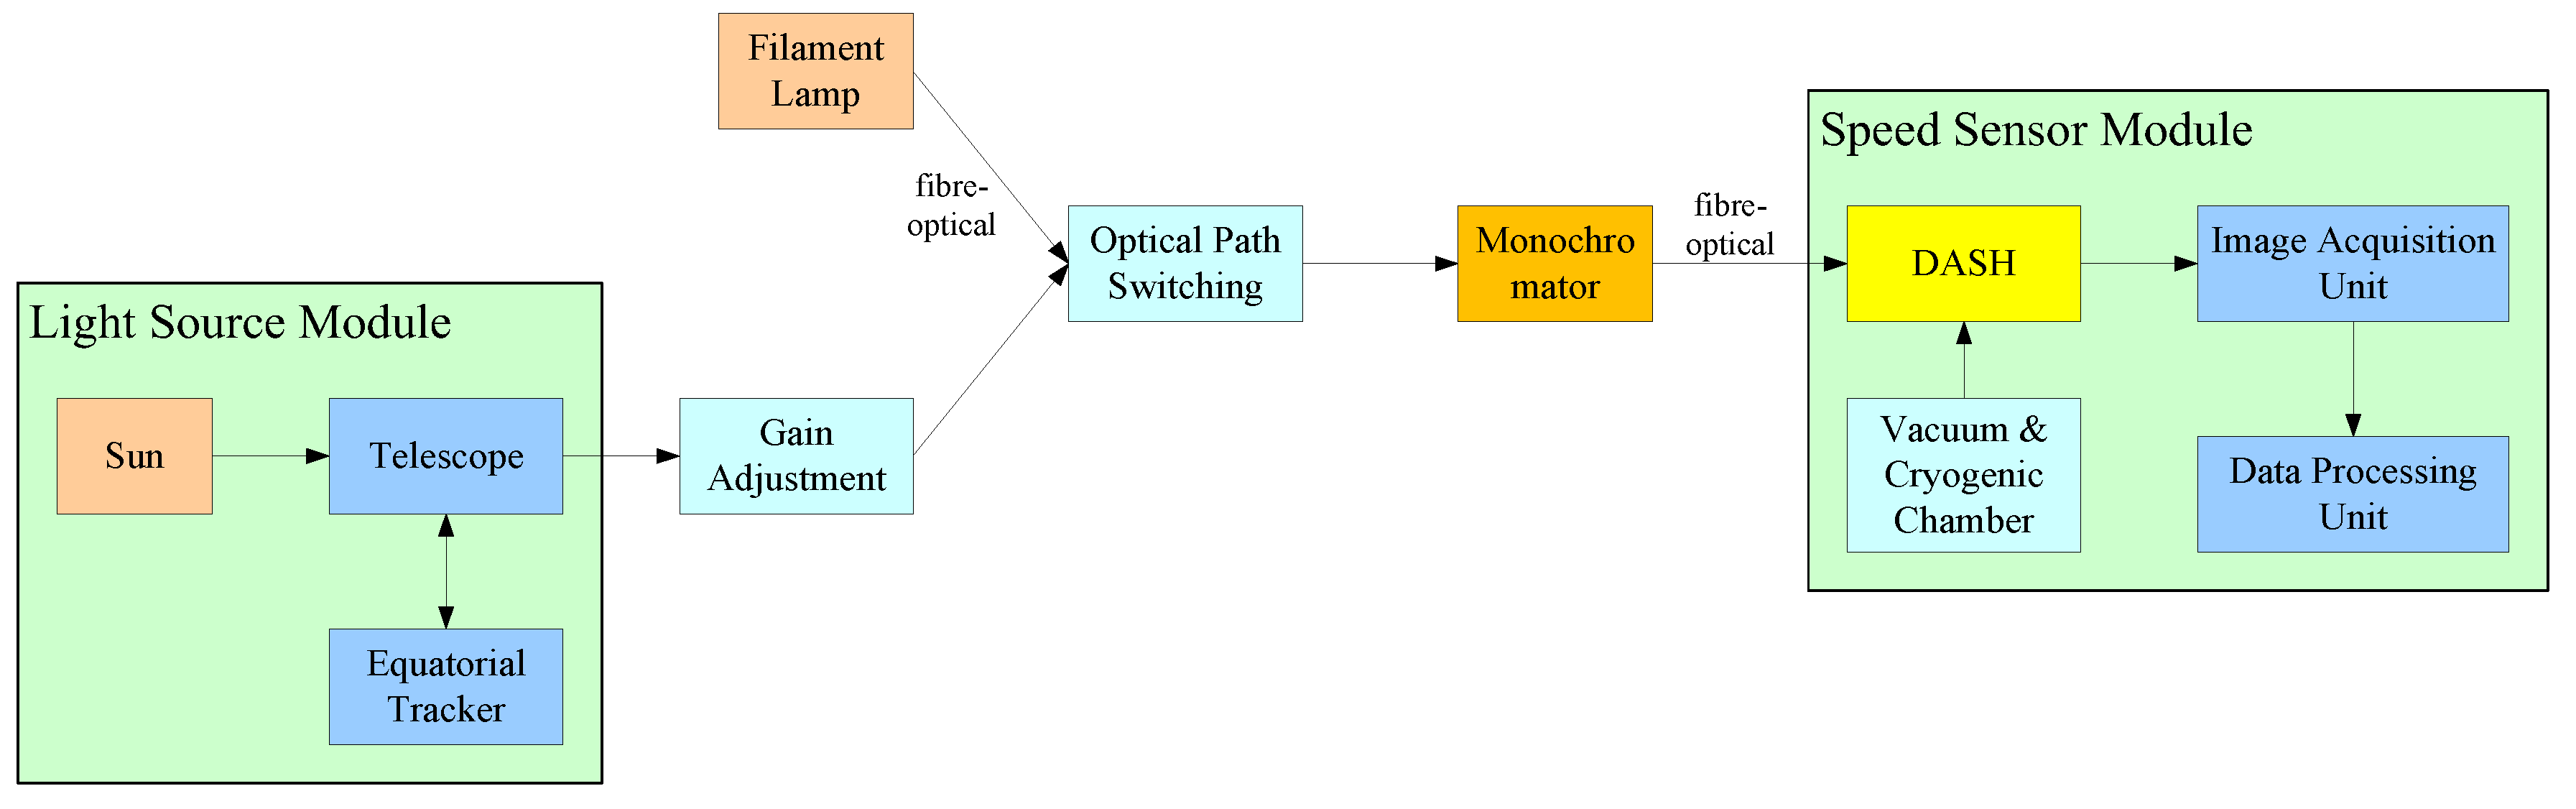
As the only star in the solar system, the sun has a relatively stable physical state and radiation effect, and can provide high energy density, thereby reducing the relative error of detection noise. On the other hand, compared to other stars, domestic and foreign scholars have conducted more in-depth and continuous research on various characteristics of the sun. Therefore, choosing the sun as the target of the field experiment can have more prior information. Regarding how to achieve synchronous elimination signal analysis based on solar absorption spectrum, this paper provides the following implementation plan. The principle structure is shown in
Figure 4, and
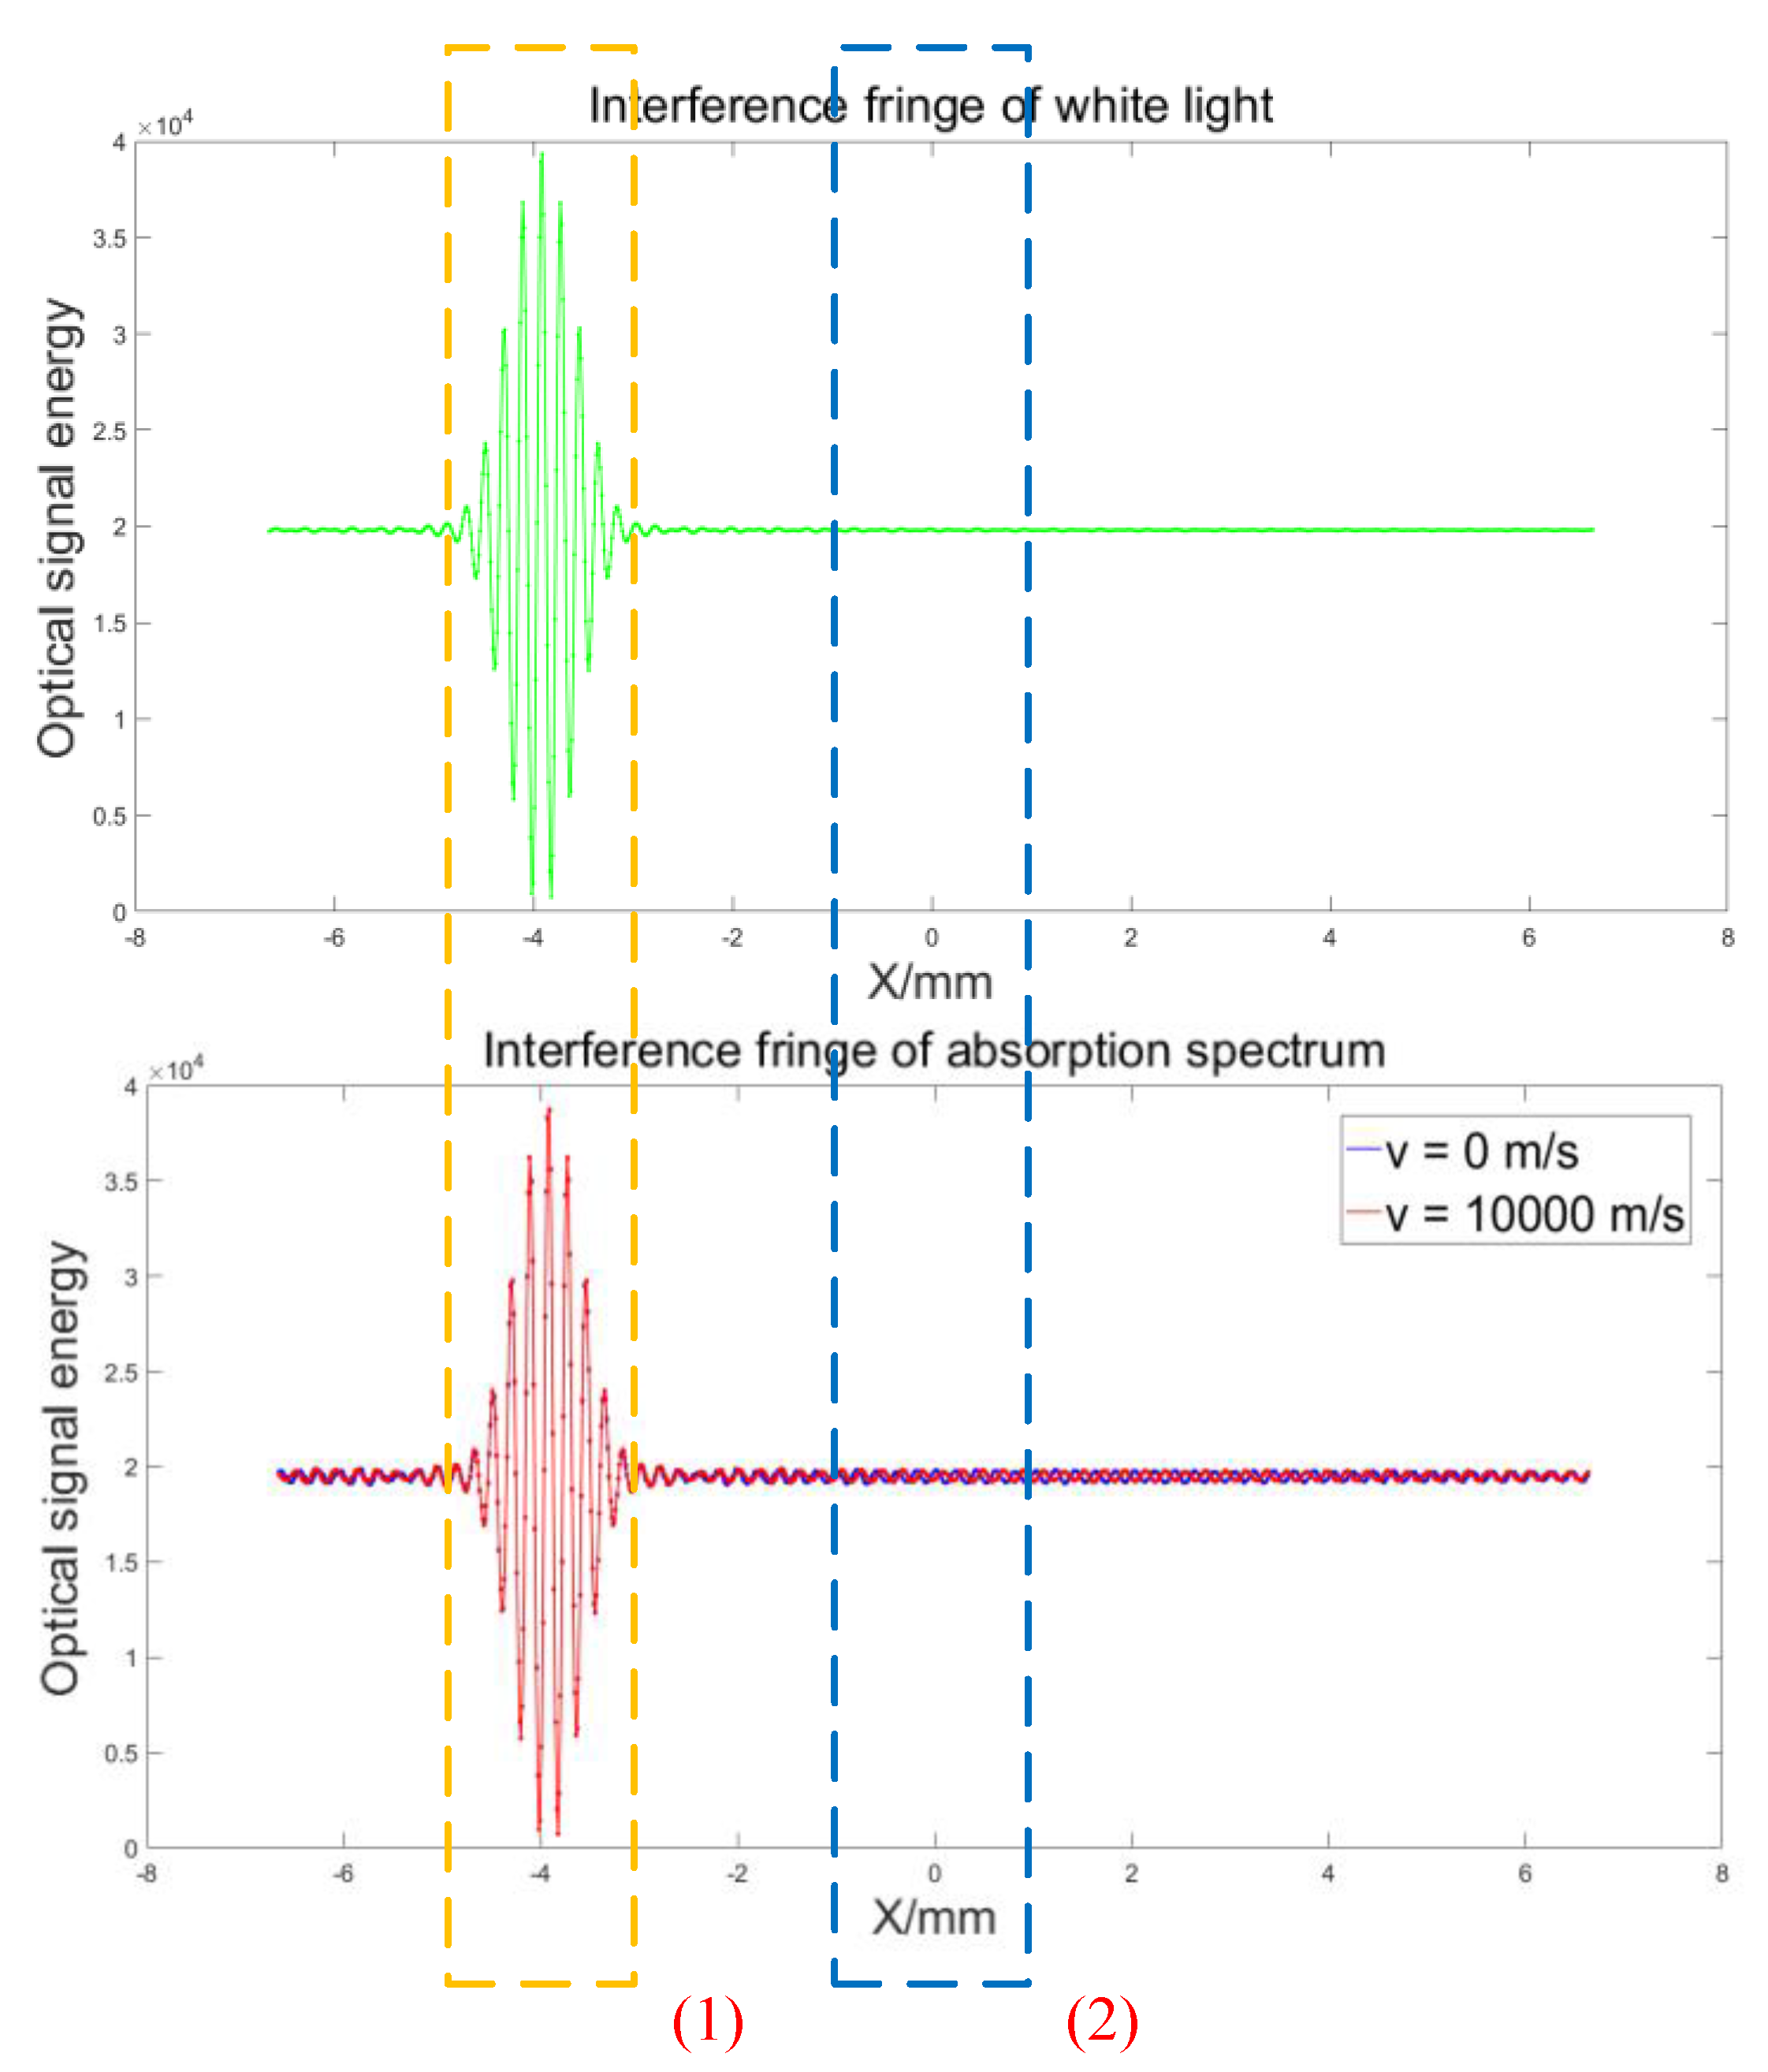
Figure 5 is the comparison of simulation curves between background light and signal light.
The specific experimental scheme is designed into three steps, namely:
Step 1: observe the signal energy at the center bright spot position of the interference fringe, marked as (1) in
Figure 5; adjust the gain device behind the signal light source, so that the interference fringes generated by the background light and the signal light have similar energy amplitudes, and record the amplitude ratio of the two.
Step 2: observe the signal energy at the side lobe position of the interference fringe, marked as (2) in
Figure 5; select the background light source, amplify the gain of the backend detection camera, and record the interference fringe signal generated by the incandescent light source as background reference information.
Step 3: select the signal light source, record the interference fringe signal generated by the signal light, and subtract it from the background signal in step 2; perform phase analysis on the differential signal, fit two sets of curves with/without speed, and verify the matching degree and measurement accuracy between the solution value of the curves and the calibrated speed quantity.
Among them, the core role of step 1 is to ensure the energy consistency between the background light and the signal light. The core role of step 2 is to obtain accurate background light signals. And because of the energy at center bright spot is much greater than the side lobe position, it is necessary to amplify the gain of the image acquisition end while keeping the front-end control unchanged. Step 3 requires switching to the signal light source (solar spectrum), differentiating the interference fringes containing the absorption peak signal from the background light interference fringes, and calculating the phase information.
It is worth noting that the application purpose of this speed measurement implementation scheme is to carry out the relative motion state of a spacecraft. However, considering the difficulties of the harsh environment and high cost of using a real spacecraft for operation, the experimental scheme downgraded to build a Doppler velocity generator in a laboratory on Earth. The natural vacuum and low temperature state in the space environment, as well as the uniform linear motion of the spacecraft at the order of 10^5 m/s (refer to the first/second/third cosmic speed), are difficult to fully match in the Earth. Therefore, errors in the velocity generator, human factors during measurement operations, the influence of environmental noise, and other issues can all interfere with the experimental measurement results.
In the experimental setup process, should meet the environmental control requirements of vacuum and low temperature firstly (DASH optical device is placed in a vacuum and low temperature chamber), and a high-stability EMCCD camera with dual-cycle cooling is used as the image acquisition unit. Secondly, the signal light source needs to select the central spot obtained by the solar telescope, and the measurement band should choose a relatively single and deep absorption peak area. At the same time, in order to improve the signal-to-noise ratio of interference fringes, a polarizer can be added behind the light source to reduce the noise interference of the measurement system under the premise that the light source energy is sufficient.
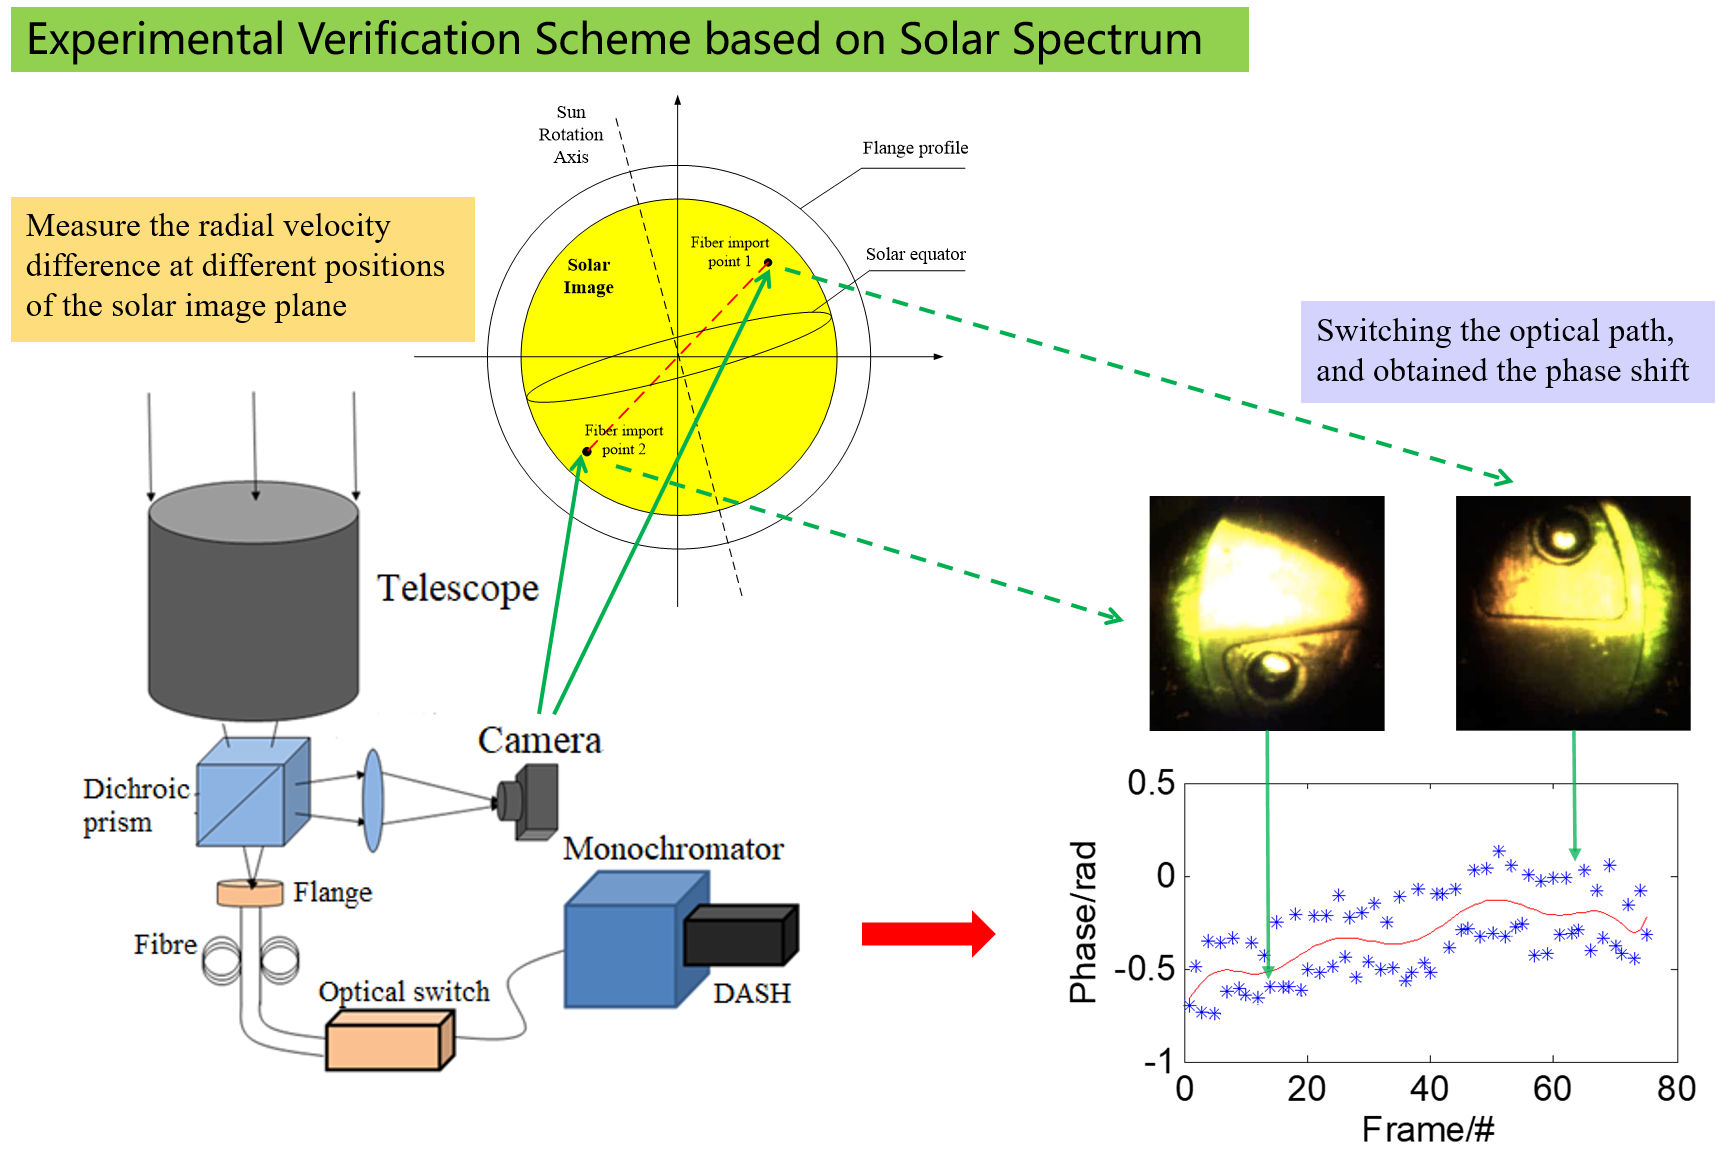
4.2. Generation of the Speed to Be Measured
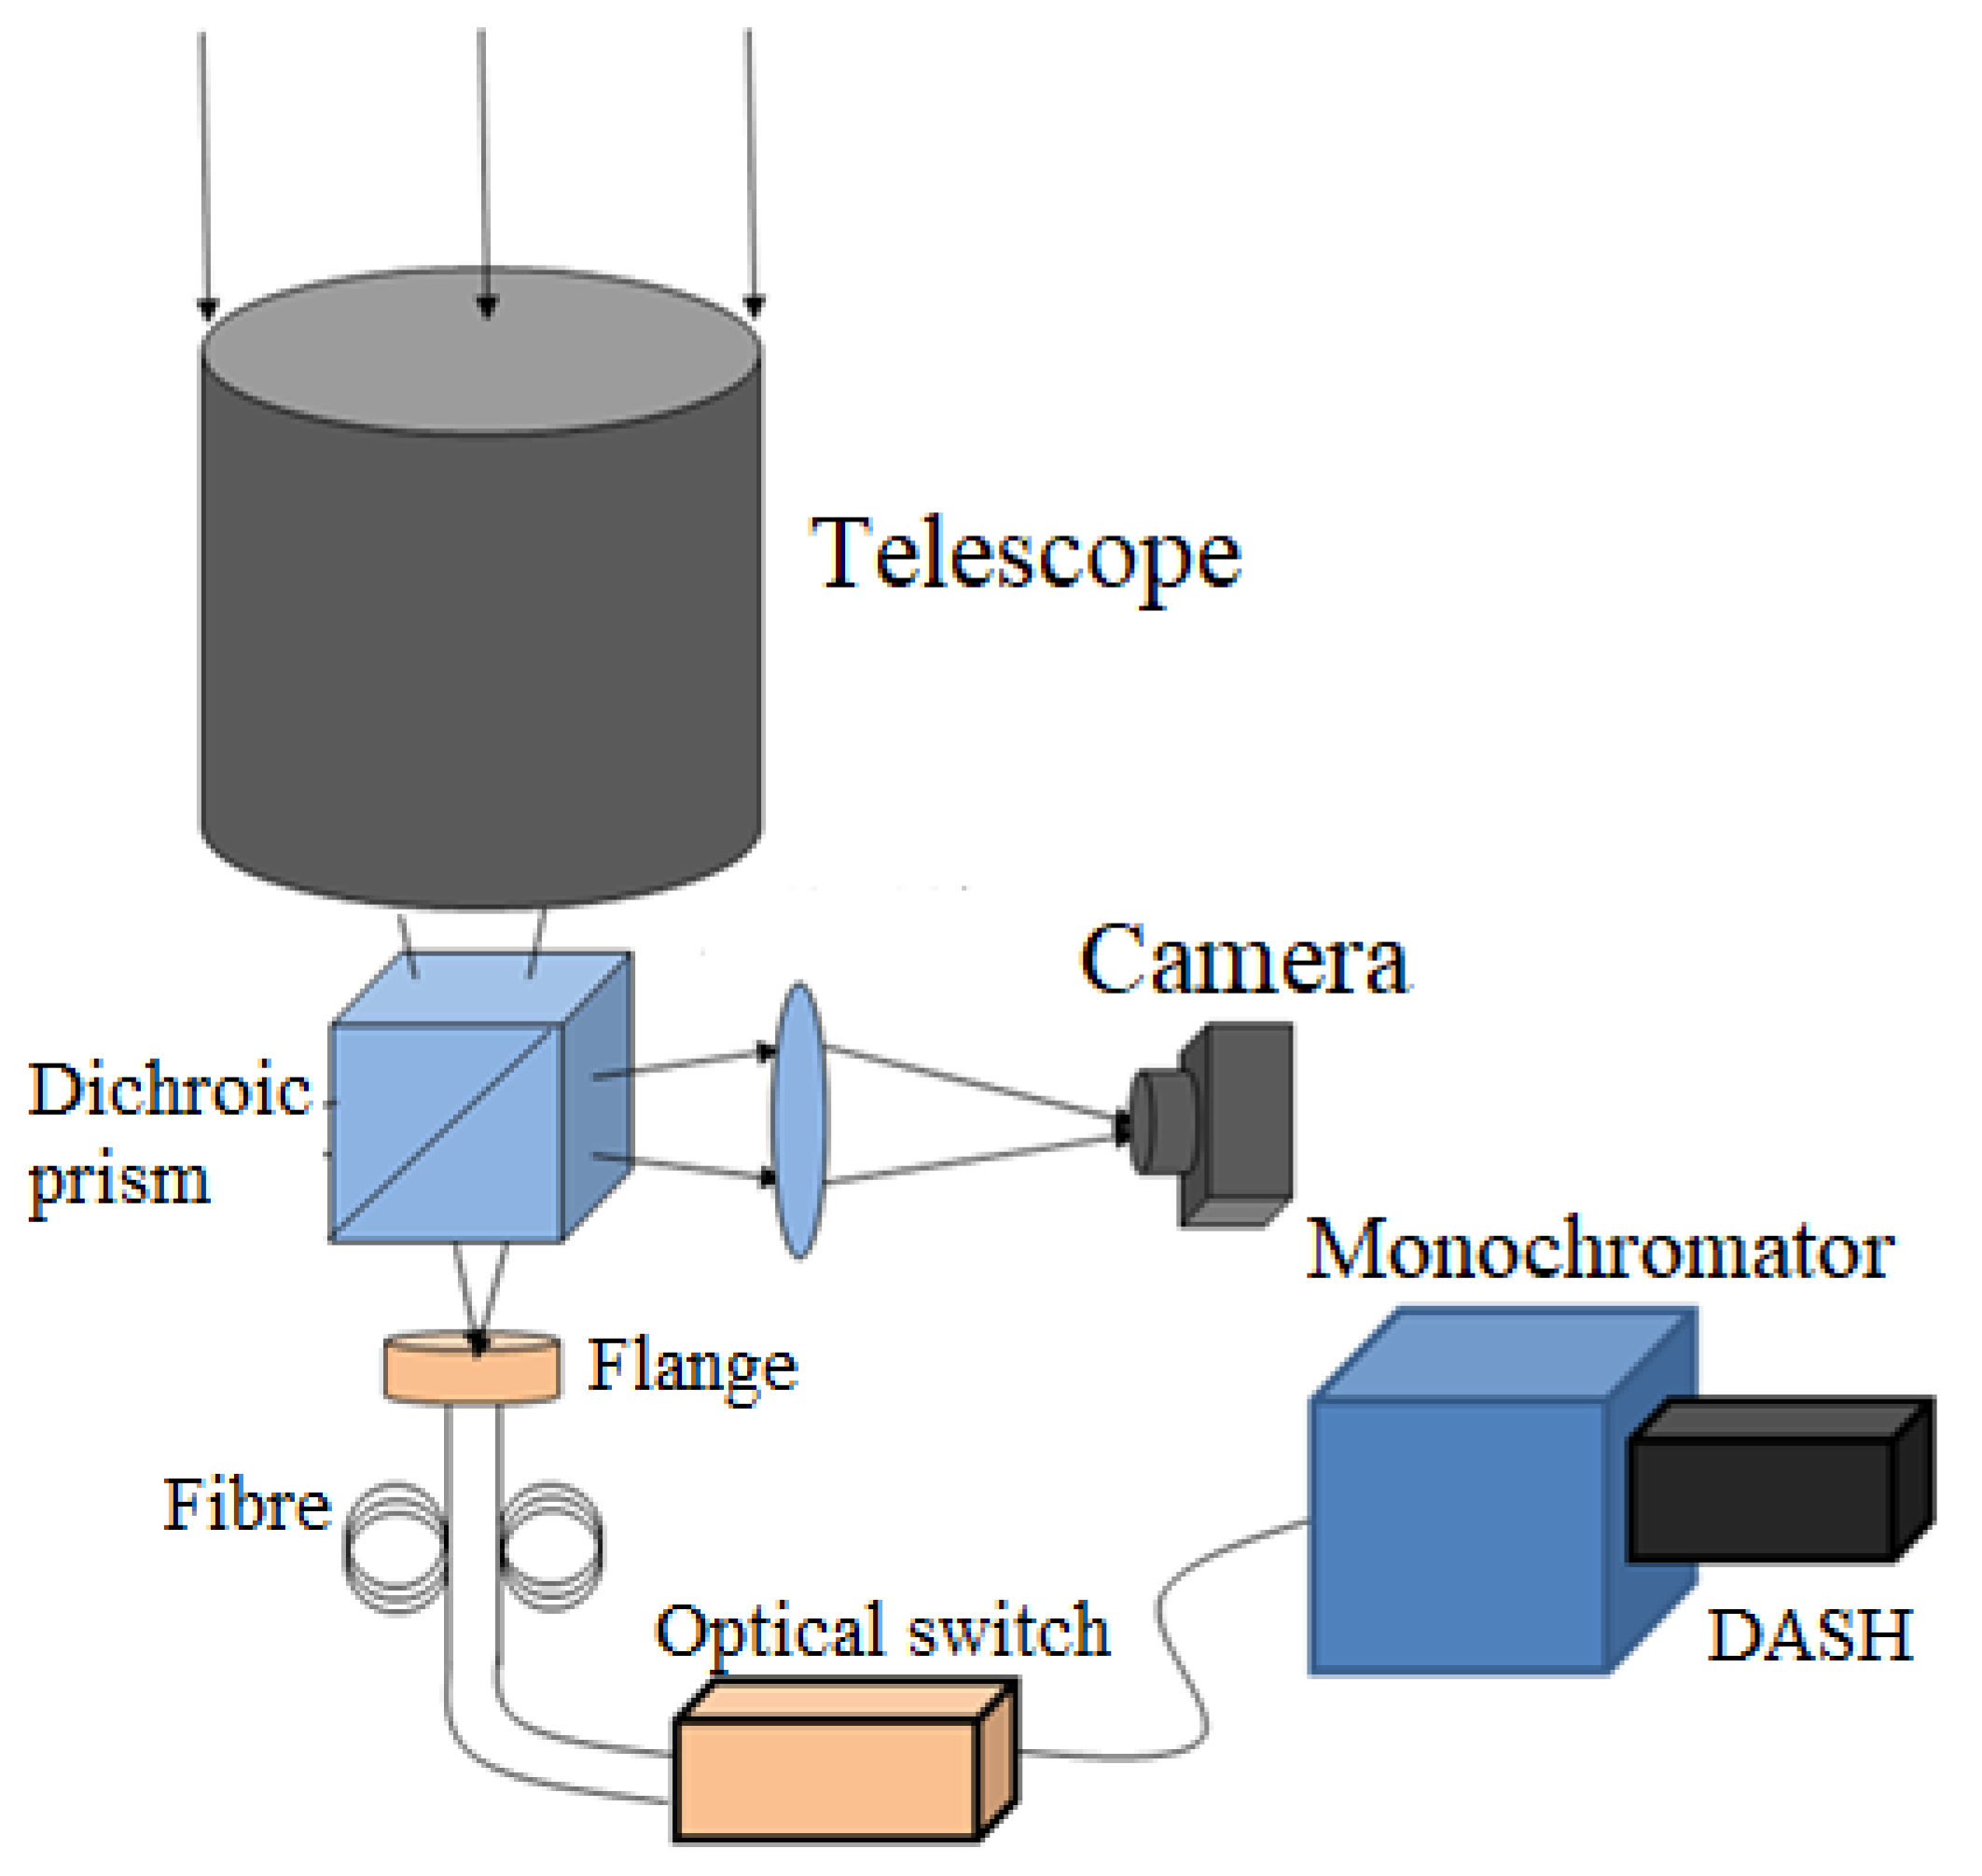
Since the spatial heterodyne spectral velocimetry technology is essentially to measure the Doppler frequency shift (speed difference) between the reference light and the signal light, and the sun itself has a differential rotation, it is considered to select two different points on the solar image plane of the telescope as targets. And measure the radial velocity difference between the two points, so as to verify the feasibility of the spatial heterodyne spectral velocimetry technology. The overall optical path design scheme for the solar observation experiment is shown in
Figure 6. Place two optical fibers on the solar image plane of the telescope, and respectively connect them to the edge areas near the equator on both sides to obtain a larger speed difference. The two signal lights are introduced into the monochromator after passing through the optical switch, and the filtered signal light enters the DASH module through the exit slit. Finally, the interference fringes are inverted and calculated by the back-end data processing module to obtain the velocity difference corresponding to the two access areas, and compared with the theoretical value converted from the solar rotation velocity field and the incident angle.
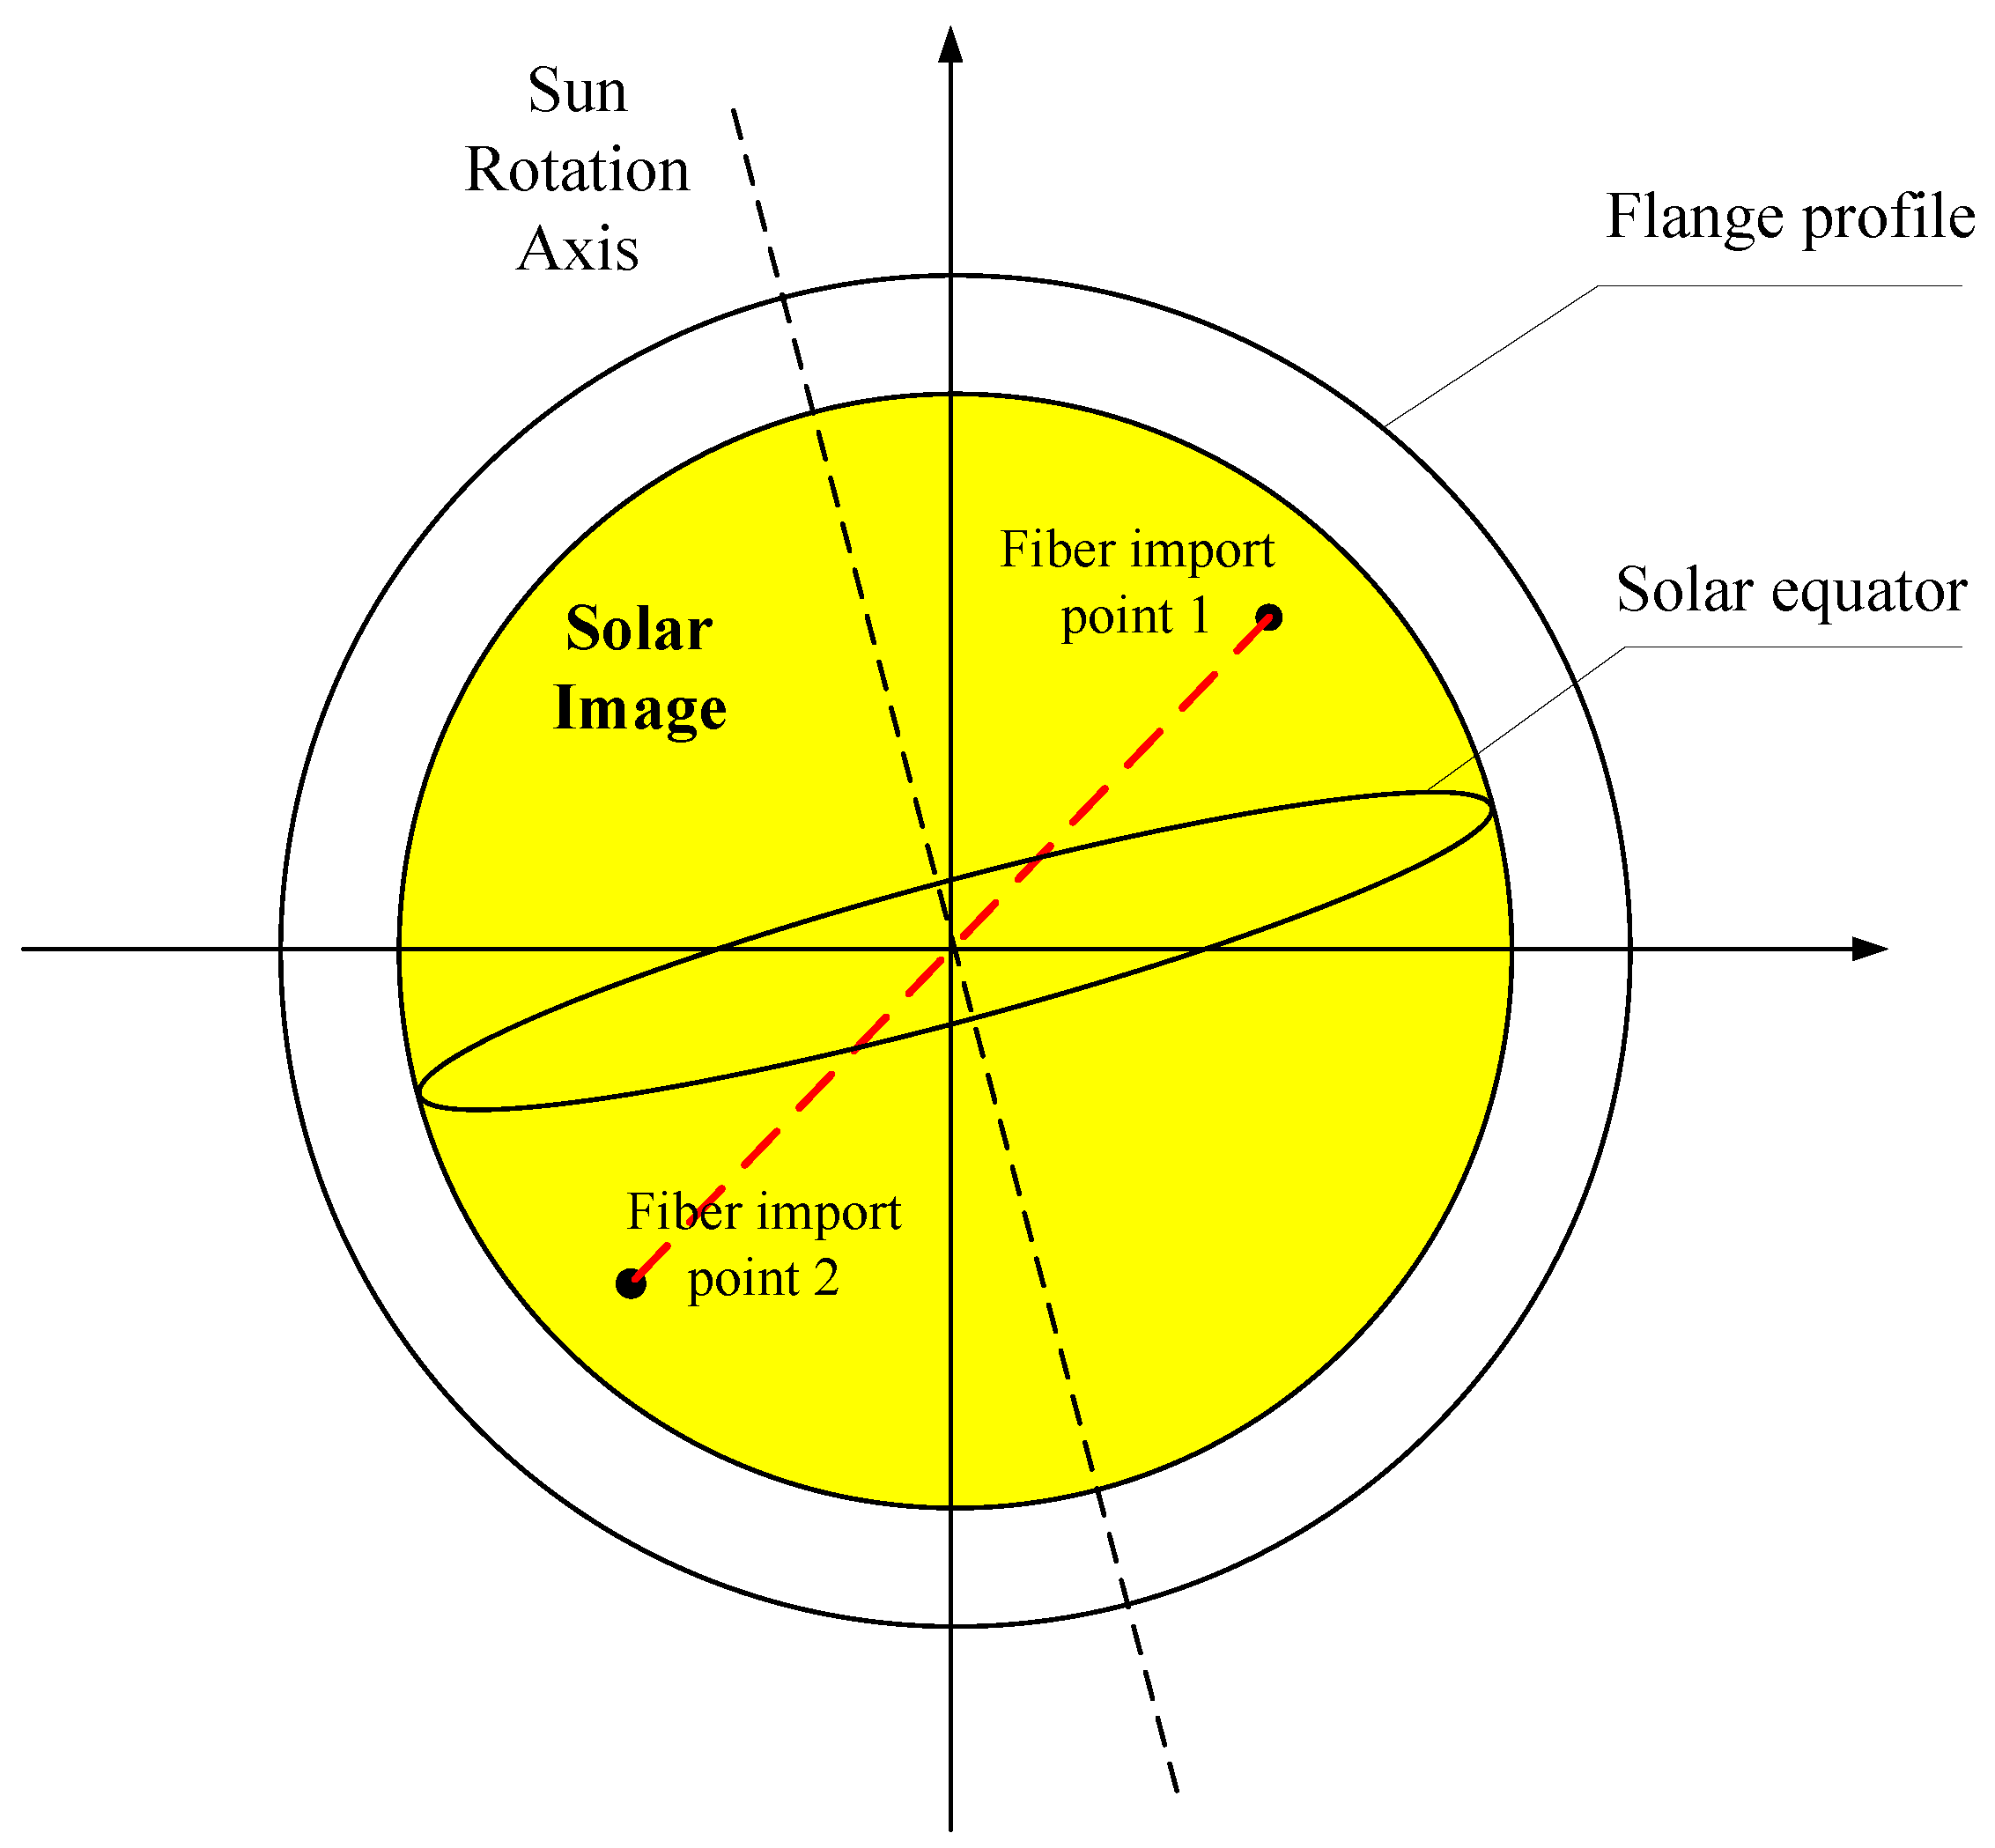
In addition, a beam splitter with a transmittance/reflection ratio of 98:2 is required between the telescope and the flange, and a flange should be placed at the focal position of the telescope system. The solar image and the fiber end face on the flange surface are reflected by a prism and imaged on the camera photosensitive surface, forming a monitoring optical path for precise positioning of the fiber end face on the solar image plane at the reflective end of the splitter. The distribution of the solar image plane and the fiber end face on the flange is shown in
Figure 7. The specific coordinate positions of the two fiber cores on the solar image are important input information for measuring the radial velocity difference. By calibrating the coordinate positions of the fiber cores, the theoretical velocity difference between the two fiber introduction points can be calculated according to the formula. Compare it with the velocity difference of the corresponding two import points on the solar image plane measured in the experiment, then can finally determine the velocimetry accuracy of the field experiment.
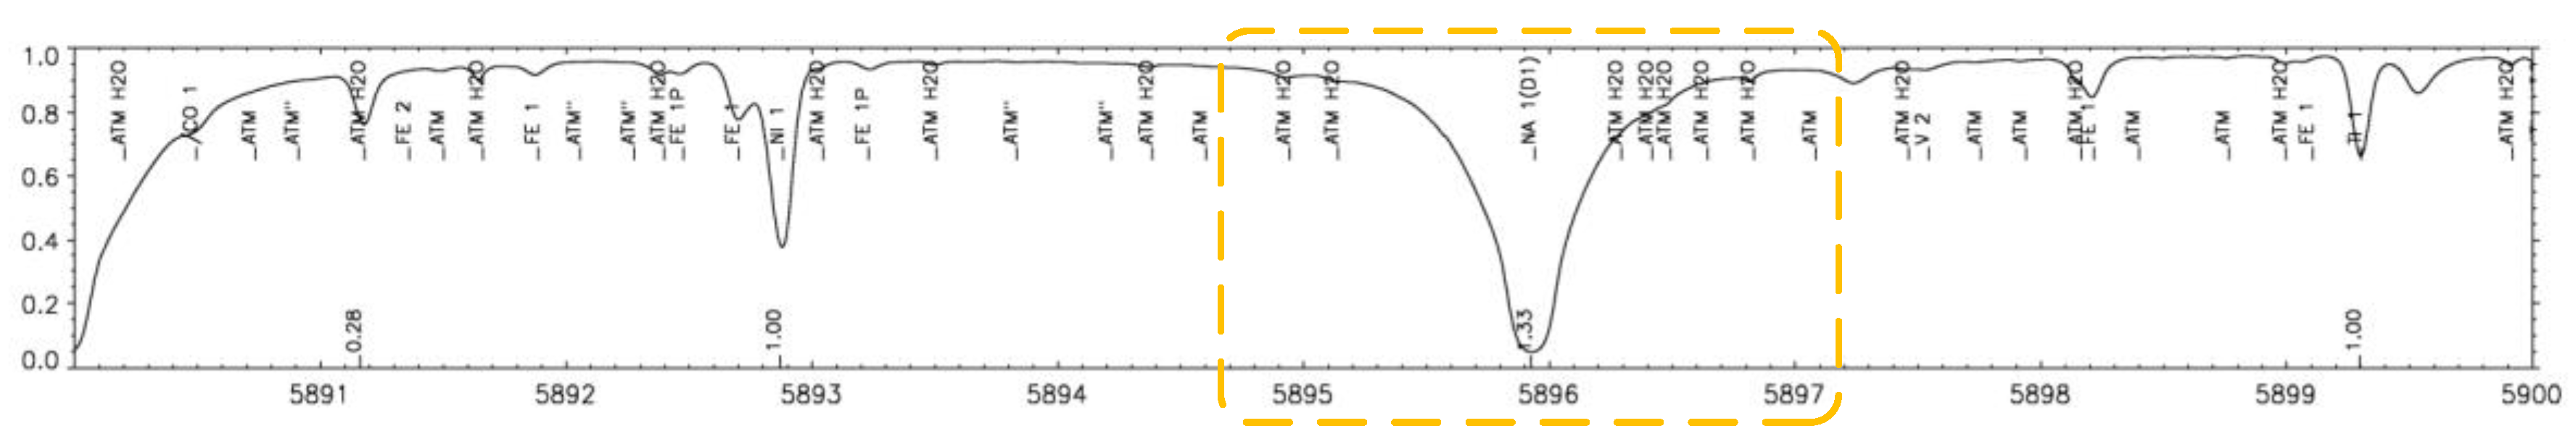
4.3. Selection of Measurement Spectrum Segment
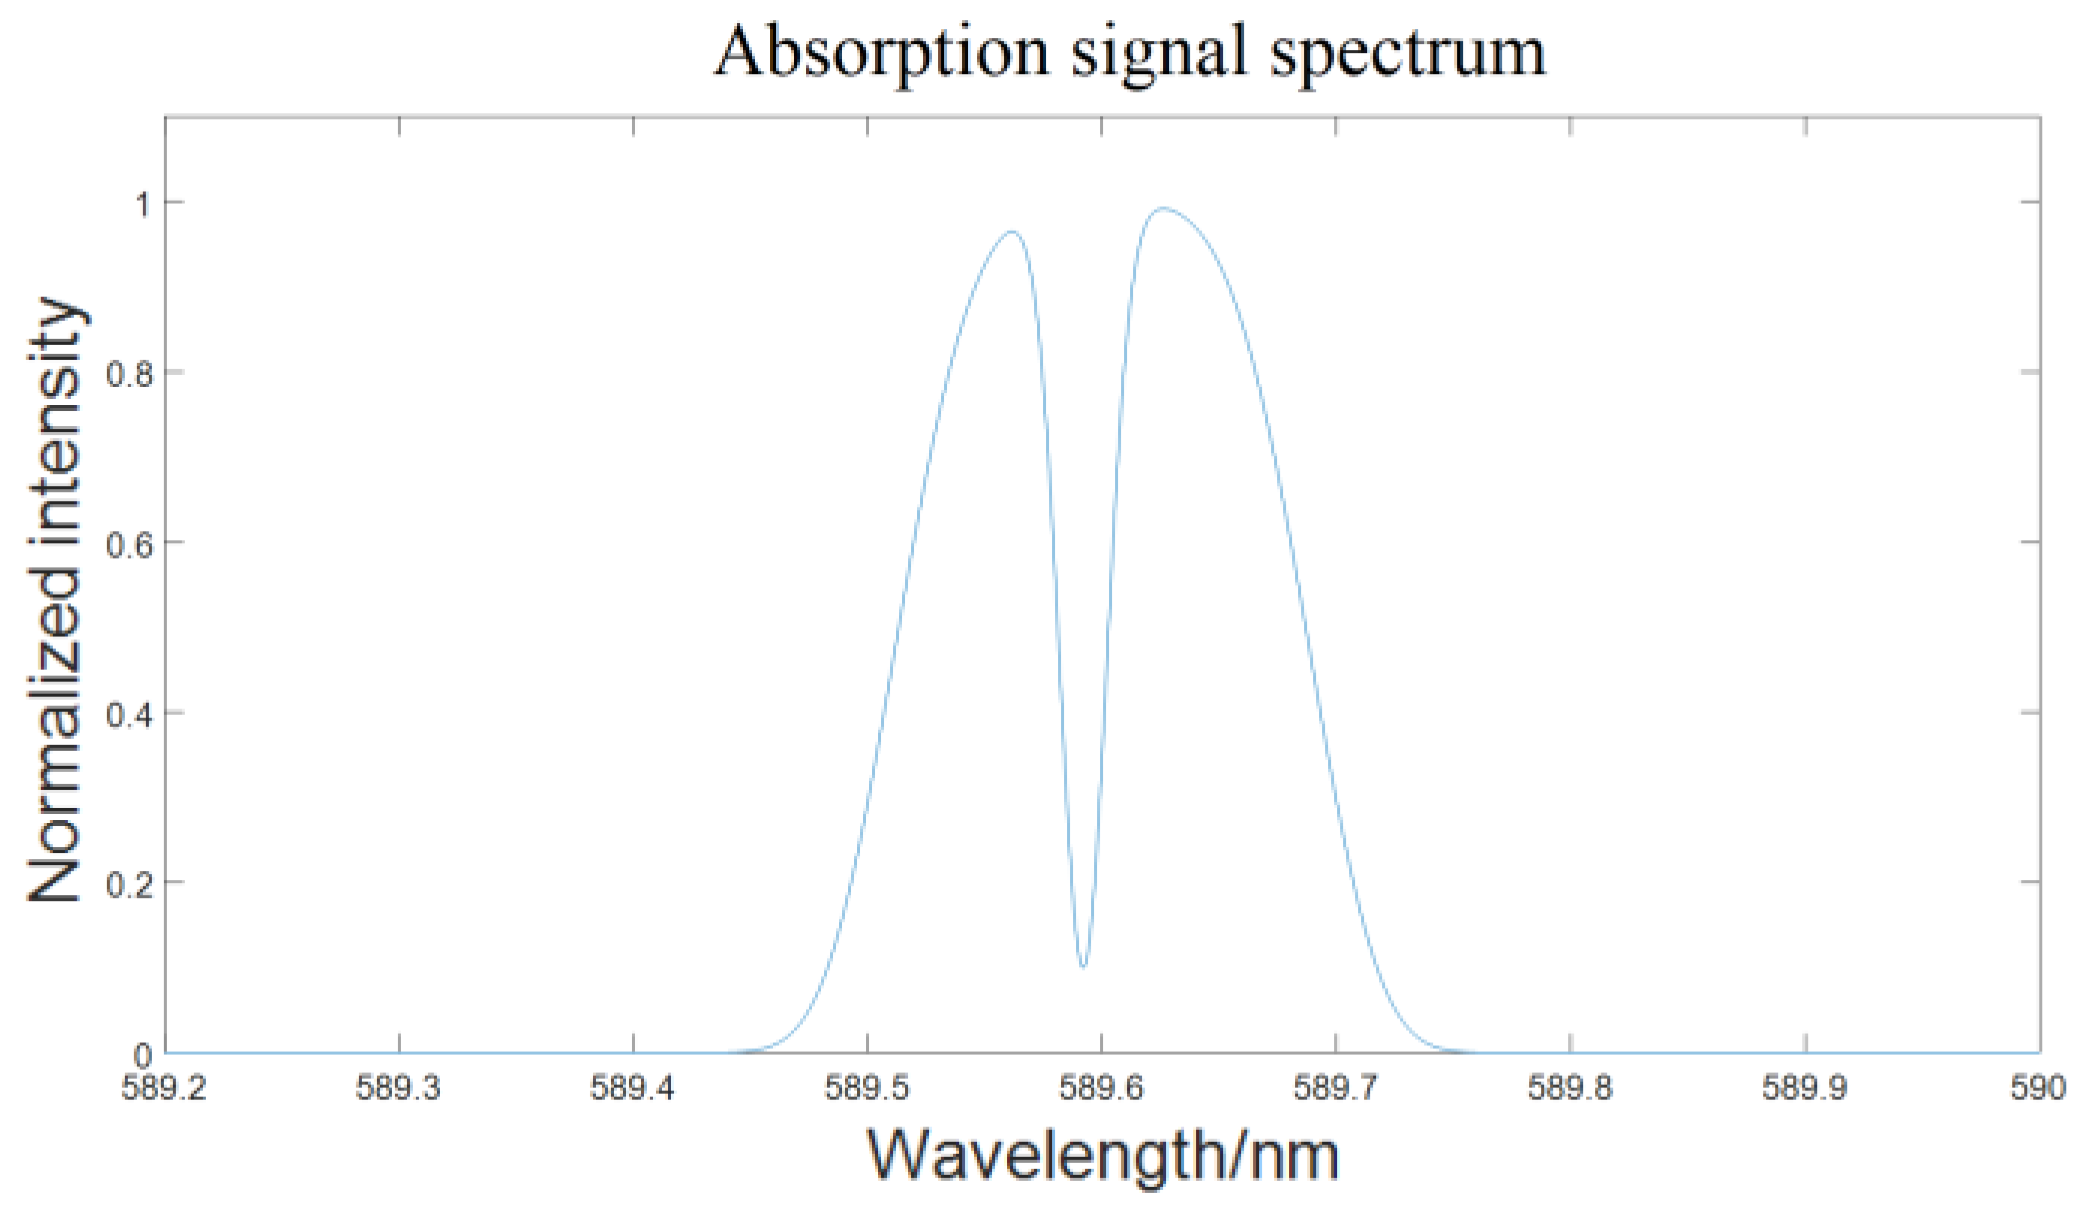
According to the blackbody radiation energy spectrum curve corresponding to the effective temperature of the solar surface (about 5800 K), it is recommended to select characteristic spectral lines in the range of 5000-7000 Å as the measurement target. Considering the technical principle requirements of the BLSE method, which involves a relatively single and deep absorption peak, we selected the spectral band around the sodium element (Na) absorption line at 589.6 nm in the solar spectrum for measurement, as shown in
Figure 8. At the same time, the central wavelength of the monochromator was set to 589.6 nm, and the output slit width was adjusted to 20 µm. The incident spectrum filtered by the monochromator is shown in
Figure 9.
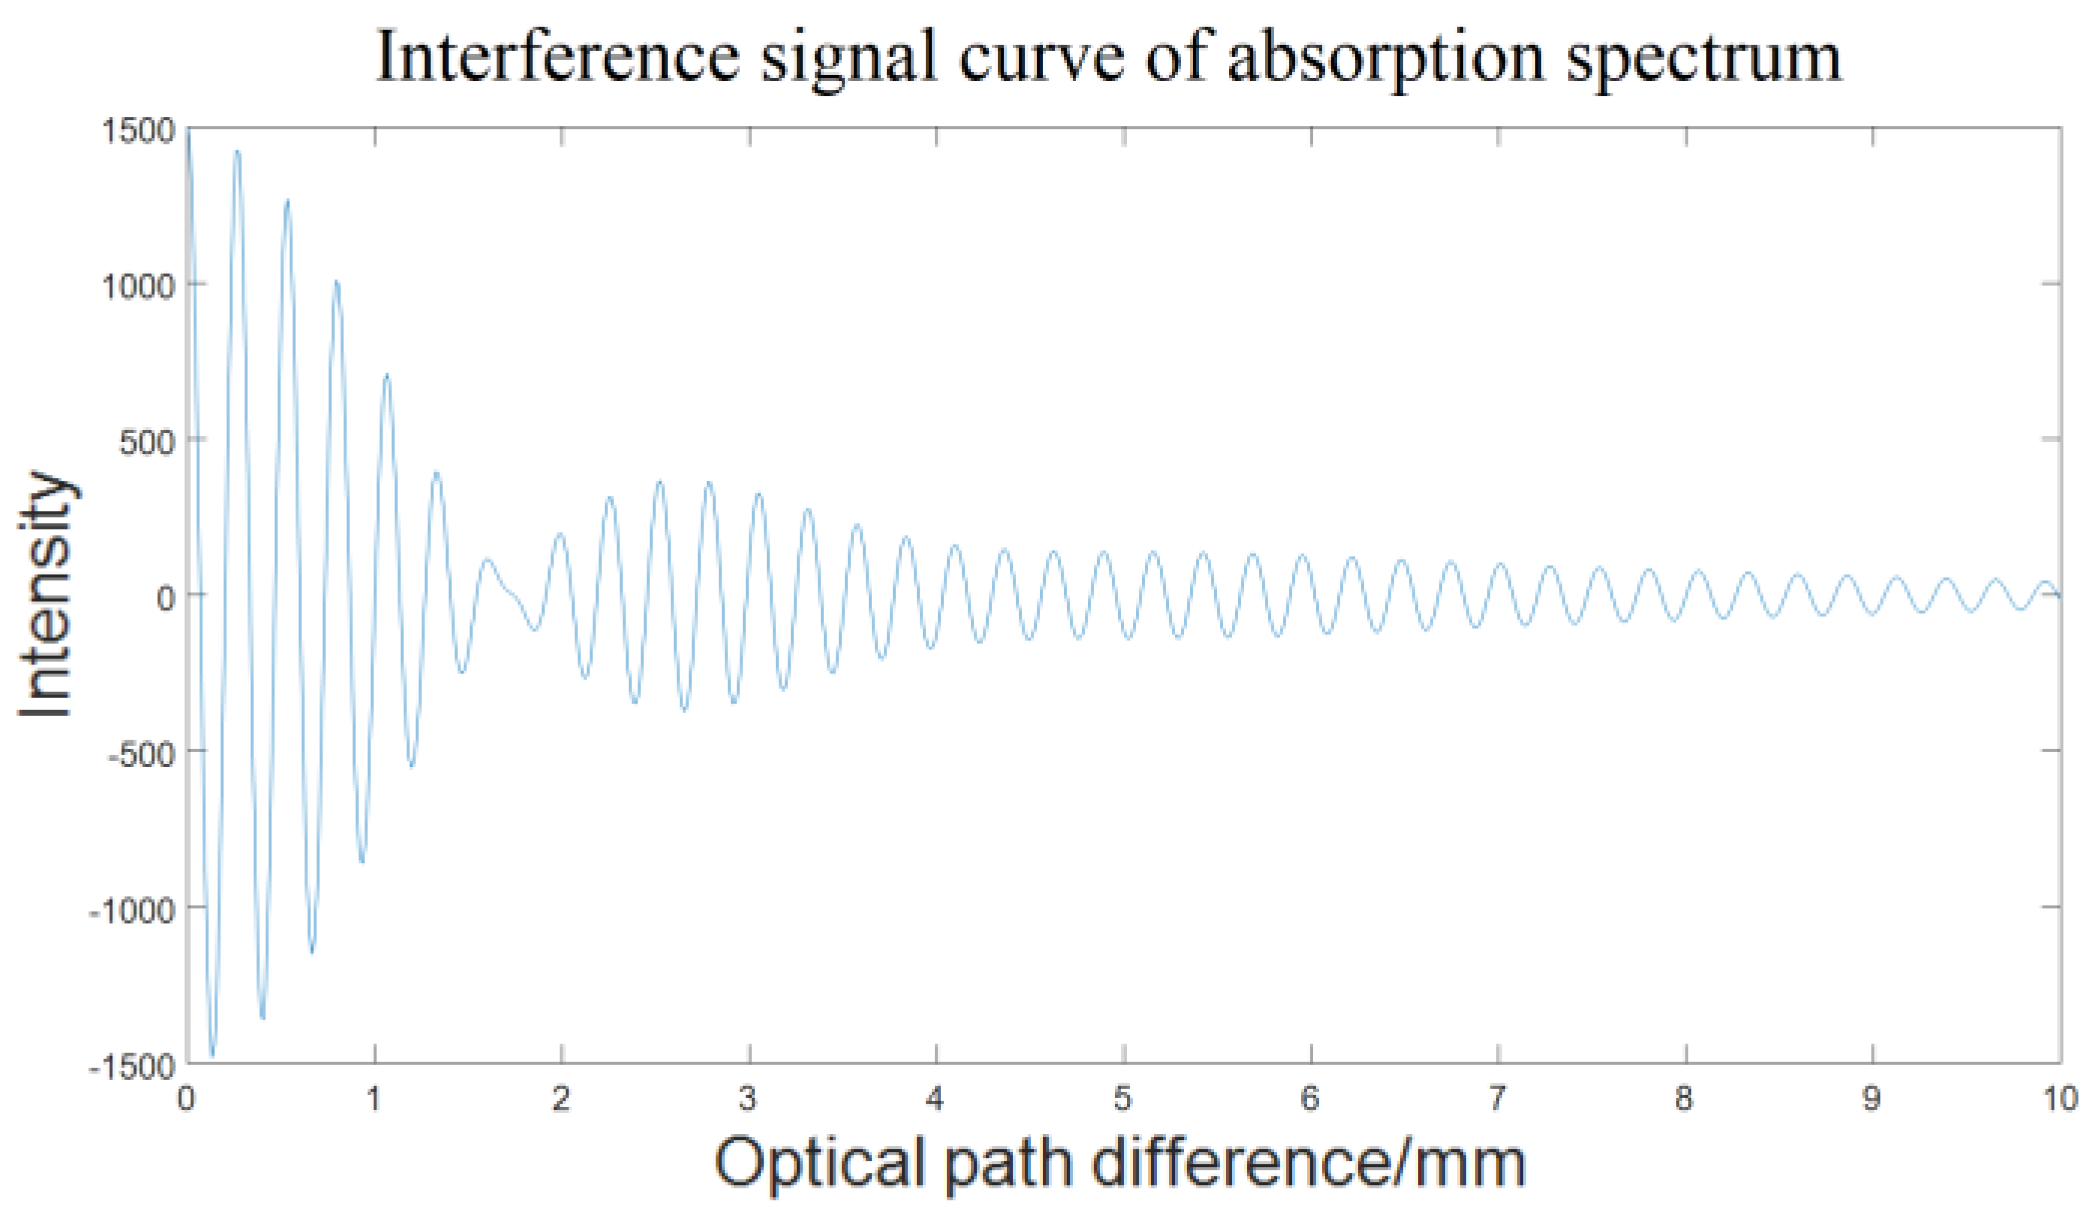
The interference signal waveform obtained by the incident spectrum sending to the DASH interferometer are shown in
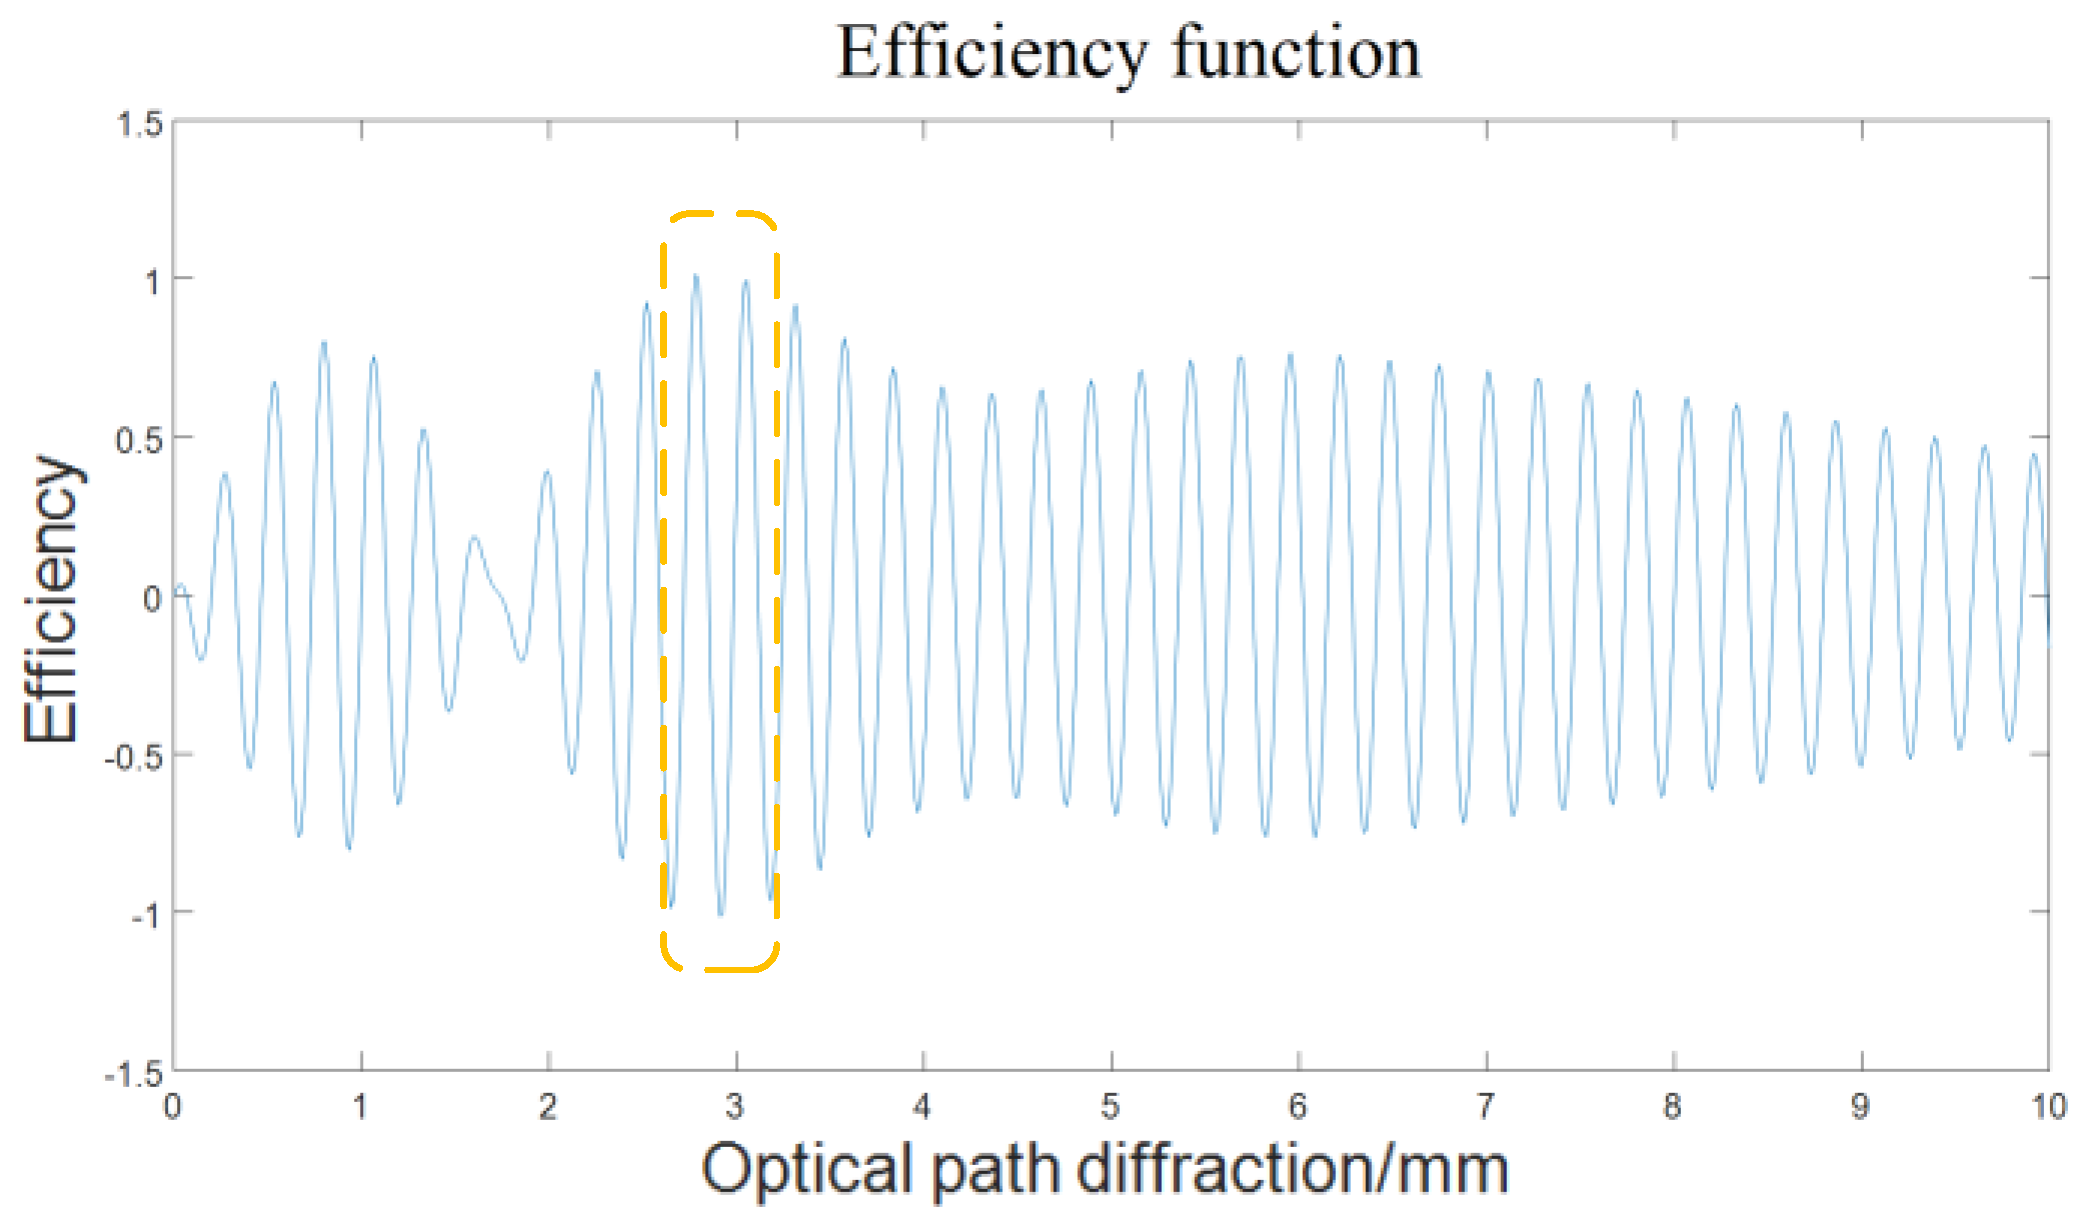
Figure 10 (disregarding the offset caused by the arm path difference). It can be seen that the contrast of the interference fringes changes significantly with the optical path difference. In order to obtain higher measurement sensitivity, according to the optimal optical path difference theory in spatial heterodyne spectral velocimetry technology, the optimal optical path difference is the value that maximizes the efficiency function
. The contrast
V(
L) can be replaced by the light intensity distribution of the interference fringes, and the efficiency function varies with the sampling optical path difference
L is shown in
Figure 11. Where the optical path difference corresponding to the maximum efficiency function profile is about 3 mm, so the single arm offset of the DASH interferometer in the verification experiment is set to 1.5 mm, and the other basic parameters of the DASH interferometer are shown in
Table 3.
5. Experimental Data Processing and Analysis
After completing the preliminary debugging of various equipment components, formal field experimental observations can be carried out. Firstly, it is necessary to enable the equatorial mount to track the sun stably, and achieve the gaze of the observation telescope towards the sun. Then set the filter center of the monochromator to 589.6 nm and the slit width to 20 µm, adjust the optical path to obtain interference fringes. After that, set the exposure time of detection camera to 0.3 seconds, and continuously collect 100 frames of interferograms for each set of data. Perform data acquisition operations according to the steps described in
Section 4.1. However, due to cost constraints and engineering difficulties, a vacuum cryogenic chamber was not equipped in the field experiment, which may cause more environmental noise affecting on the processing results.
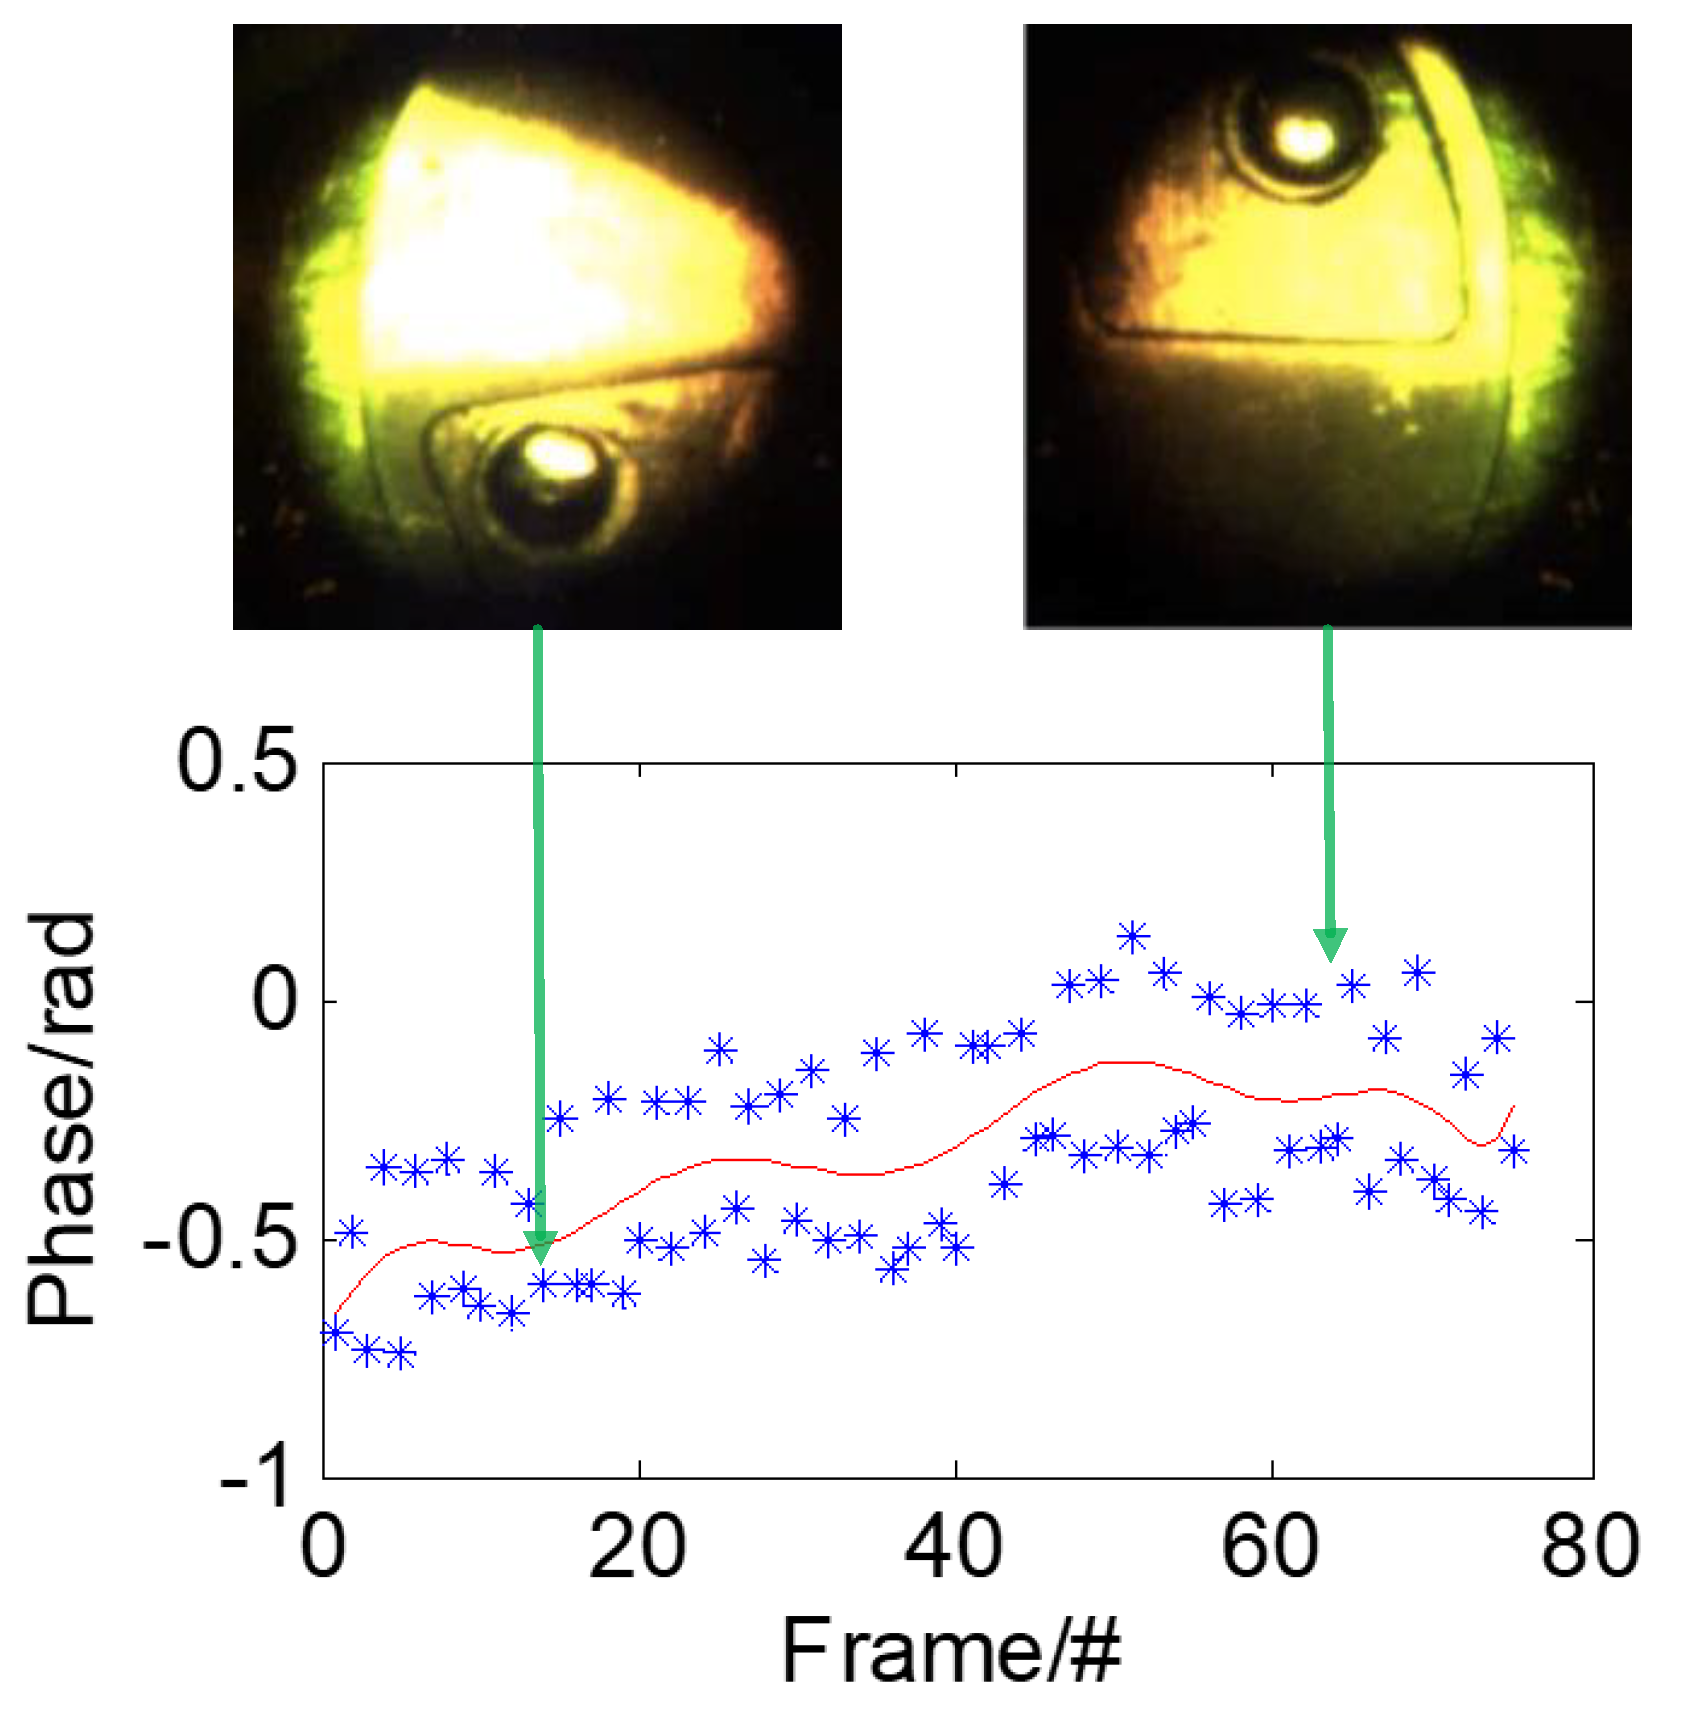
For each collected interference image: firstly filter out random noise, then extract interference fringe waveform data, next use the corresponding data processing algorithm to calculate the phase value of the center point, and remove data at edges after obtained the phase curve, at last use the remaining phase difference mean as the result value of the group. The phase changes curve with the solar monitoring image is shown in
Figure 12. By switching back and forth between different positions on the image plane, the resolved phase values maintain a relative difference while showing a changing trend due to environmental interference. The final processing results are shown in
Table 4, complete results can be seen in
Supplementary File.
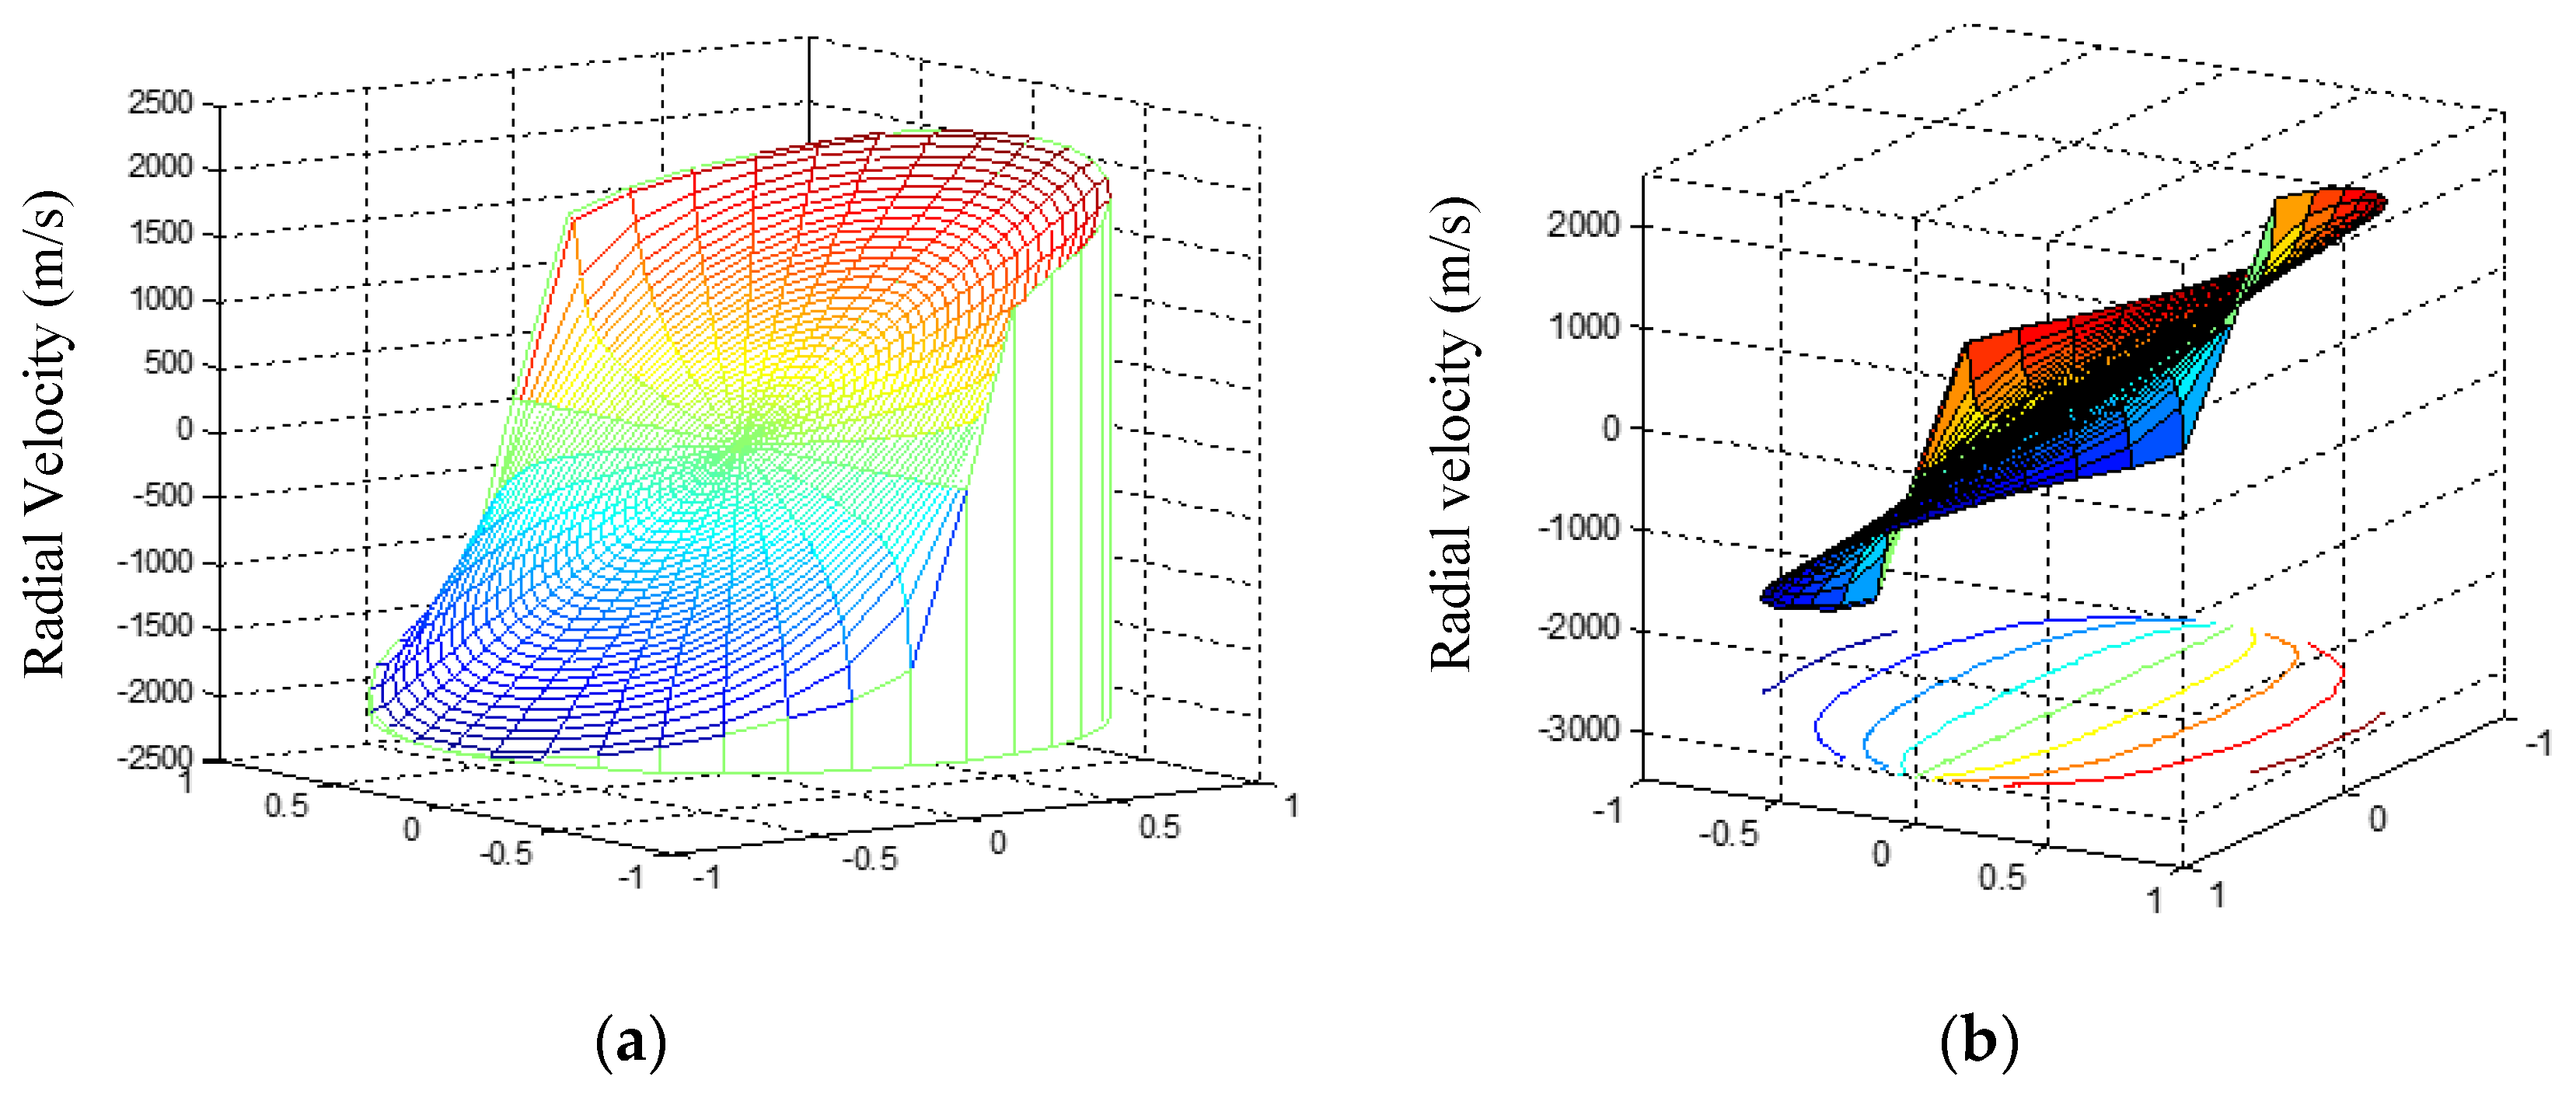
The radial velocity distribution of the solar surface on the day of the field experiment provided by Nanjing University Observatory is shown in
Figure 13, from which the radial velocity difference between any two points can be obtained. According to the latitude, longitude and altitude information of the data collection site (Urumqi, China), and converted the solar surface position corresponding to the imported point coordinates in the solar image plane monitoring system. Without considering the influence of various atmospheric activities on the solar surface, the theoretical radial velocity difference between the two positions was calculated to be 1977.56 m/s. It can be seen from
Table 4 that the average velocity value obtained after processing a total of 70 sets of data is 2066.75 m/s. Compared with the theoretical value of the sampling position, the measurement deviation of the field experiment is 89.19 m/s, and the mean standard deviation of the 70 sets of data is 55.26 m/s.
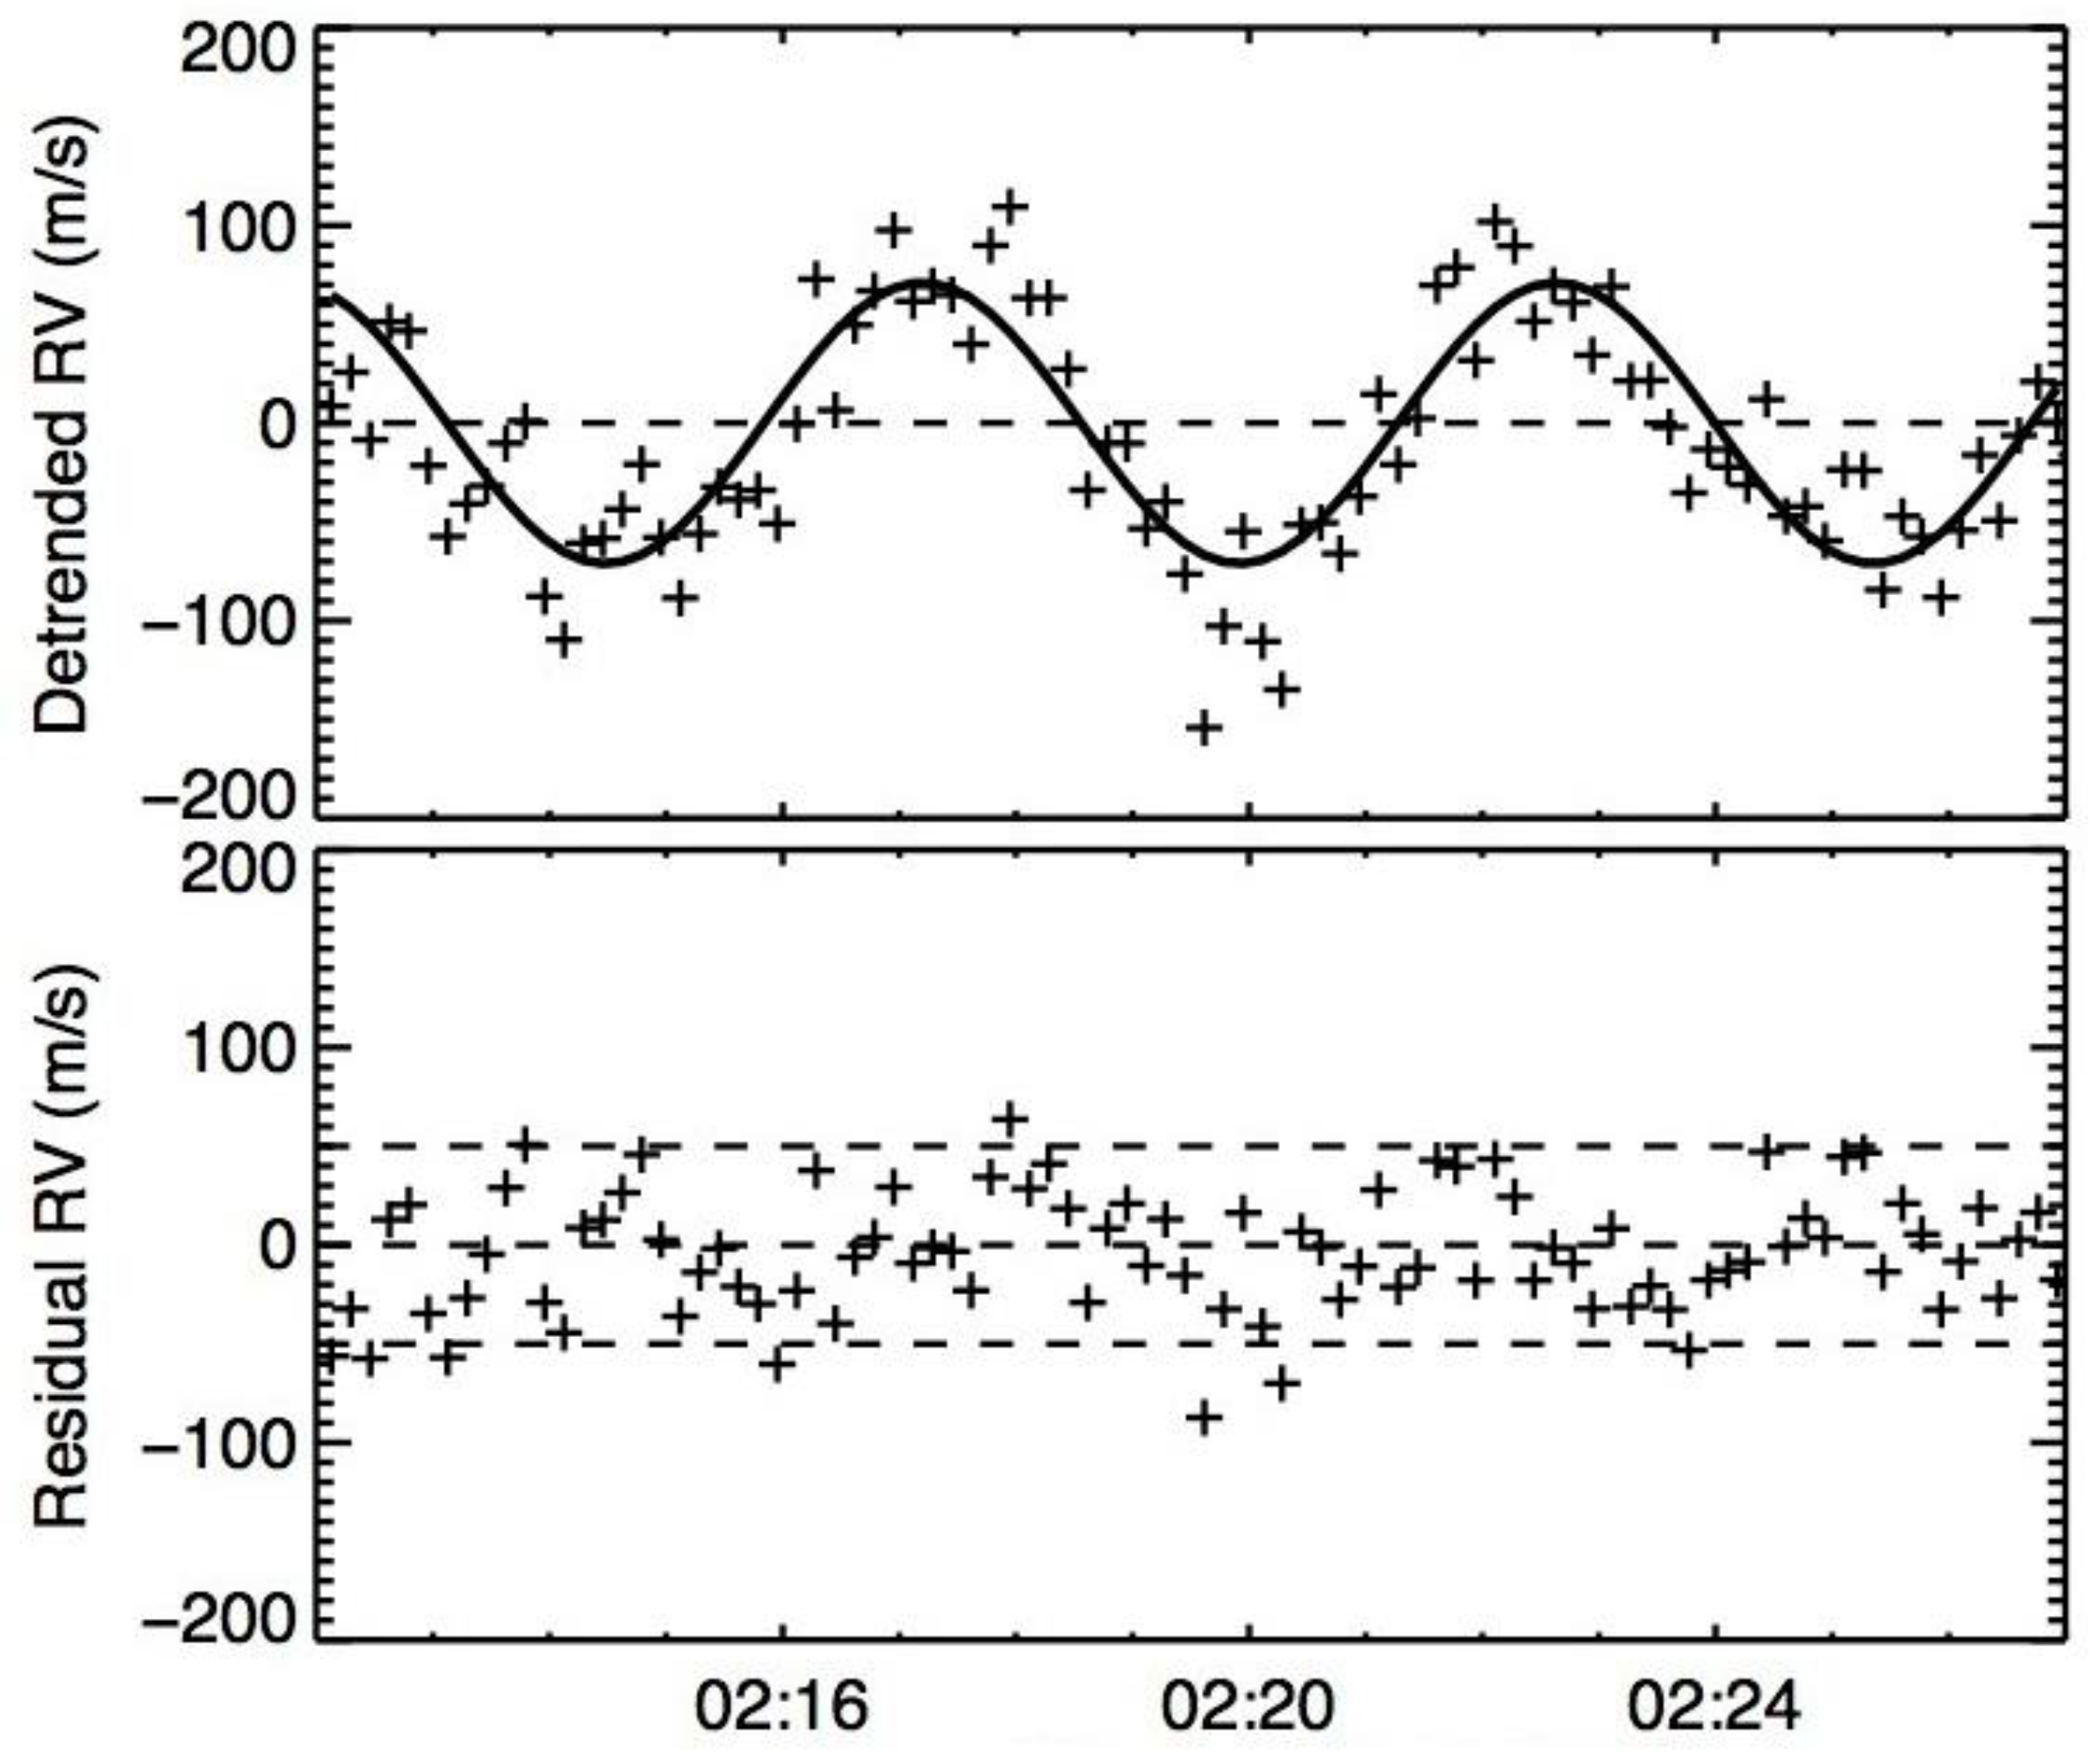
At the same time, we retrieved the observation data of the solar photosphere spectrum by the solar spectrum research team of Nanjing University based on the NVST. The team used the spectral Cross-Correlation Function (CCF) method to extract the radial velocity information of the spectral line, as shown in
Figure 14. It can be seen that the Doppler velocity distribution of the solar photosphere shows significant periodic changes, corresponding to the overall "5-minute oscillation" of the solar photosphere [
18]. After deducting this oscillation component, the remaining radial velocity is randomly distributed within the range of ±50 m/s, corresponding to the stability of the solar photosphere spectrum at the current observation level [
19].
From the processing results of the field experiment data, the systematic error of the measurement results is about 90 m/s, which corresponds to the offset that caused by the overall oscillation of the solar photosphere. And the random error is about 55 m/s, which is also consistent with the uncertainty of the solar photosphere spectrum in the limited observation environment. The author team evaluated that the measurement error of the field verification experiment scheme mainly comes from the following four aspects: a) instability of the target source; b) error of the measuring instrument; c) noise interference in outdoor experiment environment; d) analytical error of data processing algorithm (including data truncation error caused by A/D conversion) [
20].
It is worth explaining that although the measurement results obtained by the verification experiment used in this article seem to be insufficient and cannot reach the accuracy order shown in
Table 2, the two should not be directly compared on an equal level. Large ground-based telescopes collect huge amount of data and have redundancy in processing time, the processing result actually is the stable average value of the target over a relatively long period of time, thus could obtain a smaller error. The measurement data of
Table 4 in the field experiment, apart from external factors such as poor environmental conditions and not precise enough equipment construction, which have relatively small data width and processing time, and the spatial and temporal stability of the source data are both worse, resulting in relatively larger measurement errors. On the other hand, the size of the core optical components used in the verification scheme experiment introduced in this article is much smaller than that of traditional astronomical observation equipment. Therefore, it can be considered that the deep space exploration spectral velocimetry implementation plan given in this article still maintains the same level of measurement accuracy as a large ground-based telescope (compared with NVST), under the premise of instrument miniaturization and quasi real-time processing.
6. Conclusions
This paper mainly studies the feasibility of applying the newly proposed spatial heterodyne spectral velocimetry technology to the field of autonomous navigation of deep space exploration, and focuses on the implementation of miniaturized velocimetry instruments for stellar absorption spectra. This paper analyzes the principle of achieving high measurement accuracy with spatial heterodyne spectral velocimetry technology, aiming to solve the adaptability problem of this technology for absorption spectral target sources under the premise of instrument miniaturization.
Based on the principle of the BLSE method, the author team innovatively proposed a construction framework and steps for engineering verification, as well as a method for generating the velocity to be measured and selecting the measurement spectrum in the ground simulation field experiment. Furthermore, verified the actual measurement accuracy of the space heterodyne spectral velocimetry technology for the solar absorption spectrum through the specific experiments. The experimental results indicate that, under the current limited experimental environment and conditions, a miniaturized DASH interferometer combined with the relevant measurement scheme can obtain the observation results of the sun that match large ground-based astronomical telescope. Therefore, it can be considered that the research results of this article can to a certain extent verify the theoretical model of the spatial heterodyne spectral velocimetry technology and the feasibility of miniaturized aerospace detection instruments for future deep space exploration scenarios. Through the research of this article, it is believed that it can provide guidance for the further application and expansion of spatial heterodyne spectral velocimetry technology in the future aerospace field.
Although the research work in this paper has sorted out the basic principles and technical routes of applying spatial heterodyne spectral velocimetry technology to stellar absorption spectra, there are still many deficiencies in the experimental verification effect due to limited experimental costs and engineering capabilities. In future engineering applications, it is necessary to improve the integration of optical components, the environmental noise control capabilities, the contrast enhancement of generated interference fringes, and more accurate calibration methods for stellar light sources.
Supplementary Materials
The following supporting information can be downloaded at the website of this paper posted on
Preprints.org.
Author Contributions
Conceptualization, X.P. and M.G.; methodology, X.P.; software, X.P.; validation, X.P. and Q.R.; formal analysis, S.L.; investigation, X.P.; resources, R.Z.; data curation, X.P.; writing—original draft preparation, X.P.; writing—review and editing, M.G.; visualization, X.P.; supervision, Q.R.; project administration, X.P.; funding acquisition, X.P. and R.Z. All authors have read and agreed to the published version of the manuscript.
Funding
This research was funded by the National Natural Science Foundation of China (NSFC) under Grant No. 42304192, the Science and Technology Talents Project of Sichuan Outstanding Youth under Grant No. 2022JDJQ0027.
Data Availability Statement
Acknowledgments
This research was supported by the West Light Project of the Chinese Academy of Sciences. This research was also supported by the Special Talents Project of Organization Department of Sichuan Provincial Party Committee.
Conflicts of Interest
The authors declare no conflict of interest.
References
- Y.P. Guo. Self-contained autonomous navigation system for deep space missions [C]. In: AAS/AIAA Space Flight Mechanics Meeting, Breckenridge, Colorado, USA, 7-9 February 1999.
- W. You; W. Zhang; G.F. Ma. Analysis on error propagation in velocity vector synthesis of deep-space celestial autonomous navigation based on radial velocity measurement [J]. Journal of Chinese Inertial Technology 2017, 25(3), pp. 338-342. [CrossRef]
- Lathuillère C; Menvielle M; Lilensten J; et al. From the Sun’s atmosphere to the Earth’s atmosphere: an overview of scientific models available for space weather developments [J]. Annales Geophysicae 2017, 20(7), pp. 1081-1104. [CrossRef]
- Y. Li; M.D. Ding; Y. Guo; et al. On the Nature of the Extreme-Ultraviolet Late Phase of Solar Flares [J]. The Astrophysical Journal 2014, 793(2), pp. 1458-1466. [CrossRef]
- J.P. Li; A.H. Zhou; X.D. Wang. Study of temporal evolution of emission spectrum in a steeply rising submillimeter burst [J]. Research in Astronomy and Astrophysics 2015, 16(1), pp. 67-72. [CrossRef]
- Englert C.R.; Harlander J.M.; Babcock D.D.; et al. Doppler asymmetric spatial heterodyne spectroscopy (DASH): an innovative concept for measuring winds in planetary atmospheres [C]. In: Atmospheric Optical Modeling Measurement and Simulation II, San Diego, California, USA, 15-16 August 2006.
- Englert C.R.; Babcock D.D.; Harlander J.M. Doppler asymmetric spatial heterodyne spectroscopy (DASH): concept and experimental demonstration [J]. Applied optics 2007, 46(29), pp. 7297–7307. [CrossRef]
- Mierkiewicz E.J.; Roesler F.L.; Harlander J.M.; et al. First light performance of a near-UV spatial heterodyne spectrometer for interstellar emission line studies [C]. In: Ground-based Instrumentation for Astronomy, Glasgow, Scotland, United Kingdom 21-25 June, 2004.
- Sunghoon J.; Sub C.S. Gravitational-Wave Fringes at LIGO: Detecting Compact Dark Matter by Gravitational Lensing [J]. Physical review letters 2019, 122(4), 041103. [CrossRef]
- X. Peng; E.H. Liu; S.L. Tian; et al. Signal model analysis of asymmetric spatial heterodyne spectral velocimetry [C]. Proc. SPIE 12781(2F):1-9, In: International Conference on Opto-electronic Information and Functional Materials, Guangzhou, China, 10-12 March, 2023.
- Harlander J.M.; Englert C.R.; Babcock D.D.; et al. Design and laboratory tests of a Doppler Asymmetric Spatial Heterodyne (DASH): interferometer for upper atmospheric wind and temperature observations [J], Optics Express 2010, 18(25), pp. 26430-26440. [CrossRef]
- Englert C.R.; Harlander J.M.; Emmert J.T.; et al. Initial ground-based thermospheric wind measurements using Doppler Asymmetric Spatial Heterodyne spectroscopy (DASH) [J], Optics Express 2010, 18(26), pp. 27416-27430. [CrossRef]
- Englert C.R.; Harlander J.M.; Brown C.M.; et al. Spatial heterodyne spectroscopy at the Naval Research Laboratory [J], Applied Optics 2015, 54(31), pp. 158-163. [CrossRef]
- Z.W. Li; W. Xiong; H.L. Shi; et al. Study on Asymmetric Spatial Heterodyne Spectroscopy [J], Spectroscopy and Spectral Analysis 2016, 36(7), pp. 2291-2295.
- J. Shen; W. Xiong; H.L. Shi; et al. Data Processing Method of Asymmetric Spatial Heterodyne Interferogram for Wind Measurement [J], Spectroscopy and Spectral Analysis 2016, 36(9), pp. 3014-3019.
- H.Y. Luo; W. Xiong; H.L. Shi; et al. Study for Signal-to-Noise Ratio of Spatial Heterodyne Spectrometer [J], Acta Optica Sinica 2017, 37(6), pp. 1-7. [CrossRef]
- X. Peng; E.H. Liu; S.L. Tian; et al. Study of high-precision velocimetry technique based on absorption spectrum for deep space exploration [J]. Acta Astronautica 2022, 199, pp. 327-336. [CrossRef]
- D. Li; Q.M. Zhang; Y. Huang; et al. Quasi-periodic pulsations with periods that change depending on whether the pulsations have thermal or nonthermal components [J]. Astronomy & Astrophysics 2016, 597(1), L4. [CrossRef]
- C. Xing; H.C. Li; B. Jiang; et al. Two Types of Long-duration Quasi-static Evolution of Solar Filaments [J]. Astrophysical Journal 2018, 857(2), L14. [CrossRef]
- Harlander J.M.; Englert C.R.; Marr K.D.; et al. On the uncertainties in determining fringe phase in Doppler asymmetric spatial heterodyne spectroscopy, Applied Optics 2019, 58(13), pp. 3613-3619. [CrossRef]
|
Disclaimer/Publisher’s Note: The statements, opinions and data contained in all publications are solely those of the individual author(s) and contributor(s) and not of MDPI and/or the editor(s). MDPI and/or the editor(s) disclaim responsibility for any injury to people or property resulting from any ideas, methods, instructions or products referred to in the content. |
© 2024 by the authors. Licensee MDPI, Basel, Switzerland. This article is an open access article distributed under the terms and conditions of the Creative Commons Attribution (CC BY) license (http://creativecommons.org/licenses/by/4.0/).