
Submitted:
27 November 2024
Posted:
28 November 2024
You are already at the latest version
Abstract
Pregnant ewes are susceptible to hypoglycemia and ketosis; therefore, monitoring glycemic status is extremely important. Portable blood glucose meters (PBGM) can assist in quickly and conveniently identifying glycemic disturbances in this species, provided that they meet criteria demonstrating their analytical accuracy. This study evaluated the performance of a human PBGM (Accu-Chek Performa®, Roche Diagnostics, Basel, Switzerland), for glycemic evaluation of 34 pregnant ewes at 90 and 120 pregnancy days in comparison with glycemia determination by a reference method (RM). The device showed a high positive correlation (r = 0.71, 95%CI = 0.57 – 0.82, P < 0.0001) with the RM; however, 96.6% of the PBGM results (58.5 ± 9.82 mg/dL) were higher (P < 0.0001) than those obtained in the laboratory (48.6 ± 9.31 mg/dL). The PBGM tested was considered analytically inaccurate according to ISO 15197:2013 which states when glucose is <100 mg/dL, 95% of its measurements should not differ by more than 15 mg/dL from the RM value, while 1/3 of the PBGM results read up this limit. Hypoglycemia (< 50 mg/dL) was documented in 60.29% of samples measured by the RM, but only 17.64% read below 50 mg/dL in the PBGM. Due to these limitations, Accu-Check Performa® results should be interpreted cautiously in pregnant sheep suspected of hypoglycemia.
Keywords:
Sheep
; Blood Glucose
; AccuCheck Performa
; ISO 15197:2013
1. Introduction
Sheep had higher glucose demands in the gestational final third period, as well as due to twin pregnancy, in response to the accelerated fetal growth and limited ruminal capacity. The mammary gland development also accounts for increased glucose requirements. In some cases, glucose demands are not fully supplied to warrant normoglycemia (50-80 mg/dL) resulting in hypoglycemia, increased lipolysis, and eventual ketosis [1]. Peripartum glycemia monitoring helps identify metabolic disorders and can be considered a useful indicator of fetal viability [2].
Portable blood glucose meters (PBGMs) are often applied to glycemia determination in small animal clinical routines [3]. In ruminant medicine, PBGMs can be a useful tool for glucose homeostasis monitoring due to the quick results and cost reduction compared to shipping samples to a laboratory [4]. There is no specific PBGM for use in ruminants in the Brazilian market; however, several devices developed for human or veterinary use are available and validation studies for their accurate use in ruminants are warranted. In this way, this study aimed to evaluate the analytical precision of the human PBGM Accu-Chek Performa® to assess glycemia in pregnant sheep.
2. Materials and Methods
2.1. Animals and Procedures
Thirty-six pregnant sheep with no defined breed and mean body condition score of 3 (1-5) kept on the pasture system were included in the study by convenience. Blood samples were drawn at the gestation ages of 90 and 120 days by jugular venipuncture with a Vacutainer system with a 25 x 0.8 mm needle in two vacuum plastic tubes, one with sodium fluoride/EDTA and the other with coat activator and no anticoagulant.
Glycemia was determined immediately from the tube without anticoagulant after sampling with a human PBGM (Accu-Chek Performa®, Roche Diagnostics, Basel, Switzerland) as preconized by Raimondo et al. [5]. According to manufacturers, this device requires a minimum blood volume of 0.6 μL and their BG detection limits are 10 to 600 mg/dL. It operates without interference within the 10-65% hematocrit range. The test strip uses an enzymatic reaction of glucose dehydrogenase.
After coat retraction, samples were centrifugated at 700G for 15 minutes (Centrifuge 80-2b, Daiki®, Brazil) and the resultant serum was separated in microtubes aliquots and kept frozen at -20ºC until analysis. For analytical precision evaluation of the PBGM, glycemia results obtained with the portable device were compared with a reference method (RM - Glucose Kit, Labtest, Brazil) using an automatic biochemical analyzer (Labmax 240, Tokyo Boeki, Japan) at the Biochemistry Laboratory (Departamento de Clínica Médica, FMVZ, USP).
2.2. Statistical Analyses
Analytical accuracy was assessed according to the ISO 15197:2013 [6] requirements for human PBGMs [6]. For a PBGM to be considered accurate, two conditions must be met: 1) when glucose is <100 mg/dL, 95% of its measurements should not differ by more than 15 mg/dL from the RM value, and 2) when glucose is ≥100 mg/dL, 95% of its measurements should not differ by more than 15% from the RM value.
Statistical analyses were performed with the GraphPad Prism 6 software package (GraphPad Software Inc., San Diego, USA). Data normality was assessed by the Shapiro-Wilk test. The PBGM and RM results were compared using the paired t-test for accuracy assessment. The difference between these values was represented by the Bland-Altman plot [7]. Also, the Pearson coefficient was determined to assess the correlation between the results. Correlation coefficient values were interpreted as follows: 0.9-1, very high; 0.7-0.89, high; 0.5-0.69, moderate; 0.3-0.49, low, and 0-0.29, minimal correlation [8,9,10]. Differences were considered significant at P-value <0.05.
3. Results
3.1. Glycemic Range Categorization According to Each Measurement Method
According to the PBGM or RM reads, patients were classified as hypoglycemic (< 50mg/dL), normoglycemic (50-80 mg/dL), or hyperglycemic (> 80mg/dL) as suggested by Kaneko et al. [11]. Table 1 shows the number and percentage of patients considered in each glycemic range according to the glycemia determination method. Most samples were in the hypoglycemic range measured by the RM (60.29%); however, only 17.64% of the PBGM reads indicated hypoglycemia.
3.2. Inaccuracy of the PBGM Results Compared to the Reference Method
Only two samples (2.9%) showed PBGM results below RM, and one (1.5%) showed the same results in both methods. The other 65 samples (96.6%) read higher in the PBGM. The mean glucose values read by the PBGM (58.5 ± 9.82 mg/dL) were significantly higher (P < 0.0001) than the results obtained by the RM (mean = 48.6 ± 9.31 mg/dL) and are represented in Figure 1. This distortion leads to 4.41% of the samples measured in the PBGM indicating hyperglycemia (> 80 mg/dL); while no hyperglycemic value was documented in the RM.
Regarding analytical accuracy according to ISO 15197:2013 guidelines, 70.6% of them were within the acceptable ± 15 mg/dL absolute error range for samples below 100 mg/dL (Figure 2). The Pearson coefficient showed a high correlation (r = 0.71) between methods (95% confidence interval = 0.57 – 0.82, P < 0.0001).
4. Discussion
Despite the moderate to high correlation between evaluated methods [8,9,10] higher glycemia results read by the PBGM in the majority of tested samples represent a potential risk for hypoglycemia misdiagnosis in ewes since only two third of the samples were within the acceptable absolute error of 15 mg/dL preconized by the ISO 15197:2013 for samples below 100 mg/dL. To achieve ISO validation for analytic precision, a PBGM should have more than 95% of its reads within acceptable limits [6]. Notwithstanding, it is important to emphasize ISO recommendations for PBGM validation might not be completely valid for glycemia evaluation in ruminants. A < 15 mg/dL bias in animals in which normal glycemia ranges between 50-80 mg/dL [11] may be enough to cause diagnostic errors as evidenced in our study, since from the 41 samples considered hypoglycemic by the RM, about 70% were read as normoglycemic by the PBGM.
According to the PBGM manufacturer, this device operates without hematocrit interference in humans with packet cell volumes between 10 and 65%. Despite not being evaluated in this study, ewes’ hematocrit often ranges between 28-33% during pregnancy, within the reference range for the species and no effect of pregnancy on hematocrit leading to hemodilution is recognized in ewes [12,13]. The smaller the number of erythrocytes in a whole blood sample, the higher the volume of plasma that penetrates the test strip reagent layer, leading to inaccurate results. Thus, hemodilution produces higher glycemic values, while hemoconcentration leads to lower values in PBGMs [14].
Quick blood sample centrifugation after sampling is crucial to avoid time interference in the glycemia results obtained by the reference method. Despite the inhibitory effect of sodium fluoride within EDTA tubes on glycolysis, the process is not completely interrupted. Without glycolysis inhibition by the anticoagulant, glycemia may reduce by 5 - 7% per hour within the sample while waiting to be centrifugated due to erythrocyte metabolism [15].
An absolute variation greater than 10% was documented in 33% of the samples in a study evaluating PBGM precision in ruminants, including sheep. The same survey showed a variation greater than 20% in 10% of the ewes’ samples [16]. Despite these results not fulfilling ISO standards for analytical accuracy, the PBGM was considered proper for use in the field. Moreover, total blood samples may provide different results compared with plasma [17]; however, the practicality of PBGM use in stockyard precludes total blood use, and comparisons with reference methods are often made in plasma samples.
5. Conclusions
In this way, a desirable PBGM should provide quick and accurate results to provide a correct diagnosis and metabolic monitoring of common conditions in pregnant ewes, such as hypoglycemia and pregnancy ketosis. The minimal blood sample volume required to obtain sheep’s glycemia using PBGM is also an advantage of these devices. However, caution should be applied when interpreting glycemic results in ewes suspected of being hypoglycemic, since the tested device may perform poorly for hypoglycemia detection in this species. In agreement with the ISO requirements not being fully applicable to ruminant glycemia validation, the inconsistency herein reported supports the assumption the PBGM Accu-Check Performa was not analytically accurate for hypoglycemia detection in pregnant ewes and it may be associated with serious misdiagnosis. Therefore, its usefulness in stockyards to confirm hypoglycemia should be contraindicated, since subclinical mild hypoglycemias may not be detected soon, predisposing pregnant ewes to more severe hypoglycemias near pregnancy end.
Author Contributions
JSXL and AGP were responsible for data analysis, statistical analysis, writing, and manuscript reviewing. RFSR and BRC were responsible for raising financial resources, experimental design, and sample collection, LRJ was responsible for sample collection and data planning, and CSM was responsible for laboratory analyses. All authors critically reviewed the manuscript and approved the final version.
Funding
This research received no external funding.
Institutional Review Board Statement
The methods employed in this study were ethically approved by the ethics committee for animal use at the Federal University of Rio Grande do Sul, under protocol no. 37518.
Data Availability Statement
Materials and data sheets are available upon request to interested researchers
Acknowledgments
The authors would like to thank the “Programa de Ações em Endocrinologia Veterinária (PetEndocrine)” from the Universidade Federal do Rio Grande do Sul for supporting this manuscript.
Conflicts of Interest
The authors declare no conflict of interest.
References
- Radostits, O.M.; Gay, C.C.; Hinchcliff, K.W.; Constable, P.D. Veterinary Medicine: A Textbook of the Diseases of Cattle, Horses, Sheep, Pigs and Goats; Elsevier Saunders: London, UK, 2007; pp. 966–994. [Google Scholar]
- Lima, M.S.; Pascoal, R.A.; Stilwell, G.T. Glycaemia as a sign of the viability of the foetuses in the last days of gestation in dairy goats with pregnancy toxaemia. Ir Vet J 2012, 65, 1. [Google Scholar] [CrossRef] [PubMed]
- Moresco, M.B.; Matesco, V.C.; Martins, F.S.d.M.; Carvalho, G.L.C.d.; Schaefer, G.d.C.; Nunes, N.J.d.S.; Valle, S.d.F.; Pöppl, Á.G. Accuracy evaluation of two portable blood glucose meters in feline patients using whole blood samples. Ciência Rural 2023, 53. [Google Scholar] [CrossRef]
- Carvalho, J.S.; Jesus, T.K.S.d.; Delfino, G.d.O.A.; Santos, P.V.d.M.; Passos, H.S.; Soares, L.L.d.S.; Araújo, C.A.S.C.d.; Ulian, C.M.V.; Soares, P.C.; Rizzo, H. Validação do medidor portátil Freestyle® Optium Neo na determinação de glicose em ovelhas com gestação simples e gemelar. Revista Agraria Academica 2020, 3, 119–127. [Google Scholar] [CrossRef]
- Raimondo, R. F. S.; Yasuoka, M.M.; Miyiashiro, S.I.; Hagiwara, M.K.; Birgel, E.H. Uso de sensor portátil para a mensuração de glicose e β-hidroxibutirato no sangue de bovinos leiteiros. In Proceedings of the IX Congresso Brasileiro Buiatria, Goiânia – Goiás, Brazil, 4-7 october 2011. Vet e Zootec.2011, v.18, n.4 (Supl. 3), p.389 – 394. [Google Scholar]
- International Organization For Standardization. In Vitro Diagnostic Test Systems Requirements for Blood Glucose Monitoring Systems for Self-testing in Managing Diabetes Mellitus; European Committee for Standardization (CEN): Brussels, 2013. Available online: https://www.iso.org/standard/54976.html (accessed on 20 November 2023).
- Martin Bland, J.; Altman, D. Statistical methods for assessing agreement between two methods of clinical measurement. The Lancet 1986, 327, 307–310. [Google Scholar] [CrossRef]
- Johnson, B.M.; Fry, M.M.; Flatland, B.; Kirk, C.A. Comparison of a human portable blood glucose meter, veterinary portable blood glucose meter, and automated chemistry analyzer for measurement of blood glucose concentrations in dogs. J Am Vet Med Assoc 2009, 235, 1309–1313. [Google Scholar] [CrossRef] [PubMed]
- Domori, A.; Sunahara, A.; Tateno, M.; Miyama, T.S.; Setoguchi, A.; Endo, Y. The clinical utility of two human portable blood glucose meters in canine and feline practice. Vet Clin Pathol 2014, 43, 55–62. [Google Scholar] [CrossRef] [PubMed]
- Mori, A.; Oda, H.; Onozawa, E.; Shono, S.; Takahashi, T.; Yamashita, S.; Fujimoto, H.; Sako, T. Evaluation of portable blood glucose meters using canine and feline pooled blood samples. Pol J Vet Sci 2016, 19, 707–713. [Google Scholar] [CrossRef] [PubMed]
- Kaneko, J. J.; Harvey, J.W.; Bruss, M.L. Clinical biochemistry of domestic animals; Academic Press: San Diego, USA, 2008; 916p. [Google Scholar]
- Bezerra, L.R.; Oliveira, W.D.C.; Silva, T.P.D.; Torreão, J.N.C.; Marques, C.A.T.; Araújo, M.J.; Oliveira, R.L. Comparative hematological analysis of Morada Nova and Santa Inês ewes in all reproductive stages. Pesquisa Veterinária Brasileira 2017, 37. [Google Scholar] [CrossRef]
- Santarosa, B.P.; Dantas, G.N.; Ferreira, D.O.L.; Hooper, H.B.; Porto, A.C.R.C.; Garcia, S.M.F.C.; Surian, S.R.S.; Pieruzzi, P.A.P.; Silva, A.A.d.; Gonçalves, R.C. Comparison of hematological parameters between single and twin pregnancies in Dorper ewes during gestation, lambing, and postpartum. Ciência Rural 2022, 52. [Google Scholar] [CrossRef]
- Ramljak, S.; Lock, J.P.; Schipper, C.; Musholt, P.B.; Forst, T.; Lyon, M.; Pfützner, A. Hematocrit interference of blood glucose meters for patient self-measurement. J Diabetes Sci Technol 2013, 7, 179–189. [Google Scholar] [CrossRef] [PubMed]
- Chan, A.Y.; Swaminathan, R.; Cockram, C.S. Effectiveness of sodium fluoride as a preservative of glucose in blood. Clinical Chemistry 1989, 35, 315–317. [Google Scholar] [CrossRef] [PubMed]
- Katsoulos, P.D.; Minas, A.; Karatzia, M.A.; Pourliotis, K.; Christodoulopoulos, G. Evaluation of a portable glucose meter for use in cattle and sheep. Veterinary Clinical Pathology 2011, 40, 245–247. [Google Scholar] [CrossRef]
- Kuwa, K.; Nakayama, T.; Hoshino, T.; Tominaga, M. Relationships of glucose concentrations in capillary whole blood, venous whole blood and venous plasma. Clin Chim Acta 2001, 307, 187–192. [Google Scholar] [CrossRef] [PubMed]
Figure 1.
Paired comparison of glycemia results obtained using a portable blood glucose meter designed for human use (Accu-Check Performa) or a laboratory reference method in pregnant ewes at 90 and 120 pregnancy days.
Figure 1.
Paired comparison of glycemia results obtained using a portable blood glucose meter designed for human use (Accu-Check Performa) or a laboratory reference method in pregnant ewes at 90 and 120 pregnancy days.
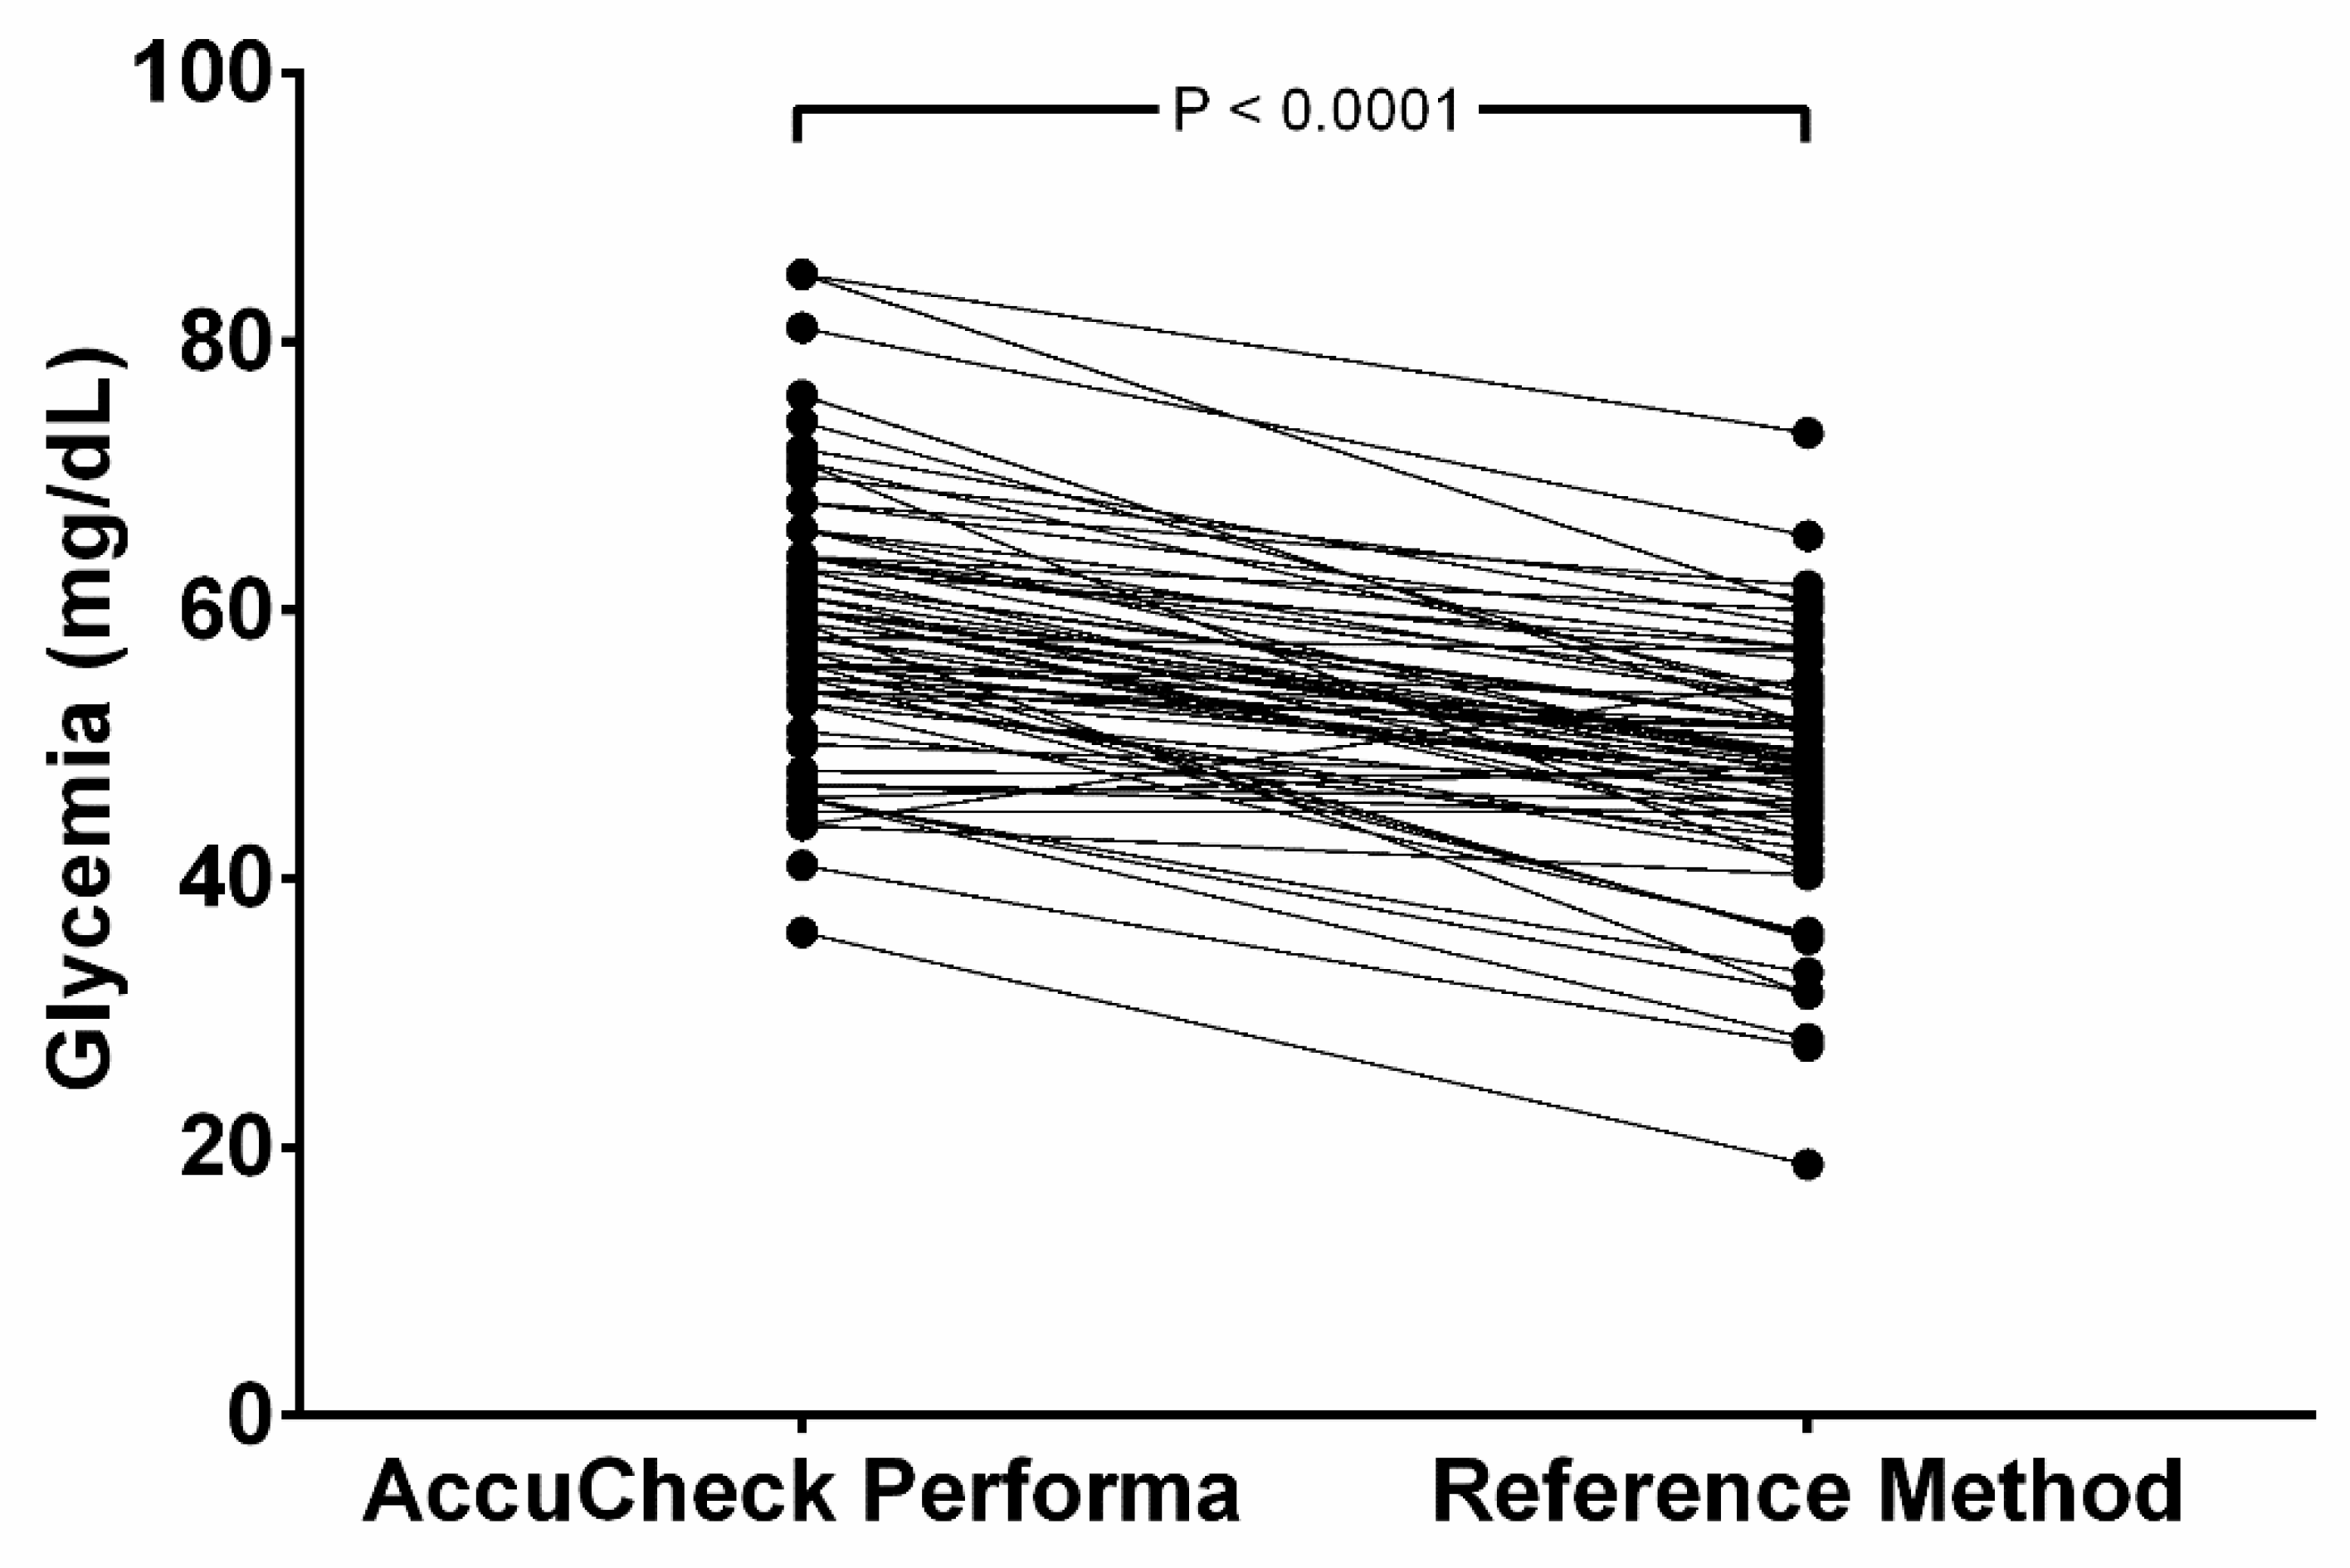
Figure 2.
Bland-Altman plot of the portable blood glucose meters (PBGM) Accu-Check Performa measurements evaluated in pregnant ewes at 90 and 120 pregnancy days. Glycemic values determined by the reference method (RM) are represented on the x-axis and the corresponding absolute difference between glycemia determined by the PBGM and the RM is represented on the y-axis. Red lines express the limits defined by ISO 15197:2013 for analytical accuracy. A PBGM should have no more than 5% of its reads outside the established limit to be considered accurate.
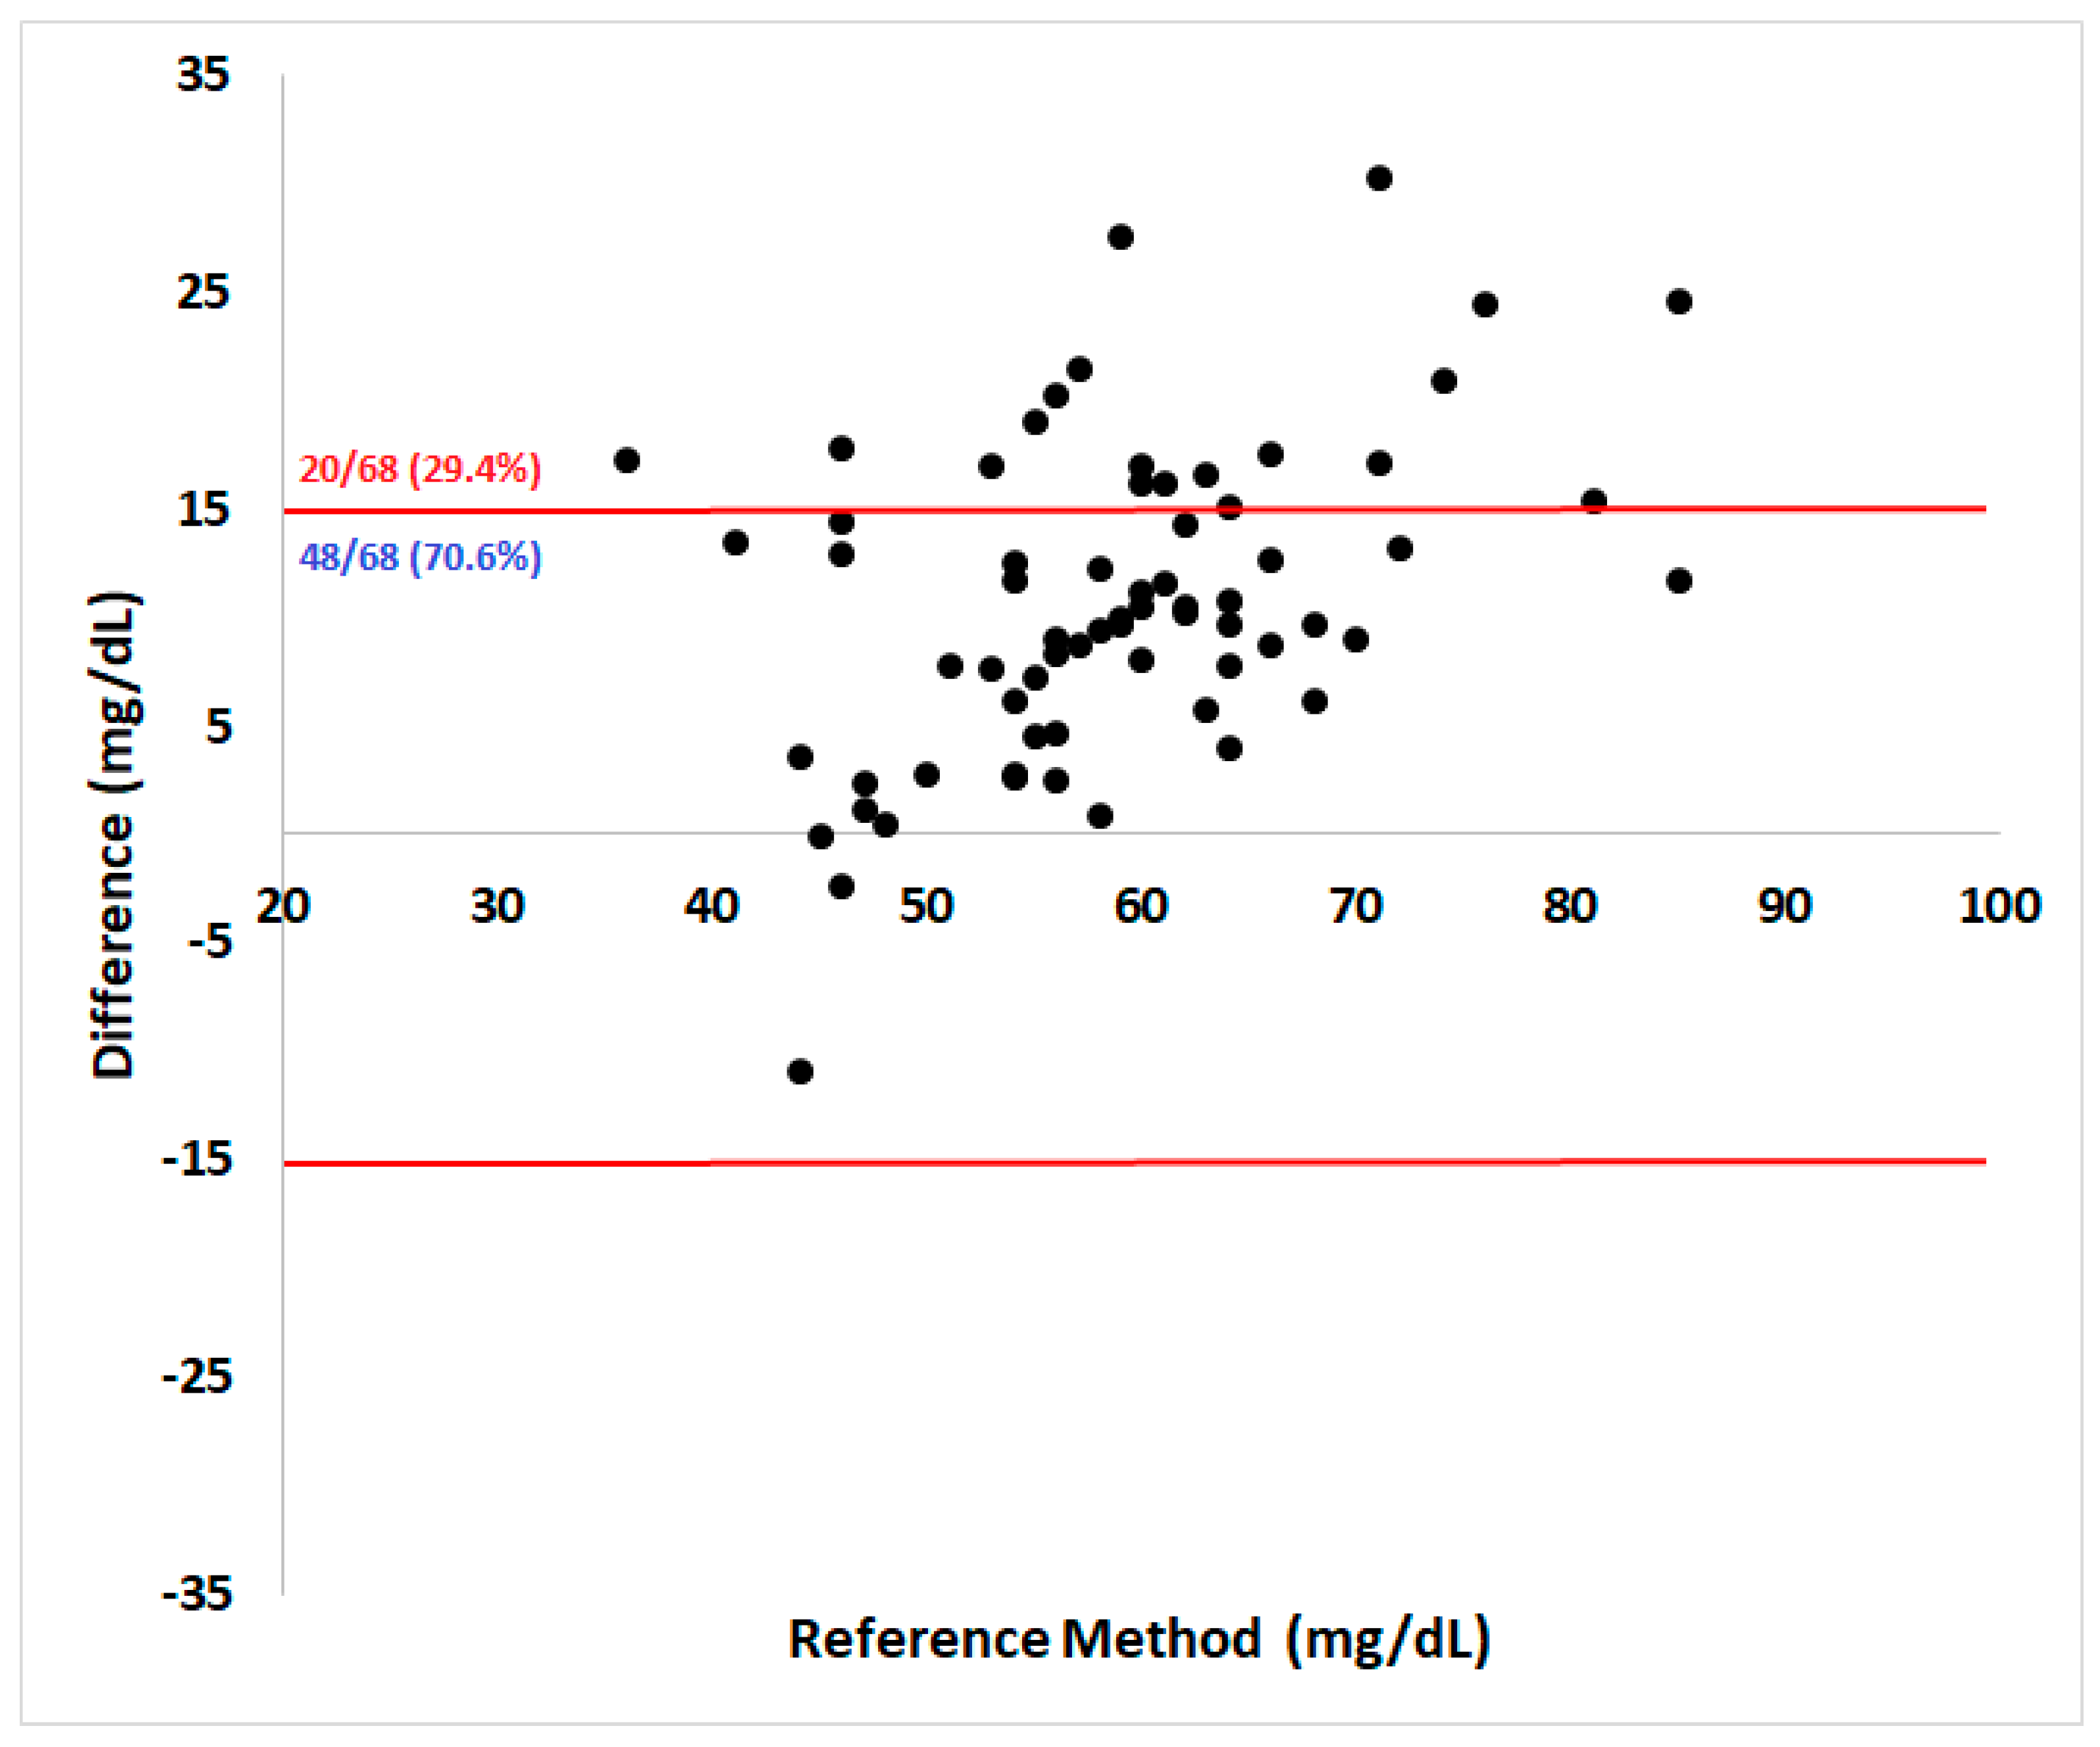

Table 1.
The total number and percentual of samples classified as hypoglycemic (values < 50 mg/dL), normoglycemic (values between 50 and 80 mg/dL), and hyperglycemic (values > 80 mg/dL) in pregnant ewes at 90 and 120 pregnancy days according to glycemia determination method.
Table 1.
The total number and percentual of samples classified as hypoglycemic (values < 50 mg/dL), normoglycemic (values between 50 and 80 mg/dL), and hyperglycemic (values > 80 mg/dL) in pregnant ewes at 90 and 120 pregnancy days according to glycemia determination method.
| Hypoglycemia (< 50 mg/dL) |
Normoglycemia (50 – 80 mg/dL) | Hyperglycemia (> 80 mg/dL) |
|
|---|---|---|---|
| Accu-Check Performa | 12 (17.64%) | 53 (77.94%) | 3 (4.41%) |
| Reference Method | 41 (60.29%) | 27 (39.71%) | 0 (0%) |
Disclaimer/Publisher’s Note: The statements, opinions and data contained in all publications are solely those of the individual author(s) and contributor(s) and not of MDPI and/or the editor(s). MDPI and/or the editor(s) disclaim responsibility for any injury to people or property resulting from any ideas, methods, instructions or products referred to in the content. |
© 2024 by the authors. Licensee MDPI, Basel, Switzerland. This article is an open access article distributed under the terms and conditions of the Creative Commons Attribution (CC BY) license (http://creativecommons.org/licenses/by/4.0/).
Copyright: This open access article is published under a Creative Commons CC BY 4.0 license, which permit the free download, distribution, and reuse, provided that the author and preprint are cited in any reuse.


