
Submitted:
27 November 2024
Posted:
29 November 2024
You are already at the latest version
Abstract
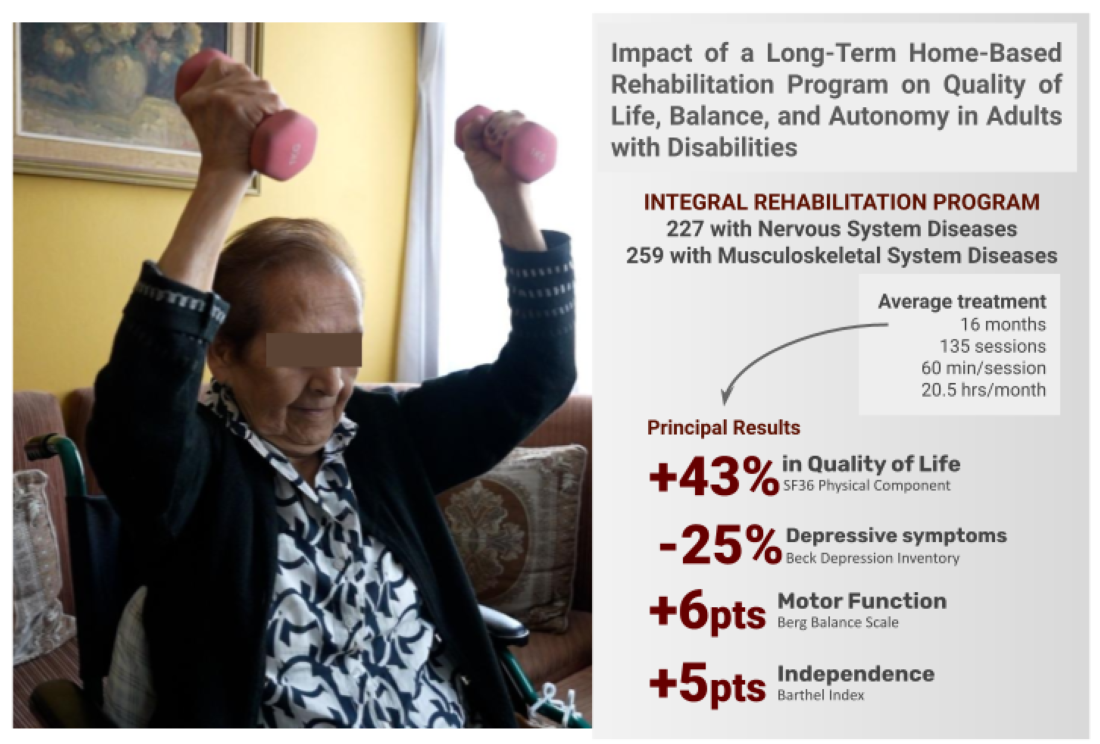
This study evaluated the impact of a long-term, multidisciplinary, home-based rehabilitation program on quality of life, balance, and functional autonomy in adults with neuromusculoskeletal disabilities. A total of 559 participants received individualized interventions from a team of physical therapists, occupational therapists, psychologists, and other health professionals. Functional independence, balance, depressive symptoms, and quality of life were assessed using the Barthel Index, Berg Balance Scale, Beck Depression Inventory, and SF-36 questionnaire, respectively. A longitudinal analysis comparing pre- and post-intervention outcomes revealed statistically significant improvements (p < 0.001) across all metrics. The Barthel Index median increased from 85 to 90 points, indicating greater functional independence, while the Berg Balance Scale improved from 39 to 47 points, reflecting reduced fall risk. Depressive symptoms decreased, with Beck Depression Inventory scores dropping from 12 to 9, and both physical and mental health components of the SF-36 showed marked enhancements. These findings demonstrate the program's effectiveness in addressing both physical and emotional needs, emphasizing the value of extended, personalized, home-based care in improving health, autonomy, and overall quality of life for individuals with disabilities. This study underscores the potential of multidisciplinary approaches to support long-term rehabilitation in diverse populations.
Keywords:
Home-based rehabilitation
; Multidisciplinary approach
; Neuromusculoskeletal disabilities
; Quality of life
; Independence
; Balance
; Long-term intervention
1. Introduction
People with disabilities often face significant limitations in their physical, emotional, and social functionality, which negatively affects their quality of life and restricts their full participation in society [1,2]. In this context, rehabilitation programs play a crucial role in offering a path toward the recovery of independence and the improvement of patients’ functionality [3]. These programs adopt a comprehensive approach, grounded in the biopsychosocial model, encompassing physical, psychological, and social aspects. This approach aims not only to achieve physical recovery but also to fully integrate the individual into their environment, addressing their functional needs and promoting their overall well-being [4]. Rehabilitation should be integrated into healthcare systems as a continuous process parallel to medical care, enabling patients to maintain autonomy and engage in meaningful activities from the early stages of recovery, thus avoiding the loss of skills and confidence associated with prolonged inactivity [5,6].
Rehabilitation is an essential process for people with disabilities, especially in cases of neurological disorders, as it aims to restore functionality and improve quality of life. This process is based on experience-dependent brain plasticity, which can be induced through personalized therapeutic interventions and strategies such as task-oriented repetitive training, multidisciplinary therapies, and home-based self-management. These techniques, tailored to the complexity and individual needs of each patient, have been shown to be effective in promoting functional recovery and independence [7,8,9].
Regarding therapeutic dosing, it is crucial to achieve a minimum threshold of repetitions during exercises to induce plastic changes in the central nervous system [10]. Recent research has highlighted that the intensity and frequency of interventions, along with early initiation within the first three months post-injury, significantly increase treatment efficacy [11]. These interventions result in substantial improvements in aspects such as mobility and balance, particularly in patients of moderate complexity. This approach, supported by studies on neuroplasticity, optimizes clinical outcomes and fosters sustainable recovery [7,12].
The standardized assessment of the clinical and functional aspects of each patient is a cornerstone of the rehabilitation process. A comprehensive evaluation enables healthcare professionals to gain a deep understanding of the individual characteristics of each person with a disability, facilitating the development of personalized and effective interventions that address their specific needs. According to Bickenbach and Stucki (2021), rehabilitation should be viewed as a 21st-century health strategy, focused on optimizing functionality and reducing disability in individuals with health conditions through a function-centered approach [13]. The implementation of this comprehensive approach, encompassing physical, emotional, and social dimensions, supports rehabilitation strategies that improve patients’ quality of life, optimize their functionality, and encourage their active participation in society [5,14].
The longitudinal assessment of key variables is essential for characterizing the clinical and functional profile of rehabilitation patients, enabling observation of changes in their progress and the effectiveness of interventions over time. This continuous approach provides a comprehensive perspective on the impact of interventions, facilitating the adaptation of therapeutic strategies to the evolving needs of each patient and promoting complete recovery in terms of health and well-being. From a biopsychosocial perspective, rehabilitation is conceived as an iterative process that addresses not only physical aspects but also considers the psychological and social dimensions influencing patients’ functionality. This approach helps identify barriers and facilitators in the environment and optimizes patients’ active participation in society [5,15]. Rehabilitation, as an essential strategy within healthcare systems, must be integrated transversally and in parallel with other medical interventions, ensuring continuity of care and maximizing functionality throughout all stages of treatment [13].
Quality of life is a central aspect of the rehabilitation of people with disabilities, as physical and emotional well-being are fundamental components for achieving a fulfilling and satisfying life. Assessing quality of life allows healthcare professionals to identify key areas of intervention that contribute to improving both the physical functioning and psychological well-being of the patient, essential aspects of their recovery process. Among the available tools, the SF-36 questionnaire has become one of the most widely used instruments for measuring quality of life in terms of physical and emotional functionality, providing a structured framework that facilitates the design of specific and effective interventions [16]. The results obtained through the SF-36 allow for the observation of changes in the patient’s quality of life throughout the treatment, offering a longitudinal perspective that supports clinical decision-making based on evidence and the patient’s actual progress.
Functional autonomy is a fundamental dimension of rehabilitation, as it enables people with disabilities to regain the ability to perform basic activities of daily living, promoting their independence and reducing the burden on their caregivers. This autonomy is essential in the rehabilitation process, as the ability to achieve functional independence has a direct impact on the patient’s social integration. The Barthel Index, a widely recognized tool for measuring this autonomy, classifies patients into different levels of dependency, facilitating the personalization of interventions according to the needs of everyone [17,18]. Improving the patient’s functional autonomy is a central goal of rehabilitation, as it allows for greater integration and participation in their family and social environment, promoting a more holistic and sustainable recovery.
Emotional well-being is fundamental to the recovery of people with disabilities, as it directly affects their motivation and willingness to actively participate in the rehabilitation process. According to Turner and Kelly (2000), patients with chronic illnesses, like many individuals with disabilities, often experience significant emotional strain due to physical and social limitations, which can lead to the onset of disorders such as depression and anxiety [19]. These symptoms affect their ability to adapt to their situation and adhere to recommended treatments. The Beck Depression Inventory (BDI) is a widely used tool for assessing the severity of depressive symptoms, enabling healthcare professionals to provide personalized interventions that promote better treatment adherence and contribute to improving the patient’s quality of life [20]. Addressing these emotional aspects in rehabilitation is essential for optimizing outcomes and fostering a more comprehensive recovery process.
Balance and the risk of falls are critical factors in rehabilitation, especially for individuals with physical disabilities or limited mobility. The Berg Balance Scale is a widely validated tool that measures balance levels and assesses fall risk in patients. Its psychometric properties have proven to be reliable and valid in both clinical and research contexts, enabling professionals to design specific interventions to improve stability and reduce the risk of accidents [21]. Furthermore, research indicates that balance impairments significantly increase the risk of falls among community-dwelling older adults, highlighting the importance of evaluating and addressing these aspects as an integral part of rehabilitation [22]. These improvements not only enhance safety but also promote patients’ independence and active participation in their daily activities.
Standardization in the evaluation of variables in people with disabilities is crucial to ensure comparability of results and facilitate clinical decision-making. Standardized tools and protocols allow rehabilitation professionals to continuously monitor patients’ progress, comparing results with reference parameters that demonstrate the impact of interventions on the patient’s condition. Wade (1999) highlights that the use of structured outcome measures not only facilitates the evaluation of treatment effectiveness but also allows for a better interpretation of results by considering the factors influencing the rehabilitation process [14]. Similarly, Rauch et al. (2008) emphasize that using a classification framework, such as the International Classification of Functioning, Disability, and Health (ICF), provides a common language and a systematic approach to documenting changes in the patient’s functional status. This enables precise adaptation of rehabilitation strategies to their biopsychosocial needs. This standardized approach contributes to optimizing interventions and promoting comprehensive functional recovery [15].
In line with the comprehensive approach described, the present study aims to characterize the clinical and functional profile of patients by analyzing standardized variables across the dimensions of quality of life, functional autonomy, balance, and emotional state. Through a longitudinal evaluation, the study seeks to observe the effectiveness of interventions in terms of health and well-being, enabling continuous adjustments to therapeutic strategies. This study aims not only to measure progress in each of these areas but also to understand how advancements in these dimensions contribute to comprehensive functional recovery that meets the biopsychosocial needs of patients.
2. Materials and Methods
2.1. Recruitment
This study included 559 patients with neuromusculoskeletal disabilities who participated in a rehabilitation program. The protocol targeted individuals registered in the institution’s database, primarily older adults with a median age of 71 years (interquartile range: 59–81 years). Patients were included if they had medical referrals and clinical information available in the rehabilitation center’s database (Figure 1). This inclusion criterion ensured access to documented medical histories for accurate health status evaluation and follow-up. Exclusion criteria included individuals with severe cognitive impairment that hindered effective participation in the rehabilitation program, as well as patients with acute medical conditions requiring immediate hospitalization.
2.2. Intervention
The rehabilitation program provided a comprehensive approach led by a multidisciplinary team. Each patient received a personalized treatment plan with a median duration of 16 months (interquartile range: 9–19 months), encompassing approximately 135 therapy sessions (interquartile range: 99–152 sessions). The therapies included physical rehabilitation sessions, independence training through occupational therapy, and emotional and psychological support. Additionally, nursing staff conducted general health care sessions. Each session lasted approximately 60 minutes, and the program delivered an average of 20.5 hours of therapy per month, aiming to promote functional independence and quality of life.
The program also included two medical evaluations (at the beginning and end of the program) to monitor clinical progress. Social workers conducted admission and discharge assessments to address the patients’ social and environmental needs.
2.3. Outcome Measures
2.3.1. Patient Characteristics and Health Conditions
Clinical and demographic characteristics, including age distribution, were recorded and analyzed. The study focused on evaluating changes in clinical and quality-of-life variables, such as functional independence, balance, depressive symptoms, and quality of life.
2.3.2. Motor Function
Balance was assessed using the Berg Balance Scale (BBS) during the initial and final evaluations. The BBS is a validated tool that evaluates balance and fall risk in patients through 14 items measuring static and dynamic balance on a scale of 0 to 56 points. Scores below 45 indicate a fall risk and potential need for assistance, while higher scores suggest stable balance. The BBS has proven effective in populations with neuromusculoskeletal disabilities and is widely used in rehabilitation programs [21].
2.3.3. Mental Health
Mental health was assessed through depressive symptoms using the Beck Depression Inventory-II (BDI-II), a self-administered tool that measures depression severity across 21 items. BDI-II scores are classified into the following categories: minimal (0–13), mild (14–19), moderate (20–28), and severe (29–63). Changes in BDI-II scores help evaluate improvements or declines in the patient’s emotional well-being. The BDI-II is widely used and has demonstrated high reliability and validity for measuring depressive symptoms in clinical populations [20].
2.3.4. Functional Independence
Functional independence was measured using the Barthel Index (BI), a scale that evaluates an individual’s ability to perform basic activities of daily living (ADLs) independently. The index scores range from 0 to 100, with higher scores indicating greater independence. This tool is widely used in rehabilitation to assess changes in patients’ functional capacity and categorize dependency levels, making it effective for monitoring progress in functional recovery [23].
2.3.5. Quality of Life
Quality of life was assessed using the physical and mental components of the SF-36 questionnaire, a generic health measure that evaluates eight dimensions. The physical and mental components provide an overall view of physical health and emotional well-being. Scores range from 0 to 100, with higher values indicating better perceptions of health and emotional well-being. The SF-36 is a widely validated and commonly used tool in quality-of-life studies involving populations with disabilities and chronic illnesses [16].
2.4. Statistical Analysis
The data were organized and cleaned using Microsoft Excel 365, which was employed for data preprocessing and preparation prior to statistical analysis. Descriptive and inferential statistical analyses were performed using GraphPad Prism v8.0.2 (GraphPad Software, Inc., San Diego, CA), a software specifically designed for advanced scientific analysis and detailed graph generation, and PAST 4.12b, a versatile statistical tool used for non-parametric tests and specialized analyses.
Measures of central tendency, such as the median and interquartile range, were used due to the non-normal distribution of most variables. The Shapiro-Wilk test was applied to verify normality, and non-parametric tests were conducted as necessary.
The Wilcoxon signed-rank test was used to evaluate changes in paired samples (pre- and post-intervention), while the Mann-Whitney test assessed absolute changes between groups. The visualization of results included graphs and tables generated with GraphPad Prism, facilitating the interpretation of the program’s impact on clinical and quality-of-life variables.
2.5. Ethical Considerations
The study was approved by the Institutional Review Board of the Rehabilitation Center Club de Leones Cruz del Sur (approval code CRCS_UID_010223), ensuring compliance with ethical and methodological standards. All data were handled confidentially and anonymized. Participants did not receive any compensation for their participation in this study.
3. Results
3.1. Age
The median age of the 559 patients was 71 years, with an interquartile range of 59 to 81 years, indicating a predominantly older adult population. The normality analysis of the age distribution showed that this variable does not follow a normal distribution, as confirmed by the Shapiro-Wilk test (p<0.001). Figure 2 presents a histogram of the age distribution, highlighting a significant deviation from normality in the analyzed sample.
3.2. Diagnosis
3.2.1. Diseases of the Nervous System
The group of Nervous System Diseases (NSD) includes diagnoses primarily affecting the brain, spinal cord, and peripheral nerves, accounting for a total of 229 patients, which represents approximately 45.1% of the total sample. The most common conditions in this category include:
- Sequelae of cerebrovascular diseases, such as cerebral infarction and subarachnoid hemorrhages.
- Traumas and paralysis, including spinal cord injury and paraplegia.
- Polyneuropathies, such as diabetic polyneuropathy and other inflammatory neuropathies.
3.2.2. Diseases of the Musculoskeletal System
The group of Musculoskeletal System Diseases (MSD) includes 259 patients, representing 54.9% of the total sample. These conditions affect bones, muscles, tendons, and joints, causing pain, stiffness, and mobility limitations. The most frequent diagnoses in this category include:
- Disorders of joints and soft tissues, such as carpal tunnel syndrome, tenosynovitis, and rotator cuff syndrome.
- Spinal problems, such as lumbago and lumbar hernias.
- Age-related diseases, such as osteoporosis, osteoarthritis, and sarcopenia.
- Sequelae of fractures and joint replacements.

Table 1.
Results of clinical outcomes expressed as median points for pre- and post-intervention assessments, separated by diagnosis group.
Table 1.
Results of clinical outcomes expressed as median points for pre- and post-intervention assessments, separated by diagnosis group.
| Clinical Outcome | Nervous System Group | Musculoskeletal System Group | ||||
|---|---|---|---|---|---|---|
| N | Pre | Post | N | Pre | Post | |
| SF36-PC | 183 | 28.1 | 38.1 | 205 | 28.1 | 41.3 |
| SF36-MC | 183 | 44.1 | 58.3 | 205 | 50.3 | 65.6 |
| Barthel | 225 | 85 | 90 | 279 | 85 | 90 |
| Beck | 90 | 12 | 9.5 | 103 | 12 | 9 |
| Berg | 219 | 43 | 50 | 268 | 36.5 | 44 |
3.3. Quality of Life
The quality of life of patients was assessed using the SF-36 questionnaire, a widely validated tool that measures two main components: physical and mental. This questionnaire is essential for evaluating the impact of rehabilitation interventions on patients’ daily lives, allowing for the observation of changes in their perception of physical health and emotional well-being.
3.3.1. Physical Component of the SF-36
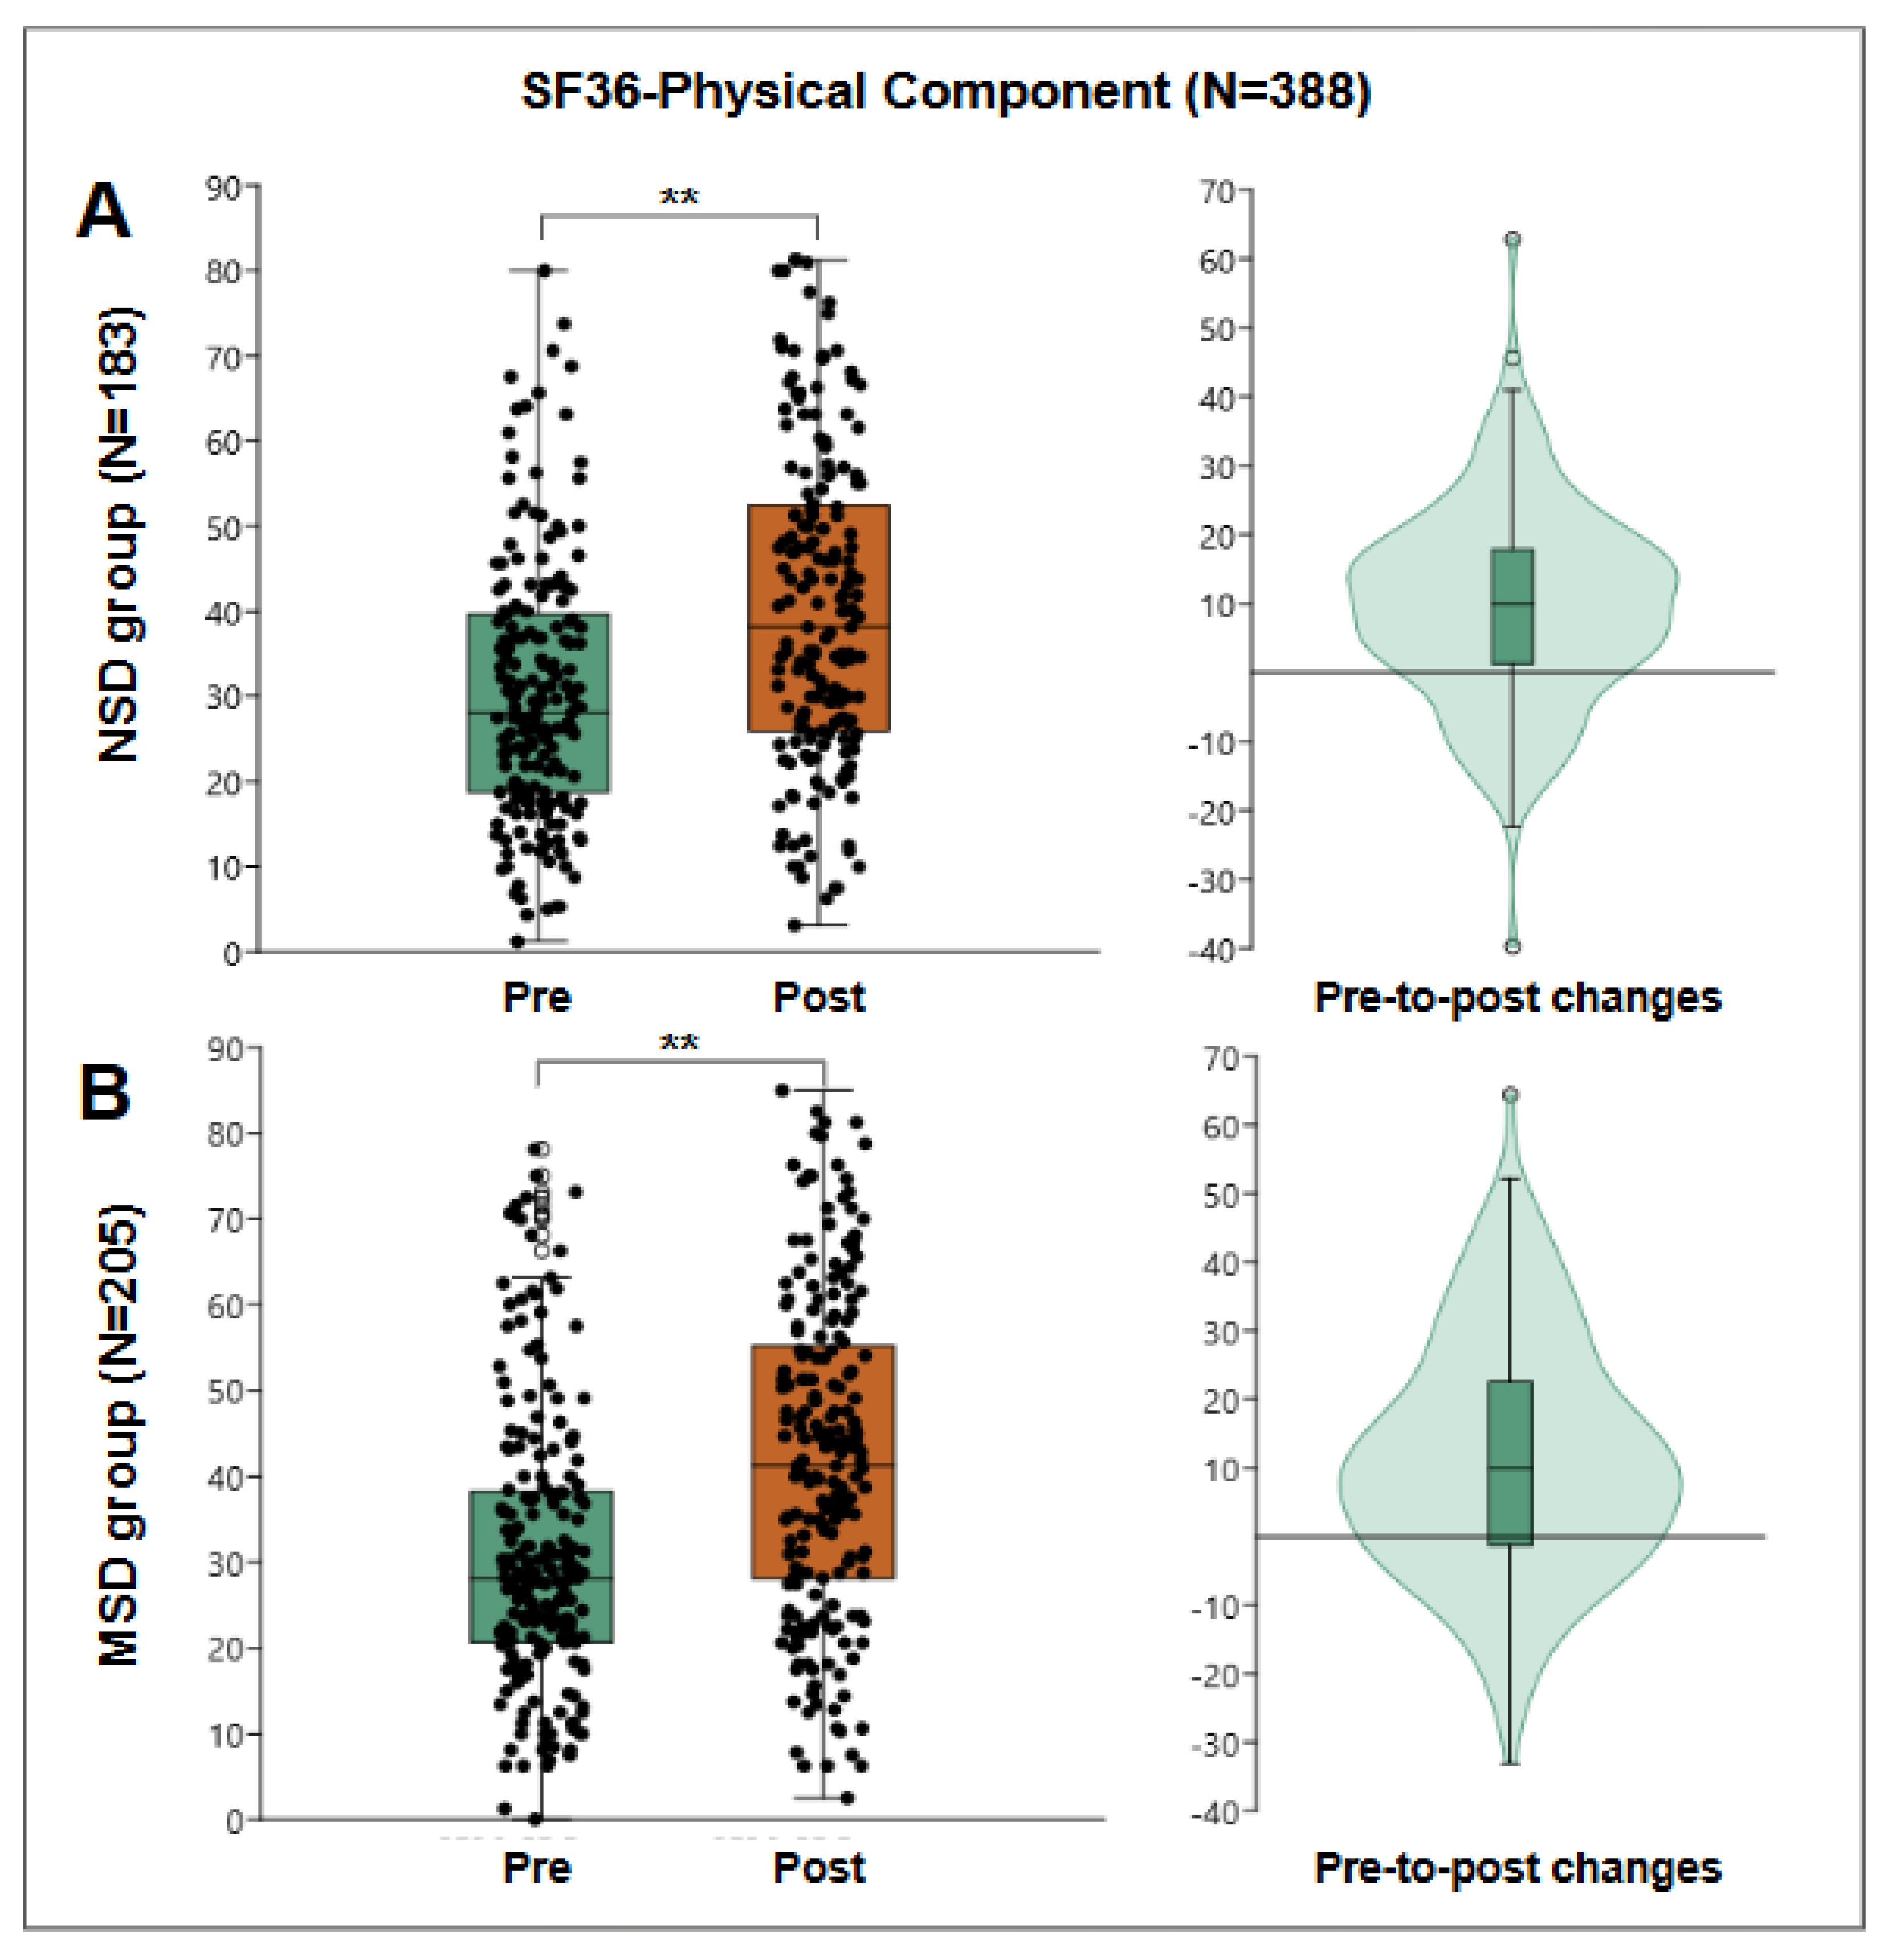
This component evaluates patients’ perception of their physical health, including aspects such as the ability to perform physical activities, role limitations due to physical health problems, bodily pain, and vitality perception. In this study, 388 patients participated in the evaluation of the physical component. Pre-treatment results showed a median score of 28.13 points, with an interquartile range of 19 to 39 points, indicating that patients perceived considerable limitations in their physical health at the start of the interventions.
After the rehabilitation program, the median score for the physical component significantly increased to 40.31 points, with an interquartile range of 27 to 54 points. The Wilcoxon test, used to compare pre- and post-treatment scores, showed statistical significance with a p-value of 2.06E-31, confirming that this improvement is significant. The median difference was 10 points, with an interquartile range of 0.3 to 19 points, reflecting a positive impact on patients’ physical functionality.
For the NSD group, 183 patients were evaluated, obtaining a pre-treatment median of 28.13 points and post-treatment median of 38.13 points, obtaining a pre-post median change of 10 points with an interquartile range of 1.25 to 17.81, statistically significant Wilcoxon W: 14014, p=1.34E-15.
For the MSD group, 205 patients were evaluated, obtaining a pre-treatment median of 28.13 points and post-treatment of 41.25 points, obtaining a median pre-post change of 10 points with an interquartile range of -1.3 to 22.5, statistically significant with Wilcoxon W=17045, p=1.41E-15.
3.3.2. Mental Component of the SF-36
The mental component of the SF-36 evaluates aspects related to emotional and psychological well-being, such as vitality, social functioning, and overall mental health. In the pre-treatment evaluation, the group of 388 patients had a median score of 48 points for the mental component, with an interquartile range of 35 to 63 points. After the program, the median score increased to 62.5 points, with an interquartile range of 44 to 81 points, suggesting a significant improvement in patients’ emotional and psychological state. The Wilcoxon test demonstrated statistical significance with a p-value of 1.12E-23.
Figure 4.
SF36-Mental Component results. “A” shows results of NSD group (N=138), a box plot of pre- and post-results (left) and a violin plot of the individual differences (right). “B” shows results of MSD group (N=205), a box plot of pre- and post-results (left), and a violin plot of the individual differences (right). **: p<0.001.
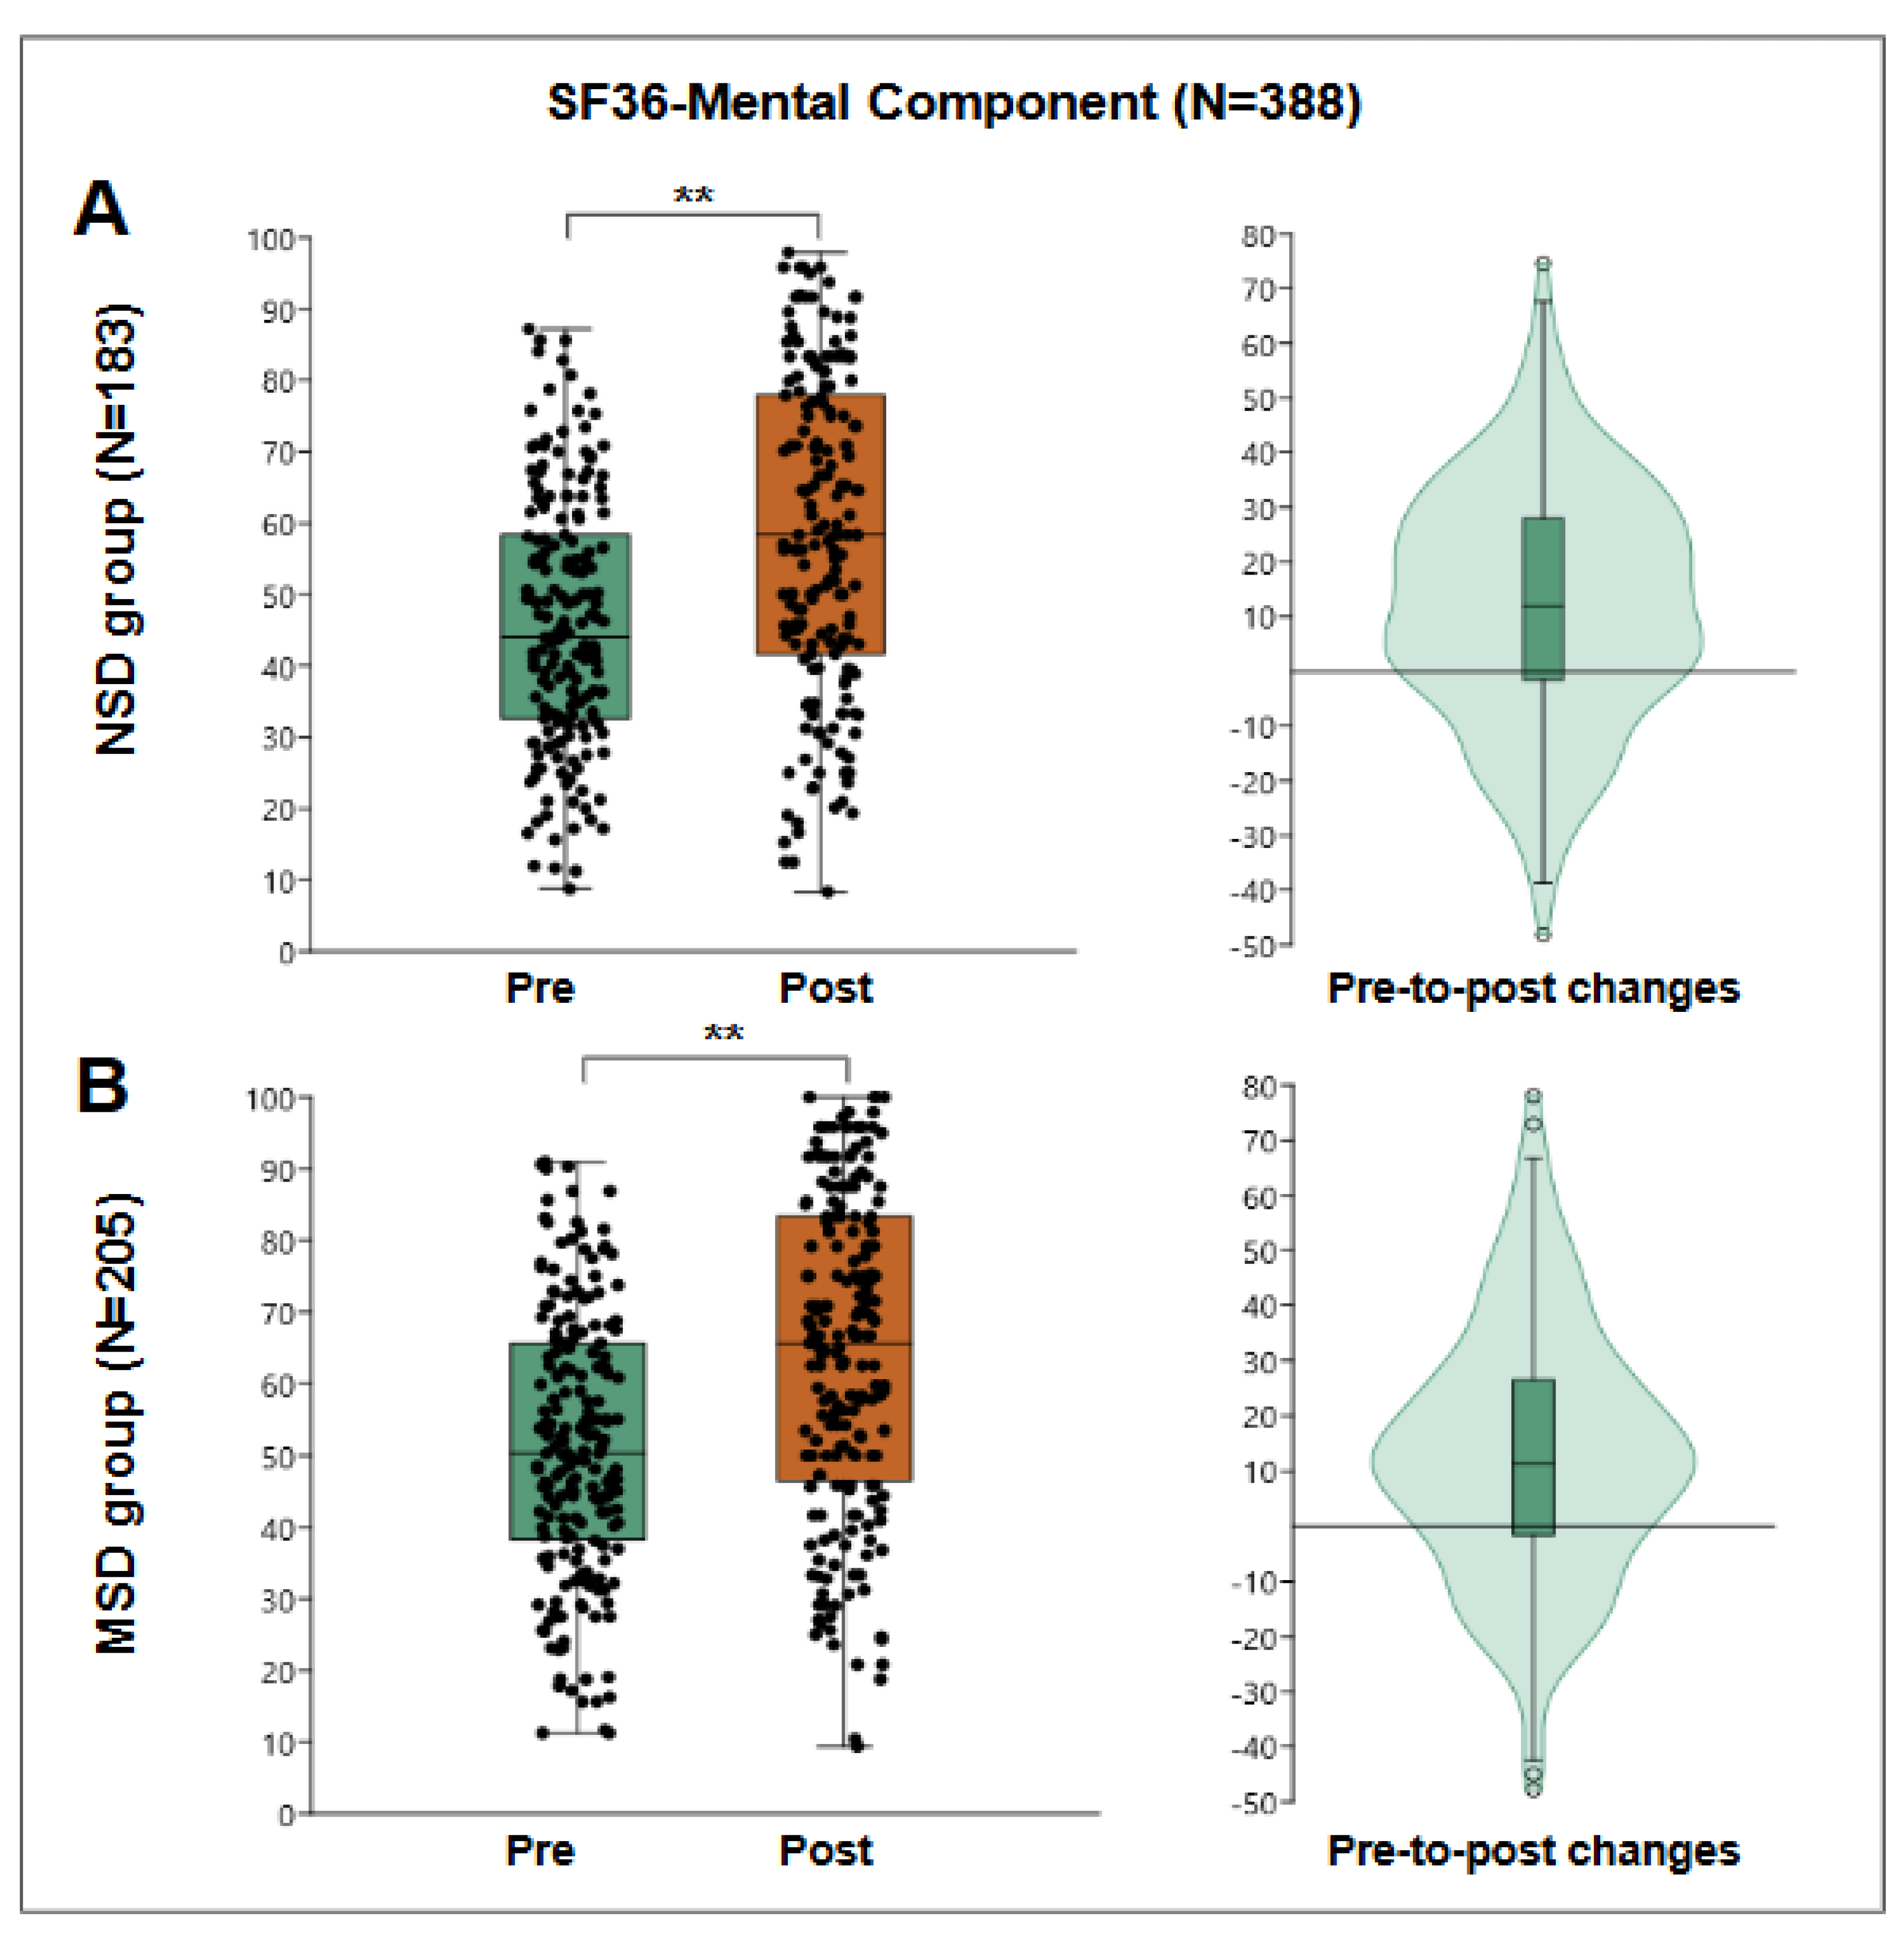
For the NSD group, 183 patients were evaluated, obtaining a pre-treatment median of 44.1 points and post-treatment median of 58.33 points, obtaining a median pre-post change of 12 points with an interquartile range of -1.6 to 27.95, statistically significant Wilcoxon W=13276, p=1.29E-11.
For the MSD group, 205 patients were evaluated, obtaining a pre-treatment median of 50.3 points and post-treatment median of 65.6 points, obtaining a median pre-post change of 11.4 points with an interquartile range of -1.6 to 26.5, statistically significant with Wilcoxon W=16380, p=2.25E-12.
3.4. Independence in Activities of Daily Living
The Barthel Index was evaluated in 504 patients to measure their level of independence in basic activities of daily living. The results showed a pre-treatment median score of 85 points, with an interquartile range of 70 to 95 points. Subsequently, the median increased to 90 points, with an interquartile range of 76 to 100 points. The Wilcoxon test indicated a significant improvement in the functional autonomy of the patients (p=2.78E-12).
Figure 5.
Barthel Index results. “A” shows results of NSD group (N=225), a box plot of pre- and post-results (left) and a violin plot of the individual differences (right). “B” shows results of MSD group (N=279), a box plot of pre- and post-results (left), and a violin plot of the individual differences (right). **: p<0.001.
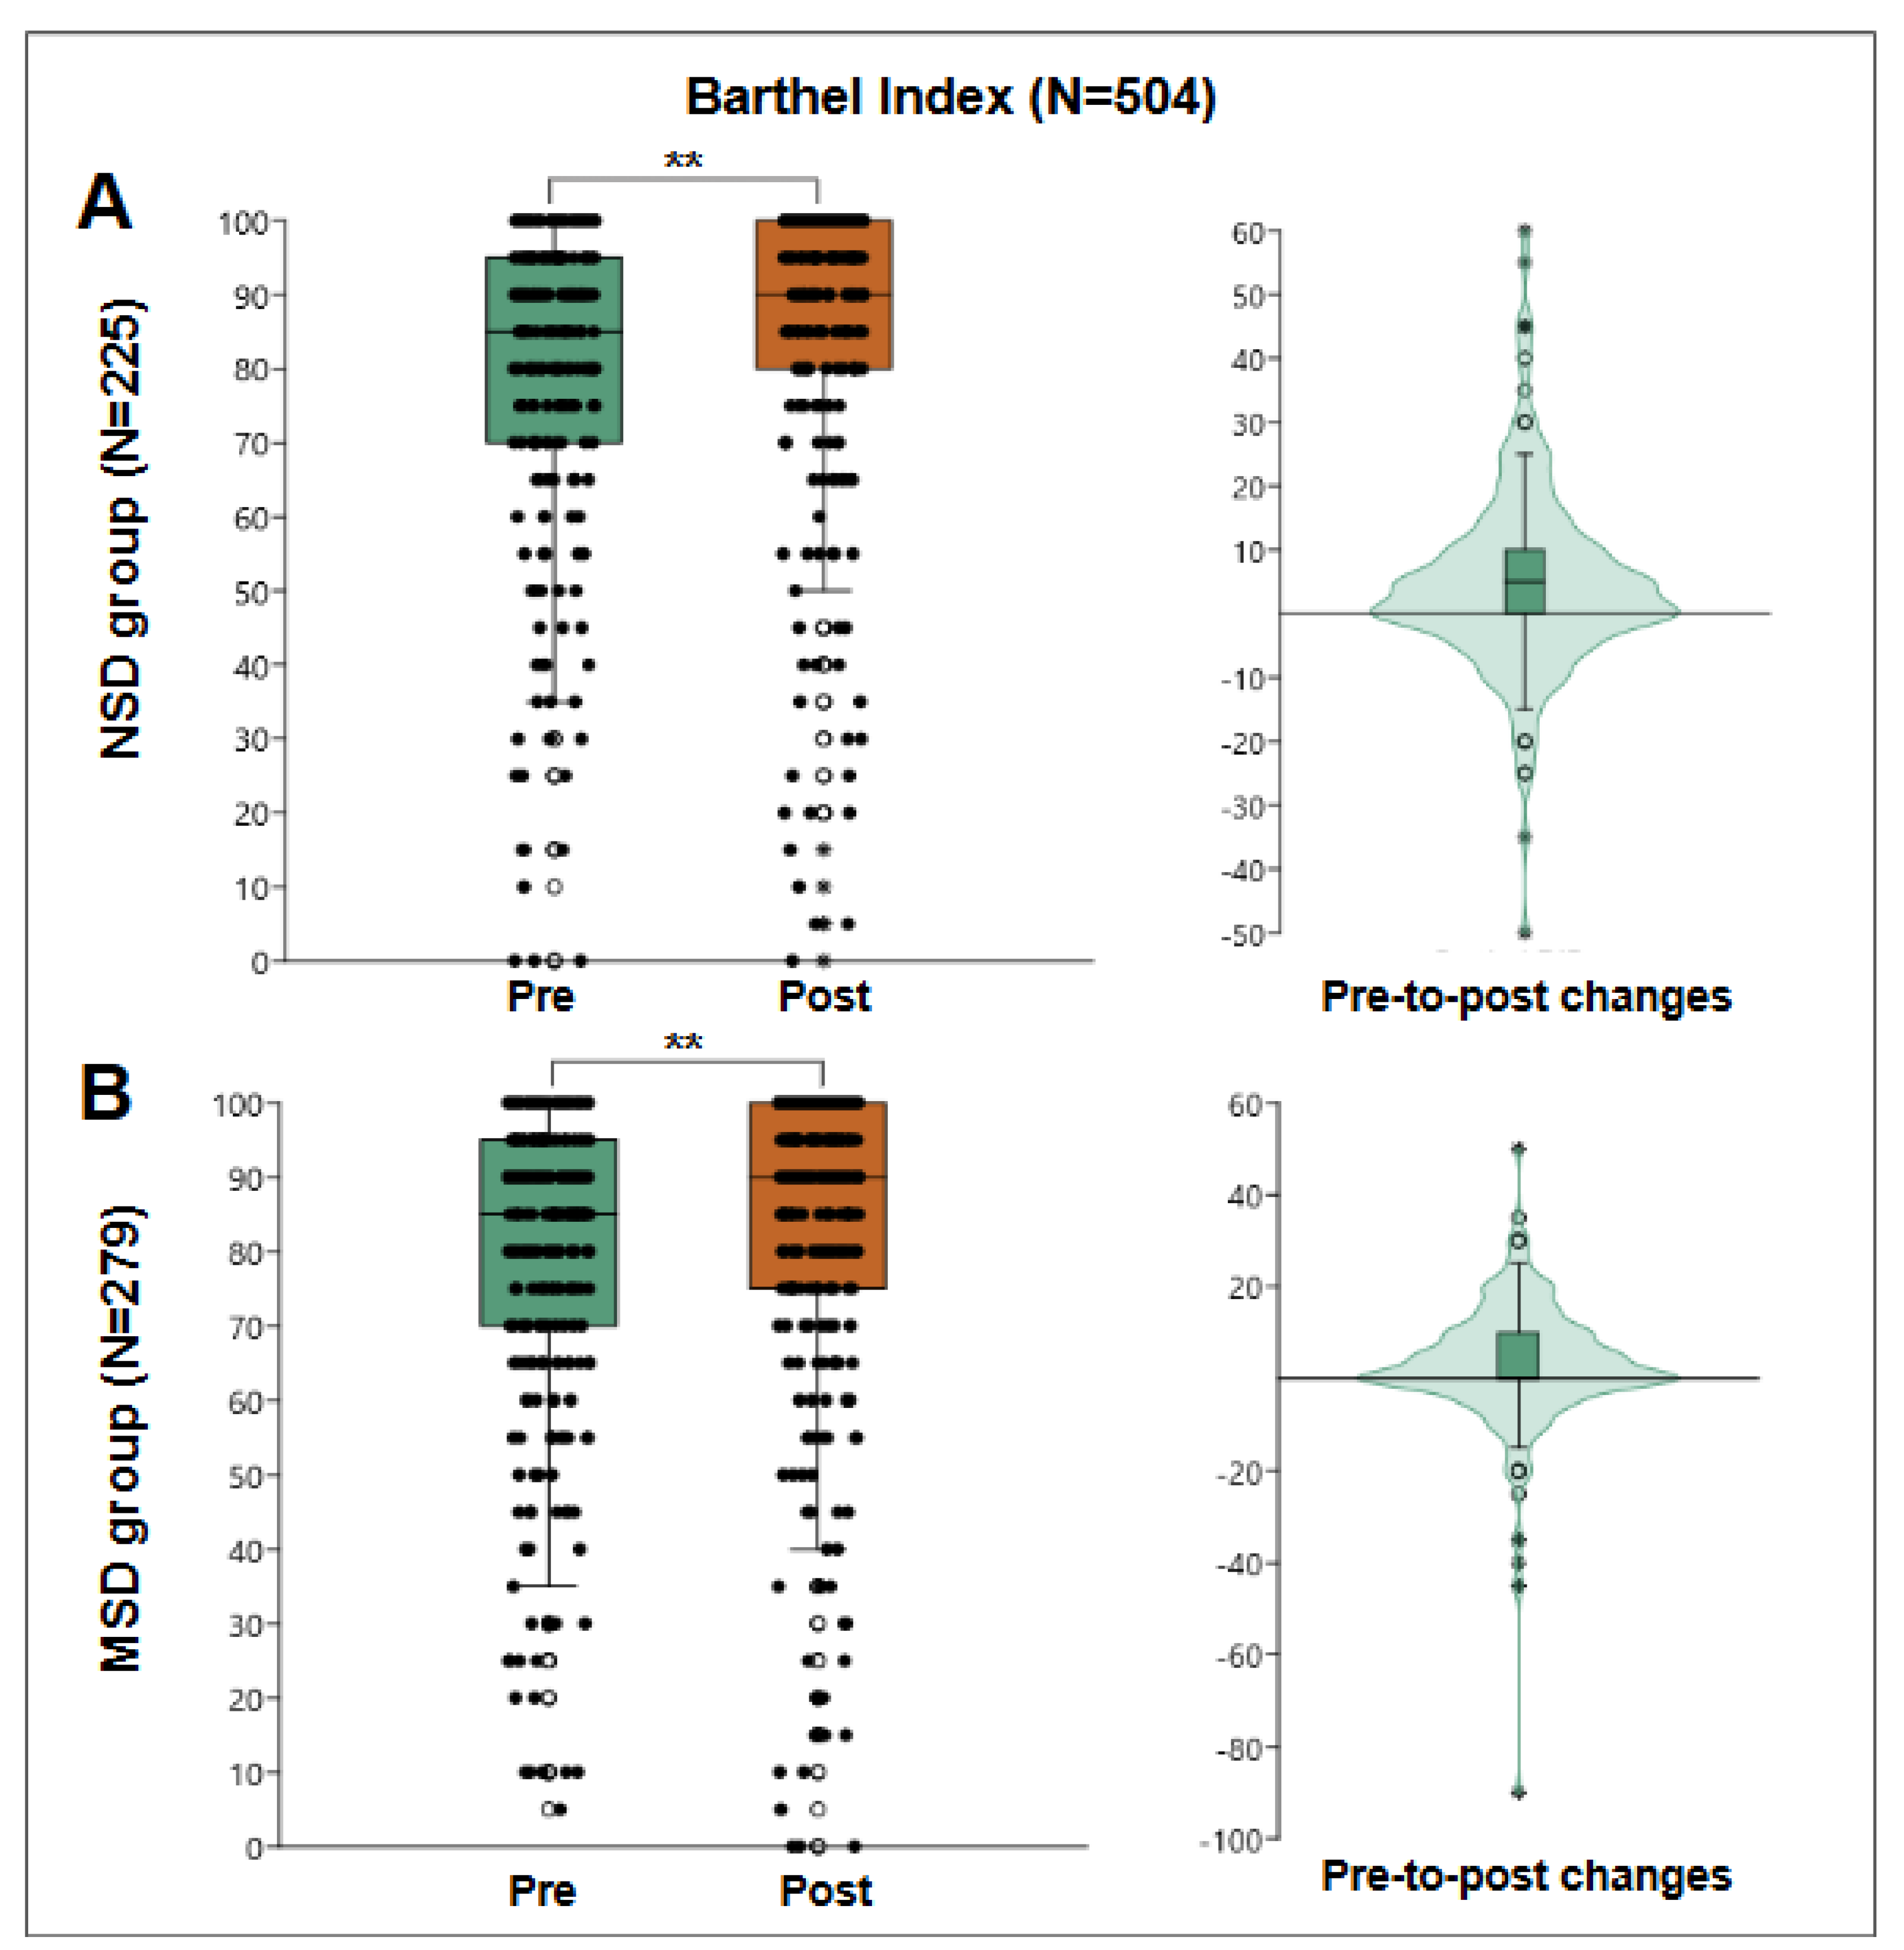
For the NSD group, 225 patients were evaluated, obtaining a pre-treatment median of 85 points and post-treatment of 90 points, obtaining a median pre-post change of 5 points with an interquartile range of 0 to 10, statistically significant Wilcoxon W=10303, p=7.47E-07. However, within those assessed, 26 users started and finished with the maximum score of 100 points. When reanalyzing the pre-to-post change among the remaining 199 patients, the median remained at 5 points, and the interquartile range changed from -5 to 10 points, better reflecting the behavior of the group.
279 patients were evaluated for the MSD group, obtaining a pre-treatment median of 85 points and post-treatment median of 90 points, which determined a median pre-to-post change of 0 points with an interquartile range of 0 to 10, statistically significant Wilcoxon W=13515, p=9.24E-07. However, among those tested, 34 users started and finished with the maximum score of 100 points. Looking again at pre-to-post change among the remaining 245 patients, the median change was 5 points, with an interquartile range of -2.5 to 10 points, better reflecting the behavior of the group.
3.5. Depressive Symptoms
The Beck Depression Inventory was administered to 193 patients to evaluate the presence and severity of depressive symptoms. The pre-treatment median score was 12 points, with an interquartile range of 7 to 17 points, which decreased to 9 points post-treatment, with an interquartile range of 6 to 14 points. The Wilcoxon test indicated a significant reduction in depressive symptoms (p=2.72E-10).
Figure 6.
Beck Depression Inventory-II results. “A” shows results of NSD group (N=90), a box plot of pre- and post-results (left) and a violin plot of the individual differences (right). “B” shows results of MSD group (N=103), a box plot of pre- and post-results (left), and a violin plot of the individual differences (right). **: p<0.001.
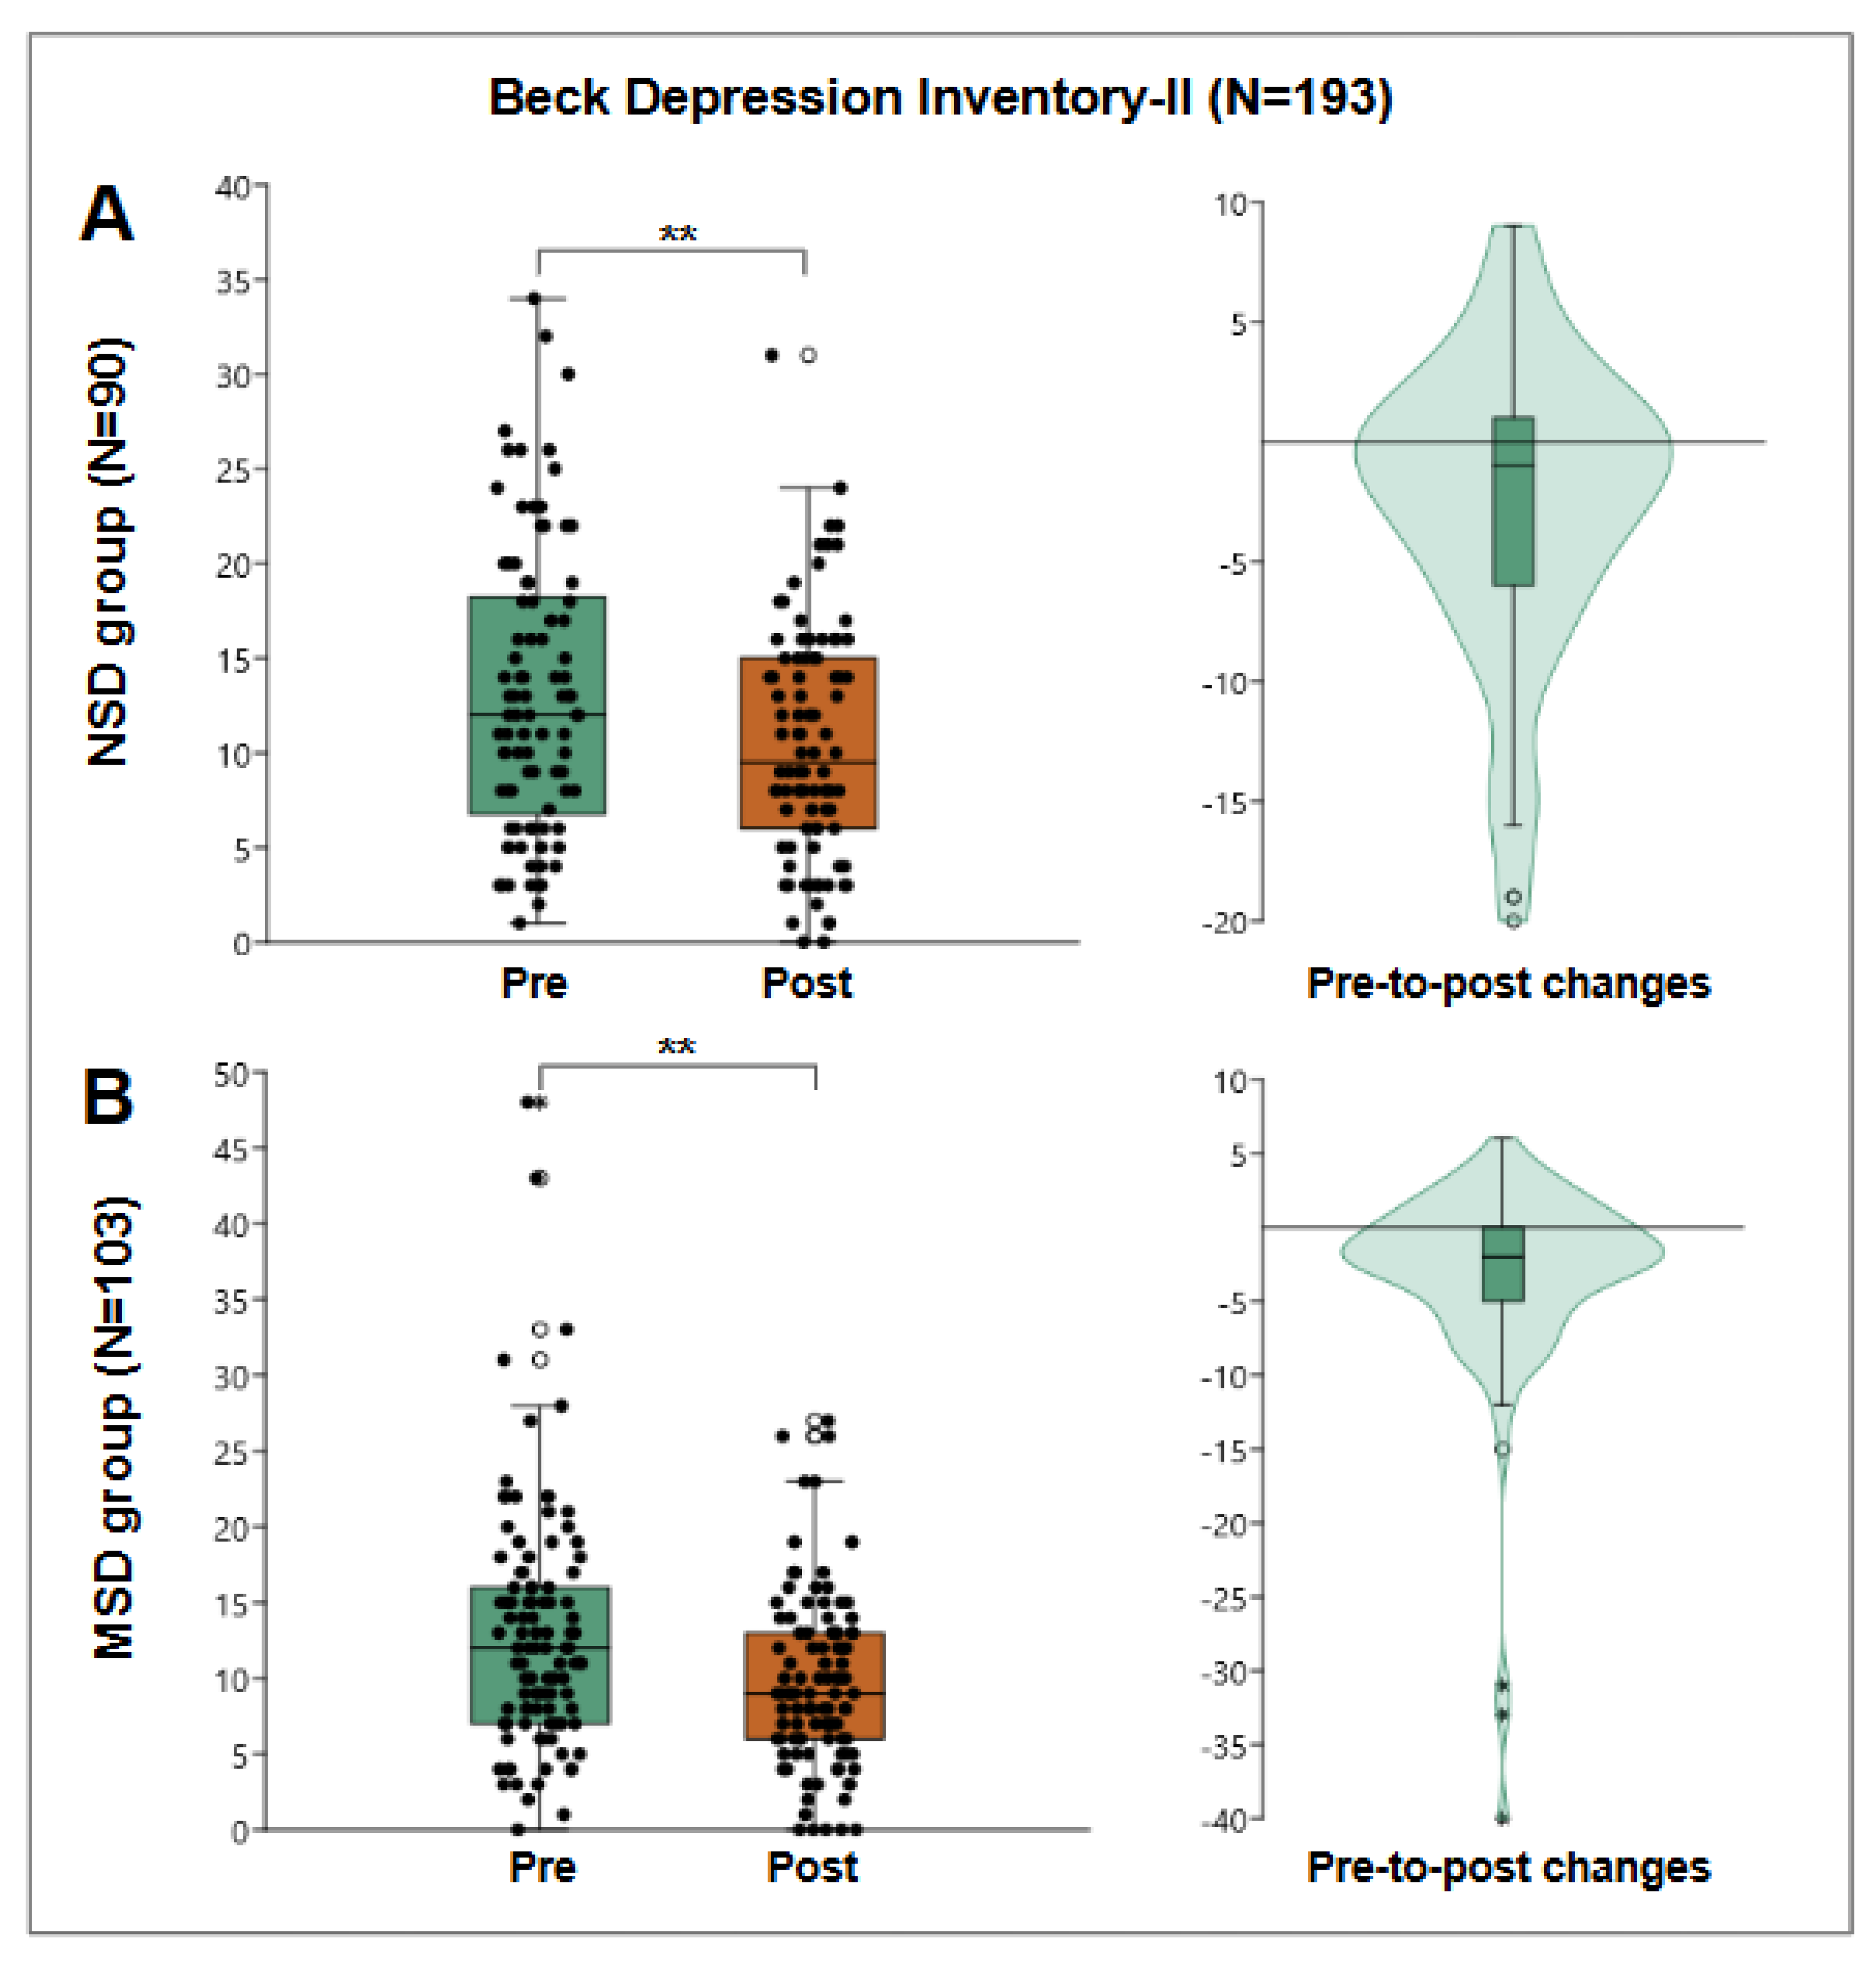
For the NSD group, 90 patients were evaluated, obtaining a pre-treatment median of 12 points and post-treatment median of 9.5 points, obtaining a pre-post median change of -1 points with an interquartile range of -6 to 1, statistically significant Wilcoxon W=2349, p=4.58E-04.
For the MSD group, 103 patients were evaluated, obtaining a median pre-treatment of 12 points and post-treatment of 9 points, obtaining a median pre-post change of -2 points with an interquartile range of -5 to 0, statistically significant with Wilcoxon W=3799, p=6.93E-08.
3.6. Balance and Fall Risk
The Berg Balance Scale, evaluated in 487 patients, showed a pre-treatment median score of 41 points, with an interquartile range of 28 to 49 points, and a post-treatment median score of 47 points, with an interquartile range of 34 to 54 points. The Wilcoxon test indicated a significant improvement in balance and a reduction in fall risk (p=7.86E-39).
Figure 7.
Berg Balance Scale results. “A” shows results of NSD group (N=90), a box plot of pre- and post-results (left) and a violin plot of the individual differences (right). “B” shows results of MSD group (N=103), a box plot of pre- and post-results (left), and a violin plot of the individual differences (right). **: p<0.001.
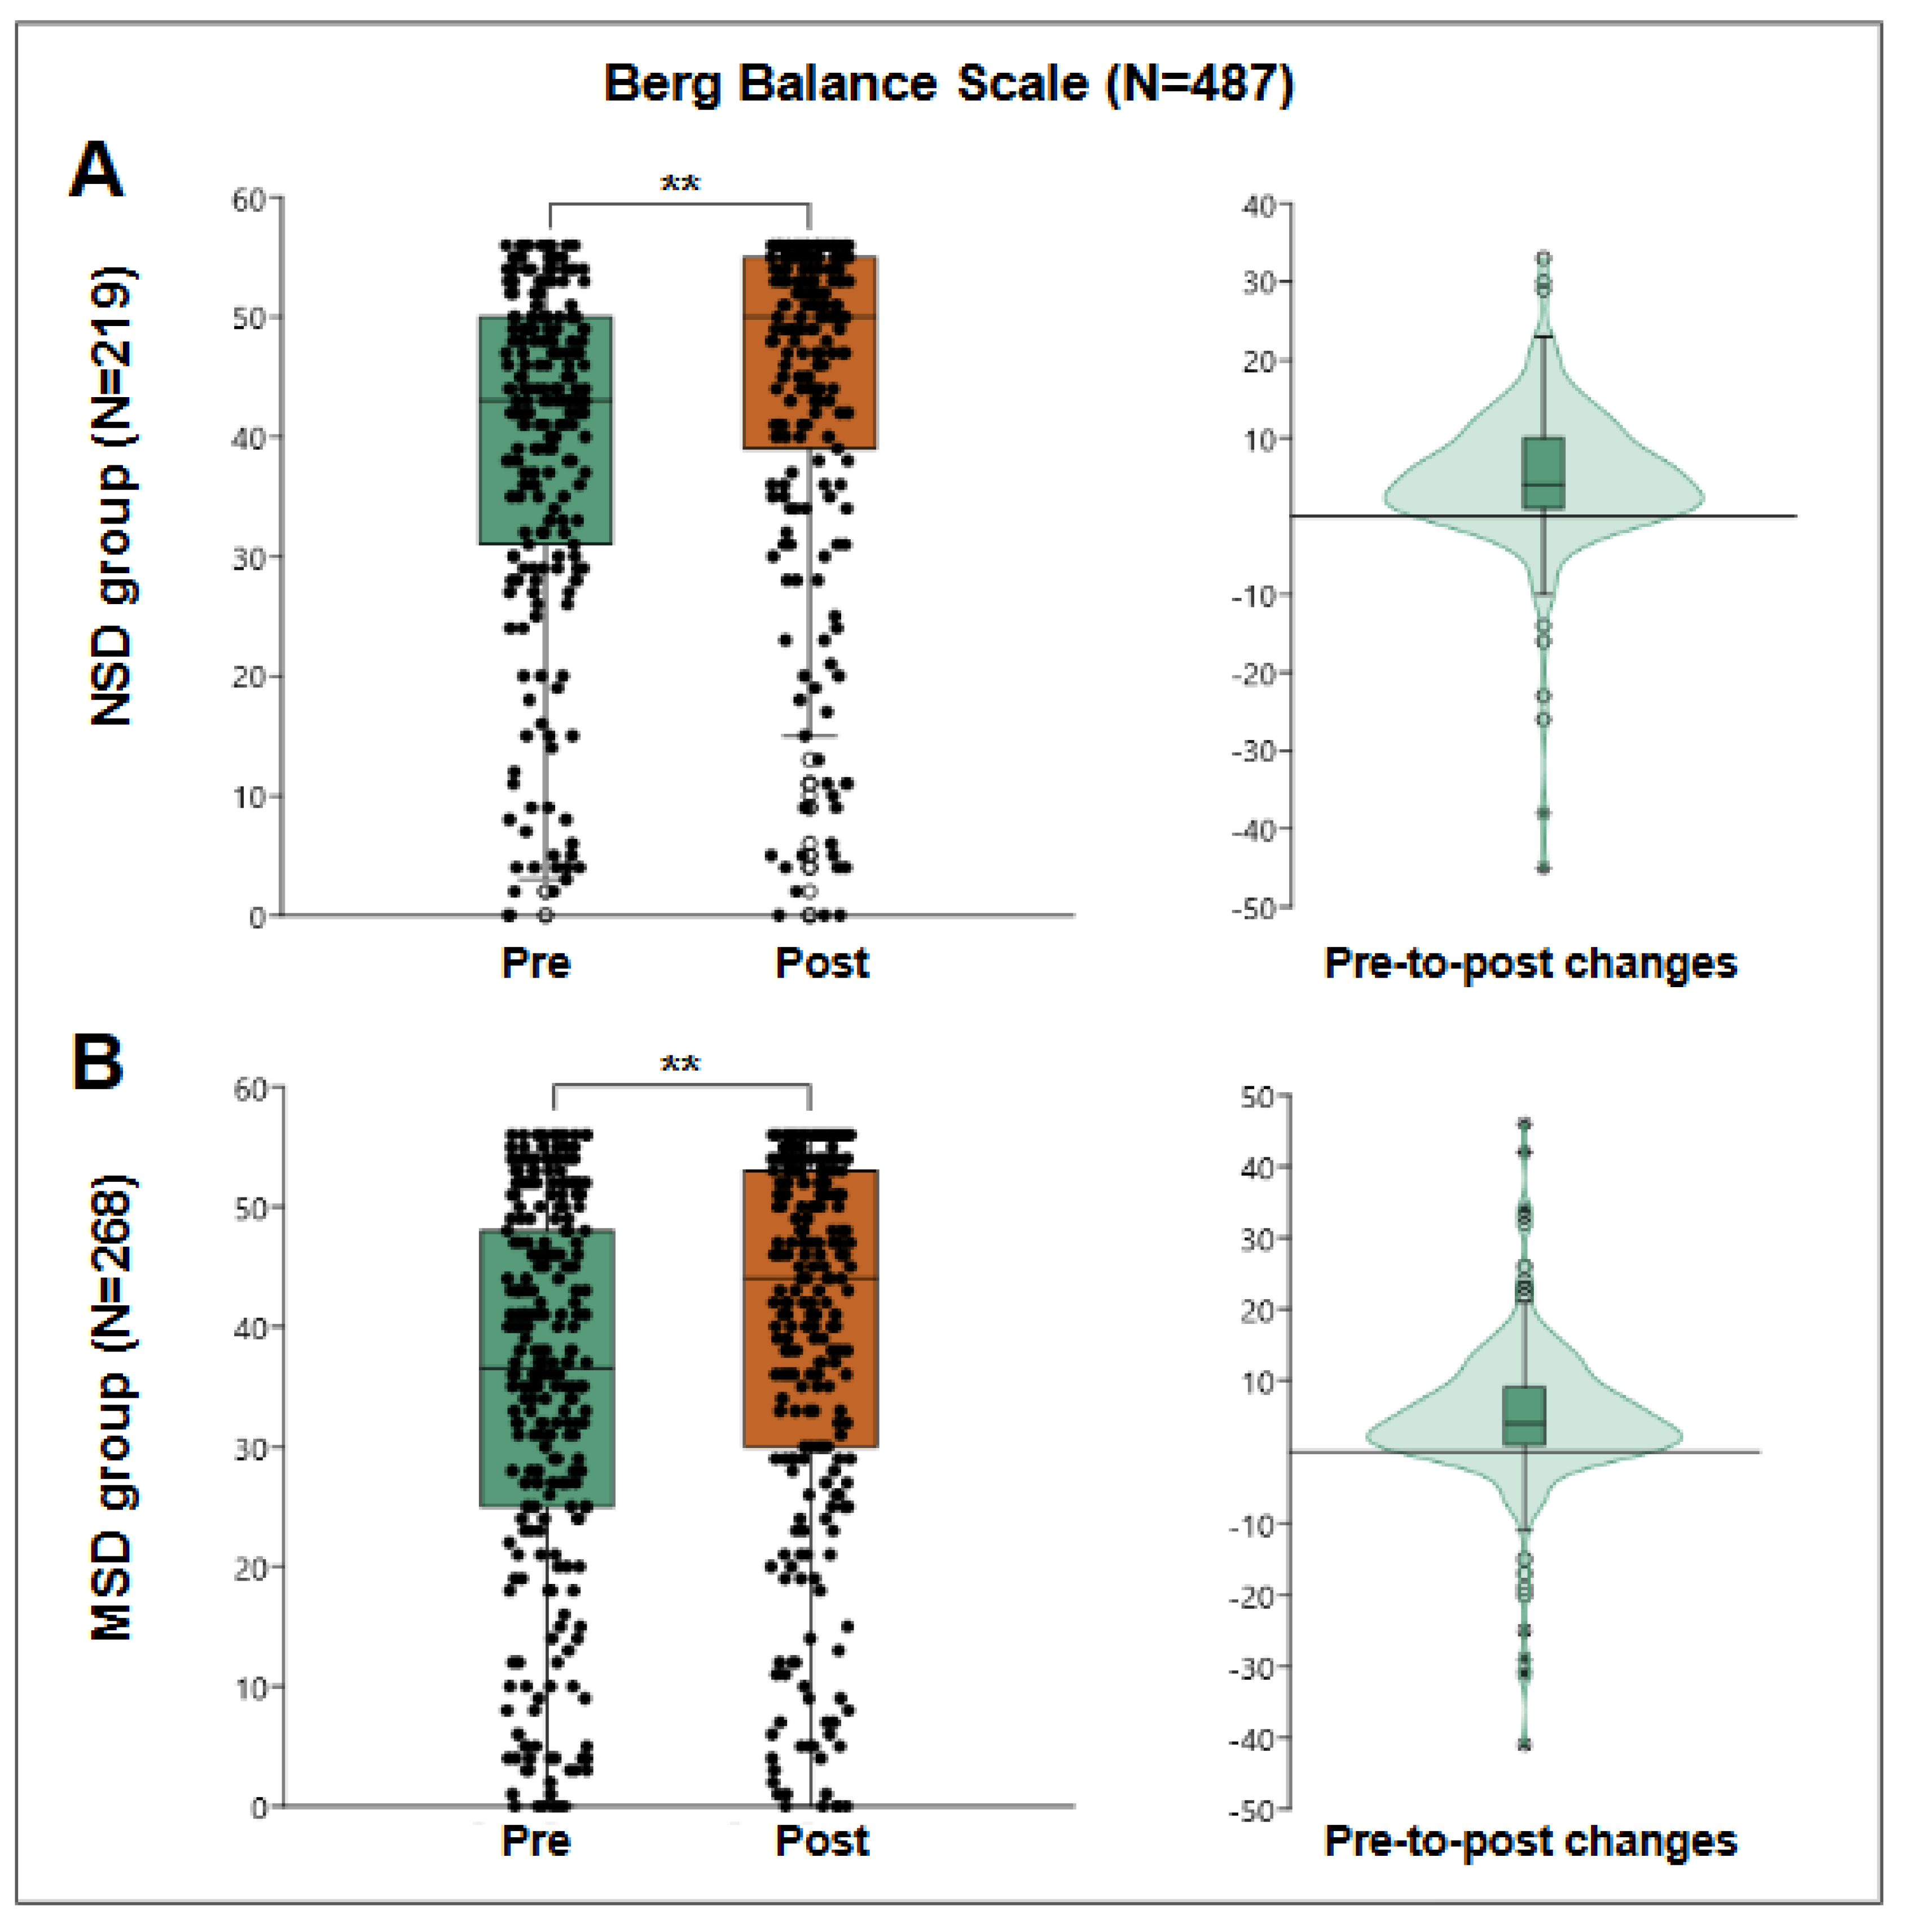
For the NSD group, 219 patients were evaluated, obtaining a pre-treatment median of 43 points and post-treatment of 50 points, obtaining a median pre-post change of 4 points with an interquartile range of 1 to 10, statistically significant Wilcoxon W=17340, p=5.53E-19. However, within those assessed, 8 users started and finished with the maximum score of 56 points. Looking again at pre-to-post change among the remaining 211 patients, the median change was 5 points, with an interquartile range of 1 to 10 points, better reflecting the behavior of the group.
For the MSD group, 268 patients were evaluated, obtaining a median pre-treatment score of 36.5 points and post-treatment score of 44 points, obtaining a median pre-post change of 4 points with an interquartile range of 1 to 9, statistically significant Wilcoxon W=25751, p=3.11E-21. However, within those assessed, 9 users started and finished with the maximum score of 56 points. When reanalyzing the pre-to-post change among the remaining 268 patients, both median and IQ range remained the same.
4. Discussion
4.1. Improvement in Motor Function
Improving motor function, particularly balance, is a key component in the rehabilitation of individuals with physical disabilities or limited mobility. The results of this study showed a significant increase in the Berg Balance Scale score, from 39 to 47 points, indicating a reduction in fall risk and an improvement in functional stability. Subgroup analysis revealed a significant pre-to-post increase, from 43 to 50 points for neurological conditions and from 36.5 to 44 points for musculoskeletal conditions. According to Lajoie and Gallagher (2004), the Berg Balance Scale is highly effective in predicting falls and guiding specific therapeutic interventions [24]. Additionally, Gillespie et al. (2012) emphasize that exercise programs, which include components of balance and strength, are effective in reducing fall risk among community-dwelling older adults [25]. This approach is supported by Horak et al. (2009), who introduced the BESTest, an assessment tool that allows for a detailed evaluation of postural control systems, facilitating the development of personalized treatments to address specific balance deficits [26]. The implementation of these strategies in rehabilitation programs helps to enhance patients’ safety, independence, and quality of life.
4.2. Impact on Functional Independence
The increase in the Barthel Index across both subgroups, from a median of 85 to 90 points, reflects a moderate improvement in functional independence, a crucial aspect of rehabilitation for older adults and individuals with disabilities. This improvement aligns with research highlighting how rehabilitation interventions, particularly those focused on functional activities and physical exercise, not only reduce dependency but also positively impact the quality of life for both patients and their caregivers. Cameron et al. (2013) demonstrated that interdisciplinary, multifactorial programs designed to comprehensively address frailty and functional limitations not only improve mobility and daily living activities but also foster greater physical and social resilience in patients [27]. Similarly, Chiu et al. (2003) emphasize the importance of tools like the Barthel Index in evaluating the effectiveness of interventions [28]. These tools enable healthcare professionals to identify key areas for designing personalized programs that maximize functional recovery and promote long-term social integration. This comprehensive approach underscores the necessity of implementing interventions specifically tailored to individual needs, ensuring sustainable improvements in functional independence and reducing the burden associated with daily care.
4.3. Reduction in Depressive Symptoms
The reduction in the Beck Depression Inventory score, from a median of 12 to 9 points in patients from the musculoskeletal group and from 12 to 9.5 points in the neurological group, indicates a significant decrease in depressive symptoms. This is crucial, as depression is prevalent among individuals with disabilities and negatively impacts their participation in rehabilitation. This finding aligns with research highlighting how physical activity and exercise programs can improve psychological well-being by reducing depressive symptoms and increasing patients’ motivation to engage in their treatment. Craft and Perna (2004) demonstrated that structured exercise is an effective intervention for treating depression, comparable in effectiveness to cognitive-behavioral therapy or antidepressant medications, with sustained long-term benefits [29]. Moschny et al. (2011) analyzed how patterns of physical activity in older adults are associated with better mental health, suggesting that promoting regular physical activity may be a key strategy for reducing depression in this population [30]. Additionally, Schuch et al. (2018) concluded that physical activity not only reduces depressive symptoms but also serves as a significant protective factor against the development of depression [31]. Despite these improvements, some patients continue to exhibit moderate levels of depression, highlighting the need for additional psychological interventions, such as cognitive-behavioral therapy, to maximize outcomes in this population. These findings underscore the importance of optimizing the psychological component of rehabilitation programs to achieve more comprehensive recovery.
4.4. Improvement in Physical Quality of Life and Mental Well-Being
The improvements in the physical component of the SF-36, from 28.13 to 41.25 points in the musculoskeletal group and from 28.13 to 38.13 points in the neurological group, reflect a significant advancement in the perception of physical health and vitality. This aligns with studies demonstrating how rehabilitation programs based on structured exercise improve the physical aspects of quality of life, which is essential for comprehensive rehabilitation [16]. Similarly, the mental component of the SF-36 showed an improvement from 47.5 to 62.5 points, indicating a positive impact on emotional well-being and patient motivation. Studies such as Vagetti et al. (2014) highlight that physical activity has a significant impact on the overall perception of quality of life, including psychological and emotional domains [32]. Additionally, King et al. (2000) note that specific physical activity programs, such as strengthening and flexibility exercises, not only improve physical functionality but also enhance mental well-being, leading to greater treatment adherence and more sustainable progress in patients [33].
4.5. Study Limitations
This study has several limitations, such as the absence of a control group, which makes it challenging to establish a direct causal relationship between the interventions and the observed improvements. Additionally, variability in treatment duration and the number of sessions could influence the results, as adherence to rehabilitation programs is a critical factor in optimizing functional and emotional outcomes. According to McLean et al. (2010), effective adherence is linked to strategies that integrate motivational and cognitive-behavioral components, which can enhance patient participation and short-term outcomes. Without a control group and a more standardized design, it is difficult to attribute the benefits exclusively to the applied interventions [34].
Another limitation is the potential self-selection bias, as only patients who were able to attend the sessions participated, potentially excluding those with greater physical limitations or logistical barriers. Additionally, the use of self-reported measures, such as the Beck Depression Inventory, although valuable for capturing subjective perceptions, may be influenced by factors such as social desirability. Studies such as Deshpande et al. (2011) highlight that while self-reported instruments are useful for measuring patient-centered outcomes, they should be complemented with objective methods to ensure a more robust evaluation and reduce potential biases [35]. These observations underscore the need to design future studies with greater methodological controls and combined tools to evaluate functional and emotional outcomes more comprehensively.
4.6. Implications for Clinical Practice
The results of this study emphasize the importance of implementing comprehensive and multidisciplinary rehabilitation programs that simultaneously address physical, emotional, and social dimensions. Evidence of significant improvements in functional independence, balance, and emotional well-being supports the effectiveness of these interventions in meeting the complex needs of older adults and people with disabilities. This aligns with previous recommendations highlighting the relevance of holistic approaches in rehabilitation to maximize therapeutic benefits and improve quality of life [32,33]
This study demonstrates how higher therapeutic dosage, with a median of 135 sessions distributed over 16 months, leads to broader and more sustained changes. Results include notable improvements in balance, as assessed by the Berg Balance Scale (increase from 39 to 47 points), and a reduction in fall risk. Additionally, emotional progress was observed, reflected in a decrease in Beck Depression Inventory scores (from 12 to 9 points), as well as functional gains, such as an increase in independence measured by the Barthel Index. These findings highlight the importance of integrating emotional components into rehabilitation through interventions tailored in duration and intensity to achieve comprehensive recovery.
In contrast, the study by Barría et al. (2024), which implemented a shorter program (82 hours over 4 months), showed significant improvements in balance (increase from 38 to 44 points) and fall risk reduction [36]. However, it did not show relevant changes in emotional or functional dimensions, reinforcing the hypothesis that greater intensity and duration of interventions have a direct impact on optimizing broader therapeutic outcomes.
These findings align with research emphasizing the relationship between appropriate dosage of interventions and the sustainability of their effects on patients’ quality of life, functionality, and emotional well-being [10,11]. In this context, rehabilitation professionals are encouraged to adjust the frequency and intensity of sessions based on individual patient needs. Furthermore, it is crucial to periodically assess mental health and incorporate, when necessary, more frequent or personalized psychological support sessions, which could improve treatment adherence and ensure more sustained emotional and functional outcomes.
Overall, these results reinforce the importance of a personalized and intensive approach to maximize therapeutic benefits and promote comprehensive and sustainable recovery in populations with complex needs.
4.7. Recommendations for Future Studies
Future studies should include a control group and conduct long-term follow-ups to assess the sustainability of the observed improvements, considering that the positive effects of rehabilitation interventions tend to diminish over time if not maintained. According to Sherrington et al.(2008), the effectiveness of exercise programs in preventing falls in older adults is linked to key factors such as intensity, the inclusion of balance training, and the duration of the intervention [37]. These findings highlight the importance of designing strategies that ensure the continuity of exercises to maximize and prolong their benefits.
5. Conclusions
In conclusion, this study provides significant evidence that structured rehabilitation interventions can improve motor function, functional independence, and emotional well-being in individuals with neuromusculoskeletal conditions. The results demonstrate that participants experienced notable improvements in balance and a reduction in fall risk, as well as an increase in their perception of physical and mental health.
This study reinforces the relevance of personalized and intensive care in rehabilitation and underscores the importance of a multidisciplinary approach that considers both physical and emotional aspects in recovery. Future studies should focus on evaluating the long-term effects of these interventions and exploring additional measures for a more comprehensive assessment of improvements in motor function and quality of life.
Author Contributions
Conceptualization, P.B. and B.C.; methodology, P.B. and B.C.; software, P.B.; validation, P.B., B.C and A.A.; formal analysis, P.B. and J.A-G.; investigation, P.B. and B.C. ; resources, A.A. and B.C.; data curation, J.A-G. and P.B.; writing—original draft preparation, P.B. and J.A-G.; writing—review and editing, A.Y, F. C-E and C.C.; visualization, J.A-G.; supervision, A.A. and B.C.; project administration, B.C.; funding acquisition, B.C.. All authors have read and agreed to the published version of the manuscript.
Funding
This research was funded by the regional government of Magallanes and Chilean Antarctica, BIP N°40047229-0.
Institutional Review Board Statement
The study was conducted in accordance with the Declaration of Helsinki, and approved by the Institutional Review Board of the Rehabilitation Center Club de Leones Cruz del Sur (approval code CRCS_UID_010223).
Informed Consent Statement
Informed consent was obtained from all subjects involved in the study.
Data Availability Statement
The data are available upon reasonable request. To access them, please contact PB by email at pbarria@rehabilitamos.org.
Acknowledgments
This study was made possible thanks to the Comprehensive Rehabilitation Program, an initiative funded by the regional government of Magallanes and the Chilean Antarctic. The program provides care and support to patients from the cities of Punta Arenas, Puerto Natales, and Porvenir in Chile, who require physical, mental, or social rehabilitation. Its multidisciplinary team of healthcare professionals designs and implements personalized rehabilitation plans with the aim of improving patients’ quality of life. In addition to individual therapies, group sessions are offered to promote social inclusion and interaction among participants. The service is free of charge and accessible through medical referral, serving as an essential tool for the recovery and reintegration of individuals into society.
Conflicts of Interest
The authors declare no conflicts of interest.
References
- Mahesh, P.; Gunathunga, M.; Jayasinghe, S.; Arnold, S.; Liyanage, S. Post-stroke Quality of Life Index: A quality of life tool for stroke survivors from Sri Lanka. Heal. Qual. Life Outcomes 2020, 18, 1–11. [Google Scholar] [CrossRef]
- Prynn, J.E.; Polack, S.; Mactaggart, I.; Banks, L.M.; Hameed, S.; Dionicio, C.; Neupane, S.; Murthy, G.; Oye, J.; Naber, J.; et al. Disability among Older People: Analysis of Data from Disability Surveys in Six Low- and Middle-Income Countries. Int. J. Environ. Res. Public Heal. 2021, 18, 6962. [Google Scholar] [CrossRef]
- Teasell, R.; Salbach, N.M.; Foley, N.; Mountain, A.; Cameron, J.I.; de, Jong, A. ; et al. Canadian Stroke Best Practice Recommendations: Rehabilitation, Recovery, and Community Participation following Stroke. Part One: Rehabilitation and Recovery Following Stroke; 6th Edition Update 2019. Int. J. Stroke 2020, 15, 763–88. [Google Scholar] [CrossRef]
- Ravan, J.; Pattnaik, J.; Panda, U.; Samal, B.; Das, S. Validity of biopsychosocial model of intervention in contemporary medical practice: Walking a few extra miles. J. Integr. Med. Res. 2023, 1, 74. [Google Scholar] [CrossRef]
- Wade, D. Rehabilitation–a new approach. Part four: a new paradigm, and its implications. Clin. Rehabil. 2015, 30, 109–18. [Google Scholar]
- World Health Organization. (2001). International Classification of Functioning, Disability and Health: ICF. World Health Organization.
- Cortés, Q.C.; Salvatierra, M.A.; Papuzinski, A.C. Intervención ambulatoria basada en categorización por complejidad en neurorehabilitación. Rev. Chil. De Neuro-Psiquiatría. 2023, 61, 23–31. [Google Scholar]
- French, B.; Thomas, L.H.; Coupe, J.; McMahon, N.E.; Connell, L.; Harrison, J.; et al. Repetitive task training for improving functional ability after stroke. Cochrane Database Syst. Rev. 2016. [Google Scholar]
- Xing, Y.; Bai, Y. A Review of Exercise-Induced Neuroplasticity in Ischemic Stroke: Pathology and Mechanisms. Mol. Neurobiol. 2020, 57, 4218–4231. [Google Scholar] [CrossRef]
- Schneider, E.J.; A Lannin, N.; Ada, L.; Schmidt, J. Increasing the amount of usual rehabilitation improves activity after stroke: a systematic review. J. Physiother. 2016, 62, 182–187. [Google Scholar] [CrossRef]
- Winstein, C.J.; Stein, J.; Arena, R.; Bates, B.; Cherney, L.R.; Cramer, S.C.; Deruyter, F.; Eng, J.J.; Fisher, B.; Harvey, R.L.; et al. Guidelines for Adult Stroke Rehabilitation and Recovery. Stroke 2016, 47, E98–E169. [Google Scholar] [CrossRef] [PubMed]
- Turolla, A.; Venneri, A.; Farina, D.; Cagnin, A.; Cheung, V.C.K. Rehabilitation Induced Neural Plasticity after Acquired Brain Injury. Neural Plast. 2018, 2018, 1–3. [Google Scholar] [CrossRef]
- Bickenbach, J.; Sabariego, C.; Stucki, G. Beneficiaries of Rehabilitation. Arch. Phys. Med. Rehabil. 2021, 2, 543–8. [Google Scholar] [CrossRef] [PubMed]
- Wade, D.T. Outcome measurement and rehabilitation. Clin. Rehabil. 1999, 13, 93–5. [Google Scholar] [CrossRef]
- Rauch, A.; Cieza, A.; Stucki, G. How to apply the International Classification of Functioning, Disability and Health (ICF) for rehabilitation management in clinical practice. Eur. J. Phys. Rehabilitation Med. 2008, 44, 329–342. [Google Scholar]
- Ware, J.E., Jr.; Sherbourne, C.D. The MOS 36-item short-form health survey (SF-36). I. Conceptual framework and item selection. Medical care. 1992, 30, 473–83. [Google Scholar]
- Shah, S.; Vanclay, F.; Cooper, B. Improving the sensitivity of the Barthel Index for stroke rehabilitation. J. Clin. Epidemiol. 1989, 42, 703–709. [Google Scholar] [CrossRef] [PubMed]
- Wade, D.T.; Collin, C. The Barthel ADL Index: A standard measure of physical disability? International Disability Studies. 1988, 10, 64–7. [Google Scholar] [CrossRef]
- Turner, J. Emotional dimensions of chronic disease. West. J. Med. 2000, 172, 124–128. [Google Scholar] [CrossRef] [PubMed]
- Beck, A.T.; Ward, C.H.; Mendelson, M.; Mock, J.; Erbaugh, J. An Inventory for Measuring Depression. Arch. Gen. Psychiatry 1961, 4, 561–571. [Google Scholar] [CrossRef]
- Berg KO, Wood-Dauphinee SL, Williams JI, Maki B. Measuring balance in the elderly: validation of an instrument. Canadian journal of public health = Revue canadienne de sante publique. 1992, 83 Suppl 2, S7-11.
- Muir, S.W.; Berg, K.; Chesworth, B.; Klar, N.; Speechley, M. Quantifying the magnitude of risk for balance impairment on falls in community-dwelling older adults: a systematic review and meta-analysis. J. Clin. Epidemiology 2010, 63, 389–406. [Google Scholar] [CrossRef]
- Mahoney, F.I.; Barthel, D.W. Functional evaluation: The Barthel Index. Md. State Med. J. 1965, 14, 61–65. [Google Scholar] [PubMed]
- Lajoie, Y.; Gallagher, S. Predicting falls within the elderly community: comparison of postural sway, reaction time, the Berg balance scale and the Activities-specific Balance Confidence (ABC) scale for comparing fallers and non-fallers. Arch. Gerontol. Geriatr. 2003, 38, 11–26. [Google Scholar] [CrossRef]
- Gillespie, L.D.; Robertson, M.C.; Gillespie, W.J.; Sherrington, C.; Gates, S.; Clemson, L.M.; E Lamb, S. Interventions for preventing falls in older people living in the community. Cochrane Database Syst. Rev. 2012, 2021, CD007146. [Google Scholar] [CrossRef]
- Horak, F.B.; Wrisley, D.M.; Frank, J. The Balance Evaluation Systems Test (BESTest) to Differentiate Balance Deficits. Phys. Ther. 2009, 89, 484–498. [Google Scholar] [CrossRef]
- Cameron, I.D.; Fairhall, N.; Langron, C.; Lockwood, K.; Monaghan, N.; Aggar, C.; Sherrington, C.; Lord, S.R.; E Kurrle, S. A multifactorial interdisciplinary intervention reduces frailty in older people: randomized trial. BMC Med. 2013, 11, 65–65. [Google Scholar] [CrossRef] [PubMed]
- Chiu A y Y, Au-Yeung SSY, Lo SK. A comparison of four functional tests in discriminating fallers from non-fallers in older people003 Jan 7;25(1):45–50. Disability and rehabilitation 2003, 25, 45–50. [Google Scholar]
- Craft, L.L.; Perna, F.M. The Benefits of Exercise for the Clinically Depressed. Prim. Care Companion J. Clin. Psychiatry 2004, 6, 104–111. [Google Scholar] [CrossRef] [PubMed]
- Moschny, A.; Platen, P.; Klaaßen-Mielke, R.; Trampisch, U.; Hinrichs, T. Physical activity patterns in older men and women in Germany: a cross-sectional study. BMC Public Heal. 2011, 11, 559–559. [Google Scholar] [CrossRef]
- Schuch, F.B.; Vancampfort, D.; Firth, J.; Rosenbaum, S.; Ward, P.B.; Silva, E.S.; Hallgren, M.; De Leon, A.P.; Dunn, A.L.; Deslandes, A.C.; et al. Physical Activity and Incident Depression: A Meta-Analysis of Prospective Cohort Studies. Am. J. Psychiatry 2018, 175, 631–648. [Google Scholar] [CrossRef]
- Vagetti, G.C.; Barbosa, V.C.; Moreira, N.B.; Oliveira, V.D.; Mazzardo, O.; Campos, W.D. Association between physical activity and quality of life in the elderly: A systematic review, 2000-2012. Braz. J. Psychiatry 2014, 36, 76–88. [Google Scholar] [CrossRef]
- Comparative effects of two physical activity programs on measured and perceived physical functioning and other health-related quality of life outcomes in older adults. The Journals of Gerontology Series A: Biological Sciences and Medical Sciences. 2000, 55, M74–83.
- McLean, S.M.; Burton, M.; Bradley, L.; Littlewood, C. Interventions for enhancing adherence with physiotherapy: A systematic review. Man. Ther. 2010, 15, 514–521. [Google Scholar] [CrossRef] [PubMed]
- Deshpande, P.R.; Rajan, S.; Sudeepthi, B.L.; Abdul Nazir, C.P. Patient-reported outcomes: A new era in clinical research. Perspect. Clin. Res. 2011, 2, 137–144. [Google Scholar] [CrossRef] [PubMed]
- Barría, P.; Andrade, A.; Gomez-Vargas, D.; Yelincic, A.; Roberti, F.; Bahamonde, E.; et al. Multidisciplinary Home-Based Rehabilitation Program for Individuals With Disabilities: Longitudinal Observational Study. JMIR Rehabil. Assist. Technol. 2024, 11, e59915. [Google Scholar]
- Sherrington, C.; Whitney, J.C.; Lord, S.R.; Herbert, R.D.; Cumming, R.G.; Close, J.C.T. Effective exercise for the prevention of falls: a systematic review and meta-analysis. J. Am. Geriatr. Soc. 2008, 56, 2234–43. [Google Scholar]
Figure 1.
Representation of the enrollment, intervention and principal assessments implemented in this study. BBS: Berg Balance Scale; BDI-II: Beck Depression Inventory II; BI: Barthel Index; QoF: Quality of Life.
Figure 1.
Representation of the enrollment, intervention and principal assessments implemented in this study. BBS: Berg Balance Scale; BDI-II: Beck Depression Inventory II; BI: Barthel Index; QoF: Quality of Life.
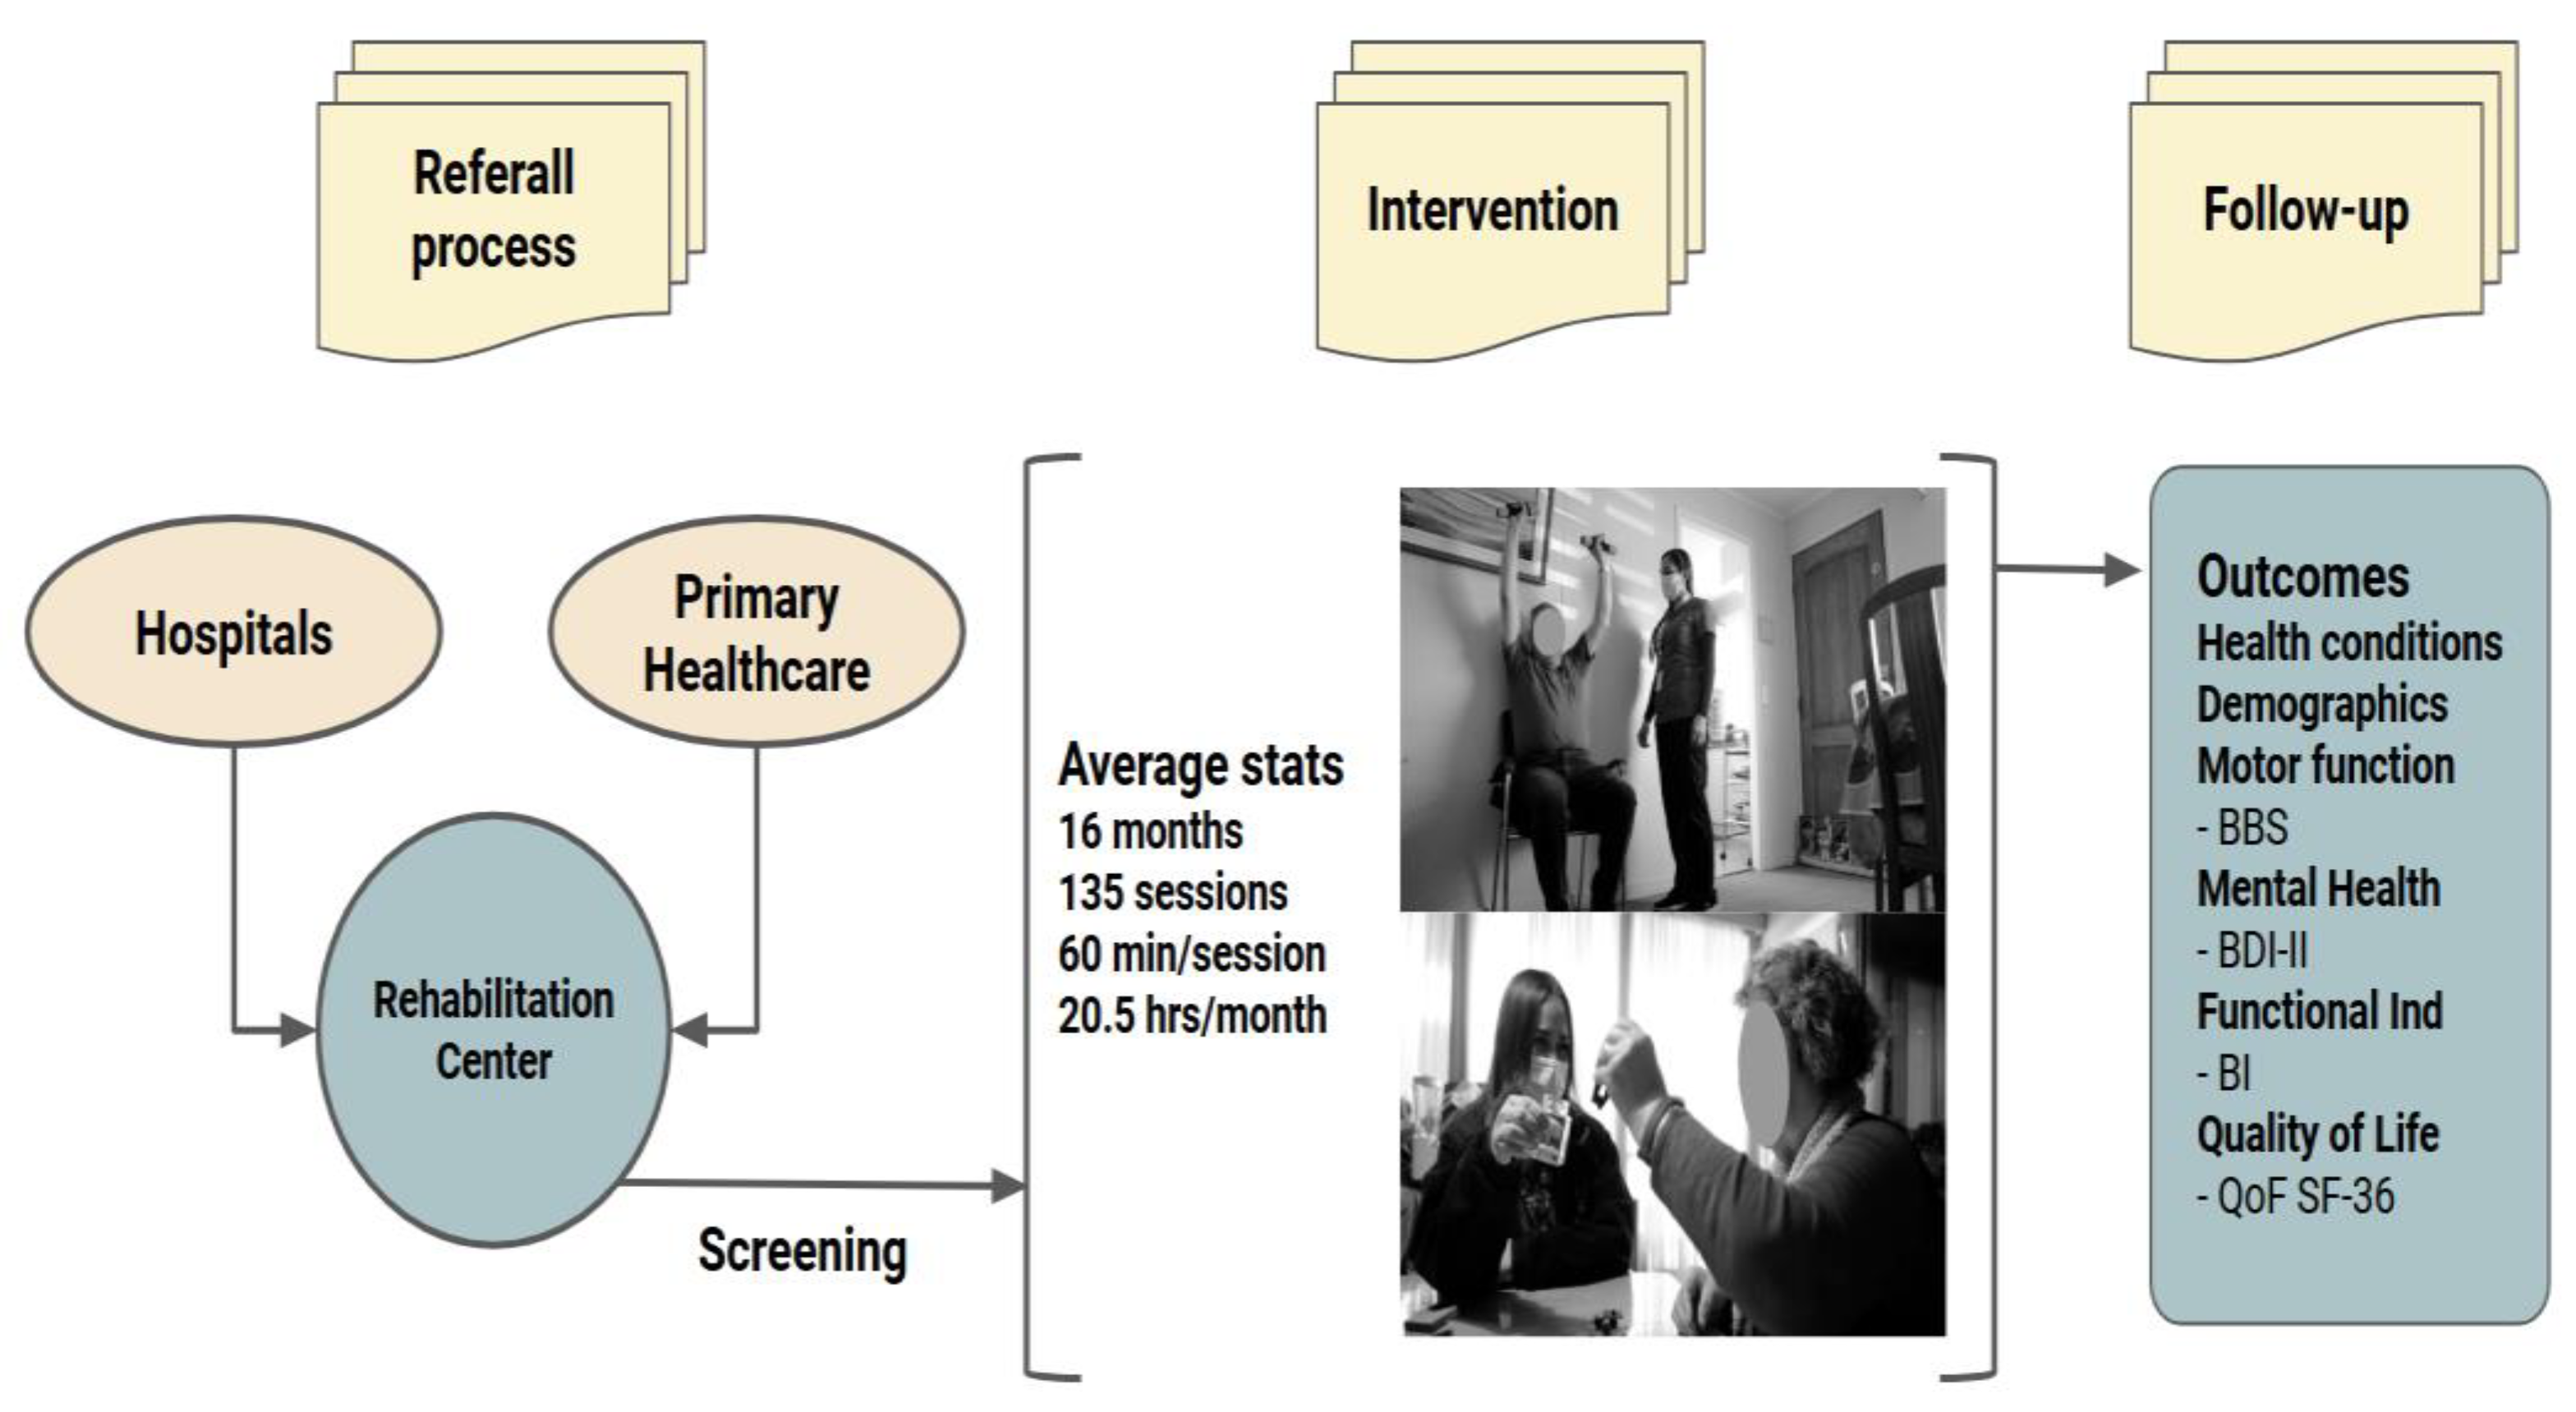
Figure 2.
Histogram of age in years, showing a statistically significant deviation from a normal distribution (solid line).
Figure 2.
Histogram of age in years, showing a statistically significant deviation from a normal distribution (solid line).
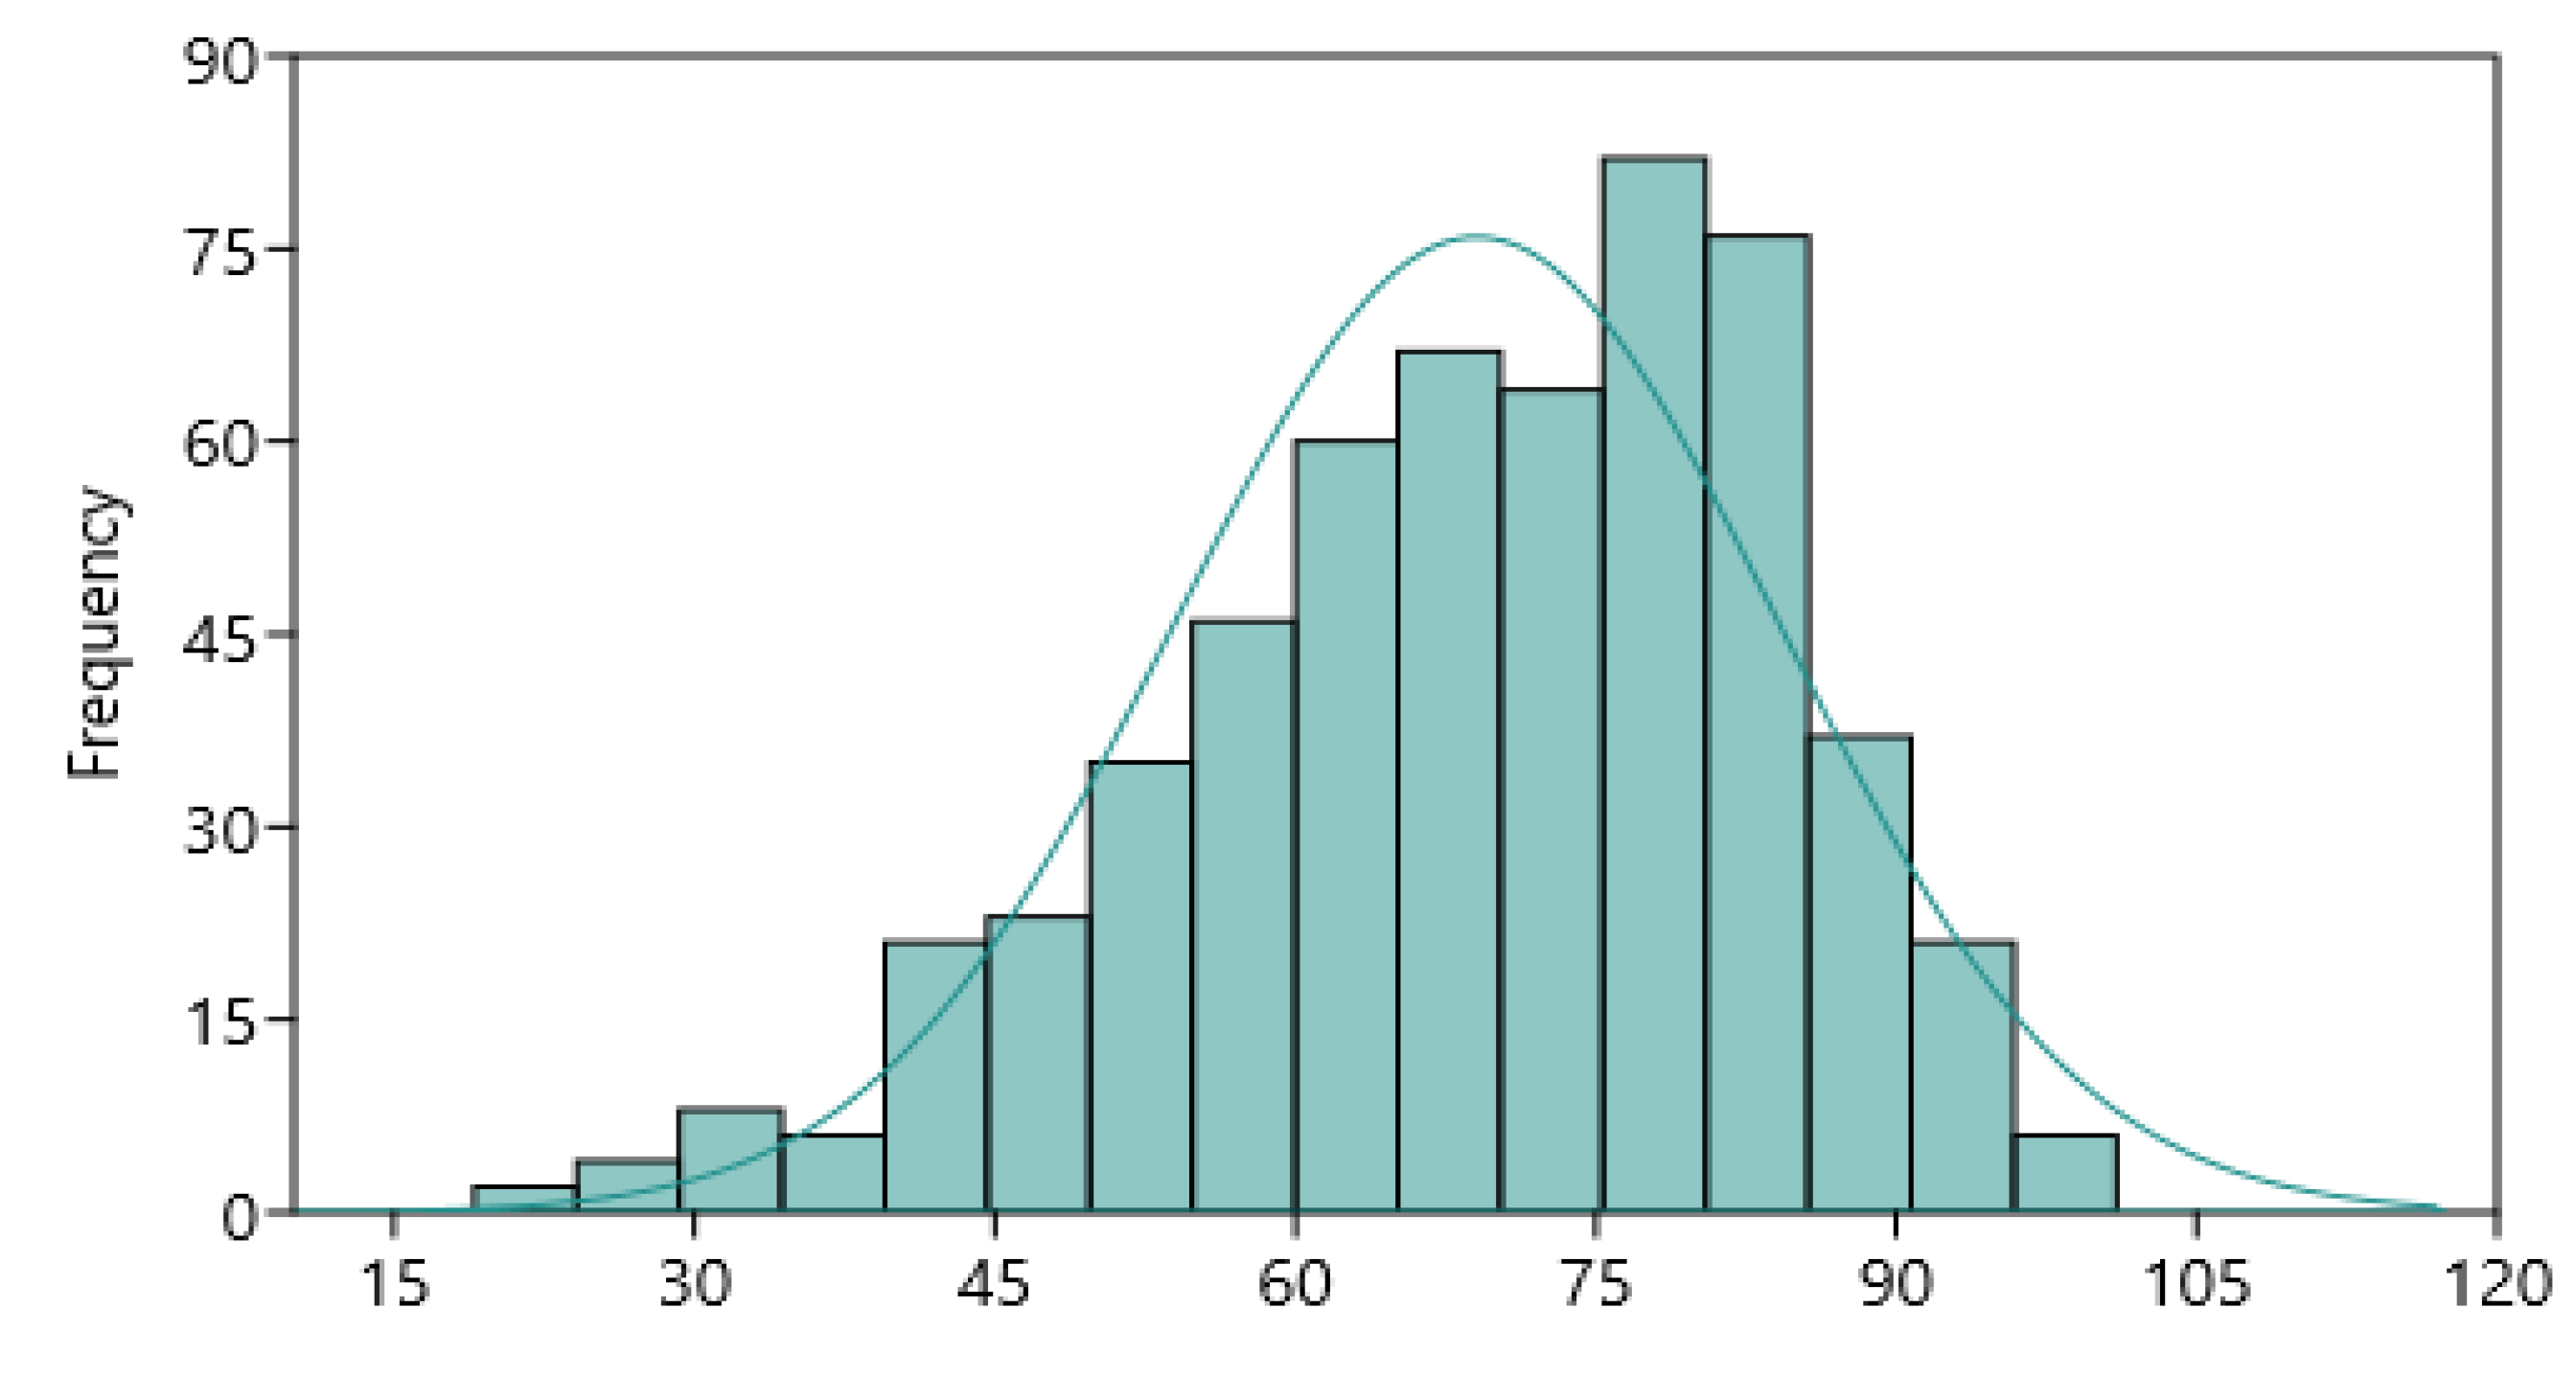
Figure 3.
SF36- Physical Component results. “A” shows results of NSD group (N=138), a box plot of pre- and post-results (left) and a violin plot of the individual differences (right). “B” shows results of MSD group (N=205), a box plot of pre- and post-results (left), and a violin plot of the individual differences (right). **: p<0.001.
Disclaimer/Publisher’s Note: The statements, opinions and data contained in all publications are solely those of the individual author(s) and contributor(s) and not of MDPI and/or the editor(s). MDPI and/or the editor(s) disclaim responsibility for any injury to people or property resulting from any ideas, methods, instructions or products referred to in the content. |
© 2024 by the authors. Licensee MDPI, Basel, Switzerland. This article is an open access article distributed under the terms and conditions of the Creative Commons Attribution (CC BY) license (http://creativecommons.org/licenses/by/4.0/).
Copyright: This open access article is published under a Creative Commons CC BY 4.0 license, which permit the free download, distribution, and reuse, provided that the author and preprint are cited in any reuse.


