
Submitted:
26 November 2024
Posted:
27 November 2024
You are already at the latest version
Preprints on COVID-19 and SARS-CoV-2
Abstract
Determining an individual’s humoral immune reactivity to a pathogen, autoantigen, or environmental agent is traditionally accomplished through assessment of specific antibody levels in blood. However, in many instances, titers of specific antibodies decline over time and thus do not faithfully reveal prior antigen exposure or establishment of immunological memory. To estimate an individual’s humoral immune competence, it is therefore necessary to assess functional B cell memory. Here, we describe novel B cell ELISPOT and FluoroSpot assays (collectively referred to as ImmunoSpot®) that can be rapidly developed and validated to characterize the memory B cell repertoire specific for any desired antigen ex vivo and at single-cell resolution. Moreover, multiplexed variants of the B cell FluoroSpot assay enable high-throughput testing of antigen-specific B cells secreting distinct antibody classes and/or IgG subclasses, with minimal cell material requirements. B cell ImmunoSpot assays also enable measurement of affinity distributions within the antigen-specific memory B cell compartment and permit cross-reactivity measurements that can provide insights into B cell memory established against future pathogen variants. Collectively, the ImmunoSpot® system presented here is highly reproducible, and can be readily validated for regulated tests. The newly gained ability to monitor the antigen-specific memory B cell compartment should catalyze a more comprehensive understanding of humoral immunity in health and disease.
Keywords:
ELISPOT
; FluoroSpot
; immune monitoring
; affinity maturation
; Ig class
; high-throughput
; SARS-CoV-2
; cross-reactivity
Introduction
Assessments of whether an individual possesses protective immunity to a specific pathogen after natural infection, or following vaccination, are crucial surrogates (“biomarkers”) for predicting clinical protection against exposure or re-exposure to that pathogen [1]. Additionally, the detection of self-reactive antibodies plays a critical role in the diagnosis of autoimmune diseases [2] or allergies [3]. Antibodies also contribute to organ transplant rejection [4] and anti-tumor immunity [5]. In each of these instances, routine clinical diagnostic assessments are commonly made solely based on the presence of measurable serum antibody reactivity. However, here we argue that to acquire a more comprehensive assessment of an individual´s humoral immune status, it is mandatory to measure antigen-specific memory B cells themselves. This is because serum antibody measurements reflect only one transient arm of the humoral defense (the “first wall”, as defined below), and frequently provide either incomplete, or even false-negative information on the other, i.e. the antigen-specific memory B cell compartment (the “second wall”), that in large part has gone unstudied so far.
There are multiple reasons why memory B cell assays are currently excluded from standard immune diagnostics, the most likely of which is that the quantification of antibody titers, quite straightforward to measure, has been assumed to accurately reflect on the antigen-specific memory B cell compartment as well. This rendered it apparently unnecessary to pursue complicated and expensive functional cellular assays, also perceived as challenging to standardize, which are needed to directly examine the antigen-specific memory B cells themselves. However, recently it has become more apparent that terminally differentiated antibody-secreting plasma cells and long-lived memory B cells, which retain the capacity to rapidly respond to a future pathogen challenge, do not arise in a fixed ratio to each other [6], and consequently that serum antibody levels and memory B cell frequencies are frequently discordant [7]. Therefore, assessing only the serum antibodies originating from plasma cells cannot provide a full picture of an individual’s humoral immune competence. Clarity in the analysis of B cell lineage differentiation pathways has resulted in the acceptance of an alternative paradigm (reviewed in [8]), and which will be discussed in the following.
Memory Cell or Plasma Cell Development? – B Cell Fate Decisions
Traditionally, antigen-specific B cell responses lead to formation of germinal centers (GCs) within the spleen and/or draining lymph node(s) (LN). It is now widely accepted that the generation of long-lived memory B cells and plasma cells in GCs is controlled by the affinity of the individual differentiating GC B cell´s antigen receptor (Figure 1 and [9,10]). As B cells proliferate and their antigen receptors undergo somatic hypermutation (SHM) within the GC, progeny arise bearing receptors with different affinities for the eliciting antigen (called the homotypic antigen). Because the acquisition of SHMs is largely random, some of the mutated B cell receptors (BCR) will, by chance, have acquired an increased affinity for the same homotypic antigen, but most will not. (The significance of the latter is, however, that they may have increased affinity for related heterotypic antigenic variants, see below). Differentiating GC B cells endowed with an increased affinity for the antigen will preferentially receive stimulatory cues (provided by follicular helper T cells) instructing them to undergo additional rounds of proliferation with accompanying SHM of their BCR. Following multiple waves of successive positive selection, the GC B cells which have attained the highest affinity for the homotypic antigen will differentiate into plasma cells capable of secreting large quantities of affinity-matured antibody. In contrast, GC B cells that underwent positive selection but which still express lower affinity BCR for the homotypic antigen will exit the GC and enter into the long-lived memory B cell compartment. Thus, plasma cells and memory B cells differentiate along different pathways controlled by BCR affinity-based selection for the homotypic antigen. Consequently, neither the frequency nor the affinity distribution of the resulting plasma and memory B cell repertoires are mirror images of each other, and neither are the fates and lifespans of these two cell types [6,11]. Hence the abundance of specific antibody in serum (and other bodily fluids) and the frequency of antigen-specific memory B cells are not inherently linked [7]. Therefore, while both memory B cells and plasma cells originate from the same progenitor B cell pool, they possess fundamentally different roles for mediating humoral immune defense [8].
Circulating Antibodies Represent a First Wall of Humoral Defense, Memory B Cells the Second
The plasma cells that arise during an immune response can be long-lived and are capable of secreting large quantities of specific antibody for many years (potentially decades) [11,12]. However, plasma cells must take up residence in specialized environmental niches, such as within the bone marrow, to achieve this extended survival [13]. Recent data suggest that plasma cell lifespans are heterogeneous and fall on a continuum, with only a small fraction surviving for >60 days [14]. The antibody-secreting cell turnover is set, therefore, by intrinsic lifespan limits, with steady-state population dynamics governed by niche vacancy rather than merely by displacement. This dynamic affects the serum antibody titer measured at any particular time. This is because secreted antibody molecules have short half-lives in vivo and subsequently the maintenance of serum antibody titers requires constant replenishment by plasma cells. The half-lives of IgG1, IgG2 and IgG4 in humans are 21-28 days, whereas for IgG3 it is only a week [15]. The half-lives of IgA and IgM is shorter at only 3-7 days [16,17] and IgE exhibits the shortest half-life of 2-3 days [18].
The specific serum antibodies produced following an initial (“primary”) immune response aim not only at eliminating the antigen, but also later on to prevent the re-entry and dissemination of the same (homotypic) antigen. Such pre-formed antibodies serve as an immediately deployable “first wall” of humoral immune defense. If such antibody titers decline, however, they fail to confer protection from (re-) infection. Crucially, even when protective antibody levels are maintained against the homotypic pathogen strain, the evolution of variants under pressure to evade neutralizing activity can still cause breakthrough infection(s) with heterotypic variants, as seen for example with circulating seasonal influenza isolates, or in the recent COVID-19 pandemic. Under these circumstances, maintaining or even increasing antibody titers by booster vaccinations against the homotype is not necessarily effective at increasing protection against heterotypic variants. However, when encountering the heterotype, the immune response will not necessarily have to “start from scratch” in generating an effective antibody response, but this is where the antigen-experienced and somatically mutated memory B cell repertoire acquires its critical importance. Inevitably, there will be BCRs present within the memory B cell pool elicited by the homotypic antigen that were not selected for continued affinity maturation and terminal differentiation into plasma cells, yet, at least a fraction of these BCR will have an adequate, if not increased, affinity for a heterotypic variant. Importantly, such heterotype-specific memory B cells are present at much higher frequencies than would otherwise exist in a naive B cell pool, and further, many of such memory B cells would already have undergone Ig class-switch recombination (CSR). Hence, such heterotype-specific memory B cells are poised for reengagement into a secondary-type antibody response even at the first encounter with the heterotypic variant, enabling the development of more rapid and robust humoral immunity. The heterotype-specific memory B cells can either rapidly differentiate into antibody-secreting cells (ASC) following an antigen-stimulated proliferative burst, or they can (re-)enter into GCs in order to acquire additional somatic mutations that serve to improve their BCR affinity for the new variant antigen. In this way, memory B cells provide the “second wall” of humoral host defense.
From the above considerations, it is clear that assessing antigen-specific serum antibodies provides only a snapshot of the current status of humoral immunity and says little about actual B cell memory and nothing at all about the ability of an individual to respond to renewed challenges by the same, or a variant pathogen. In contrast, assessing the capacities of memory B cells to recognize target antigens provides valuable information on the B cell system’s potential to engage in defense reactions in the future.
Accumulating Evidence Suggests That Serum Antibody Titers and Frequencies of Peripheral Memory B Cells Yield Different Information About Humoral Immunity
We performed an extensive study comparing anti-SARS-CoV-2, EBV and influenza antibody titers with memory B cells specific for the same antigens [7]. We believe this study to be the first of its kind, made possible by the recent development of the ImmunoSpot® technique that enabled robust and reproducible identification and quantification of the relevant memory B cells. Many individuals with verified SARS-CoV-2 infections had essentially undetectable serum antibody reactivity, but nonetheless some possessed highly increased frequencies of antigen-specific memory B cells. We have also observed this phenomenon in the case of the persistent herpesvirus human cytomegalovirus (HCMV) [19], with memory B cells (and T cells) detectable in the absence (or near-absence) of specific serum antibody reactivity. Thus, compared with antibody titers, assessment of memory B cells may be more accurate for assessing prior antigen exposure, i.e., individuals who are essentially seronegative for a certain antigen may often possess antigen-specific memory B cells, sometimes even at high frequencies (e.g. see Figure 2, and [7]). The potential clinical relevance of these studies should not be overlooked. The disparity between seronegativity for HCMV despite clear evidence for HCMV antigen-specific memory B (and T) cells in donors sourced from FDA-approved blood banks [19] suggests that routine serological testing of blood donors for HCMV, a potentially dangerous pathogen in immunosuppressed individuals, may not identify all infected donors.
Of the antigens that we tested in this regard, SARS-CoV-2 proteins were particularly informative because SARS-CoV-2 Spike (S) and Nucleocapsid (N) antigens were neoantigens before the emergence and spread of this virus, and memory B cells specific for SARS-CoV-2 S an N antigens were not detected in PBMC cryopreserved before the COVID-19 pandemic using ImmunoSpot® [7]. However, for PBMC collected during the pandemic, the presence of specific memory B cells aligned with PCR-confirmed SARS-CoV-2 infection (much more reliably than did seropositivity). Furthermore, SARS-CoV-2 N antigen-specific memory B cells (a surrogate for prior SARS-CoV-2 infection) were detected in many PBMC samples collected in the post-COVID era and served to support wide spread of the SARS-CoV-2 virus, whereas the absence of N-antigen specific serum antibodies frequently yielded a false-negative test (Kirchenbaum et al., manuscript in preparation).
Development of Next Generation B Cell ImmunoSpot® Assays for Essentially Any Antigen by Means of Affinity Coating
While there are compelling reasons for monitoring antigen-specific memory B cells, and while this goal (in principle at least) can be readily accomplished by ImmunoSpot®, one might ask why immune monitoring rarely involves memory B cell detection. The simplest reason is that the classic protocol involving direct coating of the membrane (Figure 3A) fails for most antigens. Having tested many antigens we found that direct antigen coating to the assay membrane was either insufficient for detecting antigen-specific ASC, or at best resulted in faint, barely detectable secretory footprints (“spots”) even when prohibitively high (and costly) antigen concentrations were used. To overcome this obstacle, and to facilitate a universal approach for achieving high density antigen coating, we pioneered the technique of “affinity capture coating”: the membrane is first coated with an anti-affinity (His- or other) tag antibody, and then recombinant (His- or other) affinity-tagged antigen is added [20]. Thus, the first-generation approach that relied on weak, non-specific binding (primarily via hydrophobicity) of the antigen to the assay membrane can be replaced with specific, high-affinity binding that facilitates reliable and high-density antigen coating at greatly reduced antigen coating concentrations. As a result, ImmunoSpot® assays can be developed for essentially any tagged antigen, as illustrated in Figure 3B. Furthermore, leveraging this innovation, variants of B cell ImmunoSpot® can be developed to assess additional aspects of B cell memory and ASC functional properties. These approaches are described in the following sections.
Detecting and Characterizing Memory B Cells by ImmunoSpot® vs. Flow Cytometry
An established method for detecting antigen-specific B cells relies on labeling the cells with fluorescence-tagged antigen in order to quantify them by flow cytometry (FCM). A strength of this method is that it allows the antigen-specific B cells to be phenotyped for other surface markers at the same time, thus enabling the identification of antigen-binding B cell subsets and/or isolation for downstream applications (e.g. repertoire sequencing). However, FCM also has numerous disadvantages compared to ImmunoSpot®, most notably the greater sensitivity of the latter: ImmunoSpot® allows the identification of a single ASC in PBMC, easily down to 1 in 105, and lower (Lehmann et al. under review), which cannot be detected in bulk populations by FCM. Another advantage of ImmunoSpot® over FCM is that substantially lower numbers of PBMC are required for ImmunoSpot®-based identification of antigen-specific B cells [21]: with less than 5 million cryopreserved PBMC per antigen, the frequency of the antigen-specific B cells secreting all 4 Ig classes and IgG subclasses can be determined, plus the frequencies of antigen-specific B cells amongst all ASC producing these antibody subtypes. Moreover, from a practical point of view, the level of technical skill required for accurate multiparametric FCM is far greater than what is necessary for carrying out even 4-color B cell ImmunoSpot® tests [21]. The existing protocols enable GLP-compliant high-throughput measurements allowing the convenient identification of the Ig class/subclass of antibody produced by the antigen-specific ASC (Lehmann et al. under review). FCM, in contrast, does not reliably reveal the Ig class/subclass that will be produced by individual B cells because surface BCR expression can be highly variable and this is an underappreciated complexity of probe staining [22]. Moreover, in the case of IgG-secreting B cells, they express little if any surface BCR and this undermines assessment of their antigen specificity and subclass usage using traditional surface staining approaches [23,24,25]. Consequently, fixation and intracellular staining is required to define their IgG subclass usage, a procedure that results in substantial cell loss in the sample. Finally, the B cell ImmunoSpot® assay is suitable for high-throughput investigation, with the additional advantage that even multi-color ImmunoSpot® analysis can be fully automated.
Identification of Ig Class/Subclass Production by Antigen-Specific Memory B Cells
Each of the different Ig classes and subclasses has distinct effector functions making unique contributions to host defense [26]. ImmunoSpot® assays permit to define the frequency of antigen-specific B cells expressing these classes/subclasses at single cell resolution, and hence their ratios relative to each other within the antigen-specific repertoire. On initial activation, IgM+ naive B cells differentiate into effector cells (plasma cells) that have undergone CSR, and into memory B cells [6,8]. CSR is irreversible and involves excising the exons of the Igμ heavy chain gene necessary for IgM expression. This is followed by rearrangement of the upstream variable region genes (VDJ, that are responsible for defining the BCR or secreted antibodies’ antigen specificity), with downstream exons specifying the different Ig classes or IgG subclasses [27]. CSR is determined by several factors, primarily the type of “help” provided by CD4+ T cells. Optimal Ig class employment on infection or after vaccination is crucial for adequate host defense in the absence of significant immunopathology (reviewed in [28]). Upon subsequent rechallenge with the homo- (or hetero-) typic antigen, memory B cells predominately differentiate into plasma cells producing the same Ig class/subclass expressed by the parental memory B cell. Because of this, ImmunoSpot® assays permit to predict the nature of the antibodies that will be secreted on future antigenic rechallenge. Knowledge of the full spectrum of Ig classes/subclasses that the pool of antigen-specific memory B will produce after the next antigen reencounter is thus of paramount importance for forecasting the success of future humoral immunity to that antigen.
Determining the frequency of antigen-specific B cells can be accomplished by counting the secretory footprints as specific spot-forming units (SFU). These can be expressed simply as SFU per cells plated per well, or, more informatively as the frequency of antigen-specific B cells producing a particular Ig class or subclass within the totality of all B cells secreting that Ig class/subclass. In any event, care must be exerted to avoid crowding of SFU, as well as an ELISA effect, both of which may result in underestimation of the antigen-specific ASC frequency [7]. We have systematically evaluated these variables, concluding that a range of cell numbers plated per well can be established where SFU numbers are directly proportional to the number of cells plated [21]. Outside of this range, which varies according to the type of assay and morphology of the SFU arising, the relationship may break down at around 100-200 SFU per well. This can represent a significant hurdle when accurately estimating frequencies of antigen-specific memory B cells, particularly in view of our earlier data showing enormous inter-individual variation in the frequencies of these cells which may even span orders of magnitude for the same antigen [7]. Furthermore, considerable intra-individual variation is also present, with the frequency of antigen-specific memory B cell populations for different antigens having a similarly broad distribution (Becza et al, manuscript in preparation). Adding yet more complexity, even the number of B cells producing a certain Ig class or subclass, regardless of antigen specificity, also exhibits a high degree of inter-individual variation. A solution to this problem is to plate serial dilutions of cells to identify the linear range of SFU counts and to estimate frequencies only within this range [7] (and Becza et al, manuscript in preparation). To render this approach feasible for use in high-throughput workflows, software for automatically calculating frequencies from this type of serial dilution experiment has been developed [29].
Quantifying the Affinity Distribution of the Antigen-Specific Memory B Cell Pool
As noted, to reiterate: SHM of the BCR results in the generation of a diverse memory B cell pool from cells that had previously responded to antigen in the GC [30]. This pool of memory B cells possesses a range of BCR affinities for the reencountered antigen, whether homo- or heterotypic, and may include those with a higher affinity for the heterotype [31].
The equilibrium dissociation constant (KD) between the antibody and its cognate antigen is referred to as the affinity of the antibody and defines the amount of soluble antibody required to attain 50% of the maximal antigen binding capacity. Because the forces mediating antibody binding to antigen are noncovalent, the attachment is reversible, resulting in a constant “on-off” flickering of the paratope-epitope association following a second order biochemical reaction. The affinity of antibodies elicited over the course of an immune response can range from low (e.g., KD <10-5 M) to high (e.g., KD >10-10). Thus, a difference of >105-fold in the amount of antibody required to achieve the same degree of epitope coverage would be required for Ig produced by a low relative to a high affinity B cell to mediate the same effector function(s). Hence, “specific” antigen binding will be measurable for a plethora of antibodies present in serum provided they are at a sufficiently high concentration, but a 105-fold more antibody molecules of a low-affinity antibody relative to a high-affinity antibody would be required to achieve the same level of biological activity. It is therefore crucial to establish the distribution of antibody affinities in the antigen-specific memory B cell repertoire for any given antigen, rather than simply enumerating the frequency of such antigen-specific ASC, because this is what determines their actual contribution to protective immunity. As classical methods for antibody affinity measurements require generation of monoclonal antibodies and their evaluation individually, this process is impractical for high-throughput immune monitoring of multiple antigen-specific memory B cell repertoires in sizeable human cohorts.
In marked contrast, affinity distribution data on the antigen-specific B cell repertoire are easily obtainable using ImmunoSpot® approaches [32]. Briefly, as an example, if the affinity distribution of antibodies from IgG1-producing memory B cells is to be established, the first step is to determine the frequency of antigen-specific IgG1+ ASC using the single well serial dilution method [21]. Additionally, to calculate the frequency of antigen-specific IgG1+ ASC amongst all IgG1+ ASC, it is necessary to measure all IgG1+ ASC irrespective of their specificity in a pan Ig test (Figure 3C). The second step is to perform an “inverted assay” using a replicate vial of cryopreserve cell material whereby the plate is coated with an anti-IgG1 capture reagent and the pre-determined input for the test cell population is added (Figure 3D). The number of cells to be added to yield secretory footprints at the upper threshold of the linear range would be determined in the preceding experiment using a serial dilution approach and a “saturating” concentration of detection probe. This optimal cell input can be referred to as “the Goldilocks number” and aims to achieve around 50 SFU per well. Because every SFU originates from a single B cell, at 50 SFU per well, the secretory footprints of 50 antibody-secreting B cells are directly assessed, and this number can be increased proportionally by seeding cell material into additional replicate wells: examining ~600 secretory footprints (in 12 replicate wells) at each concentration of the antigen probe provides a substantial representative sample size for the antigen-specific B cell repertoire in each individual at the timpoint of sample collection. This technique necessitates adding the antigen probe in titrated concentrations. Secretory footprints of all the antigen-specific B cells in the population, both high and low affinity, are detected at the highest (“saturating”) antigen probe concentration. With ever-decreasing concentrations of antigen, B cells secreting ever-higher affinity antibodies remain detectable. The affinity range of the B cell repertoire is assessed by plotting SFU lost at each decreasing antigen concentration, which reveals the percentage of antigen-specific ASC with affinities less than than the minimal threshold.
Following these protocols thus facilitates an assessment of the affinity distribution with an antigen-specific ASC repertoire. Moreover, B cell ImmunoSpot® assays can illuminate affinity distributions by at least two additional approaches [32]. First, by determining the morphology of the SFU assays detected when antigen is directly coated on the membrane, as described in Figure 3A and 3B. Secretory footprints originating from ASC producing higher affinity antibodies appear as smaller, sharper and more dense spots, whereas ASC producing lower affinity antibodies yield secretory footprints that are larger, fainter and more diffuse. Scatter plots depicting the size and density of the spots can be processed to extract such information. Second, coating the membrane with progressively lower (sub-optimal) concentrations of antigen and studying alterations in SFU counts and their morphology, respectively, also allows the affinity distribution of the B cell repertoire to be evaluated.
Cross-Reactivity of Memory B Cells at the Single Cell Level
As indicated above, memory B cells act as a “second wall” of defense against heterotypic antigens, particularly those derived from viruses which have evolved variants no longer recognized by the neutralizing antibodies that were previously generated against the original homotypic strain. As B cell differentiation into plasma- vs. memory cells is affinity-driven, low affinity heterotype-specific memory B cells can be induced in the absence of heterotype-specific antibodies (plasma cells). Therefore, assessing only the presence of serum antibodies provides no data from which one could predict the existence of heterotype-reactive B cell memory that can contributed to enhanced protection, whereas investigations of memory B cells are highly informative in this regard.
Memory B cell cross-reactivity can be investigated by ImmunoSpot® using two distinct testing strategies. One strategy, which is applicable when a panel of heterotype(s) has been defined in advance, involves serial dilution of the test sample in ImmunoSpot assays (direct antigen coating or inverted, see Figure 3) performed in parallel. In this way, the homotypic and heterotypic ASC frequencies can be directly compared to provide an assessment of existing cross-reactivity; albeit with low resolution. The second strategy offers a higher resolution assessment of cross-reactivity, but importantly first require that the number of input cells per well necessary to achieve the “Goldilocks” SFU count for the homotypic antigen (about 50 SFU per well, see above) is already known. In the simpler version, a single-color inverted B cell assay (Figure 3D) is performed using the Goldilocks cell input number. Seeding replicate wells at the predetermined Goldilocks cell input (e.g. 12 wells, yielding ~600 individual homotypic antigen-specific SFU), the cumulative number of SFU revealed using the homotypic antigen probe can be directly compared with the number of SFU detected using the heterotypic antigen(s). Furthermore, titrating the concentrations of the homo- and heterotypic antigen probes enables assessment of the affinity distribution of the heterotype-specific B cell repertoire compared to that reactive with the homotype.
Lastly, and building on the “Goldilocks” cell input tactic, a more elegant approach involves assessing B cell cross-reactivity through competitive co-labeling of secretory footprints using both homotypic and heterotypic antigen probes simultaneously. As before, an inverted assay is employed using PBMC plated at the predetermined Goldilocks cell input per well for the homotypic antigen. A “tag 1”-labelled homotypic antigen (for example, using a FLAG-tagged antigen) and a “tag 2”-labelled heterotypic antigen (for example, His-tagged antigen) are added simultaneously in equimolar concentrations. Secretory footprints that are co-labeled with both antigen probes (when used at equimolar concentrations) originate from ASC that are unequivocally cross-reactive. Additionally, this approach allows for the identification of ASC-derived secretory footprints that are solely reactive with either the homotypic or heterotypic antigen probe. Moreover, the affinity distribution of ASC for either the homotypic or heterotypic antigen probe can be evaluated through titrating the concentration of one probe while maintaining the other probe at a sufficiently high, but importantly non-saturating, concentration.
Concluding Remarks
The intent of this communication is to draw attention to the thus-far little-exploited potential of B cell ImmunoSpot® assays to enhance immune diagnostics. Despite the fact that ELISPOT assays were in fact first developed for quantifying antigen-specific B cells [33,34], nonetheless the T cell ELISPOT assay developed much later [35] has instead become most widely-applied. Modifications to the original T cell ELISPOT protocol allowed the assay to reliably reveal the secretory footprints of individual T cell responses to antigen [36] due to our introduction of the PVDF membrane with its far better adsorption properties [37]. This was a crucial improvement that also facilitated the affinity-coating-based B cell memory assays described here to be developed. Additionally, the introduction of automated, objective, and validated machine reading of T cell secretory footprints also contributed seminally to the success of T cell ImmunoSpot® assays. In contrast to T cell assays, in which the spot morphologies follow simple rules (as the an anti-cytokine- specific capture antibody’s affinity for the analyte is fixed [38] and therefore objective automated size gating can be applied [39,40]), for direct B cell assays (Figures 3A and 3B) the secretory footprints’ features are primarily defined by the affinity of the ASC-derived antibody for the membrane-bound antigen. Thus, the analysis of direct B cell ImmunoSpot® assays needs to follow a different set of spot recognition rules [29]. Together with high dynamic range (HDR) imaging, this methodology allows high-content analysis of secretory footprints in B cell ELISPOT/FluoroSpot assays introducing new dimensions for the investigation of antigen-specific B cell repertoires. The introduction of the affinity coating approach (enabling rapid deployment of ImmunoSpot® assays for more-or-less any desired antigen), along with the assay’s utilization for affinity and cross-reactivity studies as described above, together with suitable analytical software may finally allow the introduction of more widespread analysis of the antigen-specifc memory B cell repertoire, even meeting the strict demands of regulated and routine clinical monitoring applications.
As measurements done on serum antibodies do not reveal many critical aspects of humoral immunity (as outlined above) the newly gained ability to readily monitor the antigen-specific memory B cell compartment should provide much needed insights into the mechanisms underlying humoral immune reactivity.
Author Contributions
G.A.K conceived, designed and supervised the laboratory experiments, along with performing the associated data analysis and figure preparation. G.A.K and P.V.L wrote the original draft and G.P. contributed to editing of subsequent drafts. All authors reviewed the manuscript and agreed to the version submitted for publication.
Funding
This work was fully funded from the research budget of CTL
Institutional Review Board Statement
Donor plasma and peripheral blood mononuclear cells were collected internally at CTL under an Advarra Approved IRB #Pro00043178 (CTL study number: GL20-16 entitled COVID-19 Immune Response Evaluation).
Informed Consent Statement
Not applicable
Data Availability Statement
The data presented in this manuscript will be made available by the authors, without undue reservations, to any qualified research.
Acknowledgments
The authors than Noémi Becza, Lingling Yao and Jack Chepke for excellent technical support and Gregory Kovacs for assistance with the graphical illustrations.
Conflicts of Interest
P.V.L. is Founder, President, and CEO of Cellular Technology Limited (CTL), a company that specializes in immune monitoring by ELISPOT. G.A.K. is an employee of CTL. G.P. declares no conflicts of interest.
References
- Haselbeck, A.H.; Im, J.; Prifti, K.; Marks, F.; Holm, M.; Zellweger, R.M. Serology as a Tool to Assess Infectious Disease Landscapes and Guide Public Health Policy. Pathogens 2022, 11, 732. [CrossRef]
- Sciascia, S.; Bizzaro, N.; Meroni, P.L.; Dimitrios, B.; Borghi, M.O.; Bossuyt, X.; Grossi, C.; Tornai, D.; Papp, M.; Shoenfeld, Y.; et al. Autoantibodies testing in autoimmunity: Diagnostic, prognostic and classification value. Autoimmun. Rev. 2023, 22, 103356. [CrossRef]
- Barni, S.; Liccioli, G.; Sarti, L.; Giovannini, M.; Novembre, E.; Mori, F. Immunoglobulin E (IgE)-Mediated Food Allergy in Children: Epidemiology, Pathogenesis, Diagnosis, Prevention, and Management. Medicina 2020, 56, 111. [CrossRef]
- Rodriguez-Ramirez, S.; Al Jurdi, A.; Konvalinka, A.; Riella, L.V. Antibody-mediated rejection: prevention, monitoring and treatment dilemmas. Curr. Opin. Organ Transplant. 2022, 27, 405–414. [CrossRef]
- Mazor, R.D.; Nathan, N.; Gilboa, A.; Stoler-Barak, L.; Moss, L.; Solomonov, I.; Hanuna, A.; Divinsky, Y.; Shmueli, M.D.; Hezroni, H.; et al. Tumor-reactive antibodies evolve from non-binding and autoreactive precursors. 2022, 185, 1208–+. [CrossRef]
- Cancro, M.P.; Tomayko, M.M. Memory B cells and plasma cells: The differentiative continuum of humoral immunity. Immunol. Rev. 2021, 303, 72–82. [CrossRef]
- Wolf, C., et al., Antibody Levels Poorly Reflect on the Frequency of Memory B Cells Generated following SARS-CoV-2, Seasonal Influenza, or EBV Infection. Cells, 2022. 11(22). [CrossRef]
- Akkaya, M.; Kwak, K.; Pierce, S.K. B cell memory: building two walls of protection against pathogens. Nat. Rev. Immunol. 2019, 20, 229–238. [CrossRef]
- Victora, G.D. and M.C. Nussenzweig, Germinal Centers. Annu Rev Immunol, 2022. 40: p. 413-442. [CrossRef]
- Wishnie, A.J.; Chwat-Edelstein, T.; Attaway, M.; Vuong, B.Q. BCR Affinity Influences T-B Interactions and B Cell Development in Secondary Lymphoid Organs. Front. Immunol. 2021, 12. [CrossRef]
- Khodadadi, L.; Cheng, Q.; Radbruch, A.; Hiepe, F. The Maintenance of Memory Plasma Cells. Front. Immunol. 2019, 10, 721. [CrossRef]
- Amanna, I.J.; Carlson, N.E.; Slifka, M.K. Duration of Humoral Immunity to Common Viral and Vaccine Antigens. New Engl. J. Med. 2007, 357, 1903–1915. [CrossRef]
- Lightman, S.M.; Utley, A.; Lee, K.P. Survival of Long-Lived Plasma Cells (LLPC): Piecing Together the Puzzle. Front. Immunol. 2019, 10, 965. [CrossRef]
- Robinson, M.J.; Ding, Z.; Dowling, M.R.; Hill, D.L.; Webster, R.H.; McKenzie, C.; Pitt, C.; O’donnell, K.; Mulder, J.; Brodie, E.; et al. Intrinsically determined turnover underlies broad heterogeneity in plasma-cell lifespan. Immunity 2023, 56, 1596–1612.e4. [CrossRef]
- Morell, A.; Terry, W.D.; Waldmann, T.A. Metabolic properties of IgG subclasses in man. J. Clin. Investig. 1970, 49, 673–680. [CrossRef]
- Blandino, R.; Baumgarth, N. Secreted IgM: New tricks for an old molecule. J. Leukoc. Biol. 2019, 106, 1021–1034. [CrossRef]
- de Sousa-Pereira, P. and J.M. Woof, IgA: Structure, Function, and Developability. Antibodies (Basel), 2019. 8(4). [CrossRef]
- Lawrence, M.G.; Woodfolk, J.A.; Schuyler, A.J.; Stillman, L.C.; Chapman, M.D.; Platts-Mills, T.A. Half-life of IgE in serum and skin: Consequences for anti-IgE therapy in patients with allergic disease. J. Allergy Clin. Immunol. 2016, 139, 422–428.e4. [CrossRef]
- Terlutter, F., et al., Direct Detection of T- and B-Memory Lymphocytes by ImmunoSpot(R) Assays Reveals HCMV Exposure that Serum Antibodies Fail to Identify. Cells, 2018. 7(5). [CrossRef]
- Köppert, S.; Wolf, C.; Becza, N.; Sautto, G.A.; Franke, F.; Kuerten, S.; Ross, T.M.; Lehmann, P.V.; Kirchenbaum, G.A. Affinity Tag Coating Enables Reliable Detection of Antigen-Specific B Cells in Immunospot Assays. Cells 2021, 10, 1843. [CrossRef]
- Yao, L., et al., Four-Color ImmunoSpot((R)) Assays Requiring Only 1-3 mL of Blood Permit Precise Frequency Measurements of Antigen-Specific B Cells-Secreting Immunoglobulins of All Four Classes and Subclasses. Methods Mol Biol, 2024. 2768: p. 251-272. [CrossRef]
- Weskamm, L.M., C. Dahlke, and M.M. Addo, Flow cytometric protocol to characterize human memory B cells directed against SARS-CoV-2 spike protein antigens. STAR Protoc, 2022. 3(4): p. 101902. [CrossRef]
- Pinto, D.; Montani, E.; Bolli, M.; Garavaglia, G.; Sallusto, F.; Lanzavecchia, A.; Jarrossay, D. A functional BCR in human IgA and IgM plasma cells. Blood 2013, 121, 4110–4114. [CrossRef]
- Blanc, P., et al., Mature IgM-expressing plasma cells sense antigen and develop competence for cytokine production upon antigenic challenge. Nat Commun, 2016. 7: p. 13600. [CrossRef]
- Rouers, A.; Appanna, R.; Chevrier, M.; Lum, J.; Lau, M.C.; Tan, L.; Loy, T.; Tay, A.; Sethi, R.; Sathiakumar, D.; et al. CD27hiCD38hi plasmablasts are activated B cells of mixed origin with distinct function. iScience 2021, 24, 102482. [CrossRef]
- Lu, L.L.; Suscovich, T.J.; Fortune, S.M.; Alter, G. Beyond binding: antibody effector functions in infectious diseases. Nat. Rev. Immunol. 2017, 18, 46–61. [CrossRef]
- Stavnezer, J.; Guikema, J.E.; Schrader, C.E. Mechanism and Regulation of Class Switch Recombination. Annu. Rev. Immunol. 2008, 26, 261–292. [CrossRef]
- E Webb, N.; Bernshtein, B.; Alter, G. Tissues: the unexplored frontier of antibody mediated immunity. Curr. Opin. Virol. 2021, 47, 52–67. [CrossRef]
- Karulin, A.Y., et al., Artificial Intelligence-Based Counting Algorithm Enables Accurate and Detailed Analysis of the Broad Spectrum of Spot Morphologies Observed in Antigen-Specific B-Cell ELISPOT and FluoroSpot Assays. Methods Mol Biol, 2024. 2768: p. 59-85. [CrossRef]
- Matz, H.; Dooley, H. 450 million years in the making: mapping the evolutionary foundations of germinal centers. Front. Immunol. 2023, 14, 1245704. [CrossRef]
- Palm, A.-K.E.; Henry, C. Remembrance of Things Past: Long-Term B Cell Memory After Infection and Vaccination. Front. Immunol. 2019, 10, 1787. [CrossRef]
- Becza, N., et al., Assessing the Affinity Spectrum of the Antigen-Specific B Cell Repertoire via ImmunoSpot((R)). Methods Mol Biol, 2024. 2768: p. 211-239. [CrossRef]
- Czerkinsky, C.C.; Nilsson, L.; Nygren, H.; Ouchterlony, Ö.; Tarkowski, A. A solid-phase enzyme-linked immunospot (ELISPOT) assay for enumeration of specific antibody-secreting cells. J. Immunol. Methods 1983, 65, 109–121. [CrossRef]
- Sedgwick, J.; Holt, P. A solid-phase immunoenzymatic technique for the enumeration of specific antibody-secreting cells. J. Immunol. Methods 1983, 57, 301–309. [CrossRef]
- Czerkinsky, C.; Andersson, G.; Ekre, H.-P.; Nilsson, L.; Klareskog, L.; Ouchterlony, Ö. Reverse ELISPOT assay for clonal analysis of cytokine production I. Enumeration of gamma-interferon-secreting cells. J. Immunol. Methods 1988, 110, 29–36. [CrossRef]
- Forsthuber, T., H.C. Yip, and P.V. Lehmann, Induction of TH1 and TH2 immunity in neonatal mice. Science, 1996. 271(5256): p. 1728-30. [CrossRef]
- Weiss, A.J., Overview of membranes and membrane plates used in research and diagnostic ELISPOT assays. Methods Mol Biol, 2012. 792: p. 243-56.
- Karulin, A.Y. and P.V. Lehmann, How ELISPOT morphology reflects on the productivity and kinetics of cells’ secretory activity. Methods Mol Biol, 2012. 792: p. 125-43. [CrossRef]
- Karulin, A.Y.; Karacsony, K.; Zhang, W.; Targoni, O.S.; Moldovan, I.; Dittrich, M.; Sundararaman, S.; Lehmann, P.V. ELISPOTs Produced by CD8 and CD4 Cells Follow Log Normal Size Distribution Permitting Objective Counting. Cells 2015, 4, 56–70. [CrossRef]
- Sundararaman, S.; Karulin, A.Y.; Ansari, T.; BenHamouda, N.; Gottwein, J.; Laxmanan, S.; Levine, S.M.; Loffredo, J.T.; McArdle, S.; Neudoerfl, C.; et al. High Reproducibility of ELISPOT Counts from Nine Different Laboratories. Cells 2015, 4, 21–39. [CrossRef]
Figure 1.
Affinity determines the differentiation pathways of plasma and memory B cells. Most commonly in a lymph node, a naïve B cell (NB) encounters the homotypic antigen (Ag) for which its BCR has significant affinity (e.g., > Kd-5) and is activated following cognate interactions with follicular T helper cells (FTH). The B cell enters a germinal center (GC) within the lymph node, where it clonally expands, undergoes Ig class switching, and acquires somatic hypermutation (SHM) of its BCR. As SHM is a random process, progeny of the original NB cell express BCRs with a broad spectrum of affinities for the homotypic antigen. Daughter cells (subclones) expressing high affinity BCRs are retained in the GC, and after multiple rounds of cell division, SHM, and positive selection, eventually differentiate into plasma cells (PC). Progeny with BCRs of lower affinity for the homotypic antigen exit the lymph node as memory B cells (Bm). However, and of consequence, Bm with low affinity for the homotypic antigen may be endowed with an increased affinity for a heterotypic antigen variant to be encountered in the future.
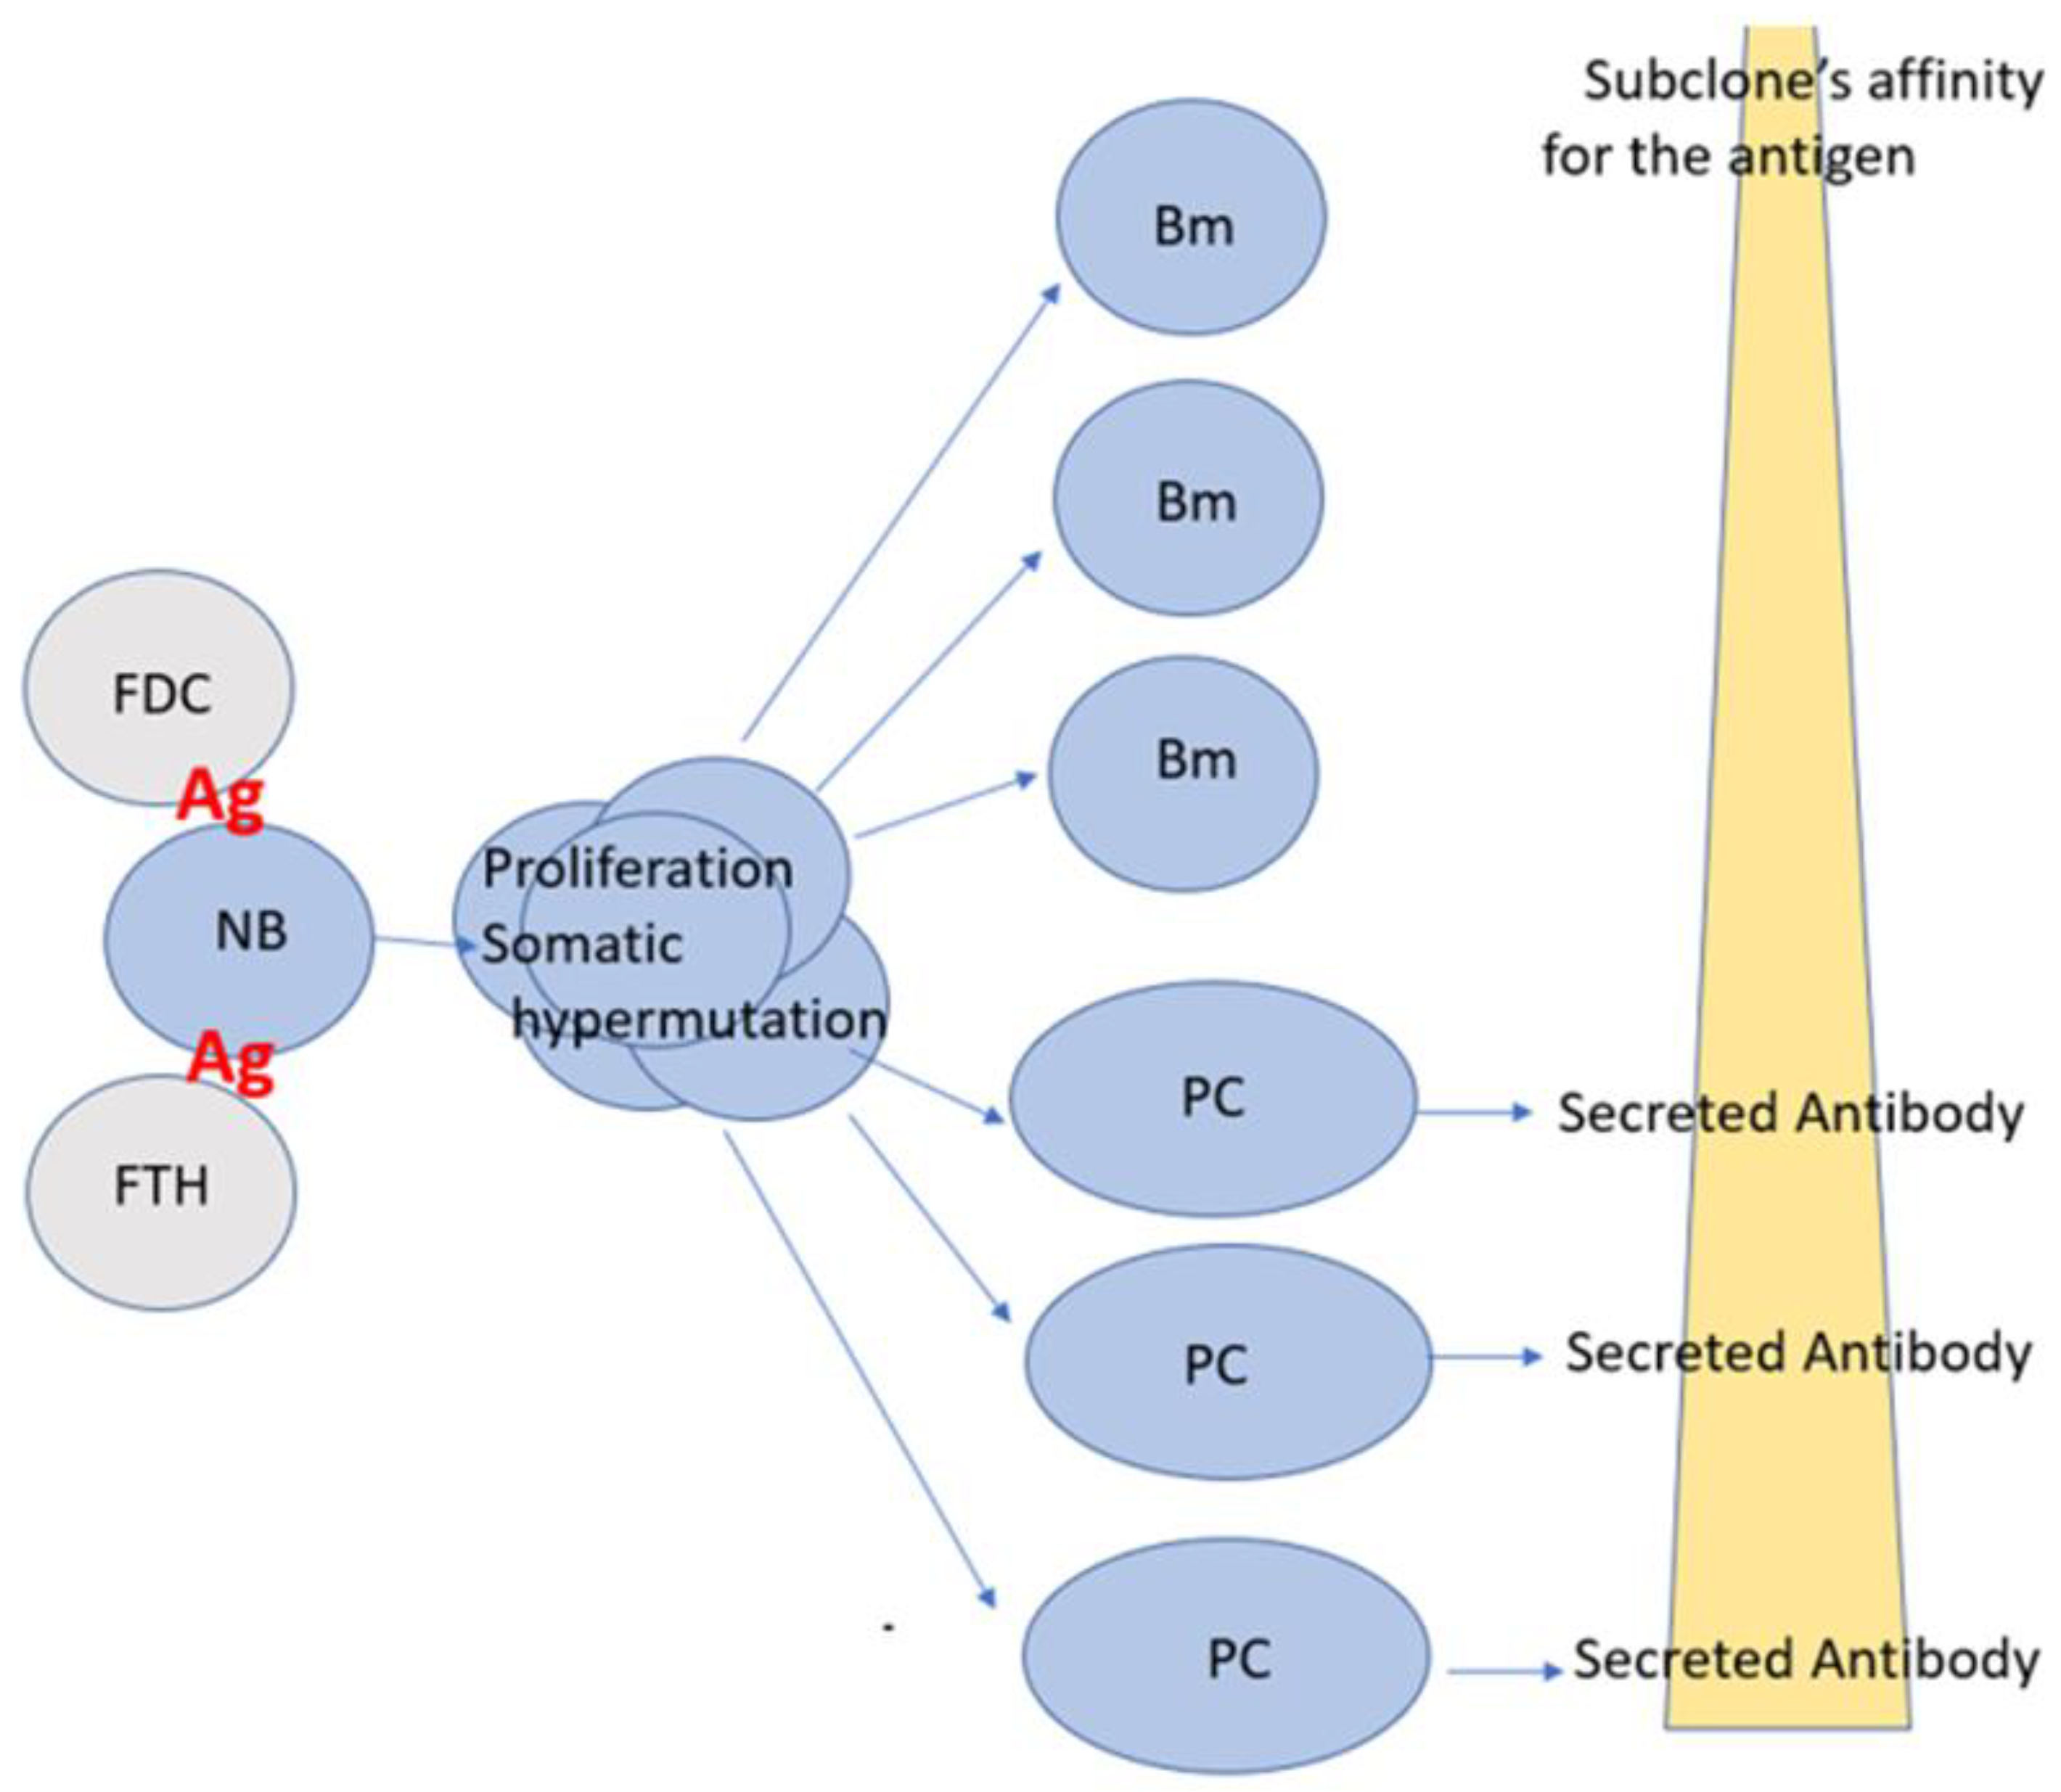
Figure 2.
Discordance between serum antibody levels and frequency of memory B cells against the prototype SARS-CoV-2 S antigen. COVID-19 mRNA-vaccinated donors (n=8) with no history of prior SARS-CoV-2 infection prior to collection were assessed ~6 months following completion of the initial prime-boost vaccination regimen for circulating antibody reactivity in blood against (A) full-length Spike (S) antigen or (B) receptor binding domain (RBD) by ELISA (y-axis) or S antigen-specific memory B cell-derived IgG+ antibody-secreting cells (ASC) following polyclonal stimulation of cryopreserved PBMC by ImmunoSpot® (x-axis). Each symbol represents one individual. Note that certain individuals possess a high frequency of memory B cell-derived IgG+ ASC but low or undetectable levels of S antigen-specific IgG reactivity. Correlation analysis between serum antibody levels and frequency of S antigen-specific memory B cell-derived ASC was performed according to the methods described previously [7].
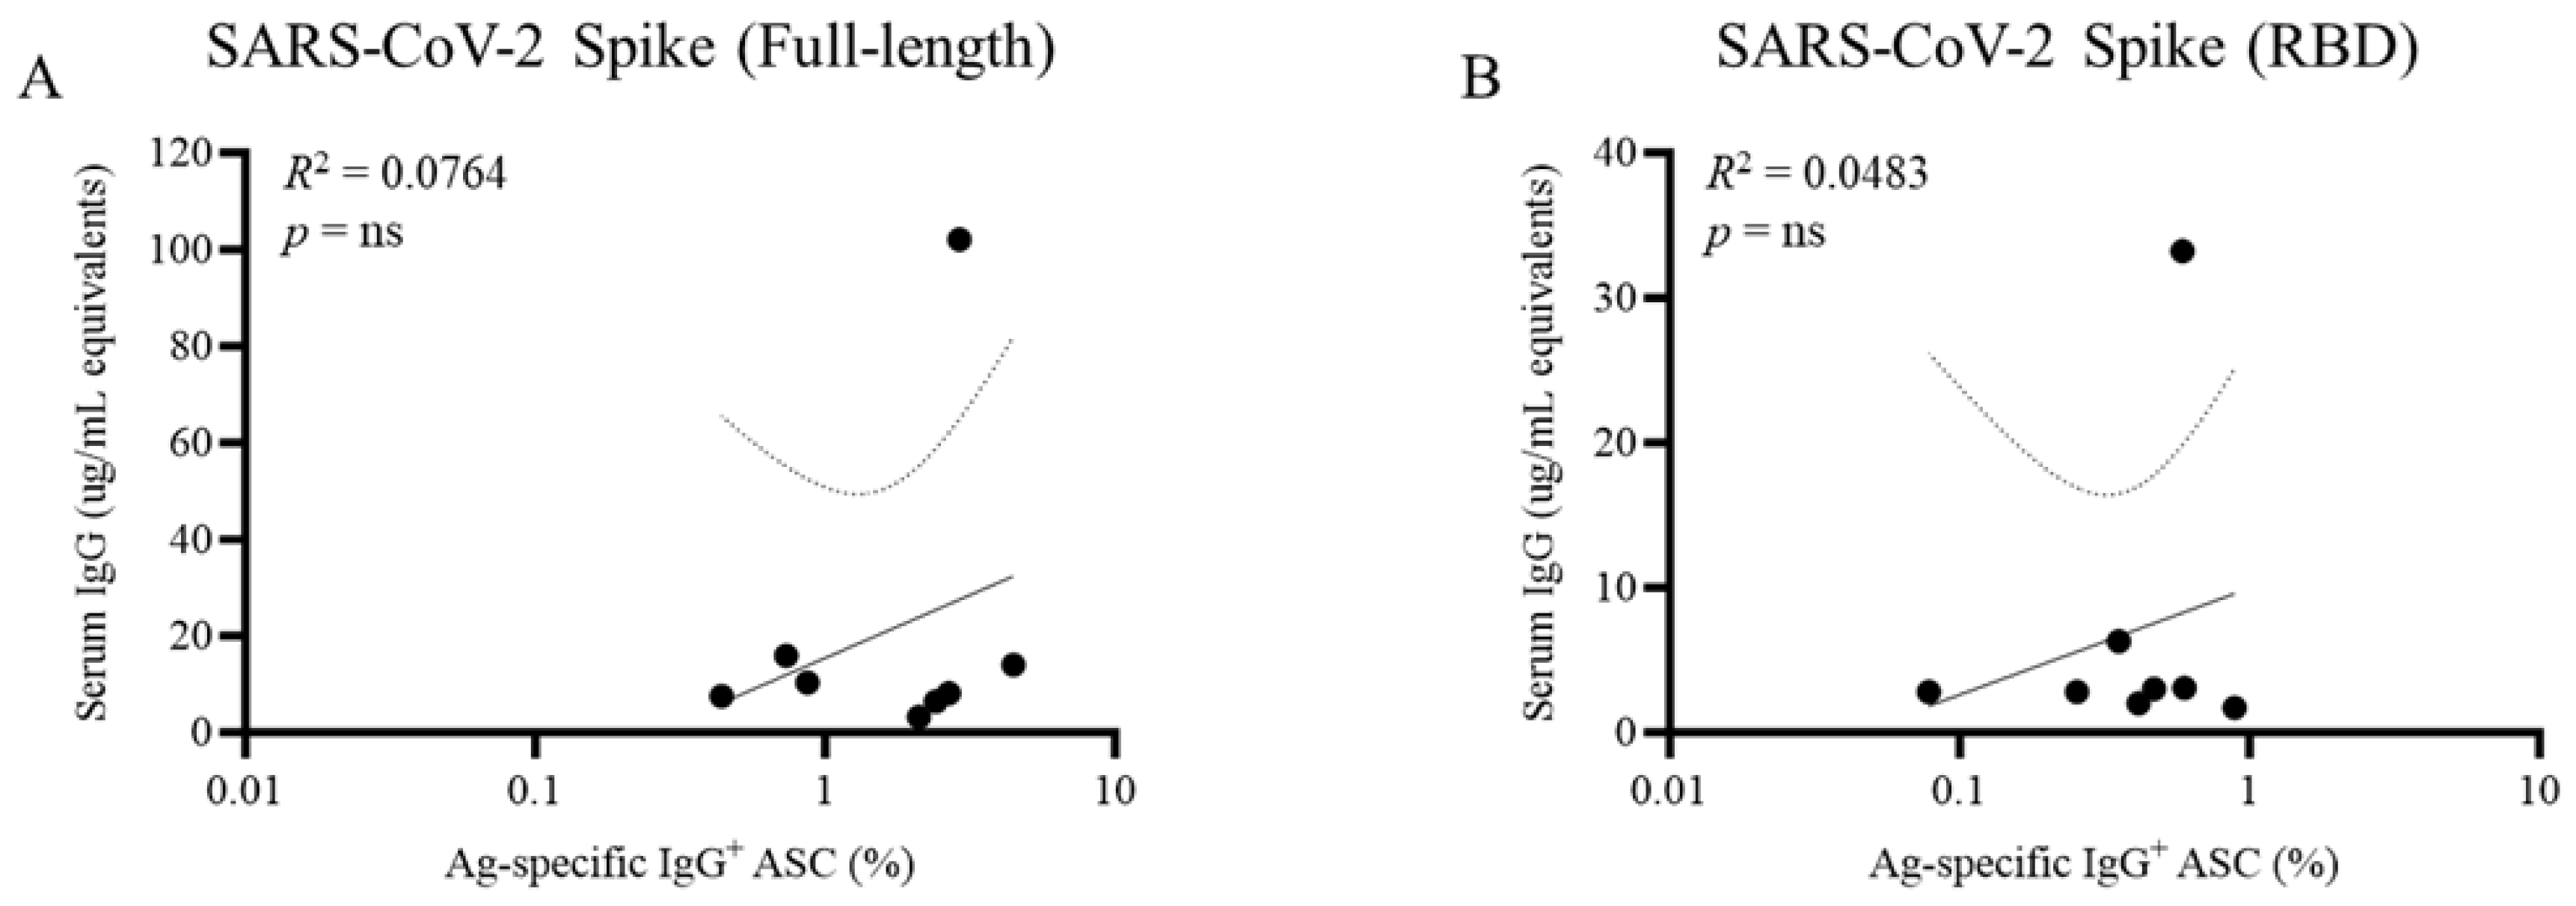
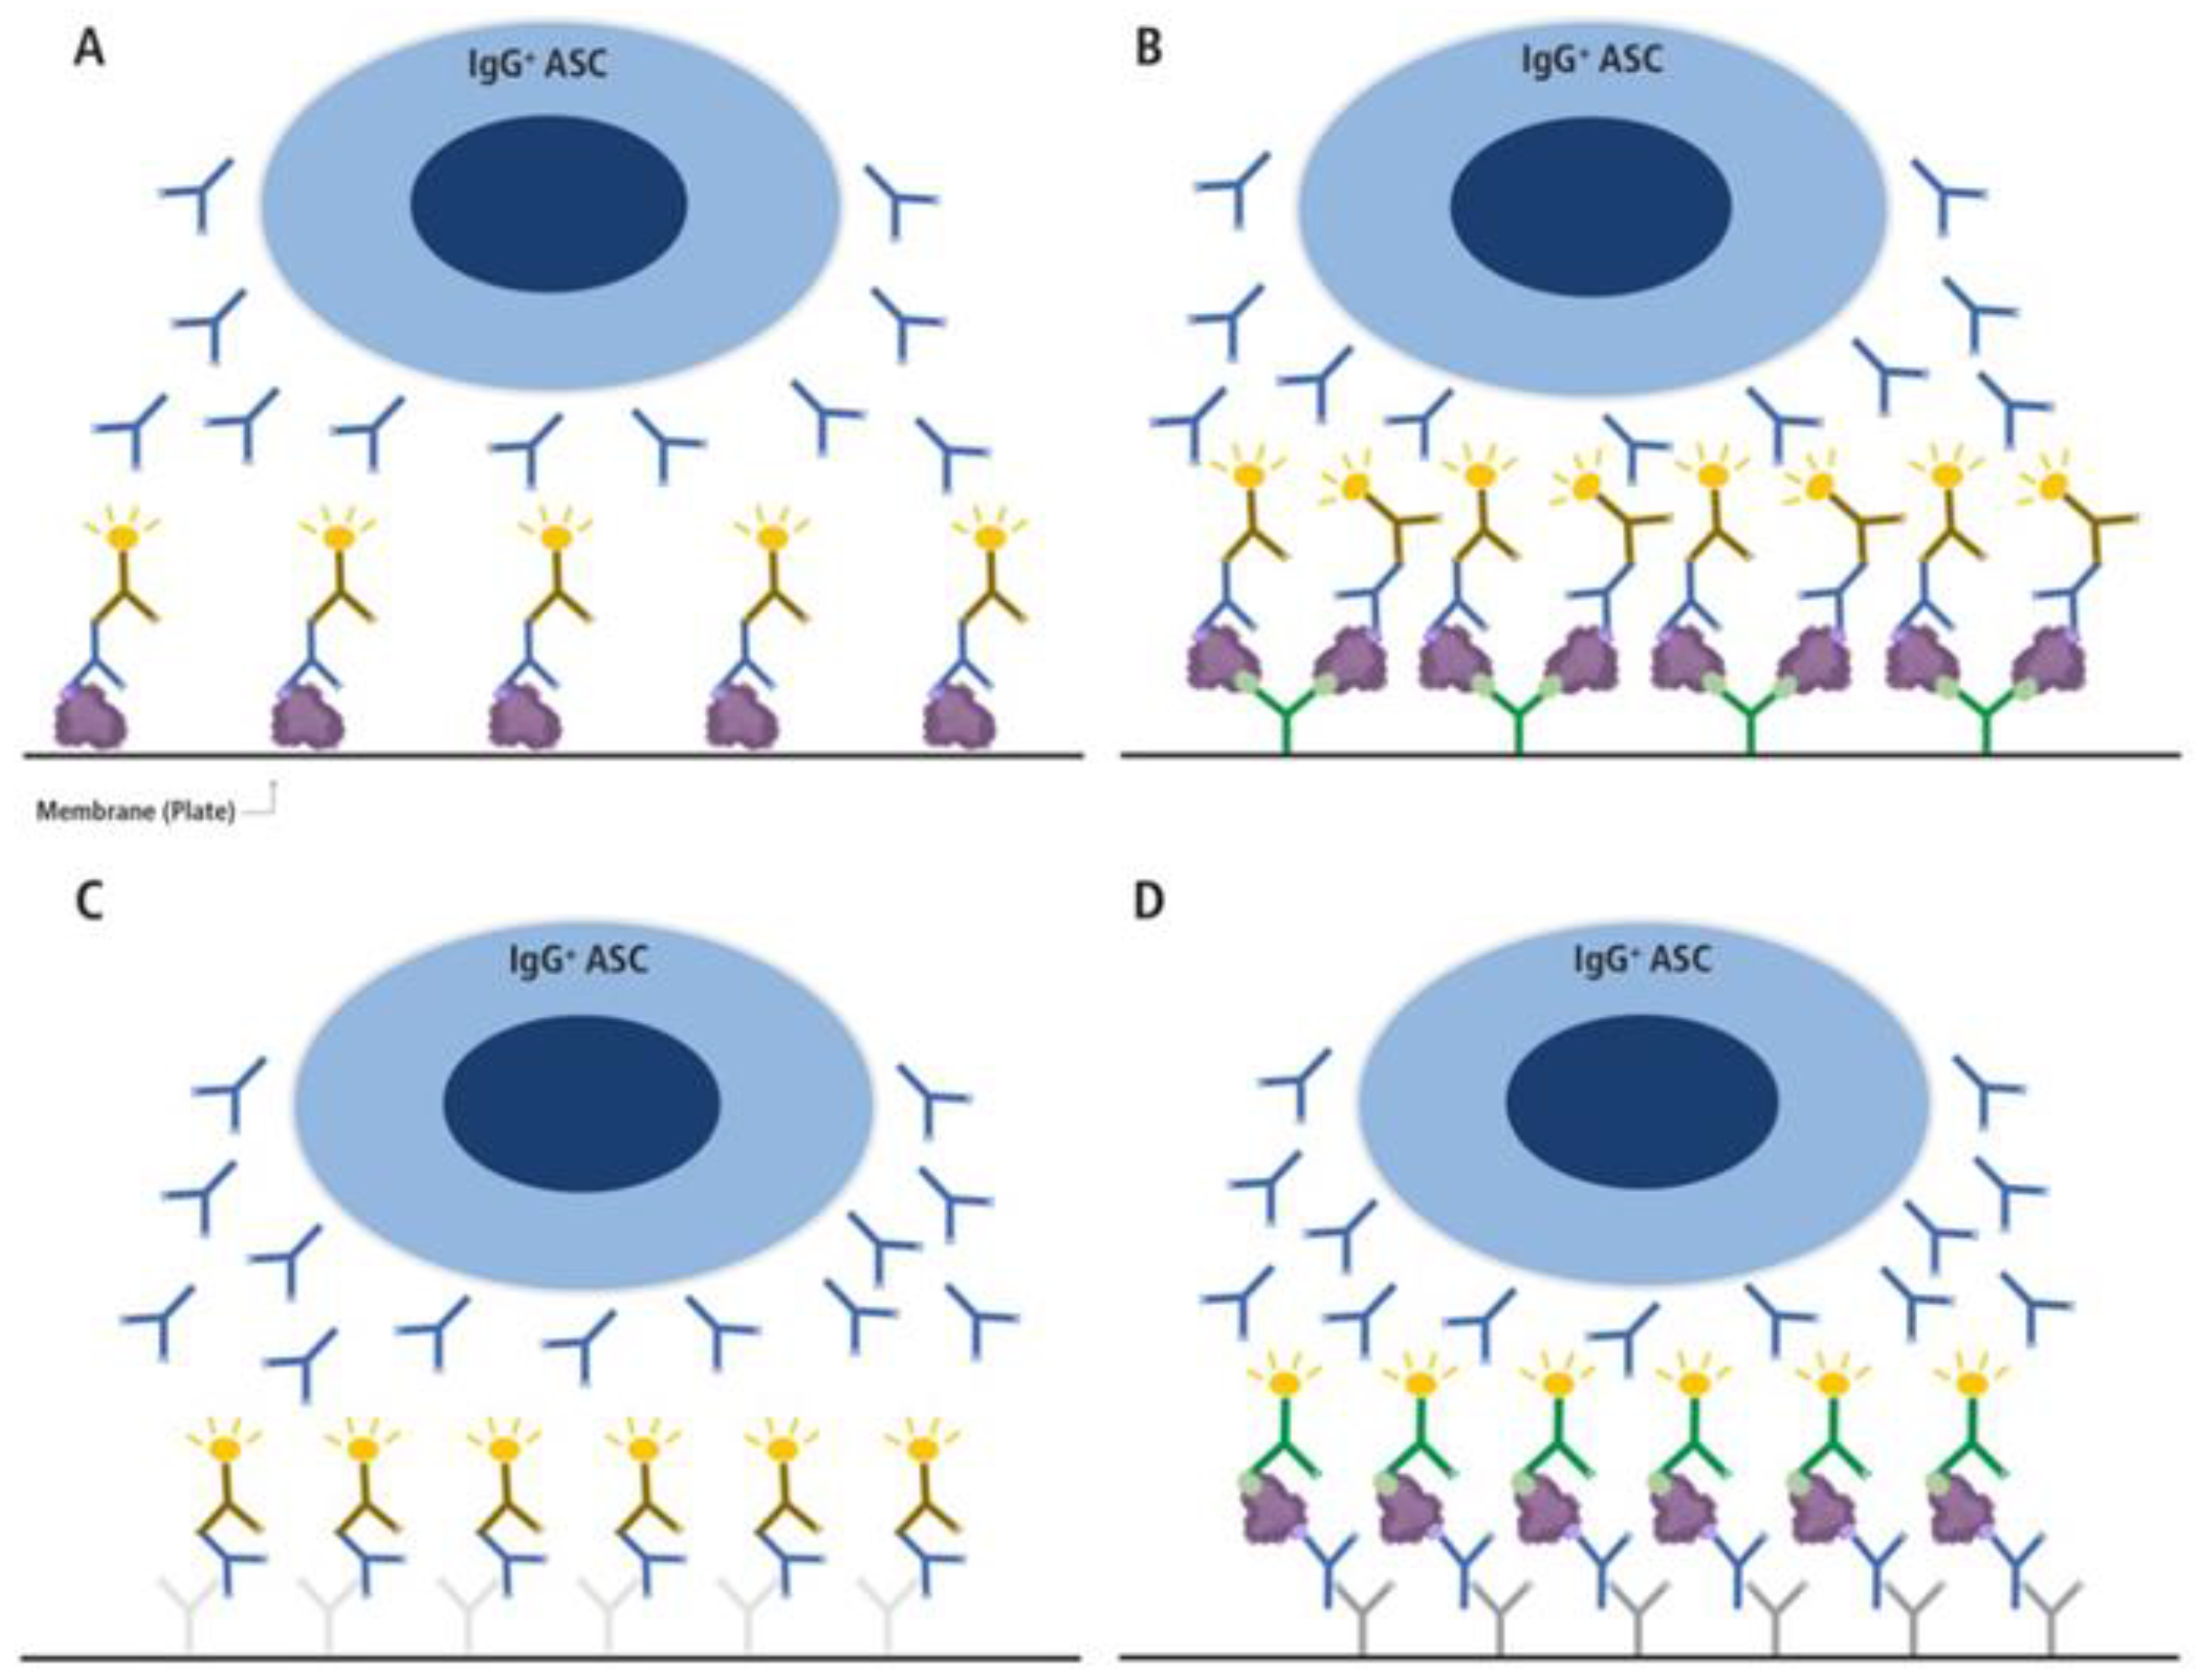
Figure 3.
Different types of B cell ImmunoSpot assays. (A and B) direct antigen-specific assay variants, (C) the pan Ig detecting test, and (D) the inverted antigen-specific assay. In the direct antigen-specific assay variant (A) the antigen itself is coated onto the membrane directly, as has been done traditionally, whereas in variant (B) the antigen’s binding to the membrane is aided by high affinity capture utilizing an affinity tag. For the latter, a His-tagged recombinant protein (depicted as a purple blob, and the His-tag epitope denoted in light green) is captured onto the membrane with high affinity via the plate-bound anti-His antibody (depicted in green) [20]. In A and B, only Ig produced by antigen-specific antibody-secreting cells (ASC) with sufficient binding affinity will be retained on the lawn of antigen bound on the membrane (the ASC-derived antibodies are depicted in blue in all panels) and are visualized by adding an anti-human Ig detection antibody (in the example shown, anti-IgG, depicted in brown). In the pan Ig detecting assay (C), the Ig produced by ASC are captured by an anti-species antibody coated onto the membrane (e.g., a goat-anti human Igκ/λ, depicted in light grey), and the plate-bound human IgG is visualized using an anti-human IgG Fc-specific detection antibody (depicted in brown). In this assay variant, as with the inverted assay (D), secretory footprints generated by IgG-producing ASC are captured irrespective of their antigen-specificity. In the inverted assay (D), the membrane is coated with an anti-human IgG Fc-specific capture antibody (depicted in dark gray) and the soluble antigen (depicted as a purple blob, and the His-tag epitope denoted in light green) will only be captured by secretory footprints generated by antigen-specific IgG-producing ASC. The membrane-bound antigen is detected in a subsequent step via a detection reagent, in the example shown, the His-tagged recombinant antigen is detected via an anti-His tag-specific detection antibody (depicted in green). .
Disclaimer/Publisher’s Note: The statements, opinions and data contained in all publications are solely those of the individual author(s) and contributor(s) and not of MDPI and/or the editor(s). MDPI and/or the editor(s) disclaim responsibility for any injury to people or property resulting from any ideas, methods, instructions or products referred to in the content. |
© 2024 by the authors. Licensee MDPI, Basel, Switzerland. This article is an open access article distributed under the terms and conditions of the Creative Commons Attribution (CC BY) license (http://creativecommons.org/licenses/by/4.0/).
Copyright: This open access article is published under a Creative Commons CC BY 4.0 license, which permit the free download, distribution, and reuse, provided that the author and preprint are cited in any reuse.


