
Submitted:
18 June 2025
Posted:
20 June 2025
You are already at the latest version
Abstract
Background: Measuring frequencies of antigen-specific memory B cells (Bmem), their immunoglobulin (Ig) class and subclass usage, cross-reactivity and affinity can provide insights into the efficacy of future antibody responses in case of antigen re-encounter. B cell ImmunoSpot assays can provide such information; however, like most cell-based tests, they too require considerable amounts of blood to be drawn from the donor and this has hindered their inclusion into clinical trials and routine immune diagnostics. Methods: We introduce strategies for reducing the cell numbers required to 2-3 million peripheral blood mononuclear cells (PBMC) per antigen, obtainable from 2-3 mL of blood from healthy adult donors. Results: Except when Bmem frequencies were very low, we found that testing PBMC in singlet wells, but in serial dilution, enables as reliable Bmem frequency assessments as testing replicate wells at a single fixed cell number. Additionally, B cell ImmunoSpot assays can be multiplexed for detecting four Ig classes, or IgG subclasses, simultaneously and without loss of sensitivity. The requirement for low cell numbers and the retention of B cell functionality of cryopreserved PBMC equivalent to freshly isolated material implies that fewer than the standard 10 million PBMC per vial must be conserved. This would reduce the number of individuals who could not be tested for Bmem due to insufficient availability of PBMC, a common problem with such assays. Conclusions: The predictable need for, and recovery of cryopreserved PBMC facilitates planning of, and optimal cell utilization in B cell ImmunoSpot assays and increases the practical feasibility of extensive Bmem characterization in larger cohorts.
Keywords:
ELISPOT
; FluoroSpot
; immunological memory
; humoral
; plasma cell
; immune monitoring
1. Introduction
Immune monitoring for clinical trials and routine diagnostics primarily relies on detecting antigen-specific antibodies in the serum/plasma of test subjects. Such pre-existing antibodies, however, reflect only the ability of the host to immediately combat an invading antigen. This occurs under optimal conditions through instantaneous neutralization (blockade of receptor binding domains and/or impairing the antigen’s association with host cells), complement fixation, precipitation through formation of immune complexes, and/or opsonization of the antigen to promote its clearance. Accordingly, preformed serum antibodies constitute the first wall of acquired humoral defense [1]. Importantly, antibodies in serum are relatively short-lived molecules which possess a half-life of ~3 weeks or less when not associated with immunoglobulin (Ig)-binding receptors such as the neonatal Fc receptor (FcRn) [2]. Their continued presence in serum therefore depends on ongoing replenishment by antibody-secreting plasma cells. While plasma cells per se can be long-lived [3], competition for survival niches located primarily in the bone marrow frequently limits their lifespan [4,5]. Subsequently, antibody levels can decline within months after vaccinations or infections [6,7,8], leaving the host susceptible to (re-)infection. Serum antibodies therefore provide fading evidence for past immune encounters and of established immunological memory.
When pre-existing antibodies can no longer prevent (re-)infections, Bmem serve as the second wall of acquired humoral defense [1]. Bmem , in contrast to antibodies in plasma/serum, are long-lived in vivo [9]. While (unlike plasma cells/blasts) Bmem do not secrete antibodies constitutively, upon antigen reencounter they rapidly give rise to secondary immune responses that produce new generations of plasma cells and Bmem. Having undergone clonal expansion, Ig class switching, and affinity maturation during previous immune encounter(s), Bmem-derived secondary antibody responses are faster and more robust compared to the initial antigen encounter. Therefore, studying Bmem unveils the immune potential that has been acquired to combat future antigen challenges when pre-existing antibodies are no longer sufficient to convey protection.
When interpreting the frequently discordant results obtained by measuring antigen-specific antibody levels vs. Bmem in blood [7], it must be considered that the differentiation of B cells into the plasma cell and Bmem lineages follows different instructive pathways (reviewed in [10,11]). During an immune response, antigen-specific (naïve and/or memory) B cells become activated and subsequently are recruited into germinal centers (GCs) within secondary lymphoid organs (spleen and/or lymph nodes) where they undergo additional clonal expansions while also acquiring somatic hypermutations (SHM) within the genes encoding their B cell antigen receptors (BCR). Subsequently, as the consequence of SHM, the daughter cells (these are called GC B cells at this differentiation stage) will express BCRs with slightly different affinity for the eliciting antigen. As these SHM are random, some of the daughter cells will acquire an increased affinity, while others will remain unchanged or even exhibit a reduced affinity for the antigen in comparison to the parental B cell. Through positive selection, the GC B cell subclones with an increased affinity for the eliciting antigen undergo further rounds of proliferation and acquisition of SHM with only the subclones achieving the highest affinity for the eliciting antigen eventually being recruited into the plasma cell lineage. This process is collectively termed affinity maturation. In contrast, antigen-specific B cells possessing a reduced affinity for the eliciting antigen will exit the germinal center and instead join the Bmem cell compartment [11]. As a consequence, the plasma cells (and hence serum antibodies) reflect on the high affinity end of the B cell repertoire generated through the immune response, whereas the Bmem repertoire will also include subclones with lower affinity for the antigen. The immunological significance of this dichotomy is that plasma cells predominantly contribute to protection against the original version of an invading infectious organism (i.e., the “homotype”) whereas Bmem also prepare the host for encounters with newly emerging future variants (“heterotypes”): while some Bmem subclones will possess a modest affinity for the homotype, they may fortuitously be endowed with an increased affinity for a heterotype and enable an anamnestic (secondary) antibody responses even at the first encounter with the heterotype [12]. Because of the distinct requirements for plasma- and Bmem lineage differentiation, and the variability in plasma cell life spans, the frequencies of antigen-specific Bmem and serum antibody levels are frequently discordant [7] and the former are more reliable in revealing past infections than plasma/serum antibody titers ([7] and Kirchenbaum, manuscript in preparation). Circulating antibodies and Bmem, reflecting wall 1 vs. 2, respectively, reveal different aspects of acquired humoral immunity, the understanding of which is equally important for immune monitoring.
For all the above reasons, the need has emerged to include assessment of antigen-specific Bmem, encompassing their affinity distribution and cross-reactivity profiles, into immunodiagnostics [13]. Once isolated from the body, serum antibodies are stable and can be stored and shipped at 4◦C (or frozen) for years. Moreover, as they detect abundant molecules in solution, many antibody-detecting tests can be performed with minute quantities of serum. Both of these properties facilitate sero-diagnostics and explain its widespread usage. Bmem in contrast, perish shortly after isolation from the body, and either need to be tested right away, or cryopreserved for later testing [14,15]. Furthermore, because antigen-specific Bmem are rare among peripheral blood mononuclear cells (PBMC), typically constituting << 0.1% thereof [16], substantial numbers of PBMC are commonly required for their reliable detection and study. Optimizing PBMC utilization for Bmem analysis is therefore critical for the inclusion of these important assays in the immune diagnostic armamentarium; this is the focus of the present communication.
Antigen-specific Bmem are best detected via the specificity of the surface BCR they express, or alternatively, based on the specificity of the antibody they secrete following terminal differentiation. One technique suitable for this purpose is staining PBMC with labelled antigen probes, followed by the identification of antigen probe-labelled B cells by flow cytometry [16,17]. The other technique relies on detecting antigen-specific B cells via the antibody secretory footprint they generate when seeded onto antigen-coated membranes [18,19]: this test system is called ELISPOT (enzyme linked immunosorbent spot assay) when the detection of the antigen-bound antibodies occurs through enzyme-catalyzed precipitation and deposition of a visible substrate, or FluoroSpot, if fluorescence-tagged detection antibodies are used. As both assay variants follow the same basic principle and differ only in the means of visualizing the secretory footprints, here they are collectively termed ImmunoSpot. In this communication we focus exclusively on ImmunoSpot assays because, compared to antigen probe staining, B cell ImmunoSpot assays require less PBMC, are more suitable for high-throughput work flows, can be automated, and can be readily validated for clinical testing [15].
2. Materials and Methods
2.1. Human Subjects
Peripheral blood mononuclear cells (PBMC) were obtained from healthy adults and originate from CTL’s ePBMC® library (CTL, Shaker Heights, OH, USA). Samples were collected at FDA-registered collection centers from IRB-consented healthy human donors by leukapheresis and then were sold to CTL identifying donors by code only while concealing the subjects’ identities. PBMC were cryopreserved at varying cell densities (10, 5 or 2 x 10⁶ cell per vial) according to previously described protocols [20] and were stored in liquid nitrogen until testing. Details of all human donors included in this manuscript, including demographics and collection dates, are provided in a supplemental excel file.
2.2. Polyclonal B Cell Stimulation
Detailed methods of thawing, washing and counting of PBMC have been previously described [20,21]. Cells were seeded into polyclonal B cell stimulation cultures within 2 h of thawing. Freshly thawed PBMC samples were resuspended in complete medium consisting of RPMI 1640 (Alkali Scientific, Fort Lauderdale, FL) supplemented with 10% fetal bovine serum (Gemini Bioproducts, West Sacramento, CA), 100 U/mL penicillin, 100 U/mL streptomycin, 2 mM L-Glutamine, 1mM sodium pyruvate, 8 mM HEPES (all from Life Technologies, Grand Island, NY) and 50 µM β-mercaptoethanol (Sigma-Aldrich, St. Louis, MO). PBMC were then stimulated with Human B-Poly-S (CTL) at 1-2 x 10⁶ cells/mL in 24-well suspension plates (Corning, Sigma-Aldrich), 25 cm2 or 75 cm2 tissue culture flasks and incubated at 37°C in 5% CO2 for five days to promote terminal differentiation of resting Bmem into antibody-secreting cells (ASC) prior to evaluation in ImmunoSpot® assays.
2.3. Recombinant Proteins
Recombinant Epstein-Barr virus nuclear antigen 1 (EBNA1) protein was purchased from Serion (Würzburg, Germany). The human cytomegalovirus (HCMV) gH pentamer complex, consisting of gH, gL, UL128, IL130 and UL131A proteins, was purchased from The Native Antigen Company (Kidlington, United Kingdom). Recombinant hemagglutinin (rHA) proteins encoding A/California/04/2009 (CA/09, H1N1), A/Texas/50/2012 (TX/12, H3N2) and B/Phuket/3073/2013 (Phuket/13, B/Yam) were acquired from the Center for Vaccines and Immunology (CVI) (University of Georgia (UGA), Athens, GA, USA) and have been described previously [22,23]. Recombinant SARS-CoV-2 Spike (S-antigen) protein representing the Wuhan-Hu-1 strain was also acquired from the CVI. Recombinant SARS-CoV-2 Nucleocapsid (NCAP) protein was purchased from the Wuhu Interferon Biological Products Industry Research Institute (Wuhu, Anhui Province, China). Importantly, all recombinant proteins used in this study possessed a genetically-encoded His affinity tag.
2.4. B Cell ImmunoSpot Assays
The general principle of B cell ELISPOT/FluoroSpot testing is outlined in Supplemental Figure S1. Collectively we refer to both tests as ImmunoSpot, as they are identical except for the last step, the visualization of secretory footprints via enzymatic or fluorescent detection. Specifically, following polyclonal stimulation, as described above, PBMC were harvested from tissue culture and washed with PBS prior to counting using CTL’s Live/Dead Cell-Counting Suite on an ImmunoSpot® S6 Ultimate Analyzer. Cell pellets were resuspended at 3 x 10⁶ live cells per mL (when measuring antigen-reactive IgG+ ASC) or 3 x 10⁵ live cells per mL (for detection of pan Ig-secreting cells), unless otherwise specified in the figure legend, in complete medium and seeded into B cell ImmunoSpot assays.
For enumeration of Ig-secreting cells irrespective of their antigen specificity (i.e. pan IgG+ ASC), the cell suspensions were serially diluted 2-fold in duplicates, starting at 3 x 10⁴ live cells per well unless otherwise specified in the figure legend, in round-bottom 96-well tissue culture plates (Corning, Sigma-Aldrich). Subsequently, cells were transferred into ImmunoSpot® assay plates that were pre-coated with anti-κ/λ capture antibody reagents (from CTL) and incubated for 16 h at 37°C, 5% CO2 unless otherwise specified in the figure legend. Plate-bound immunoglobulin (Ig) spot-forming units (SFU) were subsequently visualized using human Ig-detecting ImmunoSpot® kits (from CTL) according to the manufacturer’s instructions.
For enumeration of antigen-reactive IgG+ ASC, ImmunoSpot® assays were performed using affinity capture coating (ACC) as previously described [24]. Briefly, assay plates were first pre-conditioned with 70% (v/v) EtOH followed by two washing steps with PBS. Next, wells were coated with purified anti-6XHis tag antibody (from CTL) at 10 µg/mL in Diluent A overnight at 4°C. The following day, assay plates were washed once with PBS and then coated overnight with 6XHis-tag labeled recombinant protein at 10 µg/mL in PBS. Additionally, anti-6XHis tag antibody conditioned wells were coated with 6XHis peptide (GenScript, NJ, USA) at 2 µg/mL as a specificity control for chance recognition by IgG+ ASC. As reported previously [24], modification of the standardized antigen coating procedure was necessary for the gH pentamer complex and was achieved by coating both the anti-6XHis tag antibody and the 6XHis-tag labeled gH pentamer complex at 20 µg/mL in PBS. After overnight incubation of the 6XHis-tagged recombinant protein coating solutions at 4°C, plates were washed once with PBS and then blocked with complete medium for 1 h at room temperature prior to addition of polyclonally-stimulated PBMC at the specified cell numbers per well. Plates were incubated at 37°C, 5% CO2 for 16 h (unless indicated otherwise in the corresponding figure legend) and SFU were subsequently visualized using human IgG-detecting ImmunoSpot® kits (from CTL) according to the manufacturer´s instructions.
2.5. ImmunoSpot® Image Acquisition and SFU Counting
Plates were air-dried prior to scanning on an ImmunoSpot® Ultimate S6 Analyzer using either the Fluoro-X suite of ImmunoSpot® software (Version 7.0.28) for FluoroSpot or ImmunoSpot® Studio.SC (Version 1.7.30) for ELISPOT. SFU were then enumerated using ImmunoSpot® Studio.SC software and B cell IntelliCountTM algorithms [25]. Individual well images were quality controlled as needed. To account for the variable frequencies of pan or antigen-specific ASC amongst the donors, when applicable, two-fold serial dilutions of the donor PBMC were evaluated in ImmunoSpot assays in one or more replicate wells. Only SFU counts within the linear titration range of the ImmunoSpot assay were considered for frequency calculations and were subsequently used to extrapolate SFU counts to a designated fixed input (specified in the corresponding figure legend). Alternatively, when PBMC were plated at a fixed input of 3 x 10⁵ PBMC per well (refer to Figure 1) and the resulting SFU count exceeded the “upper bound” of accurate enumeration the SFU count was designated as >125. As ImmunoSpot® B cell kits, analyzers and software proprietary to CTL were used in this study; we refer to this collective methodology as ImmunoSpot®.
2.6. Statistical Methods
Simple linear regression analysis using GraphPad Prism 10 (San Diego, CA, USA) was performed to calculate R2 values and generate the corresponding trend lines. An analysis of variation (ANOVA) was performed to compare the frequency of S-antigen or total (pan) IgG+ ASC detected using alternative ImmunoSpot assay modalities. The mean, standard deviation (SD) and coefficient of variation (expressed as a percentage) between S-antigen-specific IgG+ ASC frequency assessments were calculated using Excel (Microsoft Office 365).
3. Results and Discussion
3.1. The Need for Testing PBMC in B Cell ImmunoSpot Assays in Serial Dilution
Having pioneered an affinity capture coating (ACC) strategy for ImmunoSpot [24] (illustrated in Supplemental Figure S1A), that facilitates development of B cell ImmunoSpot assays detecting Bmem specific for essentially any antigen, we established such assays for infectious disease-related antigens to which most humans have likely been exposed, and thus against which Bmem would have been generated. These were the Spike (S-antigen) and Nucleocapsid (NCAP) proteins of the ancestral Wuhan-Hu-1 strain of SARS-CoV-2, hemagglutinin (HA) proteins representing seasonal influenza A viruses (CA/09, H1N1 or TX/12, H3N2), seasonal influenza B virus (Phuket/13, Yamagata lineage), Epstein-Barr virus (EBNA1), and human cytomegalovirus (gH pentamer complex). Enabled by the new approach, we set out to screen a library of PBMC obtained from healthy adult donors for the presence of Bmem with reactivity against this antigen panel. Of note, the PBMC samples were collected in May 2022 or later, at which point the majority of donors had either been infected by the SARS-CoV-2 virus, and/or received one or more doses of a COVID-19 vaccine.
As commonly done for functional assays, including the traditional (T and) B cell ImmunoSpot approach, in our intial screening we tested for IgG+ antibody-secreting cell (ASC) reactivity to each antigen at a fixed cell number of 3 x 10⁵ PBMC per well. At this seeding density the PBMC sediment into a monolayer on the bottom of the 96 well plate; which is ideal for the detection of secretory footprints originating from rare individual lymphocytes using the ImmunoSpot approach [26]. Moreover, samples were tested in duplicate to counter well-to-well variatiations that can be expected in particular when detecting low frequency events [15,27].
Accounting for the possibility that the frequency of Bmem specific for any given antigen in a PBMC test sample can be quite low, it seemed justifiable to test the PBMC at a cell input close to the monolayer maximum to ensure that even antigen-specific Bmem occurring at low frequencies could be detected. Raw data obtained for 20 representative donors against the 8 antigens in our panel are shown in Figure 1. Notably, the number of antigen-reactive IgG+ ASC varied considerably between individual donors, ranging from above the upper limit of quantifcation (ULOQ) (> 125 SFU per well, see below) to below the lower limit of quantification (LLOQ, < 5 SFU/well). The data also revealed that no donor exhibited a consistently high or low responder status against all antigens in the panel; to the contrary, in line with the premise that each individual possesses a unique exposure history to environmental pathogens [28], the magnitude of viral antigen-reactive IgG+ ASC detected within and among different donors varied greatly (Supplemental Table S1). Moreover, a spectrum of secretory footprint morphologies was often observed within the same assay well, as well as distinct morphologies in wells coated with different viral antigens (Supplemental Figure S2). Therefore, these data serve to illustrate that testing PBMC at a fixed number is not suited for reliably establishing the frequency of antigen-specific IgG+ Bmem cells in ImmunoSpot assays.
To more precisely determine the frequency of antigen-specific IgG+ Bmem in donors that initially yielded a result above the assay’s ULOQ, we re-evaluated such antigen/PBMC combinations using a 2-fold serial dilution approach. As shown for a representative sample in Figure 2, a close to perfect linear relationship was seen between the number of SARS-CoV-2 Spike (S-antigen)-specific IgG+ secretory footprints (spot forming units, SFU) counted and PBMC plated, but only when the antigen-specific SFU counts were less than 100 per well (Figure 2H); at higher cell inputs for this antigen/donor combination the confluence of SFU and elevated membrane staining (occuring due to an ELISA effect in which antibodies escape into the supernatant and then subsequently bind to the antigen-coated membrane distally from the source ASC —visible in Figure 2A-C) resulted in undercounting of individual SFU (Figure 2G). The data show that secretory footprints of individual ASC could be accurately detected under 100 SFU/well, constituting the ULOQ for this particular donor. For other donors, owing either to variable antigen-specfic SFU morphologies and/or fortuitously finding the optimal serial dilution window, the ULOQ can be slightly lower or higher than 100 SFU/well. Taking this into consideration, we denoted a “gray zone” as the ULOQ in Figure 1. Nevertheless, for antigen-specific assays, the linearity region of the curve rarely exceeds 125 SFU/well (data not shown).
The LLOQ can be conservatively set at 5 SFU/well. According to Poisson’s rule, which applies when measuring antigen-specific lymphocytes [15], the well-to-well variation in SFU generated by rare ASC increases dramatically at lower precursor frequencies. Therefore, in such instances, a multitude of replicates would be required to firmly establish their actual abundance in a test sample. Importantly, only in a narrow window, between 125 and 10 SFU/well are antigen-specific SFU counts reliable for frequency calculations. Depending on the frequency of antigen-specific ASC in a test sample, as well as the resulting secretory footprint morphologies, the ideal “Goldilocks range” for frequency calculations will be unique to each PBMC/antigen combination and hence can only be consistently established using a serial dilution testing approach. Serial dilutions are therefore necessary for achieving accurate Bmem frequency measurements in PBMC samples in which antigen-specific Bmem-derived ASC are abundant, but this increases the number of PBMC required for testing. Observing the close to perfect linear relationship between PBMC numbers plated and SFU detected per well, we sought to test the hypothesis that the serial dilution strategy itself could substitute for the reliance on technical replicates. In Figure 3A-C, PBMC from three SARS-CoV-2 S-antigen-reactive subjects were serially diluted in four replicate wells for each dilution—SFU counts are shown for the Goldilocks range of <125 SFU/well only. The mean SFU counts at the designated cell inputs were first calculated, and it was established that the mean SFU counts originating from 2-fold serially diluted PBMC closely followed a linear function. Moreover, very similar regression lines were also obtained when the same calculations were performed using each of the replicates separately. Moreover, frequencies were calculated by extrapolation using either the individual SFU counts within a singlet serial dilution or using the mean counts from the quadruplicates (Figure 3D-F). In each instance, the frequency of S-antigen-specific IgG+ ASC per 106 PBMC was not significantly different between the respective singlet serial dilutions, nor were they different from the frequency determined using the mean SFU count from the four replicate wells at each cell dilution. The conclusion that singlet serial dilutions enable accurate frequency determinations was also confirmed for several additional antigens (data not shown), and for determining the frequency of ASC producing different classes of immunoglobulin (IgA, IgM or IgG) (Supplemental Figure S3). Collectively, these data demonstrate that serial dilutions performed in single wells yield nearly equivalent data compared to results obtained from serial dilutions performed in quadruplicate; however, the former approach requires only a quarter as many PBMC, representing the first subtantial saving on blood volumes needed for routine testing.
3.2. Multiplexing B Cell ImmunoSpot Assays
Immunoglobulins (Ig) occur in four major classes (IgA, IgE, IgG, and IgM) and there are four IgG subclasses (IgG1, IgG2, IgG3, and IgG4). While all of these molecules share the task of specific antigen recognition, they can fundamentally differ in the effector functions they elicit upon binding to antigen. Comprehensive immune monitoring therefore needs to account for each of these Ig classes and subclasses, including the Bmem that are pre-committed to secrete them. Traditional ELISPOT assays measure one analyte at a time: one would need to run 4 single-color assays to cover all the Ig classes, plus an additional 4 single-color assays to segregate each of the IgG subclasses, necessitating increased PBMC utilization. Multiplexing the detection of Ig classes and/or IgG subclasses is the most practical solution to this requirement, and -as we will show in the following--can be accomplished without increasing the need for additional PBMC test material.
While 4-color B cell ImmunoSpot analysis is already commerically available [14], so far its sensitivity for detecting the individal antigen-specific Ig analytes has not been formally established vs. their single color measurements. Multiplexing in FluoroSpot analysis is currently limited to four analytes owing to the requirement that each fluorescence-tagged detection antibody possess distinct excitation/emission properties that do not overlap, so that each can be visualized without leaking into the other’s detection channels and therefore permitting automated single-color counting in each color plane without the need for compensation [14]. In systematic studies we have established here that traditional single-color enzymatic ELISPOT assays and four-color fluorescent analysis provide indistinguishable antigen-specific IgG SFU counts within the linear range (Figure 4); however, in ELISPOT the linearity in S-antigen-specific SFU counts broke down earlier than FluoroSpot in large part due to the increased size of individual secretory footprints and elevated membrane staining in wells with a high density of SFU – both attributable to enzymatic amplification. Similarly, we previously demonstrated that pan (total) Ig SFU counts were also equivalent between single-color enzymatic ELISPOT and single- or four-color FluoroSpot assays [20].
With this notion in mind, we systematically studied PBMC obtained from healthy human donors in order to determine the frequency of ASC that secrete the four Ig classes and the four IgG subclasses. Following five days of in vitro polyclonal stimulation, the donor PBMC were plated at 2 x 10⁵ cells per well and then serially diluted 2-fold. The results shown in Supplemental Table S2 established that a) even for a single Ig class or IgG subclass the frequency of pan Ig ASC can vary substantially between healthy individuals, and b) that in all individuals IgM-, IgG- and IgG1-secreting ASC substantially outnumbered ASC secreting other classes/subclasses. In most instances the SFU counts originating from IgM+, IgG+ or IgG1+ ASC were above the linear range for accurate frequency calculations at the same PBMC inputs at which ASC secreting the rarer classes/subclasses (IgA, IgG2, IgG3 and IgG4) were exceedingly infrequent, if not undetectable. Lastly, these studies established that – except if one is particularly interested in the rarer Ig classes and subclasses - starting the serial dilution at 2-3 x 10⁴ PBMC per well is sufficient for multiplexed pan Ig measurements.
Systematic four-color ImmunoSpot studies conducted to establish the frequency of Bmem-derived ASC reactive with SARS-CoV-2 S-antigen representing the prototype Wuhan-Hu-1 strain were consistent with results shown in Figure 1 for single-color IgG analysis (Yao et al, manuscript in preparation). Collectively, these data confirmed the prevalence of the IgG class, and specifically the IgG1 subclass, within the antigen-specific ASC compartment.
Based on the data presented, and all experience we gained so far, we recommend for initial Bmem characterization to perform tests in which the PBMC are serially diluted starting at 1-3 x 10⁵ cells per well for each antigen, and at 1-3 x 10⁴ PBMC per well for the pan Ig assay. Since these tests can each be conducted using a single well serial dilution approach without compromising the resolution of the results, and because the detection of four Ig classes or IgG subclasses can be multiplexed using four-color detection systems, even when starting with a 3 x 10⁵ PBMC input, 1.2 x 10⁶ cells from the polyclonal stimulation cultures are sufficient for measuring all four Ig classes and four IgG subclasses per antigen with an additional 1.2 x 10⁵ cells needed for establishing the frequency of ASC producing each of the four Ig classes or IgG subclasses (irrespective of antigen specificity). The recommended plate layout for routine PBMC testing in B cell ImmunoSpot assays (Supplemental Figure S4) accomodates frequency determinations for both antigen-specific and pan Ig Bmem of all classes and subclasses despite the considerable variability of frequencies in which such Bmem occur in blood, except for those being present at very low frequencies.
3.3. Extending the Lower Limit of Detection
As can be seen in Figure 1, when tested at 3 x 10⁵ PBMC per well, there are still some donors in whom antigen-specific IgG+ ASC were not detected above the positivity threshold (>5 SFU per 3 x 10⁵ PBMC). Such an outcome may reflect two fundamentally different scenarios: either such donors have not been exposed to the antigen (true negative) or the frequency of Bmem specific for the antigen in question was below the detection limit of the assay as performed for this particular donor (false negative). Owing to the heterogeneous and often unverifiable antigen exposure histories of human subjects, determining the distinction between a true negative vs. a false negative test result is not a simple task. SARS-CoV-2 S- and NCAP antigens provide here a rare opportunity to distinguish between immunologically naïve and antigen-exposed individuals. As shown in Supplemental Table S3, subjects whose PBMC were cryopreserved before the introduction of the SARS-CoV-2 virus into the human population exhibited negligible IgG+ ASC reactivity when 1 x 10⁵ or 2 x 10⁵ PBMC were tested against SARS-CoV-2 S-antigen or NCAP, respectively. Such samples serve as true negatives and yielded the expected results. In contrast, donors who had either recovered from verified SARS-CoV-2 infection or completed the primary COVID-19 mRNA vaccination series possessed clearly elevated frequencies of S-antigen reactive Bmem-derived IgG+ ASC and provided 100% diagnostic specificity when tested at 1 x 10⁵ PBMC or lower inputs per well. However, these positive test results were seen using samples isolated within half a year following verified infection or vaccination and raised the question whether testing 2 x 10⁵ PBMC would suffice for reliably detecting S-antigen or NCAP-specific Bmem in samples from subjects whose prior infection and/or vaccination history was unknown.
With this specific question in mind, cryopreserved PBMC (collected between May and October 2022) were subjected to polyclonal stimulation and evaluated for Bmem-derived IgG+ ASC reactivity against SARS-CoV-2 S-antigen and NCAP representing the ancestral Wuhan-Hu-1 strain (Supplemental Table S4). Owing to the elevated frequency of S-antigen specific Bmem-derived IgG+ ASC detected in earlier experiments (Figure 1 and data not shown), these samples were exclusively tested using a singlet serial dilution approach starting at 2 x 10⁵ PBMC per well. However, to account for the possibility that NCAP-specific Bmem frequencies could be low, we tested these samples using either a singlet serial dilution approach starting at 2 x 10⁵ or by seeding replicate wells with 5 x 10⁵ PBMC. Notably, Bmem-derived IgG+ ASC reactivity against the S-antigen was readily apparent in 100% of these donors (n=10) and supports the notion that S-antigen-specific Bmem were generated as a consequence of prior infection(s) and/or vaccination(s). Half (5/10) of these donors, however, did not exhibit clearly elevated numbers of NCAP-reactive Bmem-derived IgG+ ASC when tested at an initial starting input of 2 x 10⁵ PBMC per well. Had these five donors indeed avoided prior SARS-CoV-2 virus infection despite its widespread early in 2022 [29], or were the frequencies of NCAP-reactive Bmem in such PBMC samples merely below the detection limit of the assay as performed? Only through modifying the testing procedure and seeding 5 x 10⁵ PBMC per well to augment the assay’s detection limit could this question be addressed. Among the donors that yielded <5 NCAP-reactive IgG+ SFU in wells seeded with 2 x 10⁵ PBMC, 4 of 5 donors demonstrated an increased number of NCAP-reactive SFU in wells seeded with 5 x 10⁵ PBMC. Nevertheless, the resulting SFU counts were not necessarily increased by 2.5-fold as might be expected. However, when the SFU counts from the four replicate NCAP-coated wells seeded with 5 x 10⁵ PBMC were aggregated together, entailing a 10-fold increase in the number of PBMC tested in the assay, it became more evident that 8 of 10 donors had likely been previously infected; albeit such cannot be definitively confirmed. Furthermore, when testing PBMC at high cell inputs, and particularly when aiming to detect very low frequencies of antigen-specific ASC, it is advisable to incorporate an irrelevant antigen into the test to serve as a comparator for “chance” reactivity.
As such, B cell ImmunoSpot assays are capable of detecting individual ASC so long as (a) these cells don’t compete for real estate on the membrane for their respective secretory footprints being captured (as shown above, this is a limitation readily overcome by performing serial dilutions when measuring high frequency ASC populations) and (b) the PBMC do not pile up in layers on the membrane. In the latter case of cell crowding, bystander cells in the lower stratum can be expected to hinder the generation of secretory footprints on the antigen-coated membrane by ASC in the upper strata. From direct visualization of PBMC on the membrane, we already know that cell inputs >1 x 10⁶ PBMC per well exceed a single stratum (i.e. a monolayer) when input into a standard 96 well plate [26]. To experimentally address how many PBMC can be plated per well before cell crowding starts to interfer with detection of ASC at single cell resolution, we admixed polyclonally simulated PBMC (that contained ASC at an optimal “Goldilocks number”, i.e., ~ 50 SFU per well) with increasing numbers of autologous unstimulated PBMC (that do not contain IgG+ ASC). The results are shown in Supplemental Figure S6, indicating that PBMC inputs exceeding 5 x 10⁵ per well can undermine the ability to discern individual secretory footprints. Therefore, if extending the lower limit of detection is intended, the number of PBMC interrogated can be indefinitely increased by testing additional replicates, each at 5 x 10⁵ PBMC per well.
Collectively, the data presented so far suggest that testing of uncharacterized PBMC for antigen-specific ASC should start at 3-5 x 10⁵ PBMC per well, and progress in a 2-fold serial dilution. This approach should permit reliable detection and accurate quantification of ASC populations existing at intermediate to high frequencies. If a donor is in the low/ambiguous frequency range, subsequent retesting at 5 x 10⁵ PBMC per well in replicates will enable extending the limit of detection and of quantification. Such a fail safe strategy requires, however, that additional vials of cryopreserved PBMC are set aside (see below). As an alternative, to accomodate the scenario in which Bmem frequencies in the study cohort could also exist at low frequencies, in the first test one could perform a serial dilution in singlet wells and also set up replicate wells with an input of 5 x 10⁵ PBMC. In such a testing approach, the serial dilution would adequately cover the intermediate to high ASC frequency range, while the replicate wells seeded with the highest cell input would enable low frequency measurements.
3.4. Targeted Cryopreservation of PBMC for Testing (And Re-Testing) in B Cell ImmunoSpot Assays
In previous work we have established protocols according to which PBMC can be cryopreserved without loss of functionality for later testing in B cell ImmunoSpot assays [14,20] and we have shown the high reproducibilty of the data (CV<20%) when different aliquots of the same sample are tested on different days, even by different investigators [15]. Such robust assay performance is essential for the ability to (a) test clinical samples in central laboratories remote from sites where they were collected, and (b) independent of the time point of collection (c) to test PBMC of different donors side-by-side in a single high throughput experiment avoiding inter-assay variations of results; (d) to reproduce results by testing repeatedly aliquots of the same blood draw, and (e) to extend the results of the first screening run if needed or intended, e.g., to lower detection limits, or to perform subsequent B cell cross-reactivity or affinity spectrum analysis by ImmunoSpot [30,31]. For the latter two options it is essential to first establish the “Goldilocks PBMC number” that yields ~50 SFU per well for a given antigen/sample combination. Cryopreservation is also essential (f) for generating reference PBMC with established Bmem frequencies for antigens of interest [7], as well as for (g) the ability to validate B cell ImmunoSpot assays [15].
Cryopreservation of PBMC for testing in functional assays is already well-established and is traditionally done at 10 million PBMC/vial. The data shown above, however, suggest that only 1-2 x 10⁶ PBMC following the 5-day polyclonal stimulation would be sufficient to establish the frequency of Bmem specific for an antigen even when the assessment extends to all four Ig classes and four IgG subclasses. Even if the PBMC would need to be retested, e.g., to extend the lower detection limit, only a few million more cells at most (far less than 10 million) would be needed. The question therefore arose, whether PBMC can be cryopreserved in lower numbers per cryovial than 10 million to avoid the waste of precious cell material.
To address this question, PBMC collected by leukapheresis were either directly subjected to polyclonal stimulation immediately upon receipt, without cryopreservation, i.e., were tested “fresh”, or following cryopreservation in aliquots containing 10, 5, or 2 x 10⁶ PBMC per vial. To allow for batch testing of multiple donors’ samples in parallel, cryopreserved aliquots were thawed two weeks or more after being generated, subjected to polyclonal stimulation and then tested for ASC activity in ImmunoSpot assays. Pan Ig and antigen-specific ASC frequencies were established using the singlet two-fold serial dilution strategy described above. In Table 1, the frequencies of S-antigen-specific IgG+ ASC are represented as the percentage of all IgG+ ASC. The results are essentially identical for fresh and frozen cells, and notably, irrespective of the number of PBMC cryopreserved per vial. Collectively, these data indicate, at least for healthy adult donors, that cryopreserving a custom number of PBMC is feasible. However, whether this conclusion can be extended to donors with different disease states or those undergoing various therapies would need to be verified in each specific clinical scenario.
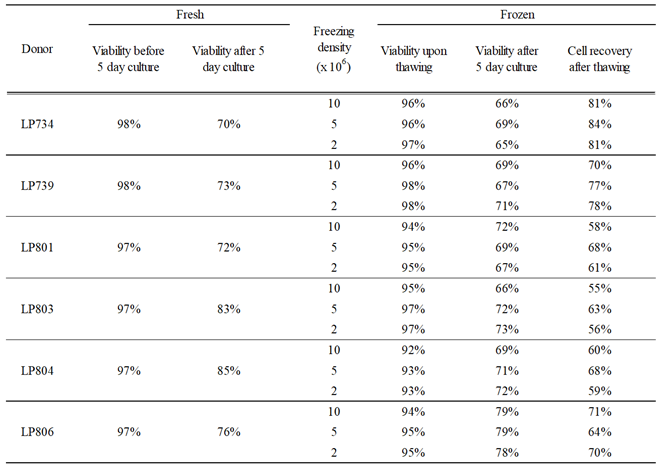
The above experiment also provided insights into cell losses associated with the cryopreservation of PBMC obtained from healthy adult donors at various cell densities. As seen in Table 2, the viabilities of PBMC frozen at the various cell densities upon thawing and following the polyclonal stimulation were indistinguishable and mirrored what was observed using freshly isolated cell material. Data accumulated over the years documenting cell recovery following the in vitro polyclonal stimulation procedure when starting with samples cryopreserved at 10 million PBMC per vial confirm the conclusion that with rare exceptions at least 50% of the PBMC can be recovered after cryopreservation followed by a 5-day polyclonal stimulation culture (Supplementary Figure S6B). This finding may serve as a guide for the planning B cell immunoSpot assays cryopreserving custom numbers of PBMC for optimized cell utilization.
4. Summary and Conclusions
As the amount of blood/PBMC available is one of the primary limitations for conducting cell-based immune monitoring, we focused in this publication on the logistic of how to optimize PBMC utilization for detection of antigen-specific Bmem cells using ImmunoSpot assays. We have established that while testing PBMC in serial dilution is necessary for defining the frequency of antigen-specific ASC when they are abundant, doing so in singlet wells provides in most cases results that are just as accurate as tests performed with additional technical replicates. We have also established that four-color multiplexed Ig class- or subclass determinations are an additional means for maximizing PBMC utilization without compromising on assay sensitivity. When testing healthy donors for Bmem specific for antigens representing ubiqitous and commonly encountered viruses, we conclude that an initial screening approach that starts at 3-5 x 10⁵ PBMC per well, with subsequent serial dilutions, will accommodate the majority of cases where Bmem frequencies are in the intermediate to high range. This can readily be accomplished using 0.6 – 1 x 10⁶ PBMC per donor following the 5 days of polyclonal stimulation; which is obtainable from 2 mL, or more conservatively 3 mL, of blood even following cryopreservation. If, for some donors, Bmem frequencies are below the assay’s lower limit of quantification (LLOQ) when tested using the proposed approach (i.e., <10 SFU per 3-5 x 10⁵ PBMC), yet it is desired to augment the LLOQ, thawing additional aliquots and retesting the sample(s) at 5 x 10⁵ PBMC per well in replicate wells is a viable strategy. The calculatable need for cells, and the predictable recovery of PBMC following their cryopreservation and subsequent polyclonal stimulation makes it possible to customize the number of PBMC cryopreserved per vial and achieve optimal sample utilization for downstream testing. Notably, while all findings reported here were made using PBMC obtained from healthy adult donors, our findings should catalyze similar studies to be undertaken using patient or pediatric samples (where PBMC are particularly limiting), as such information should be taken into consideration for achieving optimal sample utilization in the context of a clinical trial.
Supplementary Materials
The following supporting information can be downloaded at the website of this paper posted on Preprints.org. (we will make a single pdf with all supplemental figures and a separate excel file with the donors’ demographics and collection dates so they can be viewed/downloaded separately)
Author Contributions
Conceptualization: PVL and GAK; Methodology: PVL, GAK, NB, and LY; Formal analysis: GAK and NB; Investigation: NB and LY; Data curation: GAK and NB; Writing—original draft preparation: PVL; Writing—review and editing PVL and GAK; Supervision: GAK; Project administration: GAK. All authors have read and agreed to the published version of the manuscript.
Funding
This research was funded by the R&D budget of Cellular Technology Limited (CTL).
Institutional Review Board Statement
PBMC samples from pre- and post-COVID-19-era donors were collected at FDA-registered collection centers from IRB-consented healthy human donors and were sold to CTL identifying donors by code only while concealing the subjects’ identities. PBMC from convalescent COVID-19 donors were obtained either from the American Red Cross (Atlanta, GA, USA), BioIVT (Westbury, NY, USA), or Stem Express (Folsom, CA, USA) with IRB approval and then were sold to CTL identifying donors by code only while concealing the subjects’ identities. PBMC from COVID-19 mRNA vaccinated donors were collected internally at CTL under an Advarra Approved IRB #Pro00043178 (CTL study number: GL20-16 entitled COVID-19 Immune Response Evaluation).
Informed Consent Statement
Not applicable.
Data Availability Statement
The data generated in this study will be made available by the authors, without undue reservation, to any qualified researcher.
Acknowledgments
We thank Drs. Graham Pawelec and Alexey Y. Karulin for their valuable discussions and comments on the manuscript.
Conflicts of Interest
P.V.L. is Founder, President, and CEO of Cellular Technology Limited (CTL), a company that specializes in immune monitoring by ImmunoSpot. N.B., G.A.K., and L.Y. are employees of CTL. This study was funded by CTL, and the funder directed the study design, collection, analysis, interpretation of data, the writing of this article, and made the decision to submit it for publication.
References
- Akkaya, M.; K. Kwak, and S.K. Pierce, B cell memory: building two walls of protection against pathogens. Nat Rev Immunol 2020, 20, 229–238. [Google Scholar] [CrossRef] [PubMed]
- Pyzik, M.; et al. The therapeutic age of the neonatal Fc receptor. Nat Rev Immunol 2023, 23, 415–432. [Google Scholar] [CrossRef] [PubMed]
- Amanna, I.J.; N. E. Carlson, and M.K. Slifka, Duration of humoral immunity to common viral and vaccine antigens. N Engl J Med 2007, 357, 1903–1915. [Google Scholar] [CrossRef]
- Lightman, S.M.; A. Utley, and K.P. Lee, Survival of Long-Lived Plasma Cells (LLPC): Piecing Together the Puzzle. Front Immunol 2019, 10, 965. [Google Scholar] [CrossRef]
- Robinson, M.J.; et al. Intrinsically determined turnover underlies broad heterogeneity in plasma-cell lifespan. Immunity 2023, 56, 1596–1612. [Google Scholar] [CrossRef]
- Seow, J.; et al. Longitudinal observation and decline of neutralizing antibody responses in the three months following SARS-CoV-2 infection in humans. Nat Microbiol 2020, 5, 1598–1607. [Google Scholar] [CrossRef]
- Wolf, C.; et al. Antibody Levels Poorly Reflect on the Frequency of Memory B Cells Generated following SARS-CoV-2, Seasonal Influenza, or EBV Infection. Cells 2022, 11. [Google Scholar] [CrossRef]
- Xiang, T.; et al. Declining Levels of Neutralizing Antibodies Against SARS-CoV-2 in Convalescent COVID-19 Patients One Year Post Symptom Onset. Front Immunol 2021, 12, 708523. [Google Scholar] [CrossRef]
- Palm, A.E. and C. Henry, Remembrance of Things Past: Long-Term B Cell Memory After Infection and Vaccination. Front Immunol 2019, 10, 1787. [Google Scholar] [CrossRef]
- Inoue, T.; et al. Generation of memory B cells and their reactivation. Immunol Rev 2018, 283, 138–149. [Google Scholar] [CrossRef]
- Victora, G.D. and M.C. Nussenzweig, Germinal Centers. Annu Rev Immunol 2022, 40, 413–442. [Google Scholar] [CrossRef] [PubMed]
- Matz, H.C.; K. M. McIntire, and A.H. Ellebedy, 'Persistent germinal center responses: slow-growing trees bear the best fruits'. Curr Opin Immunol 2023, 83, 102332. [Google Scholar] [CrossRef] [PubMed]
- Kirchenbaum, G.A.; G. Pawelec, and P.V. Lehmann, The Importance of Monitoring Antigen-Specific Memory B Cells, and How ImmunoSpot Assays Are Suitable for This Task. Cells 2025, 14, 223. [Google Scholar] [CrossRef] [PubMed]
- Fecher, P.; et al. B Cells and B Cell Blasts Withstand Cryopreservation While Retaining Their Functionality for Producing Antibody. Cells 2018, 7, 50. [Google Scholar] [CrossRef]
- Lehmann, P.V.; et al. Theoretical and practical considerations for validating antigen-specific B cell ImmunoSpot assays. J Immunol Methods 2025, 537, 113817. [Google Scholar] [CrossRef]
- Phelps, A.; et al. Production and use of antigen tetramers to study antigen-specific B cells. Nat Protoc 2024, 19, 727–751. [Google Scholar] [CrossRef]
- Boonyaratanakornkit, J. and J.J. Taylor, Techniques to Study Antigen-Specific B Cell Responses. Front Immunol 2019, 10, 1694. [Google Scholar] [CrossRef]
- Czerkinsky, C.C.; et al. A solid-phase enzyme-linked immunospot (ELISPOT) assay for enumeration of specific antibody-secreting cells. J Immunol Methods 1983, 65, 109–121. [Google Scholar] [CrossRef]
- Sedgwick, J.D. and P.G. Holt, A solid-phase immunoenzymatic technique for the enumeration of specific antibody-secreting cells. J Immunol Methods 1983, 57, 301–309. [Google Scholar] [CrossRef]
- Yao, L.; et al. Four-Color ImmunoSpot((R)) Assays Requiring Only 1-3 mL of Blood Permit Precise Frequency Measurements of Antigen-Specific B Cells-Secreting Immunoglobulins of All Four Classes and Subclasses. Methods Mol Biol 2024, 2768, 251–272. [Google Scholar]
- Ramachandran, H.; et al. Optimal thawing of cryopreserved peripheral blood mononuclear cells for use in high-throughput human immune monitoring studies. Cells 2012, 1, 313–324. [Google Scholar] [CrossRef] [PubMed]
- Carlock, M.A.; et al. Impact of age and pre-existing immunity on the induction of human antibody responses against influenza B viruses. Hum Vaccin Immunother 2019, 15, 2030–2043. [Google Scholar] [CrossRef] [PubMed]
- Ecker, J.W.; et al. High-Yield Expression and Purification of Recombinant Influenza Virus Proteins from Stably-Transfected Mammalian Cell Lines. Vaccines 2020, 8, 462. [Google Scholar] [CrossRef]
- Koppert, S.; et al. Affinity Tag Coating Enables Reliable Detection of Antigen-Specific B Cells in Immunospot Assays. Cells 2021, 10, 1843. [Google Scholar] [CrossRef]
- Karulin, A.Y.; et al. Artificial Intelligence-Based Counting Algorithm Enables Accurate and Detailed Analysis of the Broad Spectrum of Spot Morphologies Observed in Antigen-Specific B-Cell ELISPOT and FluoroSpot Assays. Methods Mol Biol 2024, 2768, 59–85. [Google Scholar]
- Hanson, J.; et al. ELISPOT Assays in 384-Well Format: Up to 30 Data Points with One Million Cells. Cells 2015, 4, 71–83. [Google Scholar] [CrossRef]
- Dittrich, M. and P.V. Lehmann, Statistical analysis of ELISPOT assays. Methods Mol Biol 2012, 792, 173–183. [Google Scholar]
- Xu, G.J.; et al. Viral immunology. Comprehensive serological profiling of human populations using a synthetic human virome. Science 2015, 348, aaa0698. [Google Scholar] [CrossRef]
- Viana, R.; et al. Rapid epidemic expansion of the SARS-CoV-2 Omicron variant in southern Africa. Nature 2022, 603, 679–686. [Google Scholar] [CrossRef]
- Becza, N.; et al. Assessing the Affinity Spectrum of the Antigen-Specific B Cell Repertoire via ImmunoSpot((R)). Methods Mol Biol 2024, 2768, 211–239. [Google Scholar]
- Lehmann, P.V.; et al. Monitoring Memory B Cells by Next-Generation ImmunoSpot((R)) Provides Insights into Humoral Immunity that Measurements of Circulating Antibodies Do Not Reveal. Methods Mol Biol 2024, 2768, 167–200. [Google Scholar] [PubMed]
Figure 1.
Antigen-specific Bmem occur over a wide frequency range in blood. PBMC from healthy human subjects (n=20) – each represented by a dot – were tested in ImmunoSpot assays following in vitro polyclonal stimulation to establish the frequency of Bmem-derived IgG+ ASC specific for a panel of recombinantly expressed viral antigens (refer to Materials and Methods). The data shown represent results obtained when testing PBMC at single fixed input of 3 x 10⁵ PBMC per well. Since quantification of wells with >125 antigen-specific spot forming units (SFU) is generally imprecise, we defined this as the upper limit for accurate counts. All wells yielding a SFU count exceeding this designated upper limit of quantification were assigned a value of >125 SFU. Moreover, depending on the distribution and morphology of antigen-specific SFU in the assay well, we further defined an upper limit of accurate counts at 100 SFU; denoted by the gray shading in the figure. Similarly, the lower gray shaded region denotes low frequency responses in which Poisson noise hinders accurate frequency determinations.
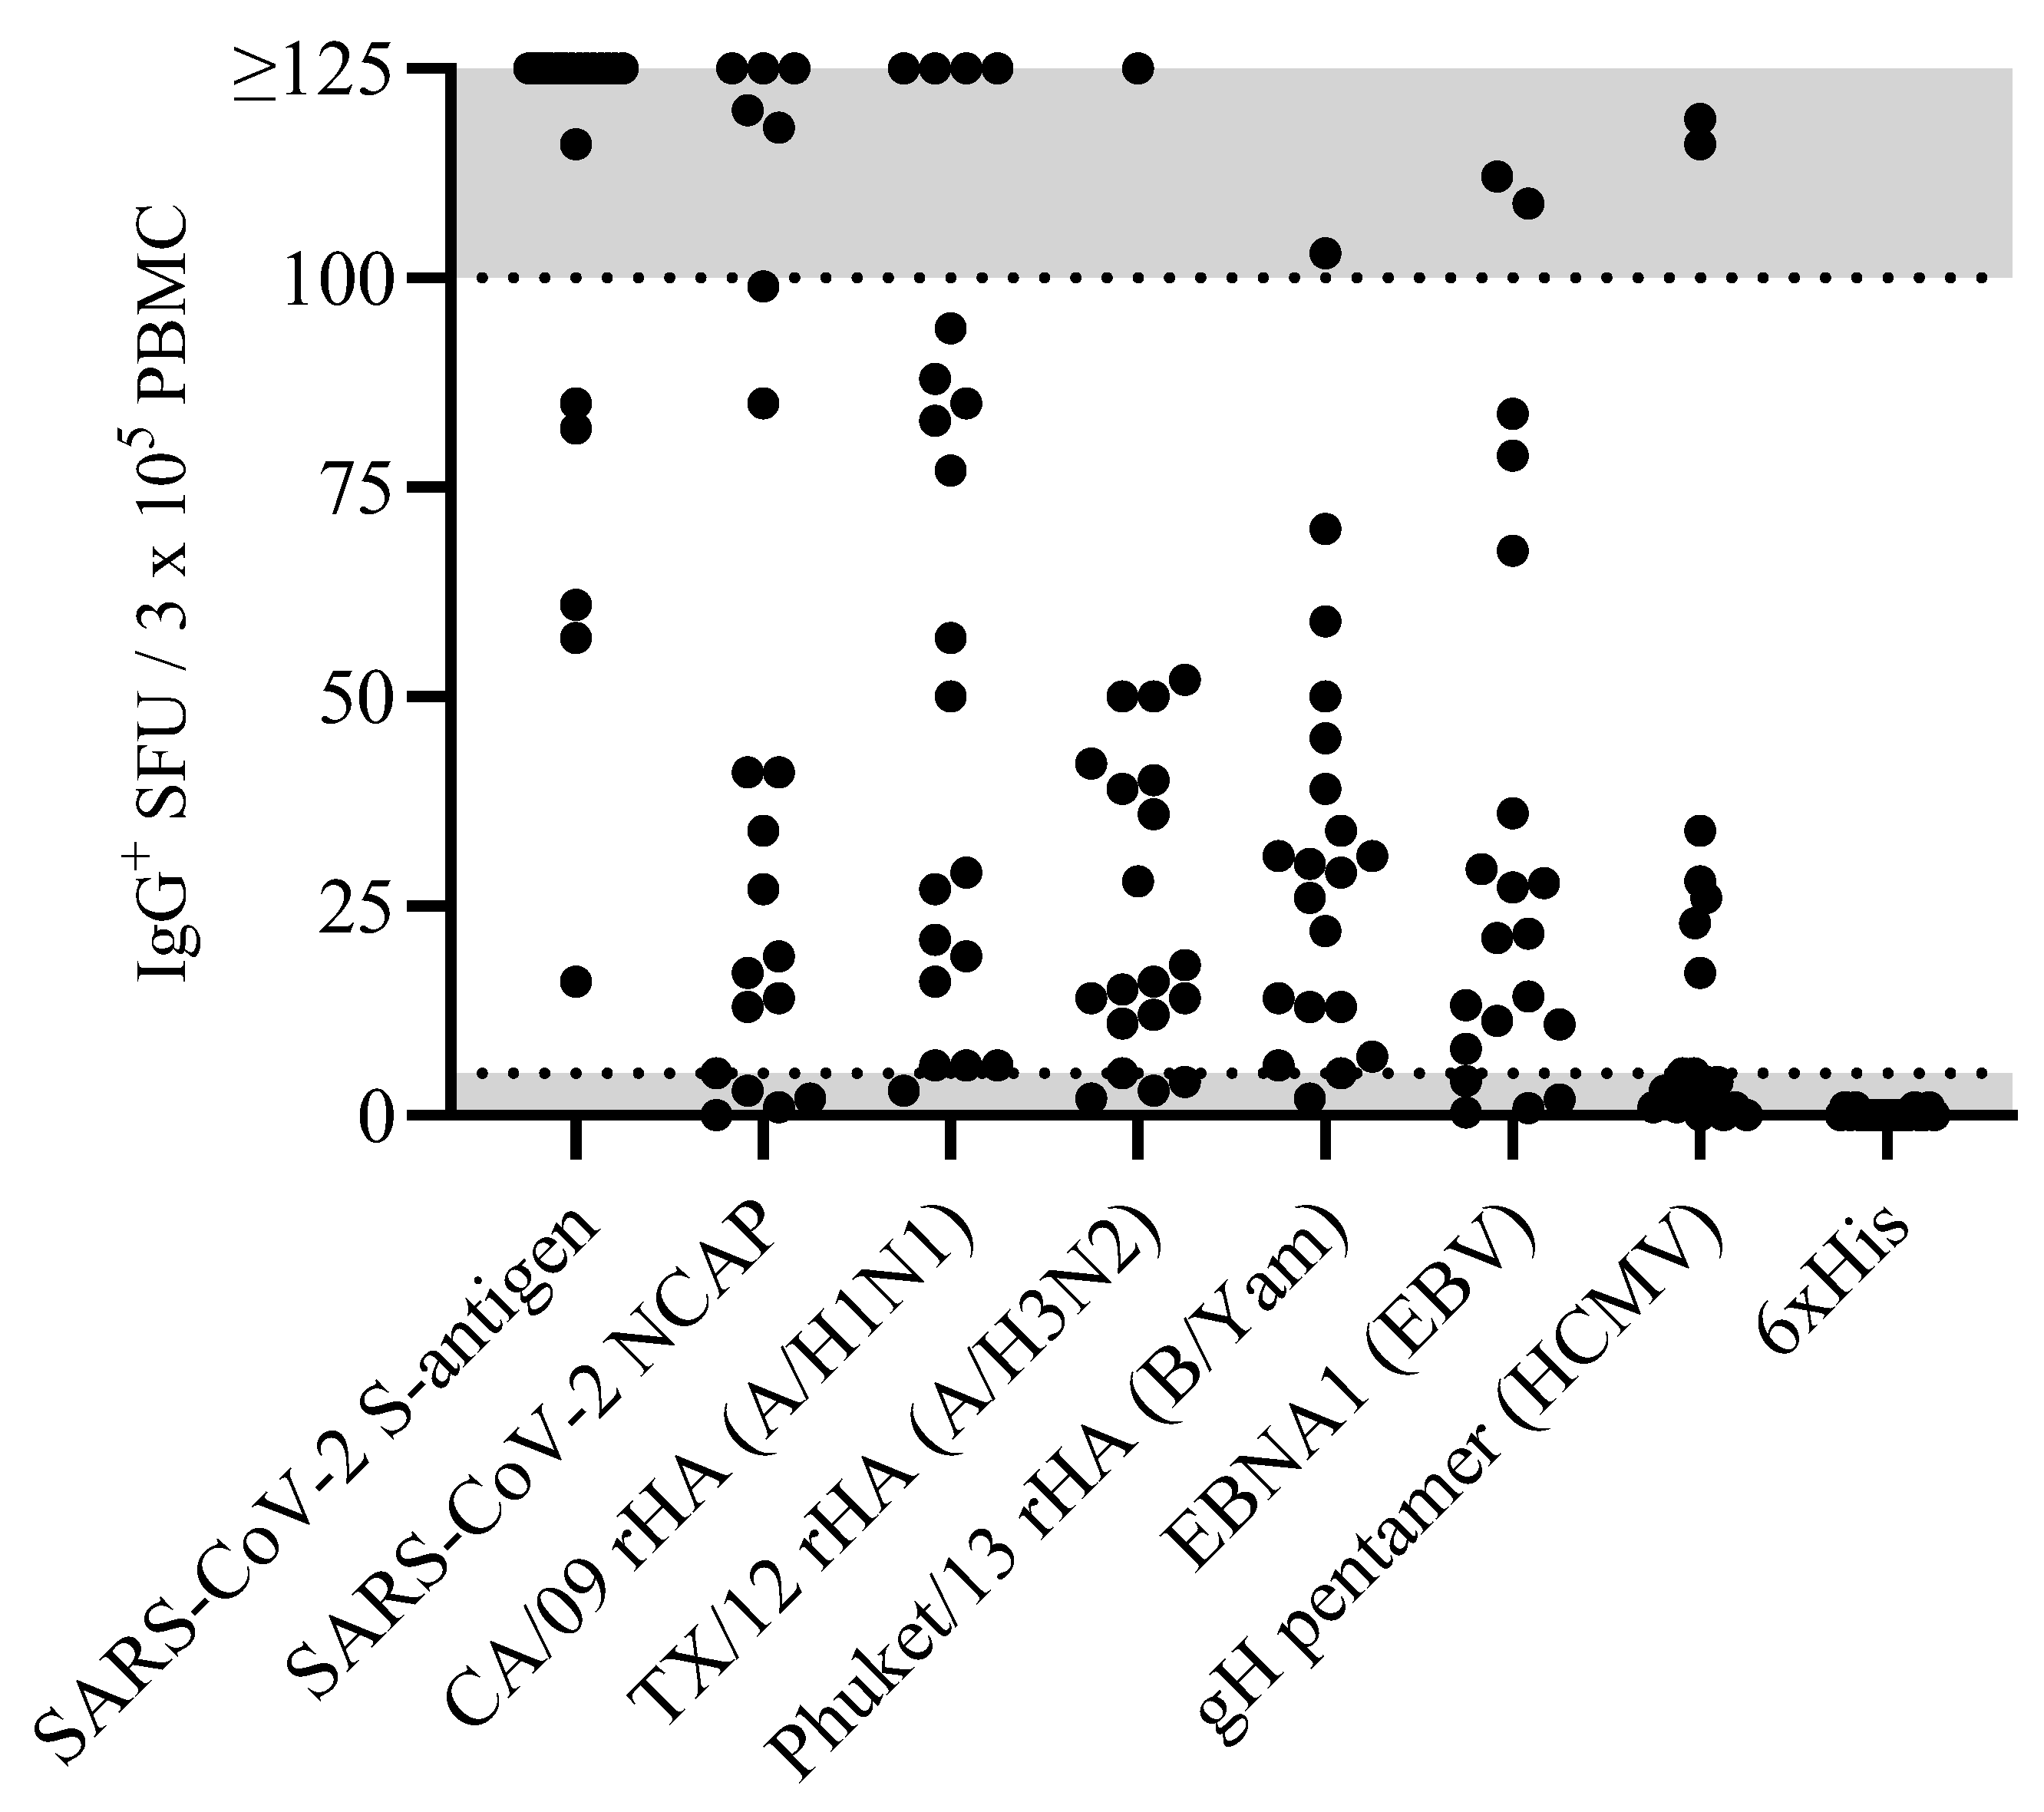
Figure 2.
Establishing the frequency of S-antigen-specific Bmem-derived IgG+ ASC using a serial dilution approach. PBMC from a healthy human subject, collected in the post-COVID era, were tested in an ImmunoSpot assay using a two-fold serial dilution approach to determine the frequency of SARS-CoV-2 S-antigen-specific IgG+ ASC following 5 days of in vitro polyclonal stimulation. A-F) Representative well images are shown for each of the specified cell inputs. Note: crowding of spot-forming units (SFU) and elevated background membrane staining resulting from an ELISA effect were present in wells input with >1 x 10⁵ PBMC. G) SFU counts per well vs. cell input over the entire cell dilution range tested. Deviation from linearity was evident at values >100 SFU per well; denoted by the dashed red line, representing the theoretical linear relationship between SFU counts and PBMC plated. H) Linearity between SFU counts and cell input in wells seeded with < 2.5 x 10⁴ PBMC; R2 value denotes the goodness of fit of the data. Notably, for this particular donor and antigen combination the mean SFU count from the 2.5 x 10⁴ PBMC input underestimated the frequency of S-antigen-specific IgG+ ASC; denoted in parenthesis as the number of S-antigen-specific IgG+ ASC per 106 PBMC.
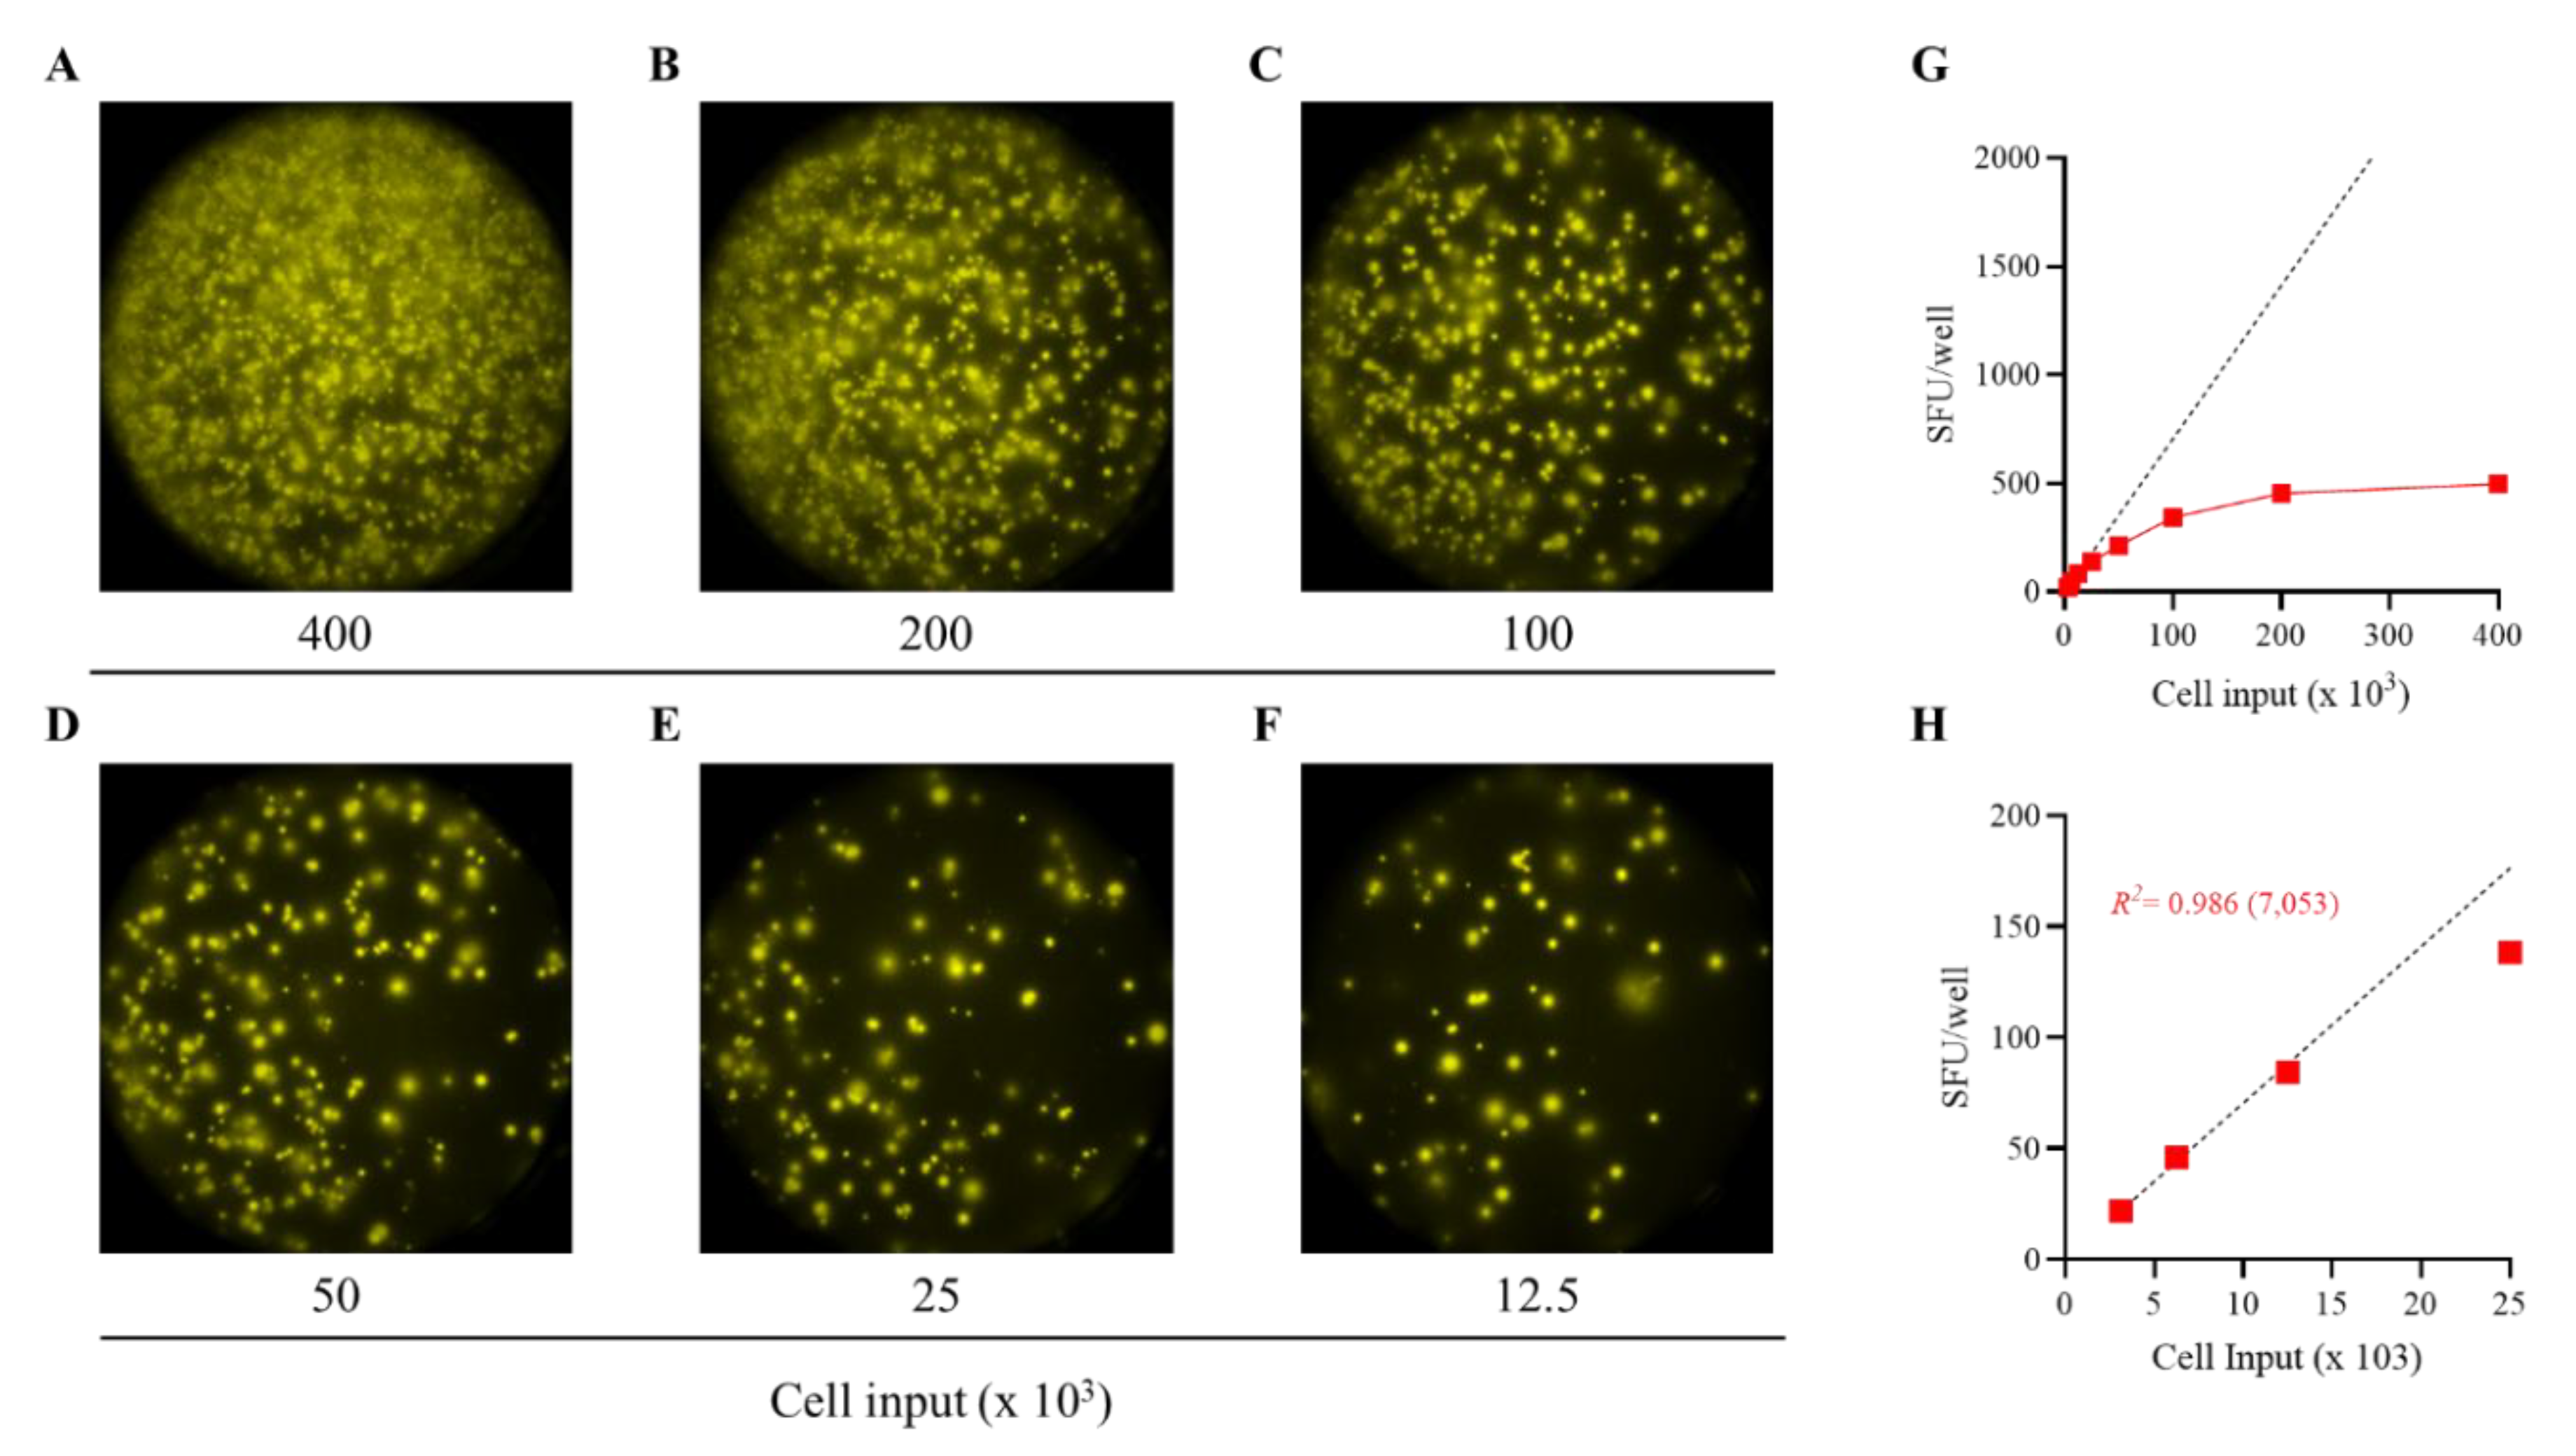
Figure 3.
Measurements of S-antigen-specific IgG+ ASC frequencies using a singlet serial dilution approach are similar to those based on the mean of quadruplicates. PBMC from three healthy human subjects, collected in the post-COVID era, were evaluated for S-antigen-specific IgG+ ASC following 5 days of in vitro polyclonal stimulation using a serial dilution approach and four replicate wells at each cell input. A-C) S-antigen-specific IgG+ SFU counts occurring within the linear range for each donor are plotted. The mean ± SD SFU counts from the four replicate wells, along with the regression line and R2 values, are in red. Additionally, datapoints originating from the four singlet serial dilutions, respectively, were used for linear regression analysis and the corresponding trend lines and R2 values are denoted in the corresponding colors indicated in the figure inset. D-F) The frequency of S-antigen-specific IgG+ ASC was then calculated using three consecutive datapoints from a singlet serial dilution or the mean SFU count at the corresponding cell inputs and then extrapolated to 106 PBMC. Importantly, no statistically significant differences were detected between the extrapolated datapoints originating from the individual singlet serial dilutions or the mean of quadruplicate wells using an analysis of variance (ANOVA) with post-hoc test for multiple comparisons.
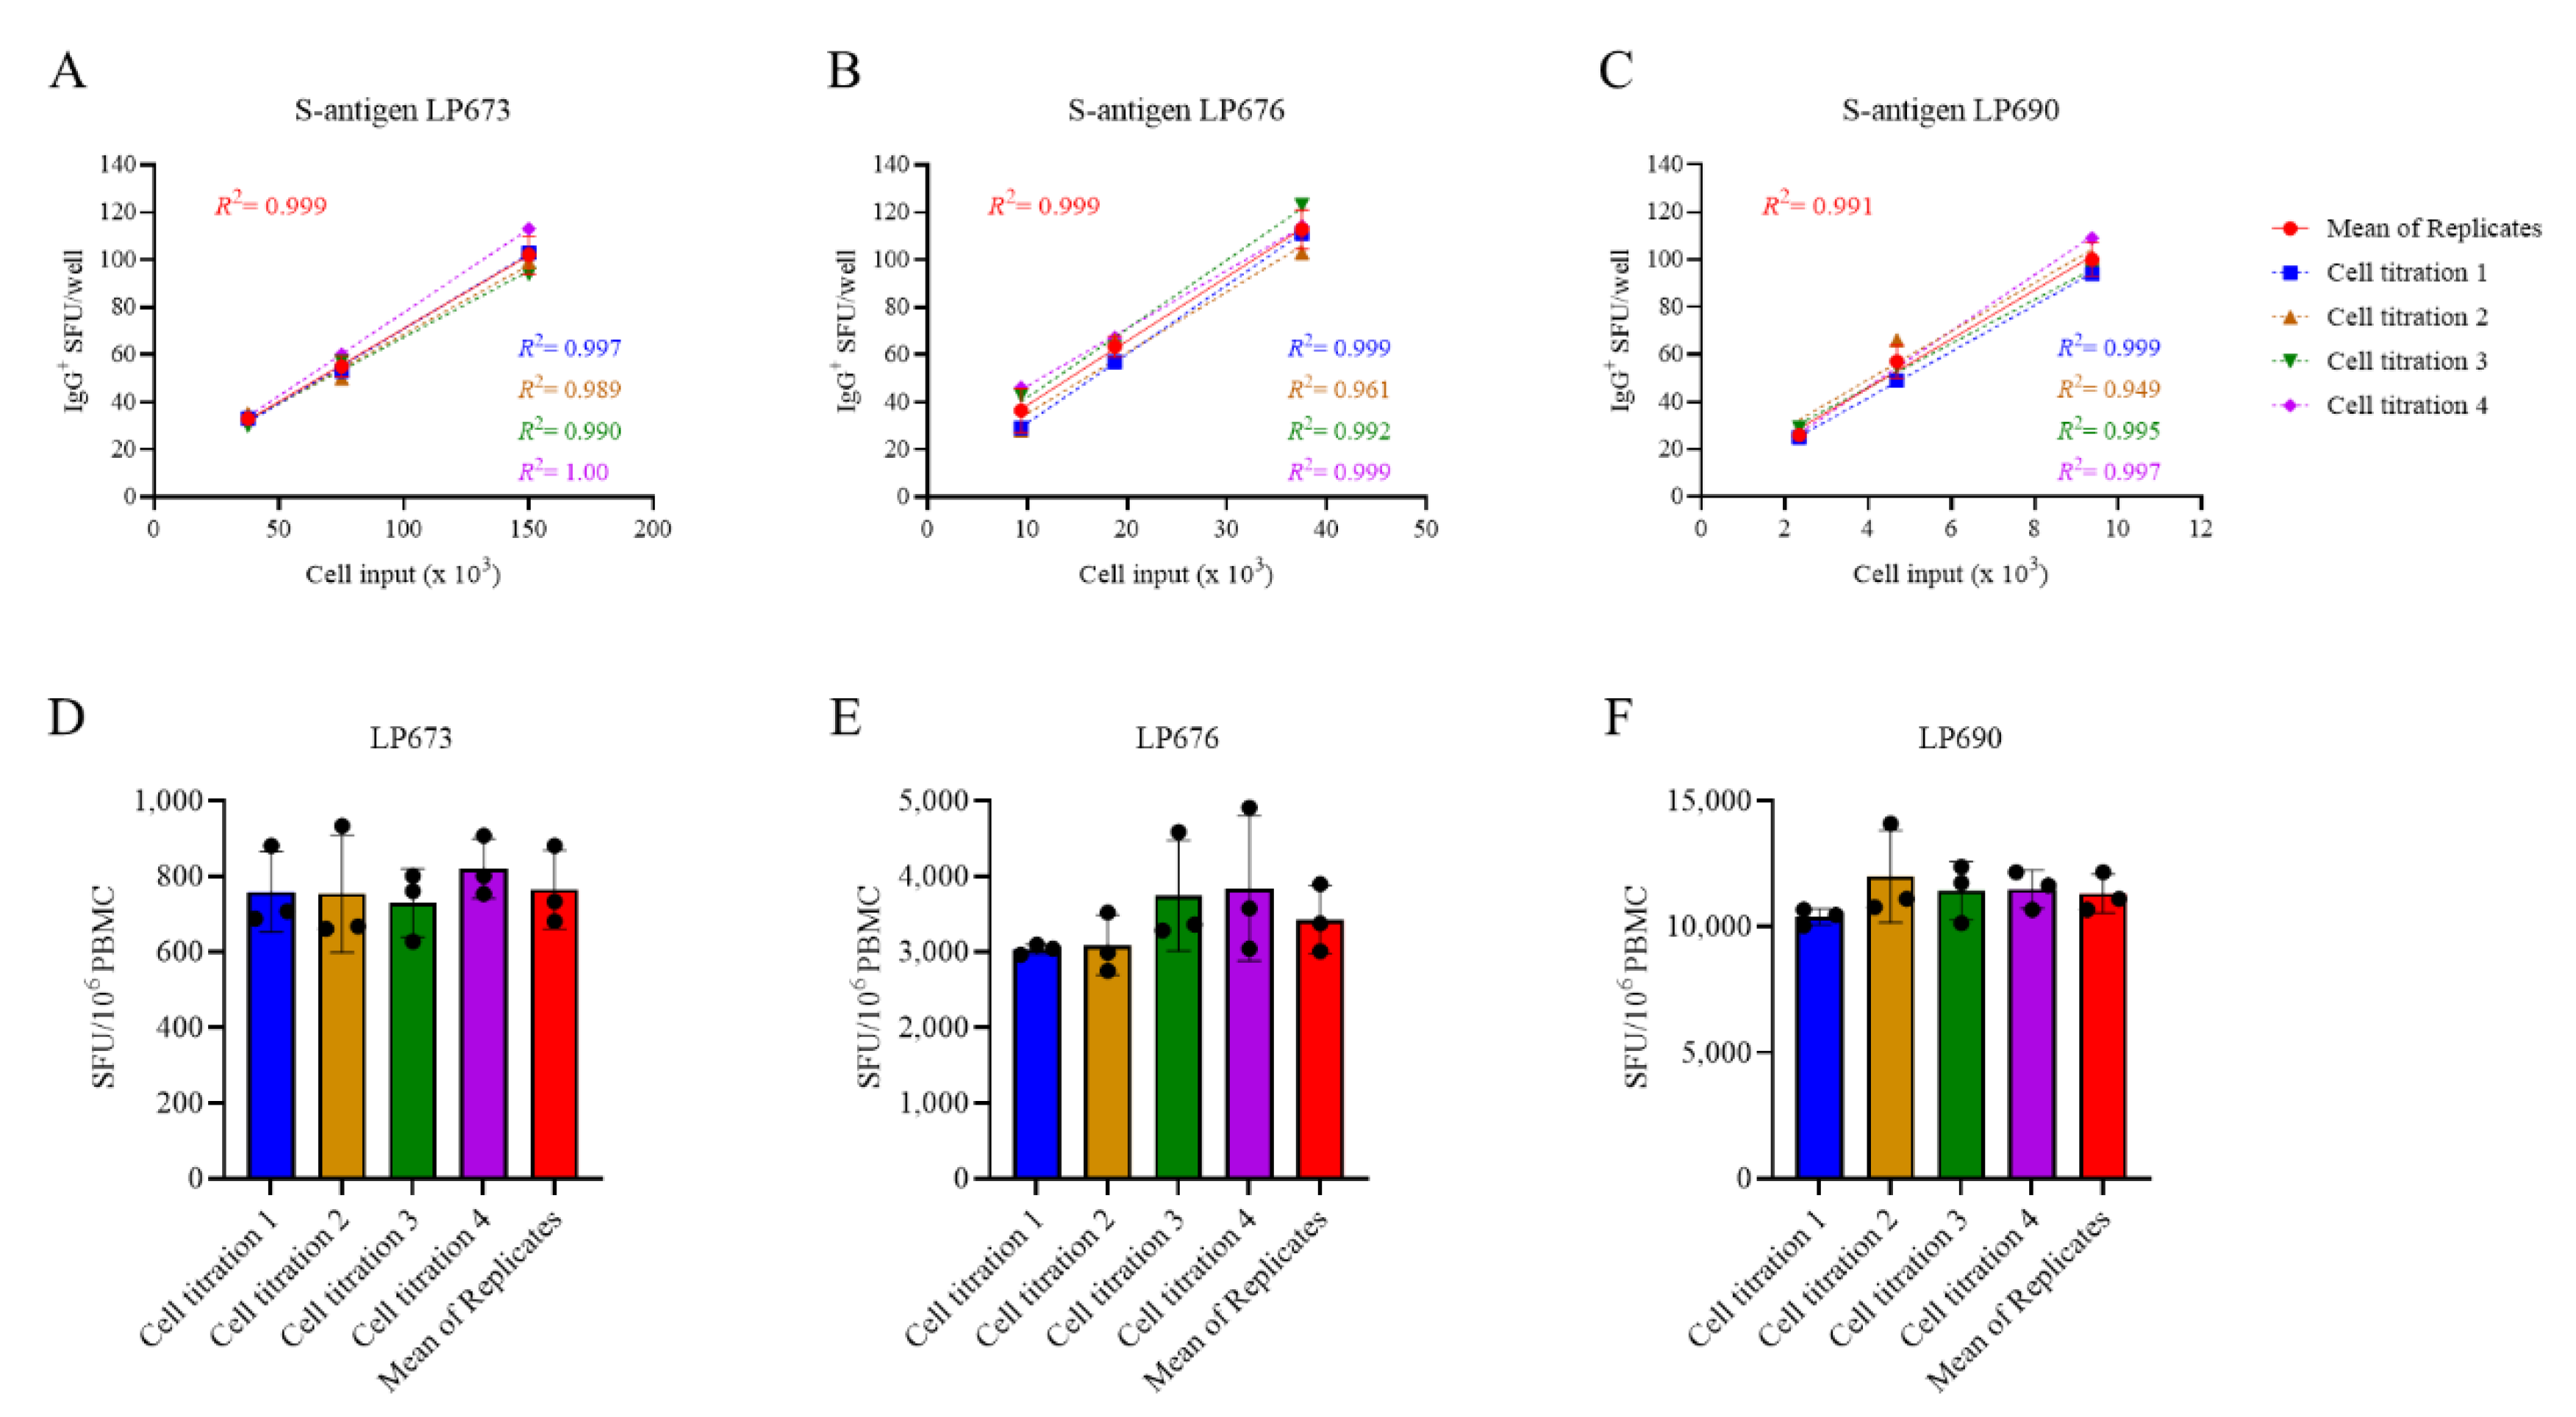
Figure 4.
Single-color ELISPOT and multi-color FluoroSpot assays have similar sensitivities for detecting S-antigen-specific Bmem-derived IgG+ ASC. A-C) PBMC from two convalescent donors with PCR-verified SARS-CoV-2 infection were polyclonally stimulated and S-antigen-specific Bmem-derived IgG+ ASC detected in single-color ELISPOT (SCE), single-color FluoroSpot (SCF) or four (quad)-color (QCF) FluoroSpot assays. A) Representative well images from S-antigen-specific ELISPOT or FluoroSpot assays. Cell input was ~6.25 x 10⁴ PBMC for both donors. B and C) S-antigen-specific IgG+ SFU counts occurring within the linear range for both ELISPOT and FluoroSpot assays are plotted for each donor. The mean ± SD of replicate wells, along with the regression line and R2 values, are denoted in the corresponding colors indicated in the figure insets. D and E) SFU counts occurring within the linear range of ELISPOT and/or FluoroSpot assays were used to calculate the frequency of S-antigen-specific or pan (total) IgG+ ASC and are expressed per 106 PBMC. Note, the cell incubation period for the depicted ELISPOT and FluoroSpot assays was shortened to 5 h to reduce background membrane staining.
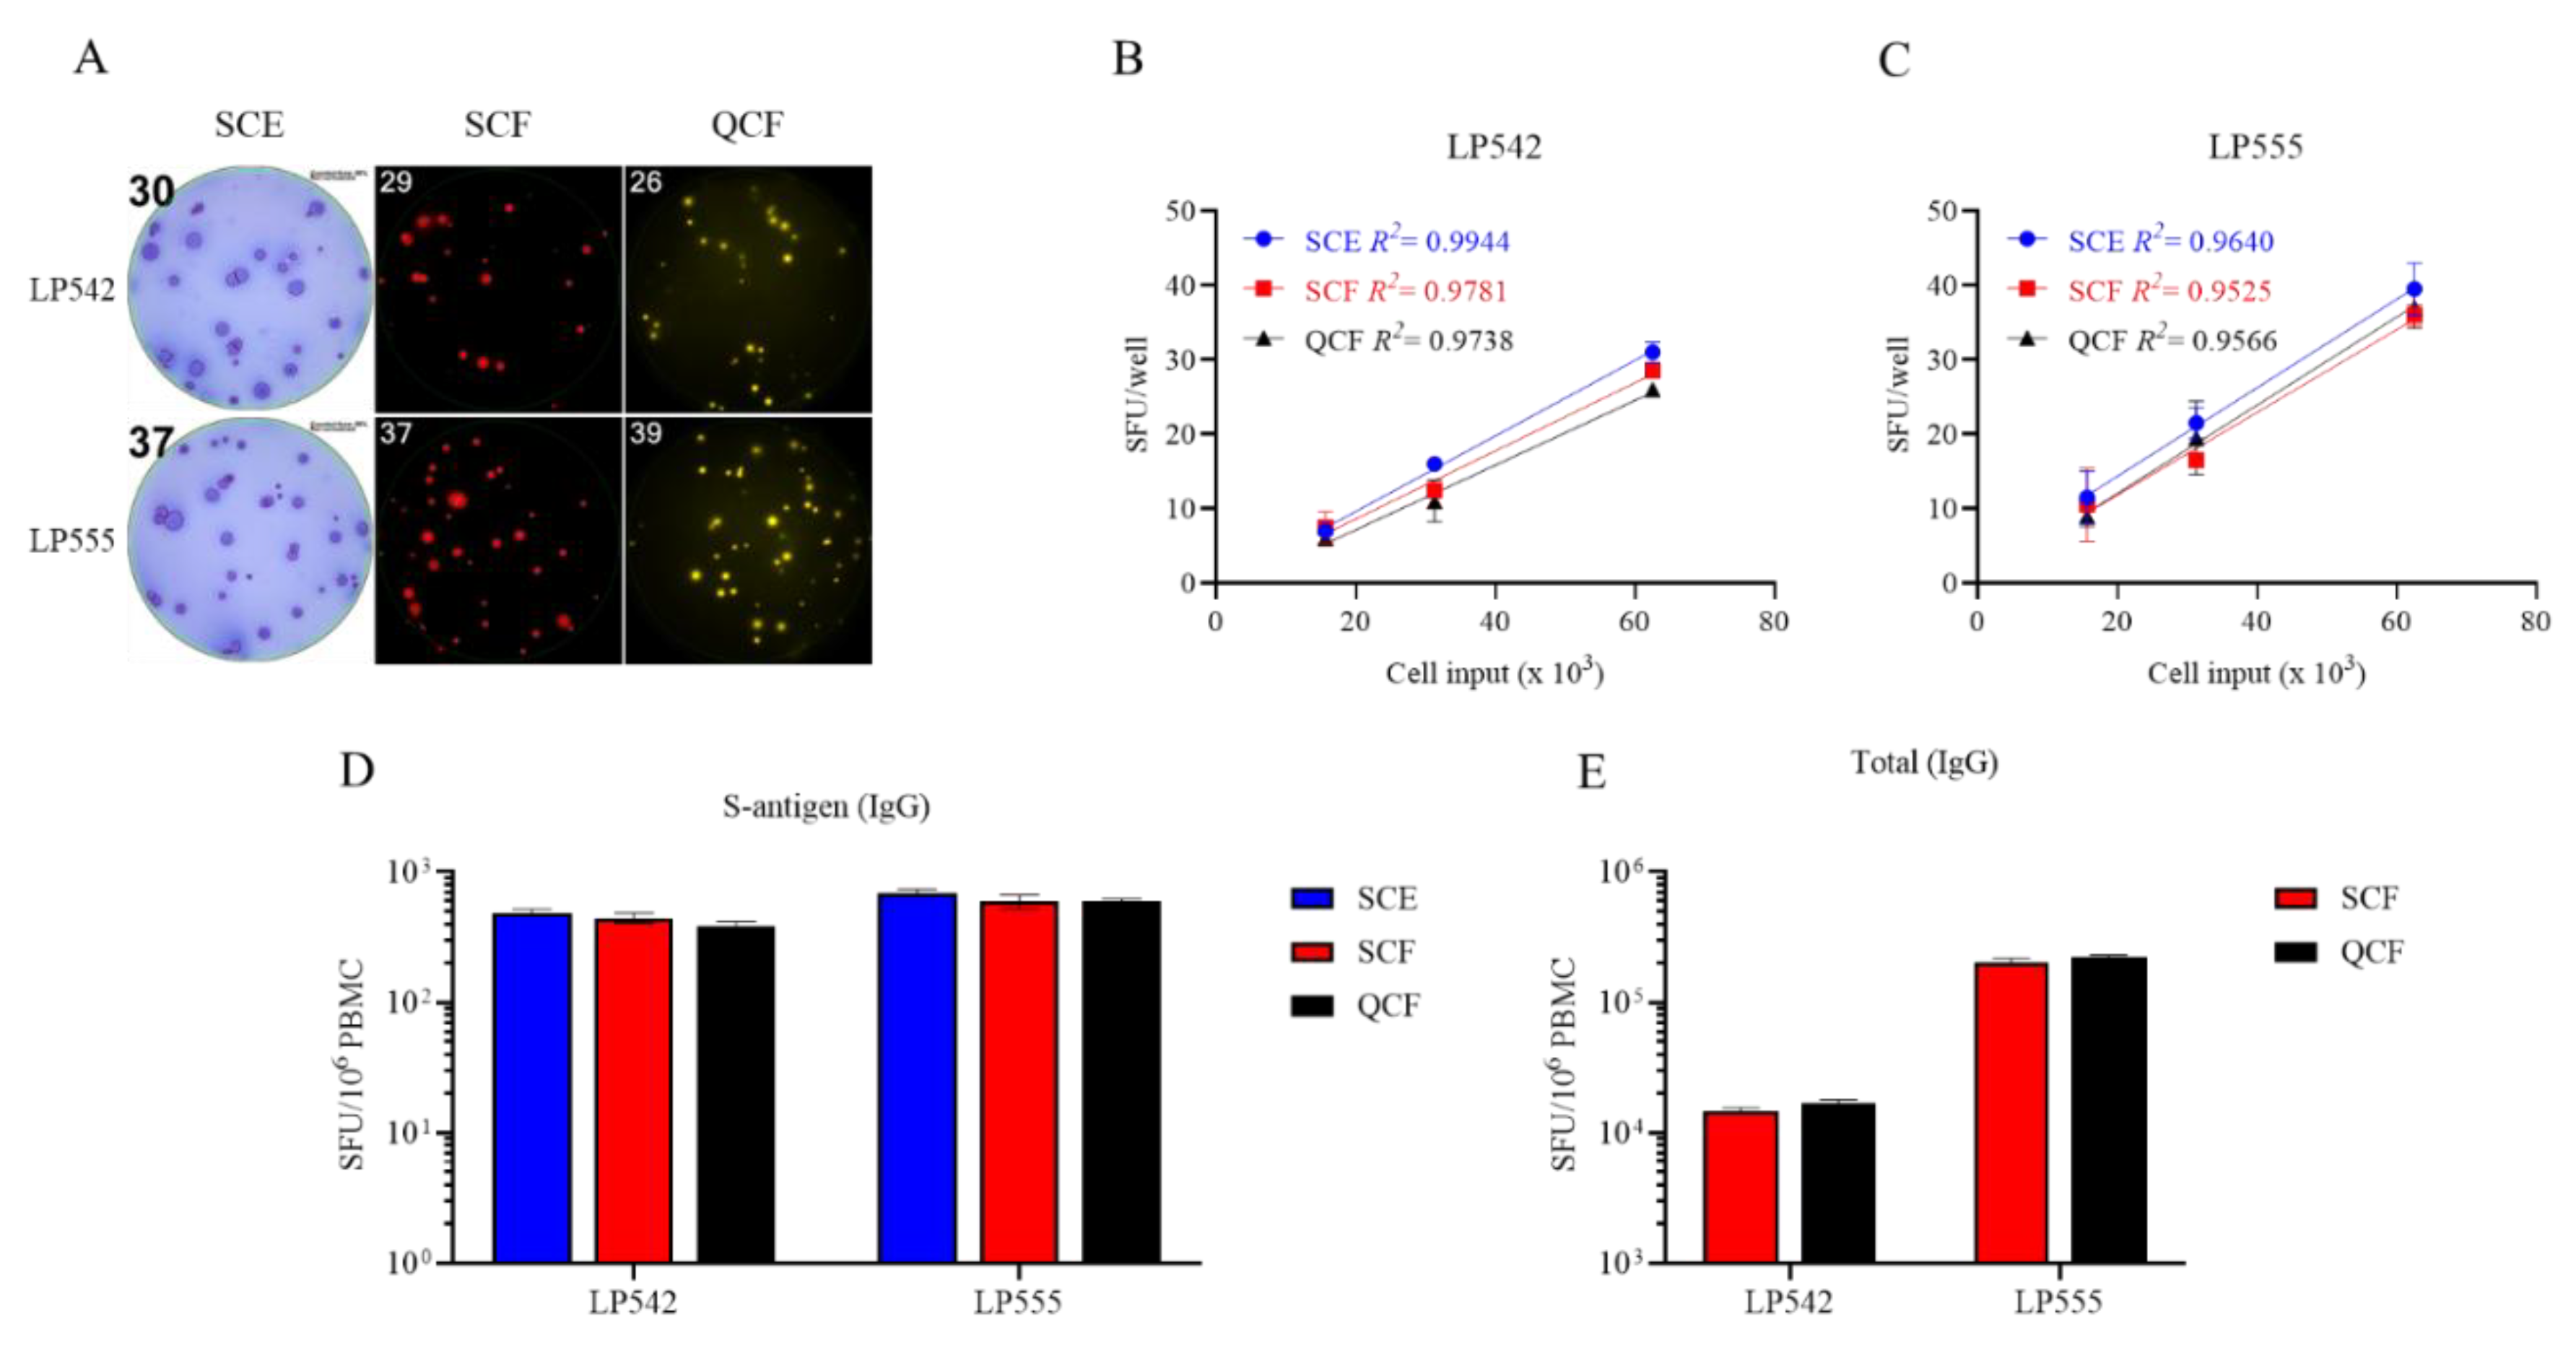

Table 1.
Frequency of S-antigen-specific IgG+ ASC in fresh or cryopreserved PBMC samples. PBMC from six healthy human subjects were either subjected to 5 days of in vitro polyclonal stimulation immediately upon receipt, without cryopreservation, or following cryopreservation in aliquots containing 10, 5 or 2 x 10⁶ PBMC per vial and then evaluated in B cell ImmunoSpot assays to quantify the number of S-antigen-specific and pan IgG+ ASC using a singlet two-fold serial dilution approach (refer to Materials and Methods). Data are expressed as the frequency of S-antigen-specific ASC amongst all IgG-secreting cells. The mean, standard deviation (SD) and coefficient of variation (CV) between S-antigen-specific IgG+ ASC frequencies in the donors’ PBMC samples cryopreserved at different cell densities are denoted.
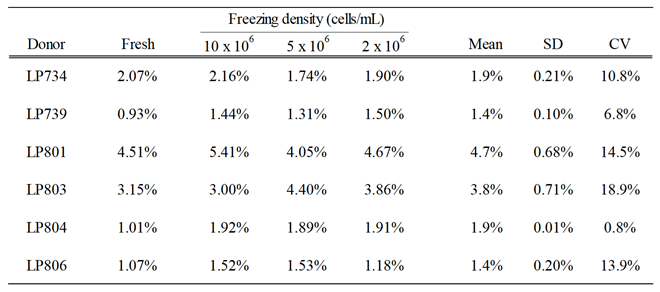 |
Table 2.
Viability and cell recovery of PBMC before and after polyclonal stimulation. Viability and cell recovery of freshly isolated or PBMC cryopreserved at different cell densities (refer to Materials and Methods and Table 1).
Table 2.
Viability and cell recovery of PBMC before and after polyclonal stimulation. Viability and cell recovery of freshly isolated or PBMC cryopreserved at different cell densities (refer to Materials and Methods and Table 1).
 |
Disclaimer/Publisher’s Note: The statements, opinions and data contained in all publications are solely those of the individual author(s) and contributor(s) and not of MDPI and/or the editor(s). MDPI and/or the editor(s) disclaim responsibility for any injury to people or property resulting from any ideas, methods, instructions or products referred to in the content. |
© 2025 by the authors. Licensee MDPI, Basel, Switzerland. This article is an open access article distributed under the terms and conditions of the Creative Commons Attribution (CC BY) license (http://creativecommons.org/licenses/by/4.0/).
Copyright: This open access article is published under a Creative Commons CC BY 4.0 license, which permit the free download, distribution, and reuse, provided that the author and preprint are cited in any reuse.


