
Submitted:
25 November 2024
Posted:
26 November 2024
You are already at the latest version
Abstract
Background/objectives: Cerebrospinal infusion studies indicate the cerebrospinal fluid outflow resistance (Rout) is elevated in normal pressure hydrocephalus (NPH). These studies assume the CSF formation rate (CSFfr) does not vary during the infusion. If the CSFfr were to increase during the infusion, then the Rout would be overestimated. Previous estimates of the CSFfr in NPH sug-gested a low figure. More recent estimates of the CSFfr suggest it is increased, indicating it probably varies with measurement technique. This would bring the estimation of Rout into doubt. A previous paper using a lumped parameter model suggested the CSFfr could vary with the capillary transmural pressure (TMP) in this disease, suggesting a possible solution to this problem. The current study investigates the possibility that the intracranial pressure manipulation occurring during an infusion study may vary the capillary TMP and CSFfr. Methods: A lumped parameter model previously developed to describe the hydrodynamics of NPH was modified to investigate the effect of CSF pressure manipulation during infusion studies, to describe how the CSFfr could vary depending on the technique used. Results: The model indicates the capillary transmural pressure is normal in NPH and increases during an infusion study. CSF drainage at the end of an infusion study similarly increases the capillary TMP, and presumably the CSFfr by increasing the interstitial fluid production. Conclusions: The model suggests that infusion studies and draining CSF increases the CSFfr in NPH compared to earlier techniques. Allowing for the increase in CSFfr suggests infusion overestimates the Rout by between 23-33%.
Keywords:
cerebral blood flow
; normal pressure hydrocephalus
; CSF formation rate
; blood brain barrier
; infusion study
; glymphatic
1. Introduction
The syndrome of normal pressure hydrocephalus (NPH) was first described by Adams et al. almost 60 years ago, in patients with a classical clinical triad of ataxia, incontinence and dementia [1]. These patients were found to have dilated ventricles but a normal cerebrospinal fluid (CSF) pressure [1]. The brain morphology of NPH suggested an abnormality of either CSF formation or absorption. The interaction between the intracranial pressure (ICP) and CSF hydrodynamics is modelled using Davson’s equation [2],
where ICP is the intracranial pressure, CSFfr is the CSF formation rate, Rout is the CSF outflow resistance and Psss is the pressure in the superior sagittal sinus. The equation is based around the suggestion that all of the CSF being formed is absorbed through the arachnoid granulations and into the venous sinuses. Classically Rout is envisaged to be the ease with which CSF can exit the cranial cavity and enter into the venous system [3]. The CSF system in NPH can be tested using an infusion study [4]. The infusion study consists of placing the patient in the lateral decubitus position. A single lumbar puncture needle is placed. The initial reference opening pressure is measured once the steady state is reached. Mock CSF is then infused at a uniform rate of 1-1.5 ml/min and the ICP measured once the ICP again reaches a steady state [4]. The Rout is calculated as the final pressure minus the initial pressure divided by the infusion rate [4]. The method assumes that the only volume change occurring during the test is due to the infusion [4]. It can be seen that Davson’s equation predicts a linear relationship between the ICP and the CSFfr, so the infusion of mock CSF should raise the ICP directly proportional to the Rout provided the CSFfr and Psss are constants and do not change during the test procedure. Initial studies using animal models indicated the CSFfr did not change following ICP manipulation in the short term, seemingly confirming the first assumption [5]. However, it should be acknowledged that these animals were normal and therefore had no deficiency of their blood brain barrier (BBB). To our knowledge, the Psss has never been confirmed to be constant in infusion studies and is just assumed to be so.
One of the first methods used to measure the CSFfr in humans was the Masserman technique [6]. Silverberg et al. used a modified Masserman technique where 3 ml of CSF was removed from a ventricular catheter and the time required to return the ICP to the pre-withdrawal level determined. The CSFfr was calculated as the volume removed divided by the time it took for the pressure to return to the pre-test level. Patients with Parkinson’s disease served as controls and were compared to patients with acute and chronic hydrocephalus. The mean CSFfr for the controls was 0.42 ml/min, the acute hydrocephalus patients were not significantly different at 0.4 ml/min and the chronic hydrocephalus patients were reduced at 0.25 ml/min or a 40% reduction compared to the controls [5]. These findings indicated to the authors that down regulation of the CSFfr probably occurred in NPH but this required some time to happen. The normal findings in acute hydrocephalus seemed to indicate the CSFfr was unaltered by an acutely elevated ICP in humans, similar to the animal models already discussed. More recently, Qvarlander et al. utilised a technique whereby the CSF pressure was reduced to zero following an infusion study. In those diagnosed with NPH, the CSFfr was 0.46 ml/min compared to 0.40 from historical controls (p=0.005) or a 15% increase [7]. Most recently Tariq et al., using a LiquoGuard7 device to maintain a zero ICP for 30 minutes, found the CSF formation rate in NPH to be 1.32 ml/min compared to the controls (provided by pituitary adenoma patients) being 0.48 mls/min or increased by 175% [8]. We can see the three techniques discussed returned similar results for their controls of 0.42, 0.4 and 0.48 mls/min, suggesting no apparent systematic errors existed between the techniques. The normal CSF pressure in middle age is 11.5 mmHg [9] and the normal pressure gradient from the CSF to the superior sinus lumen is 4 mmHg, [10] giving a normal sinus pressure by subtraction of 7.5 mmHg [11]. Therefore, placing these values into Davson’s equation indicates the normal Rout will be between 8.3-10 mmHg/ml/min by using the control CSFfr rates from these three studies. It has been suggested the upper limit of normal for Rout in man is 12 mmHg/ml/min [12]. The Dutch normal pressure hydrocephalus study found a good outcome from treatment in NPH was noted in individuals with an average Rout of 24 mmHg/ml/min [13] or twice the upper limit of normal. However, the divergent CSFfr findings in NPH of 0.25, 0.46 and 1.32 ml/min are most problematic regarding the calculation of Rout in NPH. Using an average ICP of 13 mmHg in NPH [5], an unchanged Psss of 7.5 mmHg and the three differing CFSfr values to estimate the Rout returns values of 22, 12 and 4.2 mmHg/ml/min. That is either high, normal or low.
A recent lumped parameter modelling study of NPH by the authors suggested that the CSFfr in NPH could be altered by a change in the ICP because the BBB was deficient in this disease (unlike the animal models and controls as discussed above) and the CSFfr would vary with the pressure gradient across the capillary wall or the transmural pressure (TMP) [14]. A potential solution to the variable CSFfr found by the three techniques would be changes in the capillary TMP, altering the CSFfr during each test. Note that an intact BBB both in the original animal studies comparing ICP and CSFfr and in the human controls from the three studies as discussed, would not allow for a change in CSFfr by any alteration in capillary TMP [14]. The possible variation in CSFfr in NPH could be tested by altering the original lumped parameter model to estimate the capillary TMP for each technique. Therefore, the purpose of this study is to extend the original lumped parameter modelling study, to incorporate the CSF formation rate and capillary transmural pressure. Thus, we wish to test the hypothesis that the capillary TMP will alter depending on the ICP manipulations carried out and can account for the varied CSFfr. Ultimately, this will allow us to suggest which figure is correct and indicate which test will over or underestimate the Rout.
2. Materials and Methods
A detailed description of the model can be obtained from the original paper [14]. A brief description is given to outline the methods used.
2.1. Equations
The study begins with Davson’s equation which relates the intracranial pressure to the CSF formation rate, the CSF outflow resistance and the venous sinus pressure [2],
where ICP is the intracranial pressure, CSFfr is the CSF formation rate, Rout is the CSF outflow resistance and Psss is the pressure in the superior sagittal sinus. Next Ohms law for hydraulic circuits is required:
where ΔP is the pressure drop across a vascular segment, Q is the flow rate through the segment and R is the resistance. As resistances in series are directly additive the following can be derived:
where Rart is the arterial segment resistance, Rcap is the resistance of the capillaries, Rven is the venous resistance, Rcuf is the resistance of the venous outflow cuff and Rtot is the total resistance for the entire vascular system. Poiseuille’s equation calculates the pressure drop across each of these segments:
where ΔP is the pressure drop, µ is the viscosity, L is the vessel length, Q is the fluid flow rate, π is the circle proportionality constant and r is the radius. Substituting equation (2) into (4) and eliminating Q from both sides gives an equation for the resistance in each segment:
In this modeling study the viscosity, the length of each vessel segment, and π are constants, so it can be shown that a change in resistance for any segment depends only on a change in the vessel radius i.e.
The volume of a vessel is given by the equation for a cylinder i.e.
where V is the volume, L is the vessel length and r is the radius of the vessel. Given L and π are constants for any given segment, the change in volume is dependent on the change in radius i.e.
Substituting equation (8) into equation (6) gives
The next equation relates the transmural pressure across a vessel to the vessel cross-sectional area [15]:
where Ptm is the transmural pressure across the vessel wall (lumen pressure- CSF pressure), E is the circumferential Young’s modulus of the vessel wall, h is the wall thickness, Ro is the radius in the stress free state, Ao is the area in the stress free state and A is the area following the applied transmural pressure. This equation was previously used to show that the volume of the venous outflow varies with the transmural pressure by the equation [14]:
where ΔTMPven is the normalized increase in venous transmural pressure compared to normal and ΔVven is the change in venous volume.
2.2. Model Input Parameters
The input parameters are unchanged from the previous study [14] and will only be briefly described as the details can be obtained from the original study. This study is based on a middle-aged individual with a brain size of 1500g. A normal global CBF is 50 ml/100g/min [16], giving a normal cerebral blood arterial inflow of 750 ml/min. The normal mean arterial inflow pressure is 100 mmHg [17]. The normal precapillary bed pressure is 32 mmHg [18]. The end capillary pressure is estimated to be 15 mmHg [19]. The normal CSF pressure in middle age is 11.5 mmHg [9] and the normal pressure gradient from the CSF to the superior sinus lumen is 4 mmHg, [10] giving a normal sinus pressure by subtraction of 7.5 mmHg [11]. The normal transmural pressure of the subarachnoid cortical veins in primates is 2.5 mmHg [20]. Using this figure for the model, it can be seen that the pre-venous outflow cuff pressure is 14 mmHg by addition of the TMP to the ICP.
In a 1500g brain, the total CBV would be 51 ml [14]. Hua et al. found the arterial component of the CBV to be 25% [21] or 12.8 ml in total. This leaves the remaining 75% for the capacitance vessels, including the veins and capillaries or 38.2 ml. The estimated percentage of this latter figure for the capillaries is 53% [22], giving a total capillary blood volume of 20.3 ml and a total venous blood volume of 17.9 ml.
The normal CSF outflow resistance (Rout) has been found to depend linearly with age, with the regression line being: [23].
This gives a normal Rout for a 40-year-old of 13 mmHg/ml/min. The normal CSF formation rate is 0.40 ml/min [24].
2.3. Vessel Responses to Transmural Pressure Variations
It is assumed that variations in the arterial resistance and volume in this model depend entirely on the arterial autoregulation and muscle tone and not the vessel transmural pressure. As the arterial pressure is always much higher than the ICP, the arterial transmural pressure will have no effect on the outcome of the current modelling study.
In the capillary bed, the vessels do not actively alter their diameter [25], indicating they react purely to their transmural pressure. In a rat model, extreme hyperventilation decreased the PCO2 from 40 to 21.6 mmHg without affecting PO2, the capillary size was not significantly different to controls despite the expected arteriolar constriction [26]. However, in the opposite case, in rats made extremely hypercapnic secondary to hypoventilation, the PCO2 increased to 95.6 mmHg but PO2 was normal, with the capillary diameter increasing by 20%, consistent with a 44% increase in volume compared to known control values [26]. Thus, a moderate reduction in capillary TMP does not change the capillary size but a maximal increase in TMP increases their volume by 44%. To simplify the current study, it is assumed the volume of the capillaries vary between normal and maximally dilated as a linear function of their transmural pressure. A previous study indicated an increase in capillary TMP from 12 to 37.9 mmHg would increase the capillary volume by 44% or a 1.7% increase in volume for each 1 mmHg pressure rise. Below a TMP of 12 mmHg, the volume is unchanged at 20.3 ml and above a TMP of 37.9, the elastic limit is reached and the volume is set to 29.2 ml.
Similar to the capillaries, the veins alter their size purely depending on their transmural pressures. In a previous modelling study [14], the function for the outflow vein dilatation was found to be summarized by equation (11).
At the distal end of the cortical veins, as they join the sinus wall, the outflow cuff segment resides. The collapse of this segment occurs physiologically and is passively modulated by the transmural pressure between the ICP and the sinus pressure, which is usually negative [27]. The segment is very short, and as it is mostly under a state of collapse with physiological ICPs, the change in volume from this segment will be ignored in this model. This is despite acknowledging that the cuff is dilated in the drainage model. However, its resistance will be taken into consideration. In the previous study, four differing cuff transmural pressures resulted in 4 differing resistances [14]. When these points were plotted, a straight line with R2 of 0.998 resulted, suggesting the cuff resistance varies as a linear function of the cuff TMP. Thus, giving equation 13:
where Rcuf is the cuff resistance and TMPcuf is the cuff transmural pressure.
The sagittal sinus pressure will be kept constant in this study.
3. Results
3.1. Varying Blood Flow in NPH
The original study findings in NPH suggested the brain elected to be ischemic, most likely to limit the capillary TMP and CSFfr [14]. We undertook an initial modelling study to see how an instantaneous change in CBF would alter the capillary TMP to further study this effect. These initial modelling findings are summarized in Figure 1. The five vascular segments modelled are shown in Fig 1A, with the arterial segment shown in red, the capillaries in orange, the veins in yellow, the outflow cuff in green and the sinus in blue. The pressures obtained from the literature have been appended to the beginning and end of each vascular segment within the vessels in Fig 1A. Given the arterial inflow volume passes through each segment sequentially, the resistance of each segment can be calculated using equation (2). These resistances are appended below the vessels in fig 1. The normal cerebral blood volume (CBV) values for each segment and the total CBV has been obtained from the literature and is shown below the resistances. The blue numbers represent the transmural pressure gradients between the pressure at the beginning and end of each capacitance vessel segment and the ICP, and are obtained by subtraction. The red figure is the average capillary TMP obtained by averaging the TMP before and after the capillaries. Figure 1B-D represent the effects of the differing alterations in CBF by varying the inflow resistance. In these figures, the red segments represent the areas of increased resistance compared to the normal findings and the green represent reduced resistance.
In figure 1B, the baseline findings in NPH as found in the original study have been reproduced from the previous study [14]. The arterial inflow was reduced from normal by 20% as per the literature. The literature also required the average cerebral blood volume to be unchanged from normal and the only available result to achieve this was a doubling in the venous cuff resistance and a 25% increase in the artery resistance because these resistances altered the segment volumes to exactly match each other and therefore cancel out. Further information is available in the original study [14].
Figure 1C models an instantaneous return in CBF to the normal value of 750 ml/min. This required a reduction in the inflow resistance. The resistance across the outflow cuff is unaltered because it only depends on the pressure gradient across its wall, which is unaltered at -5.5 mmHg. The effect of the increase blood flow is to increase the pressure in the veins upstream from the outflow cuff and therefore the veins dilate compared to the baseline using equation (11). The vein dilatation reduces the vein resistance using equation (9). The combination of the increased venous pressure together with the reduced arterial resistance increased the pressure on either side of the capillaries and therefore the average capillary TMP increased by 28% compared to the NPH baseline. The capillary resistance and volume were adjusted to suit. Note, this is an instantaneous finding as the model is not expected to be at steady state. The increase capillary TMP would be expected to increase the CSFfr and lead to an increased ICP, which would further compress the outflow cuff increasing its resistance i.e., a positive feedback loop. A stable system would require a new ICP to be found, which could possibly only occur once all of the arterial dilatation was exhausted.
Figure 1D models the effect of instantaneously reducing the CBF by 40% below normal to 450 ml/min by increasing the inflow resistance by 45%. Again, the outflow cuff resistance is unchanged because the pressure across its wall is unchanged. The pressure across the outflow cuff drops because the blood flow is less. The vein TMP drops and the vein reduces in volume back toward the normal value. The increased arterial resistance increases the pressure drop across this segment and the pressure on either side of the capillaries reduces the average capillary TMP by 34%. Note that at steady, state the ICP would also be affected by this change as the reduced capillary TMP would be expected to reduce the CSFfr and therefore the ICP further dilating the outflow cuff and further reducing the ICP. The effect of a profound reduction in CBF was modeled but has not been depicted in figure 1. A 57% reduction in CBF reduced the venous TMP to 0.1 mmHg (the lowest level before a significant vein collapse would occur), the capillary TMP reduced to 4.4 mmHg and the vein volume was reduced by 12.8% below the normal value.
3.2. Varying the ICP in NPH
The effect of varying the ICP in NPH had been modeled in figure 2. Again, Fig 2A is the baseline NPH findings from the original study [14]. Figure 2B models an infusion study. Momjian et al. studied 12 patients with NPH; the baseline ICP was 11.1 mmHg and the ICP increased by 17.3 mmHg to 28.4 mmHg during the study [28]. During the infusion, the arterial blood pressure increased by 8 mmHg. The baseline CBF was 14% below the controls and the CBF reduced by a further 10% following infusion. The Psss was not measured. The calculated Rout was 17.6 mmHg/ml/min [28]. Using Davson’s equation, we can calculate the average infusion rate to be approximately 1 ml/min. Thus, to match these findings in the model, the arterial inflow pressure was increased by 8 mmHg, the ICP by 17 mmHg and the arterial inflow reduced to 525 ml/min. The effect of these changes was to significantly increase the outflow cuff resistance because the pressure gradient across its wall increased by 4 times compared to the baseline. This significantly increased the vein pressure and dilated the veins further. The arterial inflow resistance needed to be minimally reduced (-3.9%) to maintain the flow at the pre-set level, but this wasn’t considered to be a significant change. The overall effect was an increase in capillary TMP of 26% above baseline.
Figure 2C is the effect of reducing the ICP to zero by drainage. In a review of the change in CBF following tap tests, Owler and Pickard suggested there was an equal likelihood of a decrease in CBF as well as an increase [29]. However, in a study comparing 13 patients with probable NPH who had at least one positive tap test or infusion study result vs 10 patients who did not, the deep white mater CBF increased by 46% following the tap test in the positive patients, whilst the negative patients reduced their CBF by 21% [30]. Most tap tests will not reduce the pressure to zero so perhaps underestimating the improvement in CBF. A reduction in ICP to zero has a significant effect on the outflow cuff resistance, which will effectively drop it to zero due to maximal dilatation. In order for no change in global CBF to occur, the arterial resistance would need to significantly increase by approximately 15% to balance the reduced outflow resistance. This seems unlikely in NPH but possible in the negative tap test patients (probably Alzheimer’s disease) where the CBF was reduced. It was decided not to alter the arterial resistance from baseline and see how the blood flow responded. The effect was for the blood flow to increase by 14.5% above baseline, which seemed reasonable. Although the pressures before and after the capillaries dropped, they did not drop by as much as the ICP. Therefore, the capillary TMP was elevated and was not significantly different to the infusion model with an increase of 24% above baseline.
A third model was performed to gauge the middle ground between normal and the infusion study ICP. The ICP was set to 21.5 mmHg, the arterial pressure was increased to 104 mmHg and the blood flow set to 563 mls/min. The results are not depicted in figure 2 but the capillary TMP was 13 mmHg.
4. Discussion
4.1. Variation in Rout in NPH
As discussed in the introduction, there seems to be some variability in either the CSF outflow resistance (Rout), or the CSF formation rate (CSFfr) in NPH, depending on the technique used to measure them. This conjecture could be suggested to be theoretical and one could dismiss both of the studies by Silverberg [5] and Tariq [8] as outliers to resolve this dilemma. However, this is not the only time that this problem has arisen. Sundstrom et al. measured the Rout in a cohort of 20 patients with NPH using three differing methods on each patient in turn;, constant pressure infusion, constant flow infusion and bolus infusion [31]. They also used each method on an experimental model with known outflow characteristics. In the experimental model there was no significant difference between methods overall. In the NPH patients the constant pressure infusion gave a mean Rout of 16.0 mmHg/ml/min (i.e., high), the constant flow averaged 13.0 mmHg/ml/min (just above normal) and the bolus method 9.8 mmHg/ml/min (normal). The rise in ICP in the constant pressure method was always greater than 18 mmHg, the constant flow method increased the ICP by approximately 18 mmHg and the bolus method was said to be much less. The bolus method required only 4 ml of fluid to be injected and the estimate was taken from the midpoint of the relaxation curve [31]. In the case of patients with idiopathic intracranial hypertension, in those with the most incompliant cranial systems, removal of 3ml of fluid would decrease the ICP by 2.6 mmHg and removing 4 ml would reduce it by 3.5 mmHg [32]. The cranial system becomes more incompliant as the ICP is increased but even if the ICP were to increase by 5 mmHg overall during the bolus method, the measurement would still be taken at about 2.5 mmHg above normal, being much lower than the other two studies. Thus, altering the ICP may be affecting the measurement of the Rout.
4.2. Variation in CSFfr with Capillary TMP
In our previous study we suggested that the CSFfr could vary with the capillary TMP if the blood brain barrier (BBB) was open [14]. It is generally thought that the CSFfr does not change with the ICP and remains a constant [33]. CSF is produced from differing regions within the brain, with seventy percent of CSF production coming from the choroid plexus, 18% from the capillaries and 12% from glucose metabolism [34]. The only possible instantaneously variable component of the CSF production could come from the capillaries but this is excluded if the BBB is intact. A long-term reduction in the flow rate would require down regulation of the choroid plexus production. Net capillary CSF production or absorption is expected to follow the Starling forces relationship. This is modelled using the following equation:
where Jcap is the capillary fluid flow rate, Lcap is the capillary hydraulic conductivity, Pcap-Pcsf is the hydraulic pressure gradient across the capillary wall (i.e. the capillary TMP), σcap is the osmotic reflection coefficient and πcap-πcsf is the osmotic pressure gradient across the capillary wall taking into account both the colloid (salt) osmotic and protein oncotic pressures [35]. Note, that at steady state, there is no significant difference in hydrostatic pressure between the CSF and the brain parenchyma within the limits of the accuracy of the equipment used to make these measurements [36,37]. With an intact BBB, the cerebral capillaries have hydraulic conductivities 2-3 orders of magnitude less than systemic capillaries [38] and the osmotic reflection coefficient is 1 [35]. In the brain, the colloid (salt) osmotic pressure of the plasma and interstitial spaces are identical at 5100 mmHg [35]. The protein oncotic pressure within the plasma is 25 mmHg and is normally negligible in the interstitial space due to low protein levels [35].This indicates that the total resultant pressure between capillary and CSF would be -13 mmHg and therefore tend to absorb free water back into the capillaries if the hydraulic conductivity were not as low as it is. As a secondary effect, any increase in net capillary water flow occurring secondary to an increase in capillary TMP would rapidly increase the osmotic pressure difference between the plasma and the interstitium, because the salt and proteins do not follow the water due to the high osmotic reflection coefficient. Thus, the capillary plasma would increase in osmotic pressure and the interstitium would decrease in pressure, further opposing the hydrostatic pressure difference [35]. However, this feedback control of water flow into the brain fails as the BBB breaks down and the net result is an increase in brain water and ICP [35]. This is because the hydraulic conductivity would increase and the osmotic reflection coefficient for salt would go to zero. For protein, the osmotic reflection coefficient can approach that for peripheral tissues at 0.93, meaning up to 7% of the protein may be filtered from the capillaries [35]. In NPH there is evidence of a significant disruption of the BBB with protein leakage. In human hydrocephalus, the capillary wall shows blood brain barrier dysfunction, with increased vesicular and vacuolar transport, open inter-endothelial junctions, thin and fragmented basement membranes, and discontinuous perivascular astrocytic end-feet [39]. Eide and Hansson found in pathological specimens of the cortex taken from NPH patients, that there was preferential extravasation of fibrinogen in the cortex from capillaries with damaged and open BBB’s [40]. The effect of protein leakage into the interstitium is to lessen the effect of the oncotic pressure difference between the plasma and interstitial space. Thus, at some point, raising the capillary TMP will promote an increase in the CSFfr and a further increase in capillary TMP would produce a further increase in the CSFfr. Similarly, decreasing the capillary TMP may promote CSF reabsorption with an open BBB.
In a previous paper, we suggested that reducing the average capillary TMP in NPH by allowing a 20% overall decrease in cerebral blood flow (CBF) may be a harm minimisation strategy, in that the TMP and CSFfr would be reduced [14]. Figure 1 explores this suggestion further. The baseline capillary TMP in hydrocephalus is not significantly different to normal at 12.2 mmHg (fig 1A-B). Increasing the CBF back to normal (fig 1C) increased the capillary TMP to 15.6 mmHg and significantly increased ICP via a positive feedback loop. Decreasing the CBF further to 40% below normal decreased the capillary TMP to 8 mmHg and significantly reduced the CSFfr and therefore ICP. The average reduction in CBF of 20% thus seems to be a compromise between the resultant ICP and maintaining overall brain health by minimising the ischemic damage.
4.3. Differences Between Cortex and Periventricular White Matter in NPH
As discussed, the literature suggests an overall reduction in CBF of 20% at baseline in NPH. However, this reduction is not evenly spread across the entire brain. In a study of naturally occurring hydrocephalus in Cavalier King Charles spaniels, there was a 58% reduction in periventricular white matter CBF with no significant difference in the cortex [41]. In humans, the white matter CBF reduction is not as dramatic. One study indicated the maximal reduction in CBF occurred just below the ependymal at -67% and returned to normal in the superficial white matter in a logarithmic fashion [28], giving an average reduction of approximately 40%. No variation in CBF was seen across the white matter in the controls [28]. If the global average CBF reduction is 20% but the white matter reduction averages 40%, then we can calculate the average grey matter CBF. Given the grey matter makes up 65% of the brain and the white matter 35% [42] and the average CBF ratio is 1.7:1 [43] respectively. Therefore, we can show that the CBF reduction for the cortex must be approximately 13.7%. This suggestion is corroborated by SPECT perfusion imaging in NPH patients, which shows an apparent hyper-perfusion of the high convexity cortex, however, this was later found to represent an increase in grey matter density from compression rather than an increased CBF [44]. The actual CBF in the cortex was reduced between 7.8- 25.7% compared to controls [44]. Our estimate is at the centre of this range. The effect of this will be discussed with the help of figure 3. Figure 3A is the graphical representation of how the reduction in CBF from the three NPH studies in fig 1 (together with the non-depicted profound ischemia study) will alter the capillary TMP. As can be seen, the average CBF reduction of 13.7 in the cortex leads to a capillary TMP of 13.1 mmHg, which is 9% above normal and would tend to promote an increase in the production of interstitial fluid. The average reduction in CBF of -40% in the white matter would lead to a capillary TMP of 8 mmHg or a 33% reduction and may promote a net absorption of interstitial fluid and CSF. The increased inflow of fluid at the cortex would be balanced by the outflow at the white matter, so the system would be in steady state. An increase in interstitial fluid from the cortex is suggested in the literature. Measurement of the CSF flow within the aqueduct in NPH patients indicates a 3-4 times larger CSF volumetric flow rate passing into the ventricles from the subarachnoid space as compared to controls where the flow is in the opposite direction (out of the ventricles) [45]. With regards to the white matter, the large amount of fluid entering the ventricles from the subarachnoid space would increase the amount of parenchymal free water. An MRI study of patients with NPH had a higher free water fraction in their periventricular hyperintensities compared to control patients, despite the controls having similar small vessel hyperintensities [46]. One may ask, does the free water transit the brain to leave by the cortex? In a rat hydrocephalus model, injected extracellular tracer movement in the cortex was inhibited and the fluid preferentially accumulated in the deep white matter. In control animals the tracer left the cortex without accumulating in the white matter. The authors concluded that white matter accumulation of tracer reflected bulk fluid flow to this site from the cortex [47]. Obviously if the water is travelling both 1) from the cortex to the white matter and 2) from the subarachnoid space to the white matter, then the white matter must be absorbing water into its capillaries as it would have nowhere else to go.
The previously described rat study brings up an interesting finding. Most of a tracer injected into the cortex would be expected to travel into the subarachnoid space over the vertex via the perivenous channels as part of the glymphatic system [48]. The rat study discussed above indicates the glymphatic system within the cortex is deficient but is probably relatively preserved in the white matter. In humans using intrathecal gadolinium as a tracer, NPH was found to be associated with ventricular reflux of the tracer and an overall reduced clearance rate of the tracer. The reduced clearance rate indicated to the authors glymphatic dysfunction [49]. Previously, we have suggested that venous dilatation within the venous perivascular space will increase the glymphatic outflow resistance and therefore reduce glymphatic flow [50,51,52]. Figure 3B is a plot of the change in venous volume vs the change in CBF for the 4 models studied as per fig 3A. In NPH, the cortex would have an increase in venous volume of 15.6% and the average white matter vein volume would be reduced by 3.3%, compared to normal suggesting reduced glymphatic flow superficially and preserved flow deeper. Inserting a shunt tube has been previously shown to reduce the vein volume by 12.8% globally [14] and therefore would be expected to improve glymphatic flow.
4.4. Which Test for ROUT in NPH is Most Accurate?
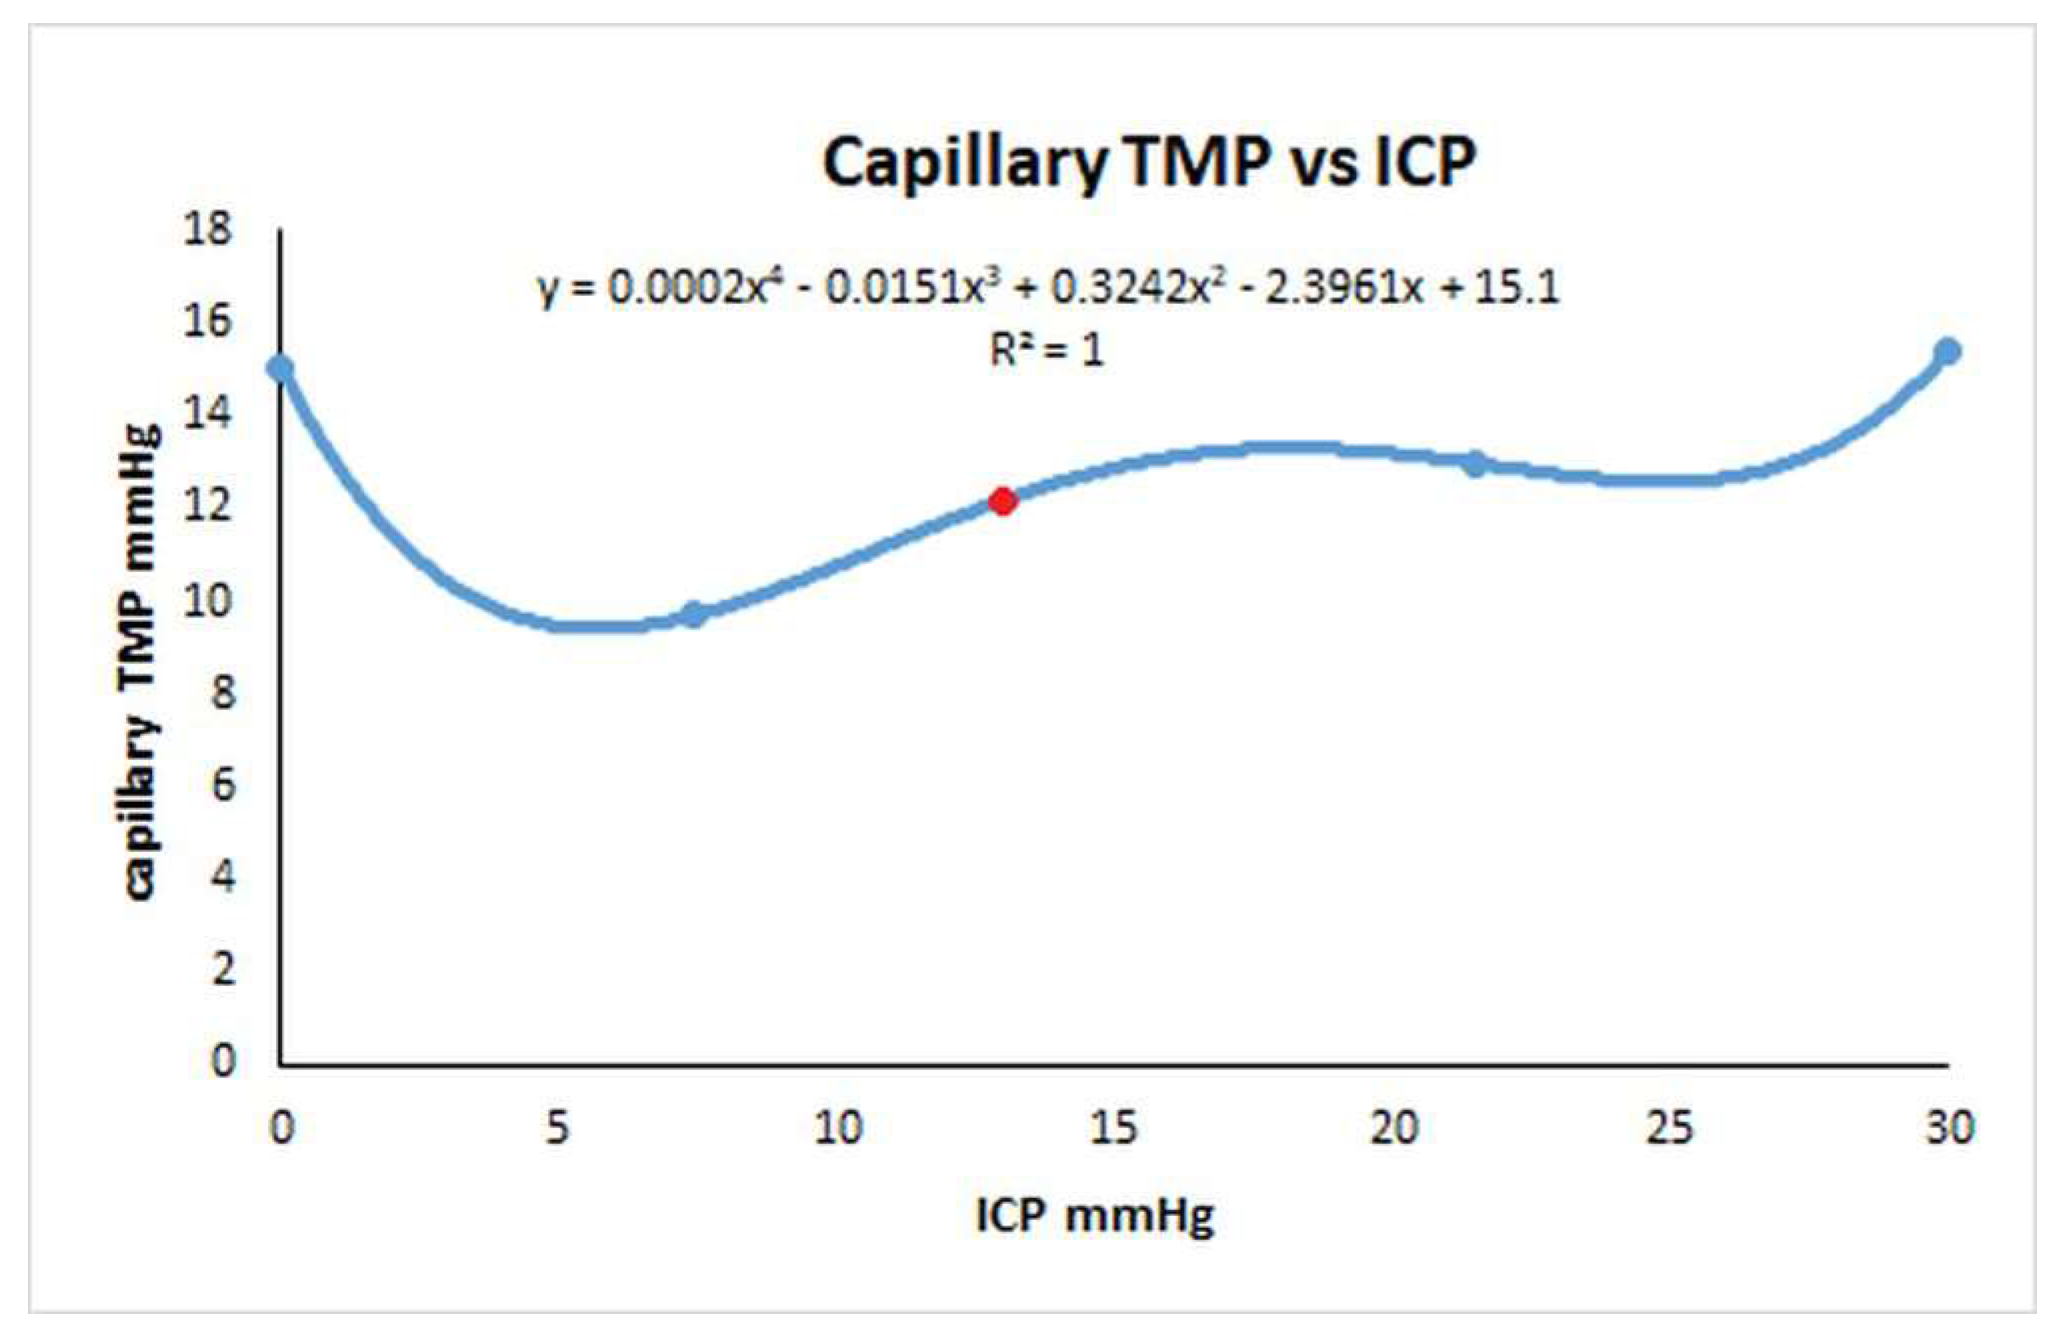
We started this study to try to find which test for Rout would be the most accurate and if infusion studies would overestimate it. As discussed in the introduction, infusion studies are hypothesised to measure the outflow resistance across the arachnoid granulations but what does this mean if the majority of the CSF absorption switches from the arachnoid granulations and the deficient glymphatic system to the capillary bed? Is an infusion study attempting to measure the capillary CSF outflow resistance instead? If so, then Davson’s equation in this disease is not valid. Bonney suggested, in chronic states of hydrocephalus, any imbalance between CSF production and absorption is transient with a new equilibrium being reached by either increased CSF absorption through means other than the arachnoid granulations or decreased CSF production [53]. It may be that both an increased absorption through the white matter and a reduction in CSFfr by down regulating the choroid plexus CSF production may occur. Ideally the Rout would be measured without varying the ICP at all but this is not possible. The response of the capillary TMP to the ICP in NPH is a complex function and has been depicted in Figure 4. In this figure the capillary TMP vs the ICP has been plotted from the baseline NPH study, the infusion and drainage studies together with an infusion study model where the ICP was midway between the baseline NPH and infusion models. An additional point is provided by the post-shunt model from the previous NPH study [14] which gives the point close to the nadir of the graph. The red dot represents the baseline model. Note, complete drainage to zero ICP and the full infusion study both increase the capillary TMP and probably the CSFfr almost identically. Qvarlander et al suggest the CSFfr for drainage (zero ICP) was 0.46 ml/min [7] and the CSFfr for their infusion study (ICP of 30 mmHg) is therefore also likely to be the same. The study estimating the CSFfr by Silverberg et al. only removed 3 ml of fluid [5] and we have previously suggested that the study by Griffith [32] indicates this would only reduce the ICP by perhaps 3 mmHg, but the average for the test would only be 1.5 mmHg because the CSF pressure is allowed to rise back to normal during measurement. Silverberg et al. suggested a CSFfr of 0.25 ml/min and this is likely more accurate than that of Qvarlander et al. If during the infusion study by Momjian et al. the CSffr increased from 0.25 to 0.46 ml/min, then the increase (0.21 ml/min) would need to be added to the infusion rate of 1 ml/min. When we do this, the Rout is reduced from 17.6 to 14.3 mmHg/ml/min, indicating it may be overestimated by 23%. In the study by Sundstrom et al. where NPH patients underwent three differing methods to measure Rout [31], the bolus method (as previously discussed) would be expected to only increase the ICP by a small amount and therefore be the most accurate test. The Rout for the infusion study averaged 13 mmHg/ml/min and the bolus method 9.8 mmHg/ml/min suggesting the infusion method overestimated the Rout by 33%.
Finally, we would need to explain the findings by Tariq et al. i.e. that the CSFfr is greatly increased at 1.32 ml/min [8] by using a technique almost exactly the same as Qvarlander et al., who found the same metric to be 0.46 ml/min [7]. The difference is that Qvarlander et al. reduced the ICP to zero immediately after an infusion study where the ICP was raised to about 30 mmHg and Tariq et al. did not. In a preliminary study recently reported as an abstract at the Hydrocephalus 2024 conference, Tariq et al. repeated their LiquoGuard7 study both before, immediately after and then 1-2 days after a standard infusion study. The CSFfr was 1.27-01.67 ml/min before the infusion test, 0.4- 0.6 ml/min immediately after the infusion (similar to Qvarlander et al.) and returned to 1.27- 1.67 ml/min at 1-2 days after [54]. Therefore, something about the infusion study is decreasing the CSFfr compared to the other time points. One possible suggestion is that because the infusion study dilates the veins by 32% because of the high ICP (see fig 3B). This would significantly block the glymphatic system even more than occurs at baseline in NPH. This glymphatic blockage may take some time to resolve and the CSFfr and glymphatic flow would therefore increase over time. However, fig 2B and C suggests that both drainage at zero ICP and infusion produces a similar increase in venous diameter so this is unlikely to be the cause of the difference. Alternatively, it is known that aquaporin 1 (found in the choroid plexus) is down regulated within the choroid in animal models of hydrocephalus [55]. Increased down regulation could occur as a response to an elevation in ICP from the infusion test to limit interstitial fluid production. Human aquaporin 1 has also been shown to rapidly alter its conductance by a reversible membrane tension mediated mechanism [56]. Down regulation or tension mediated closing of these channels could take some time to reverse and would increase the CSFfr over time.
4.5. Limitations
There are many assumptions inherent in the lumped parameter modelling. Poiseuille’s equation requires flow through a thin, rigid, circular tube of a Newtonian fluid, without turbulence. To the degree that these assumptions hold, the findings would be accurate. However, despite its limitations, this equation is commonly used in modelling the vasculature in the literature.
In our modelling, we did not vary the sinus pressure as no data was available to allow for this. However, this pressure is always assumed to be a constant in hydrocephalus. Interestingly, Chabros et al. acknowledged their reference pressure is usually hypothesised to be the sagittal sinus pressure [3]. The authors then go on to claim that this correspondence has been refuted in NPH but only referenced their own unpublished results to support this claim [3]. Presumably this is because they have measured the SSS pressure to be higher than that required for their model to work. They quote a retrospective study of 858 patients who underwent infusion to diagnose NPH and found the median Rout was 12.36 mmHg/ml/min, the median CSFfr was 0.48 ml/min, and the median reference pressure was 4.91 mmHg [3], giving a median ICP of 10.8 mmHg using Davson’s equation. We are unsure as to what this very low reference pressure corresponds, as it is 35% less than the sinus pressure (which does correspond to the reference pressure for controls) and the capillary bed pressure is even higher. As discussed Davson’s equation is probably invalid in NPH so the reference pressure is not useful.
Some of the data we required for this model is not available from human studies. In its absence, animal studies were utilised. This is exemplified by the data linking the dilatation of the capillaries to the changes in TMP, which was taken from rodent studies and the normal venous TMP, which was obtained from primate studies. We have no way of knowing if the animal data closely approximates human findings, so this is a limitation.
5. Conclusions
In NPH, the brain redirects its CSF absorption from the arachnoid granulations to the deep white matter by a combination of an opening of the blood brain barrier and a reduction in the capillary transmural pressure. Therefore, the presumed increase in Rout at the arachnoid granulations and the brain lymphatics in NPH is balanced by the reduction in outflow resistance across the capillaries, so the overall Rout is probably normal. Infusion studies increase the CSFfr during the test and if this is not taken into account, the Rout will be overestimated.
Author Contributions
Conceptualisation GAB, ARB. Methodology GAB, ARB. Validation ARB. Writing original draft preparation GAB. Writing- Review and editing GAB ARB. All authors read and approved the final manuscript.
Funding
This research received no external funding.
Institutional Review Board Statement
Not applicable.
Informed Consent Statement
Not applicable.
Data Availability Statement
All data is contained within the article.
Conflicts of Interest
The authors declare no conflicts of interest.
References
- Adams, R.D.; Fisher, C.M.; Hakim, S.; Ojemann, R.G.; Sweet, W.H. Symptomatic Occult Hydrocephalus with "Normal" Cerebrospinal-Fluid Pressure. A Treatable Syndrome. N Engl J Med 1965, 273, 117–126. [CrossRef]
- Davson, H.; Welch, K.; Segal, M.B. Physiology and Pathophysiology of the Cerebrospinal Fluid; Churchill Livingstone: 1987.
- Chabros, J.; Placek, M.M.; Chu, K.H.; Beqiri, E.; Hutchinson, P.J.; Czosnyka, Z.; Czosnyka, M.; Joannides, A.; Smielewski, P. Embracing uncertainty in cerebrospinal fluid dynamics: A Bayesian approach to analysing infusion studies. Brain Spine 2024, 4, 102837. [CrossRef]
- Jannelli, G.; Calvanese, F.; Pirina, A.; Gergele, L.; Vallet, A.; Palandri, G.; Czosnyka, M.; Czosnyka, Z.; Manet, R. Assessment of CSF Dynamics Using Infusion Study: Tips and Tricks. World Neurosurg 2024, 189, 33–41. [CrossRef]
- Silverberg, G.D.; Huhn, S.; Jaffe, R.A.; Chang, S.D.; Saul, T.; Heit, G.; Von Essen, A.; Rubenstein, E. Downregulation of cerebrospinal fluid production in patients with chronic hydrocephalus. J Neurosurg 2002, 97, 1271–1275. [CrossRef]
- MASSERMAN, J.H. CEREBROSPINAL HYDRODYNAMICS: IV. CLINICAL EXPERIMENTAL STUDIES. Archives of Neurology & Psychiatry 1934, 32, 523–553. [CrossRef]
- Qvarlander, S.; Sundstrom, N.; Malm, J.; Eklund, A. CSF formation rate-a potential glymphatic flow parameter in hydrocephalus? Fluids Barriers CNS 2024, 21, 55. [CrossRef]
- Tariq, K.; Toma, A.; Khawari, S.; Amarouche, M.; Elborady, M.A.; Thorne, L.; Watkins, L. Cerebrospinal fluid production rate in various pathological conditions: a preliminary study. Acta Neurochir (Wien) 2023, 165, 2309–2319. [CrossRef]
- Fleischman, D.; Berdahl, J.P.; Zaydlarova, J.; Stinnett, S.; Fautsch, M.P.; Allingham, R.R. Cerebrospinal fluid pressure decreases with older age. PLoS One 2012, 7, e52664. [CrossRef]
- Benabid, A.L.; De Rougemont, J.; Barge, M. [Cerebral venous pressure, sinus pressure and intracranial pressure]. Neurochirurgie 1974, 20, 623–632.
- Bateman, G.A.; Siddique, S.H. Cerebrospinal fluid absorption block at the vertex in chronic hydrocephalus: obstructed arachnoid granulations or elevated venous pressure? Fluids Barriers CNS 2014, 11, 11. [CrossRef]
- Czosnyka, M.; Czosnyka, Z.H.; Whitfield, P.C.; Donovan, T.; Pickard, J.D. Age dependence of cerebrospinal pressure-volume compensation in patients with hydrocephalus. J Neurosurg 2001, 94, 482–486. [CrossRef]
- Boon, A.J.; Tans, J.T.; Delwel, E.J.; Egeler-Peerdeman, S.M.; Hanlo, P.W.; Wurzer, H.A.; Avezaat, C.J.; de Jong, D.A.; Gooskens, R.H.; Hermans, J. Dutch normal-pressure hydrocephalus study: prediction of outcome after shunting by resistance to outflow of cerebrospinal fluid. J Neurosurg 1997, 87, 687–693. [CrossRef]
- Bateman, G.A.; Bateman, A.R. A lumped parameter modelling study of cerebral autoregulation in normal pressure hydrocephalus suggests the brain chooses to be ischemic. Sci Rep 2024, 14, 24373. [CrossRef]
- Zislin, V.; Rosenfeld, M. Impedance Pumping and Resonance in a Multi-Vessel System. Bioengineering (Basel) 2018, 5. [CrossRef]
- del Zoppo, G.J.; Sharp, F.R.; Heiss, W.D.; Albers, G.W. Heterogeneity in the penumbra. J Cereb Blood Flow Metab 2011, 31, 1836–1851. [CrossRef]
- Ursino, M. A mathematical study of human intracranial hydrodynamics. Part 1--The cerebrospinal fluid pulse pressure. Ann Biomed Eng 1988, 16, 379–401. [CrossRef]
- Salmon, J.H.; Timperman, A.L. Effect of intracranial hypotension on cerebral blood flow. J Neurol Neurosurg Psychiatry 1971, 34, 687–692. [CrossRef]
- Cirovic, S.; Walsh, C.; Fraser, W.D. Mathematical study of the role of non-linear venous compliance in the cranial volume-pressure test. Med Biol Eng Comput 2003, 41, 579–588. [CrossRef]
- Johnston, I.H.; Rowan, J.O. Raised intracranial pressure and cerebral blood flow. 3. Venous outflow tract pressures and vascular resistances in experimental intracranial hypertension. J Neurol Neurosurg Psychiatry 1974, 37, 392–402. [CrossRef]
- Hua, J.; Liu, P.; Kim, T.; Donahue, M.; Rane, S.; Chen, J.J.; Qin, Q.; Kim, S.G. MRI techniques to measure arterial and venous cerebral blood volume. Neuroimage 2019, 187, 17–31. [CrossRef]
- Menéndez González, M. CNS Compartments: The Anatomy and Physiology of the Cerebrospinal Fluid. In Liquorpheresis: Cerebrospinal Fluid Filtration to Treat CNS Conditions, Menéndez González, M., Ed.; Springer Nature Switzerland: Cham, 2023; pp. 1–19.
- Albeck, M.J.; Skak, C.; Nielsen, P.R.; Olsen, K.S.; Borgesen, S.E.; Gjerris, F. Age dependency of resistance to cerebrospinal fluid outflow. J Neurosurg 1998, 89, 275–278. [CrossRef]
- Ekstedt, J. CSF hydrodynamic studies in man. 2 . Normal hydrodynamic variables related to CSF pressure and flow. J Neurol Neurosurg Psychiatry 1978, 41, 345–353. [CrossRef]
- Claassen, J.; Thijssen, D.H.J.; Panerai, R.B.; Faraci, F.M. Regulation of cerebral blood flow in humans: physiology and clinical implications of autoregulation. Physiol Rev 2021, 101, 1487–1559. [CrossRef]
- Duelli, R.; Kuschinsky, W. Changes in brain capillary diameter during hypocapnia and hypercapnia. J Cereb Blood Flow Metab 1993, 13, 1025–1028. [CrossRef]
- R, D.E.S.; Ranieri, A.; Bonavita, V. Starling resistors, autoregulation of cerebral perfusion and the pathogenesis of idiopathic intracranial hypertension. Panminerva Med 2017, 59, 76–89. [CrossRef]
- Momjian, S.; Owler, B.K.; Czosnyka, Z.; Czosnyka, M.; Pena, A.; Pickard, J.D. Pattern of white matter regional cerebral blood flow and autoregulation in normal pressure hydrocephalus. Brain 2004, 127, 965–972. [CrossRef]
- Owler, B.K.; Pickard, J.D. Normal pressure hydrocephalus and cerebral blood flow: a review. Acta Neurol Scand 2001, 104, 325–342. [CrossRef]
- Tuniz, F.; Vescovi, M.C.; Bagatto, D.; Drigo, D.; De Colle, M.C.; Maieron, M.; Skrap, M. The role of perfusion and diffusion MRI in the assessment of patients affected by probable idiopathic normal pressure hydrocephalus. A cohort-prospective preliminary study. Fluids Barriers CNS 2017, 14, 24. [CrossRef]
- Sundstrom, N.; Andersson, K.; Marmarou, A.; Malm, J.; Eklund, A. Comparison between 3 infusion methods to measure cerebrospinal fluid outflow conductance. J Neurosurg 2010, 113, 1294–1303. [CrossRef]
- Griffith, B.; Capobres, T.; Patel, S.C.; Marin, H.; Katramados, A.; Poisson, L.M. CSF Pressure Change in Relation to Opening Pressure and CSF Volume Removed. AJNR Am J Neuroradiol 2018, 39, 1185–1190. [CrossRef]
- Weiss, M.H.; Wertman, N. Modulation of CSF production by alterations in cerebral perfusion pressure. Arch Neurol 1978, 35, 527–529. [CrossRef]
- Cserr, H.F. Physiology of the choroid plexus. Physiol Rev 1971, 51, 273–311. [CrossRef]
- Kimelberg, H.K. Water homeostasis in the brain: basic concepts. Neuroscience 2004, 129, 851–860. [CrossRef]
- Brean, A.; Eide, P.K.; Stubhaug, A. Comparison of intracranial pressure measured simultaneously within the brain parenchyma and cerebral ventricles. J Clin Monit Comput 2006, 20, 411–414. [CrossRef]
- Koskinen, L.O.; Olivecrona, M. Clinical experience with the intraparenchymal intracranial pressure monitoring Codman MicroSensor system. Neurosurgery 2005, 56, 693–698; discussion 693-698. [CrossRef]
- Xiang, J.; Hua, Y.; Xi, G.; Keep, R.F. Mechanisms of cerebrospinal fluid and brain interstitial fluid production. Neurobiol Dis 2023, 183, 106159. [CrossRef]
- Castejon, O.J. Submicroscopic pathology of human and experimental hydrocephalic cerebral cortex. Folia Neuropathol 2010, 48, 159–174.
- Eide, P.K.; Hansson, H.A. Blood-brain barrier leakage of blood proteins in idiopathic normal pressure hydrocephalus. Brain Res 2020, 1727, 146547. [CrossRef]
- Schmidt, M.J.; Kolecka, M.; Kirberger, R.; Hartmann, A. Dynamic Susceptibility Contrast Perfusion Magnetic Resonance Imaging Demonstrates Reduced Periventricular Cerebral Blood Flow in Dogs with Ventriculomegaly. Front Vet Sci 2017, 4, 137. [CrossRef]
- Good, C.D.; Johnsrude, I.; Ashburner, J.; Henson, R.N.; Friston, K.J.; Frackowiak, R.S. Cerebral asymmetry and the effects of sex and handedness on brain structure: a voxel-based morphometric analysis of 465 normal adult human brains. Neuroimage 2001, 14, 685–700. [CrossRef]
- Muer, J.D.; Didier, K.D.; Wannebo, B.M.; Sanchez, S.; Khademi Motlagh, H.; Haley, T.L.; Carter, K.J.; Banks, N.F.; Eldridge, M.W.; Serlin, R.C.; et al. Sex differences in gray matter, white matter, and regional brain perfusion in young, healthy adults. Am J Physiol Heart Circ Physiol 2024, 327, H847–H858. [CrossRef]
- Ohmichi, T.; Kondo, M.; Itsukage, M.; Koizumi, H.; Matsushima, S.; Kuriyama, N.; Ishii, K.; Mori, E.; Yamada, K.; Mizuno, T.; et al. Usefulness of the convexity apparent hyperperfusion sign in 123I-iodoamphetamine brain perfusion SPECT for the diagnosis of idiopathic normal pressure hydrocephalus. J Neurosurg 2019, 130, 398–405. [CrossRef]
- Lindstrom, E.K.; Ringstad, G.; Mardal, K.A.; Eide, P.K. Cerebrospinal fluid volumetric net flow rate and direction in idiopathic normal pressure hydrocephalus. Neuroimage Clin 2018, 20, 731–741. [CrossRef]
- Rau, A.; Reisert, M.; Kellner, E.; Hosp, J.A.; Urbach, H.; Demerath, T. Increased interstitial fluid in periventricular and deep white matter hyperintensities in patients with suspected idiopathic normal pressure hydrocephalus. Sci Rep 2021, 11, 19552. [CrossRef]
- Shoesmith, C.L.; Buist, R.; Del Bigio, M.R. Magnetic resonance imaging study of extracellular fluid tracer movement in brains of immature rats with hydrocephalus. Neurol Res 2000, 22, 111–116. [CrossRef]
- Nedergaard, M. Neuroscience. Garbage truck of the brain. Science 2013, 340, 1529–1530. [CrossRef]
- Eide, P.K.; Pripp, A.H.; Ringstad, G. Magnetic resonance imaging biomarkers of cerebrospinal fluid tracer dynamics in idiopathic normal pressure hydrocephalus. Brain Commun 2020, 2, fcaa187. [CrossRef]
- Bateman, G.A.; Bateman, A.R. Syringomyelia Is Associated with a Reduction in Spinal Canal Compliance, Venous Outflow Dilatation and Glymphatic Fluid Obstruction. J Clin Med 2023, 12. [CrossRef]
- Bateman, G.A.; Bateman, A.R. The dilated cortical veins found in multiple sclerosis can explain the reduction in glymphatic flow. Mult Scler Relat Disord 2024, 81, 105136. [CrossRef]
- Bateman, G.A.; Bateman, A.R. The dilated veins surrounding the cord in multiple sclerosis suggest elevated pressure and obstruction of the glymphatic system. Neuroimage 2024, 286, 120517. [CrossRef]
- Bonney, P.A.; Briggs, R.G.; Wu, K.; Choi, W.; Khahera, A.; Ojogho, B.; Shao, X.; Zhao, Z.; Borzage, M.; Wang, D.J.J.; et al. Pathophysiological Mechanisms Underlying Idiopathic Normal Pressure Hydrocephalus: A Review of Recent Insights. Front Aging Neurosci 2022, 14, 866313. [CrossRef]
- Tariq, K.; Toma, A.; Khawari, S.; Amarouche, M.; Elborady, M.A.; Thorne, L. Normal cerebrospinal fluid production rate in normal pressure hydrocephalus patients post lumbar infusion test. In Proceedings of the Hydrocephalus 2024, Nagoya, Japan, 13-16 September, 2024.
- Kalani, M.Y.; Filippidis, A.S.; Rekate, H.L. Hydrocephalus and aquaporins: the role of aquaporin-1. Acta Neurochir Suppl 2012, 113, 51–54. [CrossRef]
- Ozu, M.; Dorr, R.A.; Gutierrez, F.; Politi, M.T.; Toriano, R. Human AQP1 is a constitutively open channel that closes by a membrane-tension-mediated mechanism. Biophys J 2013, 104, 85–95. [CrossRef]
Figure 1.
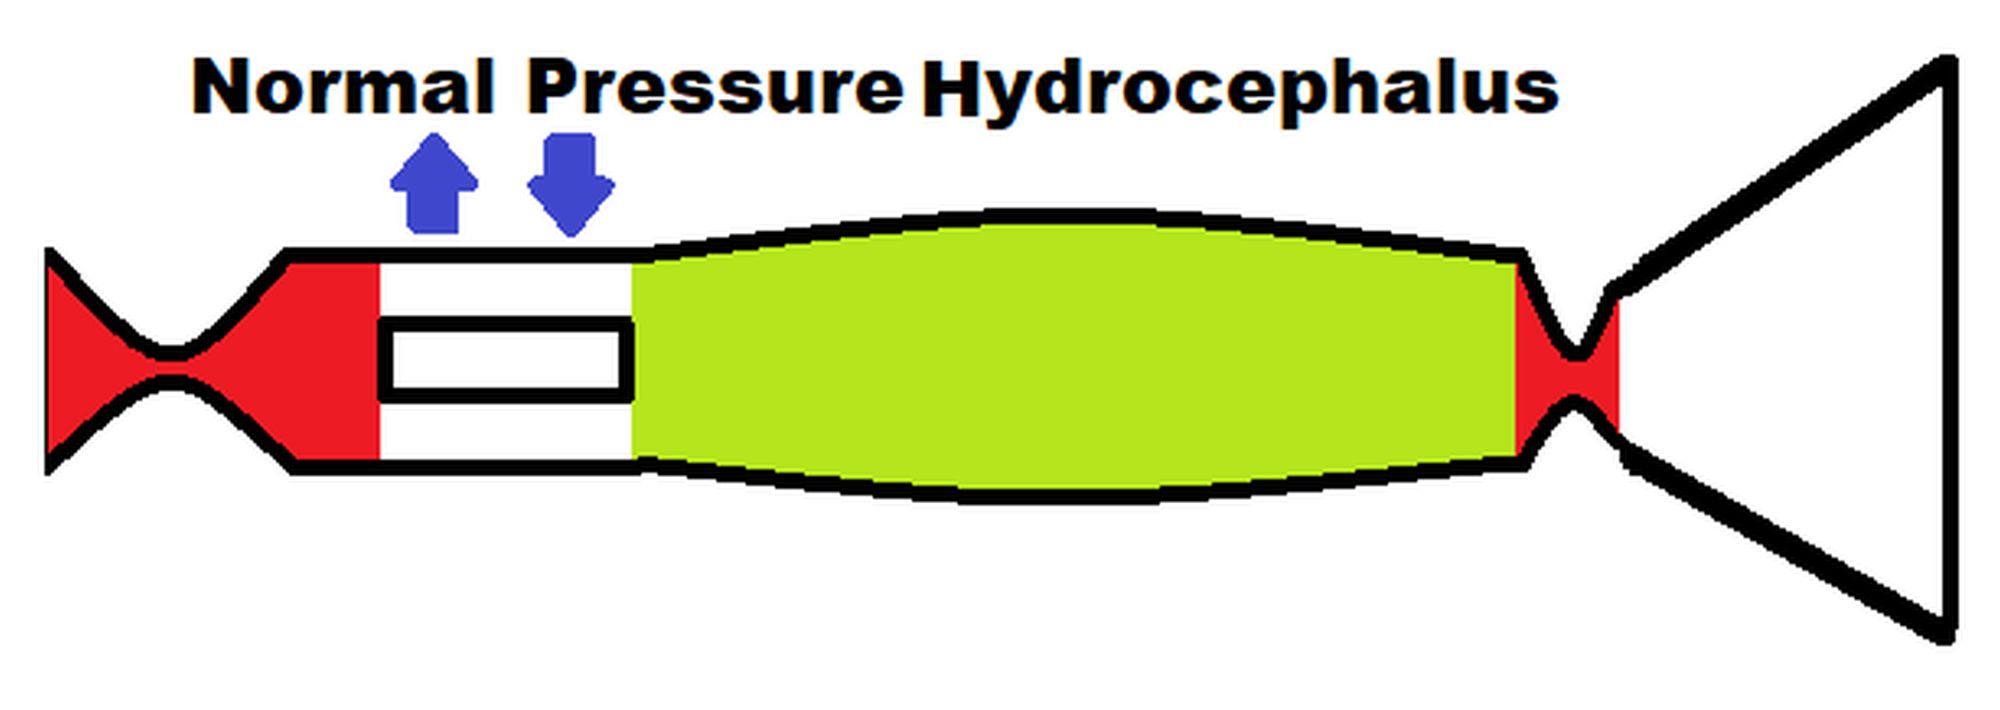
Results of modelling changes to blood flow in NPH. (A) depicts the normal findings. The red segment is the arterial, orange the capillary, yellow the veins, green the outflow cuff and blue the venous sinus. The vascular pressures are shown within the vessels. The blue numbers are the transmural pressures at each site. The red numbers are the average capillary transmural pressure. The resistances and volumes for each segment are shown below the vessel. Note. CSF; cerebrospinal fluid, ICP; intracranial pressure, mm; millimeters, mmHg; mmHg, millimeters of mercury, ml; millimeters, NPH; normal pressure hydrocephalus. (B) shows the baseline NPH findings with the red area indicating an increase in resistance in the veins and the green decreased resistance compared to normal. (C) shows the findings in NPH following an instantaneous increase in blood flow back to normal with the green area highlighting a reduction in resistance in the arteries and veins and the red an increase in the outflow cuff compared to normal. (D) shows the findings in IIH following a reduction in blood flow by 40% below normal with increased resistance in the arteries. (A) and (B) have been reproduced from [14] under a CC BY 4.0 commons licence.
Figure 1.
Results of modelling changes to blood flow in NPH. (A) depicts the normal findings. The red segment is the arterial, orange the capillary, yellow the veins, green the outflow cuff and blue the venous sinus. The vascular pressures are shown within the vessels. The blue numbers are the transmural pressures at each site. The red numbers are the average capillary transmural pressure. The resistances and volumes for each segment are shown below the vessel. Note. CSF; cerebrospinal fluid, ICP; intracranial pressure, mm; millimeters, mmHg; mmHg, millimeters of mercury, ml; millimeters, NPH; normal pressure hydrocephalus. (B) shows the baseline NPH findings with the red area indicating an increase in resistance in the veins and the green decreased resistance compared to normal. (C) shows the findings in NPH following an instantaneous increase in blood flow back to normal with the green area highlighting a reduction in resistance in the arteries and veins and the red an increase in the outflow cuff compared to normal. (D) shows the findings in IIH following a reduction in blood flow by 40% below normal with increased resistance in the arteries. (A) and (B) have been reproduced from [14] under a CC BY 4.0 commons licence.
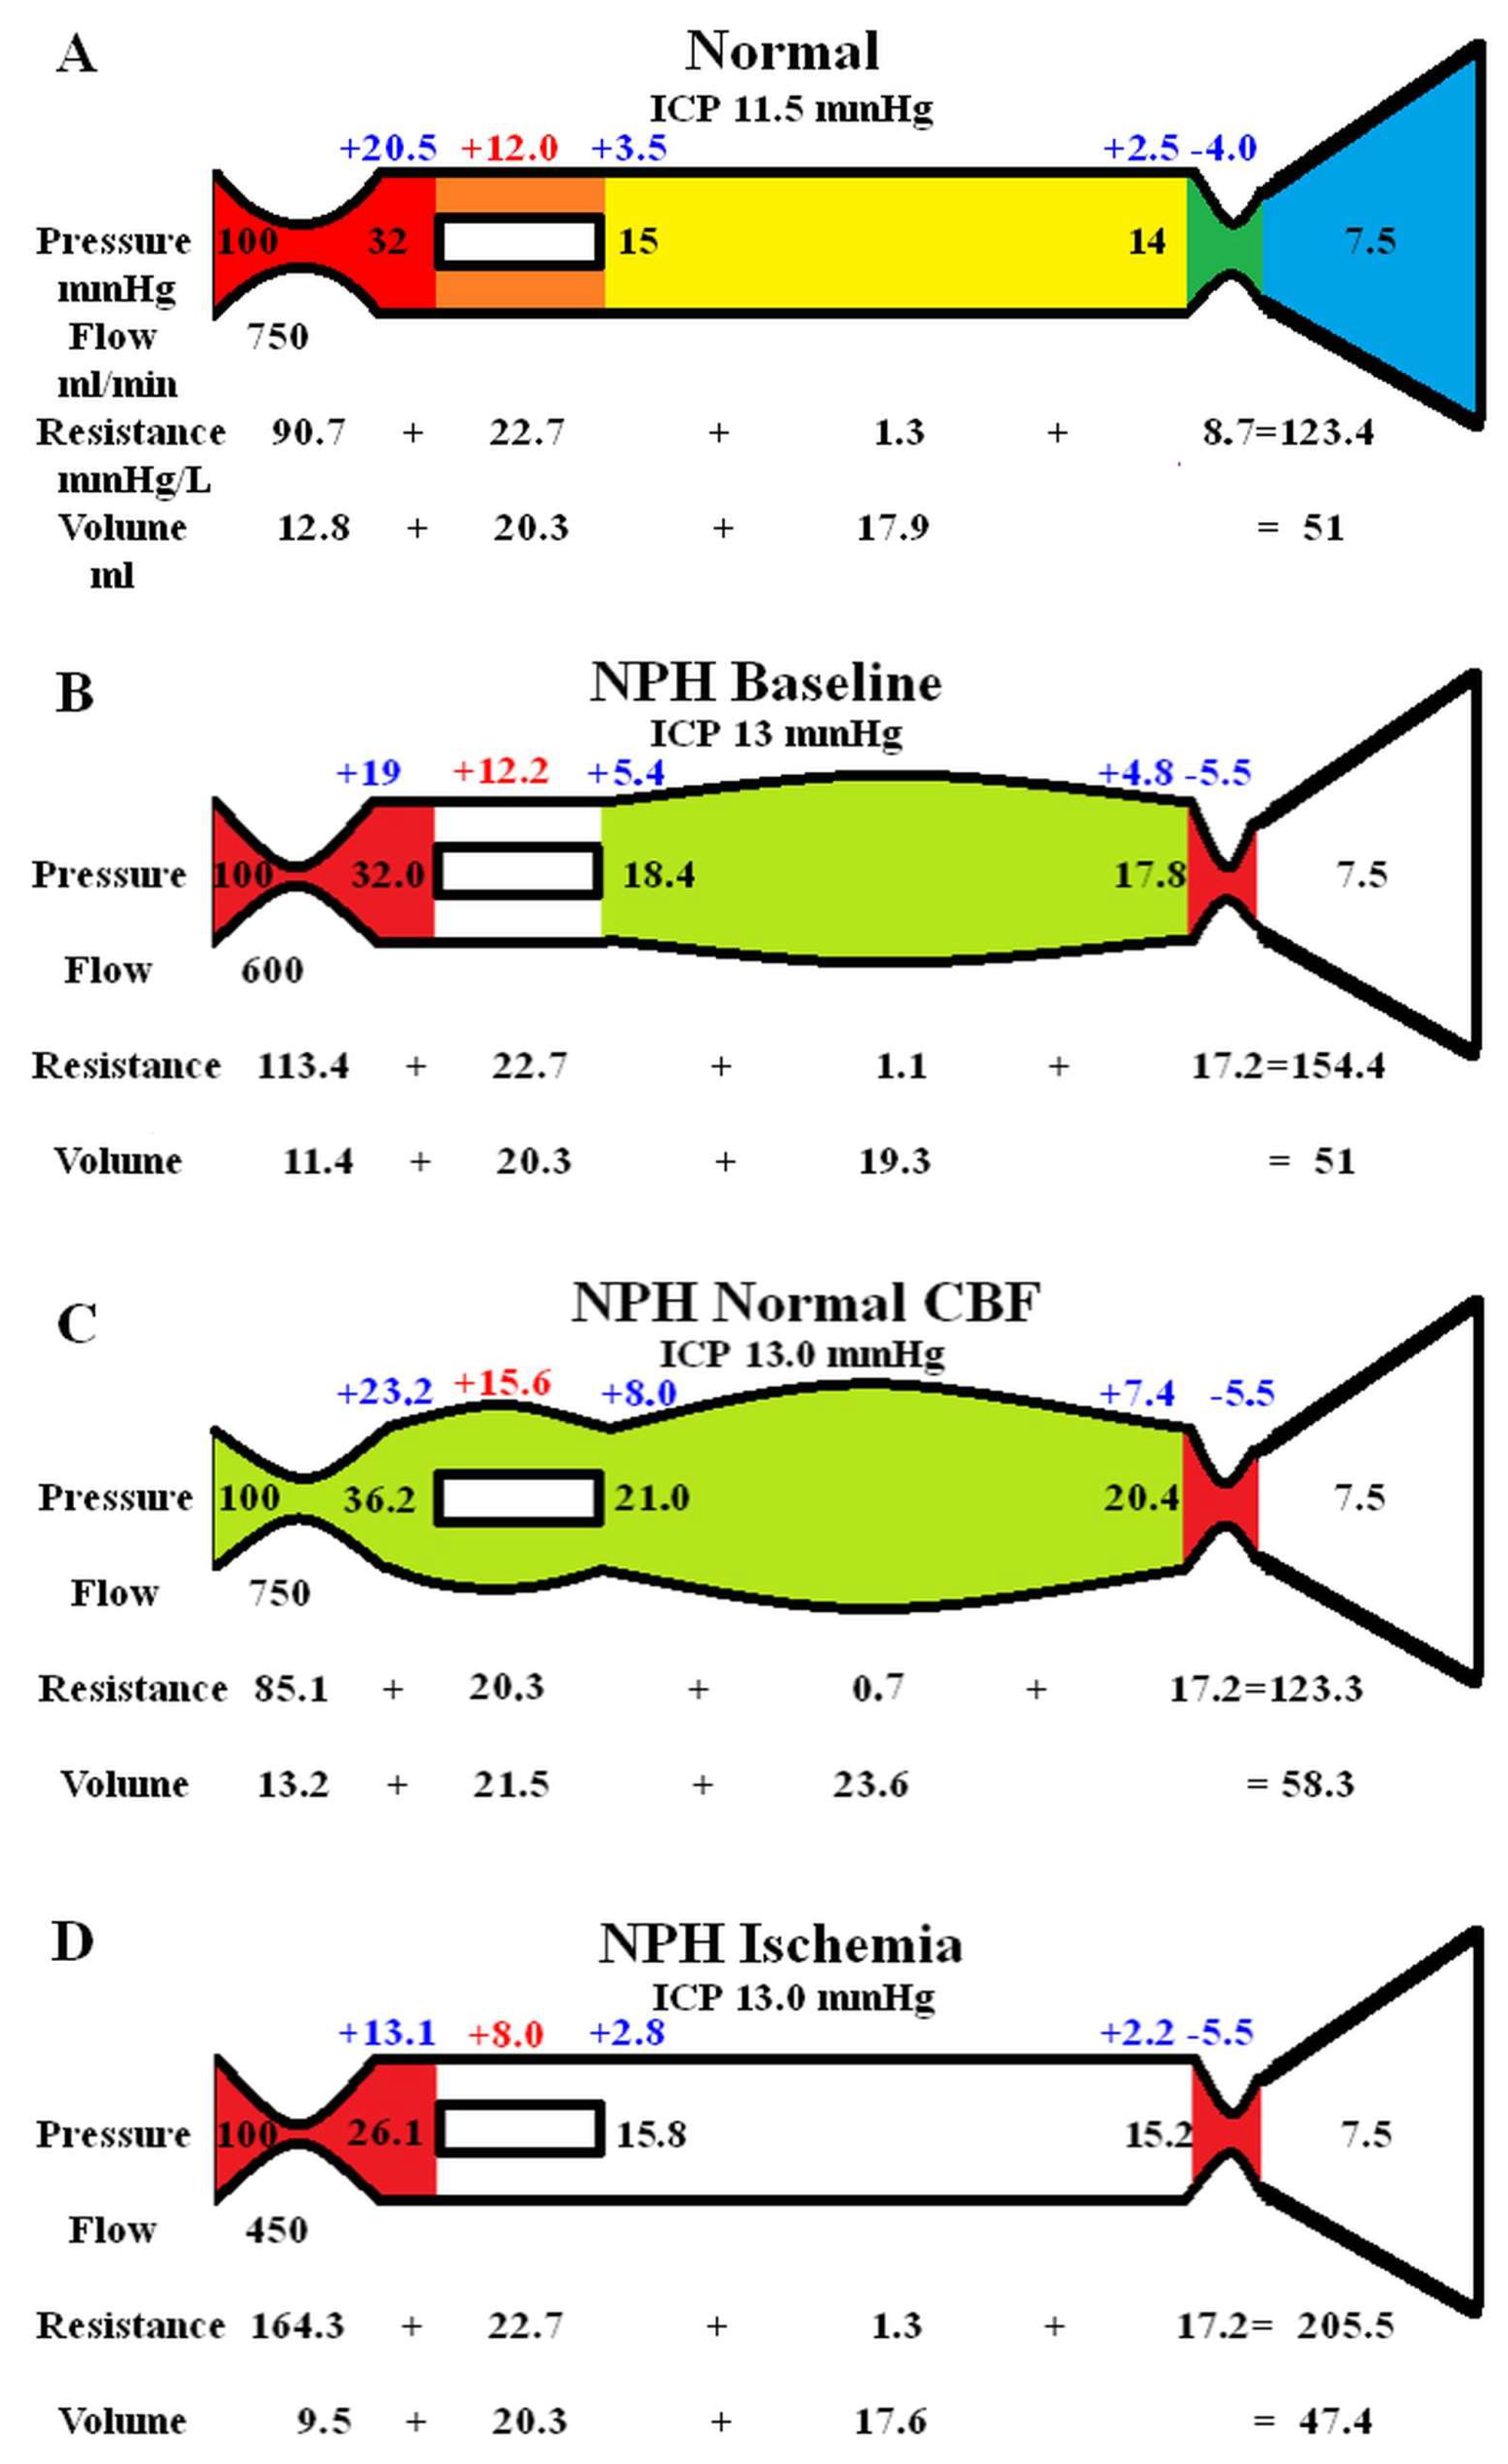
Figure 2.
Modelling of changes to ICP in NPH. (A) shows the baseline NPH findings as seen above in fig 1B. (B) shows the findings in NPH following an infusion study with the green area highlighting a reduction in resistance in the capillaries and veins and the red an increase in the arteries and outflow cuff compared to normal. (C) shows the findings in NPH following CSF drainage to lower the ICP to zero. The outflow cuff resistance is abolished reducing the venous and capillary pressure but the ICP has a greater reduction leading to an increase in capillary TMP. Note, TMP; transmural pressure. Figure (A) has been reproduced from [14] under a CC BY 4.0 commons licence.
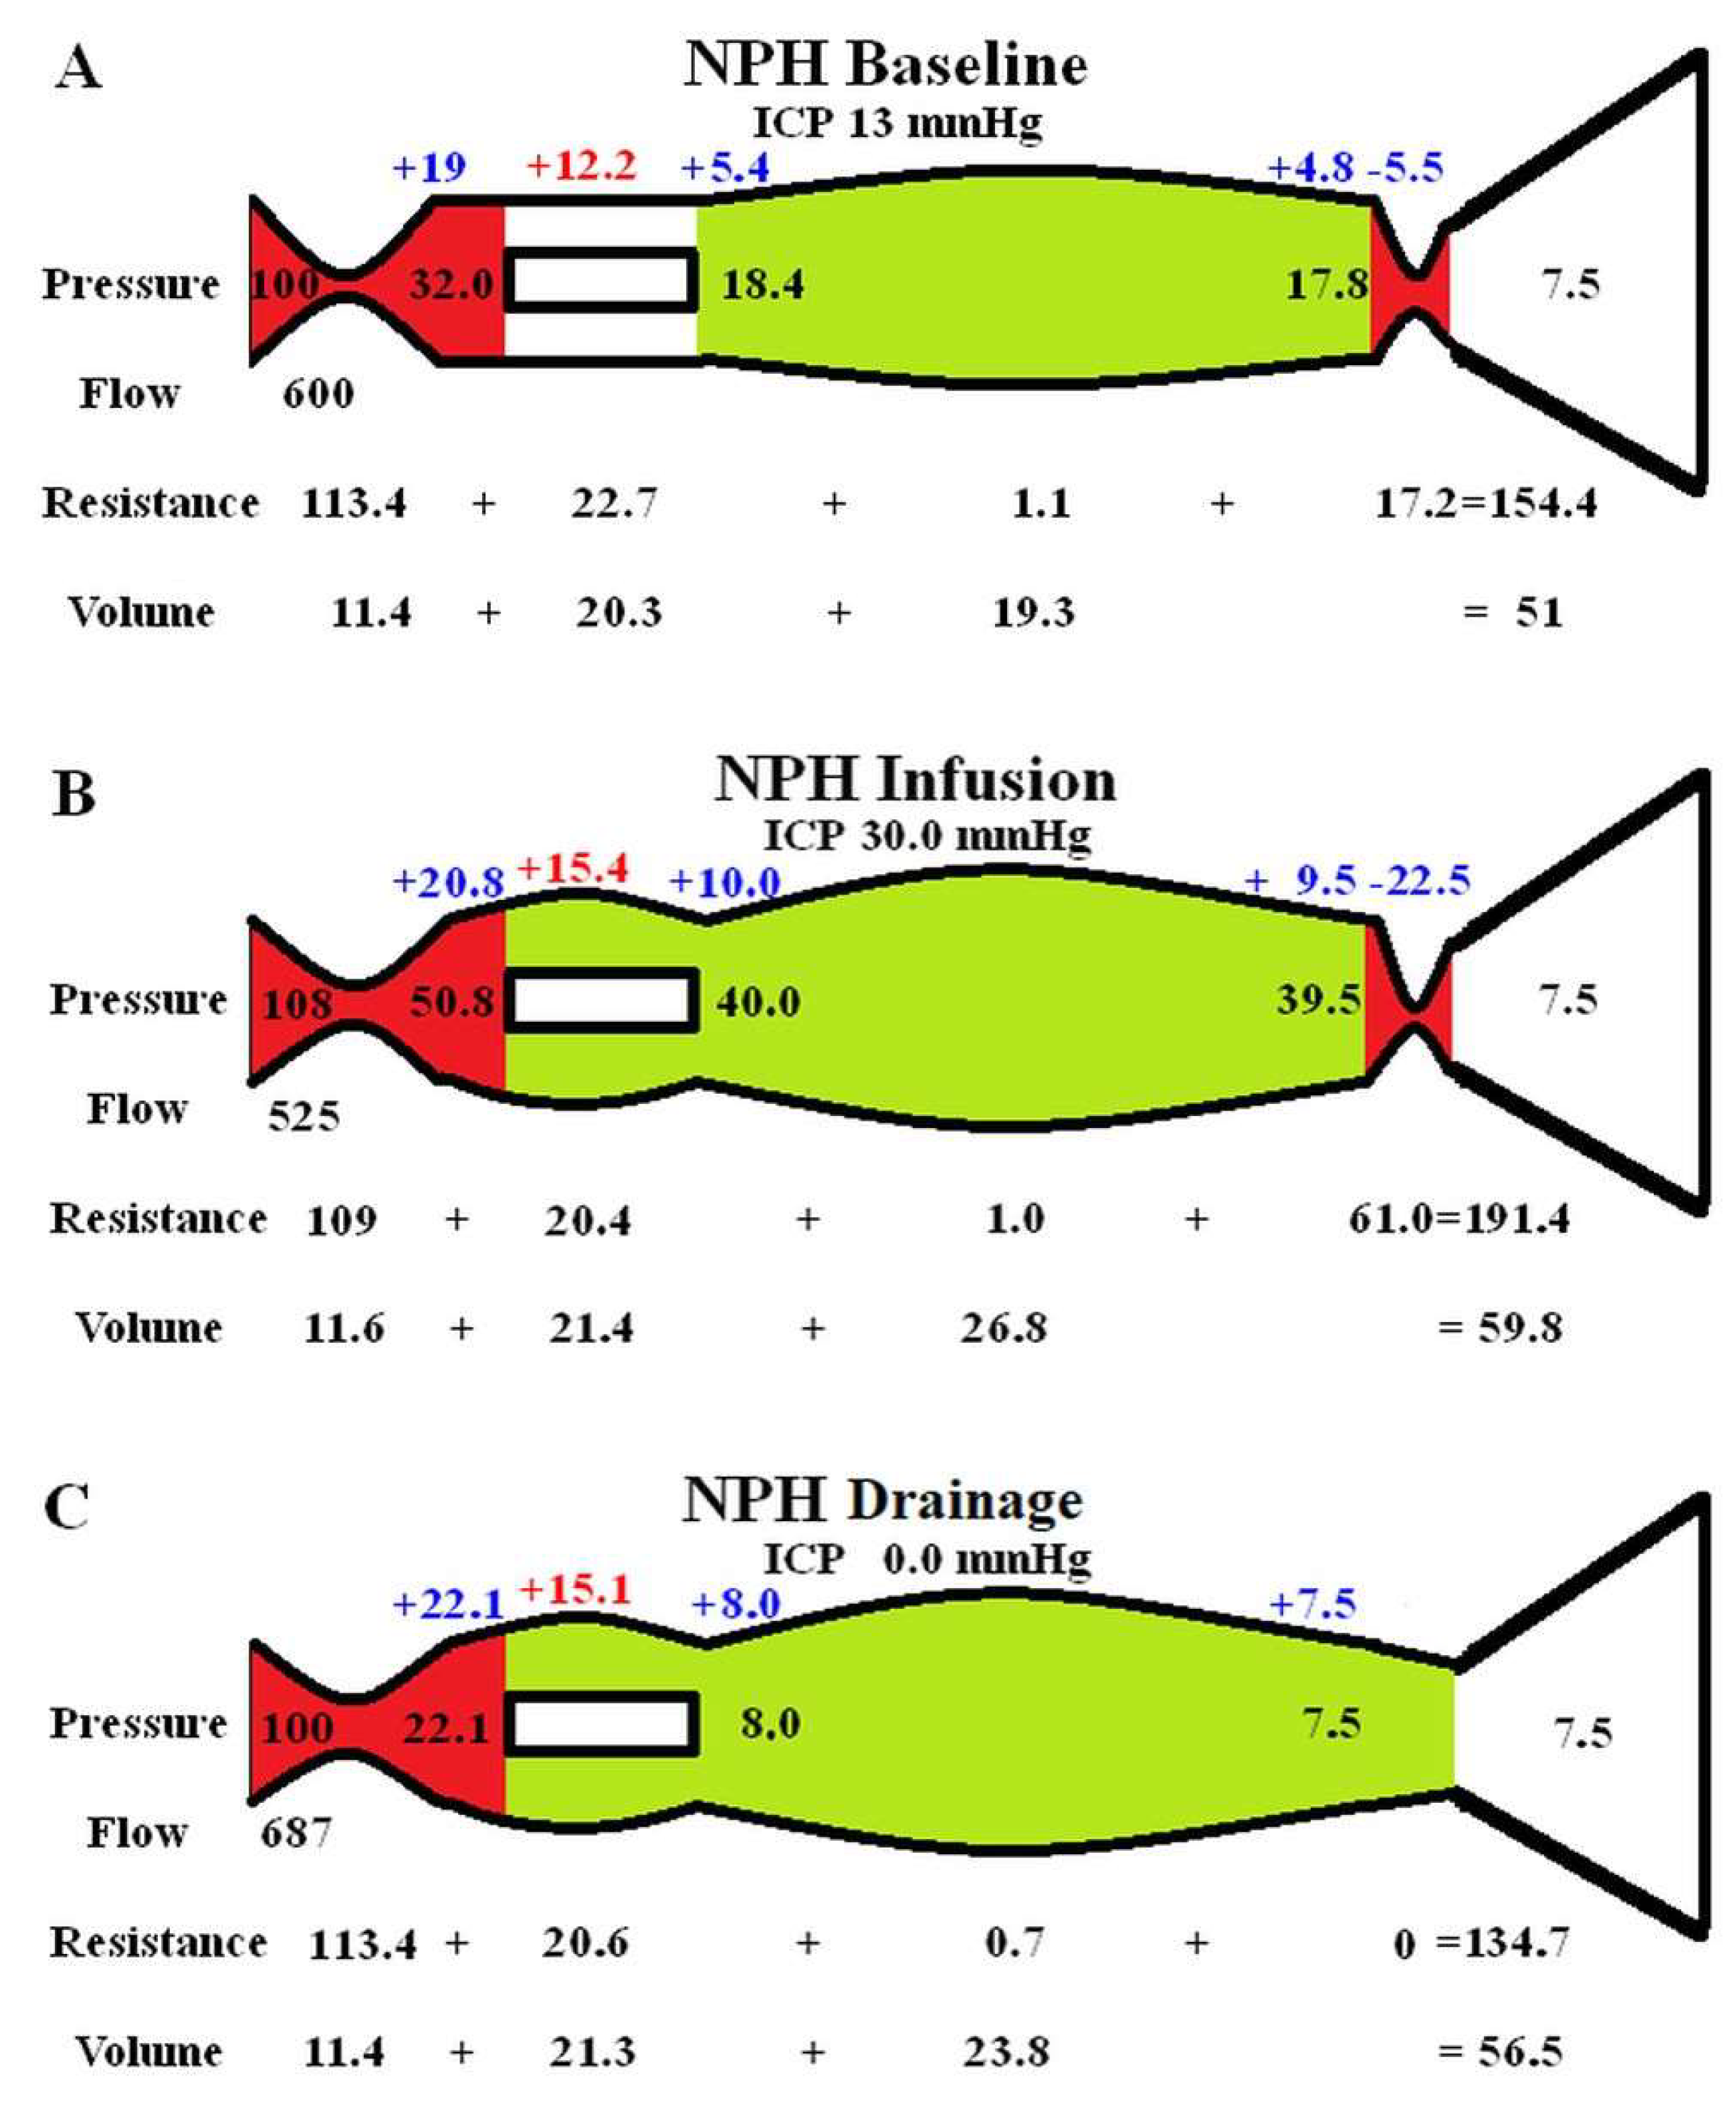
Figure 3.
Vascular changes in NPH compared to the cerebral blood flow. (A) A graph of the four calculated capillary transmural pressures vs the cerebral blood flow for the 4 studies obtained from the initial modelling. The red dot is the baseline finding in NPH. Note, increasing the CBF above baseline increased the capillary TMP and decreasing the CBF does the opposite in a linear fashion. (B) A graph of the four calculated venous volumes vs the cerebral blood flow for the 4 studies obtained from the initial modelling. The red dot is the baseline finding in NPH. Note, increasing the CBF above baseline increased the venous volume and decreasing the CBF does the opposite in a quadratic fashion.
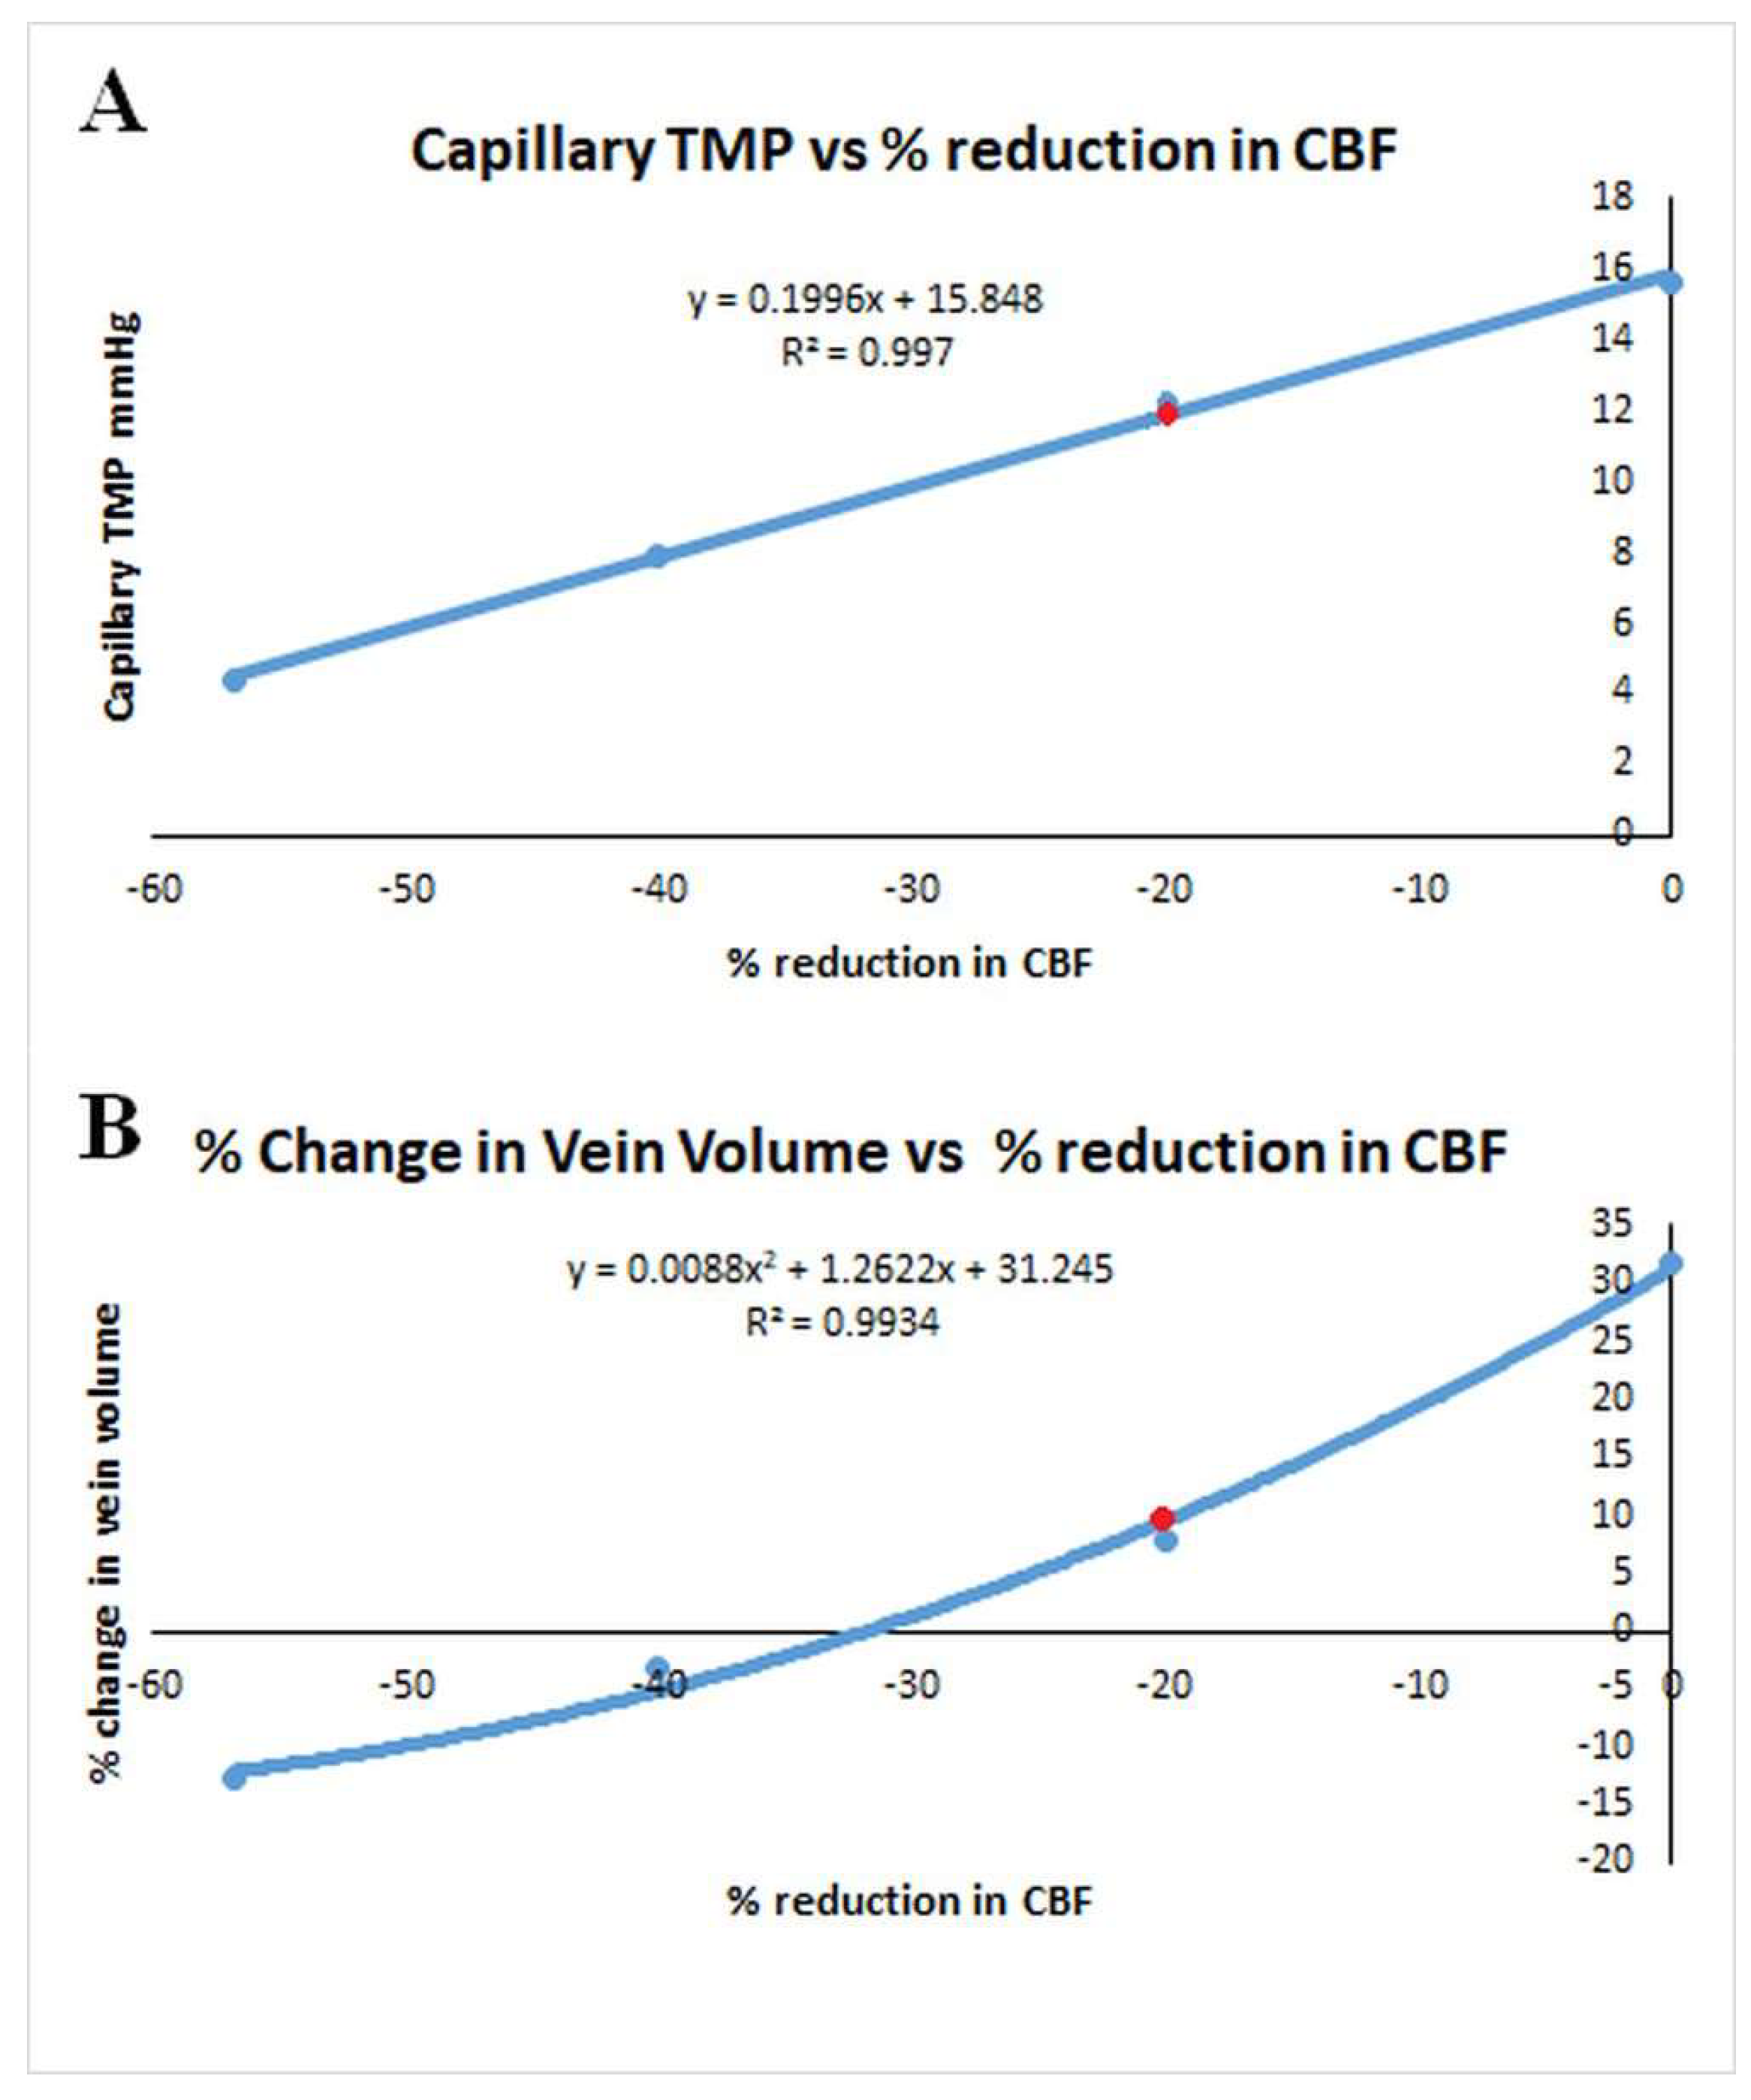
Figure 4.
Relationship between the capillary transmural pressure and ICP in NPH. A graph of the change capillary transmural pressure vs ICP from the data obtained from the second modelling study. The red dot indicates the NPH baseline. The graph is a complex polynomial function but the capillary TMP increases to an identical value at either extreme of the ICP change. The capillary TMP will remain close to the baseline if the ICP is not changed by much either way.
Disclaimer/Publisher’s Note: The statements, opinions and data contained in all publications are solely those of the individual author(s) and contributor(s) and not of MDPI and/or the editor(s). MDPI and/or the editor(s) disclaim responsibility for any injury to people or property resulting from any ideas, methods, instructions or products referred to in the content. |
© 2024 by the authors. Licensee MDPI, Basel, Switzerland. This article is an open access article distributed under the terms and conditions of the Creative Commons Attribution (CC BY) license (http://creativecommons.org/licenses/by/4.0/).
Copyright: This open access article is published under a Creative Commons CC BY 4.0 license, which permit the free download, distribution, and reuse, provided that the author and preprint are cited in any reuse.


