Preprint
Article

This version is not peer-reviewed.

Construction of Hybrid ZnO/SnO2 N–N Heterojunction with Hierarchical Porous Biomorphic Nanostructure as a High-Response Sensor for Methanol Gas

A peer-reviewed article of this preprint also exists.

Submitted:

26 November 2024

Posted:

27 November 2024

You are already at the latest version

Abstract

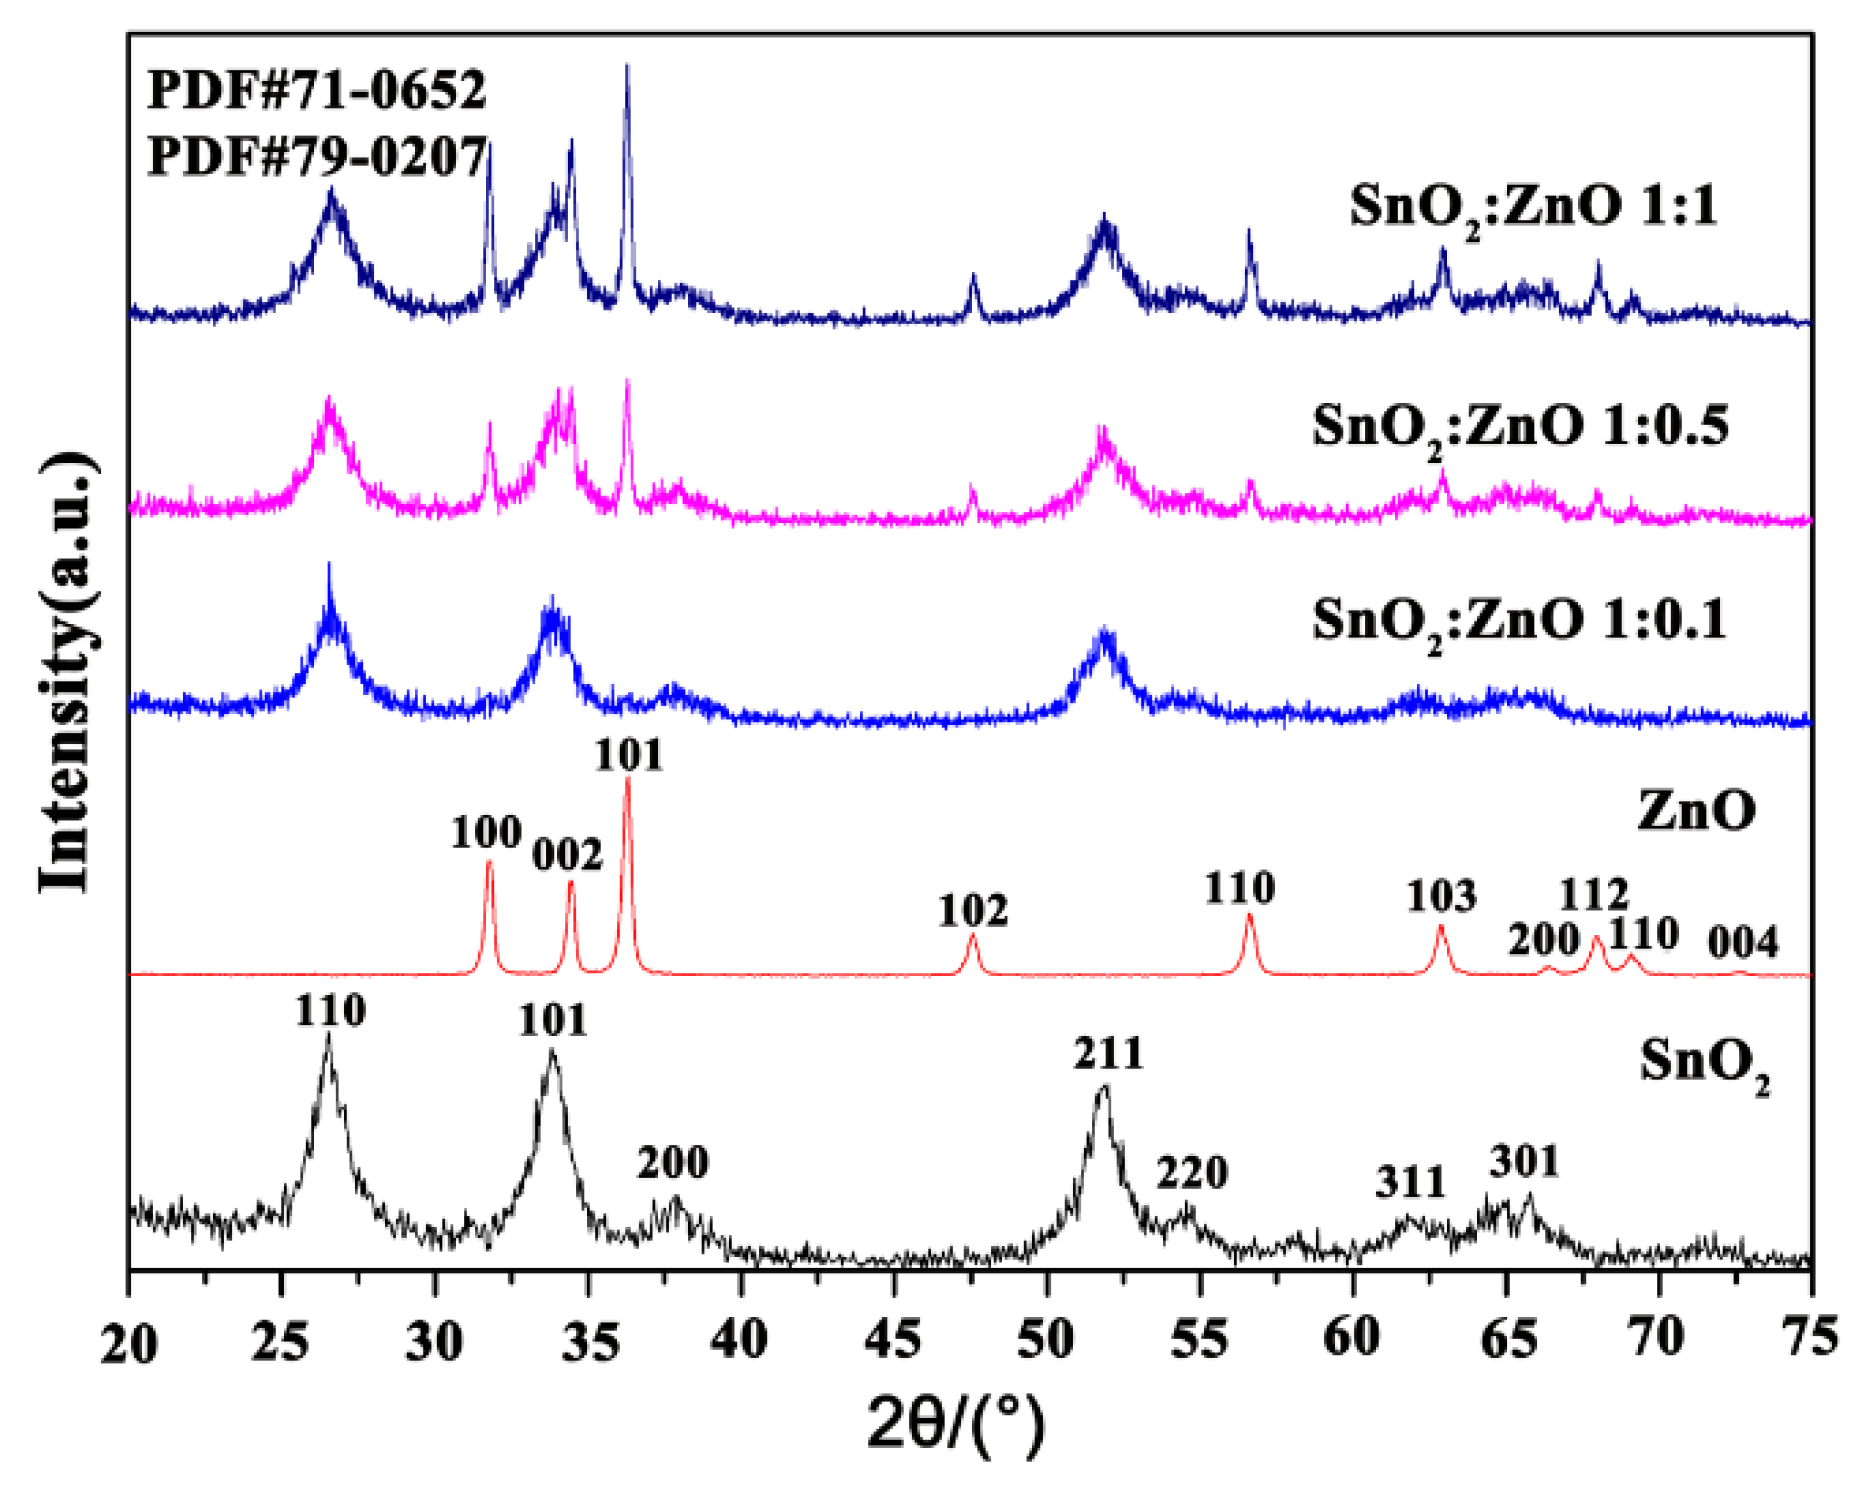
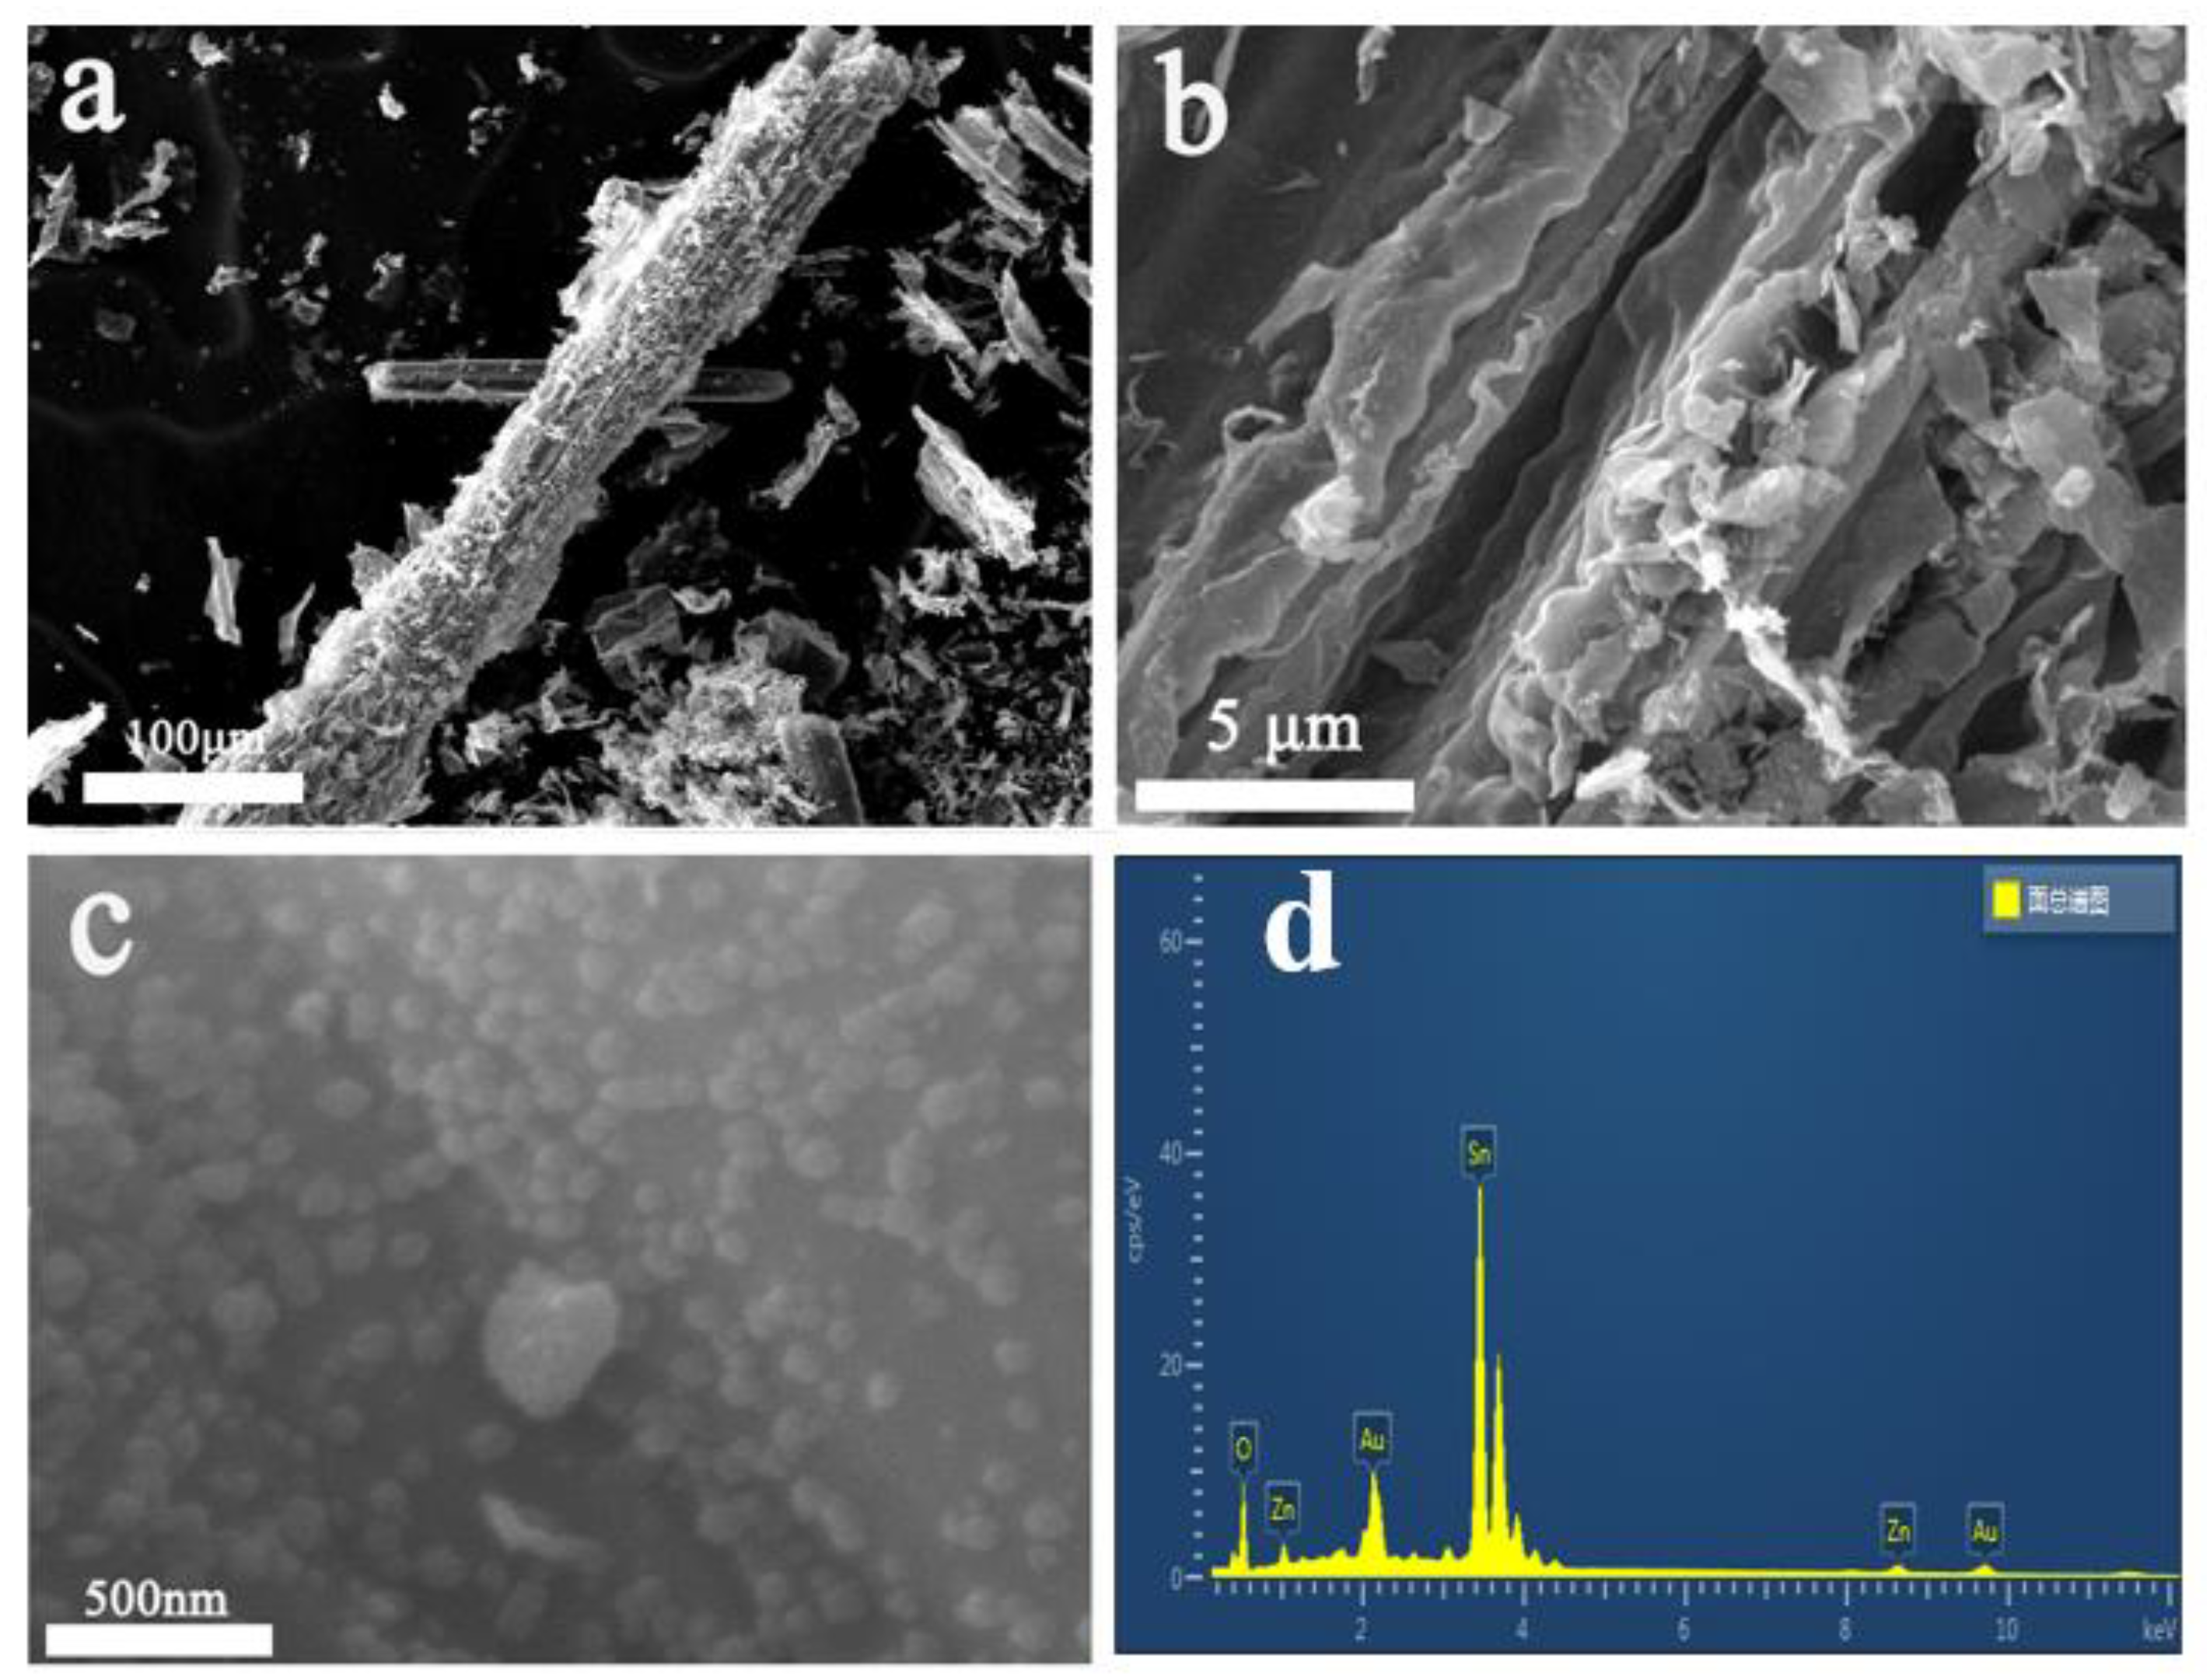
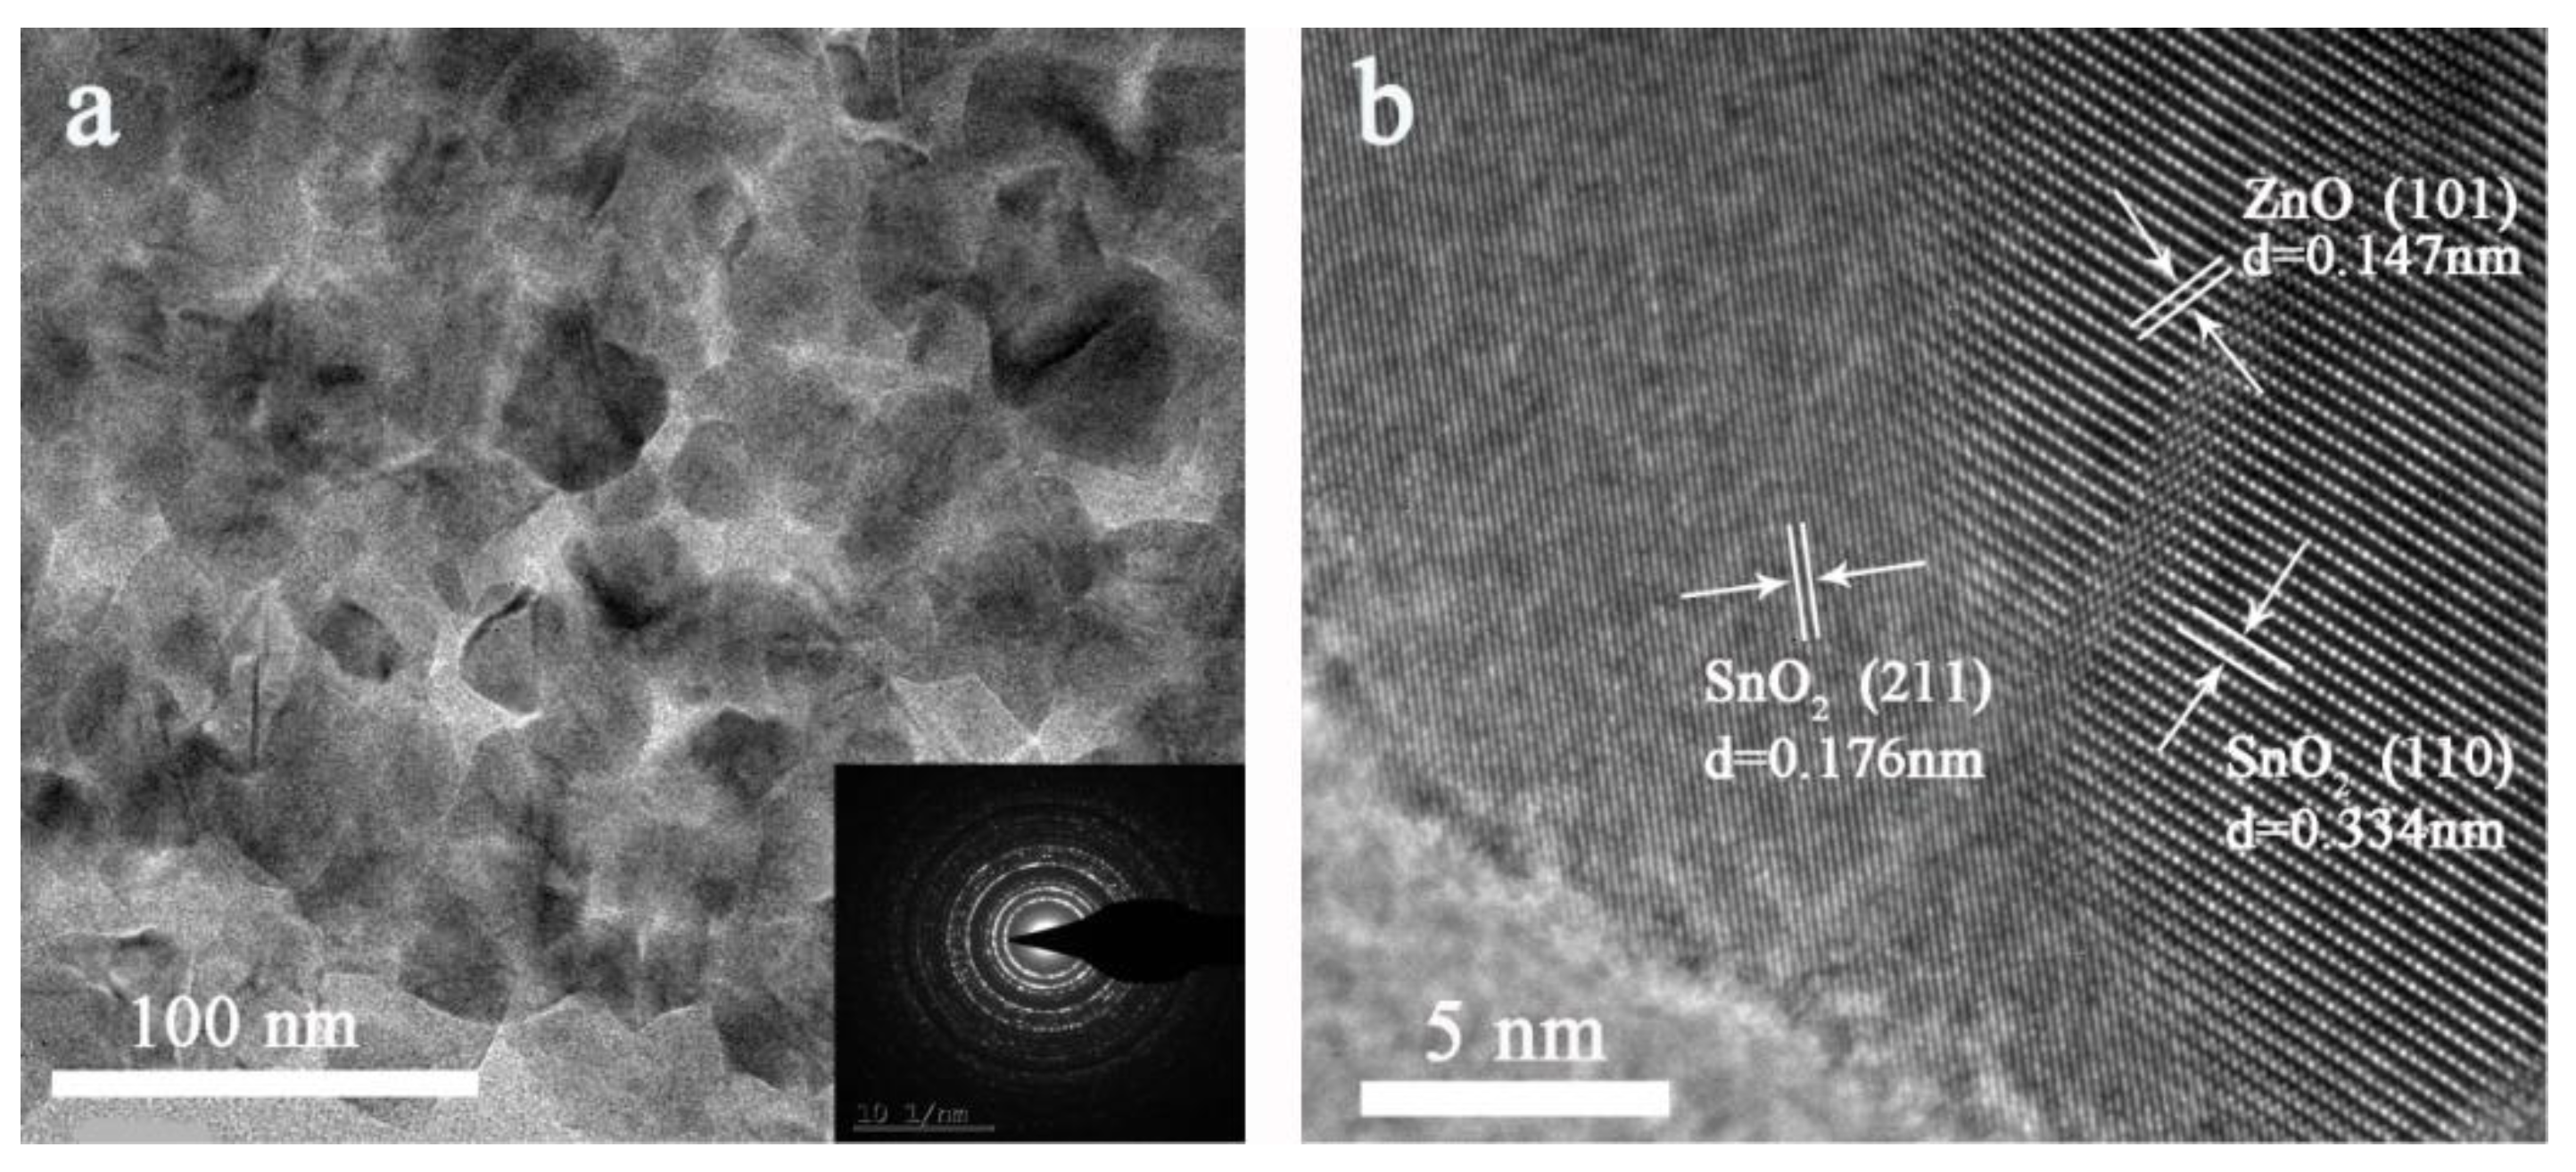
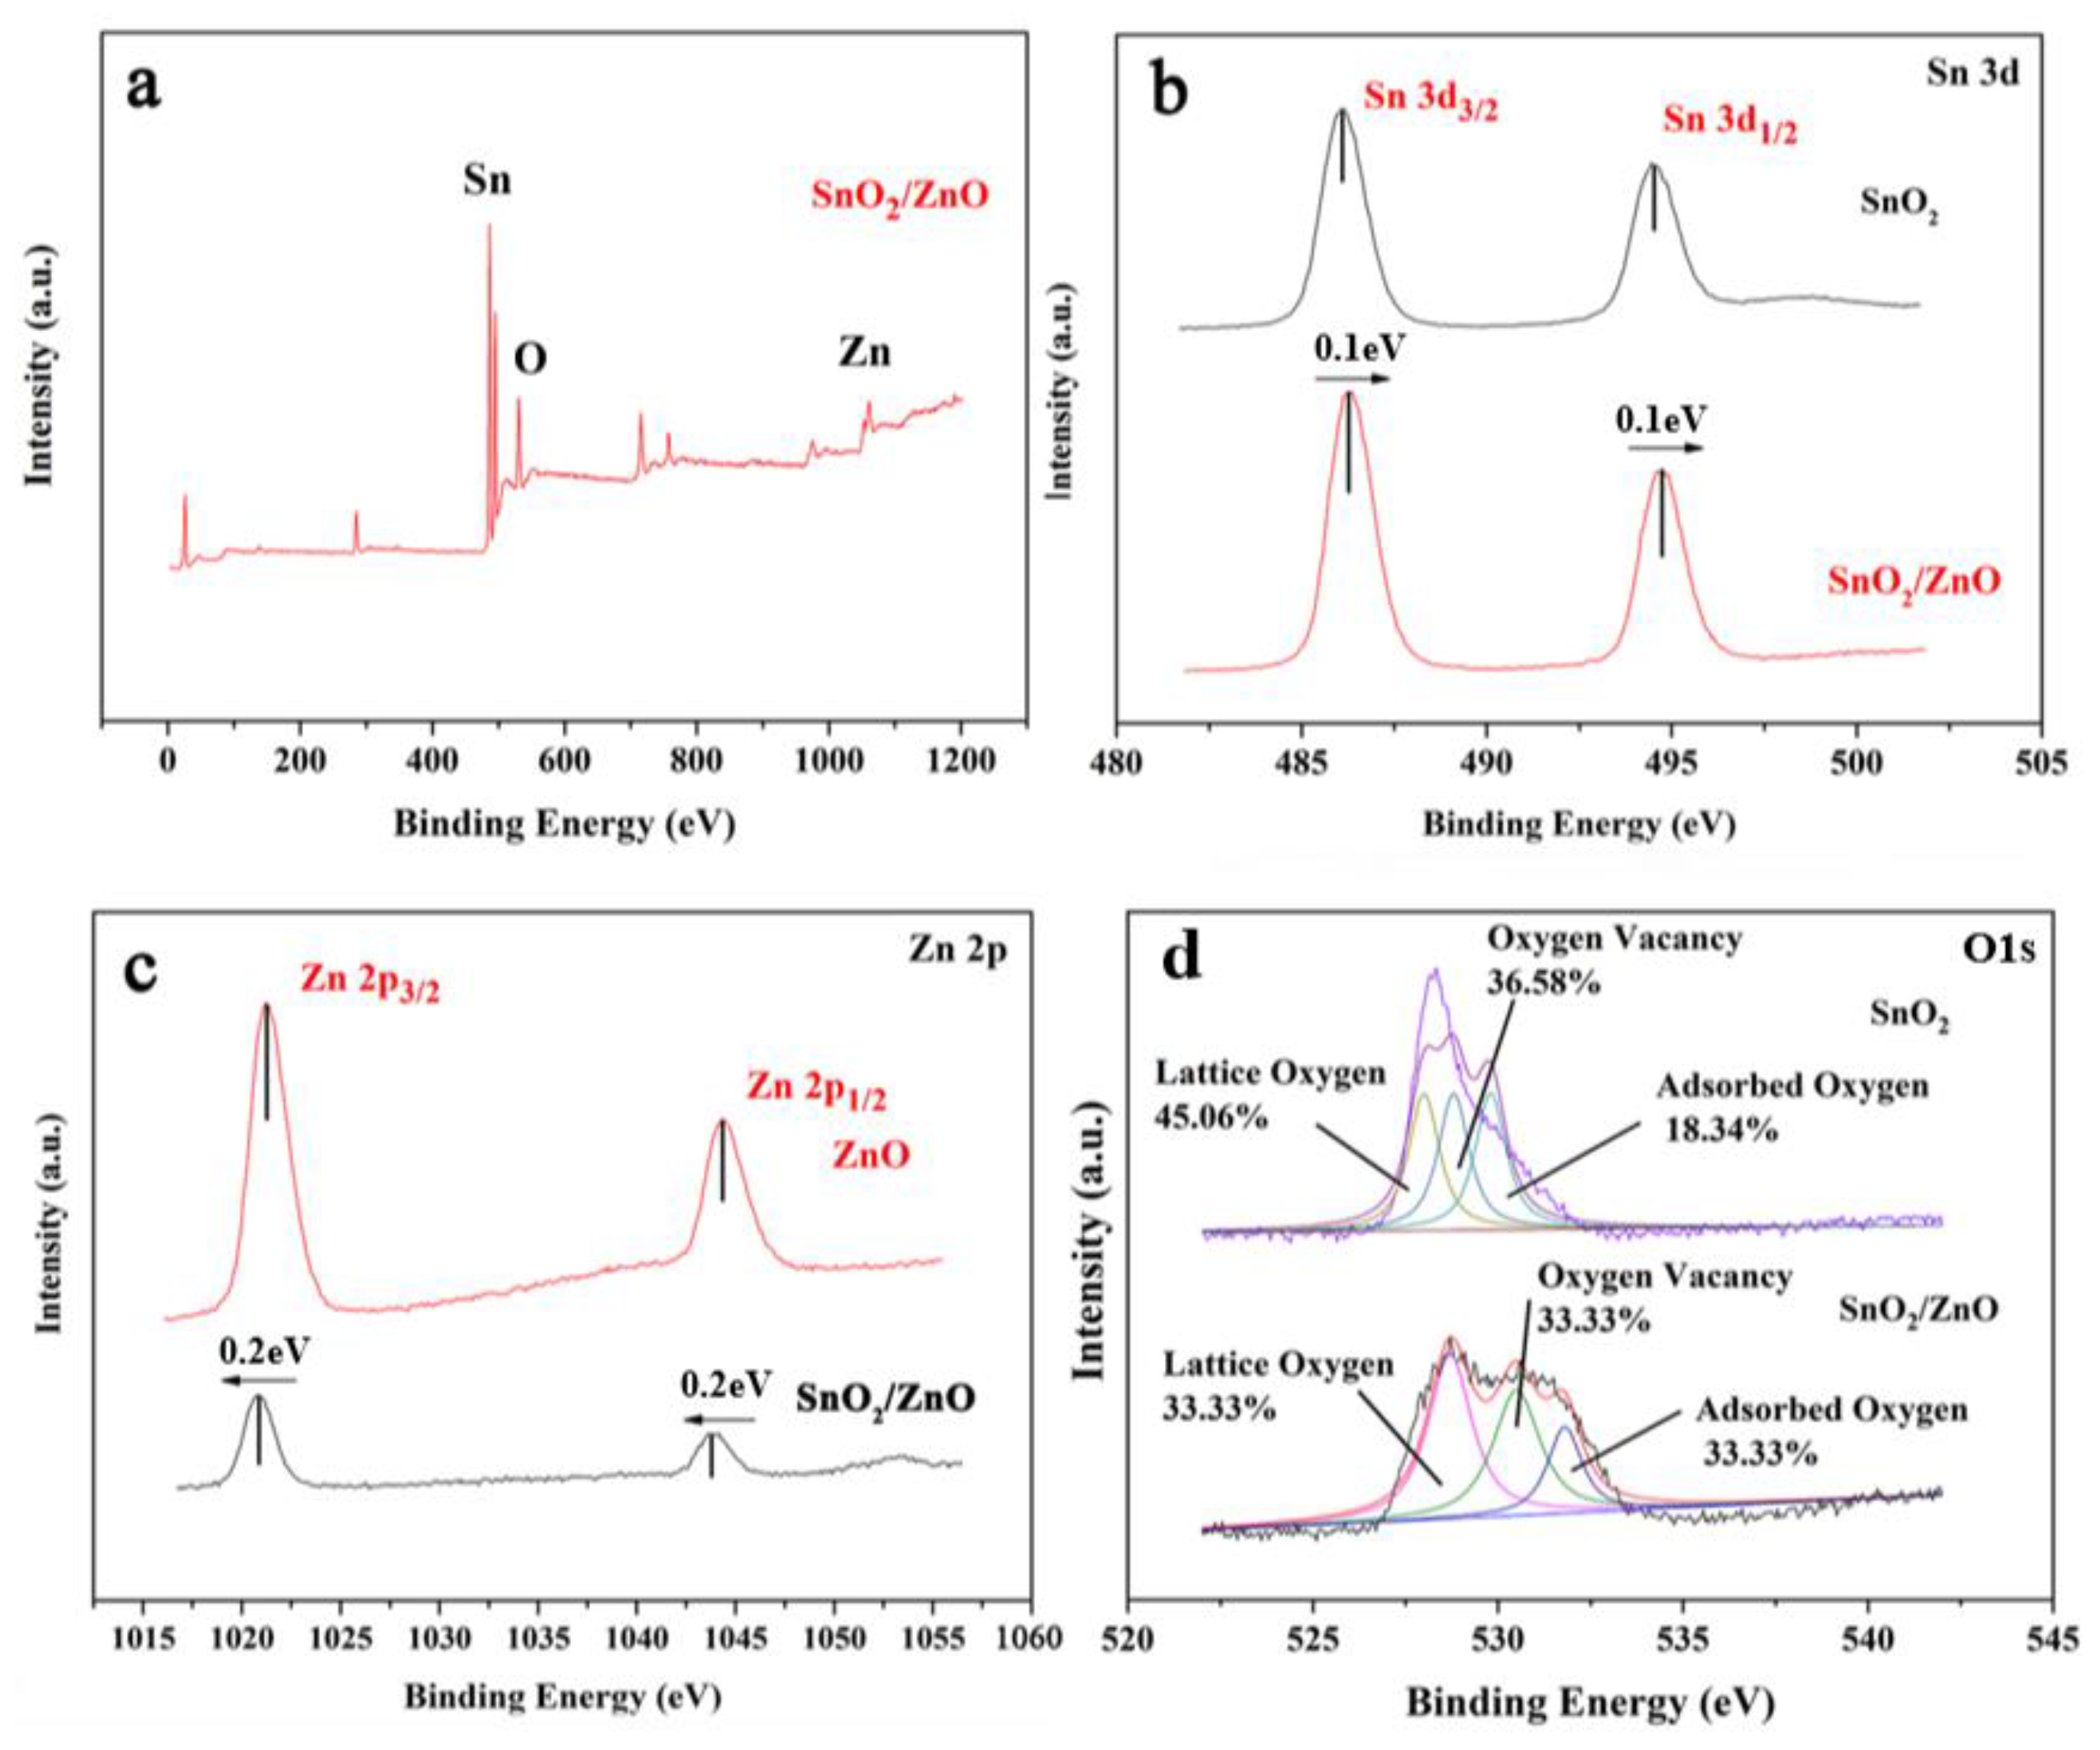
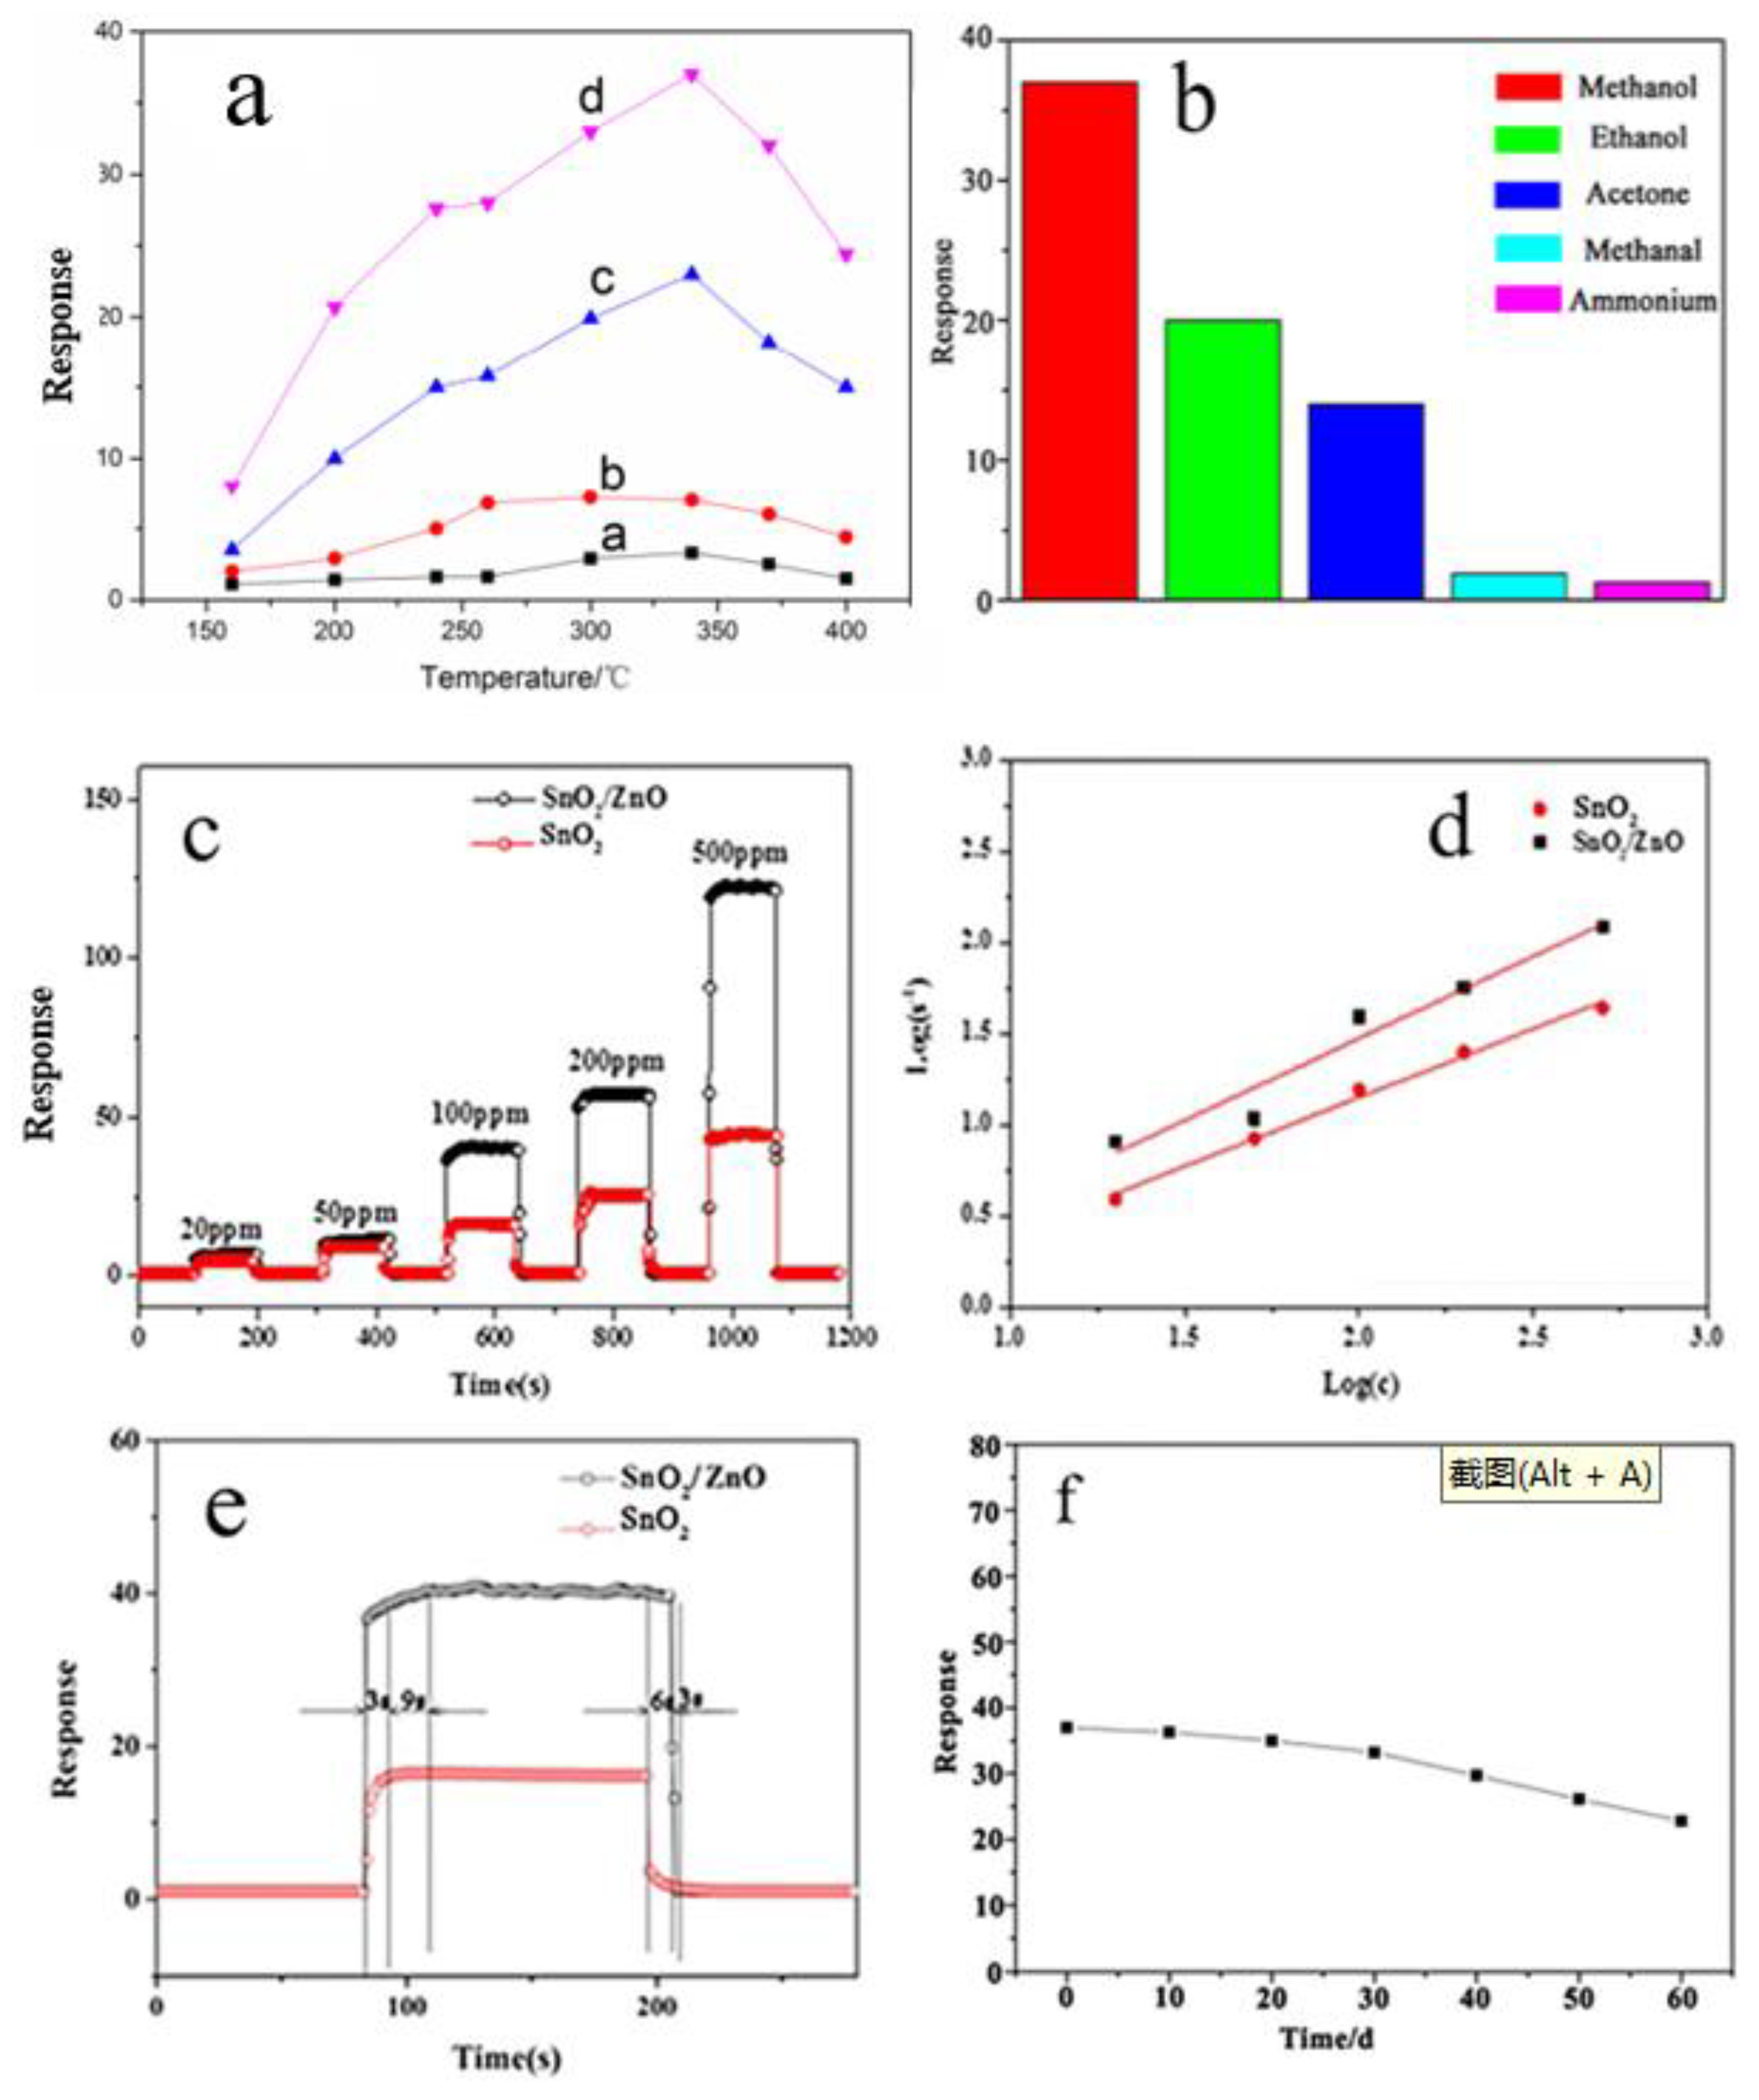
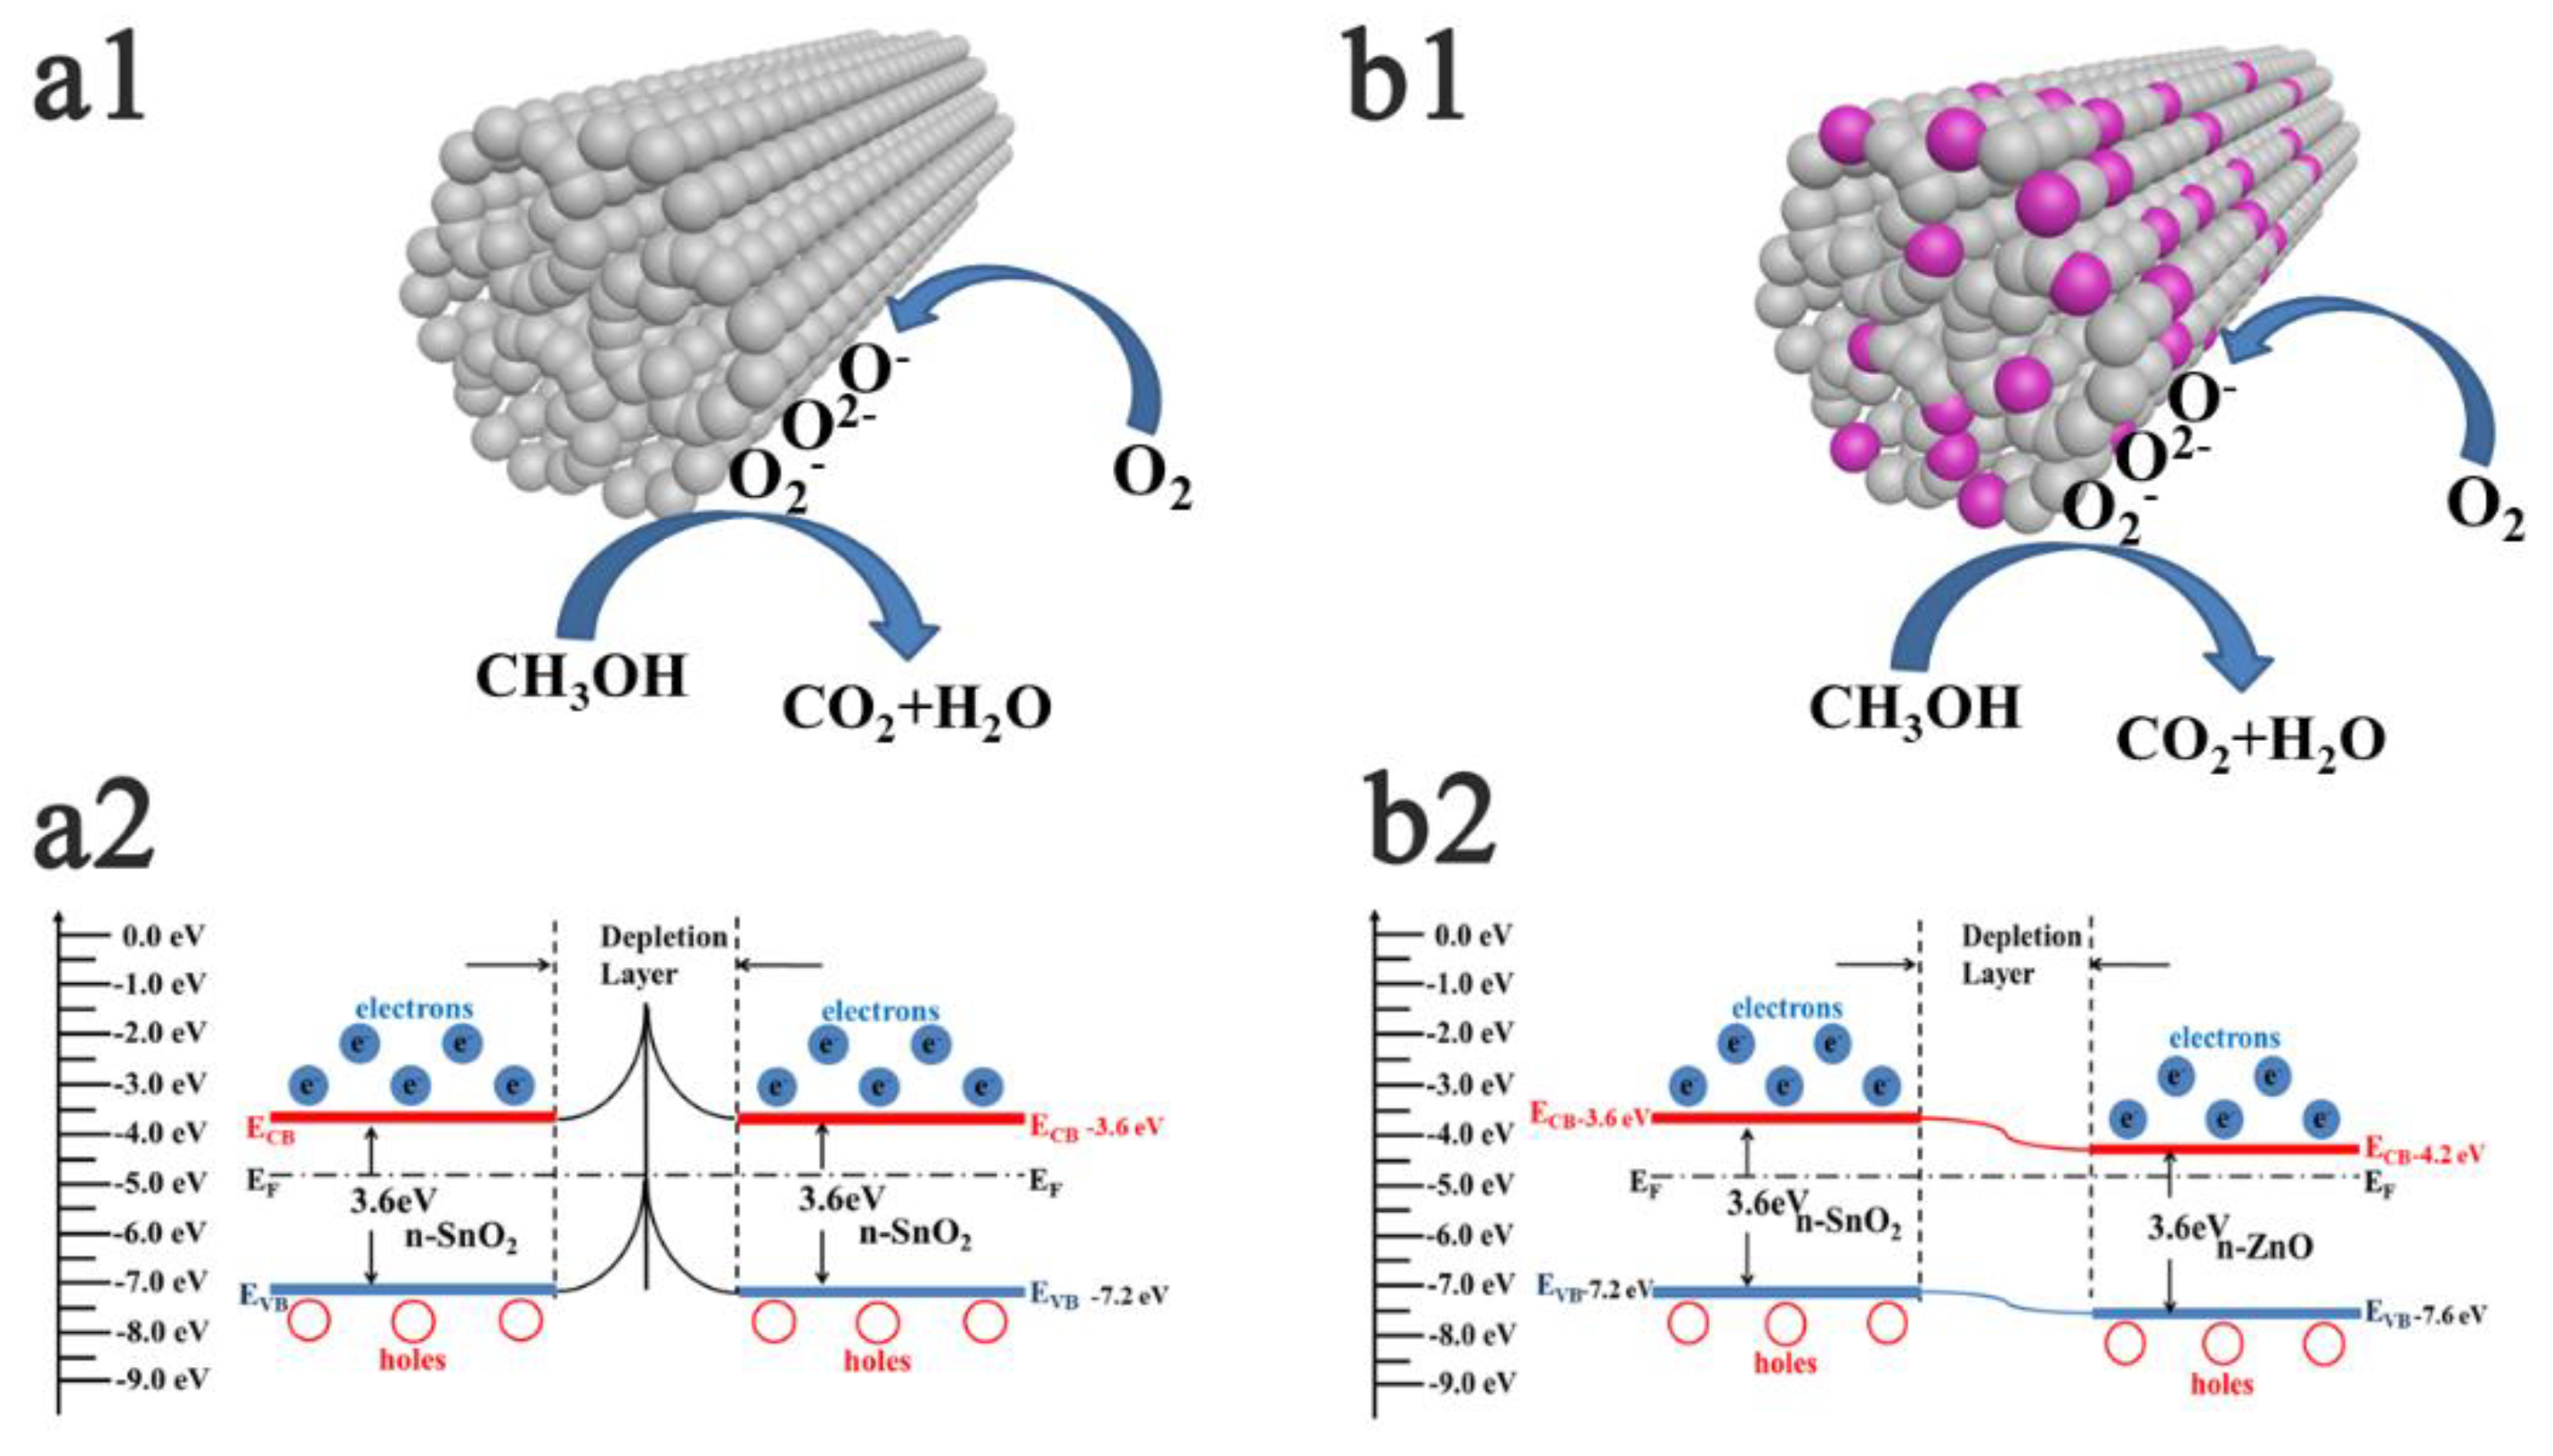
A novel hierarchical porous biomorphic ZnO/SnO has been facilely synthesized in one step using bagasse as bio-template. The structural features of the ZnO/SnO2 n–n heterostructures were characterized by X-ray diffraction (XRD), scanning electron microscope (SEM), transmission electron microscope (TEM), and X-ray photoelectron spectroscopy (XPS). The results revealed that the as-prepared ZnO/SnO2 retained the original pore morphology of the bagasse material, and the ZnO/SnO2 was demonstrated with higher sensing performance as compared with the pure SnO2. Particularly, when molar ratio SnO2:ZnO=1:1, the sensor displayed the highest response, showing an excellent response value of 37 under 100 ppm methanol at 340℃. Meanwhile, ZnO/SnO2 composite exhibit good gas selectivity and stability to methanol, which can mainly be attributed to the formation of n-n junctions between SnO2 and ZnO, high capability of absorbed oxygen species of the ZnO/SnO2 composite.

Keywords: 
;  ;  ;  ;  

1. Introduction

Gas sensor technology plays a major role for the future development, which shows a constantly increasing trend in the application field, especially in the industry and private sectors [1,2,3]. Currently, the mental oxide semiconductors, which have exceptional sensitivity, low detection limits, fast response and recovery, low fabrication cost, and excellent long-term stability, are widely used in environmental monitoring, health care, industrial safety, medical diagnostics, and other fields as gas sensors [4,5,6]. Semiconductors gas sensors have been developed based on limited kinds of n-type metal oxides, such as SnO2, ZnO, Fe2O3, In2O3[7,8,9,10]. SnO2 is a typical n-type transparent oxide semiconductor with a wide band gap of 3.6 eV. Its common crystal structure is the tetragonal system and with a spatial group. SnO2 has been recognized as an excellent material for the gas sensors, which holds high sensitivity, long service life and low cost [11,12,13]. Because the gas sensing performance of pure SnO2 cannot meet the needs of practical application, the gas sensing properties of single metal oxide SnO2 could be improved by the addition of noble metals such as Au, Ag, Pt and semiconductors like ZnO, TiO2, Fe2O3 were used [14,15,16,17]. ZnO can possess low resistance, high n-type concentration, high hole mobility, low lattice mismatch with SnO2, which were beneficial for the formation of n-n heterojunction with SnO2[18,19]. Moreover, since the gas sensitivity of gas-sensitive materials is also affected by the microstructure and morphology of the materials, it is a good option to improve the sensitivity of the detected materials by designing nanomaterials with large specific surface area and high porosity [20,21]. To date, many methods have been developed for the synthesis of nanostructures, such as hydrothermal/solvothermal synthesis, chemical etching, hard and soft templates to synthesize various forms of SnO2 materials, such as nanorods, nanoflowers, and nanospheres [22,23,24]. However, these synthesis methods generally suffer from the use of toxic solvents, complex handling methods, and expensive experimental equipment hindering the large-scale synthesis of the materials. Therefore, it remains challenging to synthesize nanomaterials with large specific surface area and high porosity in a cost-effective, facile and environmentally less hazardous manner.
In recent years, fabricating biomorphic inorganic materials using natural biomaterials as templates has attracted increasing attention [25]. Natural biological template such as cotton, wood, leaf, rice- husk, sorghum straw, pollen grain, and egg shell membrane are extensively used [26,27,28,29]. First, biotemplating can reproduce the genetic forms of natural materials, especially multilayer typologies, which are difficult to realize by other methods. On the other hand, biotemplates can also be modeled on certain biological structures, which guided the self-assembly of inorganic materials. Bagasse is a very abundant, cheap, and easily available agricultural waste, which can be used as a biological template because of its spontaneous porous structure with its high content of organic molecules that can bind to inorganic ions. Therefore, we attempted to merge the hierarchical porous structure of bagasse and the doping with transition metals towards oxide materials with new structure and composition, better suited for gas sensing application. So far, there have been no reports about use bagasse as a biological template.
In this paper, using bagasse as biological template, ZnO was chosen as a dopant for SnO2. We explore a method of synthesizing ZnO/SnO2 semiconductor, and develop the gas sensor by obtained ZnO/SnO2 semiconductor composite. In addition, we have systematically examined its enhanced gas sensing performance to methanol. The oxygen vacancy concentration and the working mechanism of n-n heterojunction were analyzed by transmission electron microscopy (TEM) and X-ray photoelectron spectroscopy (XPS) characterization, and the gas sensing mechanisms of SnO2 and ZnO/SnO2 nanocomposites were investigated, which are expected to be generalized to the preparation of other biopolycrystalline porous metal oxide gas sensing materials.

2. Materials and Methods

2.1. Synthesis of ZnO/SnO2

The bagasse was placed in a distilling flask and then heated in boiling 5% dilute ammonia for 4 h to remove the lignin and hemicellulose in the bagasse. The extracted bagasse was washed by deionized water to pH ≈ 7. The rinse steps should be repeated three times as above and then dried at 60 ◦C for 12 h.
In a typical preparation of precursor solution, 1.753g SnCl4•5H2O were dissolved in 100 ml of anhydrous ethanol, then processed by ultrasonic shock instrument for 15 min. 1g of treated bagasse was infiltrated in the precursor solution for 24 h at room temperature, dried at 60◦C for 12 h. After that the bagasse was rinsed with distilled water for three times. The infiltration steps should be repeated two times as above and then be stored. Finally, the specimens were calcined in air at 550◦C for 4 h (heating rate:2◦C/min), and then stamped SnO2 powder was obtained.
Three 50mL Zn(C2H3O2)2 aqueous solutions, which concentrations were all 0.05mol/L, were prepared. Then 10mL of 5% ammonia water was added to the solution one by one, and the solution was fully stirred on the magnetic stirrer to dissolve, and then the solution was evenly dispersed in the ultrasonic oscillator. Then, the SnO2 powder of 0.2g, 0.04g and 0.02g prepared before were weighed respectively, and was successively added to the zinc acetate aqueous solution, fully stirred and ultrasonically dispersed. Finally, the mixed solution was transferred to a 100mL polytetrafluoroethylene reactor, and the reactor was placed in an oven at 140℃ for 2h. After the reaction, the reactor was cooled naturally, and when it was reduced to room temperature, the precipitate was washed with water and anhydrous ethanol several times, and centrifuge collected. The collected precipitate was placed in an oven at 60℃ to dry ZnO/SnO2, and labeled as Sn:Zn 1:1, Sn:Zn 1:0.5, Sn:Zn 1:0.1. Meanwhile, the synthesis steps for the ZnO samples were the same except that SnO2 was not added.

2.2. Characterization

The phase structure of crystal sample was characterized by an X-ray diffraction (XRD, Cu–Kα, Rigaku D-Max 2550). The morphologies were obtained by the XL-30 ESEM FEG Scanning Electron Microscope (FESEM). TEM and HRTEM images were acquired with the FEI Tecnai G2 F20 Microscope. The adsorption and desorption isotherm studied with liquid nitrogen were performed by the Micromeritics ASAP 2020 Surface Area and the Porosity Analyzer. The composition and contents of nanofibers were analyzed by the X-ray photoelectron spectroscopy (XPS: VG Scientific, UK) using Mg Ka radiation. The specific surface area was examined using a single point Brunauer–Emmett–Teller (BET) method.

2.3. Measurement of Gas Sensing Properties

Four electrodes of ceramic tube were welded aligned with four electrodes of the base. The resistance wire was crossed through the ceramic tube and the two ends of resistance wire were soldered on the corresponding electrodes.
The prepared sample powders were mixed separately with ethanol to a form of sticky pastes, which were then coated on the ceramic tube. Then the element was placed in the AS20 aging table for 24h to ensure that the materials were adhered with the surface of ceramic tube. Gas sensing tests were performed with a measuring system of KGS101H-R500M (Ming Xuan Electronics Co. Ltd., Changchun,China), which were processed statically. A 1000ml volumetric flask was dried in a drying apparatus and then chilled at the room temperature. The volatile liquid was absorbed by the sample injector and then was transferred rapidly to the 1000ml volumetric flask. Finally in order to make liquid volatilize quickly and fully mixed with air, the flask was covered by a cap and shaken for one to two minutes.
After the element was connected to the gas sensitive monitor, it was put in a Plexiglass box. Collection could be done by setting up parameters in the software, where Ra is the resistance of the sensor in air and Rg is the resistance of sensor in the volumetric flask. The gas-sensors response in our work was characterised as S=Ra/Rg. Ra and Rg are the resistance values of the gas sensor in air and target gas environment, respectively. The upper and lower limits were defined as the maximum and minimum concentrations of the gas that can be detected, respectively.

3. Results

3.1. Characterization

3.3.1. Structural Analysis

The XRD patterns of the prepared ZnO/SnO2, pure ZnO and pure SnO2 were shown in Figure 1. It can be seen that the characteristic peaks were indexed to the hexagonal wurtzite structure of pure ZnO, which agreed well with PDF#79-0207. Characteristic peaks of ZnO were powerful and sharp. It indicated that ZnO had a high crystallinity and a high sample purity. Likewise, characteristic peaks of SnO2 matched the positions of standard card PDF#71-0652. This result showed that SnO2 was of a tetragonal rutile structure with high sample purity. Compared with pure ZnO and pure SnO2, the characteristic peaks for all ZnO/SnO2 were more obviously appear. It can be seen that the doping of ZnO did not destroy the crystal texture of SnO2, meanwhile ZnO itself was not damaged as well. From Figure 1, it can be found that characteristic diffraction peak was significantly enhanced with the increasing of ZnO doping ratio. When the doping ratio in composite material was 1:0.1, the characteristic diffraction peaks of ZnO almost disappear. While the doping ratio was 1:1, the characteristic diffraction peak was the strongest. The average crystallite size of pure SnO2 was calculated to be about 5.5 nm and average crystallite size of ZnO/SnO2 was 23 nm based on Scherrer equation.

3.3.2. Morphological Analysis

Figure 2 shows the typical SEM images of pure SnO2 and ZnO/SnO2 (1:1) morphology. It can be seen that the sample retained the original pore morphology of the bagasse nest with the removal of the bagasse body. Figure 2c showed more detailed structure of the sample, indicating that many ZnO particles were attached to the flake structure, which made previously smooth surface of SnO2 no longer smooth. The diameter of ZnO nanoparticles was about 17 nm. The shape of the cross section can be clearly seen in the Figure 2c which demonstrates that the bagasse samples have been completely remained. To further prove the complete removal of bagasse templates and the material distribution, the Energy Dispersive X-ray Spectroscopy (EDS) analysis was done and the result was shown in Figure 2d. For the molar ratio of ZnO/SnO2 1:1 sample, the atomic mass of Sn was 118.71, and the atomic mass of Zn was 65.38. In the EDS spectrum, many peaks associated with object elements were clearly visible, which clearly indicates that there are no impure elements in the prepared sample.
TEM images showing the graded structure of ZnO/SnO2 of bagasse samples were in Figure 3. It can be seen that ZnO/SnO2 composites were composed of homogeneous particles and the average size was 17nm, which was consistent with the result of SEM images. From HRTEM image, it showed that SnO2 and ZnO form n-n heterojunctions with lattice fringes spacing of about 0.147 and 0.334, which corresponding to (101), planes of ZnO and (110) planes of SnO2, respectively. These tests confirmed the presence of heterojunctions of SnO2 and ZnO. The electron diffraction pattern in Figure 3a, it shown a discontinuous concentric circle arrangement, which indicated that the prepared ZnO/SnO2 composite is polycrystalline.

3.3.3. BET Analysis

The nitrogen adsorption–desorption isotherms and the pore size distribution curves of ZnO/SnO2 sample is presented in Figure 4. The sample exhibited an IV-type isotherm with H3-type hysteresis loop according to the IUPAC classification, indicating ZnO/SnO2 sample contained abundant mesopores distribution.
The contact area between the gas and the material in gas-sensitive functional materials was an important factor affecting gas-sensitive performance. The number of active points directly affect the sensitivity. Table 1 showed that with the increase of ZnO doping amount, the specific BET surface area of the material also increased. Combined with SEM images, it can be seen that this phenomenon was caused by dispersed spherical ZnO particles on the smooth surface of SnO2 material. These particles changed from a plane to a sphere, which increased the specific BET surface area of the composite material.

3.3.4. Composition Analysis

X-ray electron spectroscopy was used to characterize the elemental stats in composite materials (ZnO/SnO2 ratio =1:1) and the valence and the electronic structure of these elements. The wide-scan XPS photoelectron full spectrum of (Figure 5a) implied that ZnO/SnO2 sample consisted of Zn, Sn, C and O. The peak appeared at a binding energy of 485.8eV and 494.3eV (Figure 5b), corresponding to the Sn3d3/2 orbital and the Sn3d1/2 orbital, respectively, indicating that Sn in the composite material existed in the form of Sn4+. It can be seen from Figure 5b that the doping of ZnO reduced the binding energy of Sn3d, the electron cloud density of Sn became larger, resulting in an enhanced electron-withdrawing ability. Figure 5c showed that the peak appeared at a binding energy of 1042.8ev and 1020.1ev, attributed to to the Zn2p1/2 and the Zn2p3/2 l, respectively, which indicated that Zn in the complex was in the form of Zn2+. It can be seen from Figure 5c that after ZnO doping, the binding energy of SnO2 increased, which was due to the decrease in electron cloud density, resulting in an increase in electron-promoting ability. Above results proved that the existence of the ZnO/SnO2 heterostructure and n-n heterojunction forming on the interface. In addition, as shown in Figure 5d, the O1s spectrum of the composite material can be fitted into one peak at 531.85eV. O in the composite material was in the form of O2-, which belonged O of Zn-O and Sn-O. After fitting, it can be found that the peak area of the adsorbed oxygen of the composite material was significantly increased, indicating the amount of adsorbed oxygen in the composite material and enhanced oxidizing power.

3.2. Gas Sensing Properties

The response value of the gas sensitive material to the target gas is closely related not only to the gas sensitive operating temperature, but also to the doping amount of the gas sensitive material. Figure 6a showed the response curves of pure SnO2 and a series of ZnO/SnO2 composites with hierarchical structure to methanol (100ppm) at different operating temperatures. It can be seen that the response value increased with the increase of temperature from 150 o C to 340 o C, then reached the peak value at 340 o C (except that the doping ratio = 1:0.1). The response value decreased at 37 when the temperature is higher than 340 o C. The ZnO doped samples have higher response value to methanol than the pure SnO2 samples. Among them, ZnO/SnO2 (ratio = 1:1) exhibited the best gas response. Thus, in in subsequent gas sensing properties experiments, 340 o C was chosen as the optimum operating temperature and ZnO/SnO2 (ratio = 1:1) was as gas sensors. Figure 6b showed the selectivity of gas sensors with ZnO doping ratio of 1:1 at an optimum operating temperature (340 o C) to different target gases of 100ppm. It shown that the maximum response value of ZnO/SnO2 (ratio = 1:1) to methanol, ethanol, acetone, methanal, and ammonium were 37、36.3、35、33.2、29.7、26.1 and 22.8 at 340 o C, which further indicated that ZnO/SnO2 had a good response value to methanol. Figure 6c displayed the dynamic response recovery curves of ZnO/SnO2 (ratio = 1:1) and SnO2 sensor exposed to methanol at different concentrations ranging from 20 to 500 ppm operated at 340 o C. The response value of ZnO/SnO2 (ratio = 1:1) to methanol increased gradually with the increase of concentration. The response value of the composite was positively correlated with the concentration of methanol. The response value of ZnO/SnO2 (1:1) element to 20, 50, 100, 500 and 1000 mg/L methanol are 15, 26, 37, 40 and 42, respectively, which were higher than that of SnO2 element. The response of metal oxide semiconductors gas sensors with the concentration of gases is usually expressed by Eq (1) [30], where S is the gas response, C is the concentration of the test gas, a and b are the constants. The logarithm of the value calculated from Eq (1).
S=a[C]b+1
Figure 6d showed the logarithm relationship of the response value of ZnO/SnO2 and SnO2 to methanol and the gas concentration. As shown in Figure 6d, the responses of ZnO/SnO2 and SnO2 sensors all had good linear relationships (the correlation coefficients were 0.9906 and 0.9365, respectively) with methanol concentrations varied from 20 ppm to 500 ppm in logarithmic forms. The slopes of the calibration curves of ZnO/SnO2 and pure SnO2 sensors to methanol were 0.75 and 0.89, which indicated ZnO/SnO2 samples had better gas sensitivity compared with pure SnO2. Figure 6e showed the comparison of response recovery time between pure SnO2 and ZnO/SnO2 samples. Response and recovery times of ZnO/SnO2 were 3 s and 3 s in the presence of 100 mg/L methanol, while that of pure SnO2 was 9 s and 6 s, respectively. This result indicated that the sensors of ZnO/SnO2 exhibited correspondingly high response, and fast response and recovery.
Figure 6f showed that the response value of composite materials to the 100ppm methanol atmosphere at 340 o C, and the test was conducted every 10 days. The results indicated that the response value of materials decreased slowly and steadily from day 1 to day 30, while it’s going down fast after day 30. The specific response value was 37, 36.3, 35, 33.2, 29.7, 26.1, and 22.8, respectively.
The gas-sensing mechanism based on n-type semiconductor metal oxides was elucidated by the surface charge theory [31,32], which mainly involved the gas adsorption, charge transfer and desorption process. As shown in Figure 7, upon exposure to air, oxygen molecules rapidly adsorbed on n-type semiconductor oxide SnO2, captured electrons from the conductance band of SnO2, and formed chemisorbed oxygen (O2- , and O-), increasing resistance due to a thicker electron depletion layer, at different operating temperatures. As methanol vapor was added to a test chamber, methanol molecules adsorbed on the SnO2 and ZnO/SnO2 surface reversed this effect by releasing the captured electrons thinning the depletion layer, and lowering resistance. By comparing the two results, the methanol gas sensing properties of the ZnO/SnO2 sensor were superior to those of its SnO2 counterpart (Figure 7). Similar to the effects of the mechanism mentioned above, these enhanced methanol sensing properties were possibly mainly due to a synergy among the effects of electronic, structural and chemical properties, such as the changes in electronic structure, the increasing number of oxygen vacancies and surface chemisorbed oxygen, and the methanol oxidation catalytic activity of SnO2.
In addition, another important factor for the enhancement of ZnO/SnO2 toward methanol vapor reaction was the high oxygen vacancy and surface chemisorbed oxygen concentration of ZnO/SnO2. The high content of oxygen vacancies in the material resulted in a high number of surface-active sites, where gas adsorption and reaction occurred. In addition, the additional chemisorbed oxygen contained in the material provided more reactants for the surface redox reaction, increasing the variation of sensor resistance.

4. Conclusions

Using bagasse as a bio-template, ZnO/SnO2 nanocomposites were successfully synthesized. Both ZnO/SnO2 and SnO2 maintained the original pore morphology of bagasse. The bio-template played a role in reducing the aggregation of the ZnO/SnO2 nanocomposites and uniformly distributing the n-n heterojunction throughout the material, which enhanced the gas-sensitizing properties. This simple bio-template synthesis route was expected to be generalized to the preparation of other biomorphic porous metal oxide gas sensing materials. The gas-sensitizing properties of the ZnO/SnO2 composites exhibited high selectivity and sensitivity. When molar ratio SnO2:ZnO=1:1, the sensor displayed the highest response, showing an excellent response value of 37 under 100 ppm methanol at 340℃. Mechanistic analysis showed that the application of bagasse templates reduced the aggregation of the nanocomposites, increased the concentration of oxygen vacancies and provided n-n heterojunctions, which together played an important role in enhancing the gas-sensitive properties.

Author Contributions

Zong-Lai Liu contributed to overall organizing of all experiments, and writing—original draft preparation. Chao Yang contributed to gas sensing properties experiments, data analysis. Bin Liu contributed to sample characteration and data analysis. Ya-Nan Chen contributed to sample preparation. Wei Feng contributed to providing ideas for all the experiments, methodology, and supervision. All authors have read and agreed to the published version of the manuscript.

Funding

This research was funded by the Jilin Science and Technology Development Planning Project [No.20210203006SF, YDZJ202201ZYTS630], the Sixth Batch of Young Science and Technology Talents Promotion Program of Jilin Province [QT202216] and the Educational Department of Jilin Province in China (No.JJKH20210304KJ) .

Data Availability Statement

Data are contained within the article.

Acknowledgments

We are grateful to all the authors for their contributions and financial help from the Jilin Science and Technology Development Planning Project [No.20210203006SF, YDZJ202201ZYTS630], the Sixth Batch of Young Science and Technology Talents Promotion Pro-gram of Jilin Province [QT202216] and the Educational Department of Jilin Province in China (No.JJKH20210304KJ).

Conflicts of Interest

The authors declare no conflicts of interest.

References

  1. Majhi, S.M.; Mirzaei, A.; Navale, S.; Kim, H.W.; Kim, S.S. Boosting the sensing properties of resistive-based gas sensors by irradiation techniques: A review. Nanoscale 2021, 13, 4728–4757. [Google Scholar] [CrossRef]
  2. Ji, H.; Zeng, W.; Li, Y. Gas sensing mechanisms of metal oxide semiconductors: A focus review. Nanoscale 2019, 11, 22664–22684. [Google Scholar] [CrossRef]
  3. Genner, A.; Martín-Mateos, P.; Moser, H.; Lendl, B. A Quantum Cascade Laser-Based Multi-Gas Sensor for Ambient Air Monitoring. Sensors 2020, 20, 1850. [Google Scholar] [CrossRef]
  4. Ciftyurek, E.; Li, Z.; Schierbaum, K. Adsorbed Oxygen Ions and Oxygen Vacancies: Their Concentration and Distribution in Metal Oxide Chemical Sensors and Influencing Role in Sensitivity and Sensing Mechanisms. Sensors 2022, 23, 29. [Google Scholar] [CrossRef]
  5. Phuoc, P.H.; Hung, C.M.; Van Toan, N.; Van Duy, N.; Hoa, N.D.; Van Hieu, N. One-step fabrication of SnO2 porous nanofiber gas sensors for sub-ppm H2S detection. Sens. Actuators A Phys. 2020, 303, 111722. [Google Scholar] [CrossRef]
  6. Ji, H.; Zeng, W.; Li, Y. Gas sensing mechanisms of metal oxide semiconductors: A focus review. Nanoscale 2019, 11, 22664–22684. [Google Scholar] [CrossRef]
  7. Jiang, Z.; Zhao, R.; Sun, B.; Nie, G.; Ji, H.; Lei, J.; Wang, C. Highly sensitive acetone sensor based on Eu-doped SnO2 electrospun nanoffbers. Ceram. Int. 2016, 42, 15881–15888. [Google Scholar] [CrossRef]
  8. Che, Y.; Feng, G.; Sun, T.; Xiao, J.; Guo, W.; Song, C. Excellent gas-sensitive properties towards acetone of In2O3 nanowires prepared by electrospinning. Colloid Interface Sci. Commun. 2021, 45, 100508. [Google Scholar]
  9. Islam, M.; Srivastava, A.K.; Basavaraja, B.M.; Sharma, A. “Nano-on-Micro” approach enables synthesis of ZnO nano-cactus for gas sensing applications. Sens. Int. 2021, 2, 100084. [Google Scholar] [CrossRef]
  10. Wang, Y.; Wang, Y.; Chen, S.-S.; Liu, C.; Chen, L.; Liu, Z.; Guo, Z. Chemiresistive sensor based on hollow Fe2O3 octahedrons incorporated into porous In2O3 nanofibers for enhanced sensing performance and recognition toward triethylamine. Sens.Actuators B Chem. 2023, 393, 134129. [Google Scholar] [CrossRef]
  11. Wawrzyniak, J. Advancements in improving selectivity of metal oxide semiconductor gas sensors opening new perspectives for their application in food industry. Sensors 2023, 23, 9548. [Google Scholar] [CrossRef] [PubMed]
  12. Wang, H. , Qua Y., Chen H., Lin Z., Dai K. Highly selective n-butanol gas sensor based on mesoporous SnO2 prepared with hydrothermal treatment. Sensors and Actuators B 2014, 201, 153–159. [Google Scholar] [CrossRef]
  13. Kim, J.-H.; Lee, J.-H.; Kim, J.-Y.; Mirzaei, A.; Kim, H.W.; Kim, S.S. Enhancement of CO and NO2 sensing in n-SnO2-p-Cu2O core-shell nanoffbers by shell optimization. J. Hazard. Mater. 2019, 376, 68–82. [Google Scholar] [CrossRef] [PubMed]
  14. Oztel, S.; Kaya, S.; Budak, E.; Yilmaz, E. Influences of Platinum Doping Concentrations and Operation Temperatures on Oxygen Sensitivity of Pt/SnO2/Pt Resistive Gas Sensors. J. Mater. Sci. Mater. Electron. 2019, 30, 14813–14821. [Google Scholar] [CrossRef]
  15. Bulemo, P.M.; Kim, D.-H.; Kim, I.-D. Controlled synthesis of electrospun hollow Pt-loaded SnO2 microbelts for acetone sensing. Sens. Actuators B Chem. 2021, 344, 130208. [Google Scholar] [CrossRef]
  16. Song, L.; Yang, L.; Wang, Z.; Liu, D.; Luo, L.; Zhu, X.; Xi, Y.; Yang, Z.; Han, N.; Wang, F.; et al. One-step electrospun SnO2/MOx heterostructured nanomaterials for highly selective gas sensor array integration. Sens. Actuators B Chem. 2019, 283, 793–801. [Google Scholar] [CrossRef]
  17. Liu, J.P. , Wang Y.Z., Wang L.Q., Tian H.W., Zeng Y., Controllable assembly of sandwich-structured SnO2/Fe2O3 multilayer nanosheets for high sensitive acetone detection, Mater. Lett. 2018, 221, 57–61. [Google Scholar]
  18. Kang, Y.; Yu, F.; Zhang, L.; Wang,W. ; Chen, L.; Li, Y. Review of ZnO-Based Nanomaterials in Gas Sensors. Solid State Ion. 2021, 360, 115544. [Google Scholar] [CrossRef]
  19. Li, H.; Chu, S.; Ma, Q.; Li, H.; Che, Q.; Wang, J.; Wang, G.; Yang, P. Multilevel Effective Heterojunctions Based on SnO2/ZnO 1D Fibrous Hierarchical Structure with Unique Interface Electronic Effects. ACS Appl. Mater. Interfaces 2019, 11, 31551–31561. [Google Scholar] [CrossRef]
  20. Ma, Z.; Yang, K.; Xiao, C.; Jia, L. Electrospun Bi-doped SnO2 porous nanosheets for highly sensitive nitric oxide detection. J.Hazard. Mater. 2021, 416, 126118. [Google Scholar] [CrossRef]
  21. Jiao, Z.; Wang, Y.J.; Ying, M.X.; Xu, J.Q.; Xu, L.Q.; Zhang, H.J. Copolymer-assisted fabrication of rambutan-like SnO2 hierarchical nanostructure with enhanced sensitivity for n-butanol, Mater. Chem. Phys. 2016, 172, 113–120. [Google Scholar]
  22. Vishnukumara, P.; Vivekanandhana, S. ; MisraM.; Mohanty A.K. Recent advances and emerging opportunities in phytochemical synthesis of ZnO nanostructures. Materials Science in Semiconductor Processing 80 (2018) 143–161.
  23. Wang, Y.; Zeng, Y.; Wang, L.; Lou, Z.; Qiao, L.; Tian, H.; Zheng, W. Ultrathin nanorod-assembled SnO2 hollow cubes for high sensitive n-butanol detection. Sensors & Actuators: B. Chemical 283 (2019) 693–704.
  24. Wang, X.; Wang, Y.; Tian, F.; Liang, H.; Wang, K.; Zhao, X.; Lu, Z.; Jiang, K.; Yang, L.; Lou, X. From the surface reaction control to gas-diffusion control: the synthesis of hierarchical porous SnO2 microspheres and their gas-sensing mechanism. J. Phys.Chem. C 2015, 119, 15963–15976. [Google Scholar] [CrossRef]
  25. Ding, J.; Zhang, G.; Dai, H.; Chen, H.; Fu, H. Gas sensor preparation based on green biological template: A review. Sensors & Actuators: A. Physical 2024, 366, 115051. [Google Scholar]
  26. Zhang, C.; Wang, J.; Hu, R.; Qiao, Q.; Li, X. Synthesis and gas sensing properties of porous hierarchical SnO2 by grapefruit exocarp bio-template, Sens. Actuators B 2016, 222, 1134–1143. [Google Scholar] [CrossRef]
  27. Cho, E.J.; Trinh, L.T.P.; Song, Y.; Lee, Y.G.; Bae, H.J. Bioconversion of biomass waste into high value chemicals, Bioresour. Technol. 2020, 298, 122386. [Google Scholar]
  28. Ren, P.; Qi, L.; You, K.; Shi, Q. Hydrothermal synthesis of hierarchical SnO2 nanostructures for improved formaldehyde gas sensing, Nanomaterials 2022,12 (2), 228.
  29. Wang, Y.; Cui, Y.; Meng, X.; Zhang, Z.; Cao, J. A gas sensor based on Ag-modified ZnO flower-like microspheres: temperature-modulated dual selectivity to CO and CH4, Surf. Interfaces 2021, 24, 101110. [Google Scholar] [CrossRef]
  30. Yamazoe, N.; Shimanoe, K. Theory of power laws for semiconductor gas sensors, Sens. Actuators, B. 2008,128 (2),566–573.
  31. Wei, Z.; Zhou, Q.; Wang, J.; Lu, Z.; Xu, L.; Zeng, W. Hydrothermal Synthesis of SnO2 Nanoneedle-Anchored NiO Microsphere and its Gas Sensing Performances. Nanomaterials 2019, 9, 1015. [Google Scholar] [CrossRef]
  32. Takata, M.; Tsubone, D.; Yanagida, H. Dependence of electrical conductivity of ZnO on degree of sintering, J. Am. Ceram. Soc. 1976, 59, 4–8. [Google Scholar] [CrossRef]
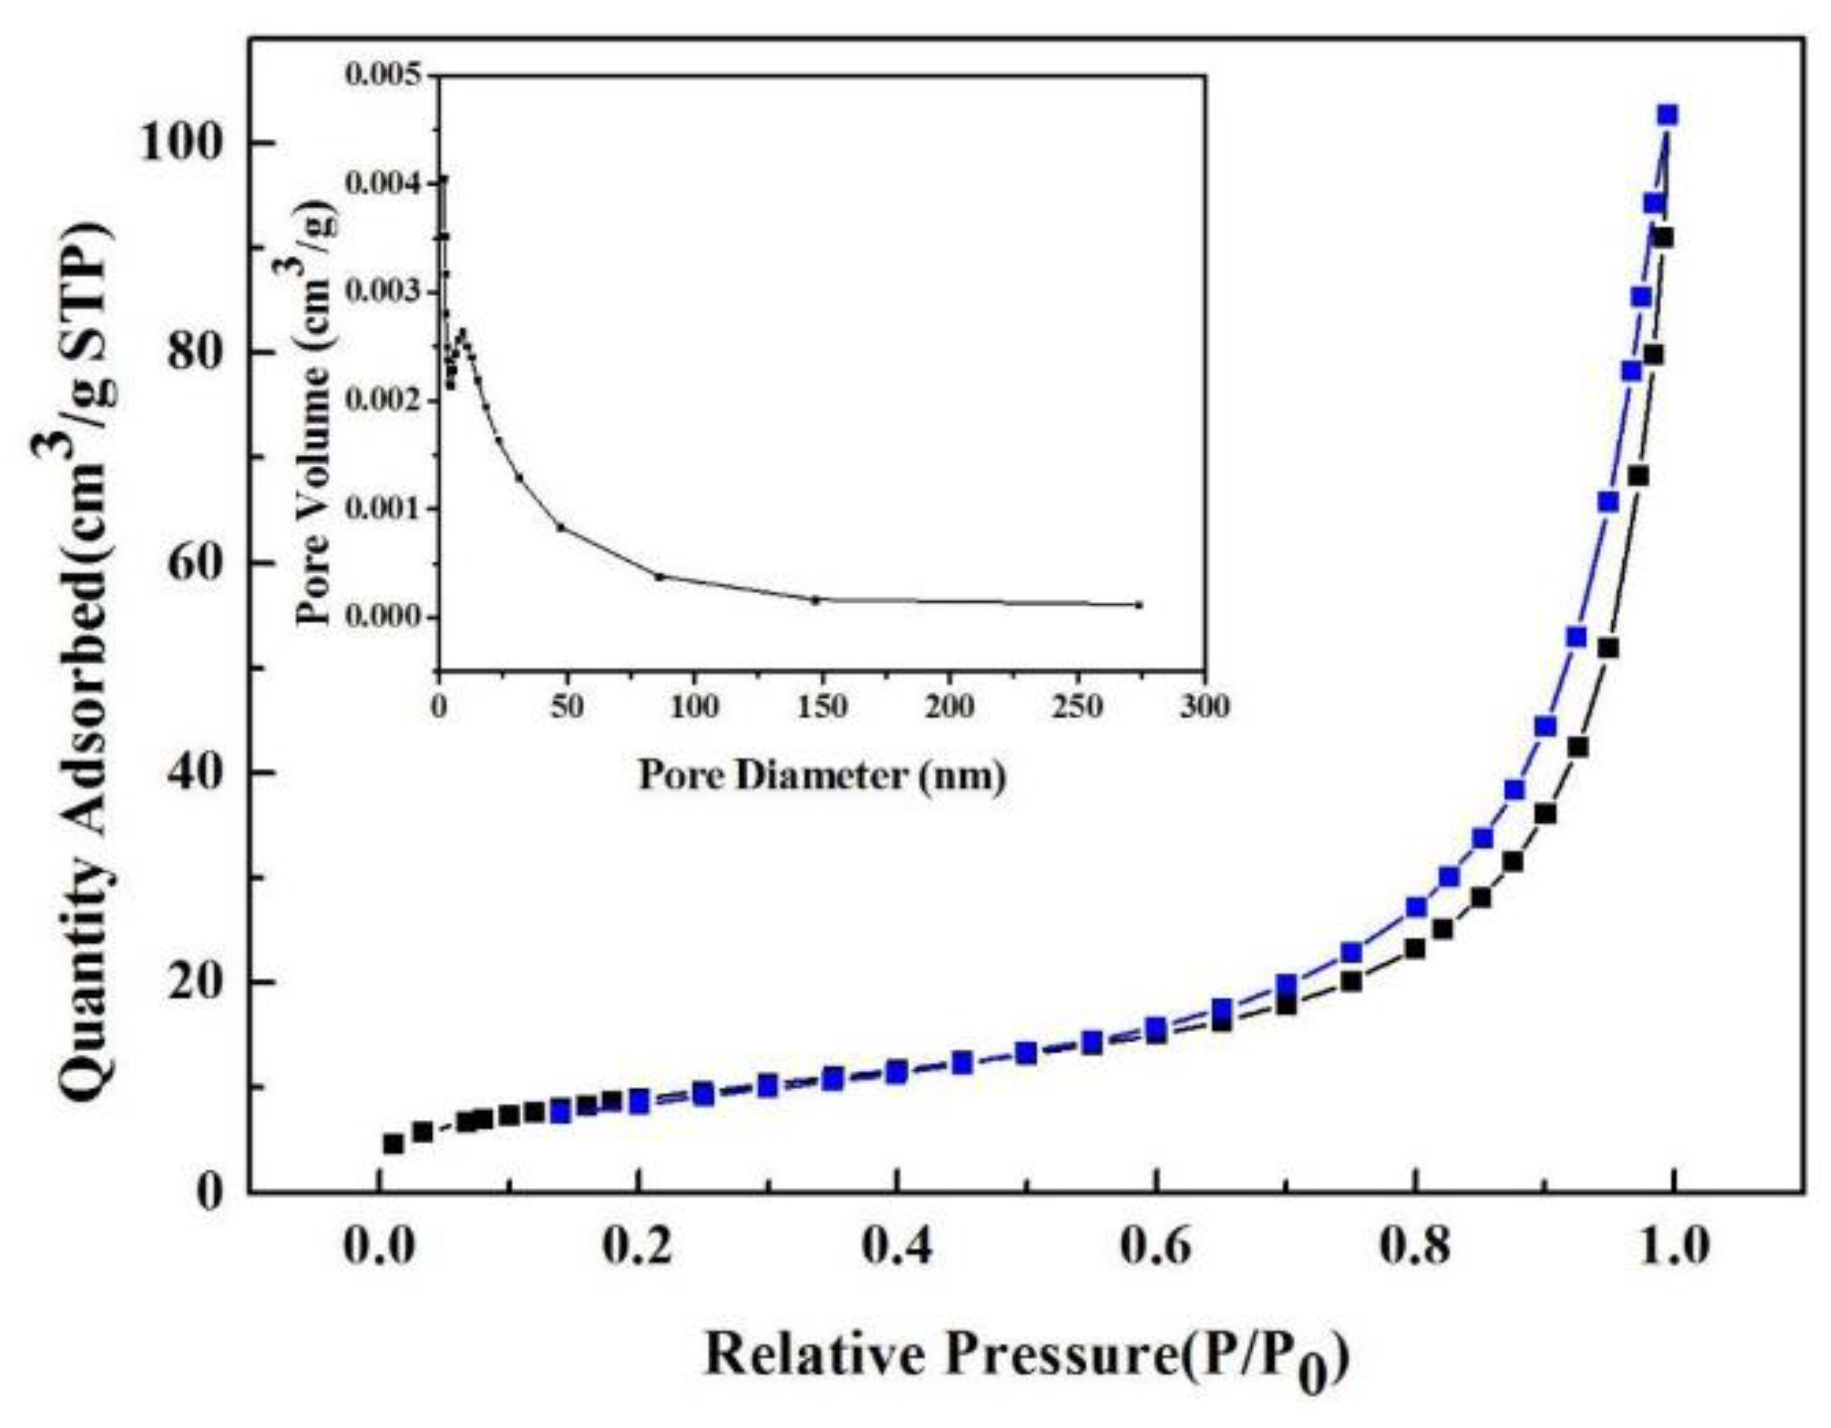
Figure 1. XRD metal oxide patterns for ZnO/SnO2 nanocomposites with different doping ratio and pure ZnO and SnO2.
Preprints 140840 g001
Figure 2. Field emission SEM (FESEM) images of: (a)SnO2, (b)ZnO/SnO2, (c)HRSEM of ZnO/SnO2 nanocomposite and (d) EDS spectra for ZnO/SnO2.
Preprints 140840 g002
Figure 3. (a) TEM images of ZnO/SnO2, (inset) SAED of ZnO/SnO2., (b) HRTEM of ZnO/SnO2.
Preprints 140840 g003
Figure 4. Nitrogen adsorption/desorption isotherm and BJH pore size distribution plot (inset) of the ZnO/SnO2.
Preprints 140840 g004
Figure 5. XPS spectrum of ZnO/SnO2(a)survey spectrum, (b) Sn3d spectrum, (c)Zn2p spectrum, and (d) O1s spectrum.
Preprints 140840 g005
Figure 6. (a) Response curves of ZnO/SnO2 samples with different ratios to methanol at different temperatures (a: SnO2; b:ZnO/SnO2=1:0.1; c: ZnO/SnO2=1:0.5; d: ZnO/SnO2=1:1). (b) Response curves of ZnO/SnO2 samples towards different target gases. (c) Response recovery curves of ZnO/SnO2 to methanol at different concentrations (d) Response of SnO2 and ZnO/SnO2 to methanol and gas concentration fitting curves (e) Response recovery time comparison charts of SnO2 and ZnO/SnO2 to 100 mg/L methanol (f)Stability of ZnO:SnO2=1:1 composite material (target gas: methanol, concentration: 100ppm, temperature:340℃).
Preprints 140840 g006
Figure 7. (a1) Gas sensitive reaction mechanism of SnO2, (a2) Change in band gap structure of SnO2 during gas-sensing reaction, (b1) gas-sensitive reaction mechanism of ZnO/SnO2 and (b2) The change in band gap structure of ZnO/SnO2 during gas-sensing reaction.
Preprints 140840 g007
Table 1. Specific surface of composites with different ratios.
SnO2 SnO2/ ZnO 1:0.1 SnO2/ ZnO 1:0.5 SnO2/ ZnO 1:1
BET(m2/g) 30.51 33.67 40.44 70.80
Disclaimer/Publisher’s Note: The statements, opinions and data contained in all publications are solely those of the individual author(s) and contributor(s) and not of MDPI and/or the editor(s). MDPI and/or the editor(s) disclaim responsibility for any injury to people or property resulting from any ideas, methods, instructions or products referred to in the content.
Copyright: This open access article is published under a Creative Commons CC BY 4.0 license, which permit the free download, distribution, and reuse, provided that the author and preprint are cited in any reuse.
Prerpints.org logo

Preprints.org is a free preprint server supported by MDPI in Basel, Switzerland.

Subscribe

Disclaimer

Terms of Use

Privacy Policy

Privacy Settings

© 2026 MDPI (Basel, Switzerland) unless otherwise stated