
Submitted:
25 November 2024
Posted:
25 November 2024
You are already at the latest version
Abstract
This study explores the characterization and application of poly(3-hydroxybutyrate-co-3-hydroxyvalerate) (PHBV) synthesized from organic residues, specifically milk and molasses. Six PHBV samples with varying 3-hydroxyvalerate (3HV) content (7%, 15%, and 32%) were analyzed to assess how 3HV composition influences their properties. Comprehensive characterization techniques, including NMR, FTIR, XRD, DSC, TGA, and tensile-stress test, were used to evaluate the molecular structure, thermal properties, crystalline structure, and mechanical behavior. Selected PHBV samples were fabricated into nanofibrous scaffolds via electrospinning, with uniform fibers successfully produced after parameter optimization. The electrospun scaffolds were further analyzed using DSC, GPC, and SEM. Biological evaluations, including cytotoxicity, in vitro drug release, and antibacterial activity tests, were also conducted. The results indicate that the electrospun PHBV scaffolds are biocompatible and exhibit promising properties for biomedical applications, such as tissue engineering and drug delivery. This study demonstrates the potential of using organic residues to produce high-value biopolymers with tailored properties for specific applications.
Keywords:
Poly(3-hydroxybutyrate)
; poly(3-hydroxybutyrate-co-3-hydroxyvalerate)
; polyhydroxyalkanoates
; electrospinning
; waste revalorization
; biopolymer
; bioplastic
1. Introduction
Polyhydroxyalkanoates (PHAs) are a diverse group of biodegradable polyesters naturally synthesized by bacteria through fermentation processes. This family includes over 150 different types, each distinguished by unique carbon side chains and monomer compositions that contribute to a wide range of physical and chemical properties [1,2]. PHAs have garnered significant attention as sustainable alternatives to conventional plastics because of their remarkable biodegradability and biocompatibility [3]. Among these, polyhydroxybutyrate (PHB) and poly(3-hydroxybutyrate-co-3-hydroxyvalerate) (PHBV) are the most studied because of their easier accessibility. However, commercially available PHBV typically contains a low 3-hydroxyvalerate (3HV) proportion (<5%). This composition leads to certain structural disadvantages as it considerably increases its properties of stereoregularity, crystallinity and rigidity [4]. These drawbacks are limiting their applicability specially when flexibility is required.
In response to these limitations, research has demonstrated that enhancing the 3HV content within PHBV can significantly increase its flexibility and toughness [5]. This enhancement occurs as the 3HV units interrupt the chain regularity of PHB, making the polymer more ductile and less rigid. Such modifications not only improve the polymer processability but also expand its range of applications. In the fermentation process, various strategies have been developed to achieve higher 3HV content, for example using specific microbes capable of producing high 3HV content, altering substrates such as adding valerate or propionic acid to favour 3HV production, and applying genetic engineering to modify bacteria for desired PHBV synthesis [6,7,8,9]. However, these approaches often lead to increased production costs or advances in technology that require significant research and development efforts to make them more cost-effective and scalable for industrial applications.
The use of industrial waste as substrate for PHBV production have been considered as an alternative approach to reduce the overall cost of production. Various industrial by-products, including agricultural residues, food waste, and other organic materials, have been identified as viable substrates for PHBV biosynthesis [10,11,12,13]. In this work, six PHBV samples with varying 3HV contents (7%, 15%, and 32%) derived from two different residues: milk and molasses, are evaluated and compared in terms of molecular structure, thermal properties, crystalline structure, and mechanical behavior. These agricultural and livestock by-products are rich in nutrients essential for bacterial growth and metabolism. Molasses contains a high concentration of sugars, primarily sucrose, which serves as an excellent carbon source for many bacteria, while milk provides lactose, proteins, and other nutrients beneficial for both carbon and nitrogen sourcing in microbial growth and PHA production. The use of these organic residues presents a cost-effective alternative for PHBV production, reducing the overall cost compared to using pure sugars or other more expensive substrates. Finally, fabrication of nanofibrous scaffolds with these PHBV samples through electrospinning technique is explored to evaluate their applicability in biomedical field.
Electrospinning is a versatile technique that allows the production of ultrafine fibers with high surface area-to-volume ratios and porosity. These attributes are critical for creating scaffolds that mimic the extracellular matrix, thereby promoting cell attachment, proliferation, and differentiation [14,15], which are essential for tissue engineering and other biomedical applications [16]. In this study, the electrospinning process parameters are optimized to achieve uniform fiber morphology. The resulting PHBV scaffolds are characterized using various techniques, including SEM for fiber morphology, DSC for thermal behaviour, GPC for assessing polymer degradation, and cytotoxicity tests to ensure biocompatibility. Additionally, in vitro drug release and antibacterial activity assays are conducted to evaluate the potential of these scaffolds for drug delivery applications.
By integrating sustainable PHBV production from organic residues with advanced electrospinning techniques, this research aims to develop cost-effective, high-performance biomaterials suitable for a range of biomedical applications, highlighting a promising approach to environmental sustainability and healthcare innovation.
2. Results and Discussion
2.1. Structural Analysis of PHBV Samples
2.1.1. FTIR Analysis
The FTIR spectra of representative PHBV samples (named by their 3HV content and source, e.g., 7HV_Milk corresponds to 7% of 3HV biosynthesized from milk residues) are presented in Error! Reference source not found. Despite the differences in 3HV content (7%, 15%, and 32%) and sources (milk and molasses), the spectra of all samples exhibit similar characteristic bands, confirming the consistent primary chemical structure of PHBV. Key bands include the C=O stretching of the ester group at 1720 cm⁻¹, and the C-H stretching vibrations of methylene and methyl groups at 2874 cm⁻¹, 2933 cm⁻¹, and 2975 cm⁻¹, which are consistent with earlier reports [17,18,19,20].
The intensities of the C-H peaks absorbed in the range of 3050–2800 cm-1 gradually increased with higher 3HV content, which is expected due to the increase in methylene side groups (Figure 1b). A detailed analysis of the C=O stretching peak reveals that it consists of a main peak and two minor peaks at 1740 cm⁻¹ and 1687 cm⁻¹ (Figure 1c). These correspond to the C=O vibration of the PHBV amorphous phase and hydrogen bonding interactions between the oxygen atom in the C=O group and the nearest hydrogen atom, respectively, as indicated by Kansiz et al. [18].
Other characteristics peaks include the -CH2- bending and -C-O-C stretching, observed at 1228 cm-1 and 1450 cm-1. Some authors have used these peaks to estimate the crystallinity content of PHBV samples, as these peaks are sensitive to the crystalline phase [21]. However, in this case, due to the complexity of the peak region, only minor variations in peak intensities can be attributed to differences in 3HV content.
2.1.2. XRD Results
The X-ray diffraction (XRD) patterns of PHBV samples derived from different feedstocks and varying 3HV contents are shown in Error! Reference source not found.. The diffraction patterns display peaks at 2Ɵ values of 13º, 16º, 21º, and 22º, corresponding to the (020), (110), (101), and (111) crystalline planes, respectively [22,23,24]. These reflections indicate the presence of an orthorhombic crystalline lattice with space group P212121. The corresponding d-spacings and lattice parameters a, b, and c are presented in Error! Reference source not found..
Figure 1.
XRD of PHBV samples derived from milk residues (black line) and molasses residues (red line) with (a) 7% 3HV, (b) 15% 3HV and (c) 32% 3HV.
Figure 1.
XRD of PHBV samples derived from milk residues (black line) and molasses residues (red line) with (a) 7% 3HV, (b) 15% 3HV and (c) 32% 3HV.
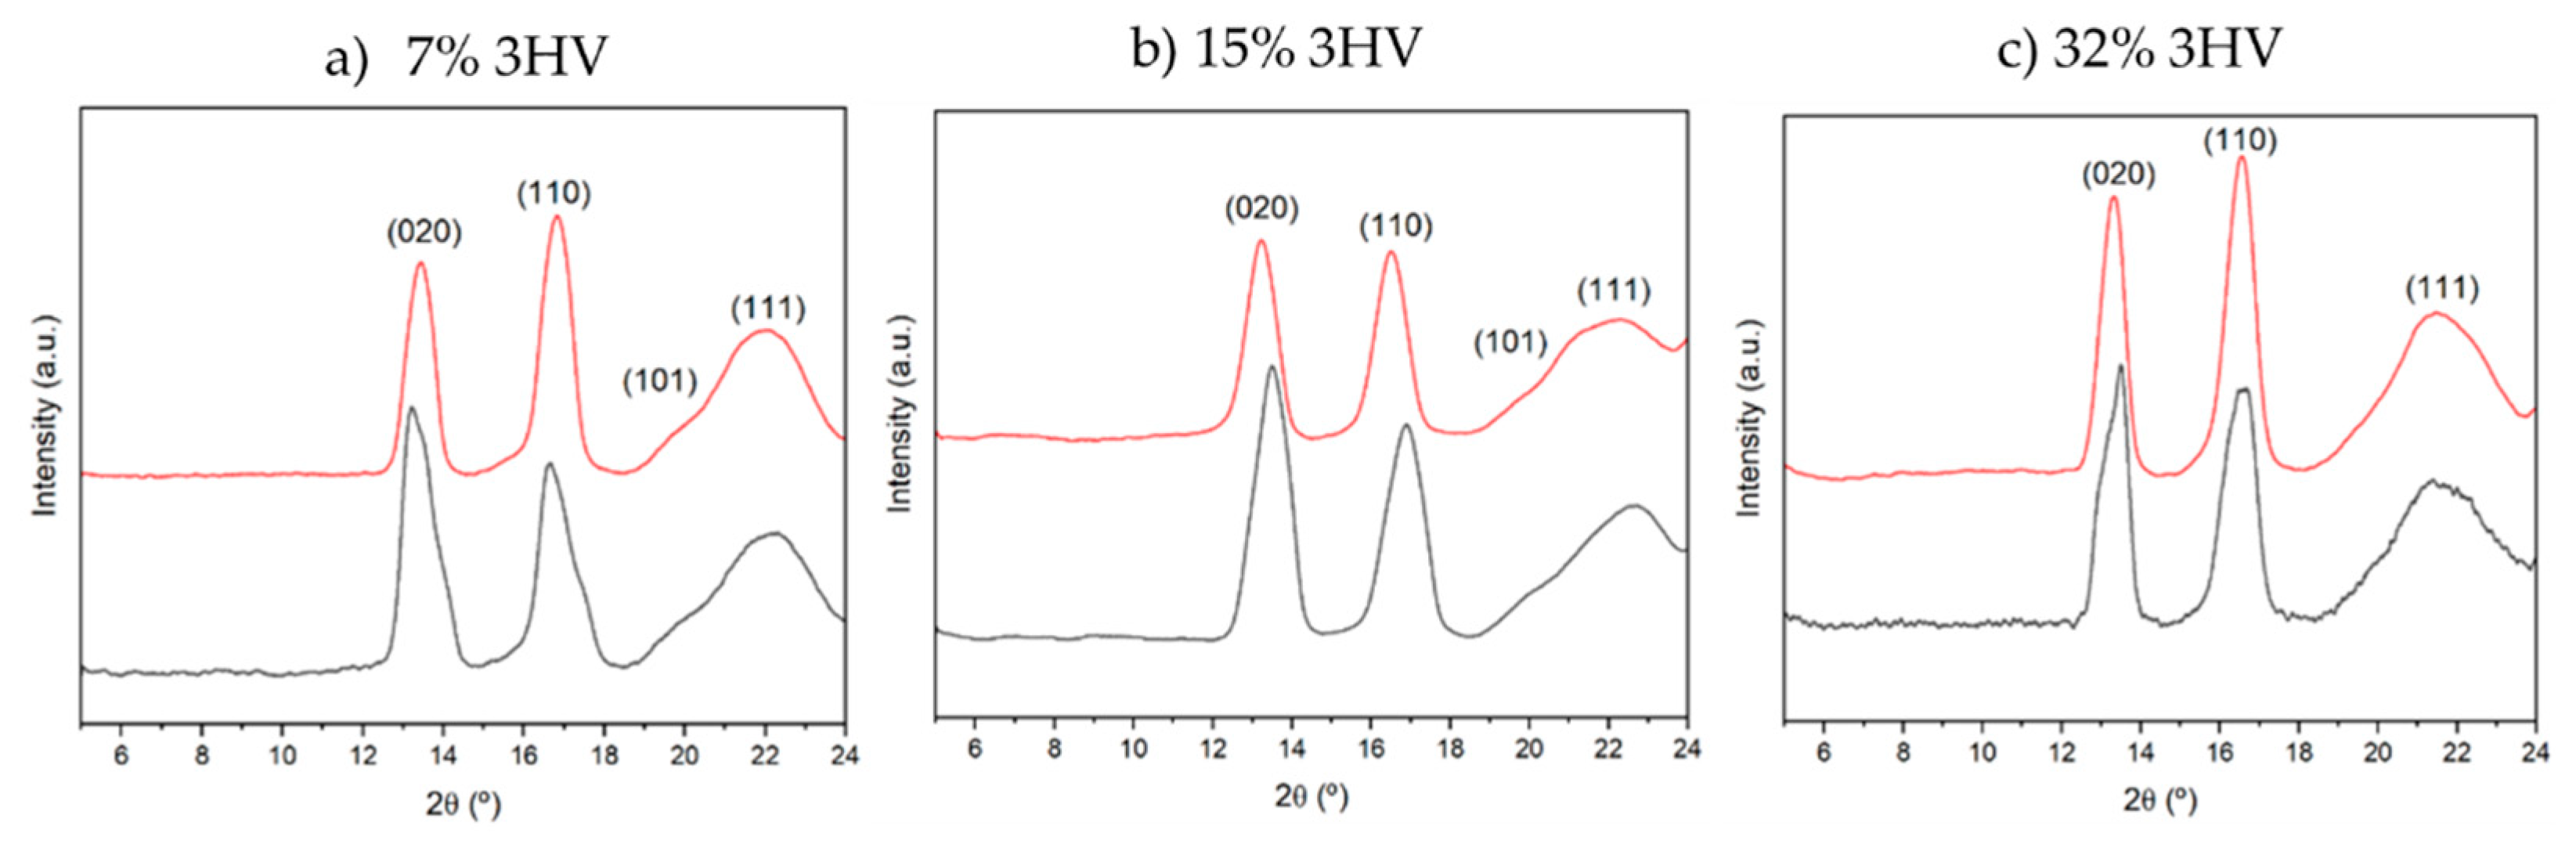

Table 1.
Crystalline lattice parameters a, b and c calculated from WAXS patterns.
| Samples | d(020) | d(220) | d(111) | a (nm) | b (nm) | c (nm) |
|---|---|---|---|---|---|---|
| 7HV_Milk | 0.670 | 0.531 | 0.401 | 0.578 | 1.339 | 0.611 |
| 7HV_Molasses | 0.654 | 0.524 | 0.392 | 0.572 | 1.308 | 0.591 |
| 15HV_Milk | 0.667 | 0.532 | 0.405 | 0.580 | 1.334 | 0.625 |
| 15HV_Molasses | 0.657 | 0.526 | 0.402 | 0.574 | 1.314 | 0.623 |
| 32HV_Milk | 0.665 | 0.534 | 0.410 | 0.583 | 1.330 | 0.640 |
| 32HV_Molasses | 0.663 | 0.530 | 0.413 | 0.578 | 1.326 | 0.659 |
The main trends observed in the studied series are as follows: a) The peak intensity of the (020) plane is higher than that of the (110) plane in samples derived from milk residues, but this is not the case for samples derived from molasses; b) The intensity of the (101) peak decreases as the 3HV content increases and also when the polymer is derived from molasses instead of milk. The loss of crystalline order, whether due to high 3HV content or the use of molasses as a feedstock, significantly affects the (101) diffraction peak; c) The variation in peak intensities suggests that the molecular alignment within the crystalline domains of PHBV favors the (020) plane for milk-derived samples, while it favors the (110) plane for molasses-derived samples. This trend is also reflected in the d-spacing and lattice parameters: for samples with the same composition, the d020 spacing is consistently larger in milk-derived samples compared to molasses-derived samples; d) The lattice parameters a and c increase with 3HV content for both milk and molasses-derived samples, with milk-derived samples generally exhibiting slightly larger a values. The parameter b behaves differently: it decreases with increasing 3HV content in milk-derived samples but increases in molasses-derived samples.
The variations in diffraction peak intensities, lattice parameters, and d-spacings reflect differences in molecular arrangement and the degree of crystallinity influenced by the feedstock. The larger intensity of the (020) peak, the larger d020 spacing, and the higher a parameter in milk-derived samples suggest a higher degree of crystallinity or preferred molecular alignment along the (020) plane. The increasing d110 and d111 spacings with higher 3HV content for both feedstocks indicate a consistent trend of expanding lattice dimensions.
2.1.3. NMR Analysis
The 1H NMR spectra of PHBV samples with varying 3HV content showed no significant differences between polymers derived from molasses and milk residues. Error! Reference source not found.a presents the spectra and assignments for the representative series derived from molasses. The B and V refer to the units of 3HB and 3HV, respectively. Due to the similar chemical environments, overlap occurs between the BH1 and VH1 protons (which belongs to the CH group) and between the BH2 and VH2 protons (CH2 group linked to the carbonyl group). Specifically, the BH1/VH1 protons appear around δ 5.1-5.4 ppm, while the BH2/VH2 protons appear at approximately δ 2.4-2.7 ppm. The spectra reveals that the multiplets attributed to BH2/VH2 and BH1/VH1 become increasingly complex as the 3HV content increases (Figure 3b,c), presumably due to the increased intensity of the VH2 and VH1 signals. Despite the variation in 3HV content, the chemical shifts of the proton peaks remain constant, corroborating the findings reported by Pramanik et al. [25]. Quantification of 3HV content within the PHBV copolymers can be achieved by integrating the area under the peaks corresponding to the methyl side chain of 3HB (BH3) at δ 1.2–1.3 ppm and the methyl side chain of 3HV units (VH4) at δ 0.9-1.1 ppm (Error! Reference source not found.).
The sequence distribution of PHBV derived from molasses with varying 3HV content was determined using 13C NMR spectroscopy. The spectra illustrated in Error! Reference source not found. show the chemical composition and magnified signals of each chemical group. According to previous studies, the distribution of monomer units in PHBV can be characterized as either diads (VB/VV) or triads (VBV/BVB/VVV/BBV), where V represents the 3HV unit and B represents the 3HB unit. The assignment of each peak is referenced in prior literature [26,27,28].
The most significant peaks in the 13C NMR spectra are shown in detail in Error! Reference source not found.b-g. The peak around 169 ppm (Error! Reference source not found.g) corresponds to the carbonyl carbon, which is split into three peaks representing the diads BB, VB/BV, and VV. The areas of these peaks are used to determine the sequence distribution of 3HV and 3HB comonomers by calculating the D parameter (D = (FVV*FBB) / (FBV*FVB), where F represents the relative mole fraction of each diad. According to the literature, copolymers are randomly distributed when D is close to 1. D values higher than 1 suggest a block-monomer distribution, while values lower than 1 are characteristic of alternating copolymer [29,30,31].
According to the results shown in Error! Reference source not found., samples with high 3HV content (32%) and those with low 3HV content (7%) derived from molasses residues are randomly distributed, with D values close to 1. However, samples with low 3HV content (7%) derived from milk residues exhibit block distribution, with a D value of 2.80. Similarly, both samples with 15% HV content show a tendency for block distribution, with D values of 2.67 for molasses-derived samples and 6.32 for milk-derived samples.
Other significant peaks include V2 at δ 38.6-38.8 ppm, V3 at δ 71.6-72.3 ppm, V4 at δ 26.6-27.2 ppm, and V5 at δ 9.2-9.8 ppm, which correspond to the V-centered triads. The intensities of these peaks increase with higher 3HV content in PHBV, as shown in Figure 4b-f. Additional peaks of interest are attributed to the carbons in the side chain and methylene group of 3HB (B2 at δ 41 ppm and B4 at δ 20 ppm). Due to their distinct chemical environments, these peaks do not overlap with 3HV units and appear as single peaks, likely due to the dominance of 3HB content.
2.2. Thermal Behaviour of PHBV Samples
2.2.1. DSC Calorimetric Data
Typical DSC curves of PHA copolymers are characterized by an unresolved double melting peak (between 144 ºC and 173 ºC) with distinctive relative intensities. This double peak arises from different lamellar populations, with the lower-temperature peak corresponding to primary thin crystals that can recrystallize into thicker crystals upon heating. The relative intensity between these peaks varies significantly depending on the stability of the primary crystals [32,33]. Several factors can influence the thermal properties of the PHBV series, including molecular weight, composition, and the type of residues used in bacterial fermentation.
Figure 5 shows the DSC traces (heating, cooling, and reheating) for a representative copolymer from the series with intermediate 3HV content (15%) obtained from milk and molasses residues. The copolymer derived from molasses was initially less crystalline and exhibited minimal crystallization during cooling (Figure 5b). However, it underwent cold crystallization during the second heating, resulting in a semicrystalline material (Figure 5c). In contrast, the copolymer obtained from milk showed easier crystallization, as evidenced by a crystallization peak detected during cooling and greater enthalpy (i.e., higher crystallinity) in both the first and second heating runs. This behavior is likely due to the block distribution of the copolymer, which enhances its ability to undergo crystallization.
Error! Reference source not found. compares the second heating trace of samples with varying 3HV content and feedstock. As expected, crystallinity decreases with increasing comonomer content, as the minor 3HV units hinder the crystallization process of the major component. The 3HV units are excluded from the crystalline regions, resulting in thinner crystalline structures with lower melting temperatures and reduced crystallinity [34,35]. However, as summarized in Error! Reference source not found., the sample with 15% 3HV (15HV_Milk) crystallized more quickly than the sample with 7% 3HV (7HV_Milk), exhibiting crystallization peaks at 97.1 ºC and 79.9 ºC, and crystallization enthalpies of 66.3 and 58.1 J/g, respectively. This anomaly is likely due to the high block distribution in the 15% 3HV samples (see Table 2), which enhances their ability to crystallize more rapidly despite the higher 3HV content. Additionally, the higher Tg observed for the 15% 3HV samples (3.8 ºC and 1.3 ºC for samples derived from milk and molasses, respectively) can also be attributed to the restricted mobility of the polymer chains due to the higher molecular weight and block distribution of monomers.
In summary, while the general trend indicates that increasing 3HV content reduces crystallinity, decreases melting and crystallization temperatures, the block distribution in the 15% 3HV sample overrides this trend, leading to enhanced crystallization behavior and higher crystallization and melting temperatures.
2.2.2. Thermal Degradation of PHBV Samples
The thermal stability of PHBV samples was assessed using TGA. Summarized data, including the temperatures at 5%, 50%, and 90% weight loss, as well as the residual mass at 310 ºC, are presented in Error! Reference source not found.. The TGA curves of percentage weight evolution for PHBV samples with varying 3HV content, separated by feedstocks, are shown in Error! Reference source not found.a for samples derived from milk residues and Error! Reference source not found.b for those derived from molasses residues.
In general, the copolymers exhibited moderate thermal stability, with the temperature corresponding to a 5% weight loss ranging from 232 ºC to 279 ºC. Decomposition consistently occurs in a single step, completing between 280-310 ºC. Degradation appears to be more pronounced in the 3HB blocks, in agreement with the known low thermal stability of the P3HB homopolymer and its difficulty in processing from the melt state. Stability decreases as the 3HB content increases, which is evident when considering the onset decomposition temperatures (or temperatures at 5% weight loss). For instance, temperatures of 232 ºC and 269 ºC were observed for samples derived from milk residues with 3HV contents of 7% and 15%, respectively. Molecular weight also affects thermal stability, with enhanced decomposition detected in samples with lower molecular weights (e.g., compare the stability of samples with 15% and 32% 3HV units).
According to Error! Reference source not found. and Error! Reference source not found.c, samples derived from molasses residues exhibited greater thermal stability (higher degradation peak in the DTGA plot) than their milk-derived counterparts. The reduced thermal stability of the milk-derived samples may be attributed to the lower stability of the 3HB blocks. The residual weight percentages at 310 ºC ranged from 2.1% to 5.3% for samples derived from milk, while those from molasses varied only between 1.4% and 1.8%. These residues might result from insufficient purification during upstream processing, which could leave impurities that accelerate the degradation of PHBV samples.
Figure 7.
TGA plots of PHBV samples with varied 3HV content and derived from milk (a) and molasses (b) residues; (c) DTGA curves of samples derived from milk (blue line) and molasses (red line) residues.
Figure 7.
TGA plots of PHBV samples with varied 3HV content and derived from milk (a) and molasses (b) residues; (c) DTGA curves of samples derived from milk (blue line) and molasses (red line) residues.
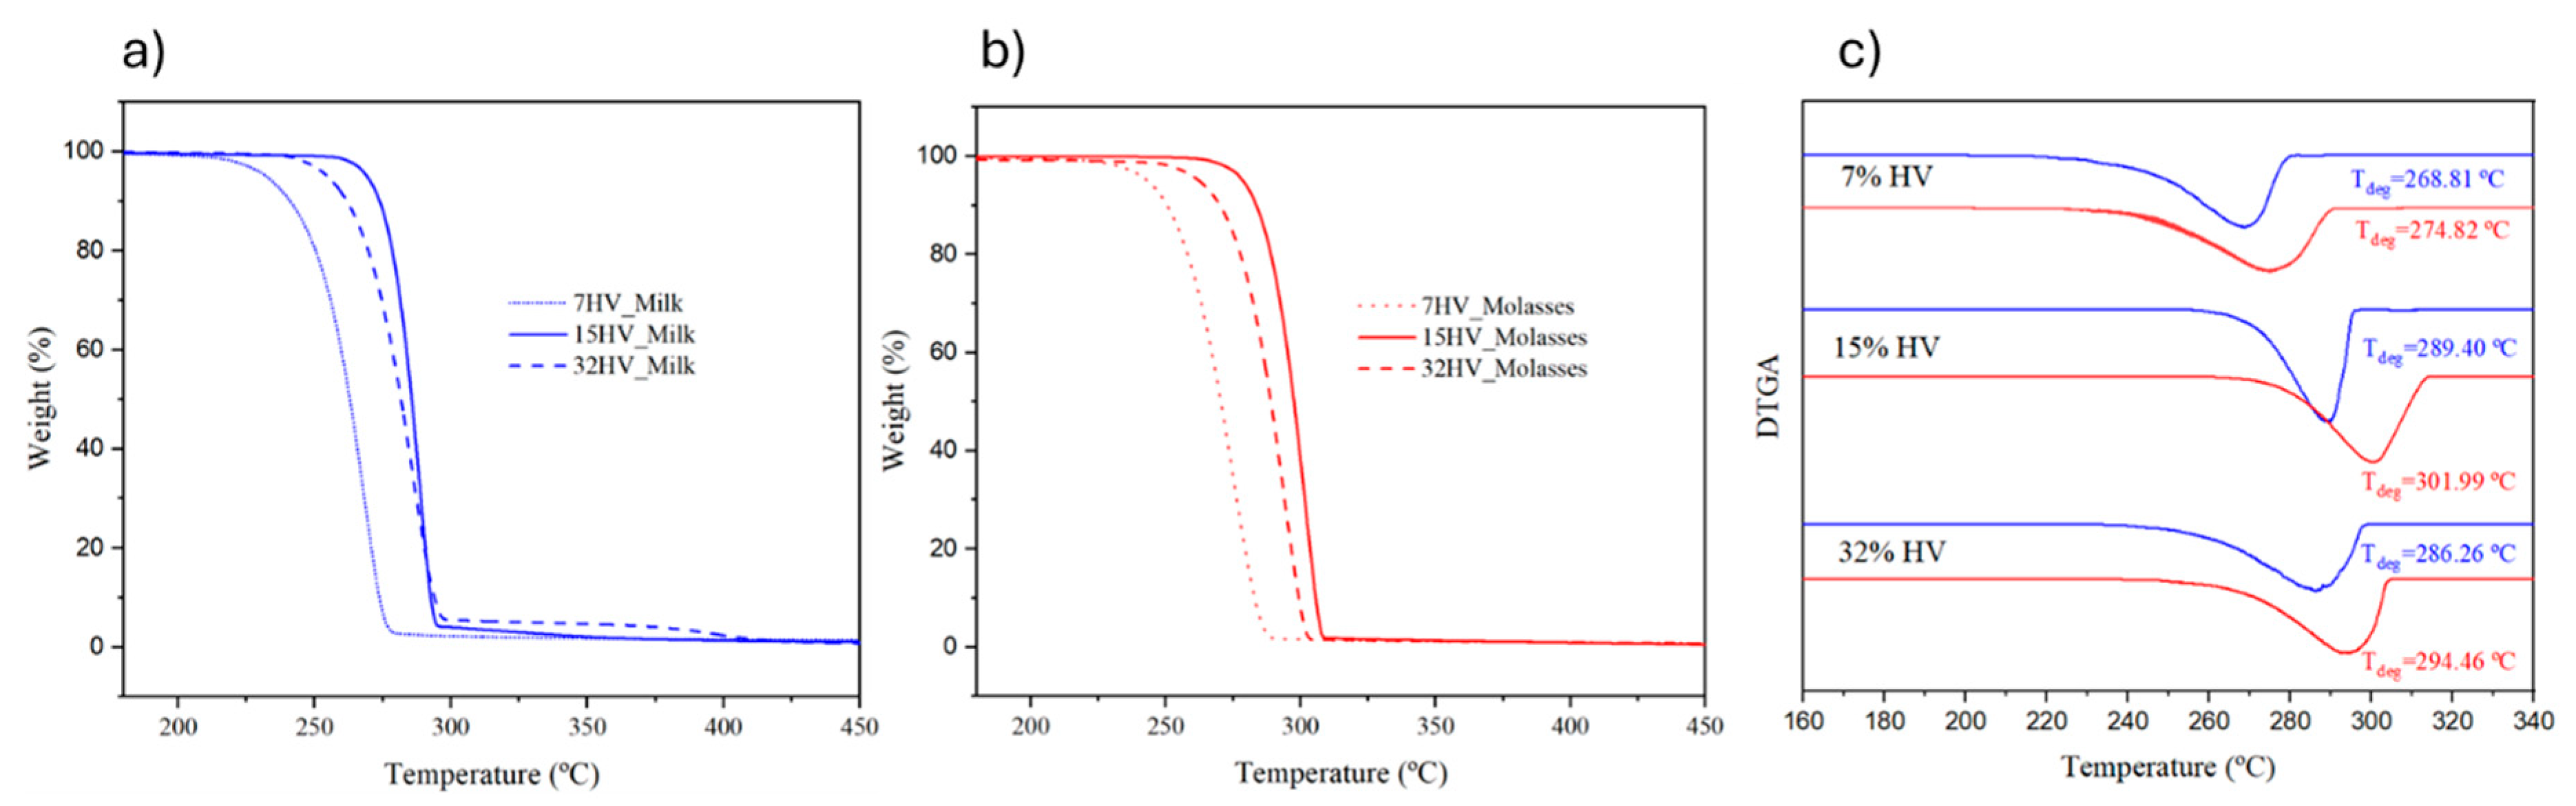
Table 4.
Degradation properties of PHBV samples.
| Sample |
T5% (ºC) |
T50% (ºC) |
T90% (ºC) |
Residue at 310 ºC (wt%) |
|---|---|---|---|---|
| 7HV_Milk | 232 | 263 | 274 | 2.1 |
| 7HV_Molasses | 243 | 270 | 283 | 1.4 |
| 15HV_Milk | 269 | 286 | 293 | 3.6 |
| 15HV_Molasses | 279 | 298 | 306 | 1.8 |
| 32HV_Milk | 255 | 287 | 294 | 5.3 |
| 32HV_Molasses | 262 | 289 | 299 | 1.5 |
2.3. Mechanical Properties of the PHBV Samples
The mechanical properties of PHBV samples derived from different sources with varying 3HV content were evaluated using film samples prepared by solvent casting. As shown in Error! Reference source not found. and Figure 8, the 3HV content directly influences the mechanical performance of PHBV. Specifically, increasing the 3HV content reduces the modulus from 1277 MPa to 230 MPa and the tensile strength from 18 MPa to 5 MPa, while elongation increases from 4% to 102%. This behavior indicates that higher 3HV content makes the samples less stiff and more ductile, as it increases the amorphous regions within the polymer matrix. This trend is consistently observed across both milk- and molasses-derived samples, demonstrating the tunability of PHBV properties through compositional adjustments.
When comparing PHBV samples derived from molasses and milk at the same composition, those from milk exhibit superior mechanical performance. The result aligns with the higher crystallinity observed in milk-derived samples, which is a consequence of their blocky structure.
Table 5.
Mechanical properties of PHBV film with varied 3HV content.
| Samples |
Modulus E (MPa) |
Tensile strength (MPa) | Elongation at break (%) |
|---|---|---|---|
| 7HV_Milk | 1277 ± 39 | 18.1 ± 0.3 | 4.3 ± 2.5 |
| 7HV_Molasses | 1129 ± 51 | 16.5 ± 0.4 | 4.1 ± 2.4 |
| 15HV_Milk | 920 ± 53 | 17.0 ± 0.4 | 8.1 ± 3.2 |
| 15HV_Molasses | 823 ± 47 | 16.1 ± 0.4 | 15.6 ± 3.1 |
| 32HV_Milk | 312 ± 59 | 7.1 ± 0.6 | 95.1 ± 8.1 |
| 32HV_Molasses | 230 ± 51 | 5.0 ± 0.5 | 102.4 ± 7.1 |
2.4. PHBV Electrospun Fibers
2.4.1. Electrospinning Process Optimization
Research indicates that the successful formation of PHBV fibrous scaffolds depends on key parameters such as polymer solution concentration, feeding rate, and applied voltage [36,37,38,39,40]. Specifically, these parameters were optimized for each PHBV sample to produce well-defined microfibers of appropriate size. The optimized parameters are presented in Error! Reference source not found., while Figure 9 illustrates their influence on a representative sample.
Table 6.
Optimized electrospinning condition for PHBV samples.
| Samples | Solution concentration (% w/v) |
Applied voltage (kV) |
Feeding rate (mL/h) | Fiber diameter (µm) |
|---|---|---|---|---|
| 7HV_Milk | 10 | 15 | 2 | 2.14 ± 0.27 |
| 7HV_Molasses | 10 | 15 | 2 | 2.49 ± 0.24 |
| 15HV_Milk | 15 | 15 | 2 | 2.34 ± 0.30 |
| 15HV_Molasses | 15 | 15 | 2 | 2.29 ± 0.35 |
| 32HV_Milk | 20 | 15 | 2 | 2.91 ± 0.37 |
| 32HV_Molasses | 20 | 15 | 2 | 2.70 ± 0.43 |
According to the optimized results, solution concentration is the most critical parameter for producing electrospun fibers of PHBV. Inadequate concentration can result in the formation of beaded fibers or, in some cases, prevent fiber formation entirely, regardless of how optimally the voltage or feeding rate is adjusted. For instance, samples with a higher 3HV content (e.g., 32%) require higher solution concentrations to achieve the necessary viscosity for fiber formation. As demonstrated in Figure 9a, beaded fibers are formed at low concentrations. It is important to note that viscosity plays a crucial role in successful fiber formation, as it directly affects the rate of solvent evaporation, a key factor in the electrospinning process. Higher feeding rates and increased applied voltage can lead to the formation of thicker fibers and increased entanglement.
2.4.2. Degradation During the Electrospinning Process
The variation in molecular weight of PHBV samples after scaffold formation via electrospinning was analyzed using GPC. The results illustrated in Error! Reference source not found. indicate no significant change for samples with lower molecular weights (200-300 kDa), with reductions being less than 10%. However, samples with higher molecular weights (above 500 kDa, specifically 15HV_Milk and 15HV_Molasses) exhibited a substantial decrease in molecular weight after the electrospinning process, with a reduction of nearly 40% in both cases.
The observed instability can be attributed to several factors. Higher molecular weight polymers have increased viscosity, which subjects them to greater shear stress during electrospinning, potentially leading to chain scission. Additionally, the electrospinning process itself involves high voltage and rapid solvent evaporation, creating thermal and mechanical stresses that make longer polymer chains more prone to breakage. The possibility of degradation during sample preparation (temperature, time, and agitation) was previously discarded to ensure that the observed molecular weight changes are specifically associated with the electrospinning process.
2.4.3. Morphology of PHBV Electrospun Fibers
The fiber morphology and diameter size were evaluated using SEM, as shown in the results presented in Figure 11. SEM images of PHBV electrospun fibers and their corresponding fiber distribution demonstrated that all PHBV samples successfully produced electrospun fibers with diameters around 2 - 3 microns, consistent with numerous studies on PHBV electrospun fibers [41,42,43]. However, several studies have reported average diameters below 1 micron [44,45,46,47,48]. This discrepancy is primarily due to the choice of solvent. Fibers with larger diameters were produced when chloroform was used while the fibers with smaller diameters were produced either by employing HFIP or a mixture of
DMF and chloroform. Basically, the choice of solvent is crucial for achieving the desired fiber size, while polymer concentration determines the quality of the fibers.
Additionally, the SEM images revealed differences in fiber surface morphology. Molasses-derived fibers such as 15HV_Molasses displayed more rugged and irregular surfaces with apparent textural inconsistencies compared to the smoother surfaces observed in milk-derived fibers (15HV_Milk). This disparity in surface roughness is likely related to differences in the crystallinity of the samples. Molasses-derived samples exhibit less crystallinity than milk-derived samples as they are randomly distributed molecular structures, which could lead to localized inconsistencies during the electrospinning process, resulting in the observed rugged morphology.
2.4.4. Thermal Behavior of PHBV Electrospun Fibers
Figure 12 represents DSC profiles obtained from the first heating cycle of PHBV samples derived from different residues with varying 3HV content, both before electrospinning and after forming electrospun fibers. The profiles illustrate notable differences in the thermal behavior of the samples, highlighting changes in crystallinity, melting temperatures, and peak complexity.
The DSC profiles of the electrospun fibers (shown with dashed lines) display lower complexity in their melting peaks compared to the original samples. This reduced complexity suggests that thicker crystals are directly formed during the electrospinning process. The alignment and rapid solidification of fibers likely facilitate the creation of more uniform crystalline structures, resulting in simpler and fewer peaks. Additionally, the electrospun fibers exhibit a slightly higher melting temperature, which is consistent with the presence of thicker crystals. Thicker crystalline regions are more thermally stable, requiring higher temperatures to melt.
Despite the improved alignment achieved through electrospinning, the DSC profiles indicate lower crystallinity in the electrospun fibers, with almost 20 J/g of enthalpy (∆Hf) reduced in each case. The reduction in crystallinity suggests that the electrospinning process hinders crystal formation, potentially due to the rapid solvent evaporation during fiber formation. The lack of sufficient time for the polymer chains to arrange into well-ordered crystalline states may hinder full crystallization, leading to an overall reduction in crystallinity compared to the original samples.
2.5. In Vitro Drug Release of PHBV Scaffolds
One of the key features of PHBV is its biocompatibility, making it suitable for biomedical applications [14,49], such as a release drug system. In this study, PHBV samples derived from molasses, with varying 3HV content, were selected to evaluate the incorporation of chloramphenicol (CAM) into scaffolds via electrospinning. The same process parameters presented in Error! Reference source not found. were used to produce CAM-loaded scaffolds. Samples from milk residues were excluded due to high residue content detected in TGA analysis (section 2.2.2). CAM was chosen for its antibacterial activity and because it has recently been suggested as a potential antitumor agent [50].
The UV spectra of CAM in PBS showed a characteristic band at 278 nm, which correlated with CAM concentration (Error! Reference source not found.a) to quantify the antibacterial drug in the release experiments. A calibration equation (y=8.688x) with a linear regression coefficient (r = 0.999) was established (Figure 13b). Three PHBV scaffolds loaded with CAM were immersed in buffer phosphate saline (PBS, pH of 7.2 – 7.4), and CAM release was monitored over time. The concentration of CAM released, calculated using the calibration curve, was expressed as a percentage (Error! Reference source not found.c). The PHBV scaffolds with low 3HV content released about 70%-80% of CAM within one day, while scaffolds with the highest 3HV content released only 40% after nine days. PHBV with 15% of 3HV reached nearly 50%-70% release within one day. In addition, the rapid initial release in the form of a burst stands out when the samples contain 7% or 15% 3HV; this release may be due to a low interaction between the drug and the polymer matrix.
These results suggest that CAM release is influenced by PHBV composition, with faster release from scaffolds with lower 3HV content. Conversely, a steady, prolonged release can be achieved with PHBV containing higher 3HV content, allowing for tailored release profile. The prolonged release may be related to the decrease in crystallinity and consequently the interaction of CAM with the amorphous phase of the polymer matrix could be favored [51,52,53,54].
2.6. Antibacterial Activity of PHBV Scaffolds
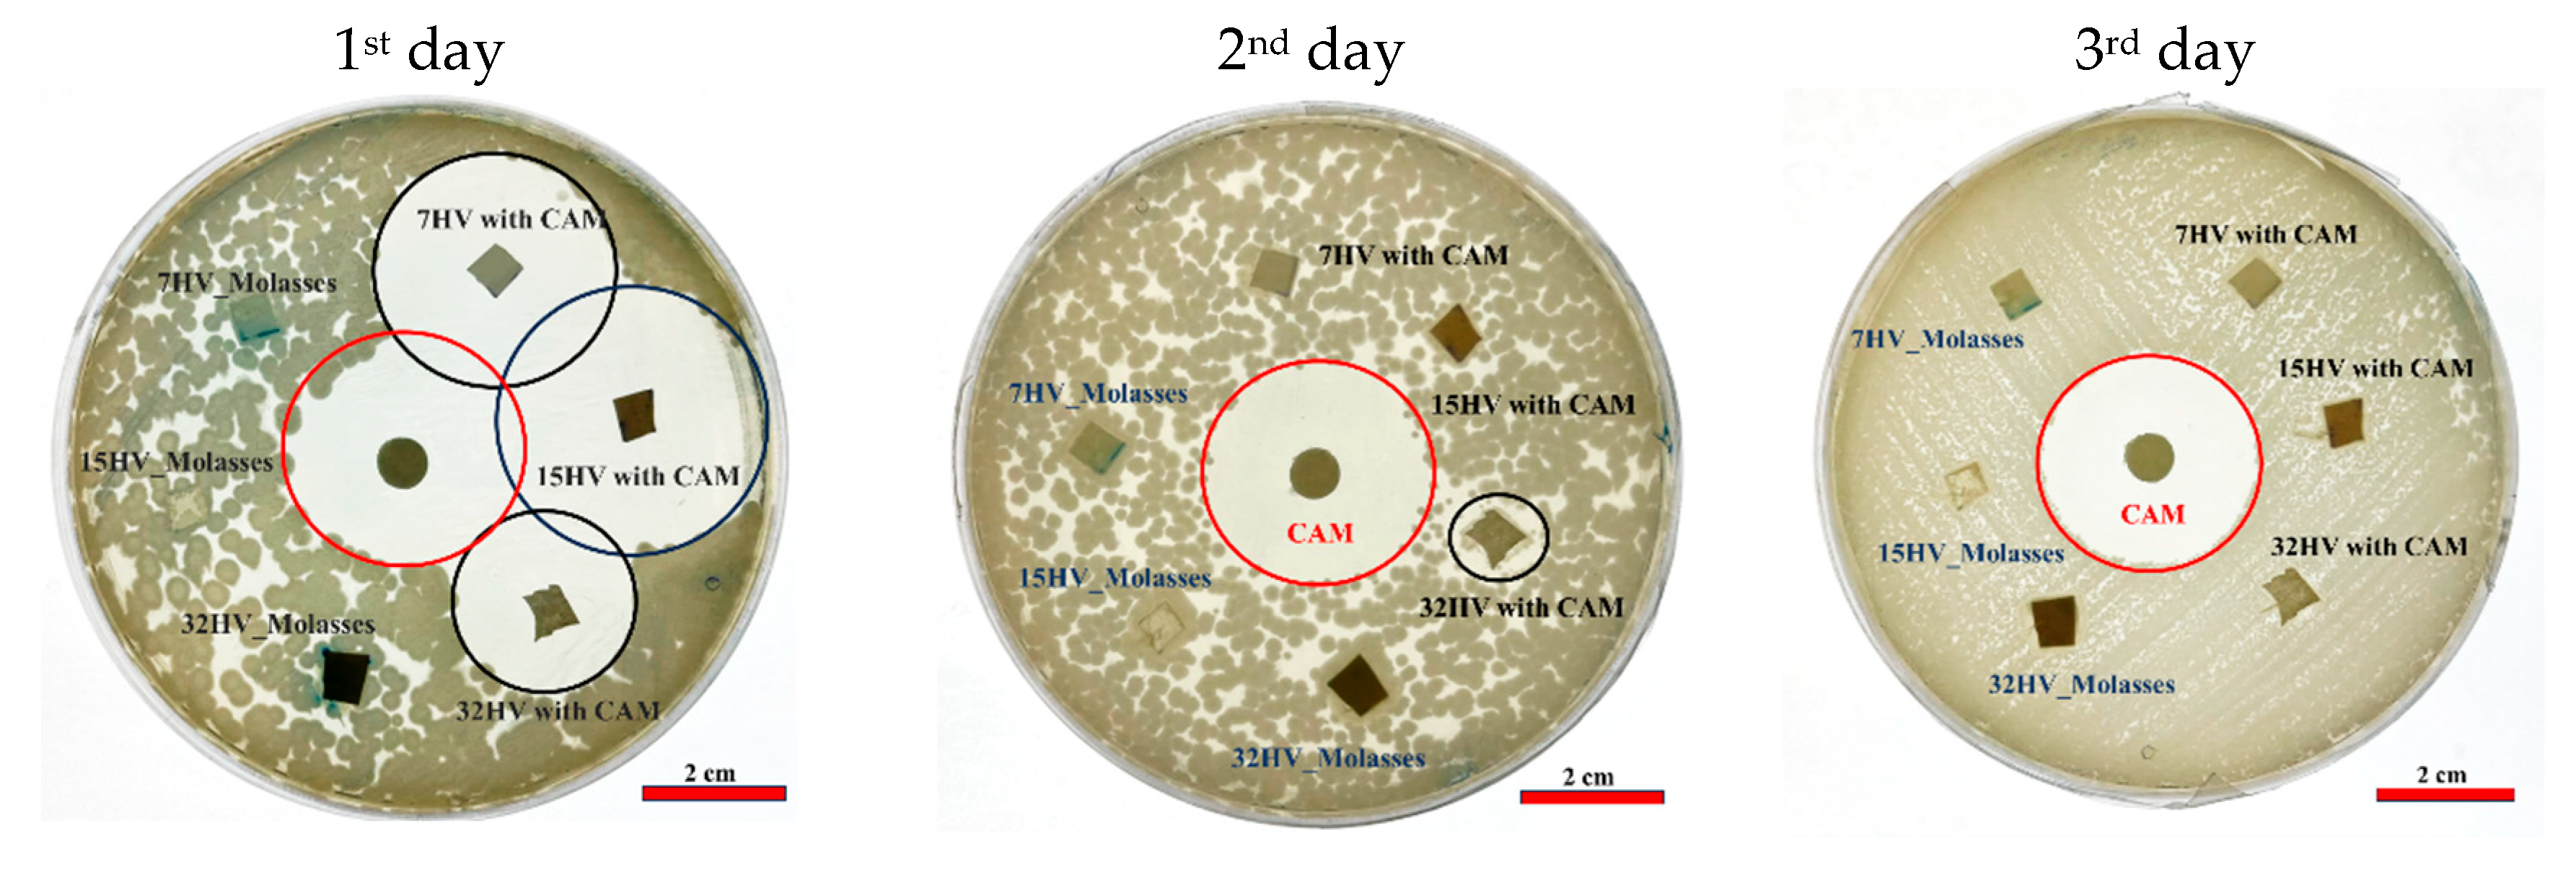
The antibacterial efficacy of CAM-loaded PHBV scaffolds was tested against Gram-negative (E. coli) and Gram-positive (S. aureus) bacteria after 24 hours of incubation. PHBV scaffolds without CAM served as references, while CAM-impregnated disks acted as controls. Clear halos of dead cells around both CAM-loaded scaffolds and CAM disks (Error! Reference source not found. and 15) confirmed effective antibacterial activity.
In agar plates seeded with E.coli, faster CAM release was evident in samples with low 3HV content, where most of the drug was released on the first day, creating a prominent halo of inhibition of bacterial growth (Error! Reference source not found.a). By the second day, the halo size around the sample with 7% 3HV had decreased significantly, indicating a substantial drop in CAM concentration (Error! Reference source not found.b). The 15% 3HV sample showed sustained antibacterial activity on the second day but was inactive by the third (Error! Reference source not found.c). In contrast, the 32% 3HV sample exhibited a more prolonged release, with antibacterial effects persisting until the fourth day (Error! Reference source not found.d).
A similar pattern was observed for S. aureus (Error! Reference source not found.), where samples with lower 3HV content released CAM rapidly on the first day. Only the 32% 3HV sample remained active on the second day as indicated by a small halo. Overall, CAM was less effective against S. aureus than E.coli, since no activity was observed on the second and third days. This feature suggests that a higher CAM concentration is needed to achieve bactericidal effects. These results align with the in vitro drug release tests, where higher 3HV content in PHBV scaffolds corresponded to slower CAM release compared to scaffolds with lower 3HV content as shown in Figure 13c.
Figure 13.
(a) UV-spectra of CAM solutions at the indicated concentrations. The spectra showed the absorption band of the p-nitrophenyl chromophore; (b) Calibration curve for absorbance measurements at 278 nm in PBS medium; (c) In vitro release of CAM from PHBV electrospun scaffold with different contents of 3HV units.
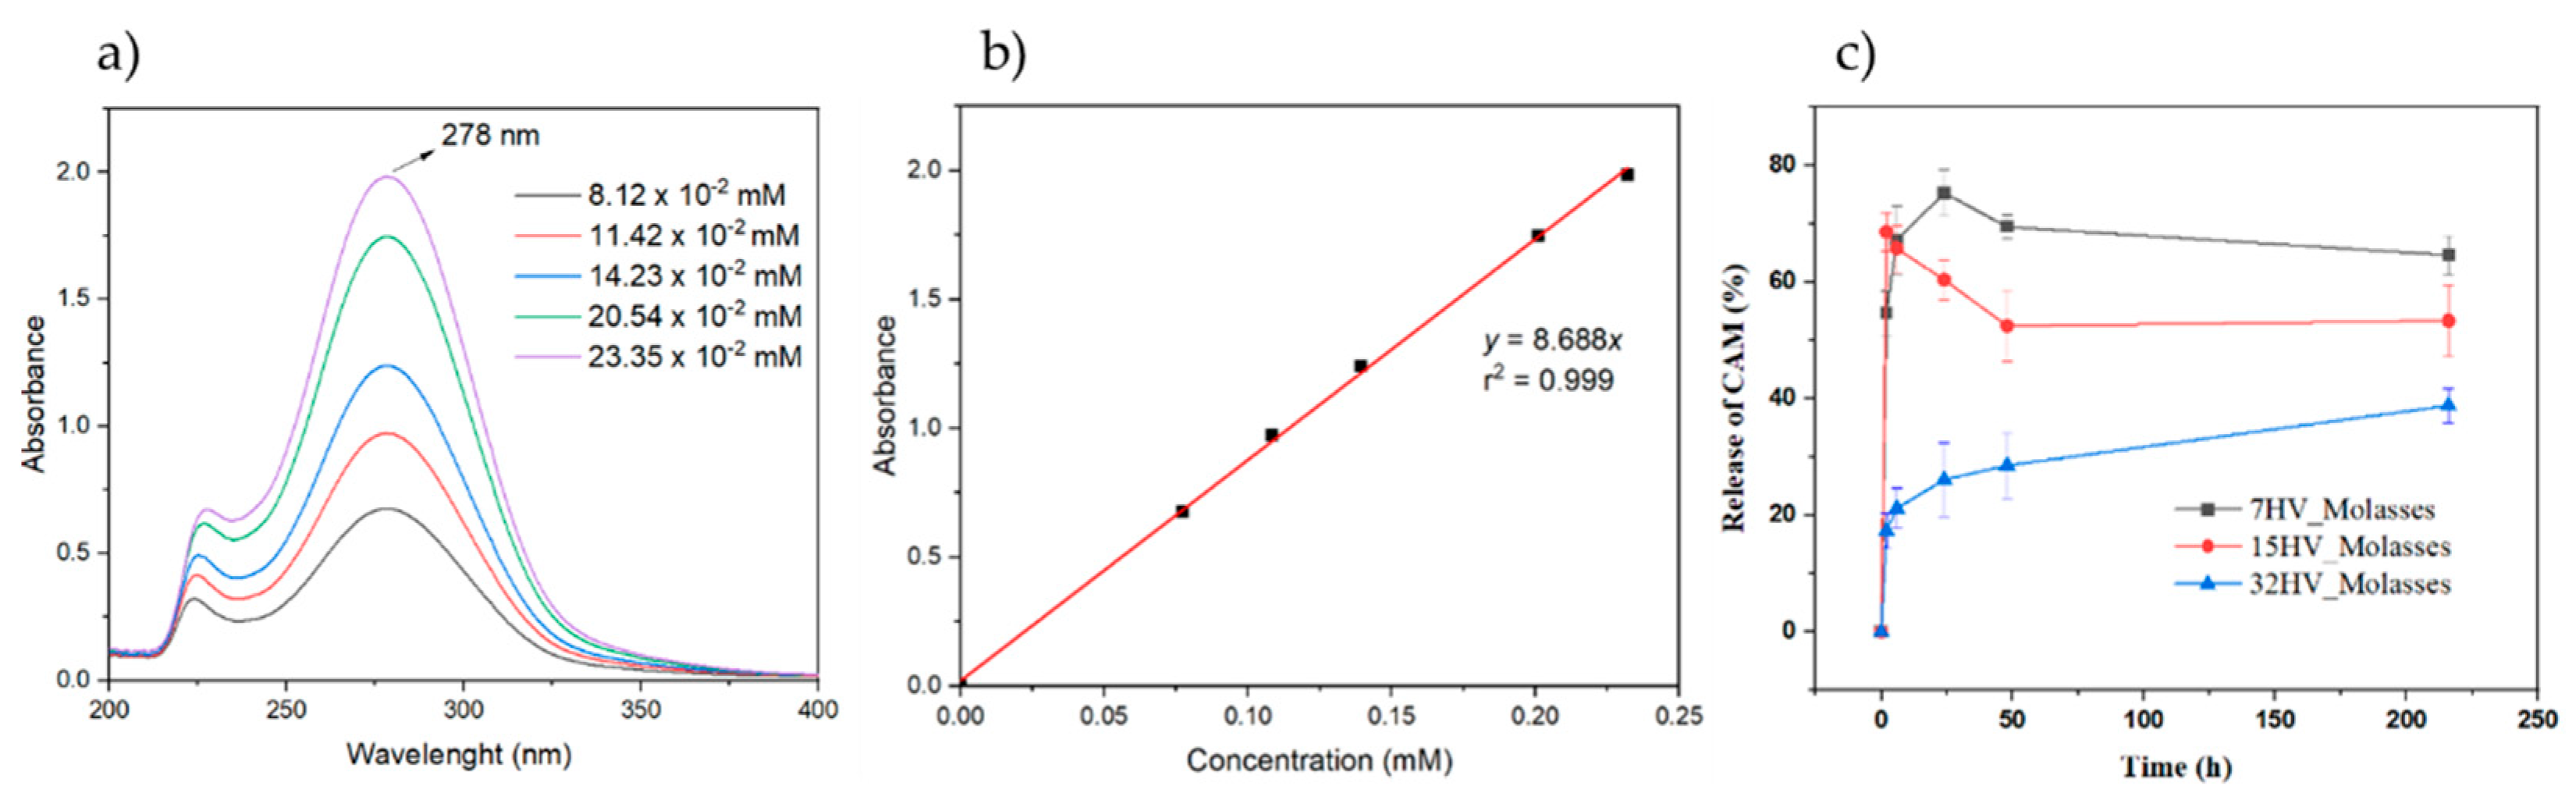
Figure 14.
E.coli growth inhibition exposed to CAM loaded PHBV scaffolds and reapplied in consecutive days.
Figure 14.
E.coli growth inhibition exposed to CAM loaded PHBV scaffolds and reapplied in consecutive days.
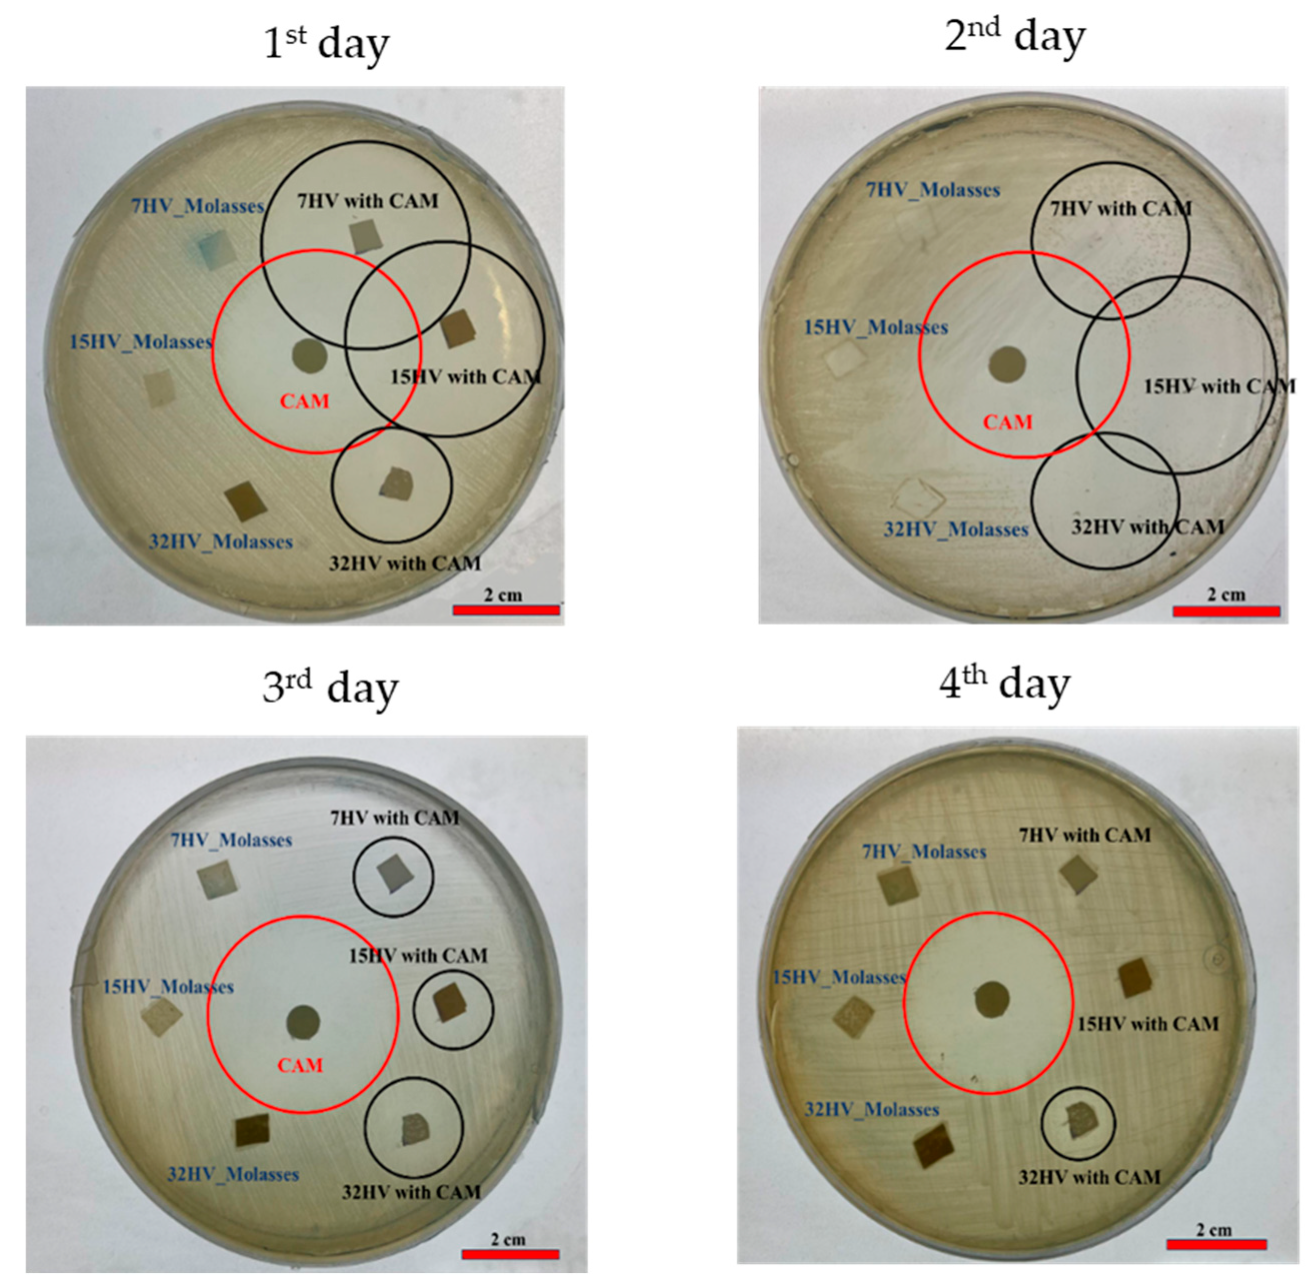
Figure 15.
S. aureus growth inhibition exposed to CAM loaded PHBV scaffolds and reapplied in consecutive days.
Figure 15.
S. aureus growth inhibition exposed to CAM loaded PHBV scaffolds and reapplied in consecutive days.
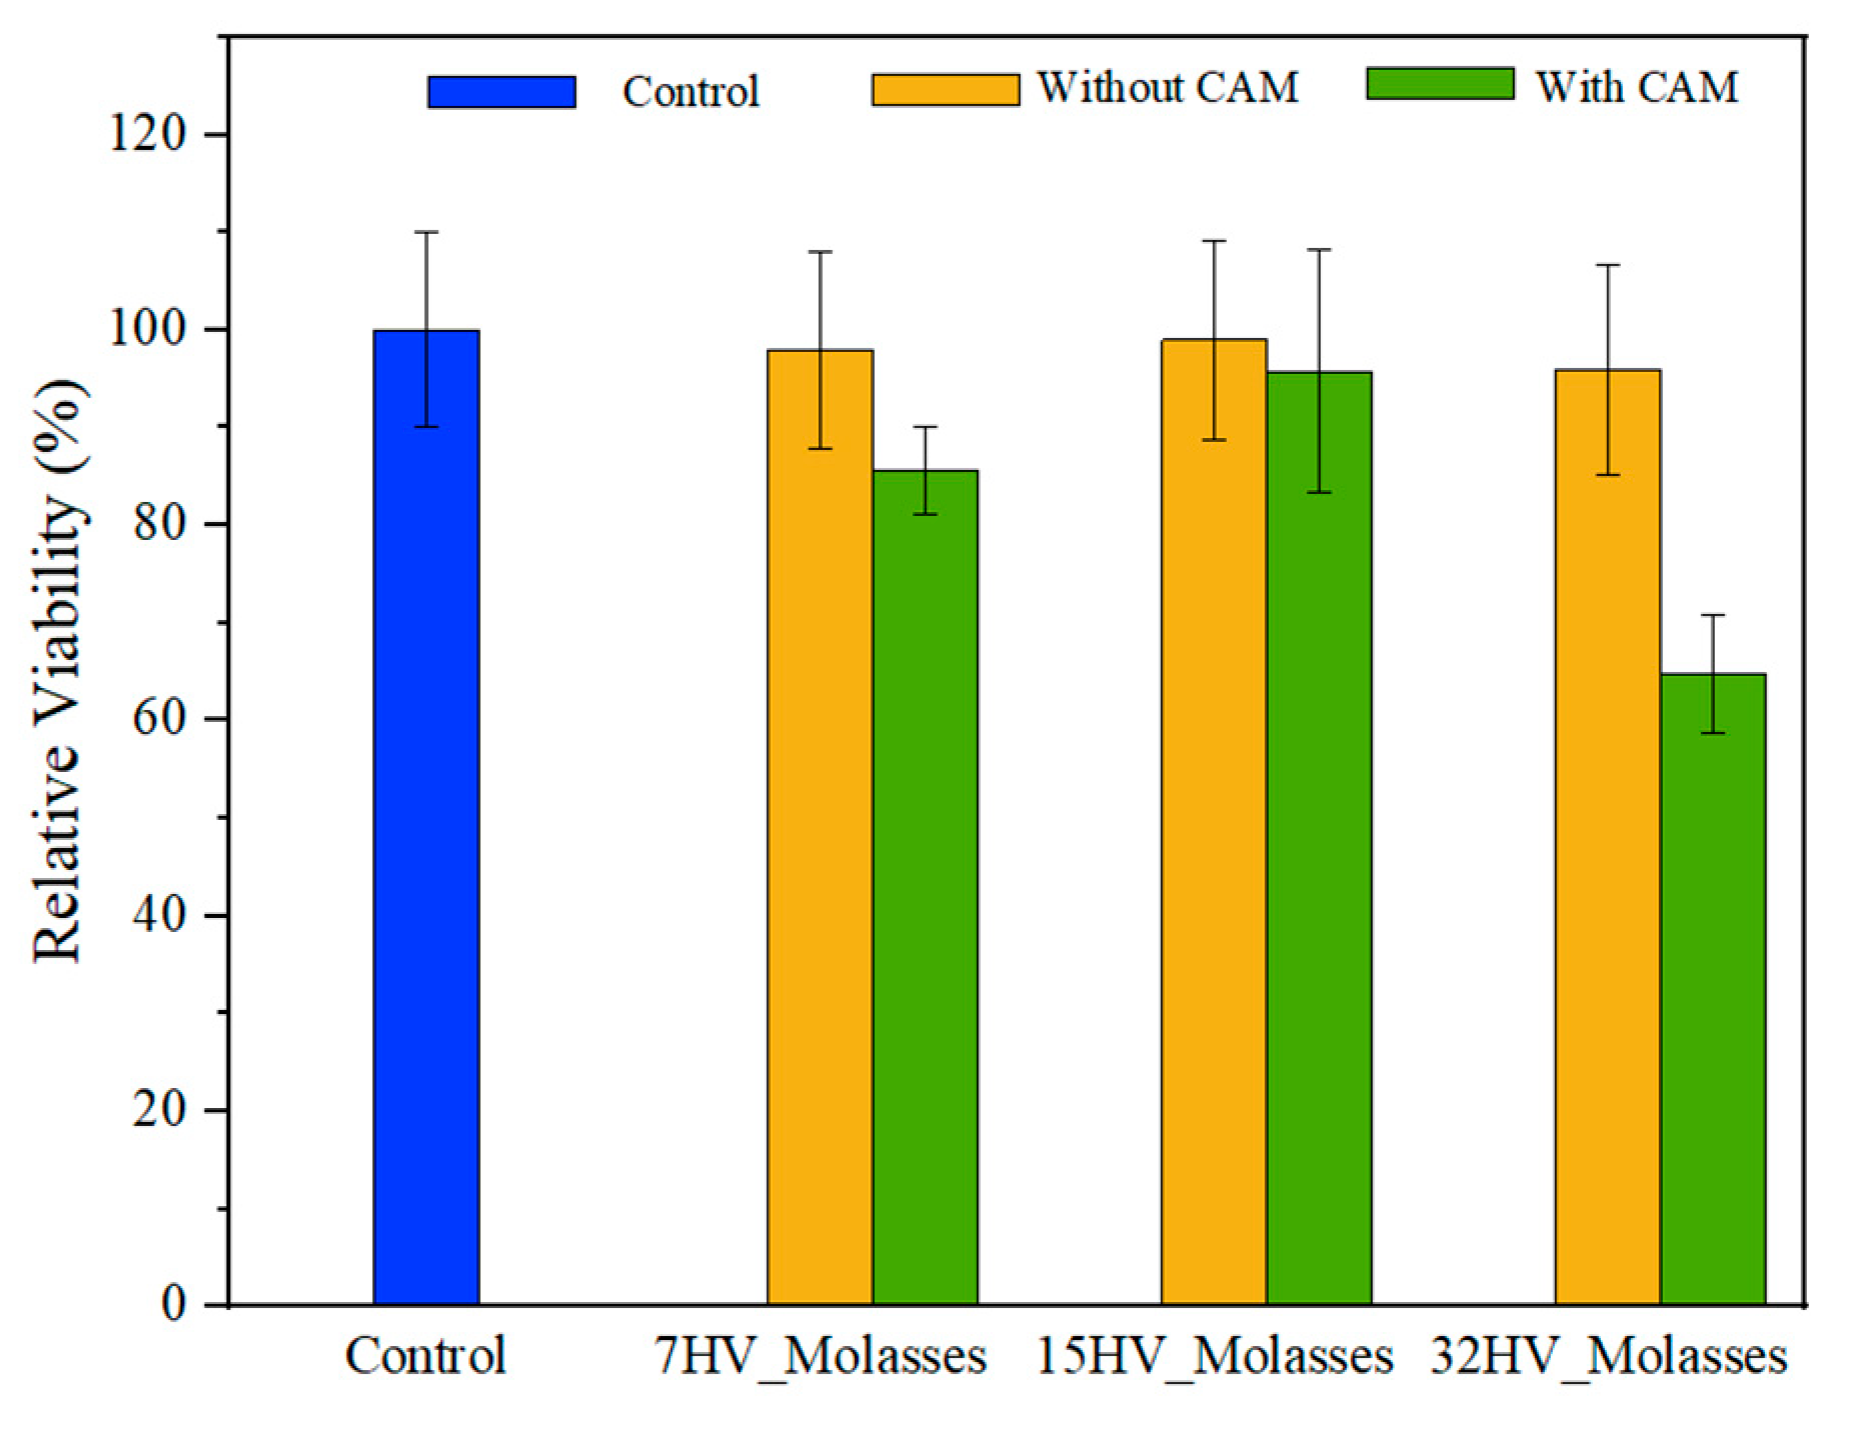
2.7. Cytotoxicity Evaluation of PHBV Scaffolds
The cytotoxicity of PHBV scaffolds, with and without CAM loading, was evaluated using a COS-1 cell growth assay for 24h. Error! Reference source not found. shows that COS-1 cells remained viable on PHBV scaffolds without CAM, indicating no cytotoxic effect.
However, a significant reduction in cell viability was observed on CAM-loaded scaffolds with high 3HV content (32%), likely due to the presence of CAM within the fiber matrix. In this study, PHBV electrospun fibers were loaded with a dose corresponding to the in vitro LD50 of CAM (2.5 M – 4 M) [55]. Thus, the results obtained with the 32% HV sample are consistent and as expected with CAM loading performed. In contrast, scaffolds with lower 3HV content showed less inhibition of cell viability as CAM was released more rapidly into the medium during conditioning of samples for culture (e.g., incubation in culture medium for 30 minutes, see materials and methods section).
Overall, these findings suggest that while PHBV scaffolds are inherently biocompatible, the presence of drug can affect cell adhesion, especially in scaffolds with higher 3HV content. The controlled release of CAM from these scaffolds can be beneficial for applications requiring sustained drug delivery, although it may temporarily affect cell viability and adhesion.
Figure 16.
Viability of COS-1 cell on PHBV electrospun scaffolds with and without CAM loaded.
3. Materials and Methods
3.1. PHBV Samples
Poly(3-hydroxybutyrate-co-3-hydroxyvalerate) (PHBV) samples, derived from milk and molasses residues with varying 3HV content, were provided by Venvirotech Biotechnology S.L. (Catalonia, Spain). The residues were subjected to acidogenic fermentation to produce volatile fatty acids, which were subsequently used as feedstock for a secondary microbial fermentation process employing mixed bacterial cultures sourced from a wastewater treatment plant. The mixed cultures underwent a feast-famine regime to selectively enrich bacterial population capable of synthesizing PHBV. The resulting PHBV samples, with their respective 3HV content and molecular weights, are presented in Table 7.
Chloroform (CHCl3) and formic acid, used as solvents, were purchased from Sigma Aldrich (St. Louis, MO, USA). Chloramphenicol (CAM) used for drug delivery tests was also purchased from Sigma Aldrich (St. Louis, MO, USA). All chemicals were used as received without further purification.
3.2. Characterization of PHBV Samples
3.2.1. Molar Mass Determination
The molecular weight of the original powder samples and electrospun fiber samples was determined by Gel Permeation Chromatography (GPC) using a liquid chromatographic pump (Shimadzu, model LC-8A, Tokyo, Japan) controlled by the LC Solution software (Shimadzu, Tokyo, Japan). The polymer was dissolved in chloroform and eluted in 1,1,1,3,3,3-hexafluoroisopropanol (HFIP) containing sodium trifluoroacetate (CF3COONa) at a concentration of 0.05 M. The flow rate was set to 1 mL/min, with an injection volume of 20 µL and a sample concentration of 10 mg/mL. A PL-HFIP-gel column (Agilent Technologies Deutschland GmbH, Böblingen, Germany) and a refractive index detector (Shimadzu, model RID-20A, Tokyo, Japan) were used. The number-average and weight average molecular weights were determined using polymethyl methacrylate standards.
3.2.2. FTIR Spectral Analysis
Infrared absorption spectra were recorded, at a resolution of 4 cm−1, with a Fourier Transform FTIR 4700 Jasco spectrometer (Tokyo, Japan) equipped with a Specac MKII Golden Gate Single Reflection Diamond ATR system. PHBV samples were analyzed by Fourier-transform infrared (FTIR) spectroscopy to obtain information regarding its chemical structure.
3.2.3. NMR Spectroscopy
Nuclear magnetic resonance spectroscopy (NMR) was used to determine the chemical composition of PHBV, the ratio of 3-hydroxybutyrate (3HB) to 3-hydroxyvalerate (3HV) units, and the sequence distribution of these units along the polymer chain. NMR spectra were recorded using a Bruker NMR Ascend spectrometer (Billerica, MA, USA) operating at a magnetic field strength of 400 MHz. Approximately, 10 mg of the corresponding sample were dissolved in deuterated chloroform. Tetramethylsilane (TMS) was used as an internal reference. All NMR data were analyzed and processed with MestReNova, version 14.3.3.
3.2.4. Thermal Analysis
Differential Scanning Calorimetry (DSC) was conducted using a TA Instruments Q100 series equipped with a refrigerated cooling system (TA Instruments, New Casttle, DE, USA), operating over a temperature range of −90 to 550 ºC. Experiments were performed under a flow of dry nitrogen, with a sample mass of approximately 4 mg. The instrument was calibrated for both temperature and heat of fusion using an indium standard. Thermal characterization followed a three-step protocol: an initial heating run from room temperature to 200 ºC at a rate of 10 °C/min to eliminate thermal history, followed by a cooling run from 200 ºC to -50 ºC at the same rate, and finally a second heating run to 200 ºC at 10 °C/min. From this second heating run, the melting temperature and the apparent enthalpy of fusion (ΔHf) were determined. Based on the fusion enthalpy, the relative crystallinity of the crystallized membraned was calculated using the following equation:
where ΔHref represents the enthalpy of fusion for a 100% crystallized PHB polymer, which is 146 J/g as reported in the literature [56,57,58]. Since the 3HV content is significantly lower than the 3HB content (less than 32%), the enthalpy contribution from crystallization is considered only for the HB units.
Thermogravimetric analysis (TGA) data were collected using a Q50 thermogravimetric analyzer (TA Instruments, New Casttle, DE, USA) under a flow of dry nitrogen, with sample masses of approximately 5 mg and at a heating rate of 10 °C /min.
3.2.5. Mechanical Analysis
The mechanical properties of the PHBV samples were evaluated by stress-strain tests performed on an Instron Universal Testing Machine, model 34SC-5 Single Column. The samples were first dissolved in chloroform and subsequently subjected to air evaporation to form uniform thin films. These films were cut into rectangular specimens with dimensions of 100 mm x 25 mm x 0.1 mm for testing. The crosshead rate and load cell capacity were set to 10 mm/min and 5 kN, respectively. Parameters were recorded using Instron software. Each test was repeated five times to ensure measurement accuracy.
3.3. Fabrication of PHBV Electrospun Fibers
All PHBV samples listed in Table 7 were used to fabricate electrospun fibers. The electrospinning process began by dissolving PHBV in chloroform, with gentle agitation and heating to 50 ºC to ensure complete polymer dissolution. Formic acid was then added at a concentration of 0.2% w/v to enhance the conductivity of solution, facilitating the formation of finer fibers and improving their overall quality. It is important to note that both the agitation time and the solution concentration were adjusted based on the specific PHBV composition to ensure smooth processing and prevent spinneret clogging. Although the optimal viscosity for fiber formation was not evaluated in this study, previous research indicates that this parameter is crucial for the successful processing of polymer nanofibers via electrospinning [59,60]. Inadequate viscosity can alter the solution’s electrical conductivity, leading to bead formation or irregular fibers.
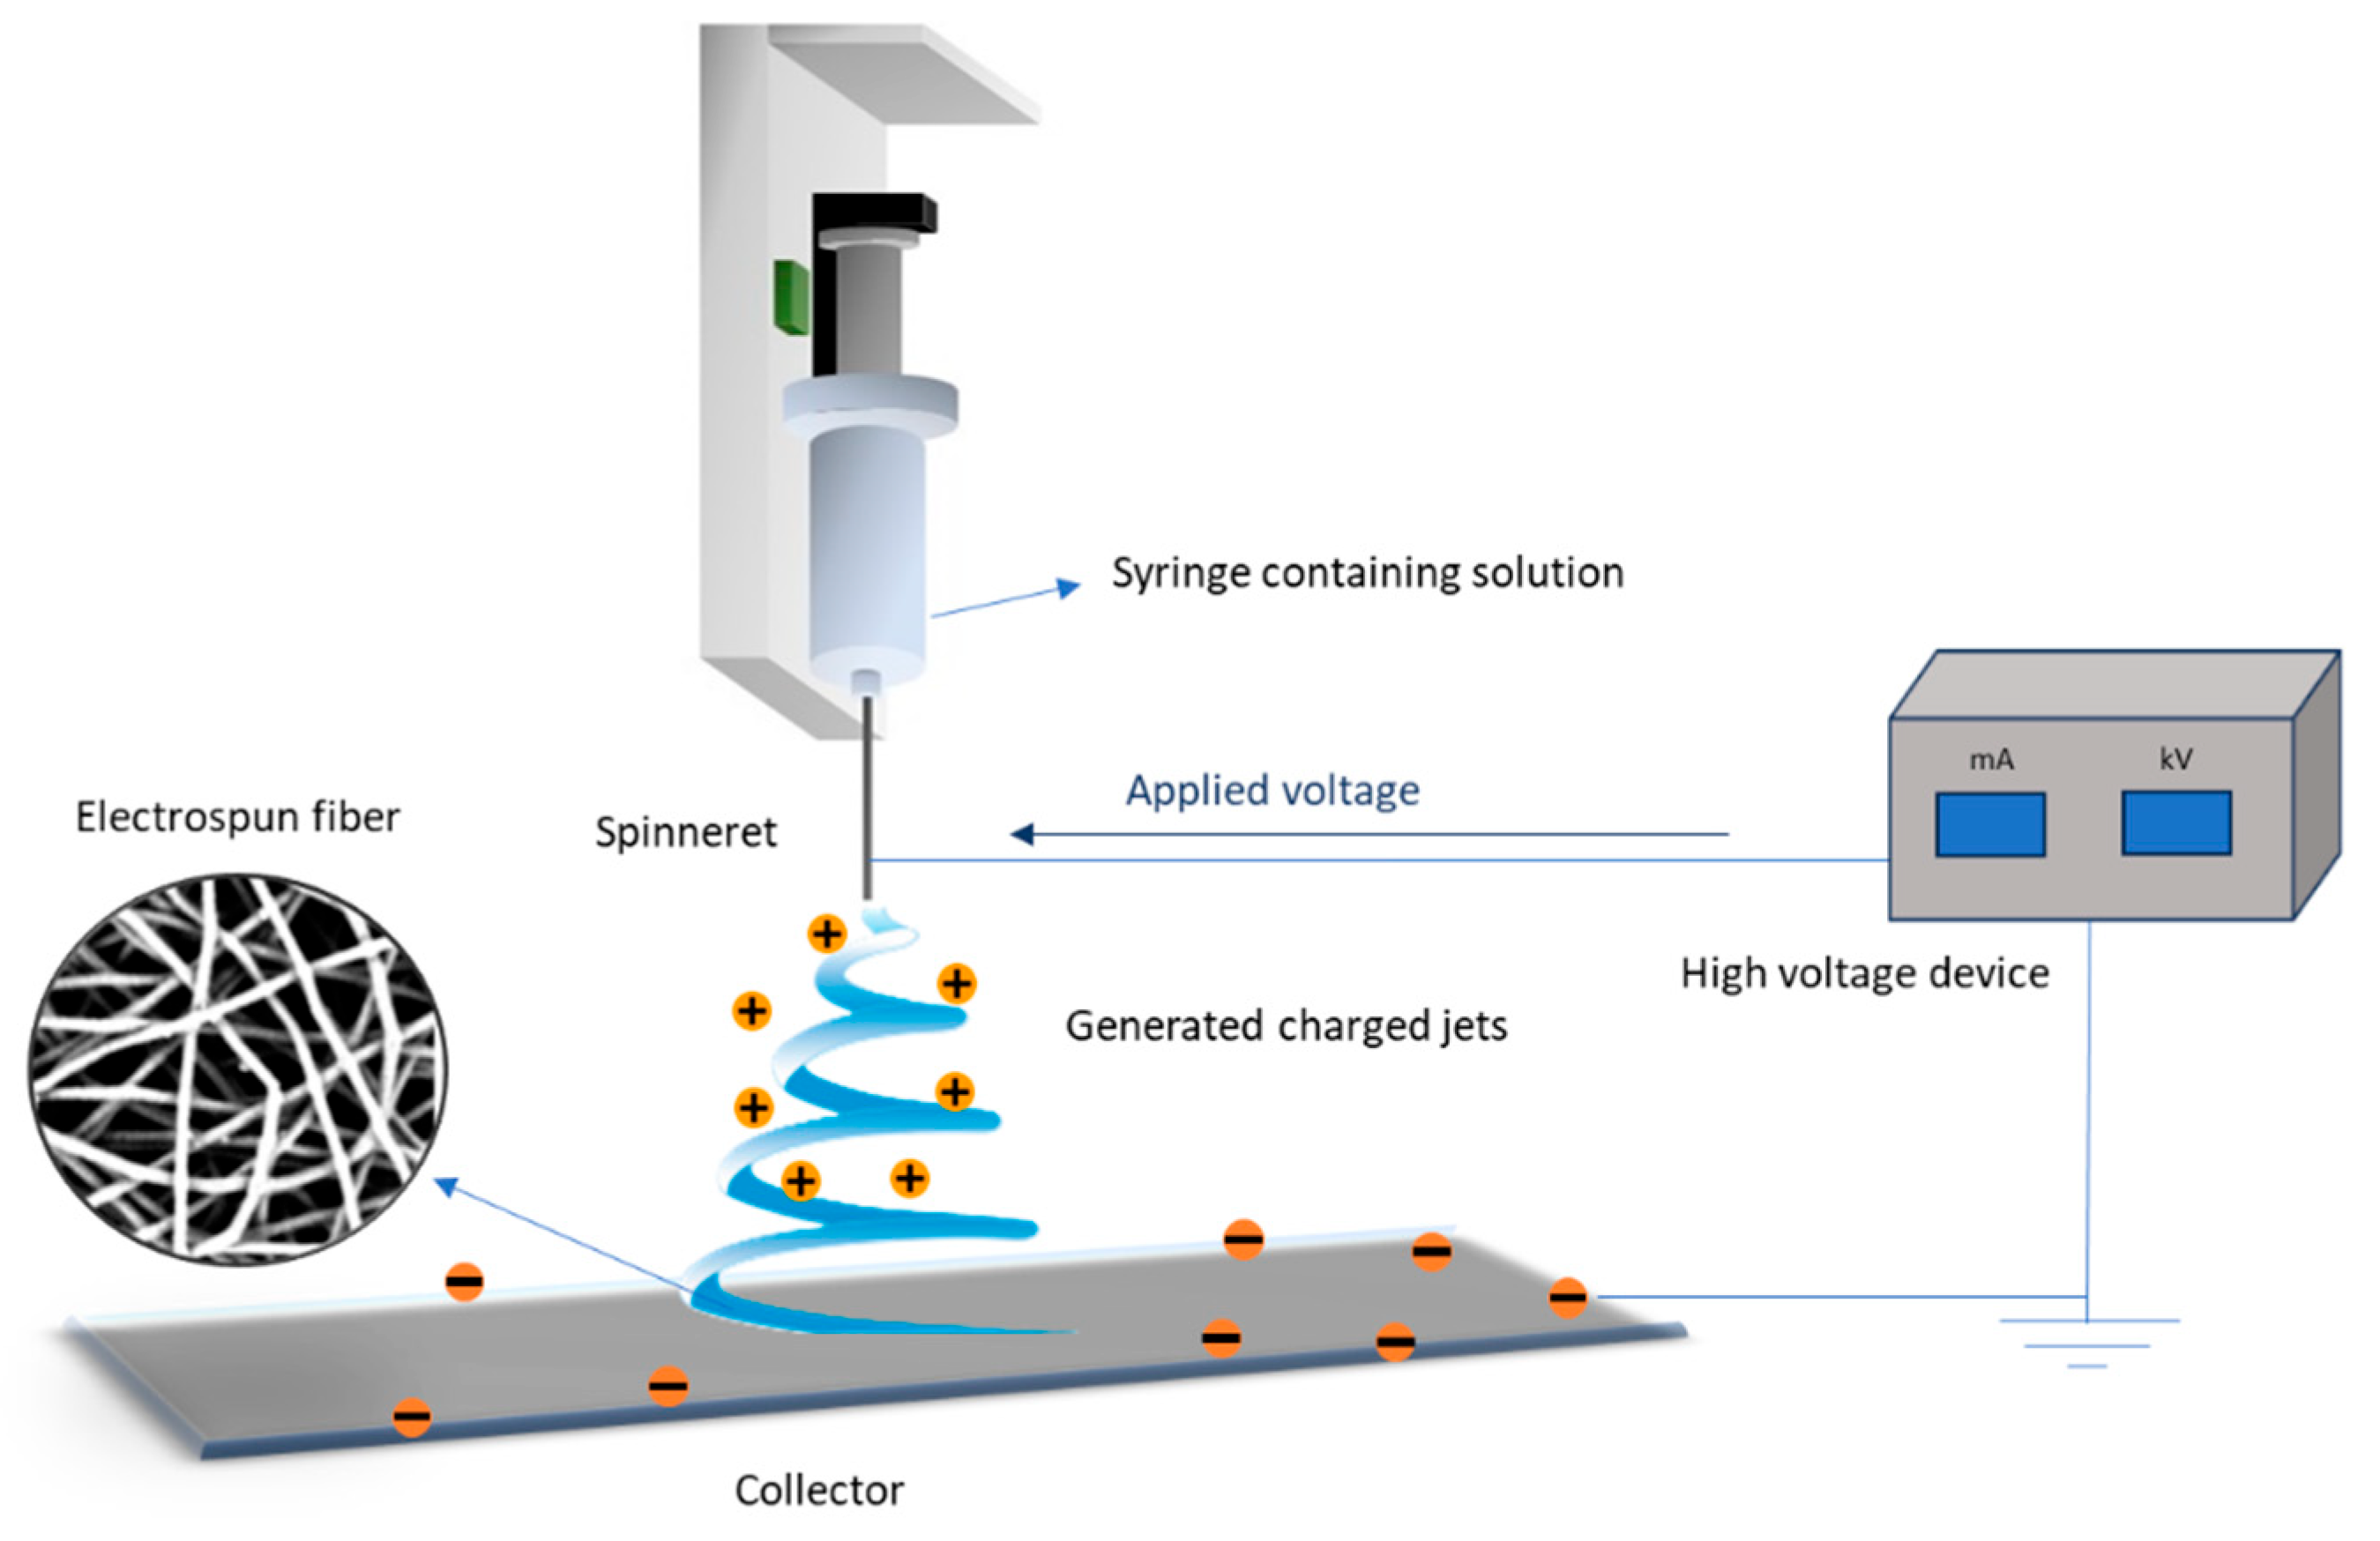
The prepared spinning solution was then transferred into a 2 mL syringe equipped with a 22G plain metallic-tip BD spinneret. The setup of the electrospinning process is illustrated in Error! Reference source not found., which depicts the critical components required for fiber formation from the polymer solution. A voltage was applied between the spinneret and the collector, inducing a charge in the polymer solution that resulted in the formation of charged jets. As these jets travelled toward the collector, solvent evaporation occurred, stretching the solution into fine fibers, which were deposited onto the collector in a random orientation. The collector, covered with aluminum foil, was positioned at a fixed distance of 15 cm from the spinneret. The production of electrospun fibers can be fine-tuned through appropriate optimization of selected process parameters (i.e., feeding rate, solution concentration, and applied voltage) [37].
Figure 17.
General set-up of electrospinning apparatus.
3.4. Morphological and Physical Characterization of Scaffolds
3.4.1. SEM Analysis of PHBV Electrospun Fibers
The morphology of electrospun fibers was characterized using Scanning Electron Microscopy (SEM) using a Focused Ion Beam Neon 40 SEM (Zeiss) equipped with an energy dispersive X-ray (EDX) spectroscopy system and operating at 5 kV. The samples were coated by carbon sputtering using a K950X Turbo Evaporator (Fedelco S.L., Madrid, España). This technique provided a detailed visualization of the physical properties of the scaffolds, including the uniformity of fiber distribution, the diameter of fibers, the presence of beads or irregularities, and the overall quality of microstructure of the scaffolds. The SEM images of the scaffolds were captured at various magnifications. The diameters of a significant number of fibers (100 fibers) were measured using Image J software to obtain a statistical understanding of the fiber size distribution.
3.4.2. XRD Analysis of PHBV Electrospun Fibers
X-ray Diffraction (XRD) was used to analyze the crystalline structure of the scaffolds. The changes in crystallinity were compared between samples derived from milk and molasses, and the variation in PHBV crystallinity based on composition was investigated in detail. XRD analyses were performed using a Bruker D8 Advance diffractometer (Bruker AXS GmbH, Karlsruhe, Germany). The samples were analyzed at room temperature in reflection mode with incident CuKα radiation (λ = 1.5405 Å), using a step size of 0.05º and an acquisition time of 5 seconds per step. The unit cell parameters of the polymer were estimated from the characteristic reflections of PHBV (i.e., (020), (110), (101), and (111)), in the 2θ range of 5º to 40º.
3.5. Biological Studies of PHBV Electrospun Fibers
3.5.1. In Vitro Drug Release from PHBV Electrospun Fibers
Three PHBV samples with varying 3HV content were selected for loading chloramphenicol (CAM), which is used as both an antibiotic and an anticancer agent. To this end, CAM was incorporated into the electrospinning solution at a concentration of 0.2% w/v. Controlled release experiments were conducted using PHBV electrospun scaffolds cut into square pieces with dimensions of 20 mm x 20 mm x 0.1 mm. The samples were weighed and placed at 37 ºC on an orbital shaker at 100 rpm in vessels containing 10 mL of phosphate-buffered saline (PBS, pH 7.2-7.4), which served as the release medium to simulate physiological conditions. Drug concentration in the release medium was evaluated by UV-Vis spectroscopy using a UV-Vis 3600 spectrophotometer (Shimadzu, Kyoto, Japan) with a wavelength range of 200-600 nm and a resolution of 0.5 nm. Calibration curves were generated by plotting absorbance at the corresponding wavelengths against drug concentration. A 1 mL sample was drawn from the release medium at 2 hours, 4 hours, 6 hours, 8 hours, 24 hours, 3 days and 1 week. All drug release tests were performed in triplicate to ensure release homogeneity, and the results were normalized by the weight fraction of CAM in the samples and finally averaged.
3.5.2. Antibacterial Activity
The antibacterial activity of the PHBV scaffolds was assessed using a bacterial growth inhibition assay, which measures the formation of inhibition zones. The Gram-negative bacterium Escherichia coli (E. coli) and the Gram-positive bacterium Staphylococcus aureus (S. aureus) were selected for the assay. These bacteria were separately spread on Luria-Bertani (LB) agar plates (Scharlau, Spain). PHBV electrospun scaffolds, both with and without CAM loading, were cut into disks with a diameter of 13 mm and sterilized under UV light for 15 minutes. A paper disk soaked in CAM solution was used as the control. The loaded disks and the electrospun samples were carefully placed on the surface of the agar plates inoculated with bacteria. The inhibition zones were measured after 24 hours of incubation. The same disks of electrospun samples were then transferred to fresh LB agar plates, and the process was repeated until no further inhibition zone was observed, indicating that all CAM had been effectively released. The presence of inhibition zones was interpreted as evidence of effective antibacterial activity.
3.5.3. Cytotoxicity Evaluation
COS-1 cells were cultured in Dulbecco’s Modified Eagle’s Medium (DMEM) containing 4500 mg/L glucose, 110 mg/L sodium pyruvate, and 2 mM L-glutamine. The medium was supplemented with 10% fetal bovine serum (FBS), 50 U/mL penicillin, 50 mg/mL streptomycin, and 2 mM L-glutamine, and incubated at 37 ºC in a humidified atmosphere of 5% CO2 and 95% air. The culture medium was replaced every two days. For sub-culturing, cell monolayers were rinsed with PBS and detached by incubating them with 0.25% trypsin/EDTA for 2–5 minutes at 37 ºC. The incubation was stopped by resuspending the cells in 5 mL of fresh medium, and cell concentration was determined by counting with a Neubauer chamber using 4% trypan blue as vital dye.
For the cell biocompatibility assays, square pieces (10 mm x 10 mm x 0.1 mm) of PHBV electrospun samples, both with and without drug loading, were cut. These pieces were placed in the wells of a multi-well culture plate and sterilized with UV light in a laminar flow cabinet for 15 minutes. A small amount of silicone adhesive (SilbioneVR MED ADH 4300 RTV, Bluestar Silicones France SAS, Lyon, France) was used to secure the samples in the wells. The samples were incubated in 1 mL of culture medium under standard conditions for 30 minutes. Afterward, the medium was aspirated, and the material was evaluated for cell adhesion.
The aliquots of 50–100 µL containing 5x10⁴ cells were seeded into the wells containing the electrospun scaffolds. The plate was incubated under standard conditions for 30 minutes to promote cell attachment to the scaffold surfaces. After this period, 1 mL of culture medium was added to each well, and the plate was incubated for an additional 24h period. Finally, cell viability was determined using the MTT assay.
4. Conclusions
This study comprehensively evaluated and compared the physical, thermal, and mechanical properties of PHBV derived from milk and molasses residues. The results demonstrated that the source of PHBV significantly influences its thermal behavior, with milk-derived samples exhibiting higher crystallinity and melting temperatures than those derived from molasses. NMR analysis revealed differences in monomer distribution, favoring a more random arrangement in molasses-derived samples. Minor variations in the X-ray diffraction patterns between samples from both sources suggest differences not only in crystallization behavior but also in crystalline structure. The mechanical and thermal properties of PHBV were also influenced by 3HV content and copolymer distribution, with higher 3HV content leading to increased flexibility and reduced melting temperatures, indicating the tunability of PHBV properties through compositional adjustments.
PHBVs from both milk and molasses were successfully used to produce electrospun fibers with an average diameter of about 2 µm. The antibiotic drug CAM was effectively loaded onto PHBV electrospun scaffolds, and release studies showed that CAM was delivered more rapidly from scaffolds with lower 3HV content. The antibacterial activity of CAM-loaded PHBV scaffolds confirmed that the material did not compromise the efficacy of CAM, maintaining effective antibacterial performance. Furthermore, cytotoxicity tests using COS-1 cells demonstrated the inherent biocompatibility of PHBV, with no adverse effects on cell viability observed for scaffolds without CAM.
Overall, the findings of this study underscore the potential of PHBV as a versatile biomaterial, capable of being tailored through compositional and processing adjustments to meet specific application needs, particularly in biomedical fields requiring controlled drug release and biocompatibility. Additionally, the use of PHBV derived from urban residues highlights its potential contribution to circular economy models by converting waste streams into valuable biomaterials.
Author Contributions
Conceptualization, A.J., G.P., L.J.V. and J.P.; methodology, A.J., G.P., A.M.I., L.J.V. and J.P.; formal analysis, A.J., A.M.I, L.J.V. and J.P.; investigation, A.J., A.M.I, L.J.V. and J.P.; writing—original draft preparation, A.J. and J.P; writing—review and editing, A.J., L.J.V. and J.P.; supervision, L.J.V. and J.P. All authors have read and agreed to the published version of the manuscript.
Funding
This research was funded by the Spanish Ministry of Science and Innovation through PID2022 – 140302OB-I00 and by the Generalitat de Catalunya under the project 2021-SGR-01042.
Institutional Review Board Statement
Not applicable.
Informed Consent Statement
Not applicable.
Data Availability Statement
Not applicable.
Acknowledgments
The authors thank the Generalitat de Catalunya and Venvirotech Biotechnology S.L. for funding this study through an AGAUR Industrial Doctorate grant (Expedient No. 2021-DI-0105).
Conflicts of Interest
The authors declare no conflicts of interest.
References
- Steinbüchel, A.; Valentin, H.E. Diversity of Bacterial Polyhydroxyalkanoic Acids. FEMS Microbiol Lett 1995, 128, 219–228. [Google Scholar] [CrossRef]
- Steinbüchel, A.; Füchtenbusch, B. Bacterial and Other Biological Systems for Polyester Production. Trends Biotechnol 1998, 16, 419–427. [Google Scholar] [CrossRef] [PubMed]
- Acharjee, S.A.; Bharali, P.; Gogoi, B.; Sorhie, V.; Walling, B.; Alemtoshi. PHA-Based Bioplastic: A Potential Alternative to Address Microplastic Pollution. Water Air Soil Pollut 2023, 234, 21. [Google Scholar] [CrossRef]
- Wang, S.; Chen, W.; Xiang, H.; Yang, J.; Zhou, Z.; Zhu, M. Modification and Potential Application of Short-Chain-Length Polyhydroxyalkanoate (SCL-PHA). Polymers 2016, 8, 273. [Google Scholar] [CrossRef]
- Abbasi, M.; Pokhrel, D.; Coats, E.R.; Guho, N.M.; McDonald, A.G. Effect of 3-Hydroxyvalerate Content on Thermal, Mechanical, and Rheological Properties of Poly(3-Hydroxybutyrate-Co-3-Hydroxyvalerate) Biopolymers Produced from Fermented Dairy Manure. Polymers 2022, 14, 4140. [Google Scholar] [CrossRef]
- Policastro, G.; Panico, A.; Fabbricino, M. Improving Biological Production of Poly(3-Hydroxybutyrate-Co-3-Hydroxyvalerate) (PHBV) Co-Polymer: A Critical Review. Rev Environ Sci Biotechnol 2021, 20, 479–513. [Google Scholar] [CrossRef]
- Urtuvia, V.; Maturana, N.; Peña, C.; Díaz-Barrera, A. Accumulation of Poly(3-Hydroxybutyrate-Co-3-Hydroxyvalerate) by Azotobacter Vinelandii with Different 3HV Fraction in Shake Flasks and Bioreactor. Bioprocess Biosyst Eng 2020, 43, 1469–1478. [Google Scholar] [CrossRef]
- Berezina, N.; Yada, B. Improvement of the Poly(3-Hydroxybutyrate-Co-3-Hydroxyvalerate) (PHBV) Production by Dual Feeding with Levulinic Acid and Sodium Propionate in Cupriavidus Necator. N Biotechnol 2016, 33, 231–236. [Google Scholar] [CrossRef]
- Aramvash, A.; Hajizadeh-Turchi, S.; Moazzeni-zavareh, F.; Gholami-Banadkuki, N.; Malek-sabet, N.; Akbari-Shahabi, Z. Effective Enhancement of Hydroxyvalerate Content of PHBV in Cupriavidus Necator and Its Characterization. Int J Biol Macromol 2016, 87, 397–404. [Google Scholar] [CrossRef]
- Ganzeveld, K. J. , van Hagen, A., van Agteren, M. H., de Koning, W., & Uiterkamp, A. J. S. Upgrading of Organic Waste: Production of the Copolymer Poly-3-Hydroxybutyrate-Co-Valerate by Ralstonia Eutrophus with Organic Waste as Sole Carbon Source. J Clean Prod 1999, 7, 413–419. [Google Scholar] [CrossRef]
- Serafim, L.S.; Lemos, P.C.; Albuquerque, M.G.E.; Reis, M.A.M. Strategies for PHA Production by Mixed Cultures and Renewable Waste Materials. Appl Microbiol Biotechnol 2008, 81, 615–628. [Google Scholar] [CrossRef] [PubMed]
- Wang, J.; Liu, S.; Huang, J.; Qu, Z. A Review on Polyhydroxyalkanoate Production from Agricultural Waste Biomass: Development, Advances, Circular Approach, and Challenges. Bioresour Technol 2021, 342, 126008. [Google Scholar] [CrossRef] [PubMed]
- Chanasit, W.; Bunkaew, K. Inexpensive Production of Poly (3-hydroxybutyrate-co- 3-hydroxyvalerate) from Bacillus Megaterium PP-10 Using Pineapple Peel Waste. ASEAN Journal of Scientific and Technological Reports 2023, 26, 36–44. [Google Scholar] [CrossRef]
- Gheibi, A.; Khoshnevisan, K.; Ketabchi, N.; Derakhshan, M.A.; Babadi, A.A. Application of Electrospun Nanofibrous PHBV Scaffold in Neural Graft and Regeneration: A Mini-Review. Nanomedicine Research Journal 2016, 1, 107–111. [Google Scholar]
- Karbowniczek, J.E.; Kaniuk, Ł.; Berniak, K.; Gruszczyński, A.; Stachewicz, U. Enhanced Cells Anchoring to Electrospun Hybrid Scaffolds with PHBV and HA Particles for Bone Tissue Regeneration. Front Bioeng Biotechnol 2021, 9, 632029. [Google Scholar] [CrossRef]
- Kaniuk, Ł.; Stachewicz, U. Development and Advantages of Biodegradable PHA Polymers Based on Electrospun PHBV Fibers for Tissue Engineering and Other Biomedical Applications. ACS Biomater Sci Eng 2021, 7, 5339–5362. [Google Scholar] [CrossRef]
- Muigano, M.N.; Anami, S.E.; Onguso, J.M.; Mauti, G.O. Optimized Poly(3-Hydroxybutyrate-Co-3-Hydroxyvalerate) (PHBV) Production by Moderately Haloalkaliphilic Bacterium Halomonas Alkalicola Ext. Int J Polym Sci 2024, 2024, 6667843. [Google Scholar] [CrossRef]
- Kansiz, M.; Domínguez-Vidal, A.; McNaughton, D.; Lendl, B. Fourier-Transform Infrared (FTIR) Spectroscopy for Monitoring and Determining the Degree of Crystallisation of Polyhydroxyalkanoates (PHAs). Analytical and Bioanalytical Chemistry 2007, 388, 1207–1213. [Google Scholar] [CrossRef]
- Bossu, J.; Angellier-Coussy, H.; Totee, C.; Matos, M.; Reis, M.; Guillard, V. Effect of the Molecular Structure of Poly(3-Hydroxybutyrate- Co-3-Hydroxyvalerate) (P(3HB-3HV)) Produced from Mixed Bacterial Cultures on Its Crystallization and Mechanical Properties. Biomacromolecules 2020, 21, 4709–4723. [Google Scholar] [CrossRef]
- Pramanik, N.; Das, R.; Rath, T.; Kundu, P.P. Microbial Degradation of Linseed Oil-Based Elastomer and Subsequent Accumulation of Poly(3-Hydroxybutyrate-Co-3-Hydroxyvalerate) Copolymer. Appl Biochem Biotechnol 2014, 174, 1613–1630. [Google Scholar] [CrossRef]
- Bayari, S.; Severcan, F. FTIR Study of Biodegradable Biopolymers: P(3HB), P(3HB-Co-4HB) and P(3HB-Co-3HV). J Mol Struct 2005, 744, 529–534. [Google Scholar] [CrossRef]
- Pradhan, S.; Dikshit, P.K.; Moholkar, V.S. Production, Ultrasonic Extraction, and Characterization of Poly (3-Hydroxybutyrate) (PHB) Using Bacillus Megaterium and Cupriavidus Necator. Polym Adv Technol 2018, 29, 2392–2400. [Google Scholar] [CrossRef]
- Yu, W.; Lan, C.H.; Wang, S.J.; Fang, P.F.; Sun, Y.M. Influence of Zinc Oxide Nanoparticles on the Crystallization Behavior of Electrospun Poly(3-Hydroxybutyrate-Co-3-Hydroxyvalerate) Nanofibers. Polymer 2010, 51, 2403–2409. [Google Scholar] [CrossRef]
- Xu, Y.; Zou, L.; Lu, H.; Wei, Y.; Hua, J.; Chen, S. Preparation and Characterization of Electrospun PHBV/PEO Mats: The Role of Solvent and PEO Component. J Mater Sci 2016, 51, 5695–5711. [Google Scholar] [CrossRef]
- Pramanik, N.; Das, R.; Rath, T.; Kundu, P.P. Microbial Degradation of Linseed Oil-Based Elastomer and Subsequent Accumulation of Poly(3-Hydroxybutyrate-Co-3-Hydroxyvalerate) Copolymer. Appl Biochem Biotechnol 2014, 174, 1613–1630. [Google Scholar] [CrossRef]
- Ivanova, G.; Serafim, L.S.; Lemos, P.C.; Ramos, A.M.; Reis, M.A.M.; Cabrita, E.J. Influence of Feeding Strategies of Mixed Microbial Cultures on the Chemical Composition and Microstructure of Copolyesters P(3HB-Co-3HV) Analyzed by NMR and Statistical Analysis. Magnetic Resonance in Chemistry 2009, 47, 497–504. [Google Scholar] [CrossRef]
- Žagar, E.; Kržan, A.; Adamus, G.; Kowalczuk, M. Sequence Distribution in Microbial Poly(3-Hydroxybutyrate-Co-3-Hydroxyvalerate) Co-Polyesters Determined by NMR and MS. Biomacromolecules 2006, 7, 2210–2216. [Google Scholar] [CrossRef]
- Montiel-Jarillo, G.; Morales-Urrea, D.A.; Contreras, E.M.; López-Córdoba, A.; Gómez-Pachón, E.Y.; Carrera, J.; Suárez-Ojeda, M.E. Improvement of the Polyhydroxyalkanoates Recovery from Mixed Microbial Cultures Using Sodium Hypochlorite Pre-Treatment Coupled with Solvent Extraction. Polymers 2022, 14, 3938. [Google Scholar] [CrossRef]
- Ivanova, G.; Serafim, L.S.; Lemos, P.C.; Ramos, A.M.; Reis, M.A.M.; Cabrita, E.J. Influence of Feeding Strategies of Mixed Microbial Cultures on the Chemical Composition and Microstructure of Copolyesters P(3HB-Co-3HV) Analyzed by NMR and Statistical Analysis. Magnetic Resonance in Chemistry 2009, 47, 497–504. [Google Scholar] [CrossRef]
- Bossu, J.; Angellier-Coussy, H.; Totee, C.; Matos, M.; Reis, M.; Guillard, V. Effect of the Molecular Structure of Poly(3-Hydroxybutyrate- Co-3-Hydroxyvalerate) (P(3HB-3HV)) Produced from Mixed Bacterial Cultures on Its Crystallization and Mechanical Properties. Biomacromolecules 2020, 21, 4709–4723. [Google Scholar] [CrossRef]
- Cheng, H.N.; Biswas, A.; Vermillion, K.; Melendez-Rodriguez, B.; Lagaron, J.M. NMR Analysis and Triad Sequence Distributions of Poly(3-Hydroxybutyrate-Co-3-Hydroxyvalerate). Polym Test 2020, 90, 106754. [Google Scholar] [CrossRef]
- Yoshie, N.; Me+, H.; Sato, H.; Inoue, Y. Complex Composition Distribution of Poly( 3-Hydroxybutyrate-Co-3-Hydroxyvalerate). Macromolecules 1995, 28(19), 6516–6521. [Google Scholar] [CrossRef]
- Gunaratne, L.M.W.K.; Shanks, R.A. Multiple Melting Behaviour of Poly(3-Hydroxybutyrate-Co-Hydroxyvalerate) Using Step-Scan DSC. Eur Polym J 2005, 41, 2980–2988. [Google Scholar] [CrossRef]
- Guho, N.M.; Pokhrel, D.; Abbasi, M.; Mcdonald, A.G.; Alfaro, M.; Brinkman, C.K.; Coats, E.R. Pilot-Scale Production of Poly-3-Hydroxybutyrate-Co-3-Hydroxyvalerate from Fermented Dairy Manure: 1 Process Performance, Polymer Characterization, and Scale-up Implications. Bioresour Technol 2020, 12, 100588. [Google Scholar] [CrossRef]
- Abbasi, M.; Pokhrel, D.; Coats, E.R.; Guho, N.M.; McDonald, A.G. Effect of 3-Hydroxyvalerate Content on Thermal, Mechanical, and Rheological Properties of Poly(3-Hydroxybutyrate-Co-3-Hydroxyvalerate) Biopolymers Produced from Fermented Dairy Manure. Polymers 2022, 14. [Google Scholar] [CrossRef]
- Tong, H.W.; Wang, M. Electrospinning of Poly(Hydroxybutyrate-Co-Hydroxyvalerate) Fibrous Scaffolds for Tissue Engineering Applications: Effects of Electrospinning Parameters and Solution Properties. Journal of Macromolecular Science, Part B: Physics 2011, 50, 1535–1558. [Google Scholar] [CrossRef]
- Tong, H.W.; Wang, M. Effects of Processing Parameters on the Morphology and Size of Electrospun PHBV Micro- and Nano-Fibers. Key Eng Mater 2007, 334, 1233–1236. [Google Scholar] [CrossRef]
- Tong, H.-W.; Wang, M. Electrospinning of Fibrous Polymer Scaffolds Using Positive Voltage or Negative Voltage: A Comparative Study. Biomed Mater 2010, 5, 054110. [Google Scholar] [CrossRef]
- Tong, H.W.; Wang, M.; Lu, W.W. Electrospun Poly(Hydroxybutyrate-Co-Hydroxyvalerate) Fibrous Membranes Consisting of Parallel-Aligned Fibers or Cross-Aligned Fibers: Characterization and Biological Evaluation. J Biomater Sci Polym Ed 2011, 22, 2475–2497. [Google Scholar] [CrossRef]
- Tong, H.W.; Wang, M.; Lu, W.W. Electrospinning and Evaluation of PHBV-Based Tissue Engineering Scaffolds with Different Fibre Diameters, Surface Topography and Compositions. J Biomater Sci Polym Ed 2012, 23, 779–806. [Google Scholar] [CrossRef]
- Suwantong, O.; Waleetorncheepsawat, S.; Sanchavanakit, N.; Pavasant, P.; Cheepsunthorn, P.; Bunaprasert, T.; Supaphol, P. In Vitro Biocompatibility of Electrospun Poly(3-Hydroxybutyrate) and Poly(3-Hydroxybutyrate-Co-3-Hydroxyvalerate) Fiber Mats. Int J Biol Macromol 2007, 40, 217–223. [Google Scholar] [CrossRef] [PubMed]
- Sombatmankhong, K.; Sanchavanakit, N.; Pavasant, P.; Supaphol, P. Bone Scaffolds from Electrospun Fiber Mats of Poly(3-Hydroxybutyrate), Poly(3-Hydroxybutyrate-Co-3-Hydroxyvalerate) and Their Blend. Polymer 2007, 48, 1419–1427. [Google Scholar] [CrossRef]
- Kaniuk, Ł.; Krysiak, Z.J.; Metwally, S.; Stachewicz, U. Osteoblasts and Fibroblasts Attachment to Poly(3-Hydroxybutyric Acid-Co-3-Hydrovaleric Acid) (PHBV) Film and Electrospun Scaffolds. Materials Science and Engineering C 2020, 110, 110668. [Google Scholar] [CrossRef] [PubMed]
- Kouhi, M.; Prabhakaran, M.P.; Shamanian, M.; Fathi, M.; Morshed, M.; Ramakrishna, S. Electrospun PHBV Nanofibers Containing HA and Bredigite Nanoparticles: Fabrication, Characterization and Evaluation of Mechanical Properties and Bioactivity. Compos Sci Technol 2015, 121, 115–122. [Google Scholar] [CrossRef]
- Zhang, S.; Prabhakaran, M.P.; Qin, X.; Ramakrishna, S. Biocomposite Scaffolds for Bone Regeneration: Role of Chitosan and Hydroxyapatite within Poly-3-Hydroxybutyrate-Co-3-Hydroxyvalerate on Mechanical Properties and in Vitro Evaluation. J Mech Behav Biomed Mater 2015, 51, 88–98. [Google Scholar] [CrossRef]
- Meng, W.; Kim, S.Y.; Yuan, J.; Kim, J.C.; Kwon, O.H.; Kawazoe, N.; Chen, G.; Ito, Y.; Kang, I.K. Electrospun PHBV/Collagen Composite Nanofibrous Scaffolds for Tissue Engineering. J Biomater Sci Polym Ed 2007, 18, 81–94. [Google Scholar] [CrossRef]
- Lee, I. S. , Kwon, O. H., Meng, W., Kang, I. K., & Ito, Y. Nanofabrication of Microbial Polyester by Electrospinning Promotes Cell Attachment. Macromol Res 2004, 12, 374–378. [Google Scholar] [CrossRef]
- Ito, Y.; Hasuda, H.; Kamitakahara, M.; Ohtsuki, C.; Tanihara, M.; Kang, I.K.; Kwon, O.H. A Composite of Hydroxyapatite with Electrospun Biodegradable Nanofibers as a Tissue Engineering Material. J Biosci Bioeng 2005, 100, 43–49. [Google Scholar] [CrossRef]
- Kaniuk, Ł.; Berniak, K.; Lichawska-Cieślar, A.; Jura, J.; Karbowniczek, J.E.; Stachewicz, U. Accelerated Wound Closure Rate by Hyaluronic Acid Release from Coated PHBV Electrospun Fiber Scaffolds. J Drug Deliv Sci Technol 2022, 77, 103855. [Google Scholar] [CrossRef]
- Dinos, G.P.; Athanassopoulos, C.M.; Missiri, D.A.; Giannopoulou, P.C.; Vlachogiannis, I.A.; Papadopoulos, G.E.; Papaioannou, D.; Kalpaxis, D.L. Chloramphenicol Derivatives as Antibacterial and Anticancer Agents: Historic Problems and Current Solutions. Antibiotics 2016, 5, 20. [Google Scholar] [CrossRef]
- Pramanik, U.; Khamari, L.; Shekhar, S.; Mukherjee, S. On the Role of Hydrophobic Interactions between Chloramphenicol and Bovine Pancreatic Trypsin: The Effect of a Strong Electrolyte. Chem Phys Lett 2020, 742, 137137. [Google Scholar] [CrossRef]
- Miller, S.I. Antibiotic Resistance and Regulation of the Gram-Negative Bacterial Outer Membrane Barrier by Host Innate Immune Molecules. mBio 2016, 7, 10–1128. [Google Scholar] [CrossRef] [PubMed]
- Lemes, A.P.; Montanheiro, T.L.D.A.; Durán, N.; da Silva, A.P. PHBV/MWCNT films: Hydrophobicity, thermal and mechanical properties as a function of MWCNT concentration. Journal of Composites Science 2019, 3. [Google Scholar] [CrossRef]
- Khamplod, T.; Winterburn, J.B.; Cartmell, S.H. Electrospun Poly(3-Hydroxybutyrate-Co-3-Hydroxyvalerate) Scaffolds–a Step towards Ligament Repair Applications. Sci Technol Adv Mater 2022, 23, 895–910. [Google Scholar] [CrossRef]
- Rivas, M.; Del Valle, L. J.; Rodríguez-Rivero, A. M.; Turon, P.; Puiggalí, J. , & Alemán, C. Loading of Antibiotic into biocoated hydroxyapatite nanoparticles: Smart antitumor platforms with regulated release. ACS Biomater Sci Eng 2018, 4, 3234–3245. [Google Scholar]
- Montiel-Jarillo, G.; Morales-Urrea, D.A.; Contreras, E.M.; López-Córdoba, A.; Gómez-Pachón, E.Y.; Carrera, J.; Suárez-Ojeda, M.E. Improvement of the Polyhydroxyalkanoates Recovery from Mixed Microbial Cultures Using Sodium Hypochlorite Pre-Treatment Coupled with Solvent Extraction. Polymers 2022, 14, 3938. [Google Scholar] [CrossRef]
- Rosengart, A.; Cesário, M.T.; de Almeida, M.C.M.D.; Raposo, R.S.; Espert, A.; de Apodaca, E.D.; da Fonseca, M.M.R. Efficient P(3HB) Extraction from Burkholderia Sacchari Cells Using Non-Chlorinated Solvents. Biochem Eng J 2015, 103, 39–46. [Google Scholar] [CrossRef]
- Barham, P.J.; Keller, A.; Otun, E.L.; Wills, H.H.; Holmes, P.A. Crystallization and morphology of a bacterial thermoplastic: poly-3-hydroxybutyrate. J Mater Sci 1984, 19, 2781–2794. [Google Scholar] [CrossRef]
- Jun, Z.; Hou, H.; Schaper, A.; Wendorff, J.H.; Greiner, A. Poly-L-lactide nanofibers by electrospinning–Influence of solution viscosity and electrical conductivity on fiber diameter and fiber morphology. E-Polymers 2003, 3, 009. [Google Scholar] [CrossRef]
- Ol’khov, A. A. , Staroverova, O. V., Gol’dshtrakh, M. A., Khvatov, A. V., Gumargalieva, K. Z., & Iordanskii, A. L. Electrospinning of Biodegradable Poly-3-Hydroxybutyrate. Effect of the Characteristics of the Polymer Solution. Russian Journal of Physical Chemistry B 2016, 10, 830–838. [Google Scholar] [CrossRef]
Figure 1.
(a) FTIR absorption spectra of PHBV derived from molasses and milk with varying 3HV content; (b) Expanded section of 3050 to 2800 cm-1 of PHBV derived from molasses samples with 7% 3HV (red), 15% 3HV (blue) and 32% 3HV (orange); (c) Expanded section of 1800 – 1610 cm-1 of 7% 3HV from milk.
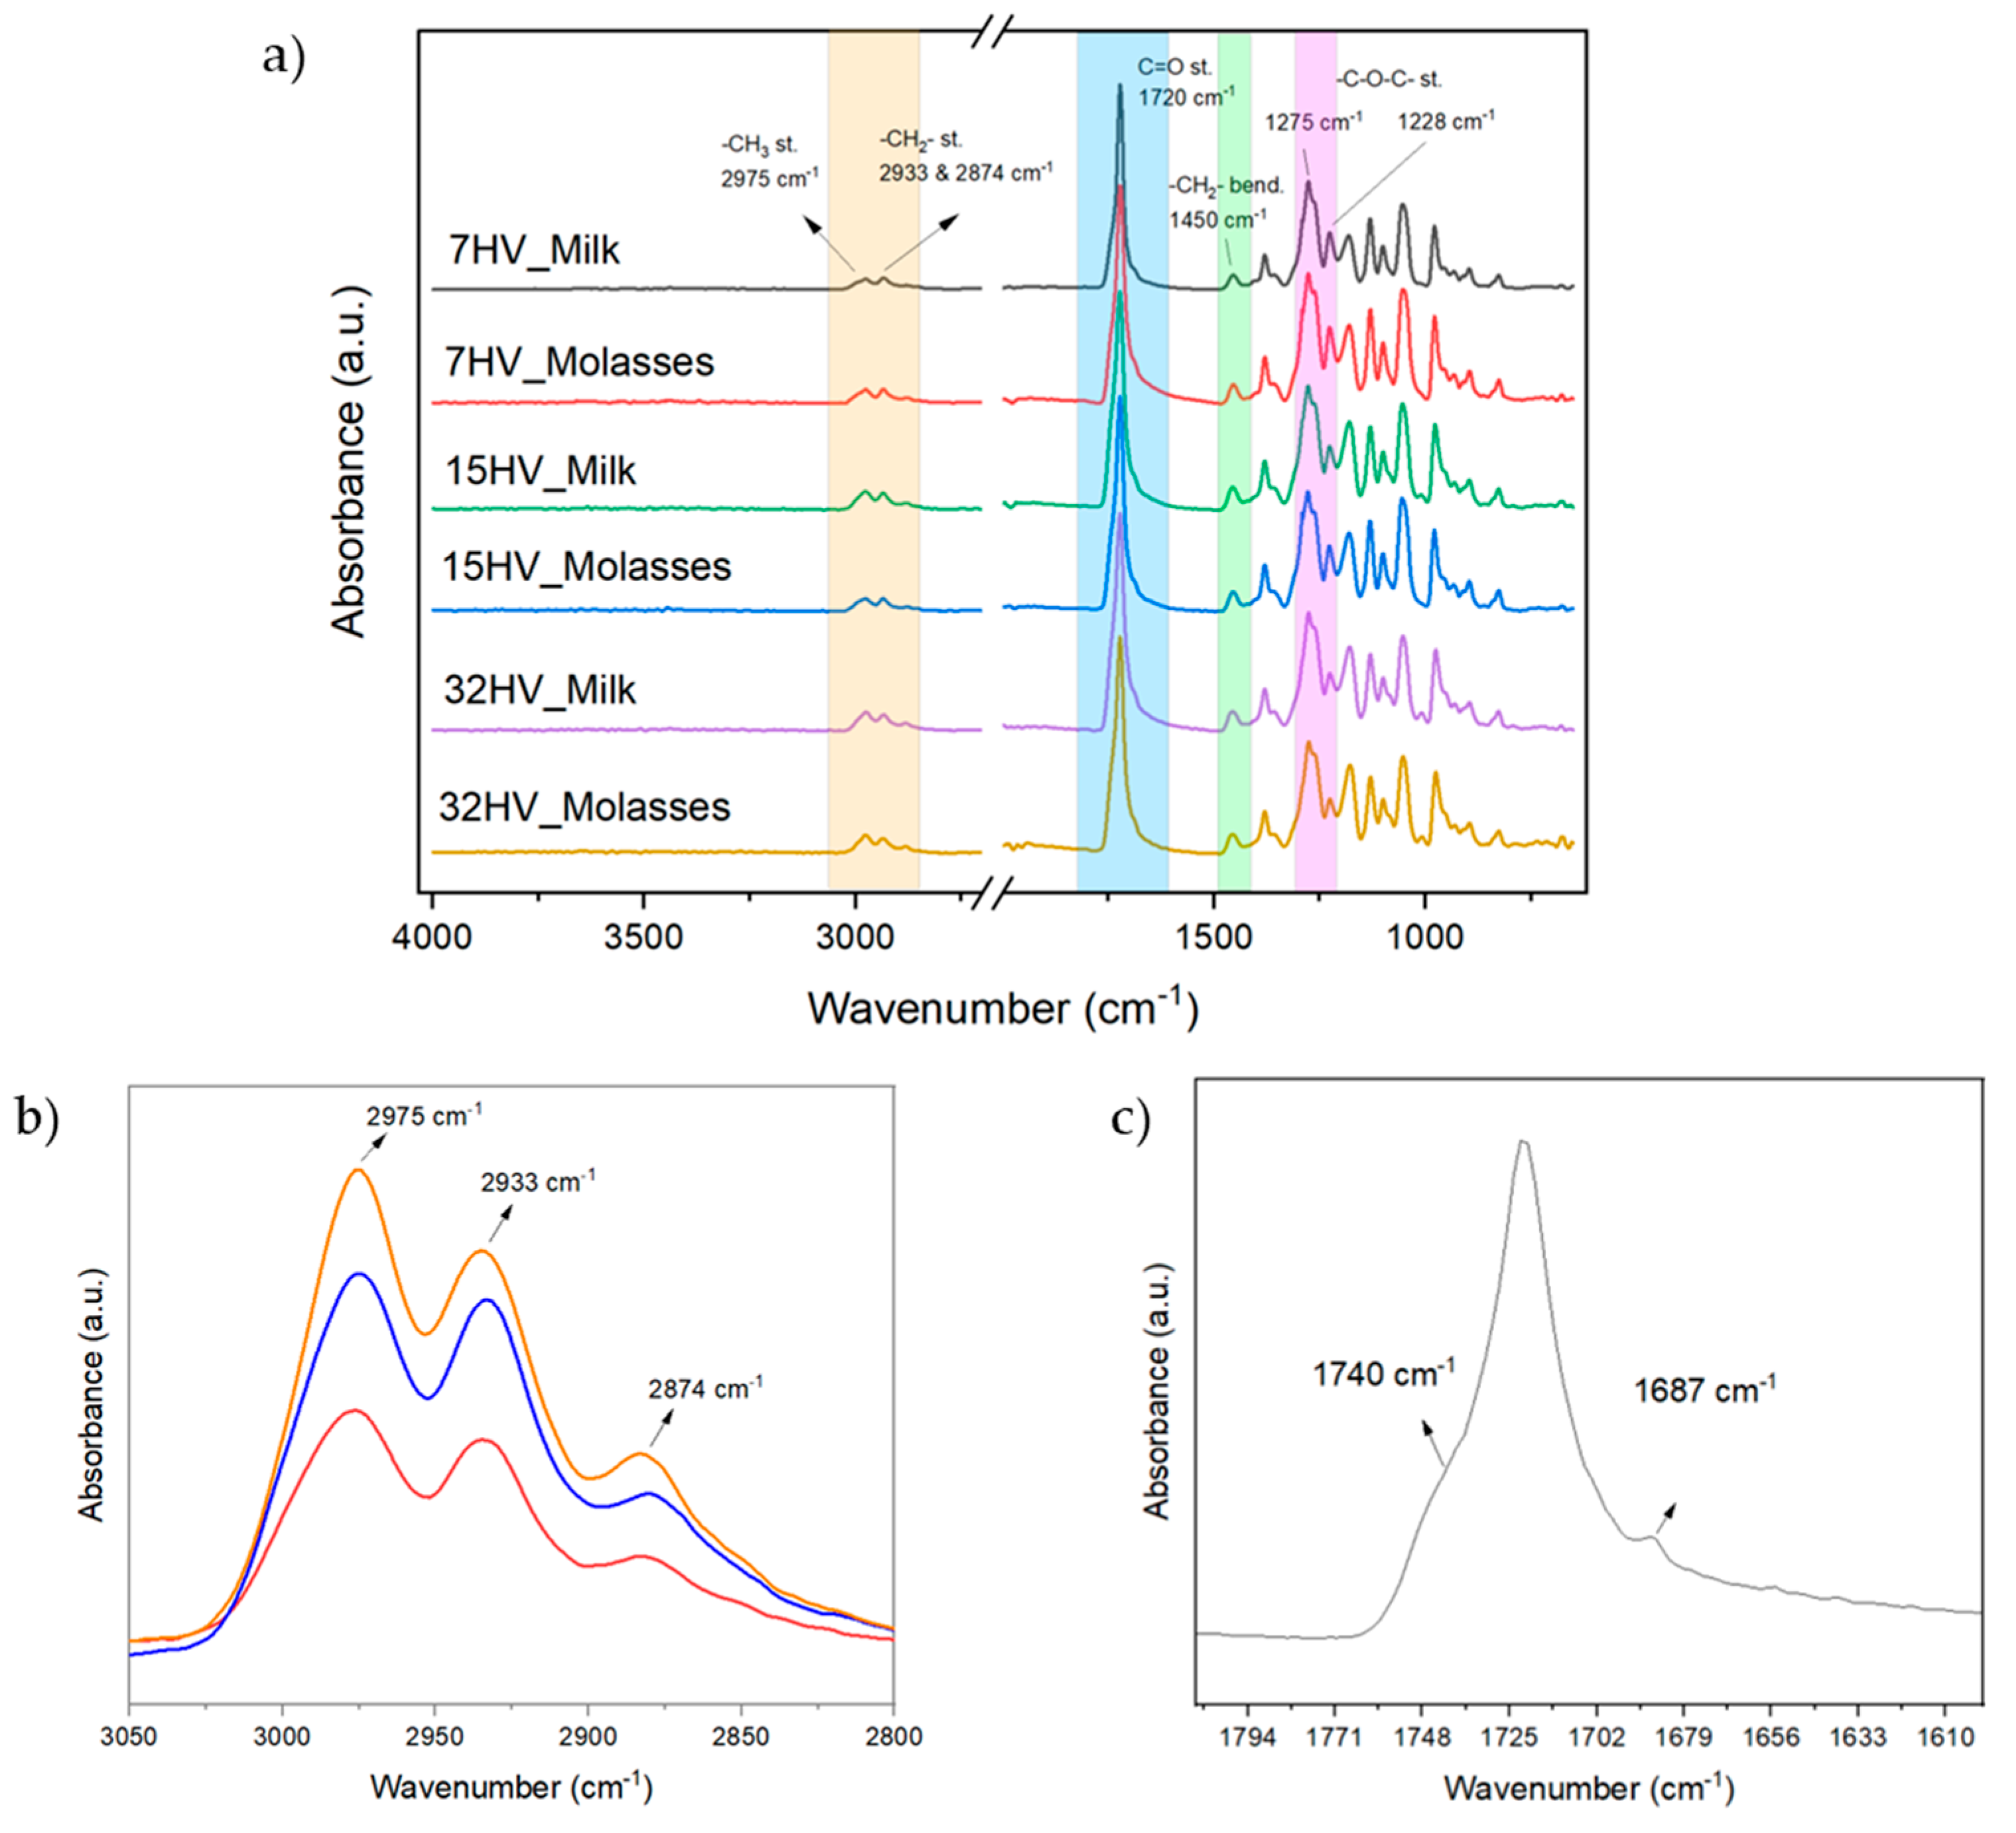
Figure 3.
(a) 1H NMR spectra of PHBV samples derived from molasses with varied 3HV content; (b) Expanded signals assigned to BH1/VH1 chemical groups and (c) Expanded signals assigned to BH2/VH2 chemical groups.
Figure 3.
(a) 1H NMR spectra of PHBV samples derived from molasses with varied 3HV content; (b) Expanded signals assigned to BH1/VH1 chemical groups and (c) Expanded signals assigned to BH2/VH2 chemical groups.
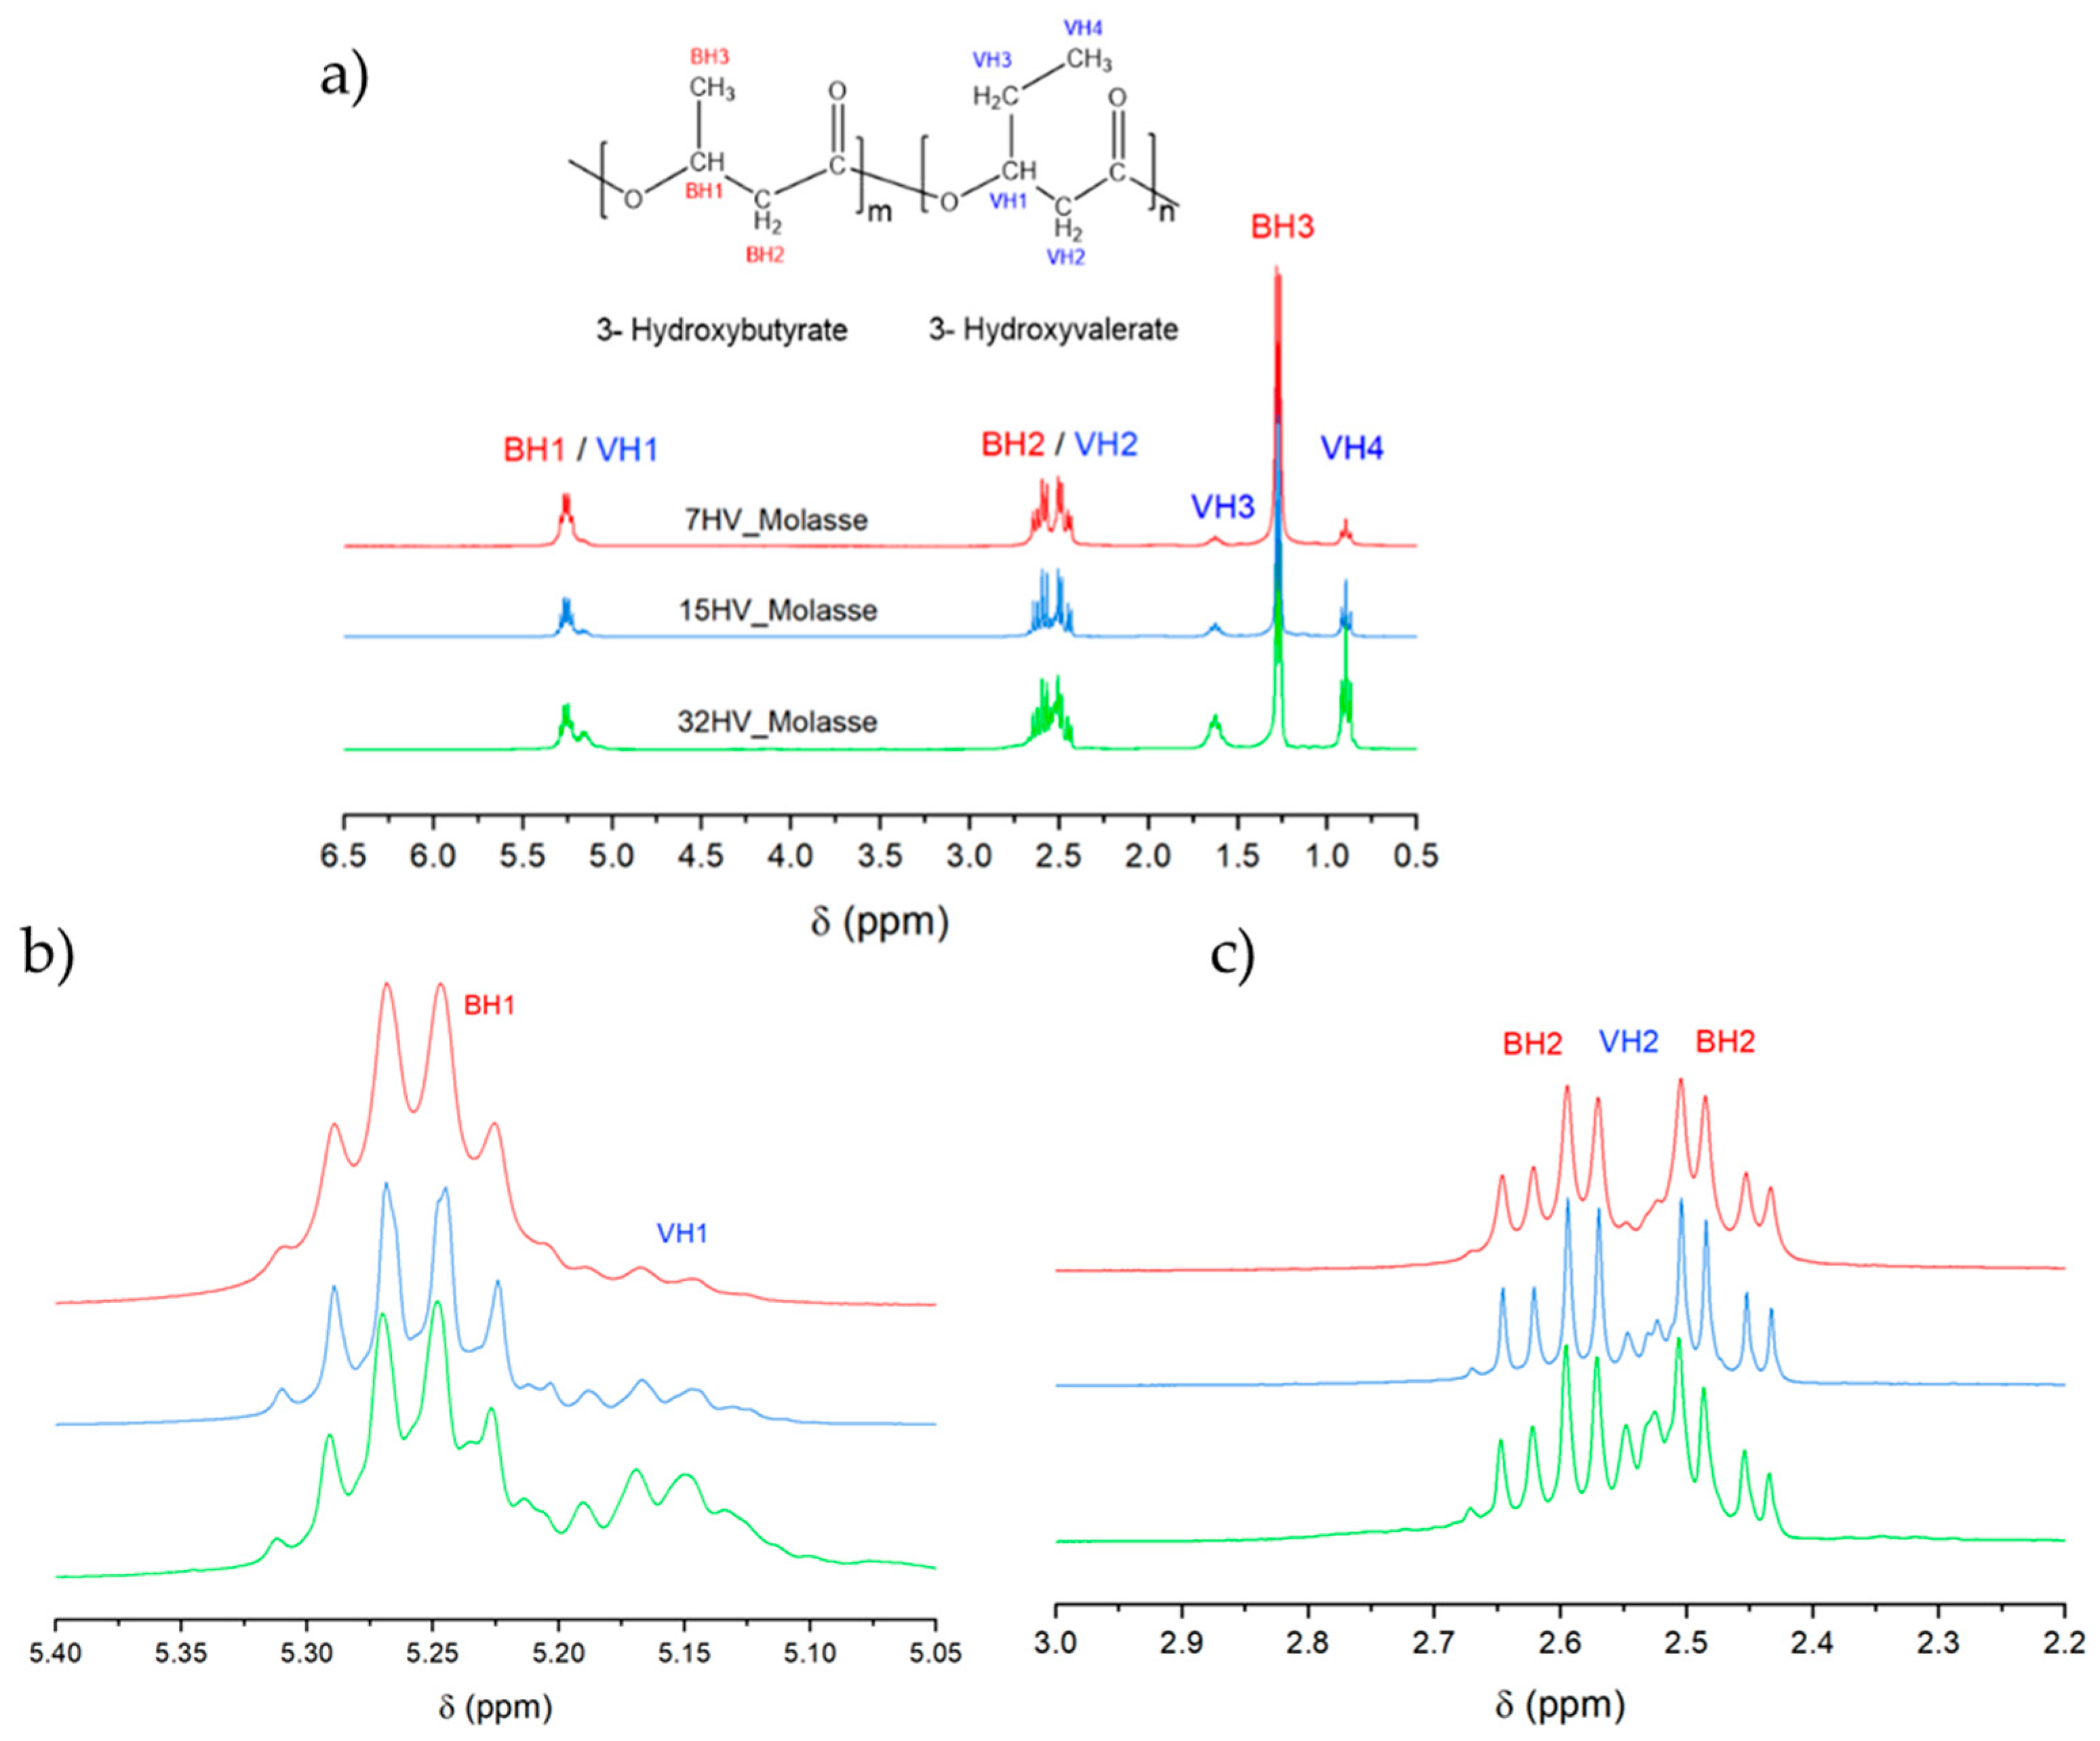
Figure 4.
(a) 13C NMR spectra of PHBV samples derived from molasses residues with varying 3HV content: 7% 3HV (red line), 15% 3HV (blue line) and 32% 3HV (green line); (b-g) Expanded signals assigned to different chemical groups.
Figure 4.
(a) 13C NMR spectra of PHBV samples derived from molasses residues with varying 3HV content: 7% 3HV (red line), 15% 3HV (blue line) and 32% 3HV (green line); (b-g) Expanded signals assigned to different chemical groups.
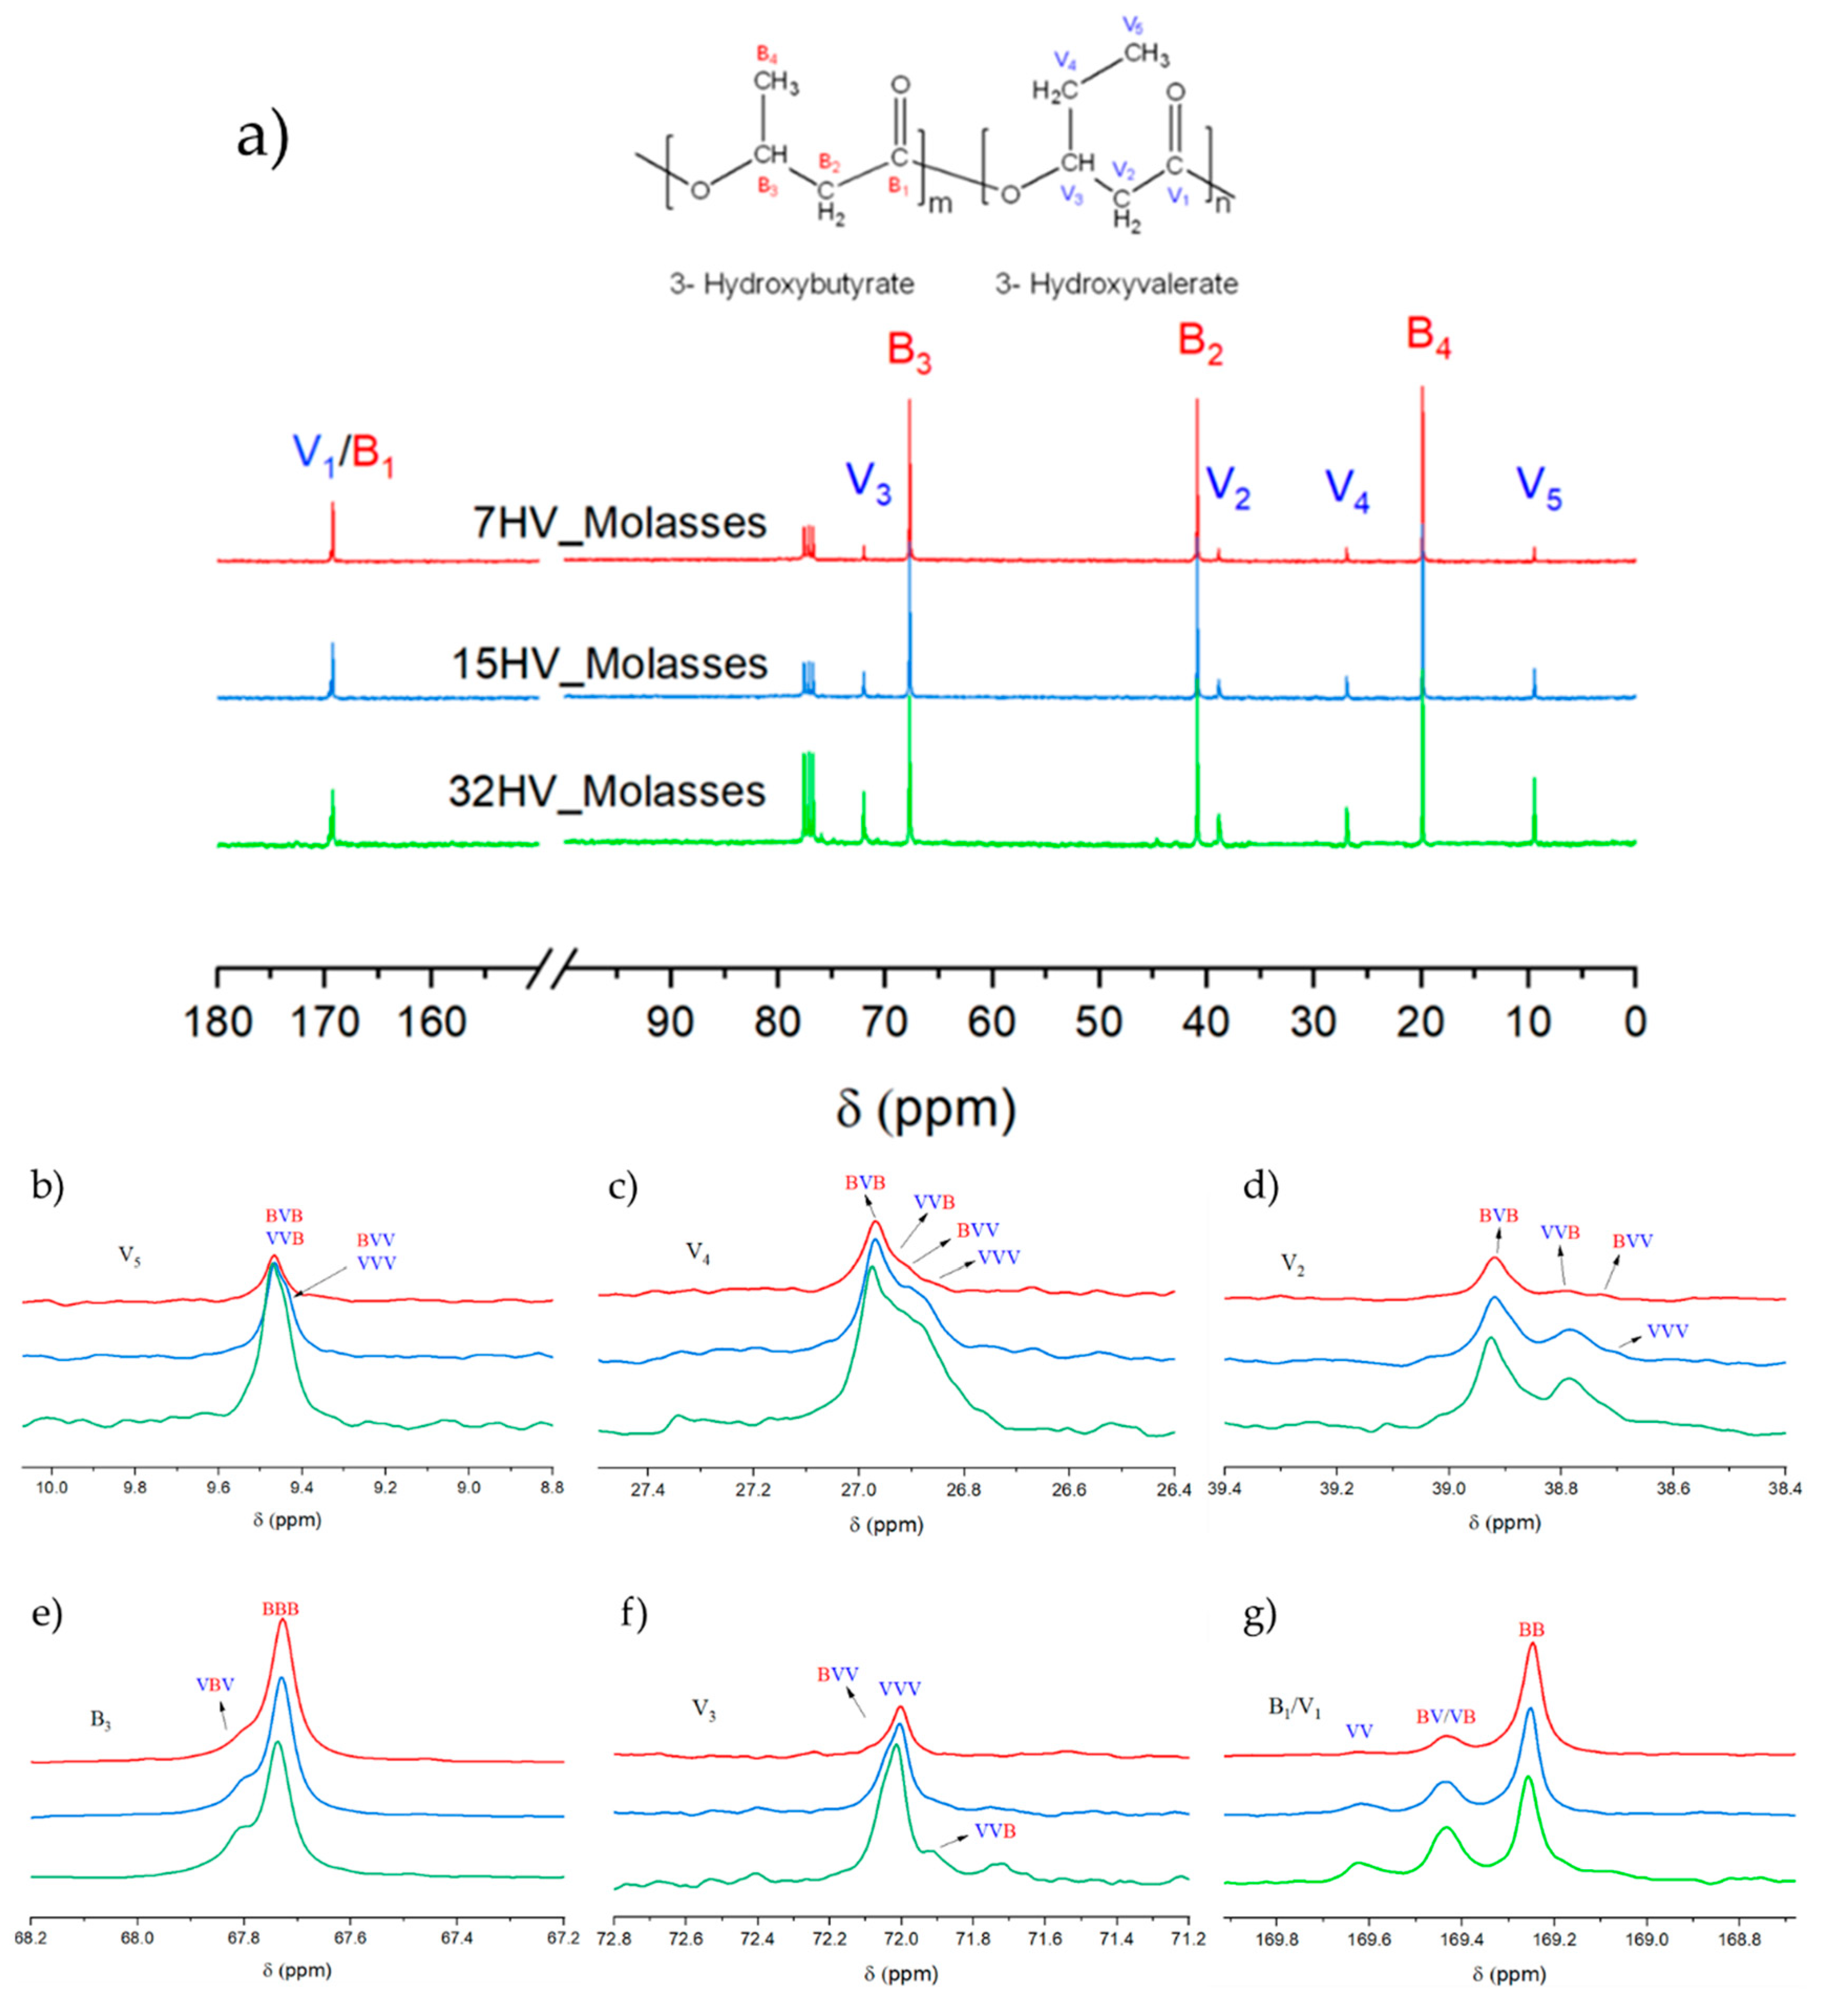
Figure 5.
DSC traces corresponding to the first heating (a), cooling (b) and second heating (c) runs of PHBV samples having 15% of 3HV content, obtained from milk (red) and molasses (blue) residues.
Figure 5.
DSC traces corresponding to the first heating (a), cooling (b) and second heating (c) runs of PHBV samples having 15% of 3HV content, obtained from milk (red) and molasses (blue) residues.
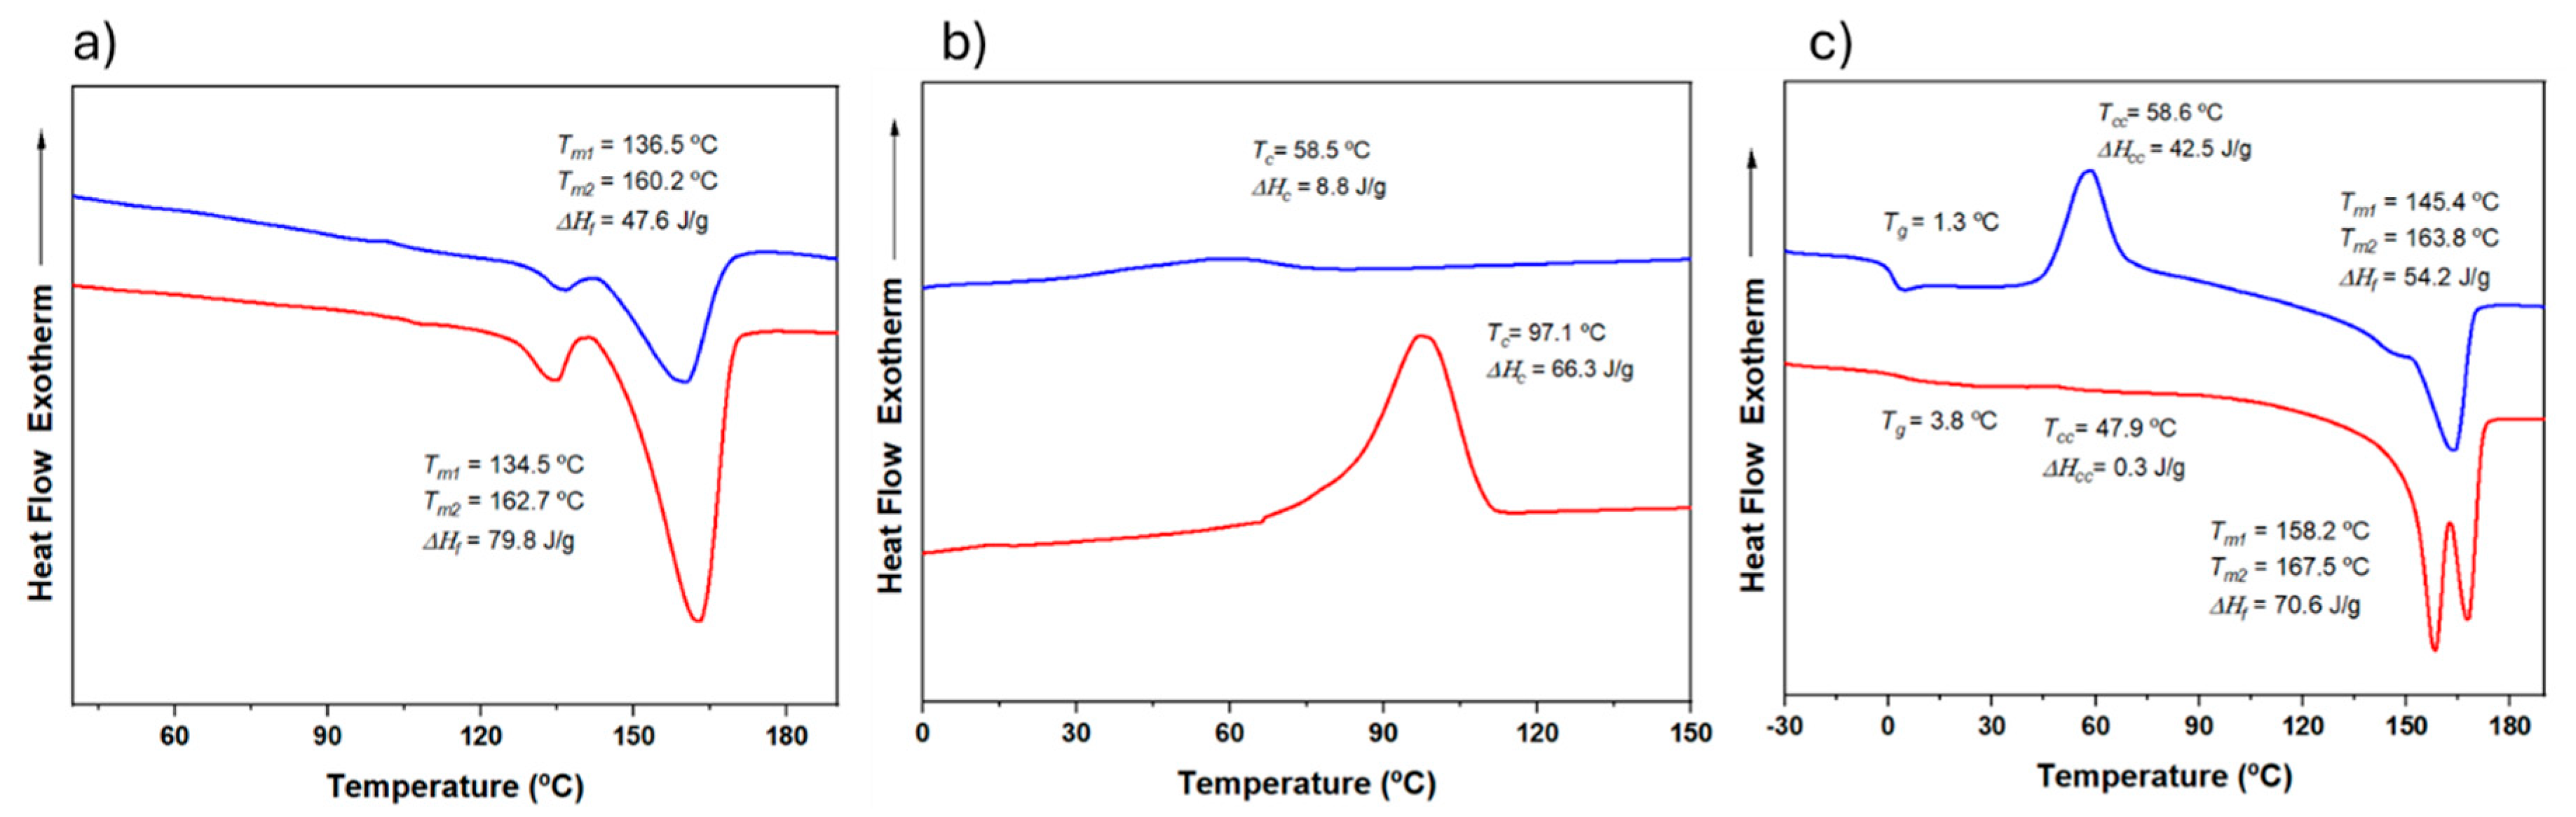
Figure 6.
DSC second heating run of PHBV samples having 7% (red), 15% (blue) and 32% (green) of 3HV units. Copolymers were obtained from milk (solid lines) and molasses feedstocks (dashed lines).
Figure 6.
DSC second heating run of PHBV samples having 7% (red), 15% (blue) and 32% (green) of 3HV units. Copolymers were obtained from milk (solid lines) and molasses feedstocks (dashed lines).
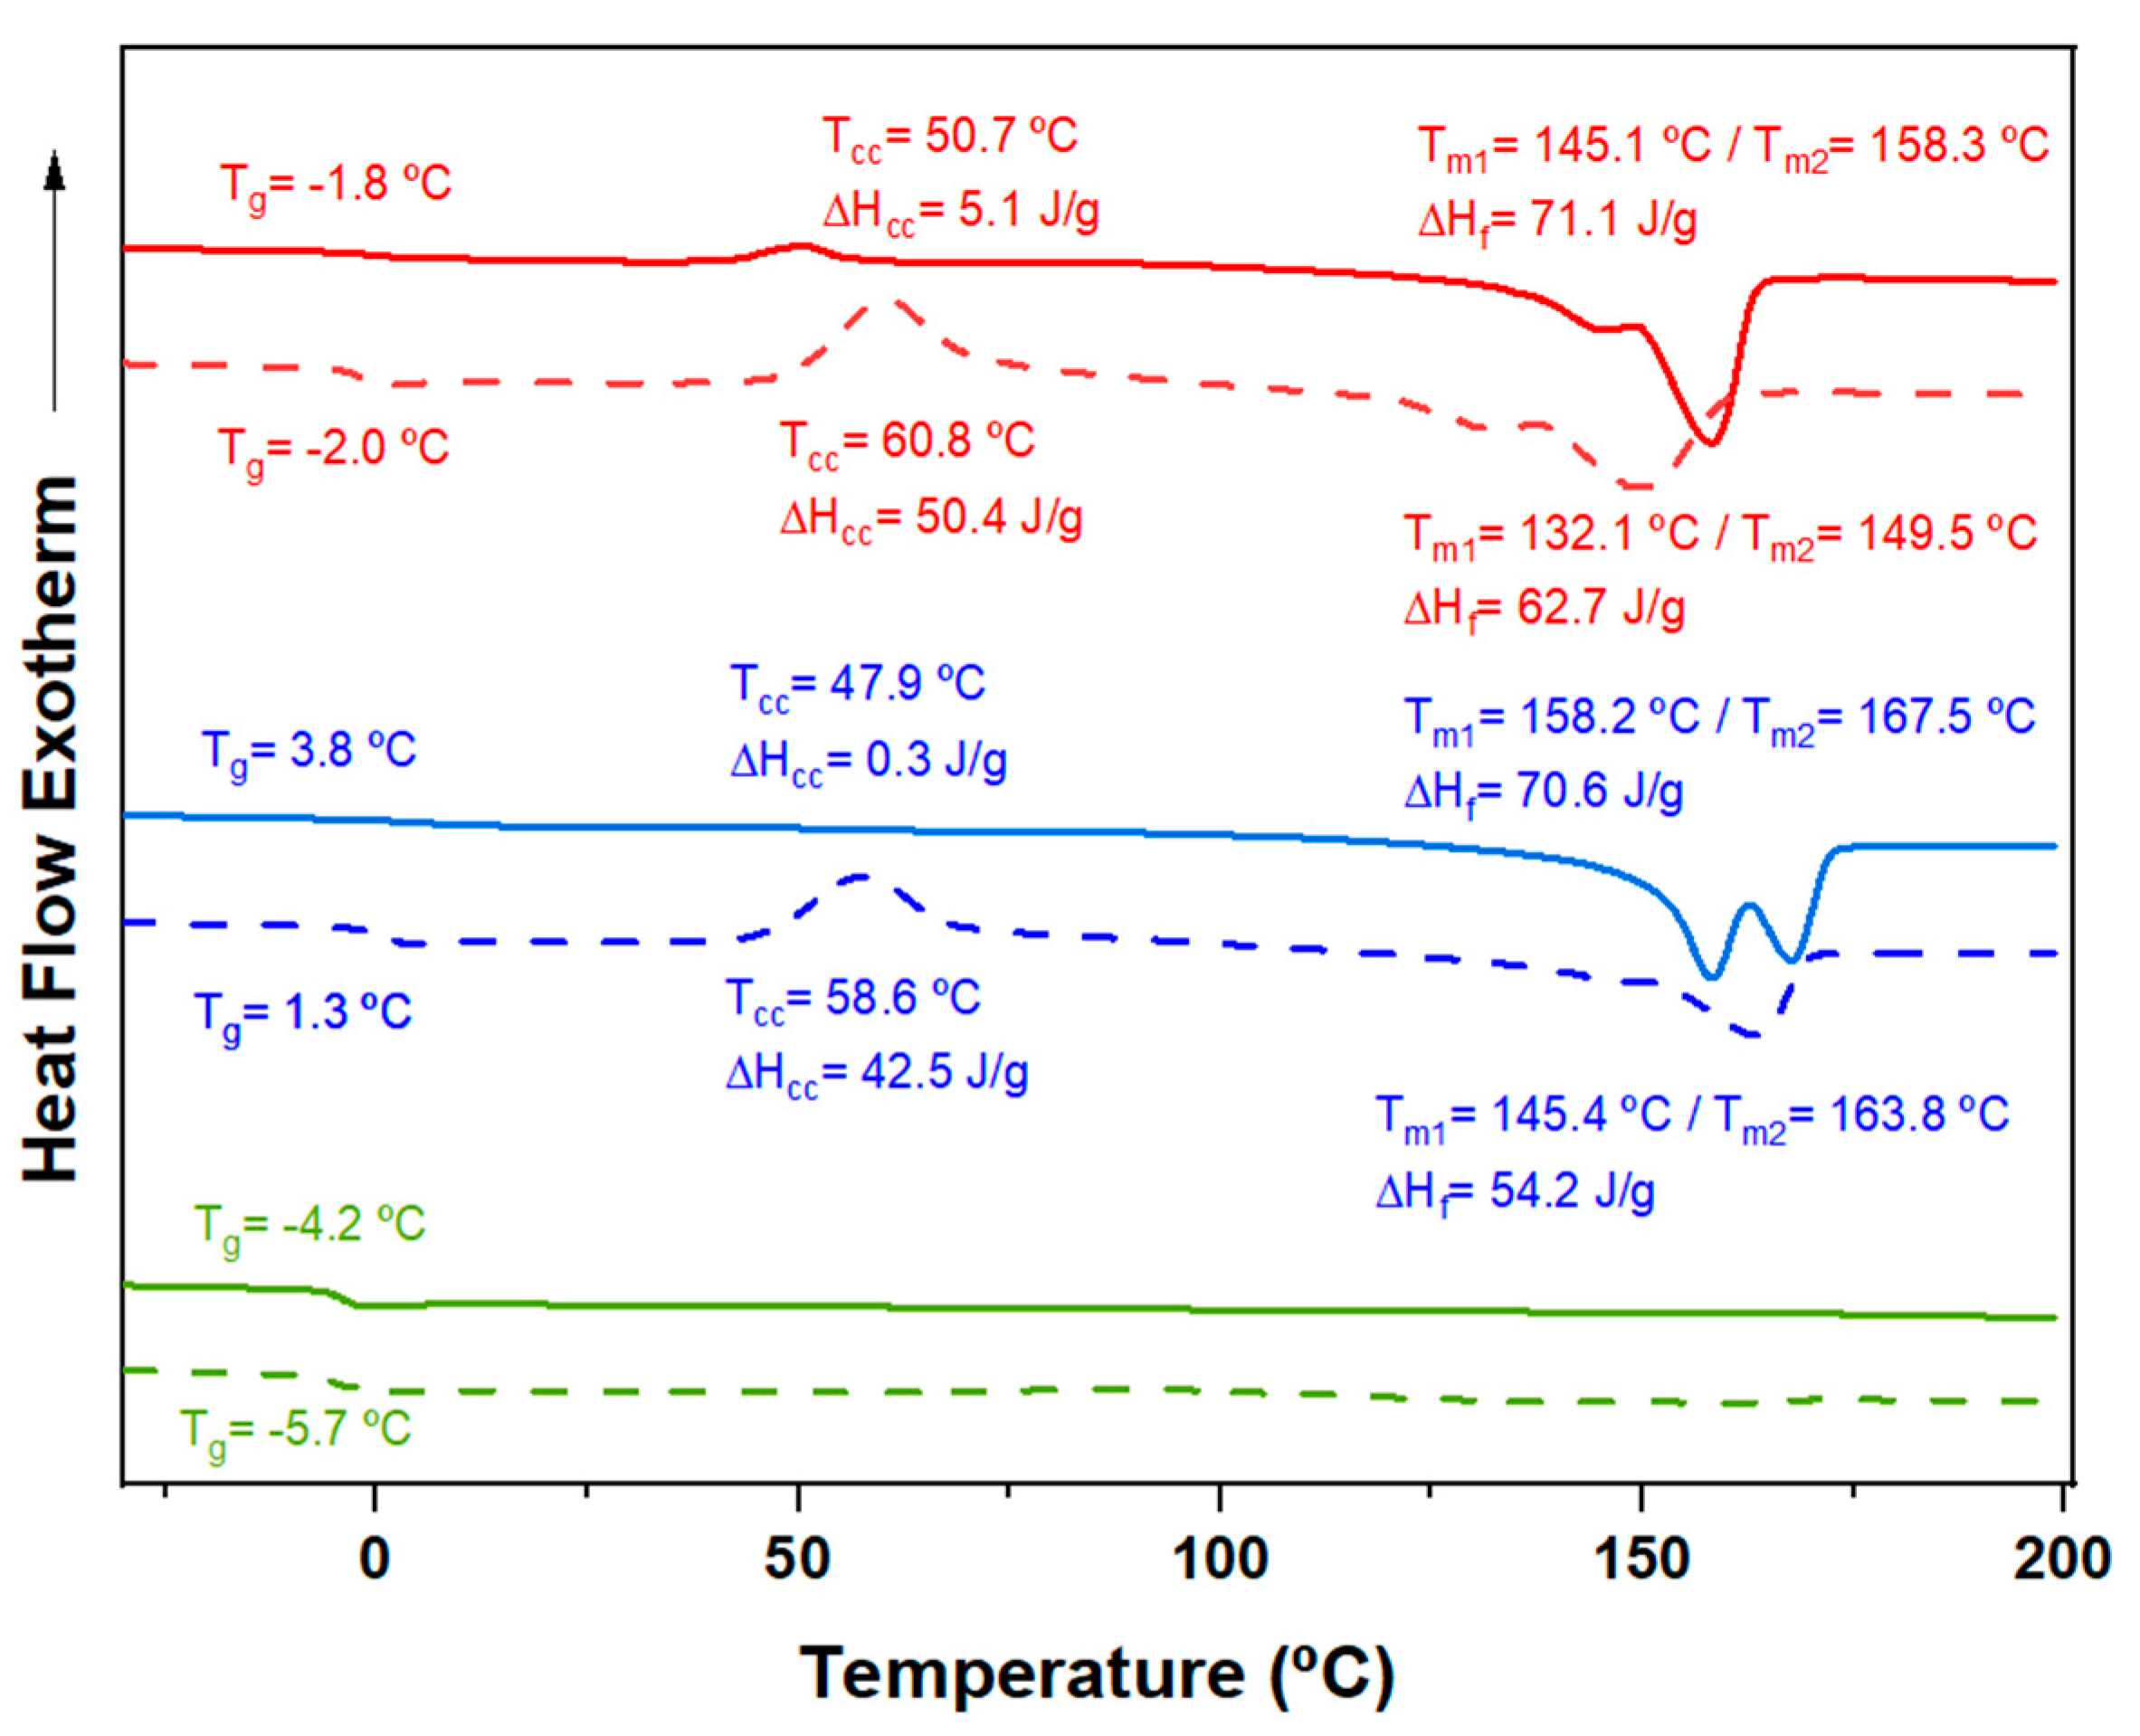
Figure 8.
Mechanical properties of PHBV film samples derived from different residues. (a) Plot of the change in modulus and elongation; (b) Plot of the change in tensile strength and elongation.
Figure 8.
Mechanical properties of PHBV film samples derived from different residues. (a) Plot of the change in modulus and elongation; (b) Plot of the change in tensile strength and elongation.
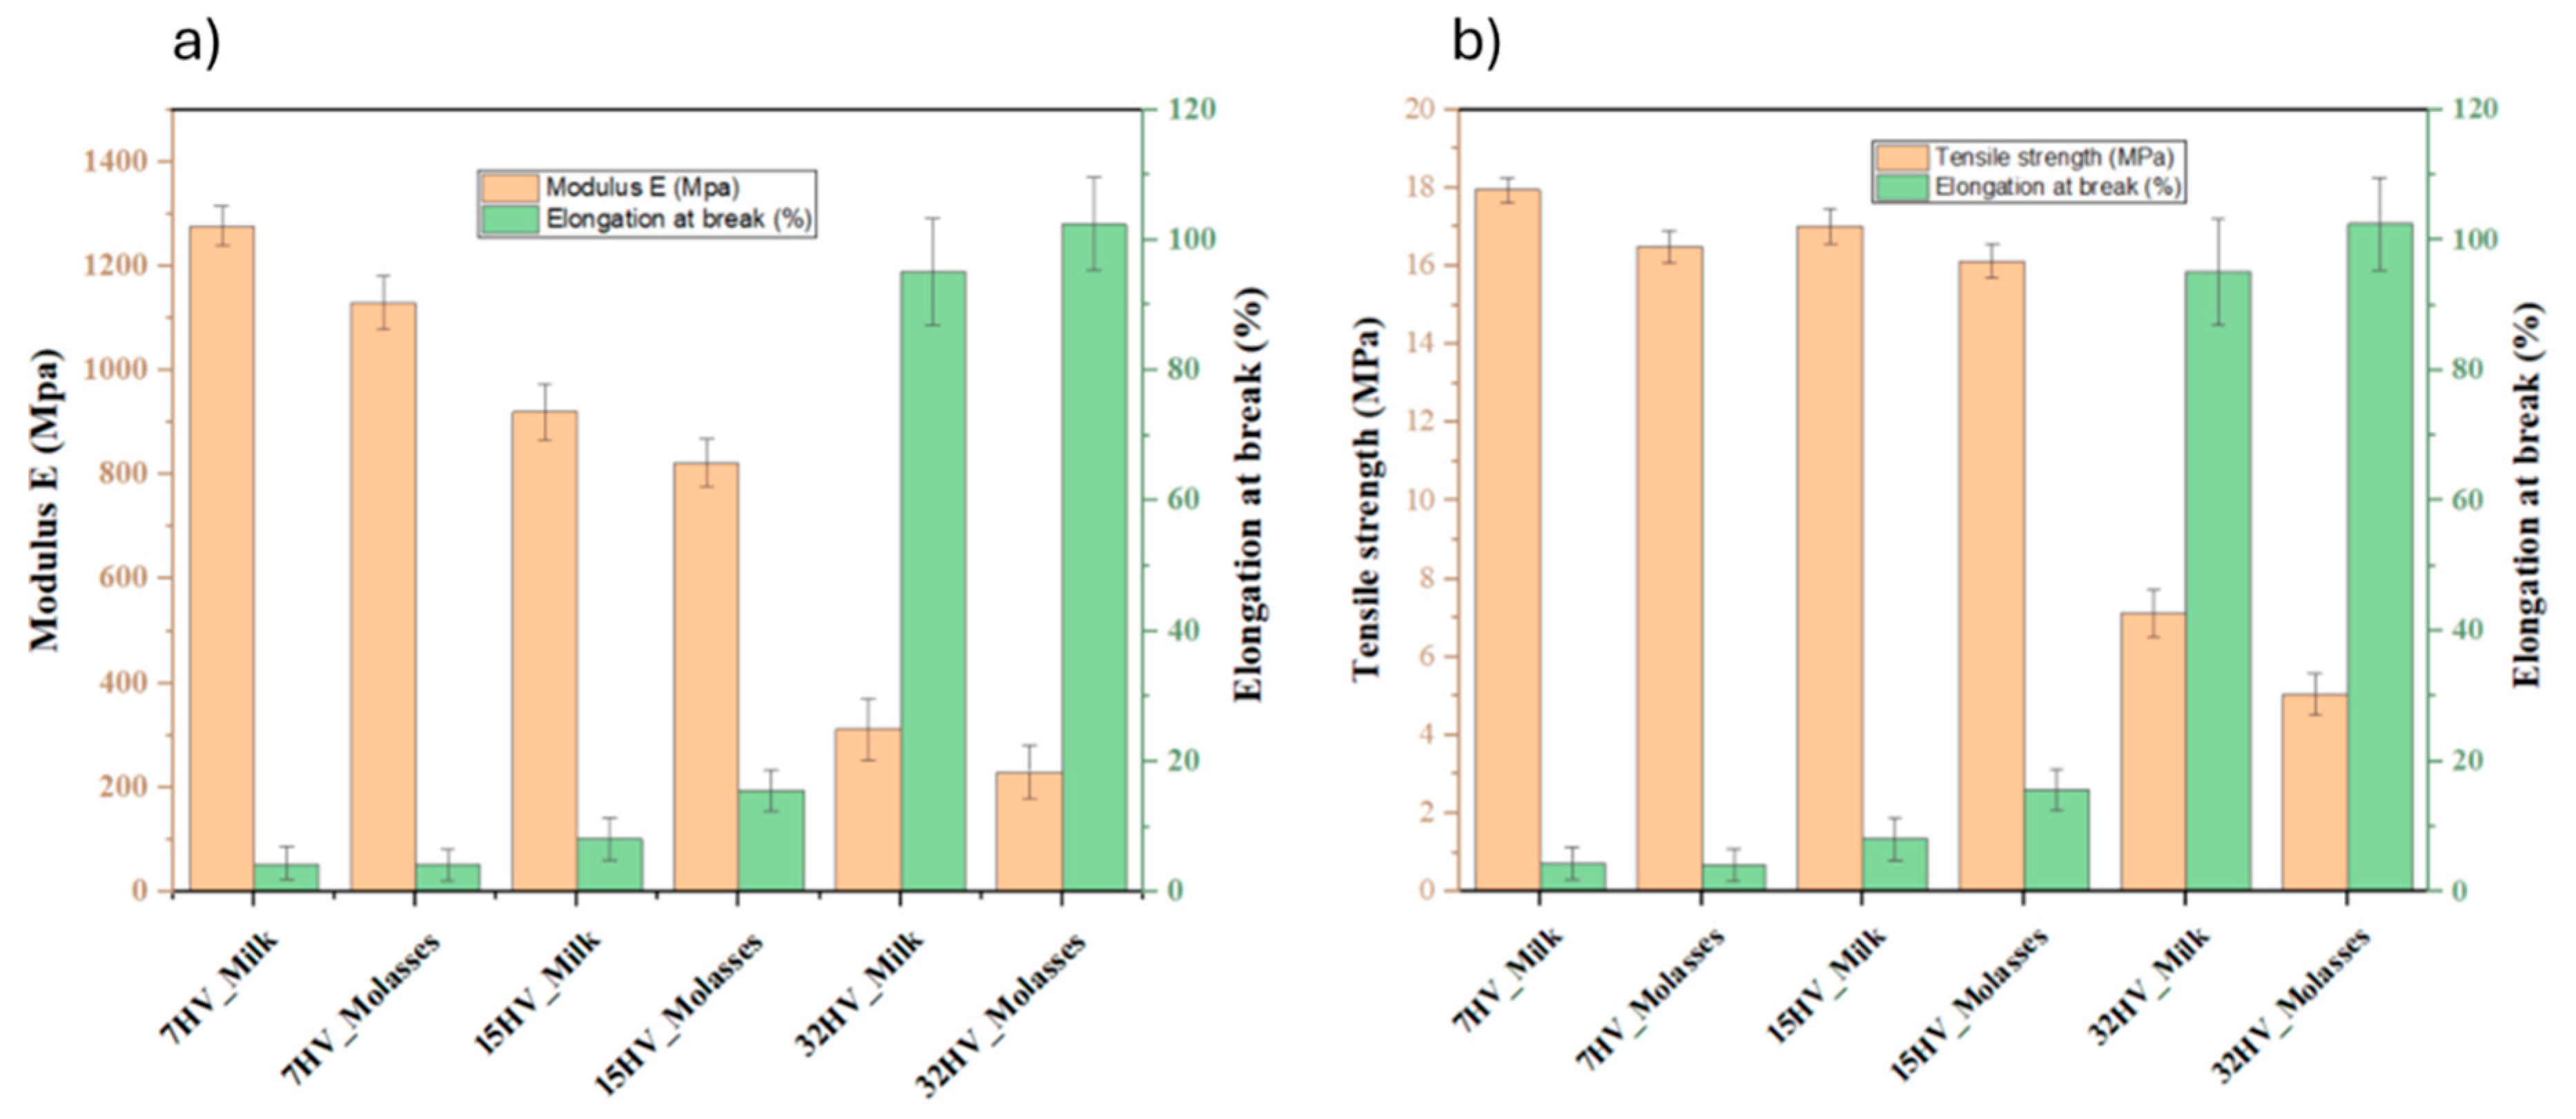
Figure 9.
Optical micrographs of electrospun fibers from 7HV_Molasses and processed under different conditions. (a) Variation in concentration; (b) Variation in feeding rate; (c) Variation in applied voltage. Scale bar 100 µm.
Figure 9.
Optical micrographs of electrospun fibers from 7HV_Molasses and processed under different conditions. (a) Variation in concentration; (b) Variation in feeding rate; (c) Variation in applied voltage. Scale bar 100 µm.
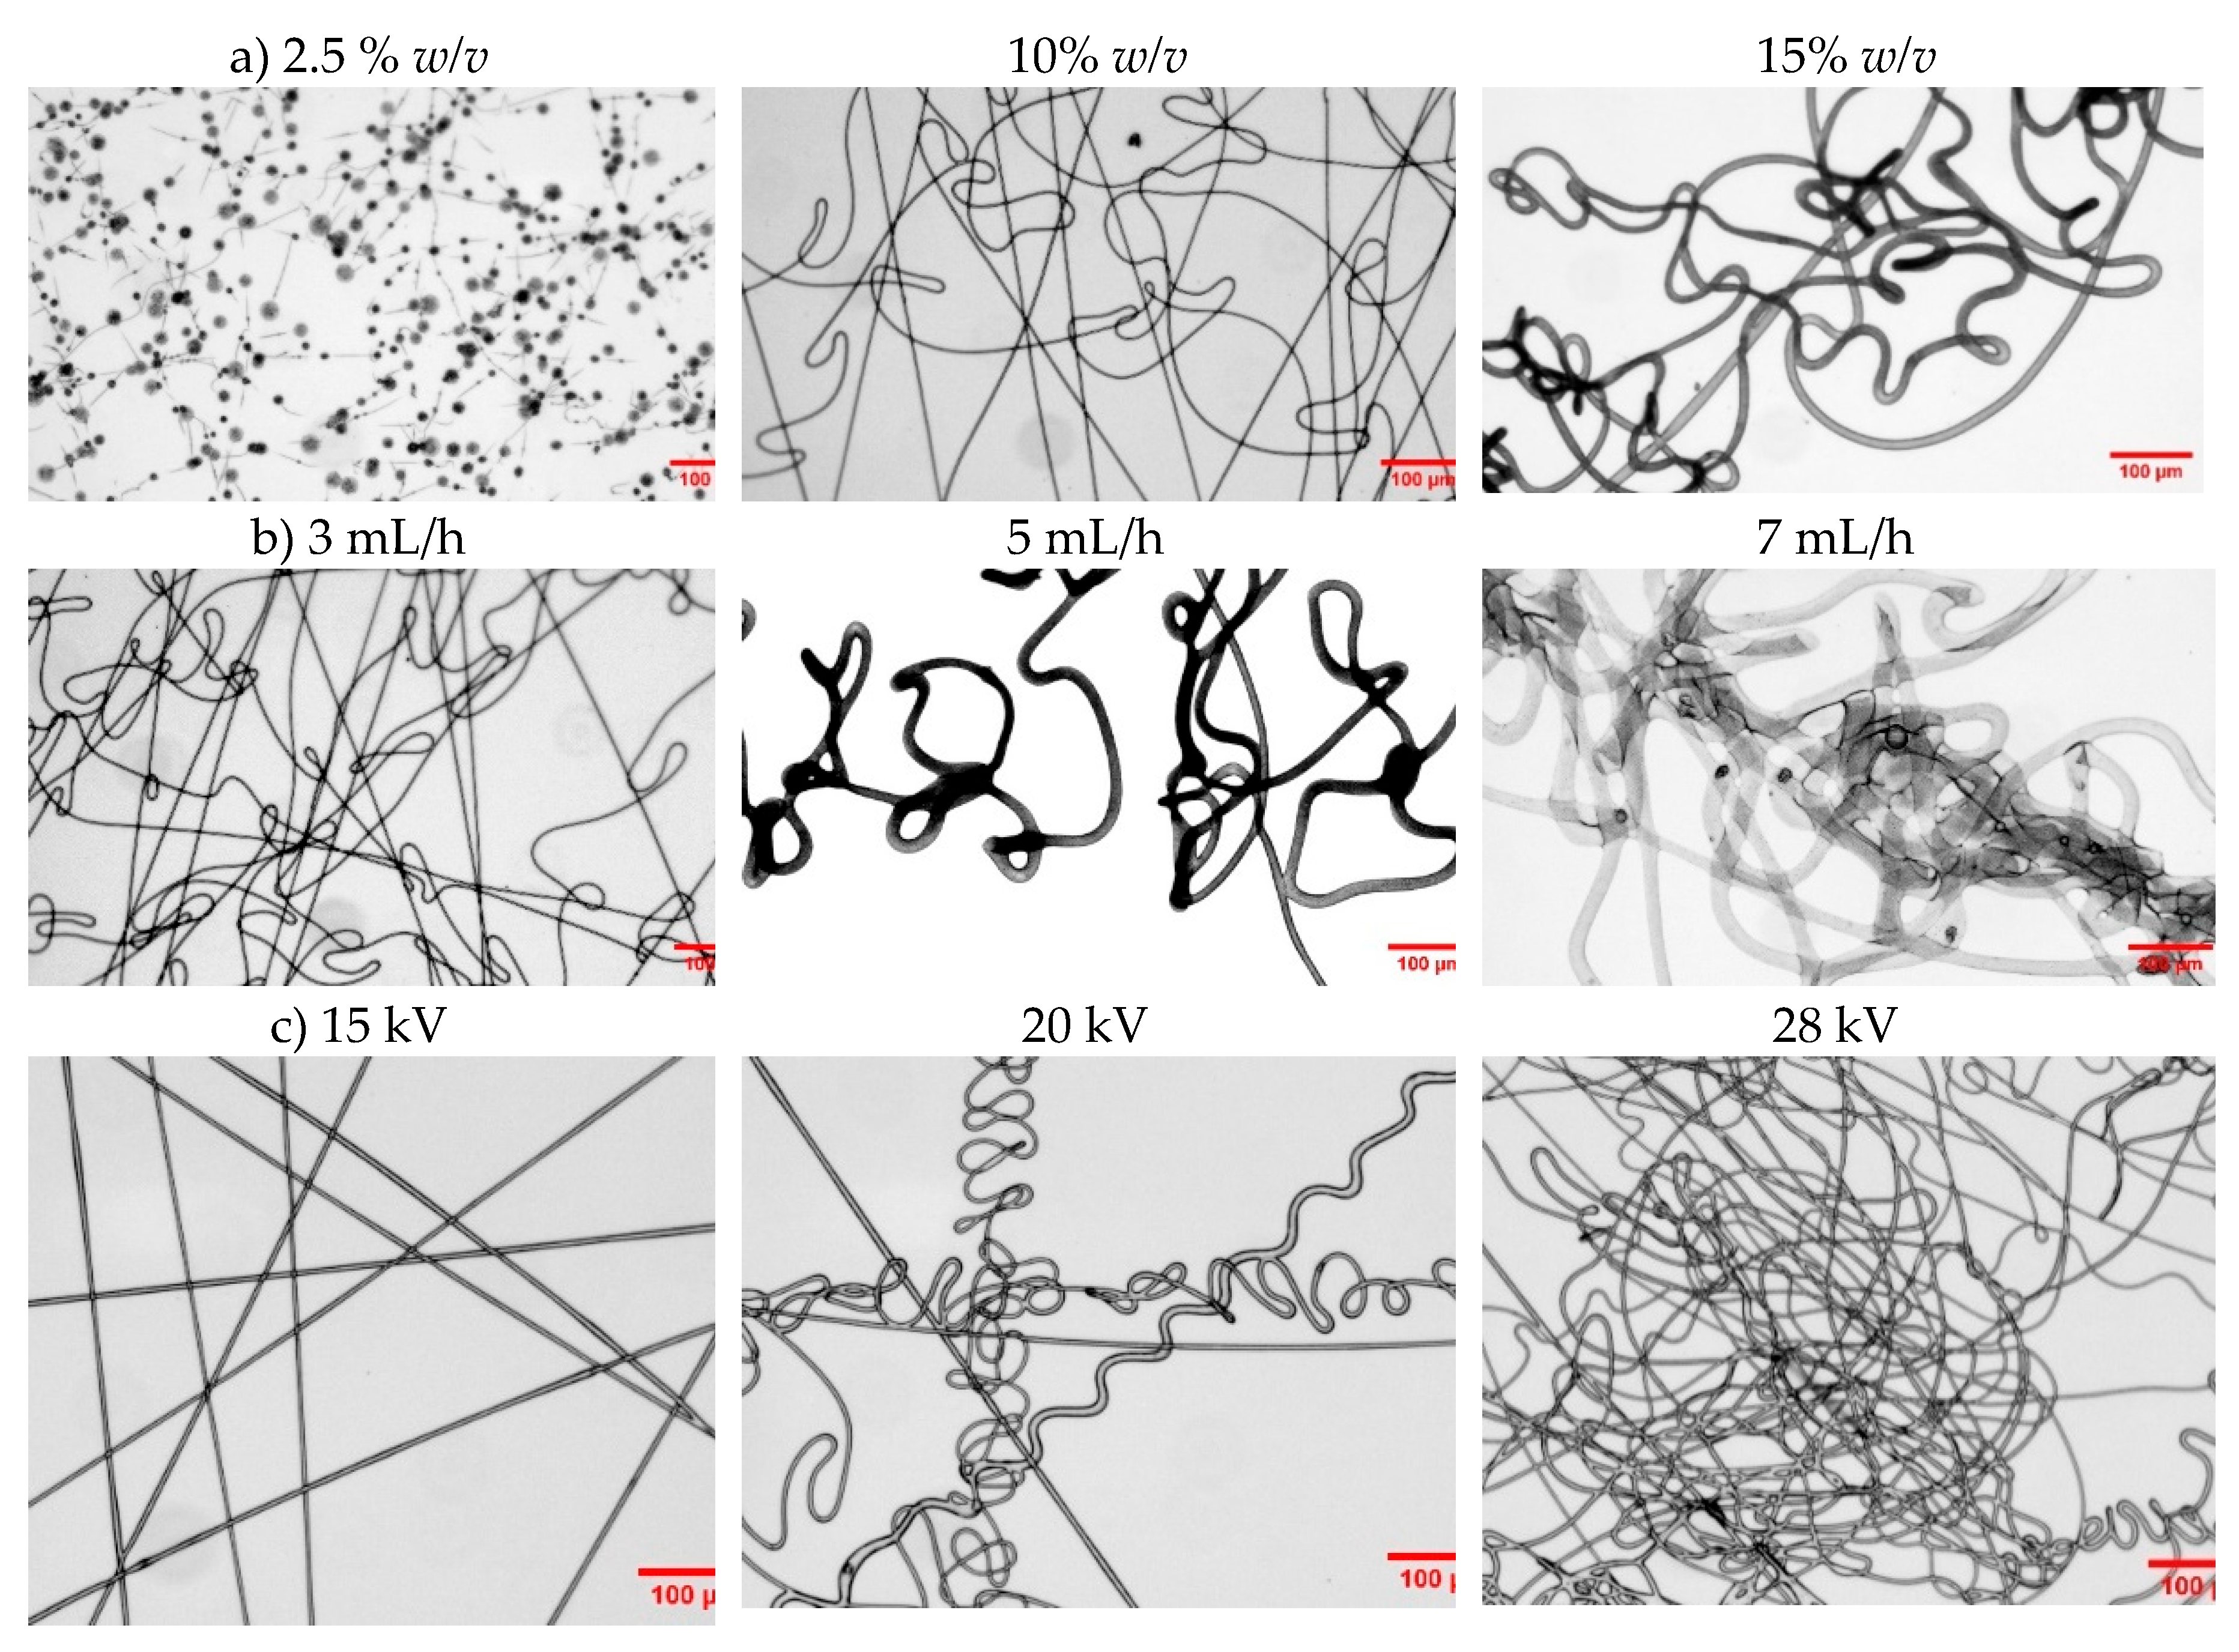
Figure 10.
Molecular weight of pristine PHBV and corresponding electrospun fibers.
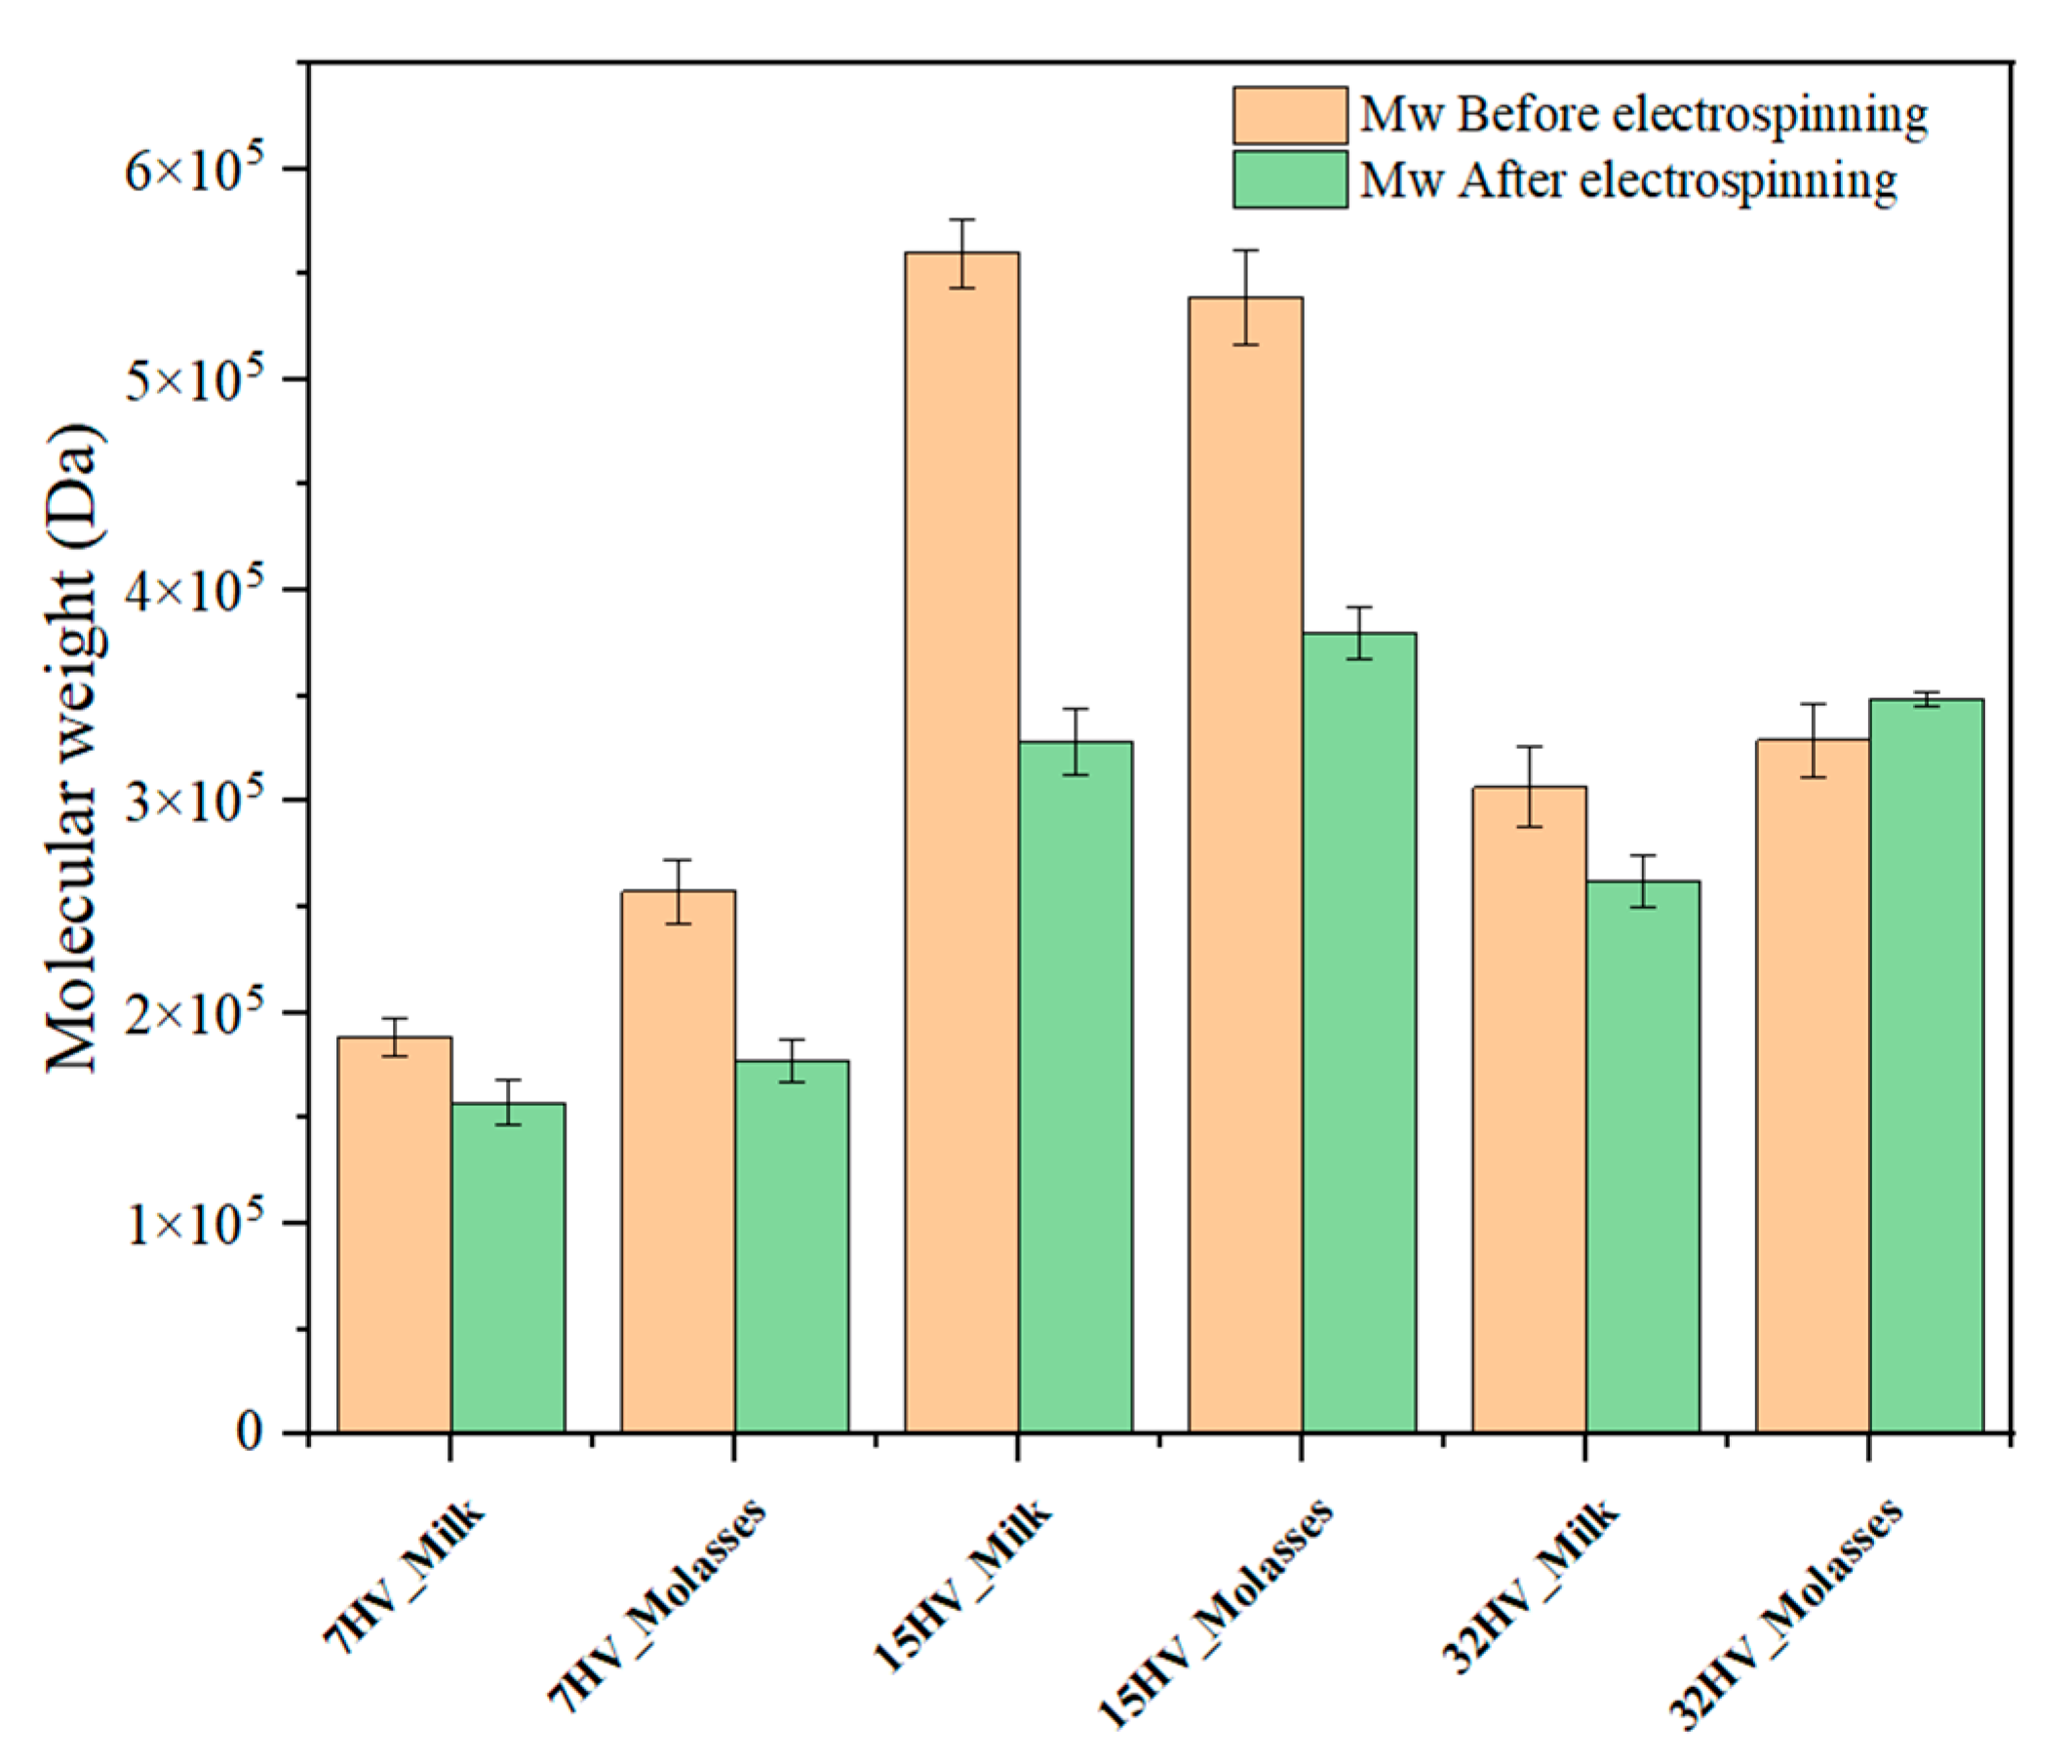
Figure 11.
SEM images of the different PHBV electrospun fibers produced under optimized condition and corresponding fiber distribution.
Figure 11.
SEM images of the different PHBV electrospun fibers produced under optimized condition and corresponding fiber distribution.
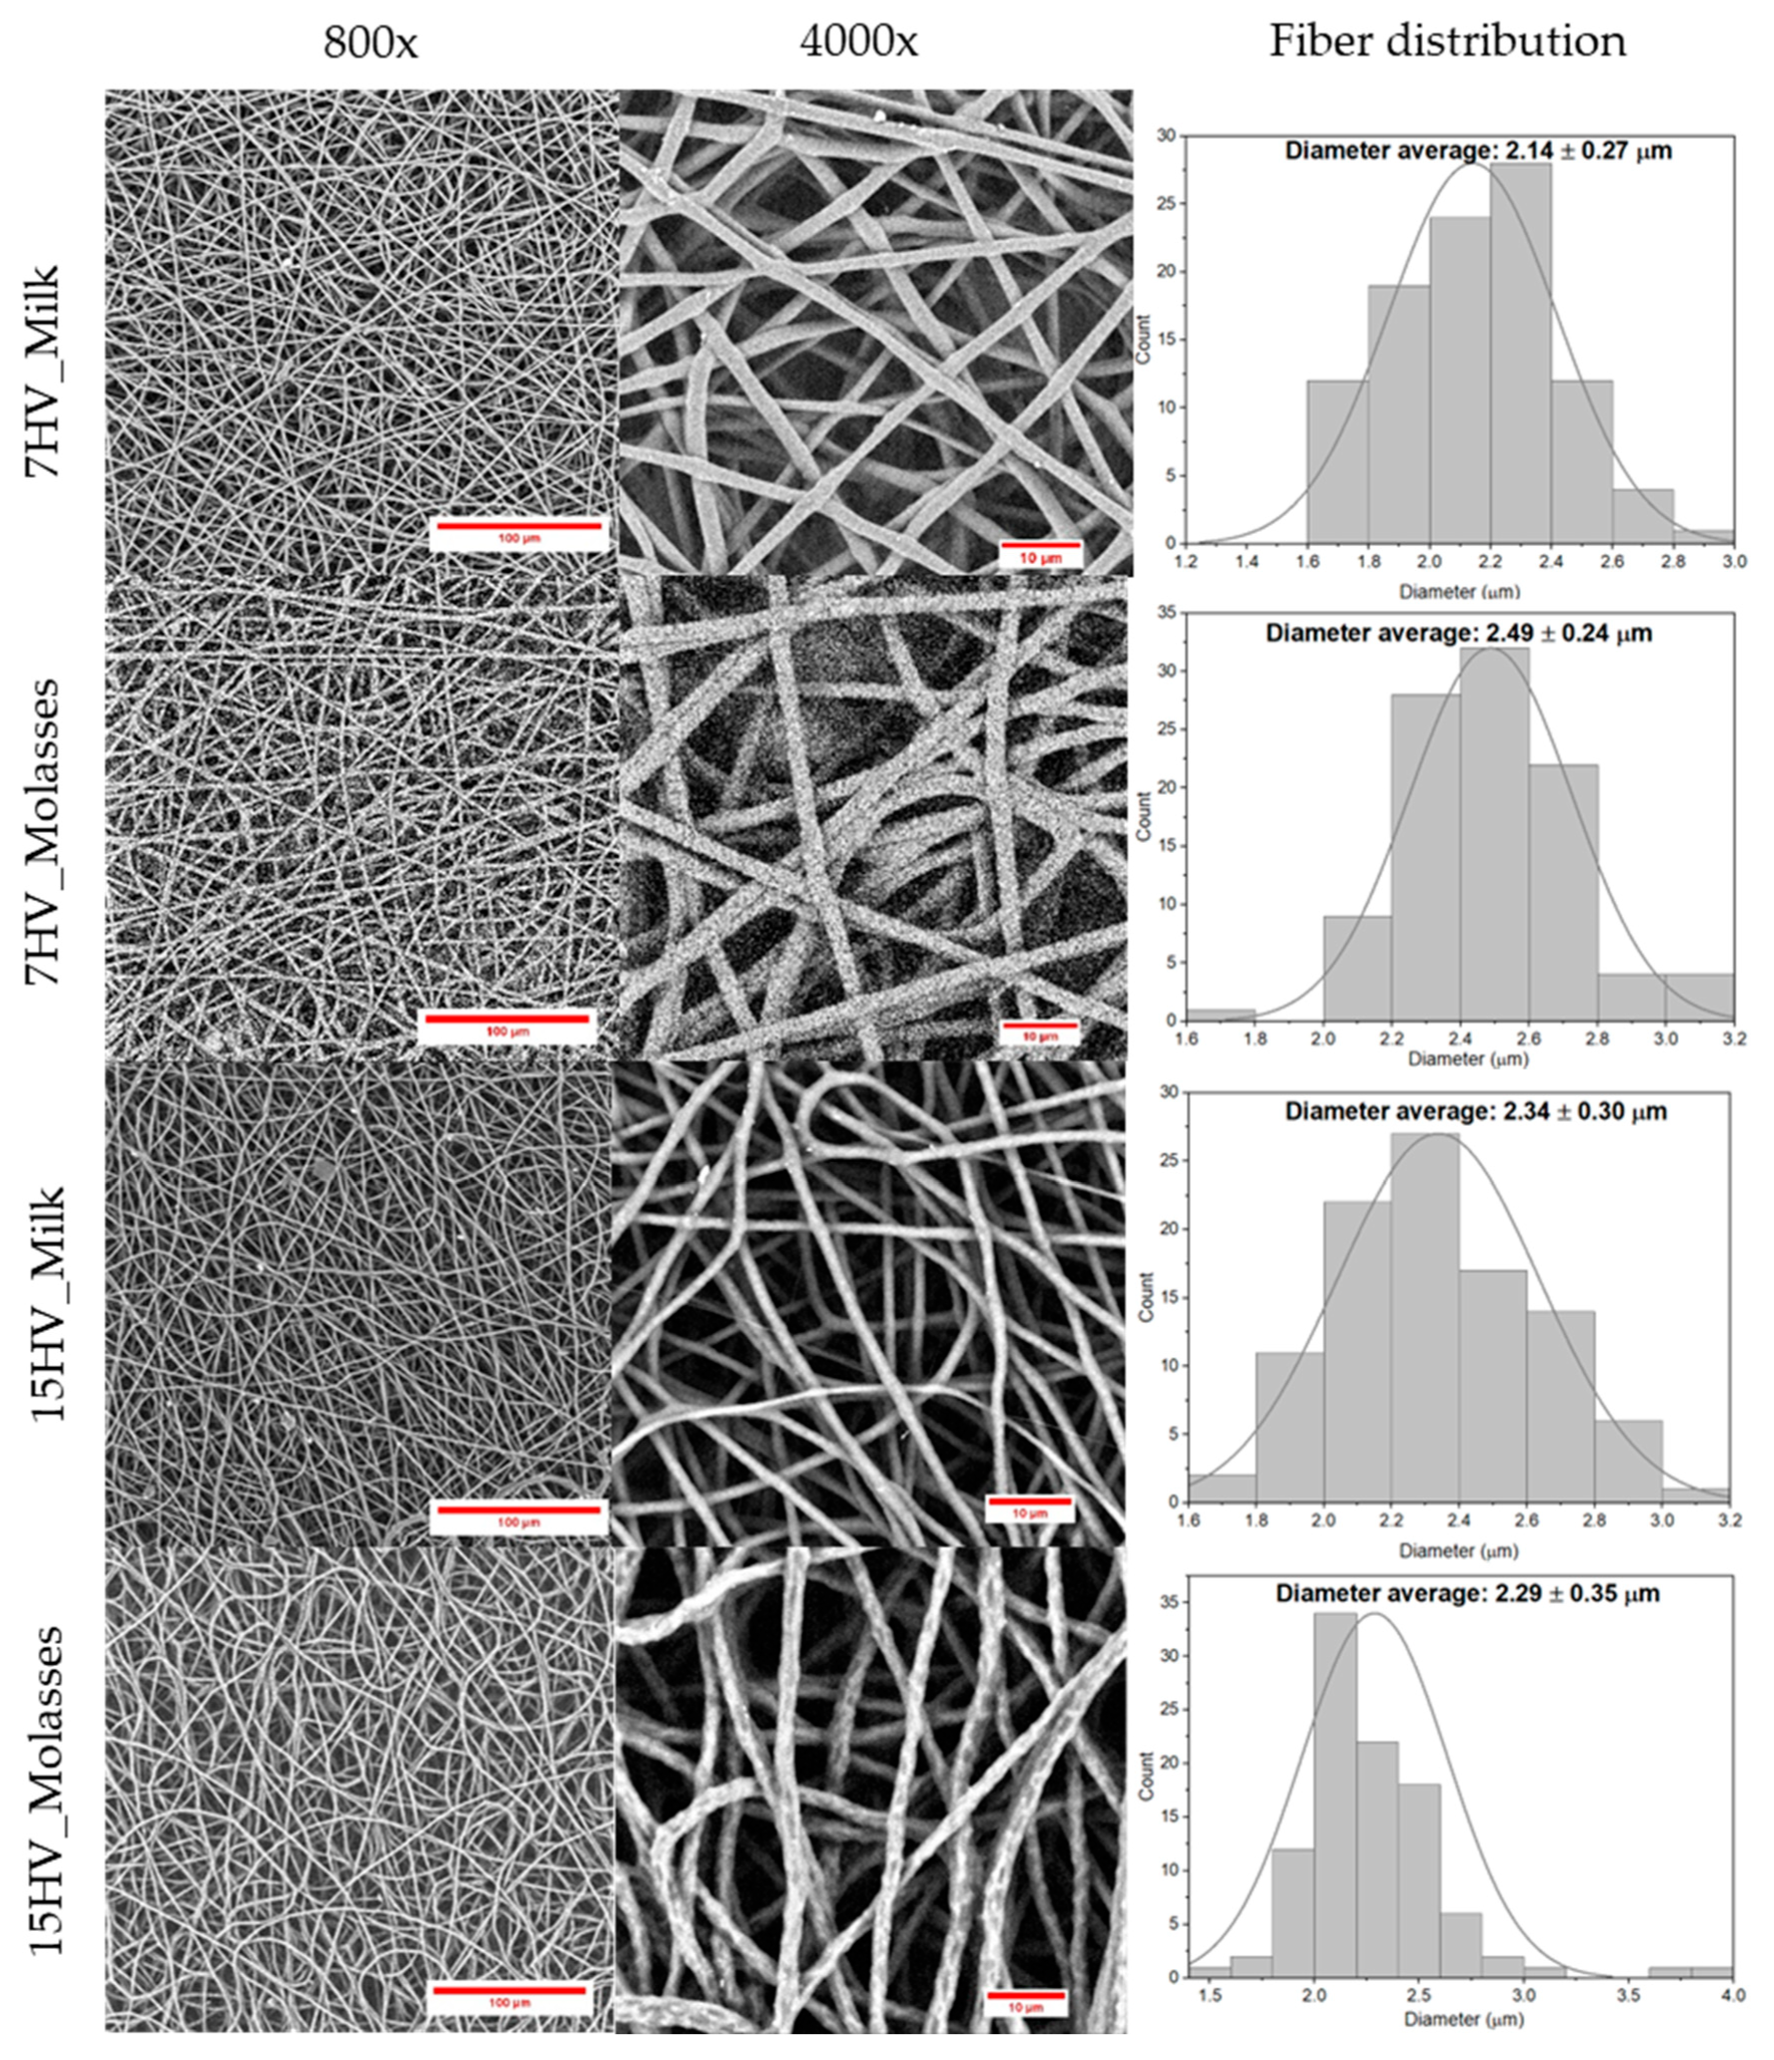
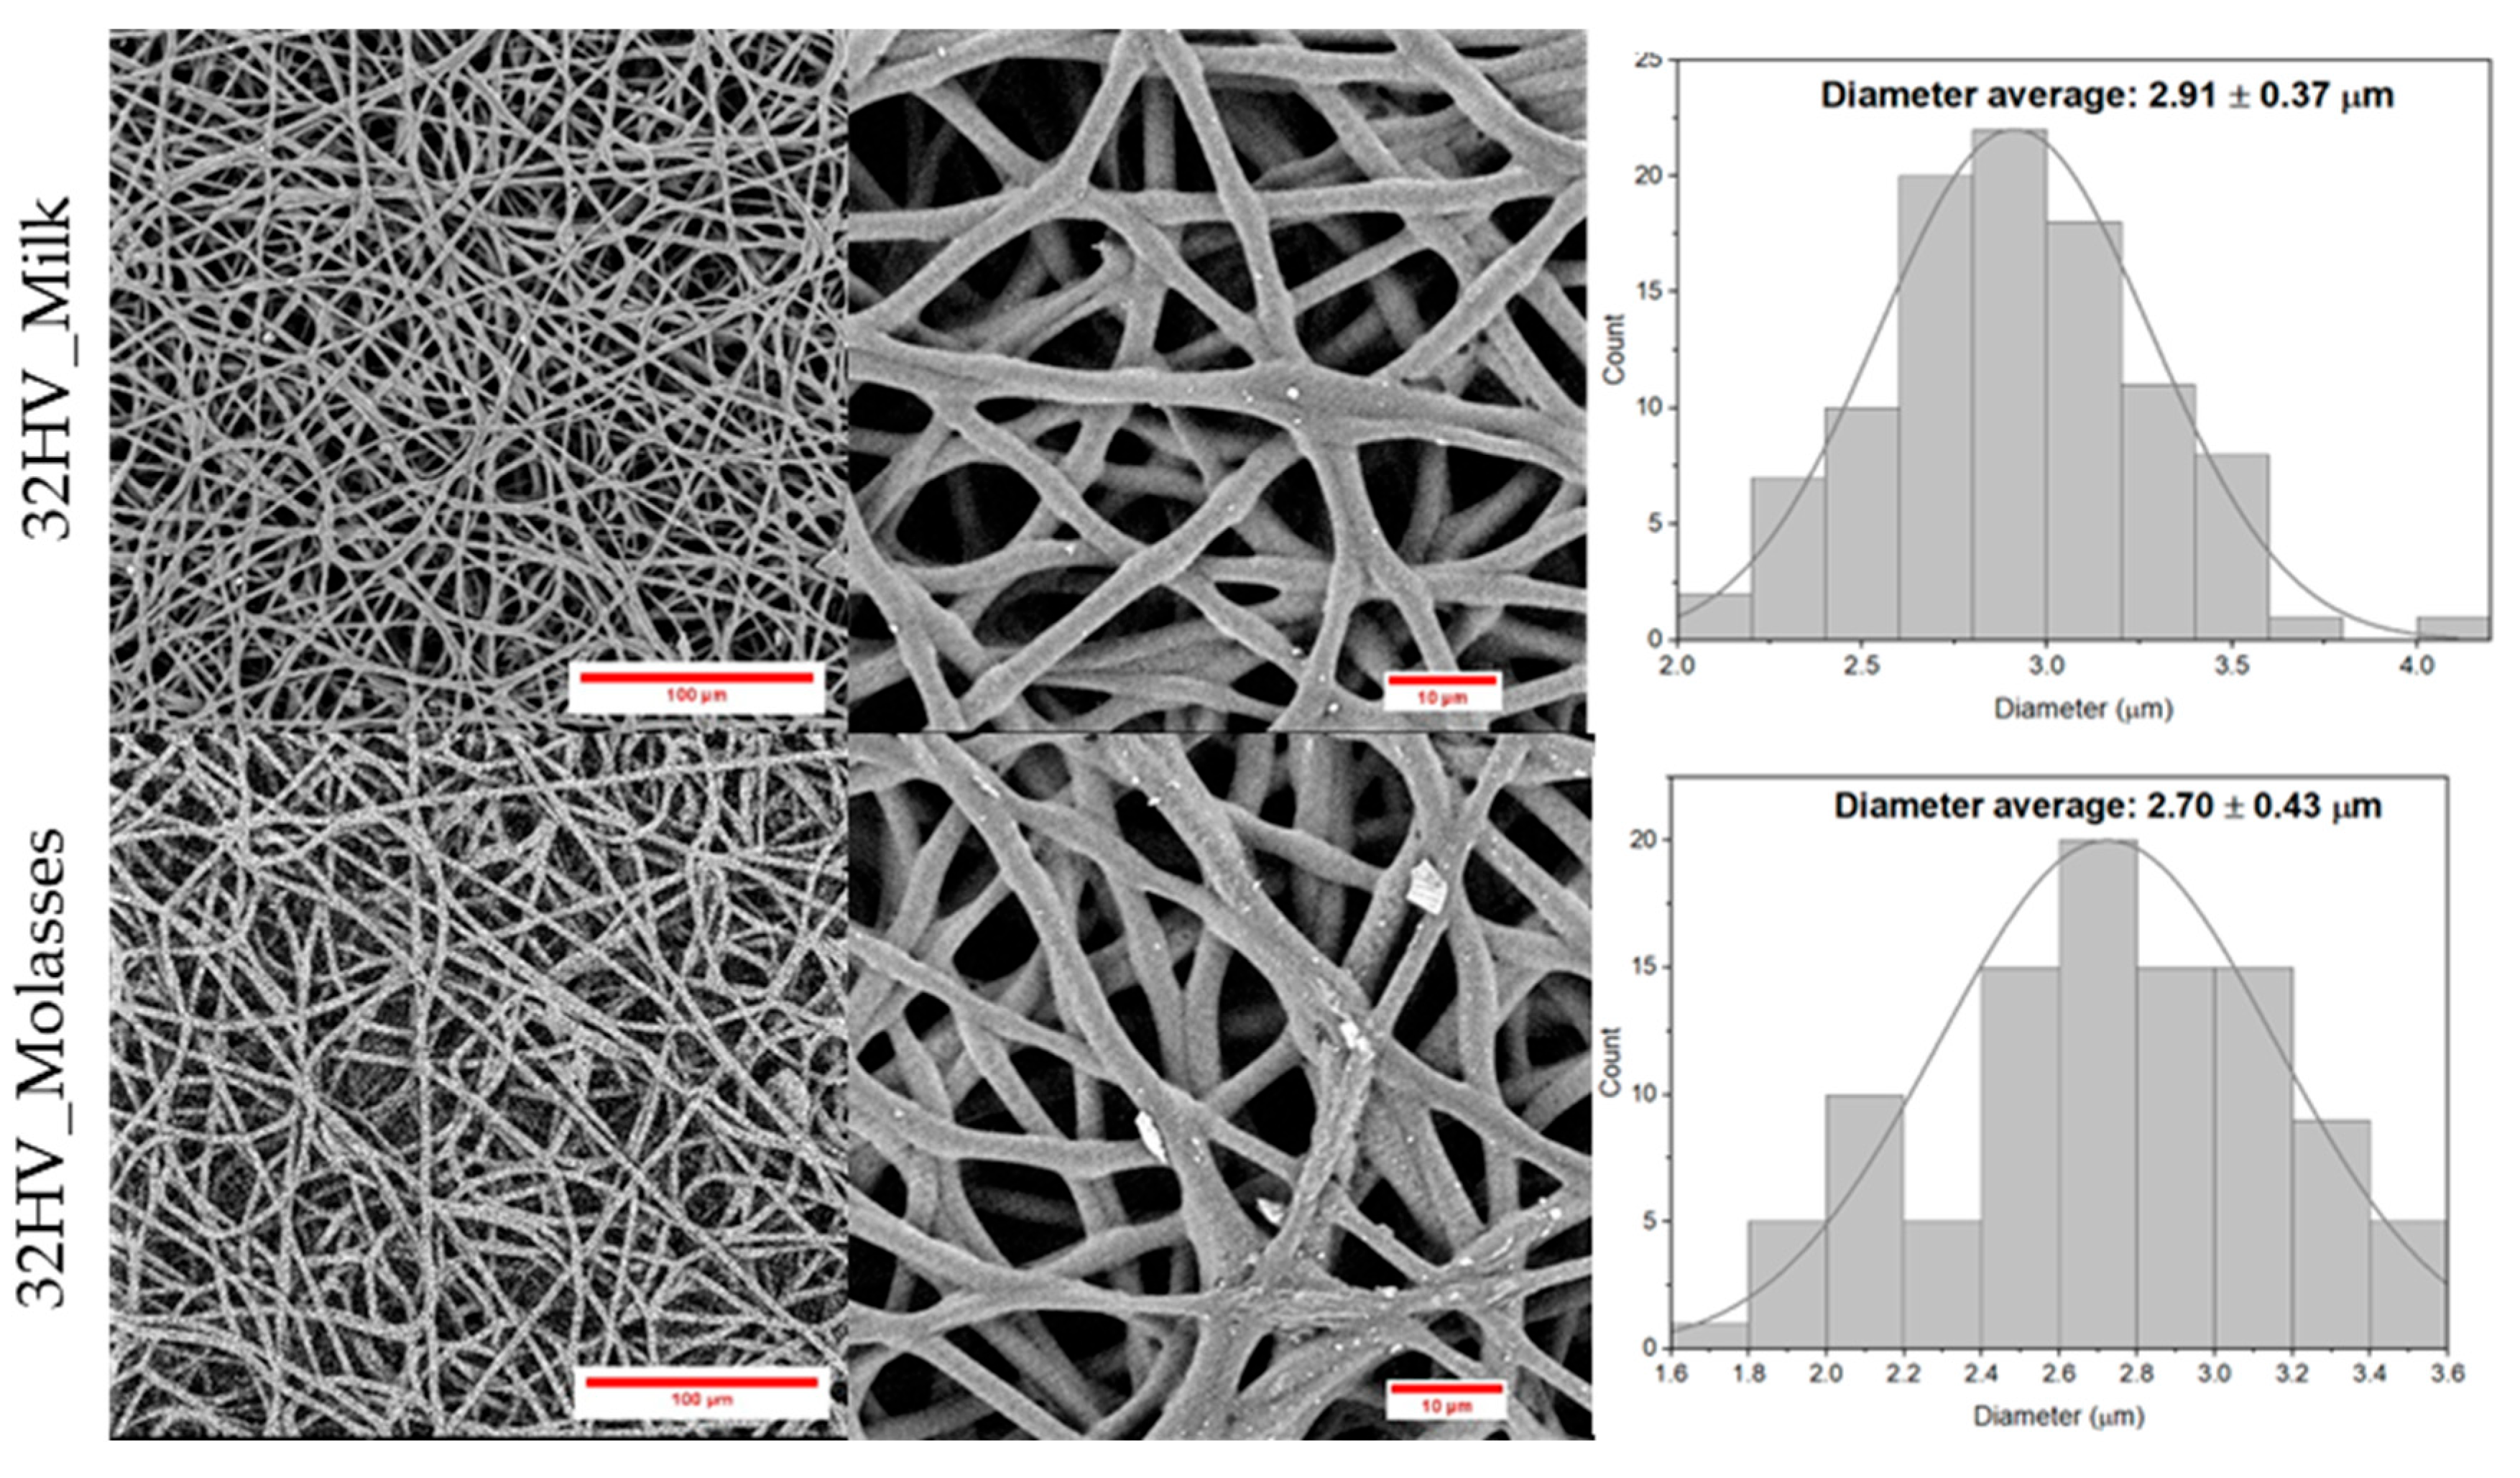
Figure 12.
1st DSC heating curve of virgin PHBV samples derived from milk residues (a) and molasses residues (b) with 7% 3HV (red), 15% 3HV (blue), and 32% 3HV (green); The corresponding electrospun fibers are illustrated with dashed lines.
Figure 12.
1st DSC heating curve of virgin PHBV samples derived from milk residues (a) and molasses residues (b) with 7% 3HV (red), 15% 3HV (blue), and 32% 3HV (green); The corresponding electrospun fibers are illustrated with dashed lines.
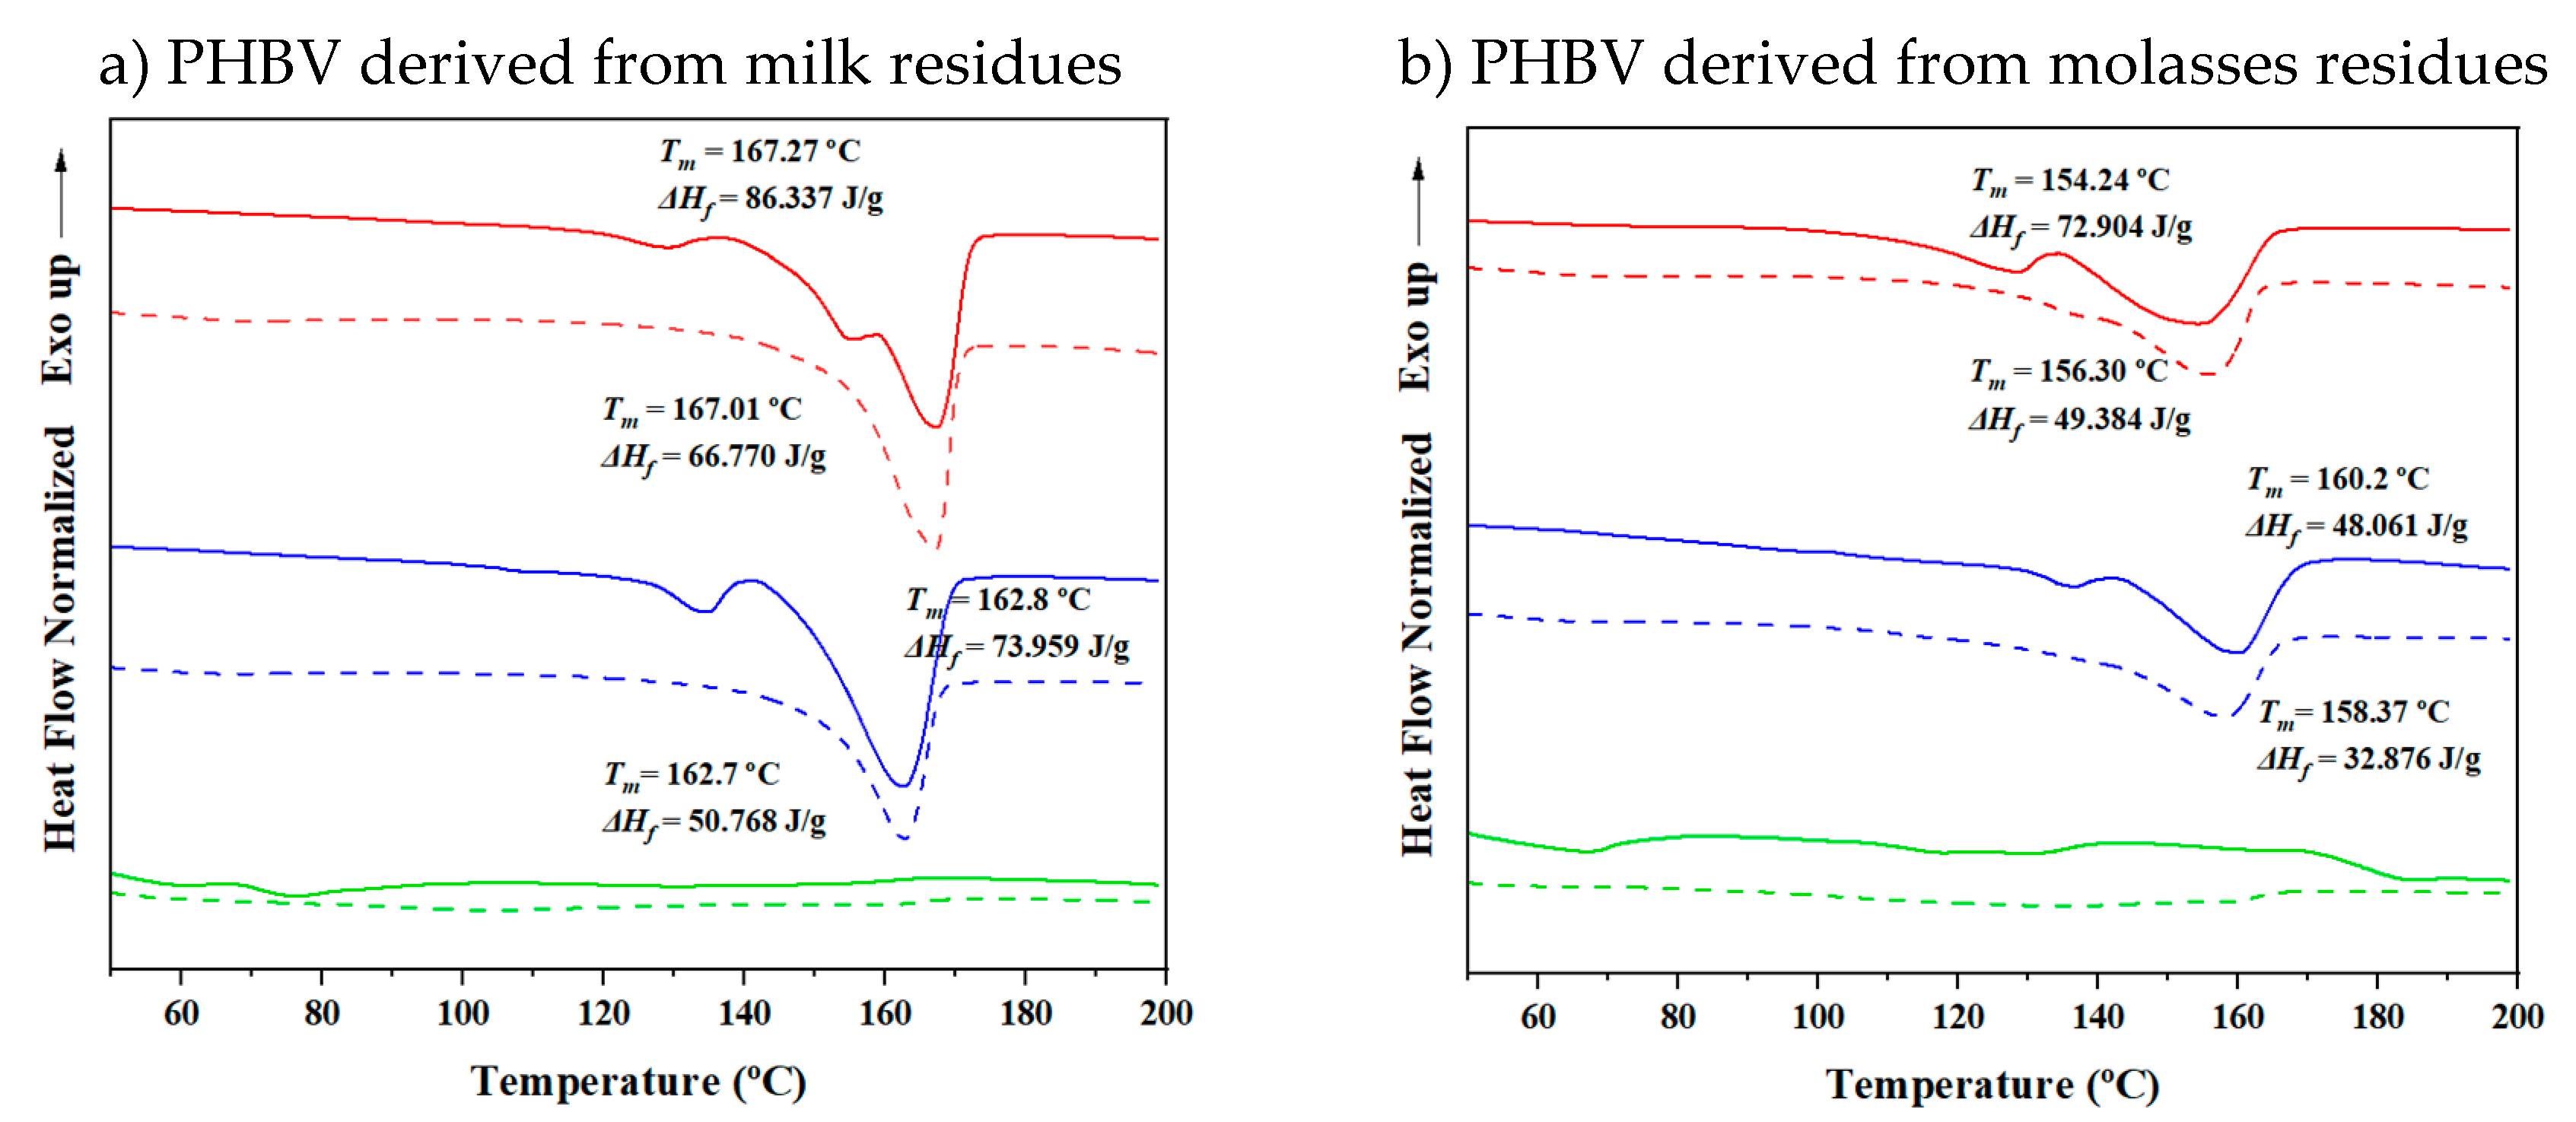
Table 2.
13C NMR integrated signals and parameter D.
| Samples | Monomer mole fractiona |
Diad mole fractionb | D parameter | ||||
| FB | FV | FBB | FBV | FVB | FVV | ||
| 7HV_Milk | 0.934 | 0.066 | 0.870 | 0.064 | 0.055 | 0.011 | 2.80 |
| 7HV_Molasses | 0.931 | 0.069 | 0.831 | 0.081 | 0.077 | 0.011 | 1.42 |
| 15HV_Milk | 0.853 | 0.147 | 0.862 | 0.059 | 0.056 | 0.024 | 6.32 |
| 15HV_Molasses | 0.851 | 0.149 | 0.786 | 0.096 | 0.089 | 0.029 | 2.67 |
| 32HV_Milk | 0.682 | 0.318 | 0.450 | 0.222 | 0.213 | 0.115 | 1.10 |
| 32HV_Molasses | 0.683 | 0.317 | 0,449 | 0.223 | 0.213 | 0.114 | 1.08 |
aDetermined from 1H NMR from -CH3 resonance peaks. bDetermined from 13C NMR from -C=O resonance peaks.
Table 3.
Thermal properties of PHBV samples derived from milk and molasses residues.
| Samples | Cooling | Second heating | |||||||
|---|---|---|---|---|---|---|---|---|---|
| Tc (ºC) | ΔHc (J/g) | Tg (ºC) | Tcc (ºC) | ΔHcc (ºC) | Tm1 (ºC) | Tm2 (ºC) | ΔHf (ºC) | χa (%) | |
| 7HV_Milk | 79.9 | 58.1 | -1.8 | 50.7 | 5.1 | 145.1 | 158.3 | 71.1 | 48.7 |
| 7HV_Molasses | 64.2 | 9.8 | -2 | 60.8 | 50.4 | 132.1 | 149.5 | 62.7 | 42.9 |
| 15HV_Milk | 97.1 | 66.3 | 3.8 | 47.9 | 0.3 | 158.2 | 167.5 | 70.6 | 48.3 |
| 15HV_Molasses | 58.5 | 8.8 | 1.3 | 58.6 | 42.5 | 145.4 | 163.8 | 54.2 | 35.8 |
| 32HV_Milk | - | - | -4.2 | - | - | - | - | - | - |
| 32HV_Molasses | - | - | -5.7 | - | - | - | - | - | - |
a Percentage of crystallinity calculated from second heating cycle using equation (1).
Table 7.
PHBV samples obtained from milk and molasses, with varying 3HV content and molecular weights.
Table 7.
PHBV samples obtained from milk and molasses, with varying 3HV content and molecular weights.
| Samples | Feedstock | 3HV (%) (1H-NMR) | Mw (g/mol) (GPC) | Mn (g/mol) (GPC) | PDI (GPC) |
|---|---|---|---|---|---|
| 7HV_Milk | Milk | 6.6 | 188073 | 59278 | 3.2 |
| 7HV_Molasses | Molasses | 6.9 | 212342 | 68592 | 3.1 |
| 15HV_Milk | Milk | 14.7 | 560082 | 165591 | 3.6 |
| 15HV_Molasses | Molasses | 14.9 | 539206 | 151537 | 3.6 |
| 32HV_Milk | Milk | 31.8 | 306957 | 122939 | 2.6 |
| 32HV_Molasses | Molasses | 31.7 | 328966 | 97285 | 3.4 |
Disclaimer/Publisher’s Note: The statements, opinions and data contained in all publications are solely those of the individual author(s) and contributor(s) and not of MDPI and/or the editor(s). MDPI and/or the editor(s) disclaim responsibility for any injury to people or property resulting from any ideas, methods, instructions or products referred to in the content. |
© 2024 by the authors. Licensee MDPI, Basel, Switzerland. This article is an open access article distributed under the terms and conditions of the Creative Commons Attribution (CC BY) license (http://creativecommons.org/licenses/by/4.0/).
Copyright: This open access article is published under a Creative Commons CC BY 4.0 license, which permit the free download, distribution, and reuse, provided that the author and preprint are cited in any reuse.


