
Submitted:
23 November 2024
Posted:
25 November 2024
You are already at the latest version
Abstract
Despite being superior to conventional bolt, rivet, and weld joining in many aspects, adhesive joining has the serious limitation that its bondline integrity is difficult to assess. If remains undetected, fabrication defects and in-service damages in the joint may eventually develop into catastrophic failure. Available non-destructive examination (NDE) methods to detect defects are helpful in discovering defective joints during fabrication. For long-term monitoring of joint integrity, many of these NDE techniques are prohibitively expensive and time-consuming to carry out. A number of techniques suitable for long-term joint integrity monitoring have been proposed. Fiber Bragg grating (FBG) sensors embedded in the joint are one of the promising candidates. It has the advantages of being close to the damage, and immune to environmental attack and electromagnetic interference. Damage and disbonding inside an adhesive joint will give rise to a non-uniform strain field that may bring about peak splitting and chirping of the FBG spectrum. It has been shown that the evolution of the full spectral responses can closely reveal the development of damages inside the adhesive joints during tensile and fatigue failures. However, recording and comparing the successive full spectra in the course of damage is tedious and can be subjective. An energy modulation interrogation technique is proposed using a pair of tunable optical filters. Changes in the full FBG spectral responses are modulated by the filters and converted into a conveniently measurable voltage output by photodiodes. Monitoring damage development can then be easily automated, and the technique is well-suited for practical applications. The technique will be demonstrated on a number of adhesive lap-joint tensile specimens. The parameters of the set-up configuration that may affect the sensitivity and accuracy of the interrogation will be examined.
Keywords:
adhesive joint
; integrity monitoring
; fiber Bragg grating
; tensile damage
; full spectral response
; energy modulation interrogation.
1. Introduction
Adhesively bonded joints are superior to conventional rivet, bolt, and weld joints in a number of ways. Load transfer is distributed over a large joining area instead of concentrating in a number of holes with fasteners. This leads to a more advantageous strength-to-weight ratio and stiffness [1,2]. Since the curing temperature of the adhesive is low, and so there will not be material degradation in a heat-affected zone like that in welded joints. The exclusion of stress-concentration holes also helps to avoid fiber discontinuity in composite materials. Thus, adhesive joints are increasingly being employed in aerospace, automotive, and maritime structures. Despite the various advantages of adhesive joints, they cannot be dismantled to allow the materials around the bondline to be inspected for defects/degradation. As in the cases of all practical load-bearing structures, those involving adhesive joining are subjected to various service loading and adverse environments. Such loading may accumulate damages and degrade the joints and, in serious cases, can lead to catastrophic structural failures. For example, the aircraft accident report on the 1988 Aloha Airlines Flight 243 incident traced fuselage failure to a degraded adhesive bond [3].
Non-destructive examination (NDE) techniques are available to reveal defects in adhesive joints. Commonly employed NDE techniques make use of principles involving ultrasonics [4,5,6,7], shearography [8,9], thermography [10,11], and electromechanical impedance [12,13,14]. The application of these NDE techniques is often time and money-consuming and cannot provide continuous monitoring output. Moreover, most NDE for defects techniques are helpful in detecting disbonding at the fabrication stage and extensive delamination at the late stage of failure. They have difficulty in detecting kissing bonds or long-term gradual joint degradation [15].
Instead of directly looking for defects, there are relatively more economical techniques suitable for continuous real-time monitoring of the integrity degradation of adhesive joints. Electrical impedance, strain measuring with strain gages, and optical fiber sensors have been attempted in this category. The electrical impedance method usually requires the adhesive joints to be conductive. This was commonly achieved by mixing carbon nanotubes into the adhesive to form a conductive network. Damages in this network will change the impedance [16,17,18]. Joint damages will change the local strain and thus alter the overall joint stiffness. These changes may be picked up with conventional strain gages [19,20]. As strain gage embedded inside the joint may lead to delamination defects, they are usually applied to the external surface and so are subjected to environmental degradation. Also, they are susceptible to early fatigue failure. Optical fibers have significantly longer fatigue lives than foil strain gages [21]. They are compatible with resin adhesive and can be embedded inside the bond without causing internal defects. This will leave the external surface smooth, which is an advantage for structures that need aerodynamic performance. Glass optical fibers are relatively free from environmental attack. As information is modulated in the light signal, fiber sensors are immune to electromagnetic interference and have been commonly employed in structural health monitoring [22,23,24]. Furthermore, multiple sensors can co-exist on the same fiber.
There are two main categories of fiber sensors, distributed [25,26,27] and discrete sensors [28,29,30,31,32,33,34,35,36,37,38,39]. Both have been attempted to monitore the integrity of adhesive joints. For distributed sensors, the whole fiber is available for sensing, and it is possible to locate the strain at any specific segment along the fiber. Thus, local perturbation in strain caused by damages in the bond can be revealed. The most commonly employed discrete fiber sensor is the fiber Bragg gratings (FBGs). An FBG is a series of uniform periodic variations of refractive index in a section of an optical fiber. When a broadband light traveling in the fiber encounters an FBG, a characteristic single peak spectrum related to the refractive index period will be reflected. The shift of this peak wavelength was often recorded and was related to the strain on the FBG [28,29,30,31,32,33,34]. In this way, FBGs were actually treated as embeddable strain gages. These FBG strain sensors do possess some advantages over conventional metal foil gages. Besides the favorable properties mentioned above, embeddability enables the sensors to be closer to the internal damages. However, one must note that peak shifting to reflect strain on the FBG is meaningful when the whole spectrum shifts while preserving its spectral shape. Damages in the adhesive bond and its corresponding strain perturbation are stochastic and localized events. They may result in highly non-uniform strain distribution along an FBG. This fact has been reflected in Ref.[35,36,37] where chirp FBG sensors were employed. Chirp FBG has a known varying refractive index period along the grating instead of a single uniform period. A series of wavelengths instead of a single peak will, therefore, be reflected. It is possible to correlate a particular wavelength with the location on the grating, and so chirp FBG offers a certain spatial resolution. By embedding chirp FBG in the adhesive [35] or in one adherend close to the bondline [36,37], it has been shown that a dip in intensity in the full spectral response occurred at locations over artificially induced [35] or naturally initiated disbonds [36,37]. This indicated the occurrence of non-uniform strain over the defects. For single-peak FBG, non-uniform strain distribution will also disrupt the uniform periodicity. This will result in peak splitting and broadening of the FBG spectrum, deforming the original spectral shape. Such changes are schematically shown in Figure 1. As a result, using the shift of a peak in the original spectrum relative to a peak in the deformed spectrum to deduce strain can be problematic. Peak splitting and broadening of embedded FBG spectra in lap-joints during tensile and fatigue failures have indeed been observed [38,39,40]. The evolution of the full spectral response of an embedded FBG, instead of a simplistic peak shift, is more indicative of the initiation and development of damages.
Applications making use of the full spectral responses are limited [38,39,40,41]. Webb et al. [38,41] obtain the full spectrum through a post-possessing transformation of the time history of intensity recorded with a MEMs-tuned optical filter, whose wavelength varies over time under a controlled manner [42]. Our previous work used an optical spectrum analyzer to record the full FBG spectrum [39,40]. After obtaining the spectra at different stages, a comparison of shapes of successive spectra to discern progressive changes is needed to reveal the occurrence and development of damages. This is not only tedious but also subjective. A parameter has been proposed to allow the change of the spectral shape to be quantified objectively [39,43]. However, the whole process is still time-consuming and inconvenient for practical applications. In this work, we introduce an energy modulation technique to interrogate the change in the full spectral response. This technique employs two optical filters, and the change in the spectral response is intercepted by the filters and directly output as a voltage. Recording and manual comparison of the FBG spectra are not needed, so this method is more convenient and well-suited for practical applications. The width of the filter spectrum and its initial position relative to the FBG spectrum will affect the range and sensitivity of this measurement technique. The effect of these parameters will be examined. Finally, the technique is tested on embedded FBG sensors in a number of composite lap-joint tensile specimens.
2. Materials and Methods
2.1. Single Lap-Joint Specimens Tensile Testing
Single lap-joint specimens 190 mm in length were fabricated and tested under progressively increasing loading until specimen failures in a servo-hydraulic testing machine (810 Materials Testing System, MTS Systems, Minnesota, USA). Three 125 μm diameter FBG inscribed optical fibers, running along the specimen loading axis, were embedded, both as sensors and as spacers, to control the bond line thickness to ~160 μm. Detailed dimensions and procedures for specimen fabrication, as well as specifications of the FBGs, have been reported in Ref.[39].
The FBG spectra under different loading were recorded. It should noted that even without damage, tensile loading alone will cause deformation of the joint and change the period of the FBGs. To preclude any effect due to loading, testing was periodically interrupted, and the specimen was unloaded to allow reflected spectra to be measured at 0 N.
2.2. Energy Modulation Method for FBG Interrogation
When the spectrum reflected from an FBG embedded in an adhesive joint is passed through a filter, only the overlapping hatched area between the filter and FBG spectra can come through, as illustrated in Figure 2. When this resulting spectrum goes into a photodiode detector, an output voltage proportional to the intensity of the incoming spectrum will be generated. When damage occurs in the adhesive joint, the FBG reflected spectrum may drift, broaden, or chirp. With a fixed filter pass spectrum, the resulting overlapping area will change accordingly and is reflected as a changing voltage.
A schematic arrangement to capture this voltage is shown in Figure 3: The broadband light source (BLS – 08001, GIP Technology, New Taipei City, Taiwan) goes into port ① of the circulator (CIR1550PM-FC, Thorlab, Newton, NJ, United State). It will come out at port ② into the FBG, reflected back into port 2, and come out at port ③. This reflected FBG spectrum is passed through a tunable filter (OTF-300-03S3, Santec, Komaki, Aichi, Japan) into a photodiode detector (PDA10CS, Thorlab, Newton, NJ, United States). The latter converts the output coming through the filter into a voltage proportional to the light energy of the overlapping hatched area. The tunable range of the OTF-300-03S3 filter employed is 1530nm - 1590nm, and the full width at half maximum (FWHM) of the filter spectrum is 1 nm.
2.3. Simulation of the Energy Modulation Interrogation Results
As is evident from Figure 2, when the FBG spectrum shifts towards the right, the overlapping area, as well as the voltage output from the photodiode (PD), will increase. However, voltage output will revert to decrease when the FBG spectrum moves on, passing the maximum of the filter spectrum. Thus, during the course of joint damage development, the same voltage output corresponding to two different FBG spectral positions/shapes may arise. A filter spectrum with a larger FWHM helps to alleviate/avoid this situation. However, a larger FWHM implies a more gentle slope of the filter spectrum. This will sacrifice the sensing sensitivity as a shift in the FBG spectrum against a gentler filter slope will result in a smaller change in the overlapping area. Another factor affecting the sensing range and sensitivity is the initial relative positions between the filter and FBG spectra or the amount of overlap between the two.
For optimum sensing range and sensitivity, two questions need to be clarified: (1) how much initial amount of overlap should be set? (2) What FWHM of the filter spectrum should be employed? To answer these questions, instead of trial and error by experimenting with different filters and different initial overlap settings using lap-joint specimens, the calculation of the measured voltages in simulated experiments has been attempted to help shed some light on the better arrangements.
Three spectra must be known before the simulation calculation can be carried out. The broadband light source (BLS) spectrum was first measured with an optical spectrum analyzer (OSA). Then, the light from the BLS was passed through the filter, and the output was recorded as the filter spectrum. Finally, the FBG reflected spectrum was measured at the output from port 3 of the circulator in Figure 3.
For any particular wavelength λi, the fraction of energy that can come through the filter from a light source, , is given by:
In the light circuit shown in Figure 3, the output light intensity Ii at λi after coming through the filter is:
The total energy that the PD receives in Figure 3 is by adding the Ii for every wavelength λi. The resulting output voltage V is:
C is a conversion factor. It was calibrated by passing some known spectra into the PD. The total intensity of this spectrum could be calculated. The output voltage measured by the PD divided by the total intensity calculated gives C.
The only filters at hand have a FWHM of ~1 nm. To simulate the filter spectrum with a larger FWHM, we tried to scale up the filter spectrum in the widthwise direction. To facilitate this operation, a curve fitting exercise was first made to the measured filter spectrum. When the center wavelength was set to 1537.157 nm, the OTF-300-03S3 filter spectrum can be fitted with the following quadratic expression:
where y is the intensity in dBm at wavelength x nm. Figure 4 compares the measured OTF-300-03S3 filter spectrum with the above quadratic fit, calculated between 1536.5nm and 1537.6nm. Figure 4(a) shows that above ~-60 dbm, the expression in Equation (4) fitted well with the measured spectrum. Much discrepancy seems to exist below -60 dbm. However, the light energy associated with -60 dbm or below is very small, and so such discrepancy has a negligible effect on the subsequent energy modulation output. In fact, if light intensity is expressed in the linear scale in nW, the difference between the quadratic fit and the measured filter spectrum is indeed negligible (see Figure 4(b)).
To simulate the filter spectrum with wider FWHM, the expression in Equation (4) was modified to:
where a is the intended FWHM in nm. Figure 5 (a), (b) and (c) display the simulated filter spectra with FWHM equals 1 nm, 3 nm, and 5 nm respectively.
Different initial relative positions between the filter and FBG spectra were achieved by tuning the filter center wavelength. This simply shifts the whole filter spectrum and the 's on the wavelength axis without changing its shape.
3. Results
3.1. FBG Spectrum Evolution in the Course of Tensile Failure
Figure 6 shows the spectra from an embedded FBG in an adhesive lap-joint specimen under different loads during a typical tensile test. As the applied tensile loading increased from 0 to 3200 N, the spectra progressively shifted towards longer wavelengths. Apart from the appearance of some small secondary peaks, the shape of the spectrum more or less retained its original shape before the test. This shift is caused by the longitudinal extension of the specimen that strains the FBG and increases its period. The emergence of the minor secondary peaks may be attributed to the uneven stress/strain distributions along the longitudinal direction of the joint. Finite element analysis of a single lap-joint [45,46] indicated that significant stress concentration occurs right at or very close to the longitudinal edges of the joint for each of the stress components. However, as the stiffness of the optical fiber is much higher than that of the polymeric adhesive, the corresponding strain concentration on the fiber is milder. This may explain the mild secondary peaks at these stages.
At 5200 N, besides shifting further to the right, secondary peaks become more marked. Broadening or chirping became very prominent at 6600 N. This specimen eventually failed at 6797 N. Besides aggravating stress/strain concentration under these high loads, internal damages in the adhesive joint may probably start to emerge and develop at some locations, leading to increasingly profound perturbation of the uniform periodicity, which resulted in the heavy broadening of the spectrum.
In the above spectra, both loading and damage inside the joint played some roles in the strain distribution and contributed to the change in the spectrum shape. As our aim is damage monitoring, the effect of loading on the FBG must be excluded. The latter can be achieved by measuring at zero load. Any deviation of the instantaneous spectrum from the initial damage-free spectrum under the same load will indicate the occurrence and development of damages. To this end, after loading progressively to different levels, the specimens were unloaded for the load-free spectra to be measured.
The evolution of these unload spectra is shown in Figure 7. The unload spectra from 3200 N or smaller loads virtually overlapped with the spectrum recorded at 0 N at the beginning of the tensile test. Thus, only the unload spectra from 3200 N and above are displayed. An unchanging unload spectrum suggests that negligible damage has arisen at 3200 N. The 5200 N unload spectra exhibited slight deviation from the reference, indicating damage has probably commenced. The 6600 N unload spectra were heavily chirped, showing that damage has become extensive.
3.2. Simulation of Energy Modulation Interrogation of FBG Spectrum Development
3.2.1. Verification of the Simulation of Energy Modulation Interrogation Results
To test whether the simulation of the energy modulation interrogation reflects the actual measurement, typical calculated and measured filter-modulated spectra are compared in Figure 8 and Figure 9. Using the circuit shown in Figure 3 and tuning the filter spectrum from short to long wavelengths crossing the FBG spectrum, the maximum output voltage, Vmax, was recorded at some point. The relative positions between the filter and FBG spectra were then set respectively at PD output of 0.5 Vmax (Figure 8 (a)) and 0.1 Vmax (Figure 9 (a)). Figure 8 (b) and Figure 9 (b) compare the measured output spectra from the filter with the calculated one with the intensity shown in dbm for the respective settings. Above ~ -70 dbm, both the measured and the calculated curves agreed well with each other. Marked discrepancies are observed below -70 dbm. The cut-off intensity of the OSA is ~ -80 dbm, and the signal intensity below that is displayed as noise. There is no cut-off for the simulation calculation, giving rise to the apparent discrepancies. However, as pointed out before, the light energy below -60 dbm is negligibly small and will not affect the energy output measurement. When expressed in terms of nW, the measured and calculated spectra virtually overlapped with each other, as clearly seen in Figure 8 (c) and Figure 9 (c).
Next, the measured and calculated PD outputs are compared. An FBG embedded inside a single lap-joint specimen was connected to the light circuit in Figure 3. The output from port ③ was fed into a 50%-50% coupler to split the light output into two equal halves. Each half was fed into an identical filter. One filter spectrum was set on the short wavelength side to an initial overlap that gave a PD output of 0.5 Vmax. The other filter spectrum was set on the long wavelength side to give a PD output of 0.25 Vmax. These filter spectra and the FBG spectrum before the test are shown in Figure 10(a). The specimen was then pulled under tension at incrementally increasing load. After each load increment, the specimen was unloaded. The FBG spectrum and the voltage outputs from the two filters were recorded. Some of these load-free FBG spectra are shown in Figure 10(b). The recorded FBG spectra were used for the calculation of the simulated voltage outputs. The latter are compared with the outputs measured from the PDs, and the results are shown in Figure 11 (a) and (b) for filters at the short and long wavelength side, respectively. As the unloaded FBG spectra in this tensile test remained unchanged before 4000 N, both PD outputs changed little initially. Beyond 4400 N, the change in the FBG spectral shape became more marked, and the spectrum has a tendency to shift towards the shorter wavelength (see Figure 10 (b)). This direction of shift will move the FBG spectrum into the filter on the left while moving out of the filter on the right. As a result, the output from the filter on the short wavelength side increased to a maximum, and that from the filter on the long wavelength side decreased.
Two observations may be noted. Firstly, the simulated values agree reasonably well with the output measured from the PDs, showing that using the simulation calculation to estimate the PD output is feasible. Secondly, the output from the PD may increase or decrease, depending on the relative positions of the filter and FBG spectra, as well as the direction of shift of the FBG spectra.
Observation from a number of tensile failure monitoring using FBG shows that there is no rule of thumb on whether the spectrum will shift towards the short or long wavelength sides. This is especially true when damage becomes extensive, leading to broadening and splitting the spectrum into multiple peaks. Broadening will not spread the spectrum symmetrically. In some specimens, it may spread more toward the shorter wavelengths, while in the other specimens, it spreads more towards the longer wavelengths. The reason behind this may be explained by the fact that the exact pattern of damage differs in each individual specimen. If a single filter is used, the output voltage may either increase or decrease as damage develops. This ambiguous phenomenon is not desirable when one uses the energy modulation method to judge the extent of damage development. In order to achieve a more intuitive interpretation where the output increases with damage development, a normalized PD output is proposed making use of a two-filter arrangement, with spectra tuned to overlap the FBG spectrum on the short and long wavelength sides respectively, as follows:
and are, respectively the PD voltage outputs from the filters on the short and long wavelength sides. and are the initial and before testing. is the maximum output voltage recorded when the filter spectrum is tuned from short to long wavelengths crossing the FBG spectrum.
The two-filter arrangement can be set up using the circuit schematically shown in Figure 3 with a slight modification. A 50-50 coupler is inserted at port ③ of the circulator to split the output into two equal halves. To each half, a tunable filter and a photodiode are connected. The filters are first tuned to locate the maximum voltage output Vmax. One filter is then tuned down towards the shorter wavelength while the other is tuned up to the longer wavelength to achieve the desired overlap output voltage. These two voltage outputs can then be fed into Equation 6 to get the normalized PD.
3.2.2. Effect of filter Spectrum Positions Relative to the FBG Spectrum
From the schematic diagram in Figure 2, if the initial overlap between the two spectra is minimal and the FBG spectrum is moving away from the filter spectrum during the course of damage, the overlapping area will quickly drop to zero, and no output will be recorded even though the damage is continuously developing. On the other hand, if initially the spectra fully overlap, a slight shift/change in the FBG spectrum may not change the overlapping area, and early damage development will not be revealed. In order to evaluate how much initial overlap between the filter and FBG spectra will be optimum for damage monitoring, simulation calculation was employed to test a series of different initial overlaps using the load-free spectra from the test shown in Figure 7. The two-filter arrangement was used. The maximum output voltage was first identified before testing. The short and long wavelength filters were then tuned away from the maximum overlap position symmetrically against the fixed FBG spectrum. Nine sets of initial overlap configurations were tested, with output in increments of 0.1 from 0.1 to 0.9 . The relative positions between the spectra for 0.1 and 0.9 are shown respectively in Figure 12 (a) and (b).
The simulated outputs for four of the nine filter configurations using the unloaded FBG spectra in the course of tensile testing are shown in Figure 13. Also shown in Figure 13 is the V value proposed in Ref. [39]. Ref. [39] showed that the damage inside an adhesive joint can qualitatively be reflected in the change of the embedded FBG spectral shape. The V value was intended to quantify the change of FBG spectral shape with respect to the reference spectrum before testing to aid objective and quantitative assessment of the development of internal damage. V value in Ref. [39] is defined as:
where Pλicurrent and Pλireference are respectively the power intensity in dbm of the current unload spectra and the reference spectra at the same corresponding wavelength λi . n is the number of data points in the FBG spectrum wavelength span.
Figure 7 shows that the unload FBG spectra from about ~50% failure load have shifted by a small but discernible amount toward a longer wavelength. Beyond ~70% failure load, the unload spectra showed more significant changes. The evolution of the V value agrees with these trends. When the initial overlap amounts to 0.1 , the normalized PD output has nearly no change up to ~70% failure load. The insensitivity of the overlap setting is understandable. With only a small initial overlap, the FBG spectrum has to shift a considerable amount to allow any change to be intercepted by the filter spectrum and reflected in the photodiode output. The sensitivity is significantly improved, and the PD output follows the V value closely when the initial overlap amounts to 0.3 (Figure 14b). However, when the overlap increases to 0.5 or more, the discrepancy with the V value occurs close to the failure load where the PD voltage drops despite the obvious increase in damage. An initial overlap to give a PD voltage of 0.3 to 0.4 is optimum to reflect the amount of change in the FBG spectra and the damage inside the lap-joint. Figure 7 shows that the FBG spectrum has already broadened to slightly larger than 3 nm close to failure. This is well beyond the 1 nm FWHM filter spectrum and can explain the observed drop in PD output close to failure.
3.2.3. Effect of the FWHM of the Filter Spectrum
It has been pointed out in Section 2.4 that another factor affecting the sensitivity of the energy modulation method is the width of the filter spectrum. The filter employed for measurement has a spectrum FWHM of 1 nm. The actual effect of filter spectrum FWHM is examined by simulation for FWHM up to 5 nm. The results for FWHM of 3 nm and 5 nm for initial overlap to give a PD voltage of 0.4 and 0.9 are shown in Figure 14 to illustrate the trends.
For the 3 nm FWHM filter with an initial overlap of 0.4 Vmax, the PD output agreed well with the V value before ~ 50% of the failure load (Figure 14a). Beyond this point, the V value started to increase at a greater rate because of a more marked change in the FBG spectrum. The PD output failed to reflect this accelerated rate, indicating that the sensitivity of a 3 nm FWHM filter is somewhat inferior to the 1 nm filter. On the other hand, unlike that of the 1 nm filter, increasing the initial overlap from 0.4 Vmax through to 0.9 Vmax does not significantly improve the sensitivity, as is evident in Figure 14b. Also evident in Figure 14b is that with a wider filter spectrum, increasing the initial overlap does not bring about a large abnormal drop in PD output near failure. Figure 14c and d show that the 5 nm FWHM filter exhibited similar characteristics.
For the same peak intensity, a filter spectrum with wider FWHM will have a gentler slope and, thus, a lower sensitivity towards change in the FBG spectrum. However, a filter spectrum with wider FWHM of not missing out a large broadening and shifting of the FBG spectrum. For general applications, the shape of the FBG spectrum varies, and some may have chirped and broadened considerably after embedding into a structure. Also, large deformation in a structure will cause considerable wavelength shifts in the FBG spectrum. Figure 7 shows that near failure, the single peaked FBG spectrum has broadened to slightly beyond 3 nm. To be on the safe side, a filter with wide FWHM is more advisable.
3.3. Testing the Technique on More Embedded FBG in Lap-Joint Tensile Specimens
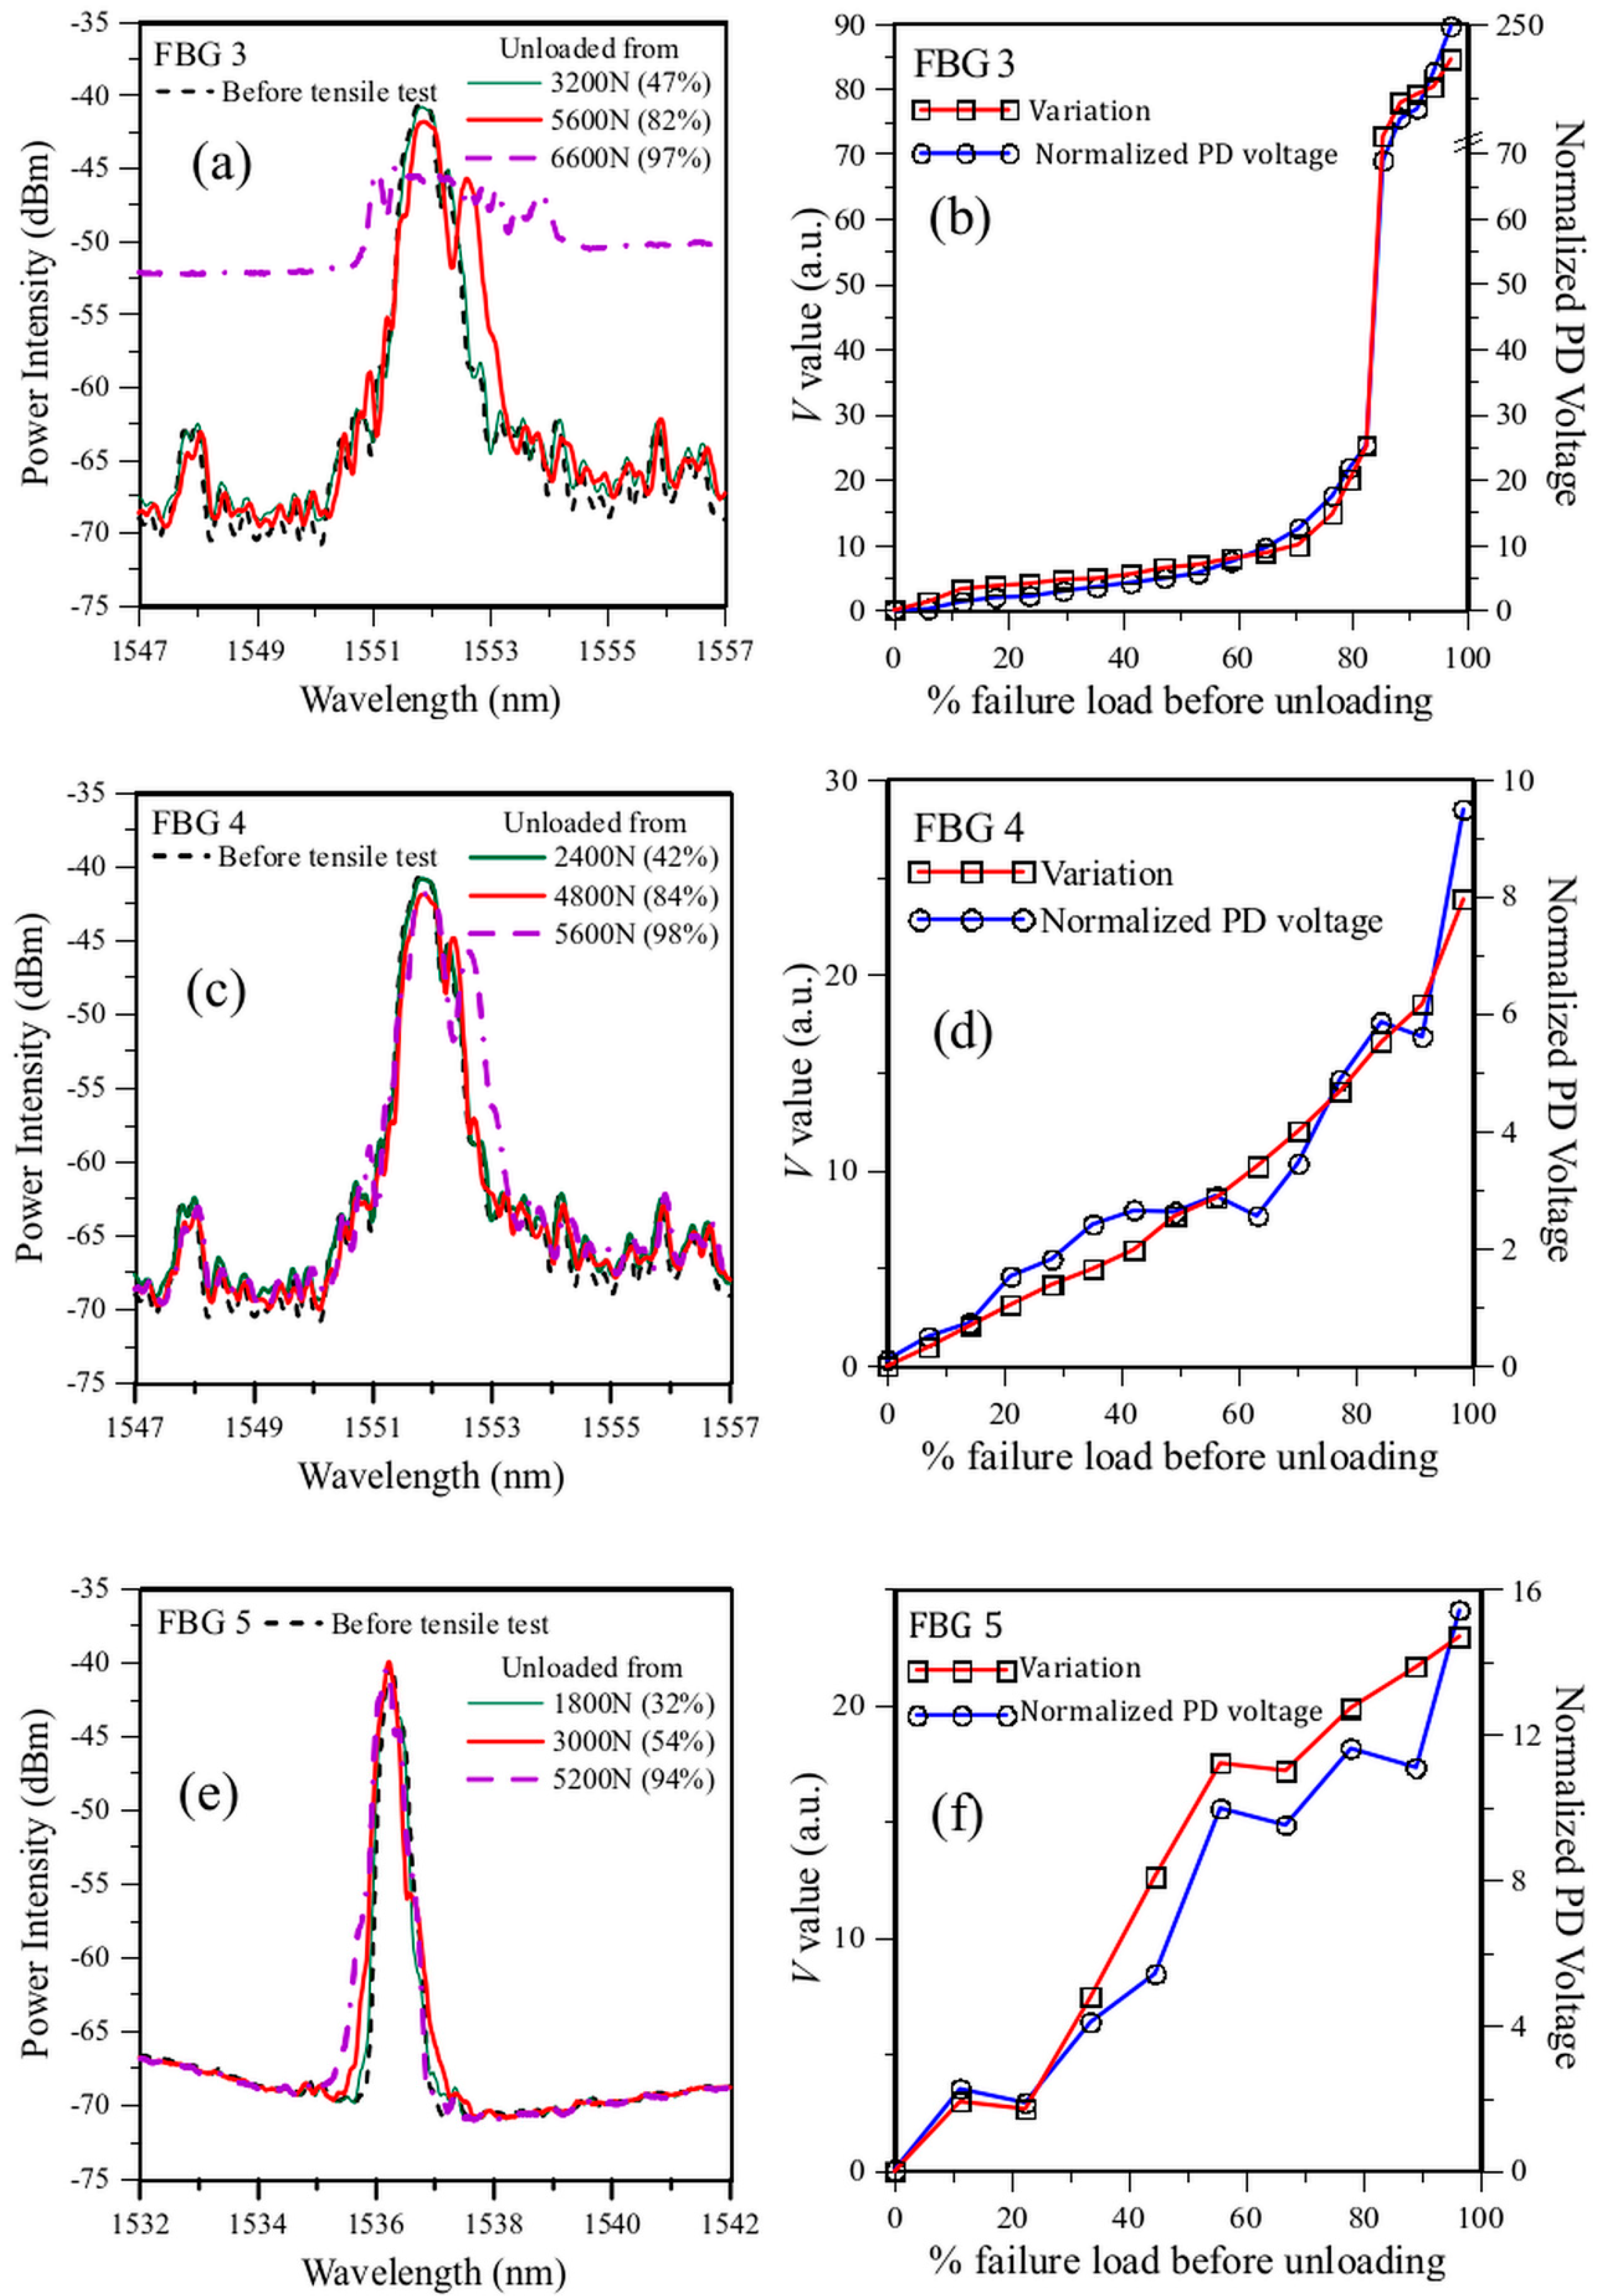
To further verify the feasibility of this method for monitoring the integrity of lap-joint, we tried to apply it to monitor more embedded FBG in different lap-joint tensile tests. The results in Section 3.2 recommend a filter spectrum FWHM of 5 nm and an amount of overlap to give a PD output of 0.4 Vmax. As the filter at hand only has an FWHM is 1 nm, we again resort to simulation calculation to obtain the results for 5 nm FWHM. Figure 15a, c, and e are spectrum evolution from 3 FBGs. For clarity, only a few typical spectra are drawn in these figures. The bracketed numbers following the loading values in the figure legends indicated the loading as a percentage of the final failure load. Figure 15b, d, and f are the corresponding PD voltages using the energy modulation technique and the V values. All three FBG spectra changed a little up to 50-60% of the respective failure loading of the lap-joint specimens. This is reflected in small and gradual increases in both the PD voltages and the V values in Figure 15b, d, and f. The FBG3 spectra in Figure 15a started to show serious broadening and peak splitting after loading reached ~80% of the failure load. Correspondingly, Figure 15b shows the PD voltage started to increase steeply at this point. FBG4 also started to show broadening after reaching ~80% of the failure load, but the amount of broadening was gentler (see Figure 15c) when compared with that in FBG3. The corresponding acceleration in PD output increase is also gentler and the final voltage reaches close to failure is also much smaller (see Figure 15d). FBG 5 showed only very moderate broadening even close to failure (see Figure 15e), and the corresponding PD output also increased gradually without marked acceleration in change (see Figure 15f). In all three cases, the trend in the V values corroborated closely with that in the PD output voltage, suggesting both parameters correctly reflected the amount of shape changes in the evolution of the full FBG spectra during progressive tensile failure. The major difference between the two is the V value requires an optical spectrum analyzer to log the full FBG spectrum followed by computation afterward, while the PD voltage can be obtained simply using suitable optical filters and photodiode, and no follow-up computation is needed. Thus, the proposed energy modulation technique is relatively cheaper, much faster, easily automated, and more convenient for interrogating the development of the full FBG spectrum.
4. Conclusions
Previous work has demonstrated that the load-induced damages inside an adhesive lap-joint are reflected as spectrum shifting, peak splitting, emergence of secondary peaks, and broadening of the spectra of embedded fiber Bragg gratings. To interrogate the full FBG spectral responses more conveniently, an energy modulation technique is proposed and examined. This technique employs two optical filters with pass spectra respectively overlapping with the short and long wavelength sides of the FBG spectrum. The pass-through intensity from each filter is then converted to a voltage output by a photodiode. The voltage outputs from both filters are then combined to a normalized PD output voltage. Filter spectrum FWHM of 5 nm and initial overlap of 0.4 Vmax is recommended, and the technique has been tested on embedded FBGs from different adhesive lap-joint specimens and successfully reflected the severity of changes in the full spectral shapes during the course of tensile failure. Moreover, the trends in these PD outputs corroborate with the V value previously proposed to describe the qualitative change in FBG spectral shape.
Author Contributions
Conceptualization, C.S.S.; methodology, C.S.S; software, T.C.L. and S.H.H.; validation, T.C.L. and C.S.S.; formal analysis, C.S.S. and T.C.L.; investigation, T.C.L.; resources, C.S.S.; data curation, C.S.S.; writing—original draft preparation, C.S.S.; writing—review and editing, C.S.S.; visualization, C.S.S., T.C.L. and S.H.H.; supervision, C.S.S.; project administration, C.S.S.; funding acquisition, C.S.S. All authors have read and agreed to the published version of the manuscript.
Funding
This research was funded by the Ministry of Science and Technology, ROC, through the projects MOST 104-2221-E-002 -036 -MY3 and NSTC 112-2221-E-002-226-MY2.
Acknowledgments
The authors would like to thank the National Science and Technology Council, ROC, for funding. They would also like to thank Prof. C. C. Chiang of Dept. of Mechanical Engineering, National Kaohsiung University of Science and Technology, for providing the equipment and help to fabricate the FBG sensors used in this work.
Conflicts of Interest
The authors declare no conflict of interest.
References
- Markatos, D.N.; Tserpes, K.I.; Rau, E.; Markus, S.; Ehrhart, B.; Pantelakis, S. The effects of manufacturing-induced and in-service related bonding quality reduction on the mode-I fracture toughness of composite bonded joints for aeronautical use. Comp Part B-Engng. 2013, 45, 556–564. [Google Scholar] [CrossRef]
- da Silva, L.F.M.; Öchsner, A.; Adams, R.D. Handbook of Adhesion Technology, 2nd ed.; Springer, Berlin Heidelberg, Germany, 2018; pp.1-7.
- Aircraft Accident Report--Aloha Airlines, Flight 243, Boeing 737-200, N73711, near Maui, Hawaii, April 28, 1988, NTSB/AAR-89/03, National Transportation Safety Board Bureau of Accident Investigation Washington, D. C. 2 0594, June 14, 1989.
- Mojškerc, B.; Kek, T.; Grum, J. Ultrasonic Disbond Detection in Adhesive Joints. 14th Int. Conf. of the Slovenian Society for Non-Destructive Testing, Bernardin, Slovenia, Sep. 4-6, 2017.
- Karpenko, O.; Khomenko, A.; Koricho, E.; Haq, M.; Udpa, L. Monitoring of fatigue damage in composite lap-joints using guided waves and FBG sensors. AIP Conference Proceedings 1706, 42nd Annual review of progress in quantitative nondestructive evaluation, Minneapolis, Minnesota1, United States, 26-31 July 2015; Ed.: Chimenti, D.E.; Bond, L.J. AIP Publishing, 2016. [Google Scholar] [CrossRef]
- Scarselli, G.; Nicassio, F. Analysis of debonding in single lap-joints based on employment of ultrasounds. Proc. SPIE 10170, Health Monitoring of Structural and Biological Systems 2017, Portland, Oregon, United States, 26-–29 March 2017; Ed.: Kundu, T. SPIE, 2017, 1017020. [Google Scholar] [CrossRef]
- Yilmaz, B.; Jasiūnienė, E. Advanced Ultrasonic NDT for Weak Bond Detection in Composite-Adhesive Bonded Structures, Int J Adhesion Adhes. 2020, 102, 102675. [CrossRef]
- Kryukov, I.; Böhm, S. Prospects and limitations of eddy current shearography for non-destructive testing of adhesively bonded structural joints, J Adhes. 2019, 95, 874-886. [CrossRef]
- Kryukov, I.; Thiede, H.; Böhm, S. Quality assurance for structural adhesively bonded joints by eddy current shearography. Weld anicsWorld. 2017, 61, 581–588. [Google Scholar] [CrossRef]
- Martens, U.; Schröder, K.-U. Evaluation of infrared thermography methods for analysing the damage behaviour of adhesively bonded repair solutions. Comp Struct. 2020, 240, 111991. [Google Scholar] [CrossRef]
- Shin, P.H.; Webb, S.C.; Peters, K.J. Pulsed phase thermography imaging of fatigue-loaded composite adhesively bonded joints. NDT E Int. 2016, 79, 7–16. [Google Scholar] [CrossRef]
- Liu, T.; Pei, C.; Cheng, X.; Zhou, H.; Xiao, P.; Chen, Z. Adhesive debonding inspection with a small EMAT in resonant mode, NDT & E Int. 98, 2018, 110-116. [CrossRef]
- Roth, W.; Giurgiutiu, V. Structural health monitoring of an adhesive disbond through electromechanical impedance spectroscopy. Int J Adhesion Adhes. 2017, 73, 109–17. [Google Scholar] [CrossRef]
- Dugnani, R.; Zhuang, Y.; Kopsaftopoulos, F.; Chang, F.-K. Adhesive bond-line degradation detection via a cross-correlation electromechanical impedance–based approach. Struct Health Monit 2016, 15, 650–67. [Google Scholar] [CrossRef]
- Davis, M.J.; McGregor, A. Assessing adhesive bond failures: mixed-mode bond failures explained. ISASI Australian Safety Seminar, The International Society of Air Safety Investigators, Canberra, Australia, 4-6 June 2010.
- Kim, C.-H.; Choi, J.-H. ; Kweon, J-H. Defect detection in adhesive joints using the impedance method, Comp. Struct., 2015, 120, 183–188. [Google Scholar] [CrossRef]
- Bregar, T.; An, D.; Gharavian, S.; Burda, M.; Durazo-Cardenas, I.; Thakur, V.K.; Ayre, D.; Słoma, M.; Hardiman, M.; McCarthy, C.; Nezhad, H.Y. Carbon nanotube embedded adhesives for real-time monitoring of adhesion failure in high performance adhesively bonded joints. Sci Rep. 2020, 10, 16833. [Google Scholar] [CrossRef]
- Sam-Daliri, O.; Faller, L.-M.; Farahani, M.; Zangl, H. Structural health monitoring of adhesive joints under pure mode I loading using the electrical impedance measurement, Engng. Fract. Mech., 2021, 245, 107585. [Google Scholar] [CrossRef]
- Sadeghi, M.Z.; Weiland, J.; Preisler, A.; Zimmermann, J.; Schiebahn, A.; Reisgen, U.; Schröder, K.U. Damage detection in adhesively bonded single lap-joints by using backface strain: Proposing a new position for backface strain gauges, Int J Adhesion Adhes. 2020, 97, 102494. [CrossRef]
- Graner Solana, A.; Crocombe, A.D.; Ashcroft, I.A. Fatigue life and backface strain predictions in adhesively bonded joints, Int J Adhesion Adhes. 2010, 30, 36-42. [CrossRef]
- Shin, C.S.; Chiang, C.C. Deformation monitoring by using optical fiber grating sensor. J. Chinese Inst. Engr. 2005, 28, pp. 985–992. [Google Scholar] [CrossRef]
- Jo, B.W.; Khan, R.M.A.; Lee, Y.S.; Jo, J.H.; Saleem, N. A Fiber Bragg Grating-Based Condition Monitoring and Early Damage Detection System for the Structural Safety of Underground Coal Mines Using the Internet of Things. J Sensors, 2018, 9301873. [CrossRef]
- Papantoniou, A.; Rigas, G.; Alexopoulos, N.D. Assessment of the strain monitoring reliability of fiber Bragg grating sensor (FBGs) in advanced composite structures, Comp Struct. 2011, 93, 2163-2172. [CrossRef]
- Kahandawa, G.C.; Epaarachchi, J.; Wang, H.; Lau, K.T. Use of FBG Sensors for SHM in Aerospace Structures. Photonic Sens. 2012, 2, 203–214. [Google Scholar] [CrossRef]
- Grefe, H.; Weiser, D.; Kandula, M.W.; Dilger, K. Deformation measurement within adhesive bonds of aluminium and CFRP using advanced fibre optic sensors. Manufacturing Rev. 2020, 7, 14. [Google Scholar] [CrossRef]
- Ning, X.; Murayama, H.; Kageyama, K.; Wada, D.; Kanai, M.; Ohsawa, I.; Hirotaka, I. Dynamic strain distribution measurement and crack detection of an adhesive-bonded single-lap-joint under cyclic loading using embedded FBG. Smart Mater Struct. 2014, 23, 105011. [Google Scholar] [CrossRef]
- Young, S.; Penumadu, D.; Foster, D.; Maeser, H.; Balijepalli, B.; Reese, J.; Bank, D.; Dahl, J.; Blanchard, P. Smart Adhesive Joint with High-Definition Fiber-Optic Sensing for Automotive Applications. Sensors 2020, 20, 614. [Google Scholar] [CrossRef]
- Jaiswal, P.R.; Kumar, R.I.; Saeedifar, M.; Saleh, M.; Luyckx, G.; De Waele, W. Deformation and damage evolution of a full-scale adhesive joint between a steel bracket and a sandwich panel for naval application. Proc. Instn Mech. Engr. Part C: J Mech Engng Sci, 2021, 235, 571–584. [Google Scholar] [CrossRef]
- da Silva, L.F.M.; Moreira, P.M.G.P.; Loureiro, A.L.D. Determination of the strain distribution in adhesive joints using Fiber Bragg Grating (FBG), J Adhes Sci Tech. 2014, 28, 1480-1499. [CrossRef]
- Haq, M.; Khomenko, A.; Udpa, L.; Udpa, S. Fiber Bragg-Grating Sensor Array for Health Monitoring of Bonded Composite Lap-Joints. Proc 2013 SEM Annual Conference on Experimental and Applied Mechanics, Lombard, IL, United States,June 3–5, 2013; Eds. Tandon, G.; Tekalur, S.; Ralph, C.; Sottos, N.; Blaiszik, B.; Springer, Cham, Switzerland. 2014, 6, 189–195. [Google Scholar] [CrossRef]
- Karpenko, O.; Koricho, E.; Khomenko, A.; Dib, G.; Haq, M.; Udpa, L. Multitechnique monitoring of fatigue damage in adhesively bonded composite lap-joints. AIP Conference Proceedings 1650, 41st Annual review of progress in quantitative nondestructive evaluation, Boise, Idaho, United States, 20–25 July 2014; Ed.: Chimenti, D.E.; Bond, L.J. AIP Publishing, 2015; pp. 1102–1111. [Google Scholar] [CrossRef]
- Bento, T.; Maciel, R.; Braga, D.F.O.; da Silva, L.F.M.; Moreira, P.M.G.P.; Infante, V. Self-sensing FS Weld-bonded joints for structural monitoring, Proc Struct Intgr. 2020, 25, 234-245. [CrossRef]
- Cabral, T.D.; Zimmermann, A.C.; Willemann, D.P.; Gonçalves, Jr., A. A. Pipeline Bonded Joints Assembly and Operation Health Monitoring with Embedded FBG Sensors. Eng. Proc. 2020, 2, 5. [Google Scholar] [CrossRef]
- Zeng, H.; Yan, R.; Xu, L.; Gui, S. Application study on fiber Bragg grating sensors in damage monitoring of sandwich composite joints, J. Sandwich Struct. Mater. 2020, 22, 1542–1563. [Google Scholar] [CrossRef]
- Scheel, I.; Udd, E. Fiber gratings strain sensor systems for composites and adhesive joints. Proc. SPIE 10168, Sensors and Smart Structures Technologies for Civil, Mechanical, and Aerospace Systems 2017, SPIE Smart Structures and Materials + Nondestructive Evaluation and Health Monitoring, Portland, Oregon, United States, 25-29 March 2017. 101681L. [CrossRef]
- Palaniappan, J.; Wang, H.; Ogin, S.L.; Thorne, A.M.; Reed, G.T.; Crocombe, A.D.; Rech, Y.; Tjin, S.C. Changes in the reflected spectra of embedded chirped fibre Bragg gratings used to monitor disbonding in bonded composite joints, Comp Sci Tech. 2007, 67, 2847-2853. [CrossRef]
- Palaniappan, J.; Ogin, S.L.; Thorne, A.M.; Reed, G.T.; Crocombe, A.D.; Capell, T.F.; Tjin, S.C.; Mohanty, L. Disbond growth detection in composite–composite single-lap-joints using chirped FBG sensors, Comp Sci Tech. 2008, 68, 2410-2417. [CrossRef]
- Webb, S.; Shin, P.; Peters, K.; Zikry, M.A.; Stan, N.; Chadderdon, S.; Selfridge, R.; Schultz, S. Characterization of fatigue damage in adhesively bonded lap-joints through dynamic, full spectral interrogation of fiber Bragg grating sensors: 1. Experiments. Smart Mater Struct 2014, 23, 025016. [Google Scholar] [CrossRef]
- Shin, C.-S.; Lin, T.-C. Adhesive Joint Integrity Monitoring Using the Full Spectral Response of Fiber Bragg Grating Sensors. Polymers 2021, 13, 2954. [Google Scholar] [CrossRef] [PubMed]
- Shin, C.S. ; Lin T-C. Hygro-thermal damage monitoring of composite adhesive joint using the full spectral response of fiber Bragg grating sensors. Polymers 2022, 14, 368. [Google Scholar] [CrossRef]
- Webb, S.; Shin, P.; Peters, K.; Zikry, M.A.; Stan, N.; Chadderdon, S.; Selfridge, R.; Schultz, S. Characterization of fatigue damage in adhesively bonded lap-joints through dynamic, full spectral interrogation of fiber Bragg grating sensors: 2. Simulations. Smart Mater Struct 2014, 23, 025017. [Google Scholar] [CrossRef]
- Vella, T.; Chadderdon, S.; Selfridge, R.; Schultz, S.; Webb, S.; Park, C.; Peters, K.; Zikry, M. Full-spectrum interrogation of fiber Bragg gratings at 100 kHz for detection of impact loading. Meas Sci Tech. 2010, 21, 094009. [Google Scholar] [CrossRef]
- Shin, C.-S.; Chen, L.-W. Damage Monitoring of Composite Adhesive Joint Integrity Using Conductivity and Fiber Bragg Grating. Polymers 2023, 15, 1575. [Google Scholar] [CrossRef]
- Menendez, J.M.; Guemes, J.A. Bragg-grating-based multiaxial strain sensing: its application to residual strain measurement in composite laminates. Proc. SPIE 3986, Sensory Phenomena and Measurement Instrumentation for Smart Structures and Materials 2000. In SPIE's 7th Annual Int. Symp. on Smart Structures and Materials, Newport Beach, CA, United States, 6-9 MARCH 2000; Volume 3986. [CrossRef]
- Gonçalves, J.P.M.; de Moura, M.F.S.F.; de Castro, P.M.S.T. A three-dimensional finite element model for stress analysis of adhesive joints. Int J Adhesion Adhes. 2002, 22, 357–365. [Google Scholar] [CrossRef]
- Yang, Y.J. Monitoring fatigue damage of an adhesive joint using fiber optics sensors. Master Thesis, 2016, Department of Mechanical Engineering, National Taiwan University.
Figure 1.
Schematic diagram showing the effect of complex strain field on the spectral shape reflected from an FBG.
Figure 1.
Schematic diagram showing the effect of complex strain field on the spectral shape reflected from an FBG.
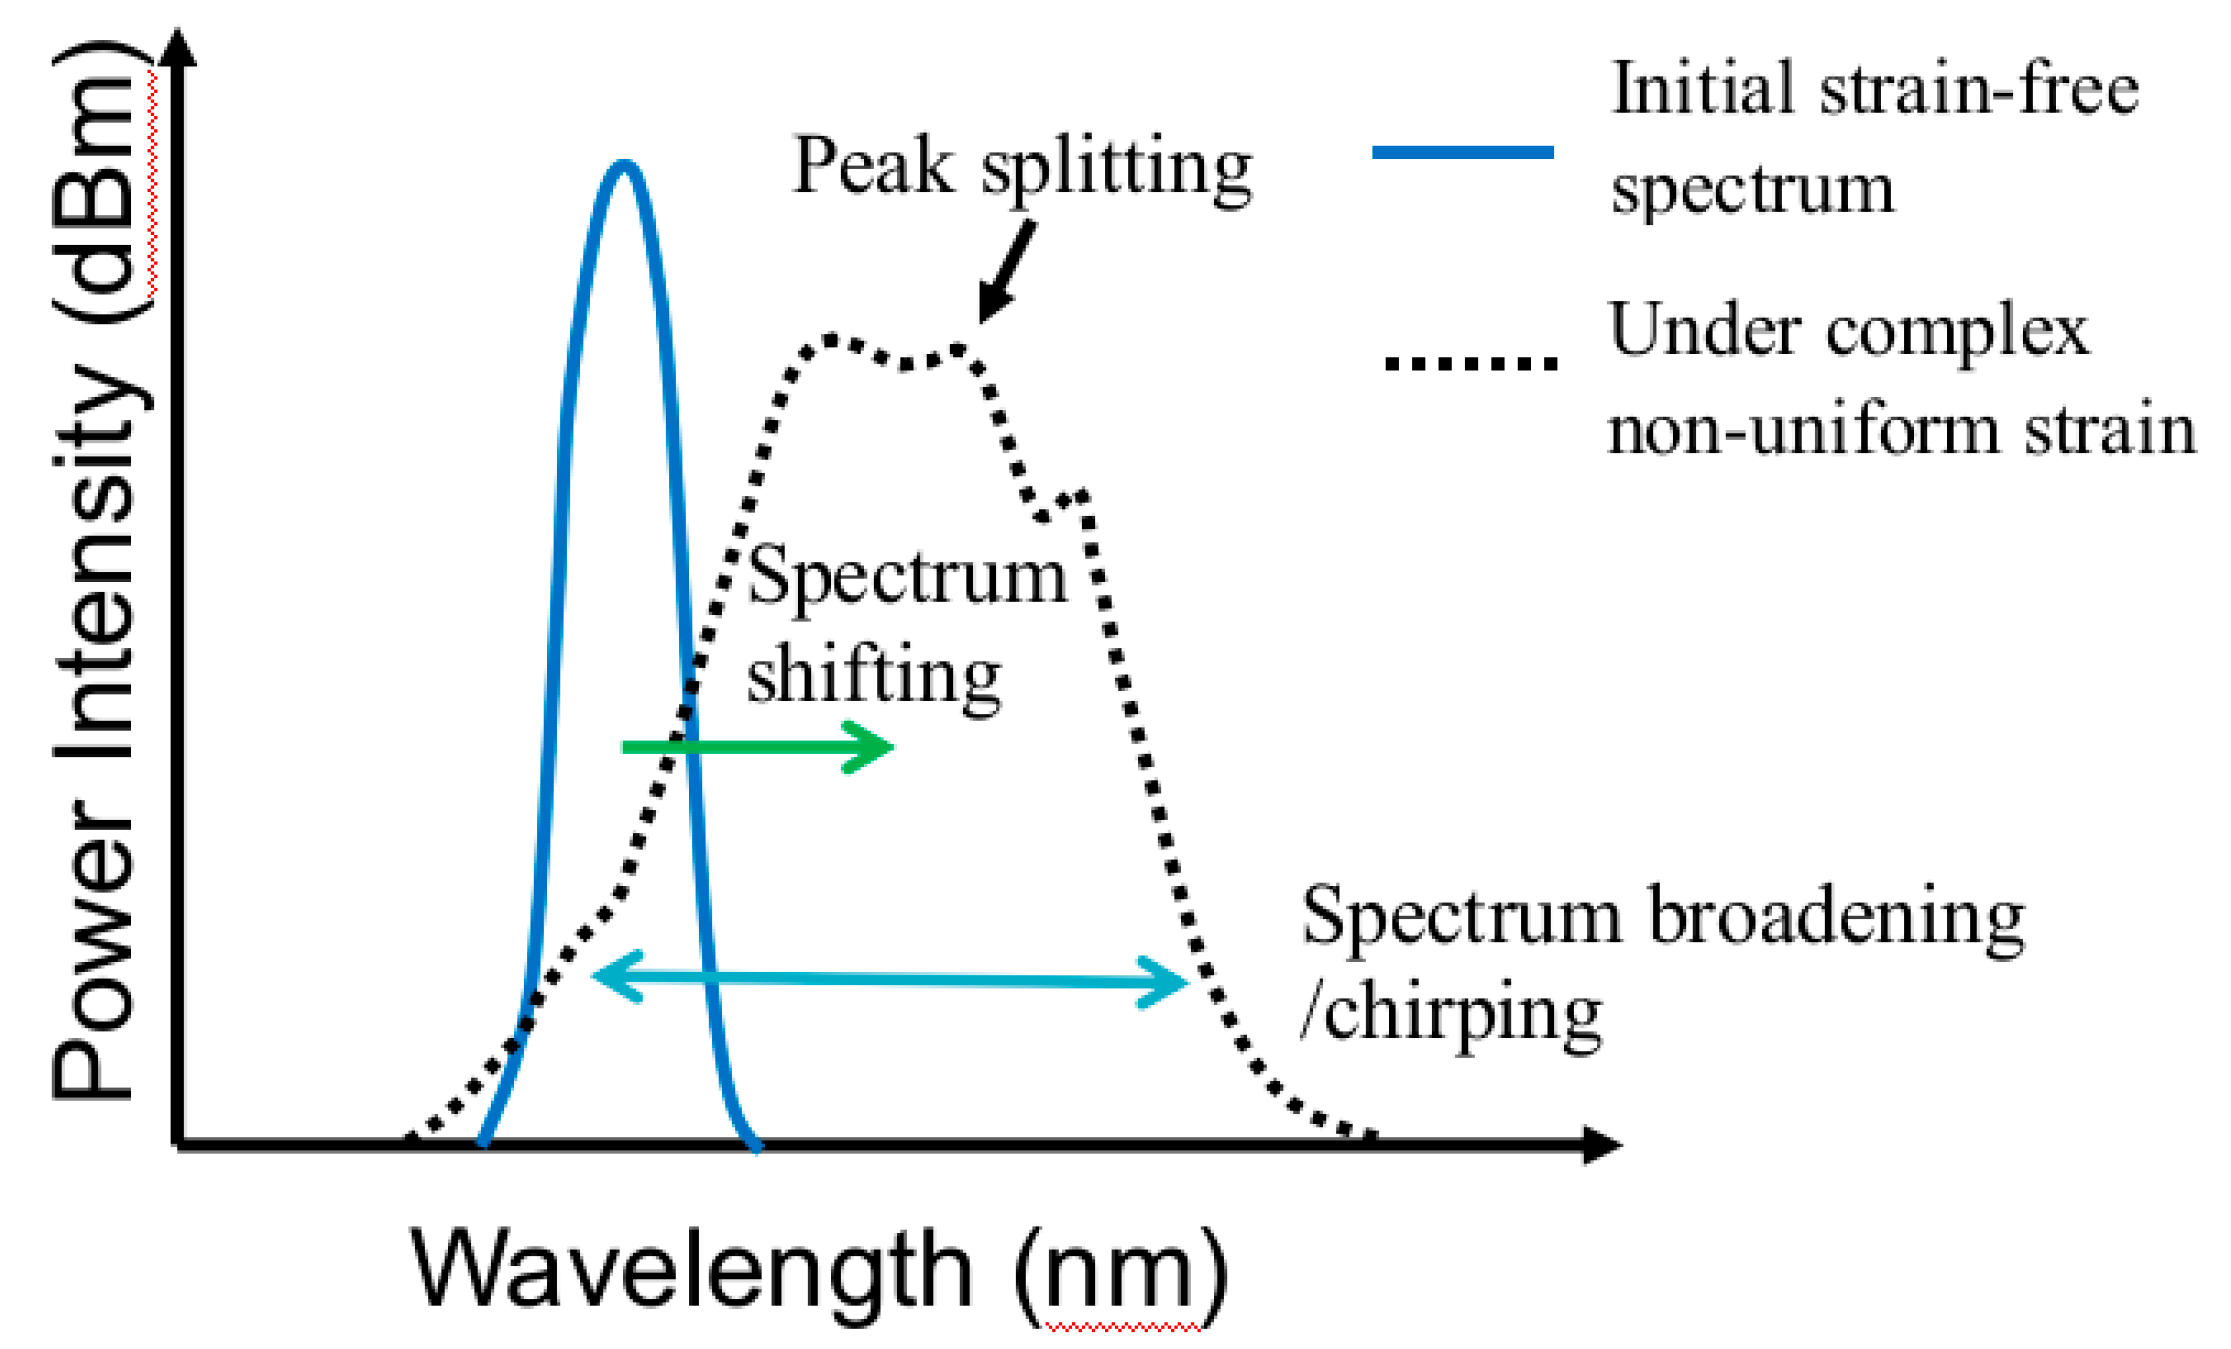
Figure 2.
Schematic arrangement for energy modulation interrogation of FBG.
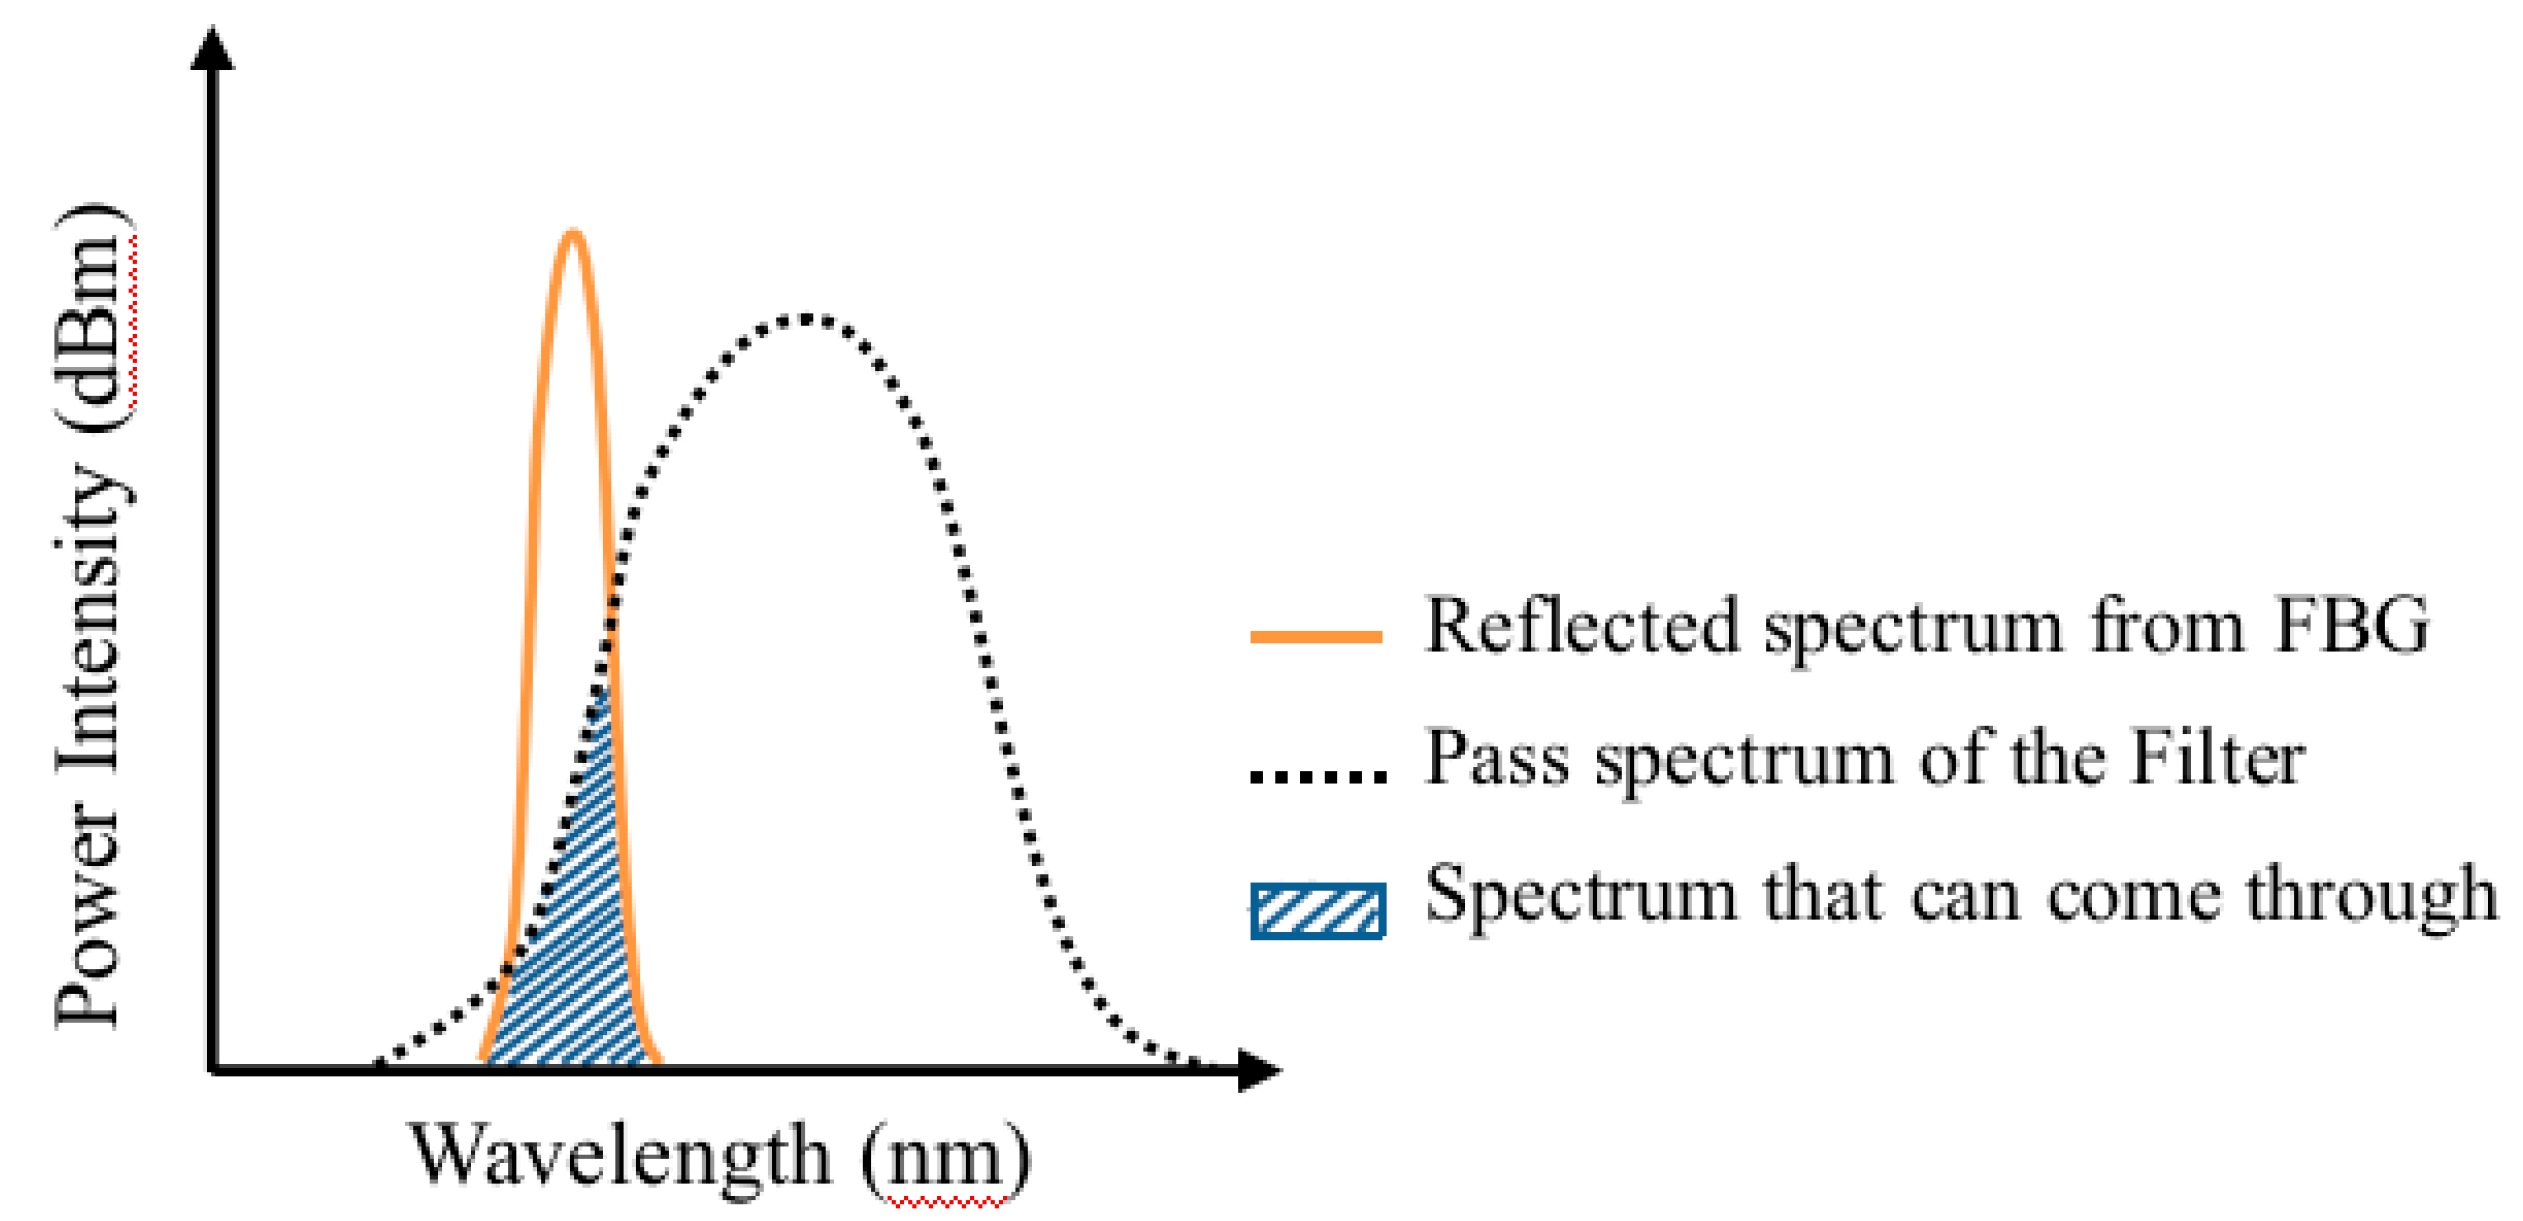
Figure 3.
Overlapping of the FBG and filter spectra resulted in the hatched area that will come through the filter.
Figure 3.
Overlapping of the FBG and filter spectra resulted in the hatched area that will come through the filter.
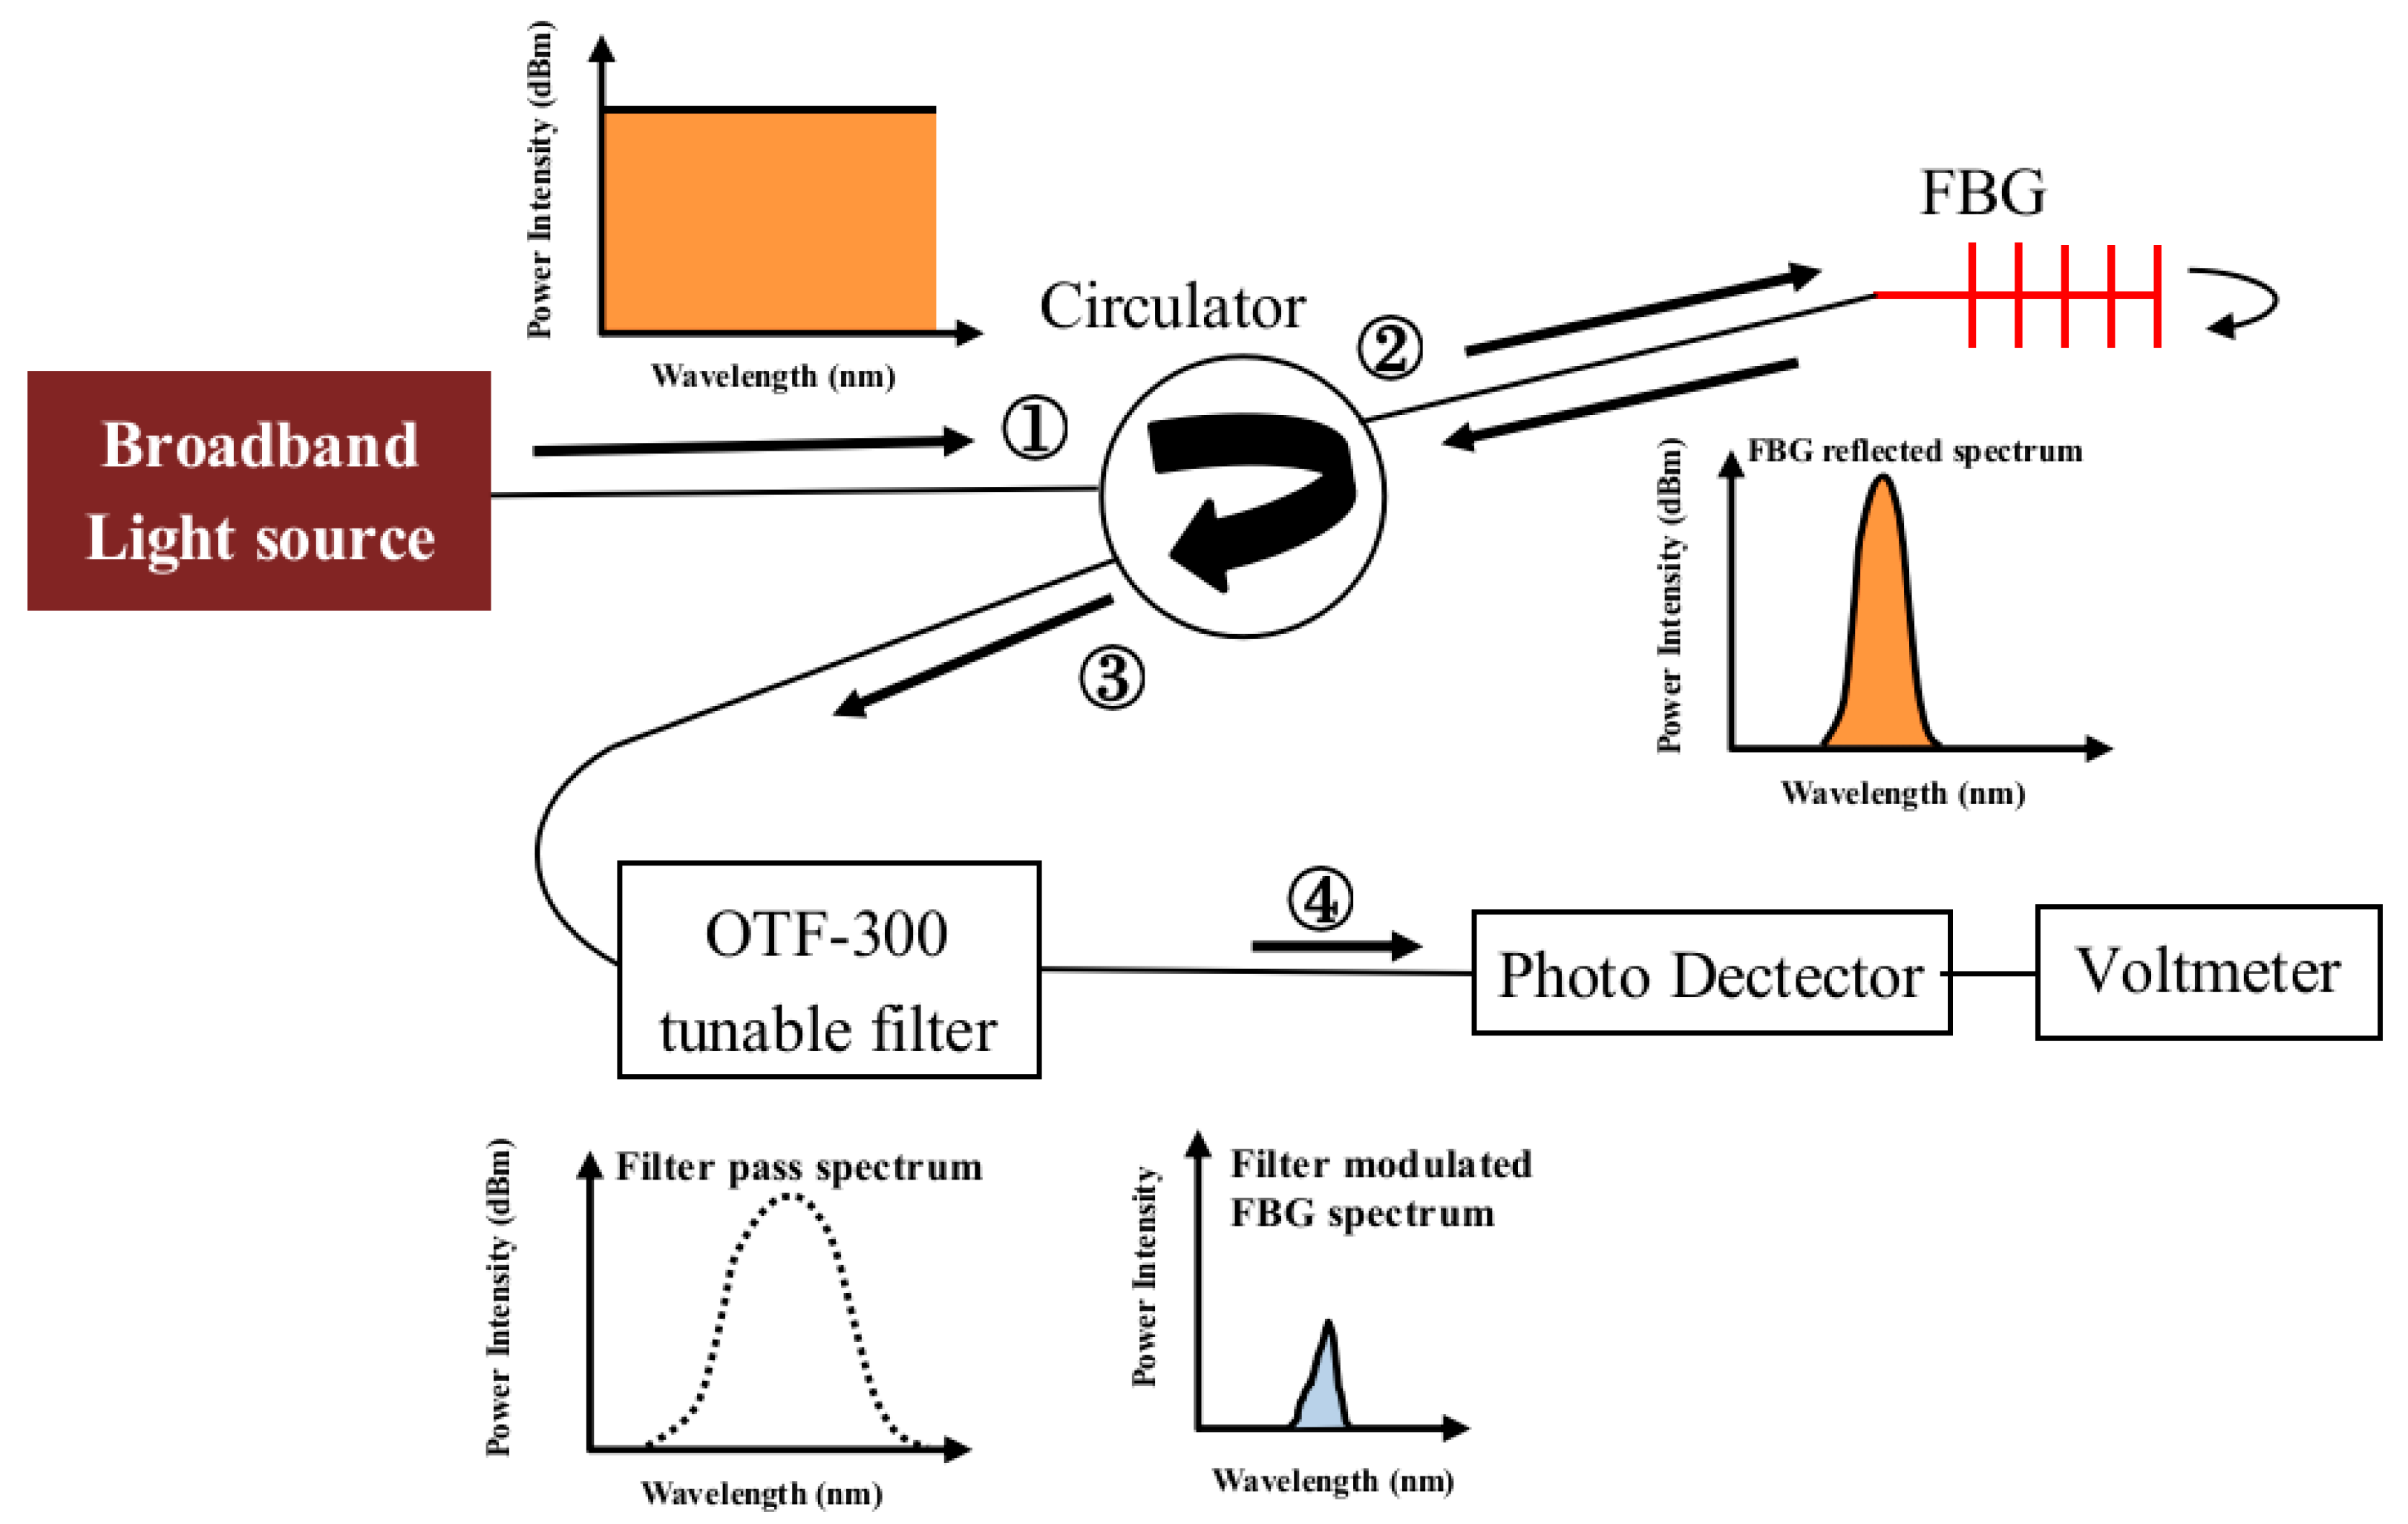
Figure 4.
Comparison of measured filter spectrum with the quadratic fit with light intensity in (a) dbm; and (b) nW.
Figure 4.
Comparison of measured filter spectrum with the quadratic fit with light intensity in (a) dbm; and (b) nW.
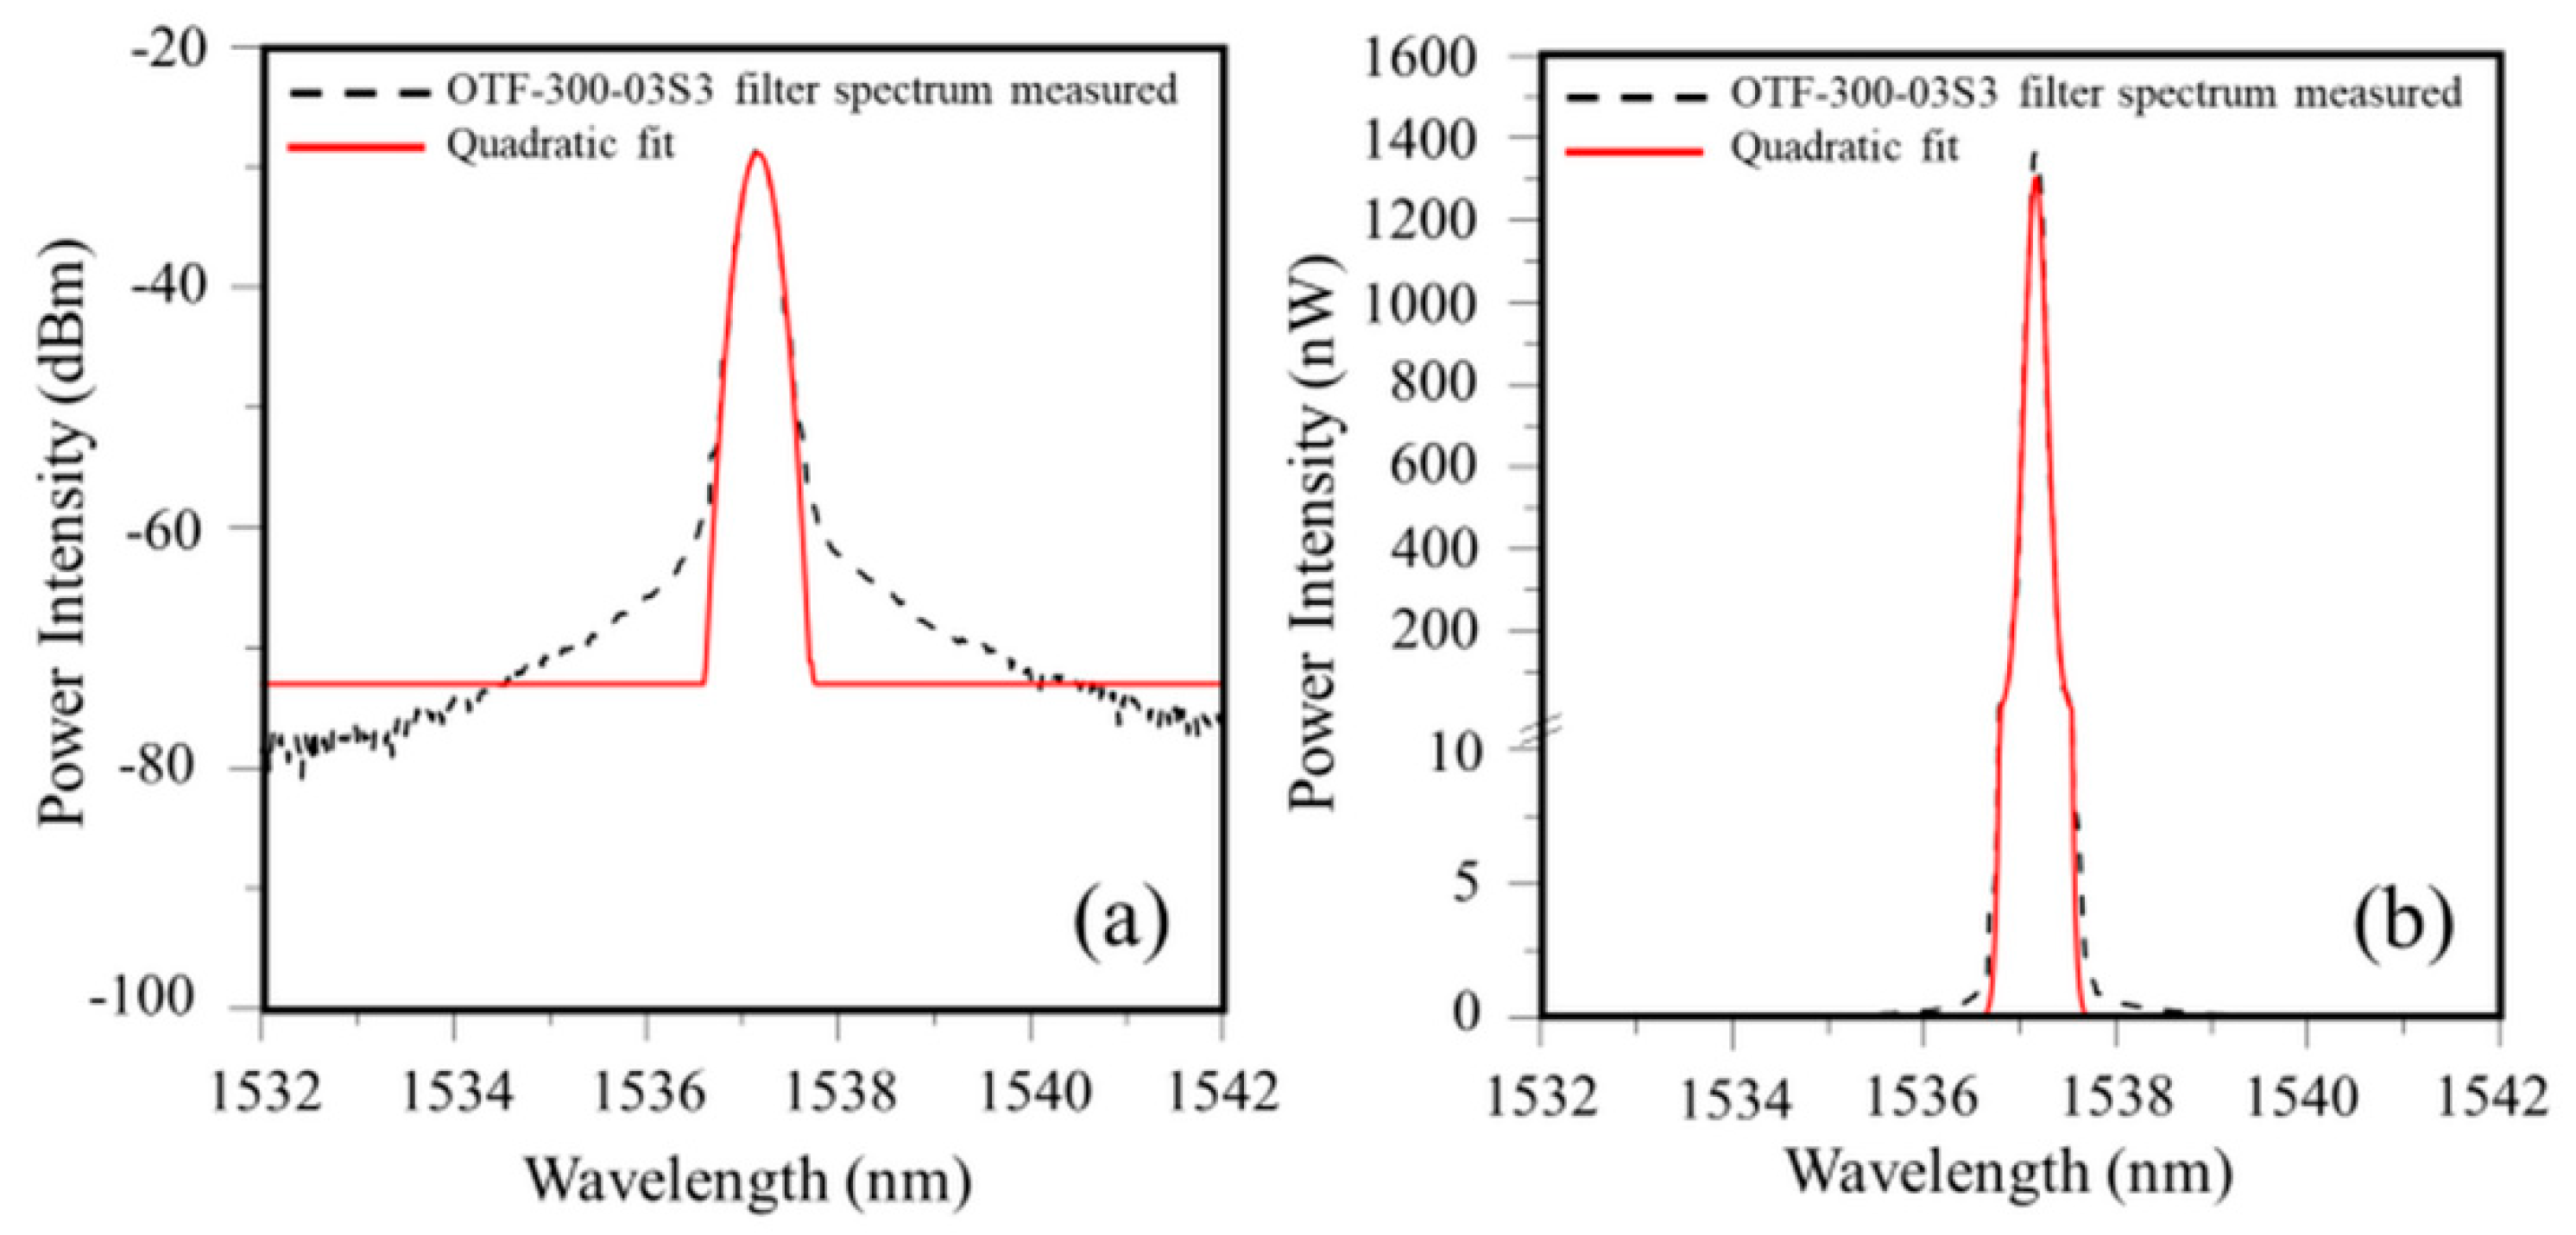
Figure 5.
Simulated filter spectra for full width at half maximum equals (a) 1 nm, (b) 3 nm, and (c) 5 nm.
Figure 5.
Simulated filter spectra for full width at half maximum equals (a) 1 nm, (b) 3 nm, and (c) 5 nm.
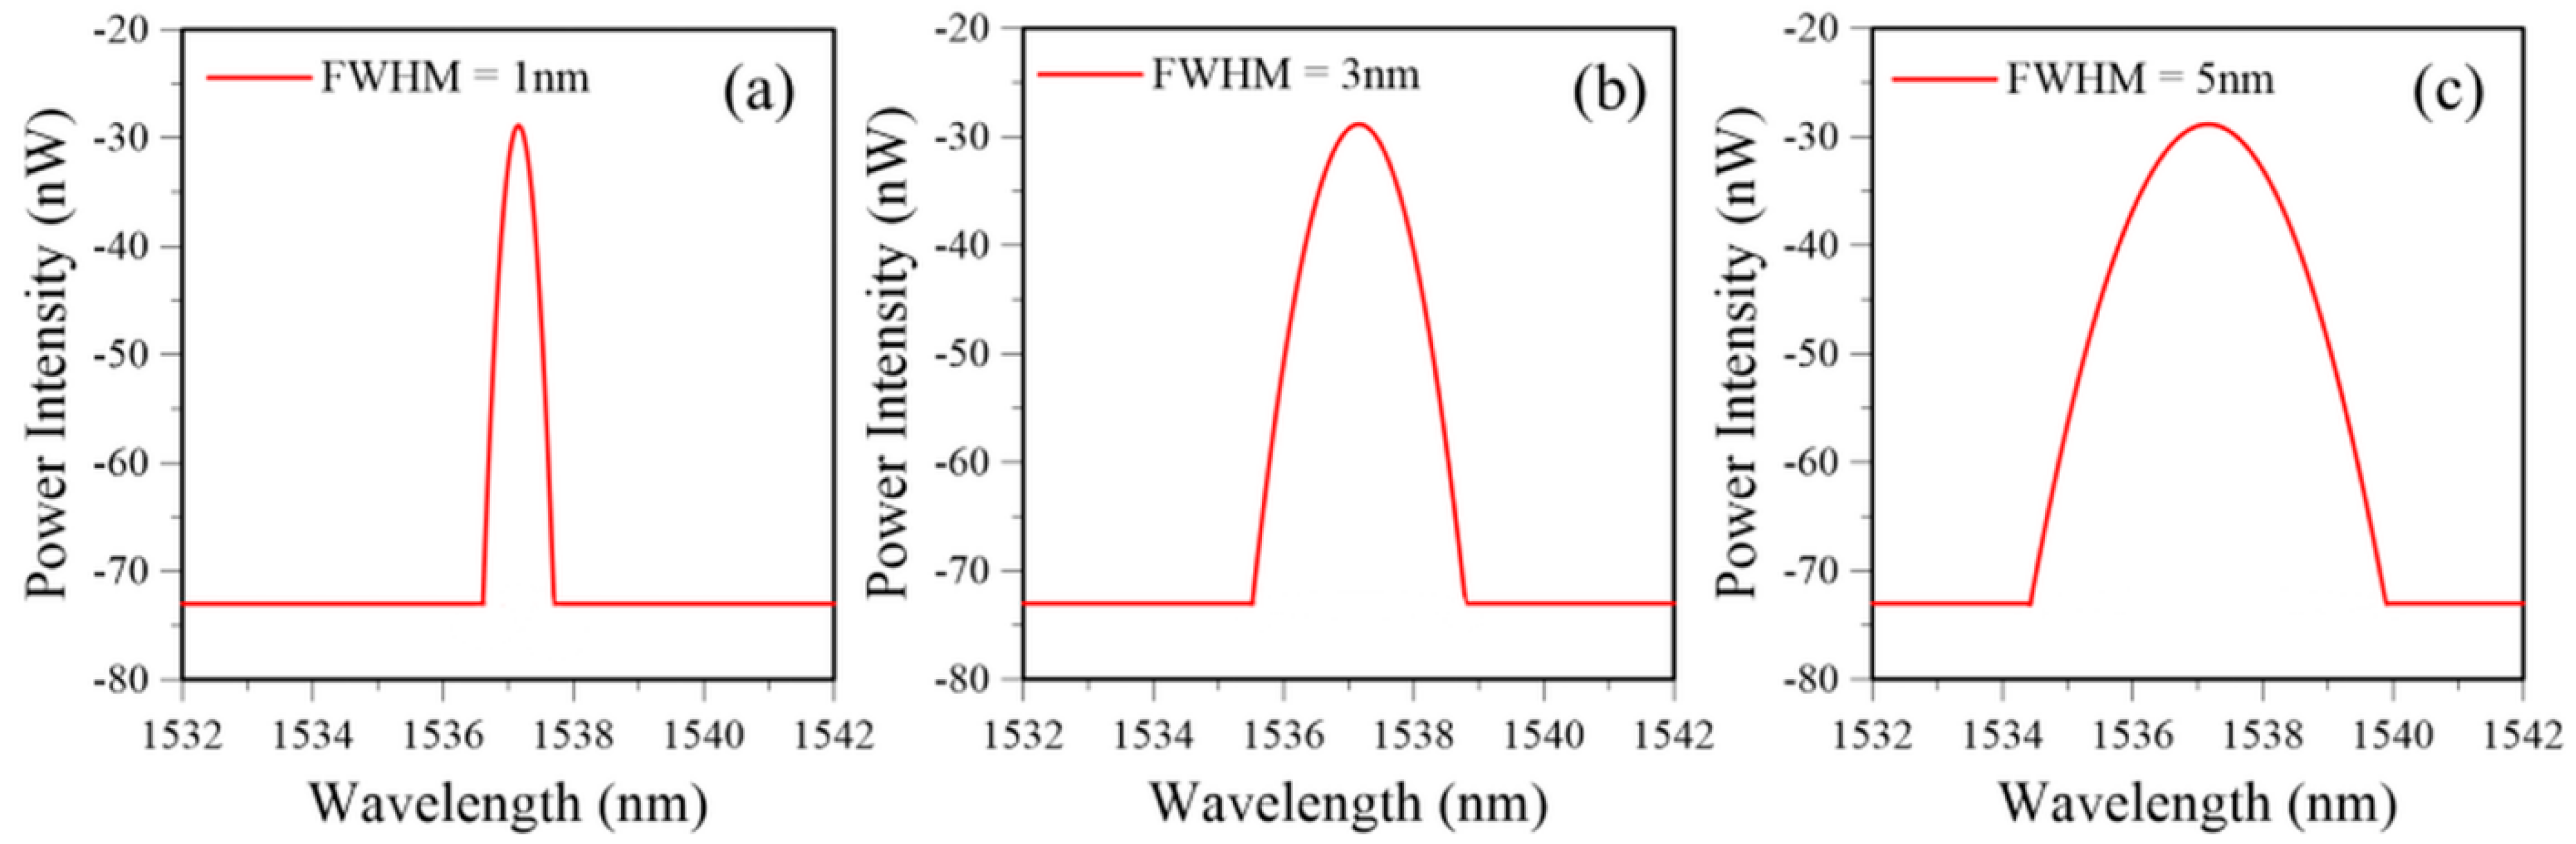
Figure 6.
The evolution of FBG spectrum measured at increasing load during a tensile test (the bracketed numbers after the loading values in the figure legends indicated the loading as a percentage of the failure load).
Figure 6.
The evolution of FBG spectrum measured at increasing load during a tensile test (the bracketed numbers after the loading values in the figure legends indicated the loading as a percentage of the failure load).
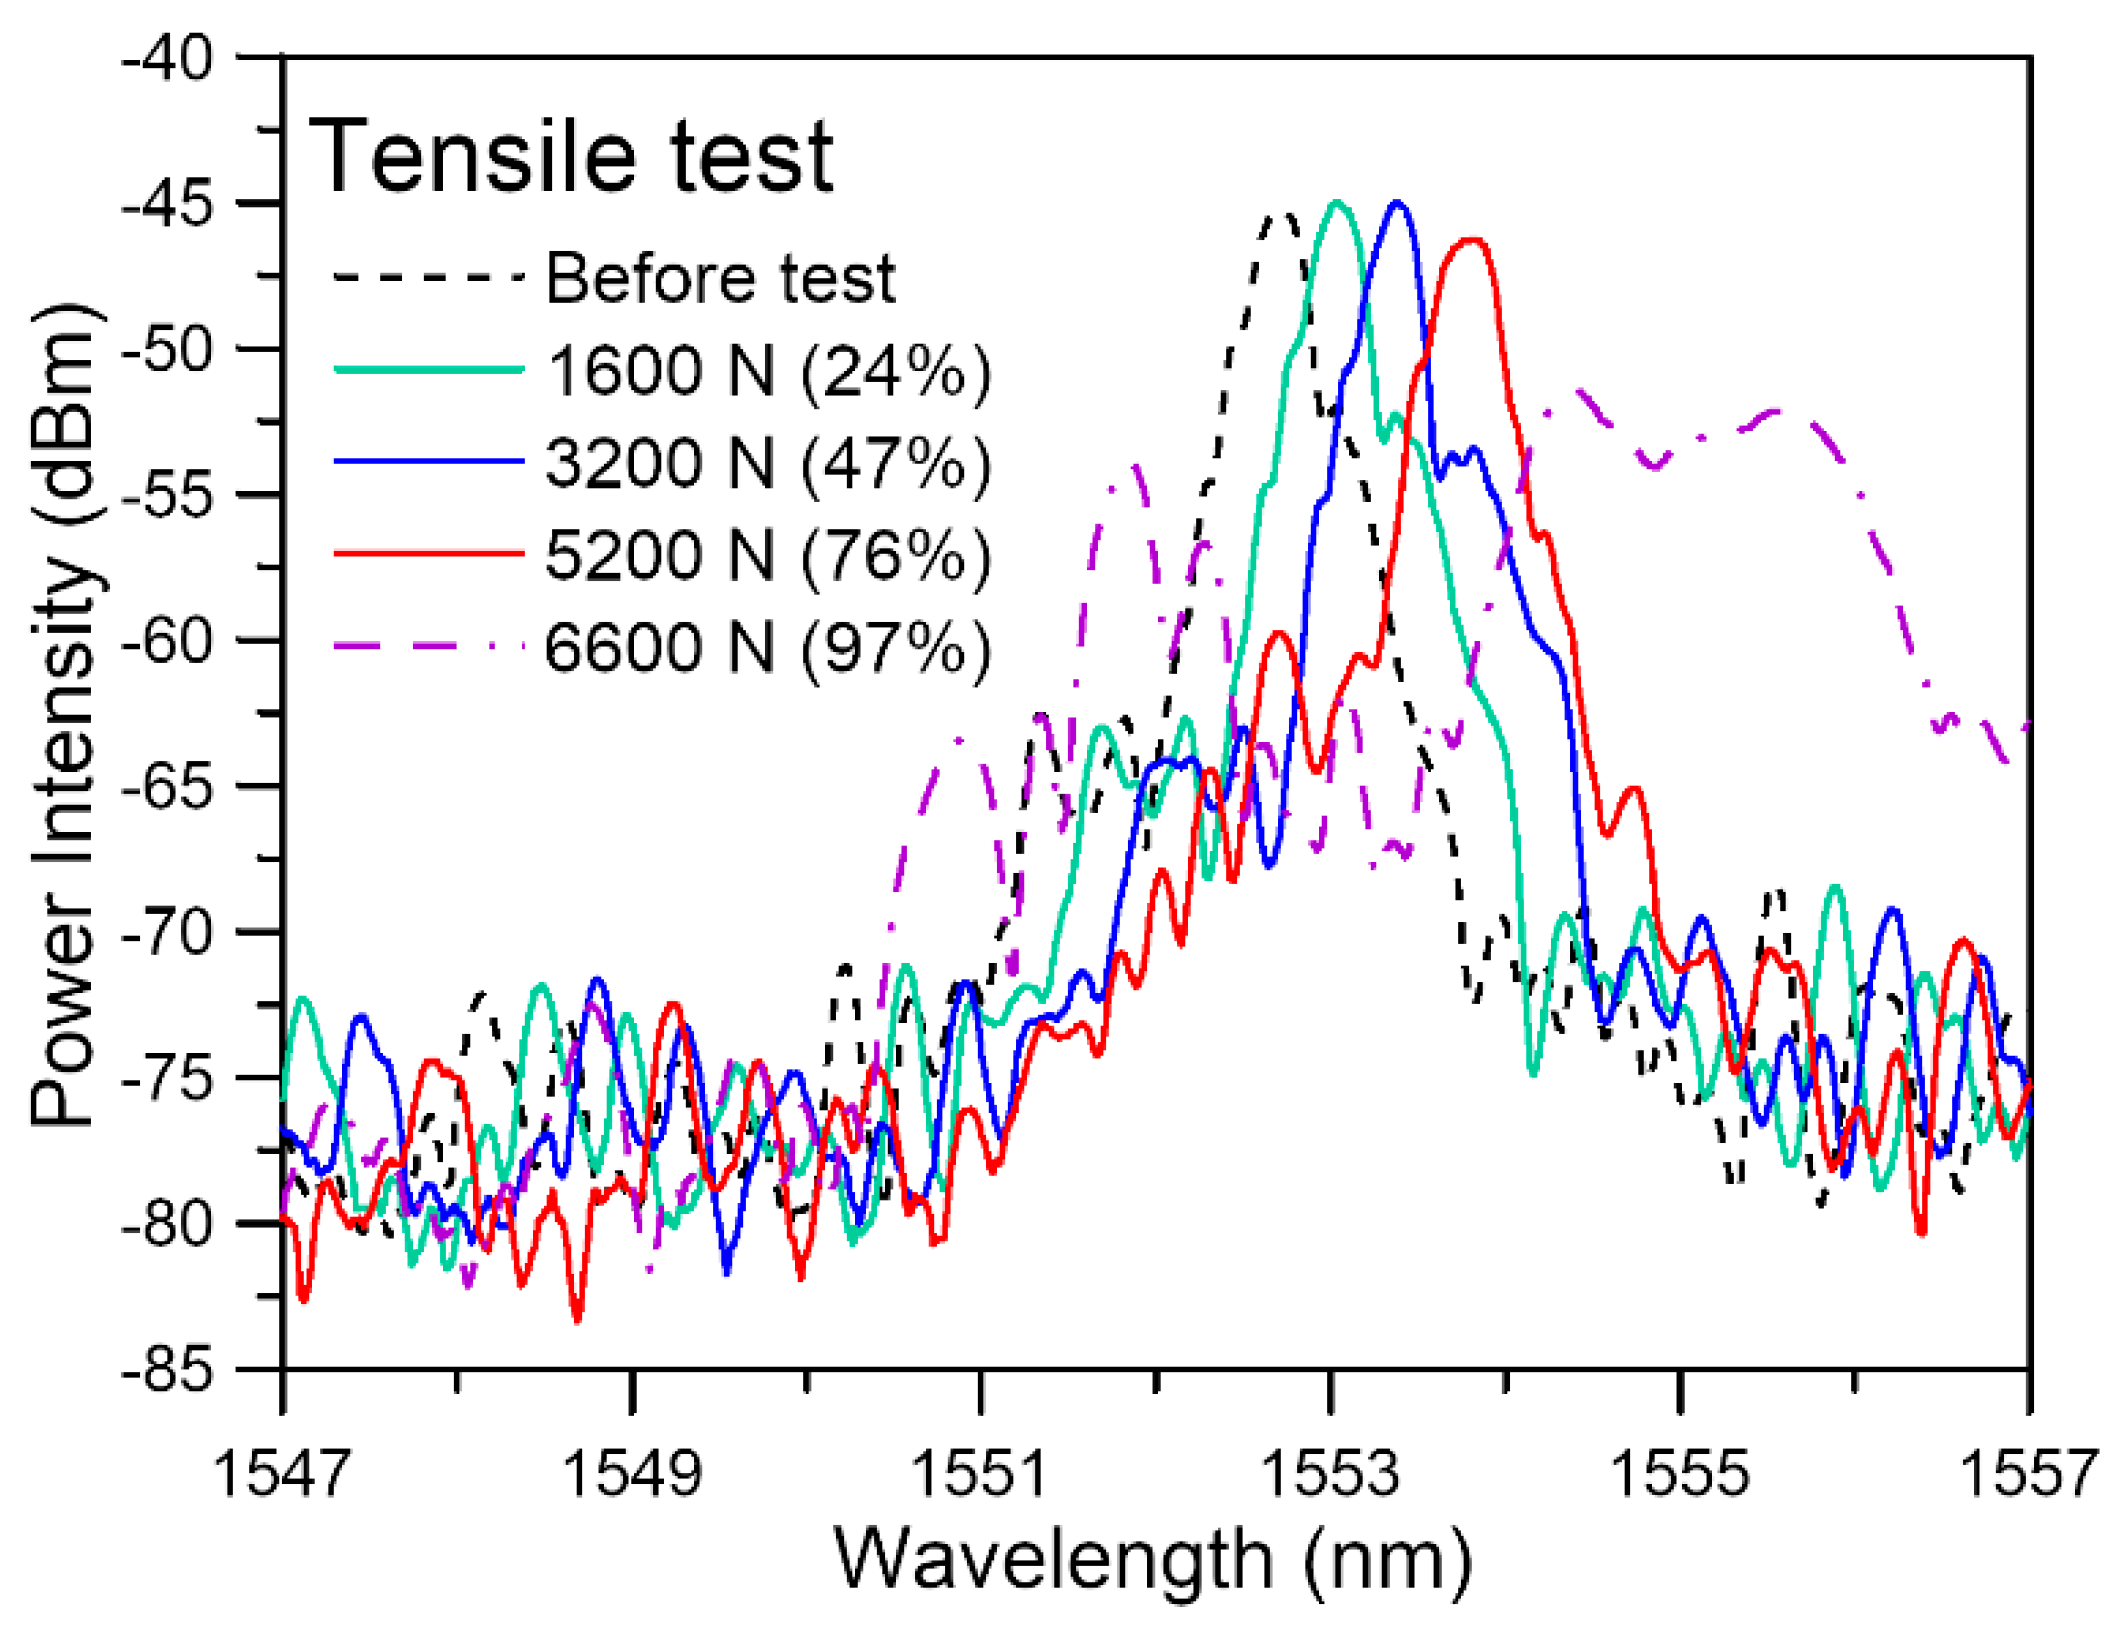
Figure 7.
The evolution of the load-free FBG spectrum measured after progressively increasing load during a tensile test (the bracketed numbers after the loading values in the figure legends indicated the loading as a percentage of the failure load).
Figure 7.
The evolution of the load-free FBG spectrum measured after progressively increasing load during a tensile test (the bracketed numbers after the loading values in the figure legends indicated the loading as a percentage of the failure load).
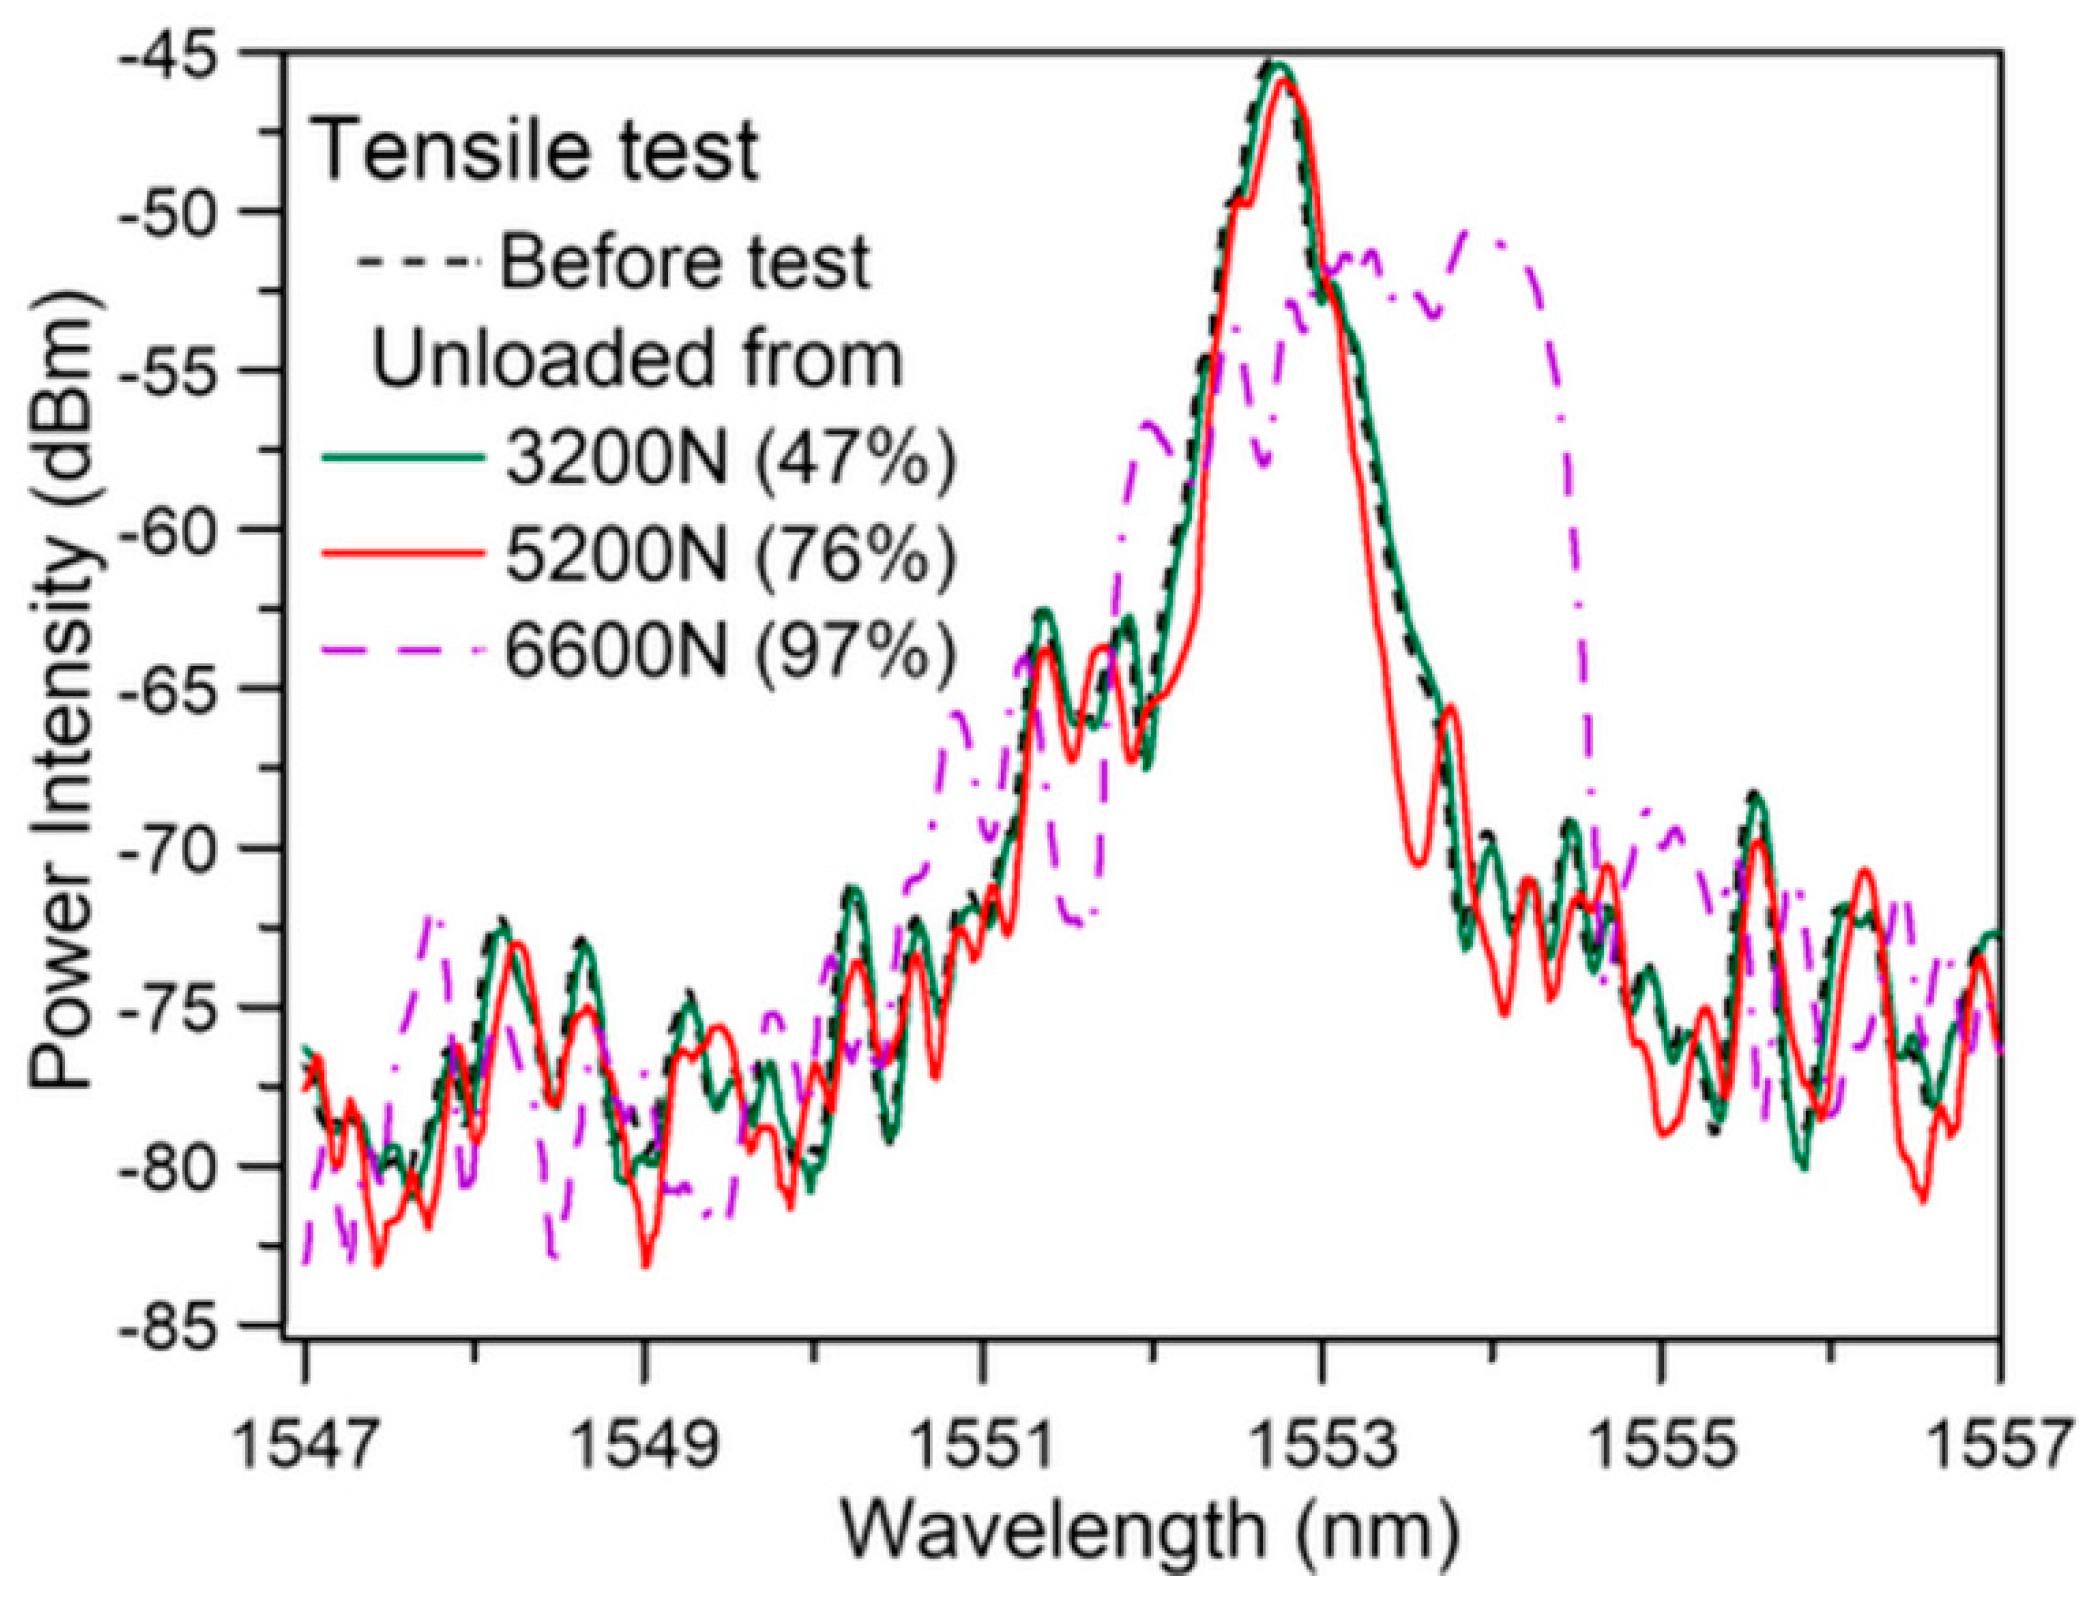
Figure 8.
Comparison of calculated and measured energy modulated results: (a) relative positions between the filter and FBG spectra to give 0.5 of maximum voltage; (b) energy modulated output spectra in dbm; (c) energy modulated output spectra in nW.
Figure 8.
Comparison of calculated and measured energy modulated results: (a) relative positions between the filter and FBG spectra to give 0.5 of maximum voltage; (b) energy modulated output spectra in dbm; (c) energy modulated output spectra in nW.
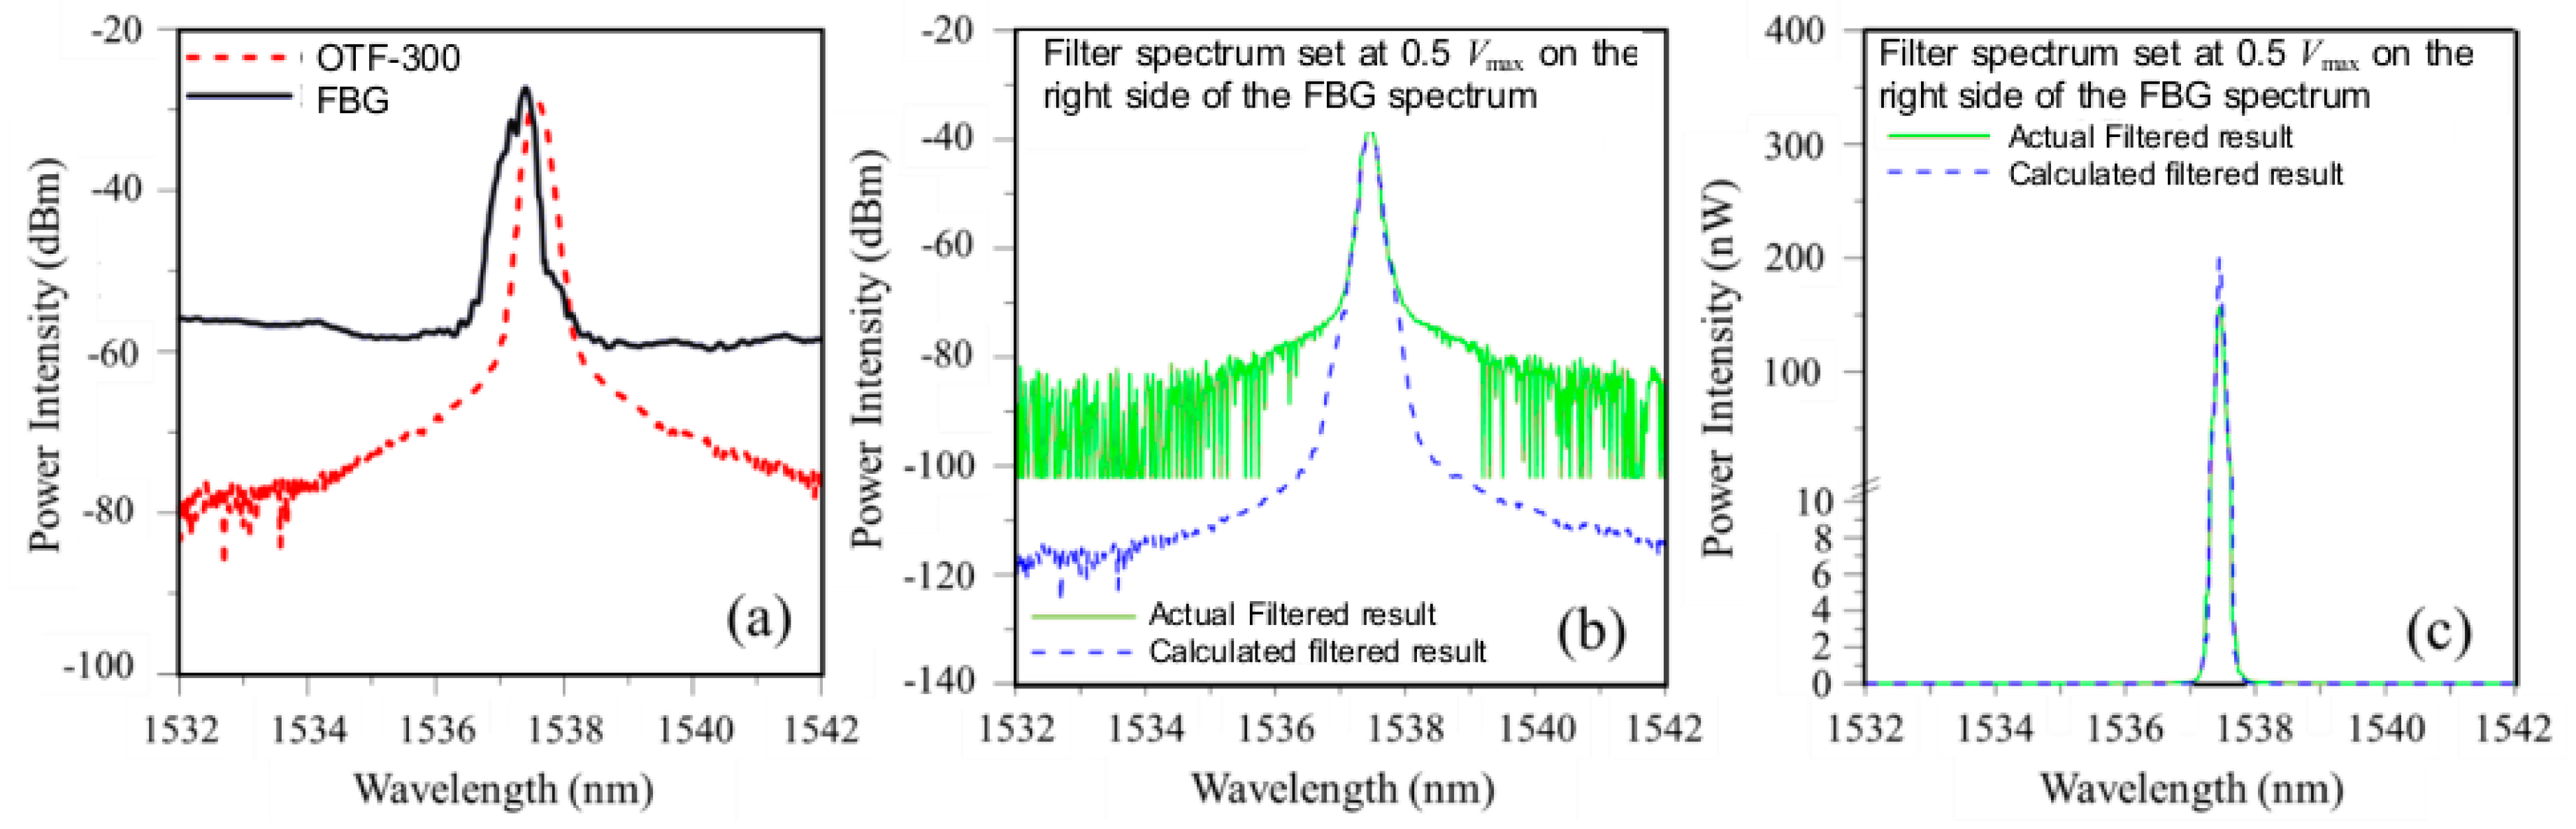
Figure 9.
Comparison of calculated and measured energy modulated results: (a) relative positions between the filter and FBG spectra to give 0.1 of maximum voltage; (b) energy modulated output spectra in dbm; (c) energy modulated output spectra in nW.
Figure 9.
Comparison of calculated and measured energy modulated results: (a) relative positions between the filter and FBG spectra to give 0.1 of maximum voltage; (b) energy modulated output spectra in dbm; (c) energy modulated output spectra in nW.
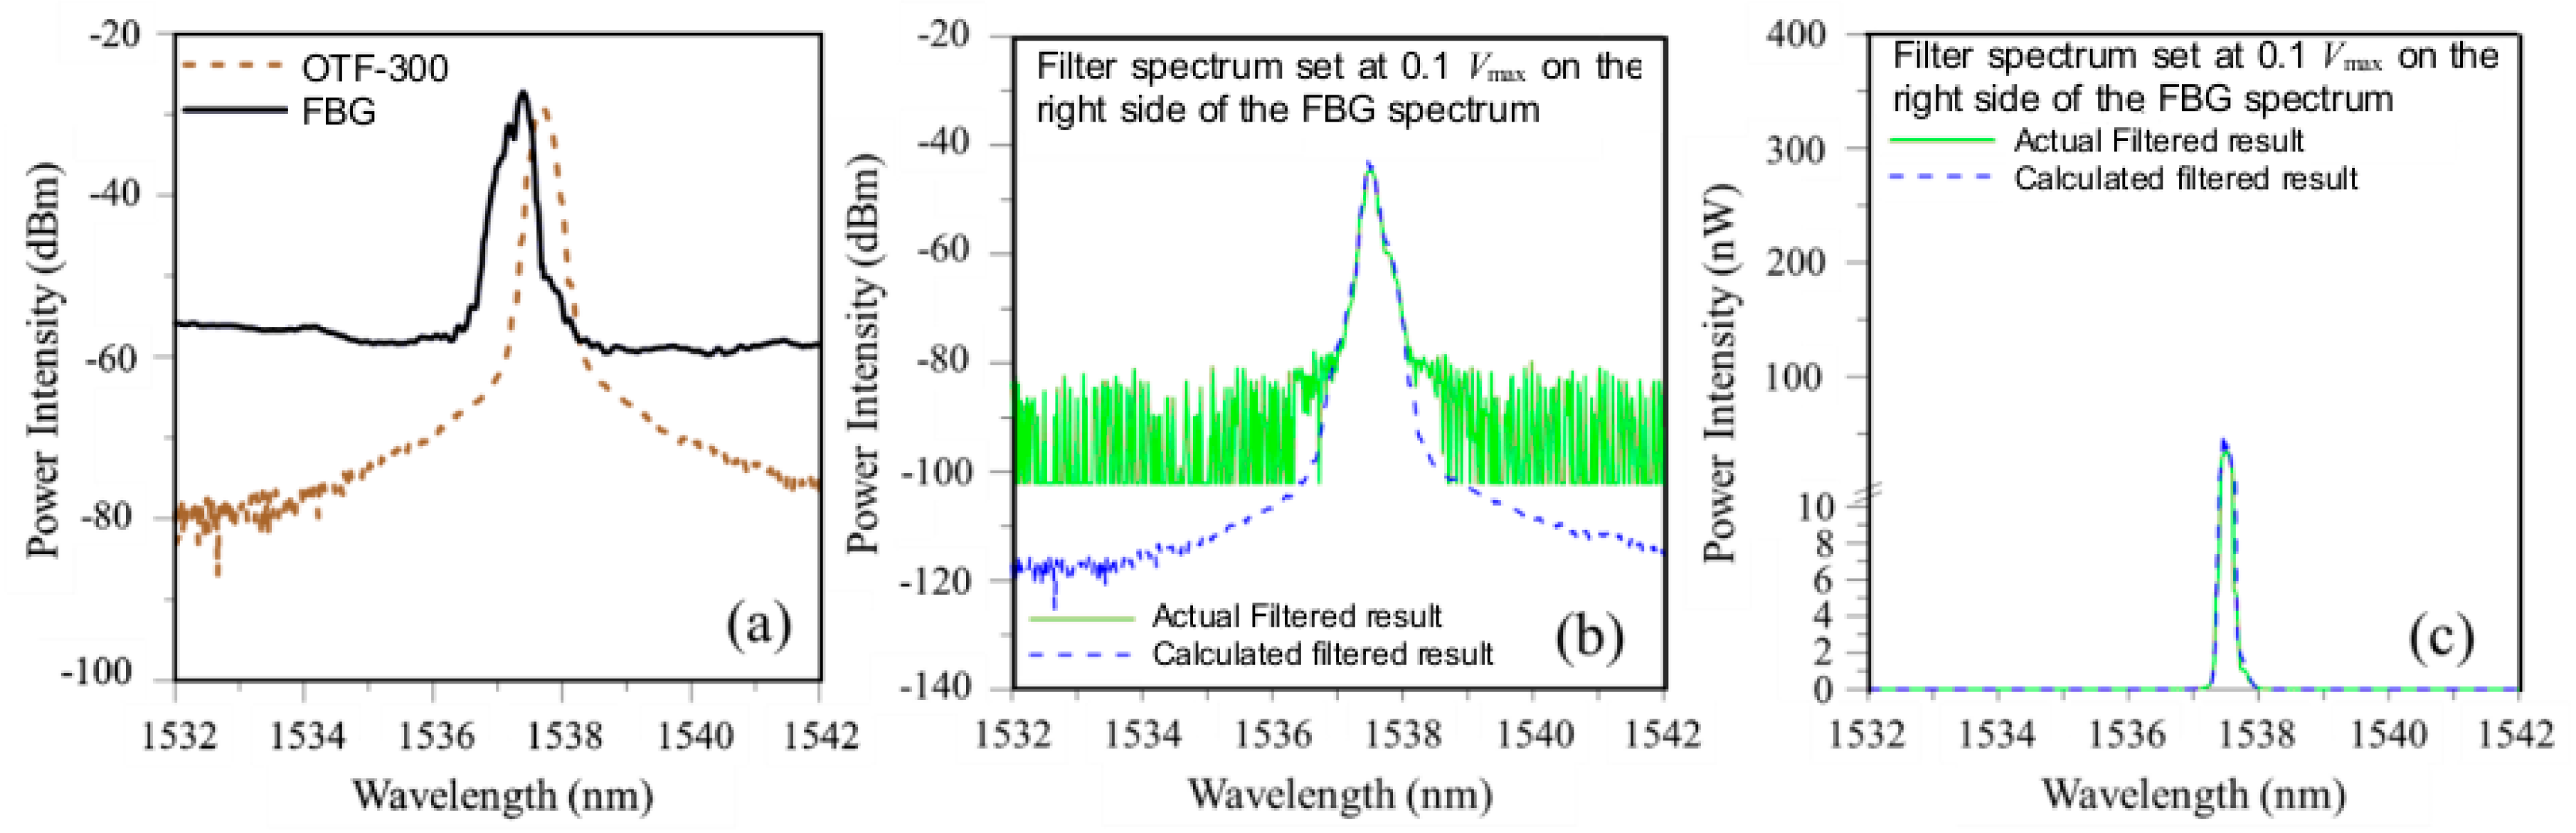
Figure 10.
(a) the FBG and the two filter spectra before the test; (b) evolution of the unloaded FBG spectra up to 96% of failure load.
Figure 10.
(a) the FBG and the two filter spectra before the test; (b) evolution of the unloaded FBG spectra up to 96% of failure load.
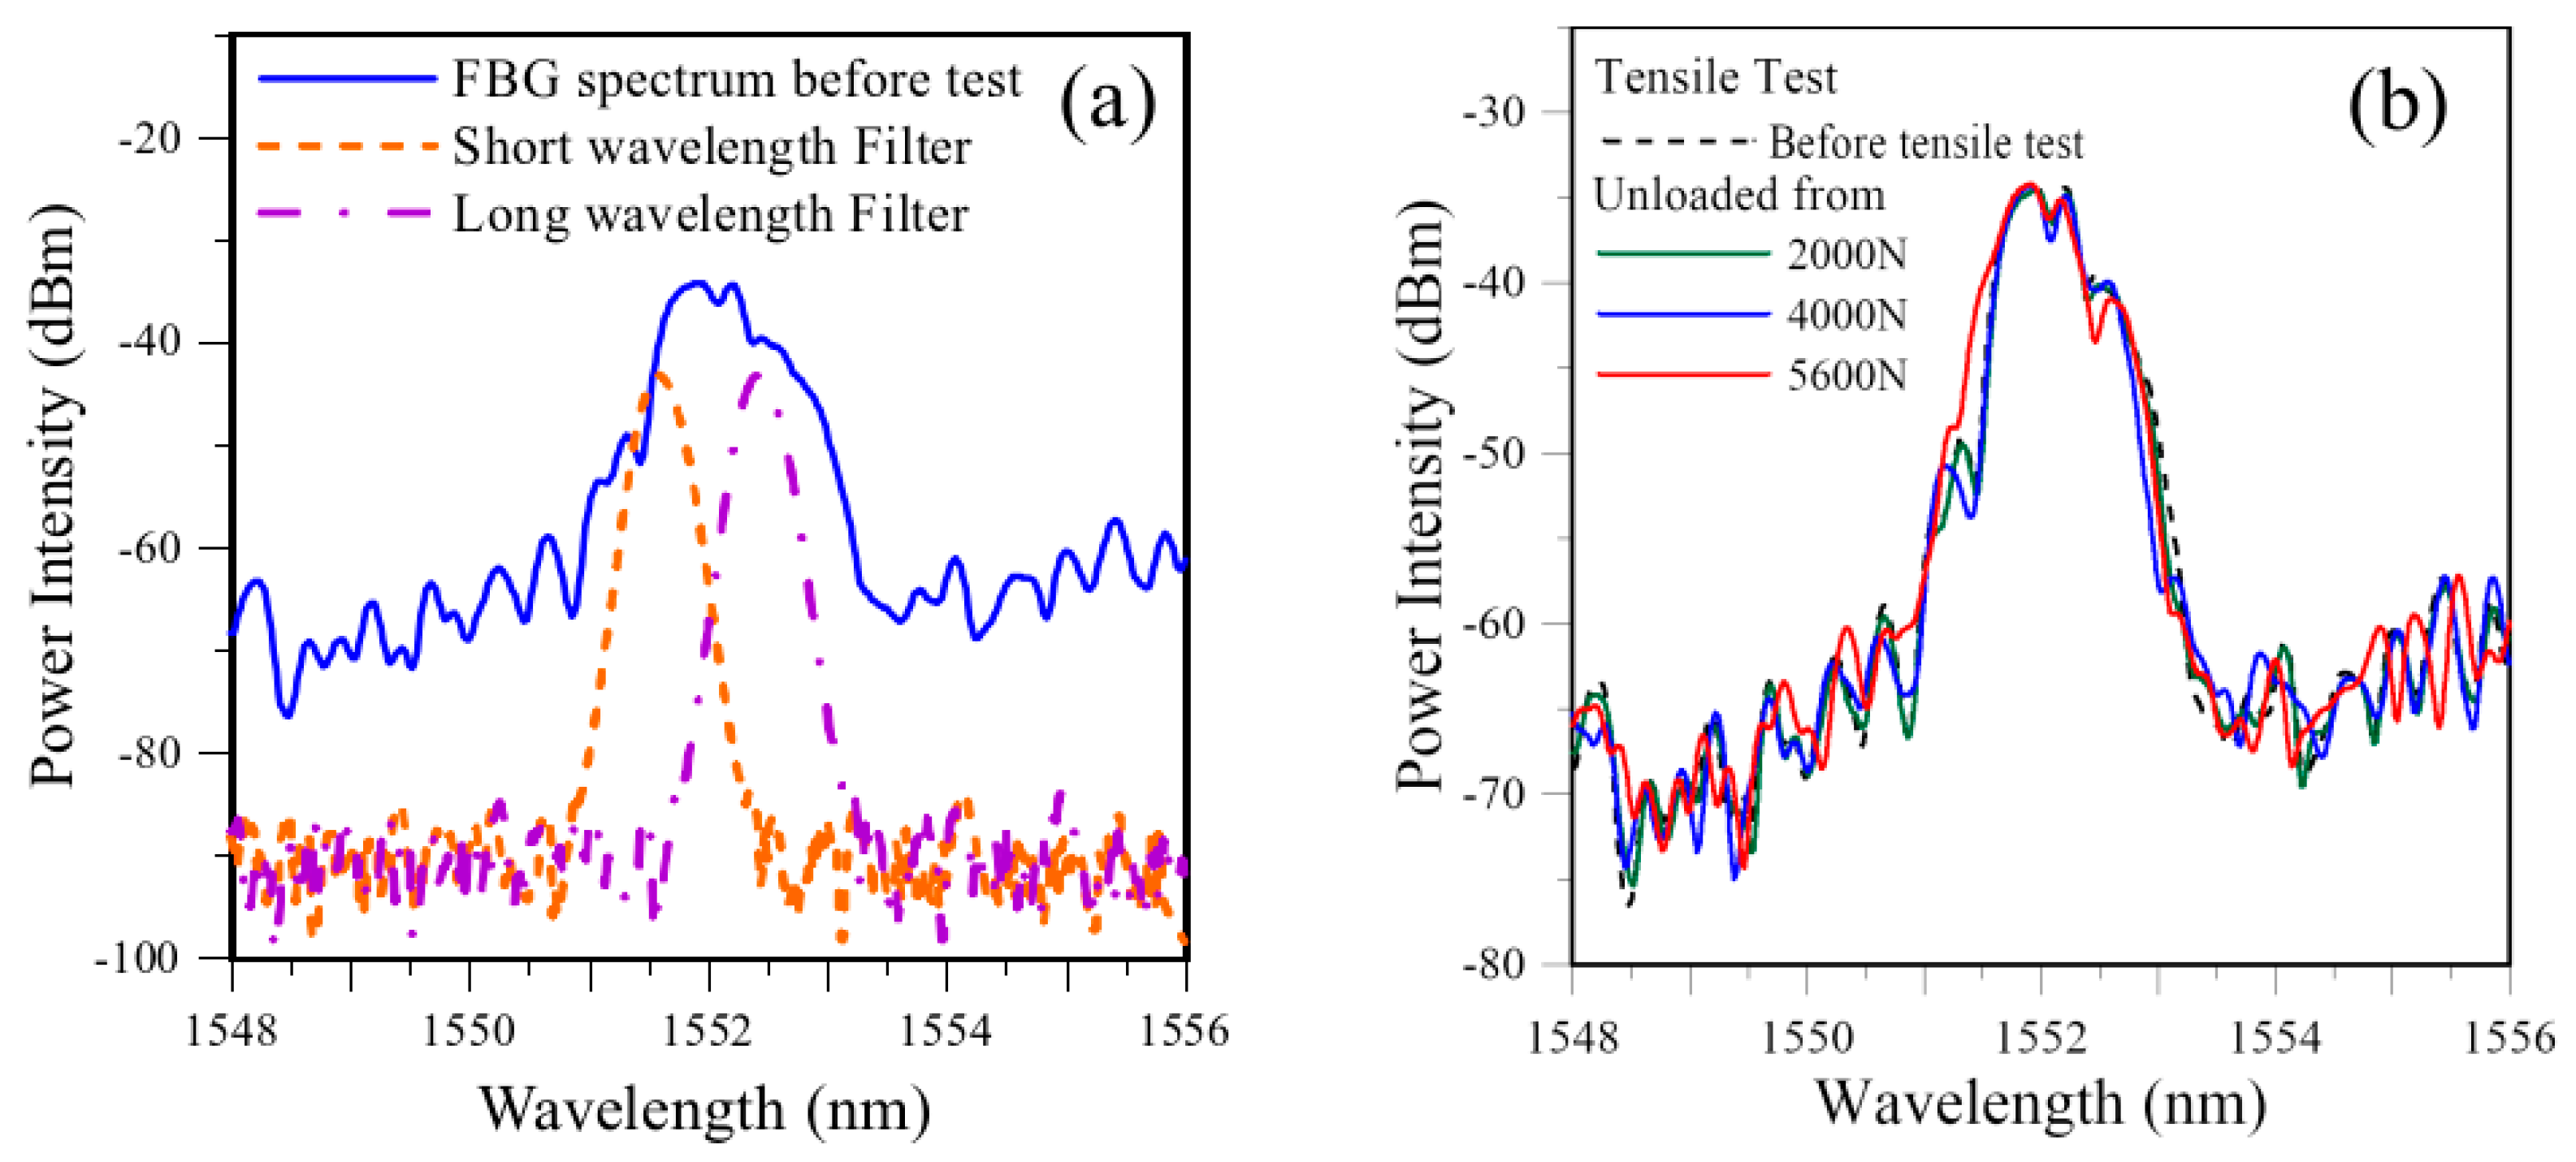
Figure 11.
Comparison between the measured and simulated energy modulation outputs from the filter: (a) on the short wavelength side, with an initial output of 0.5 Vmax ; (b) on the long wavelength side, with an initial output of 0.25 Vmax.
Figure 11.
Comparison between the measured and simulated energy modulation outputs from the filter: (a) on the short wavelength side, with an initial output of 0.5 Vmax ; (b) on the long wavelength side, with an initial output of 0.25 Vmax.
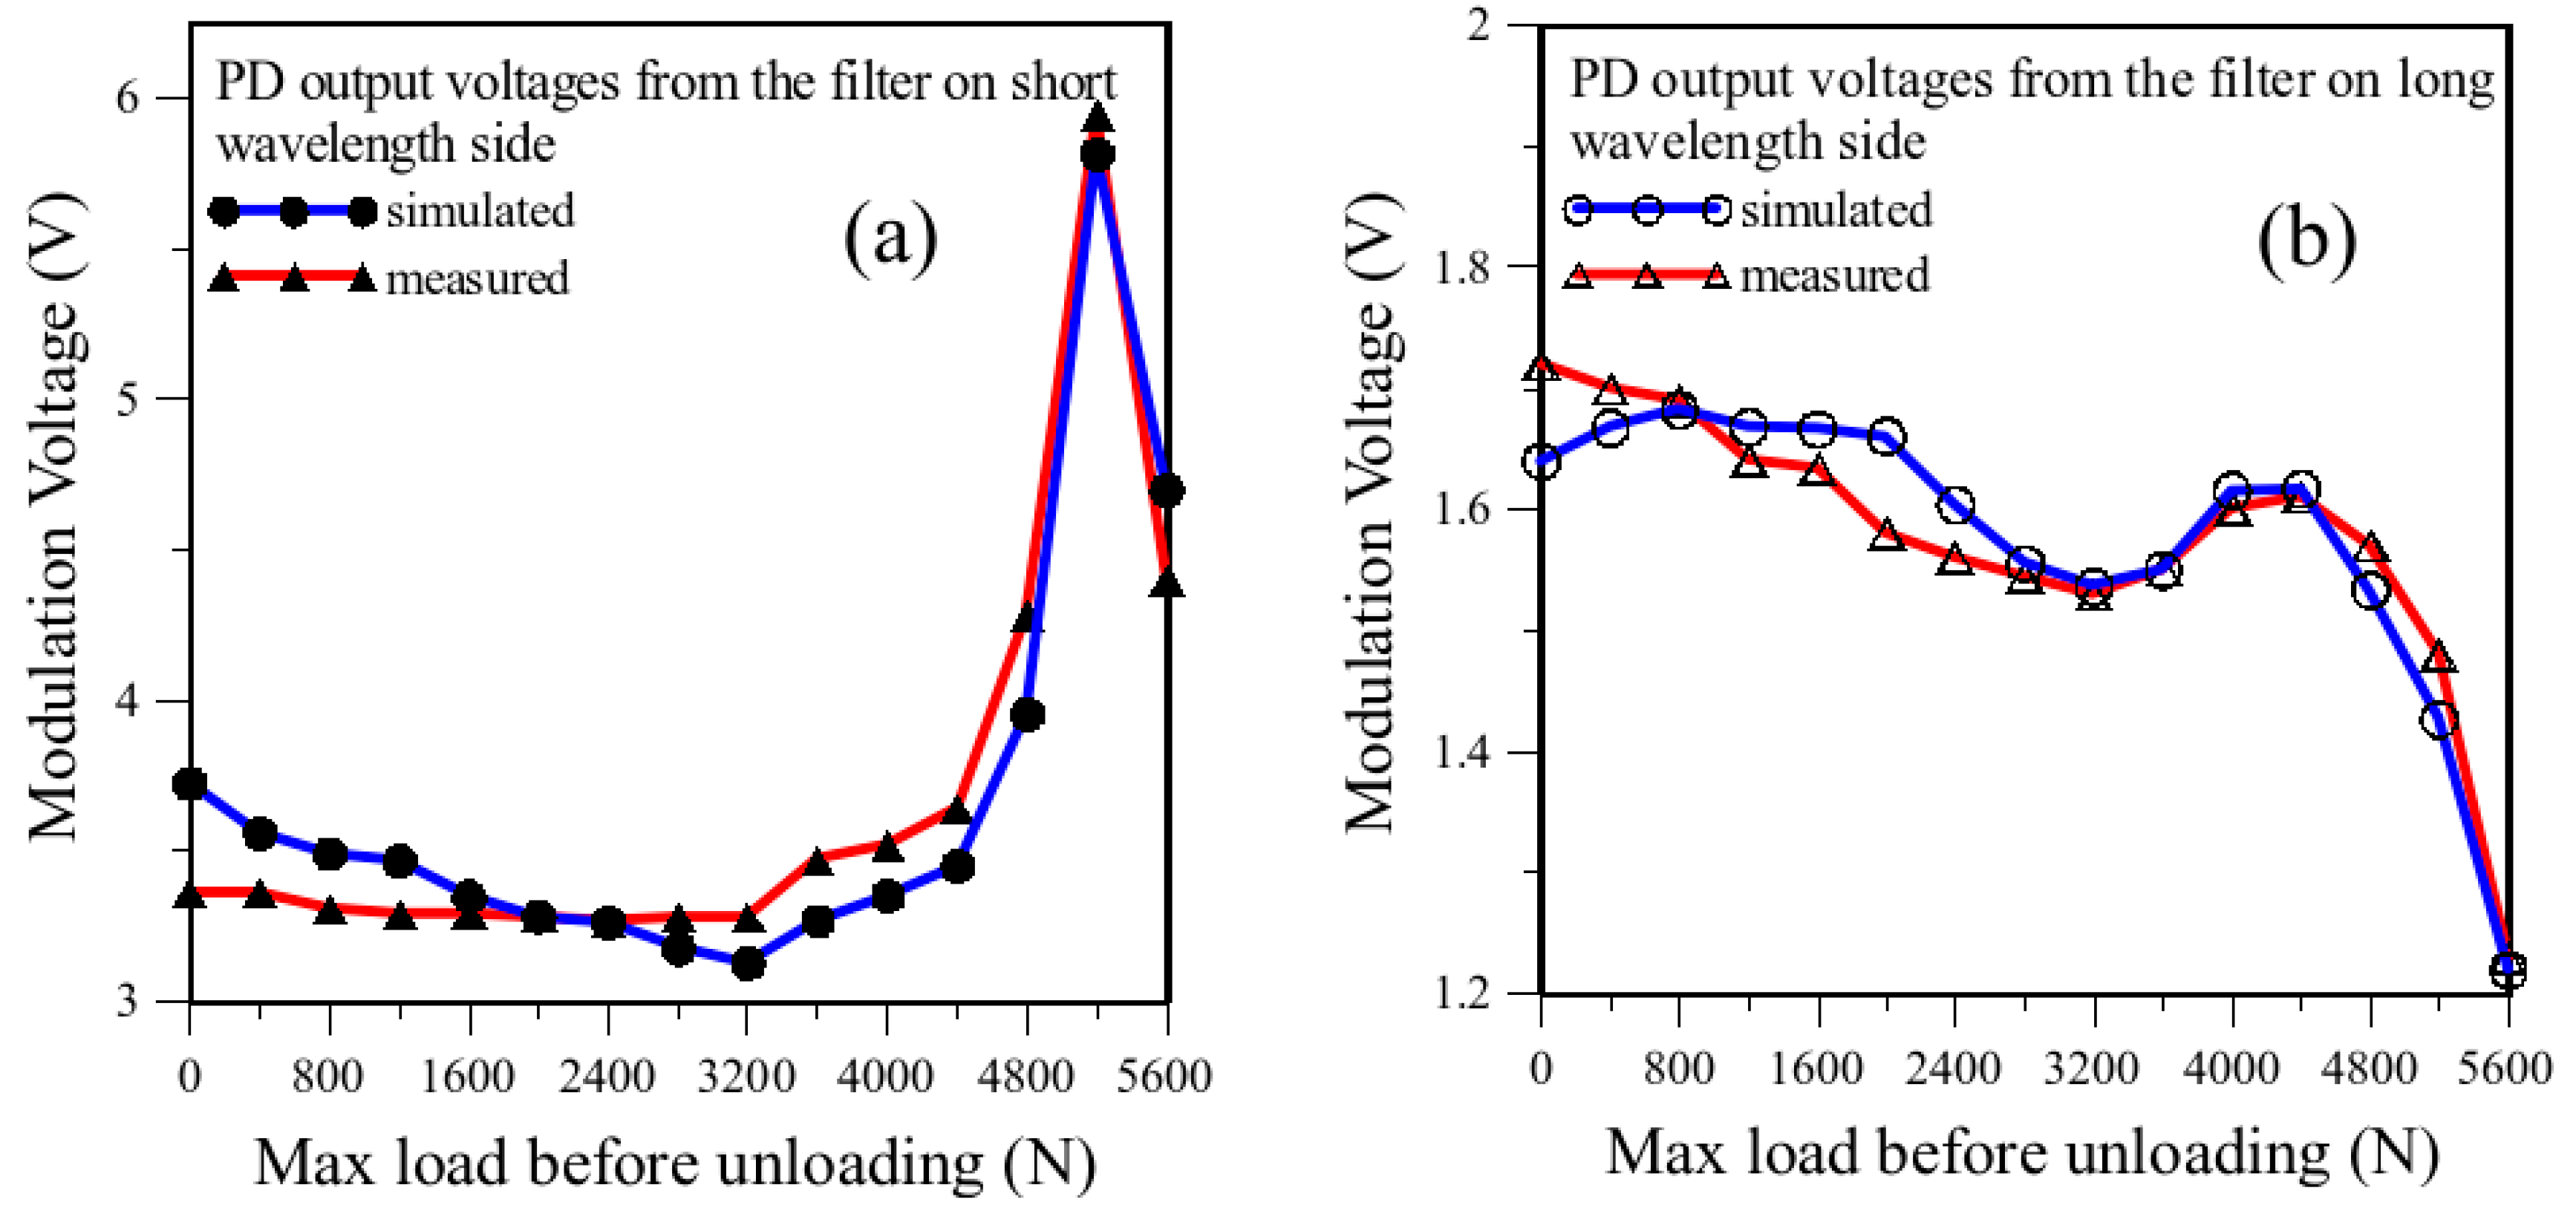
Figure 12.
Relative positions between the filters and FBG spectra when output equals (a) 0.1 and (b) 0.9 .
Figure 12.
Relative positions between the filters and FBG spectra when output equals (a) 0.1 and (b) 0.9 .
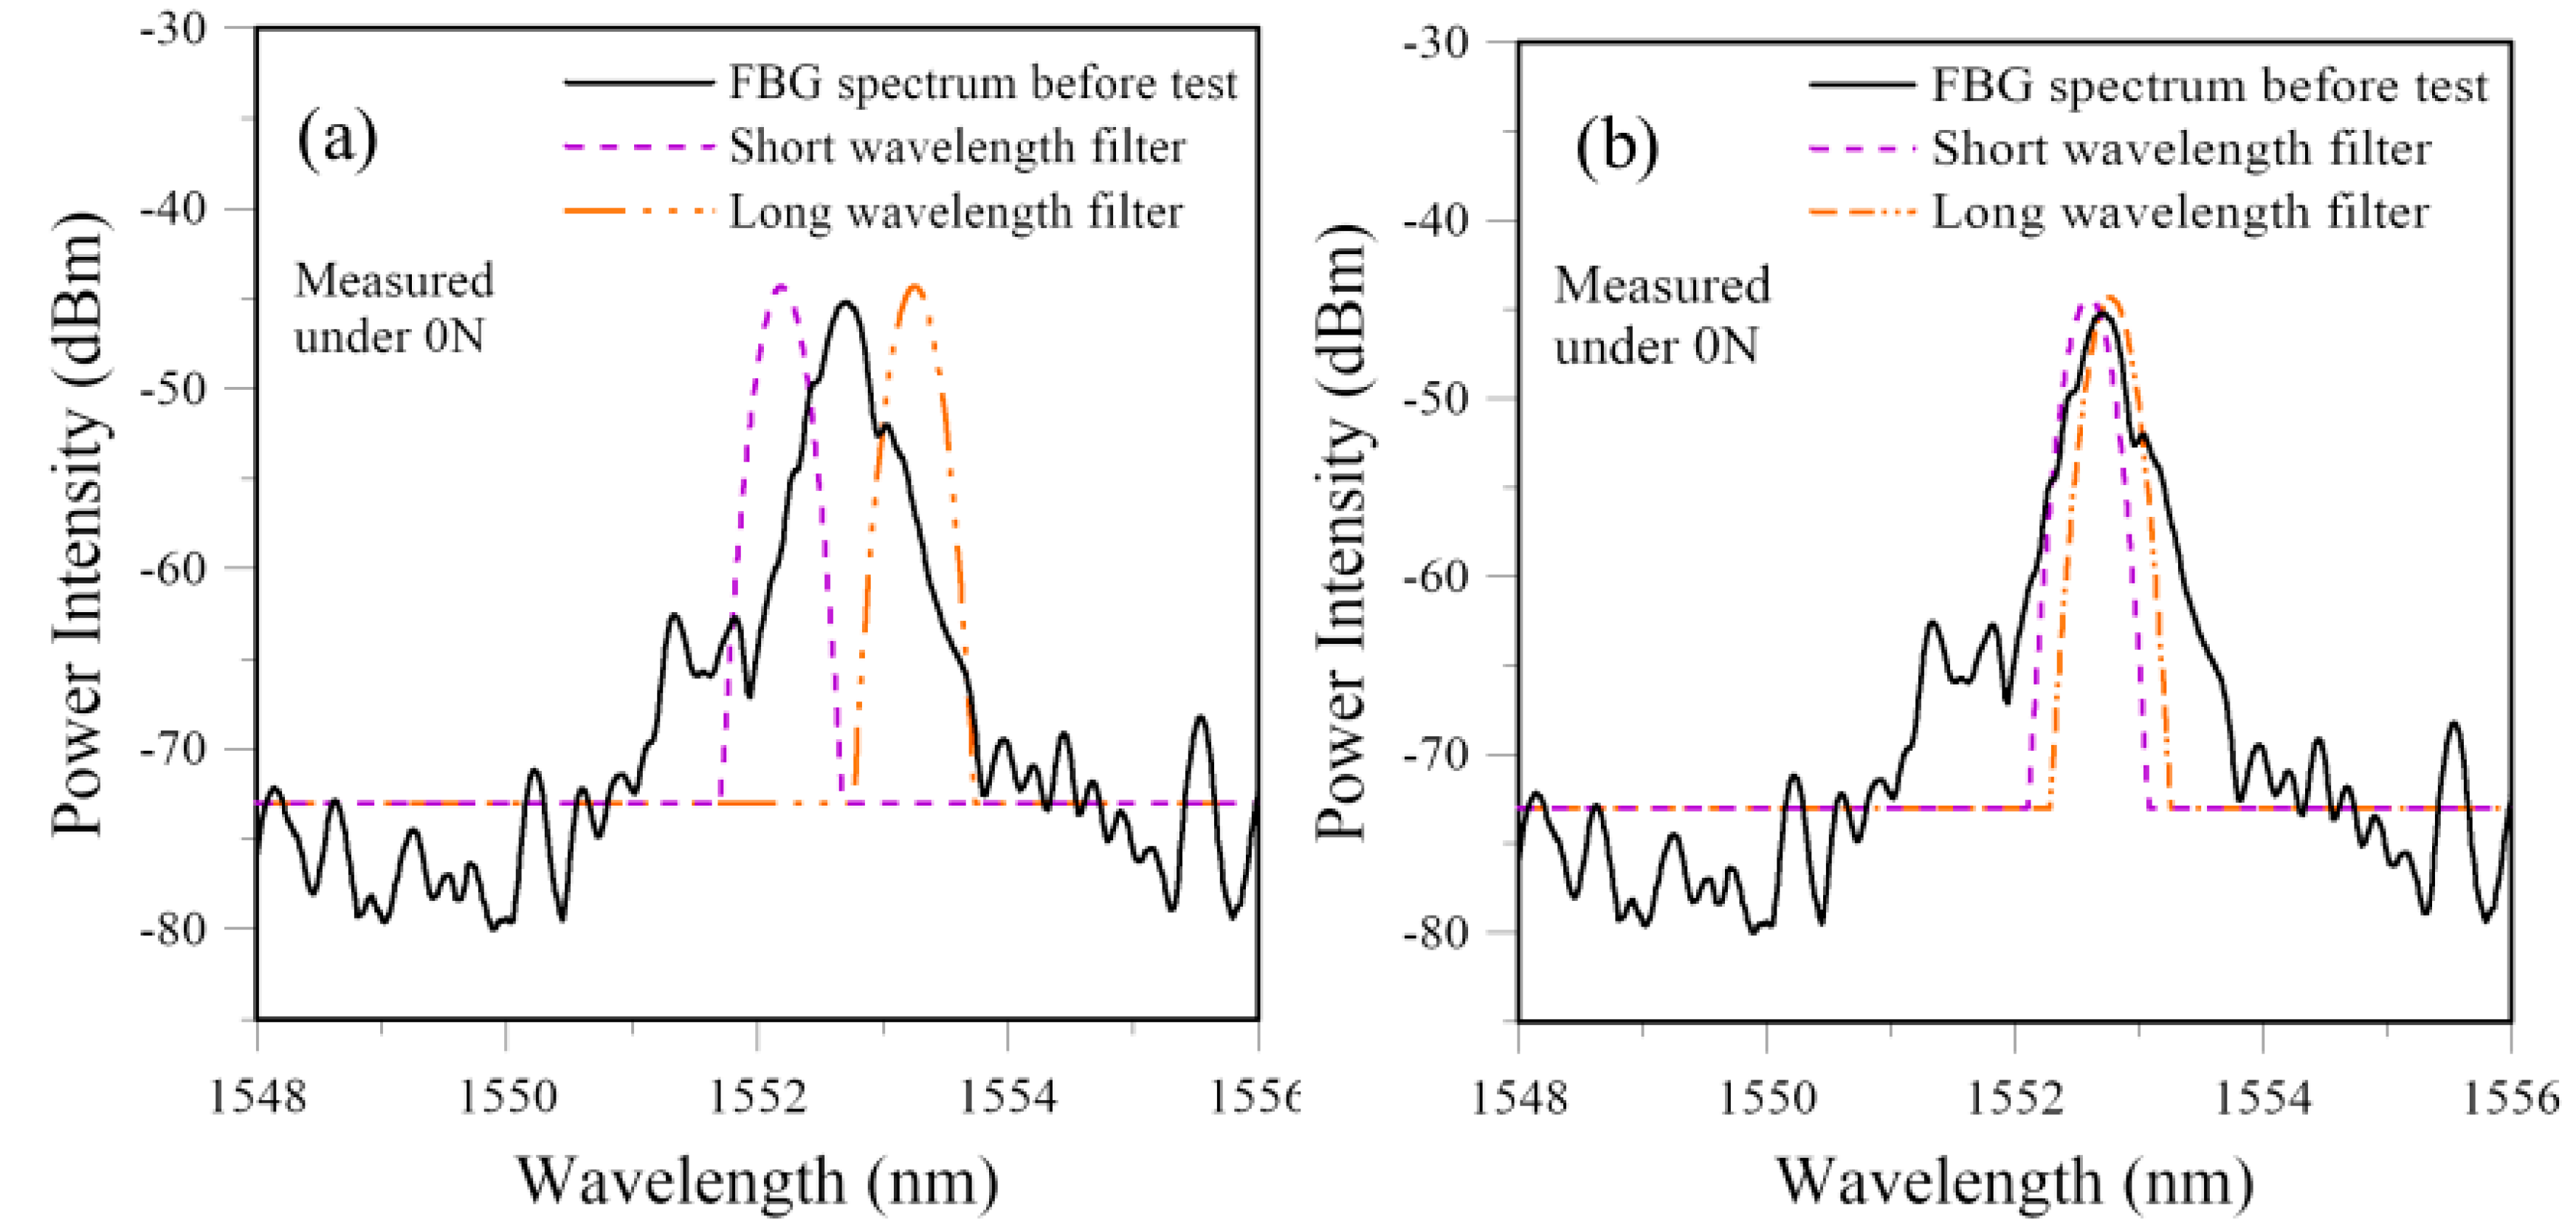
Figure 13.
Simulated PD output compared with the V values for initial overlap corresponding to (a) 0.1 ; (b) 0.3 ; (c) 0.5 ; and (d) 0.9 .
Figure 13.
Simulated PD output compared with the V values for initial overlap corresponding to (a) 0.1 ; (b) 0.3 ; (c) 0.5 ; and (d) 0.9 .
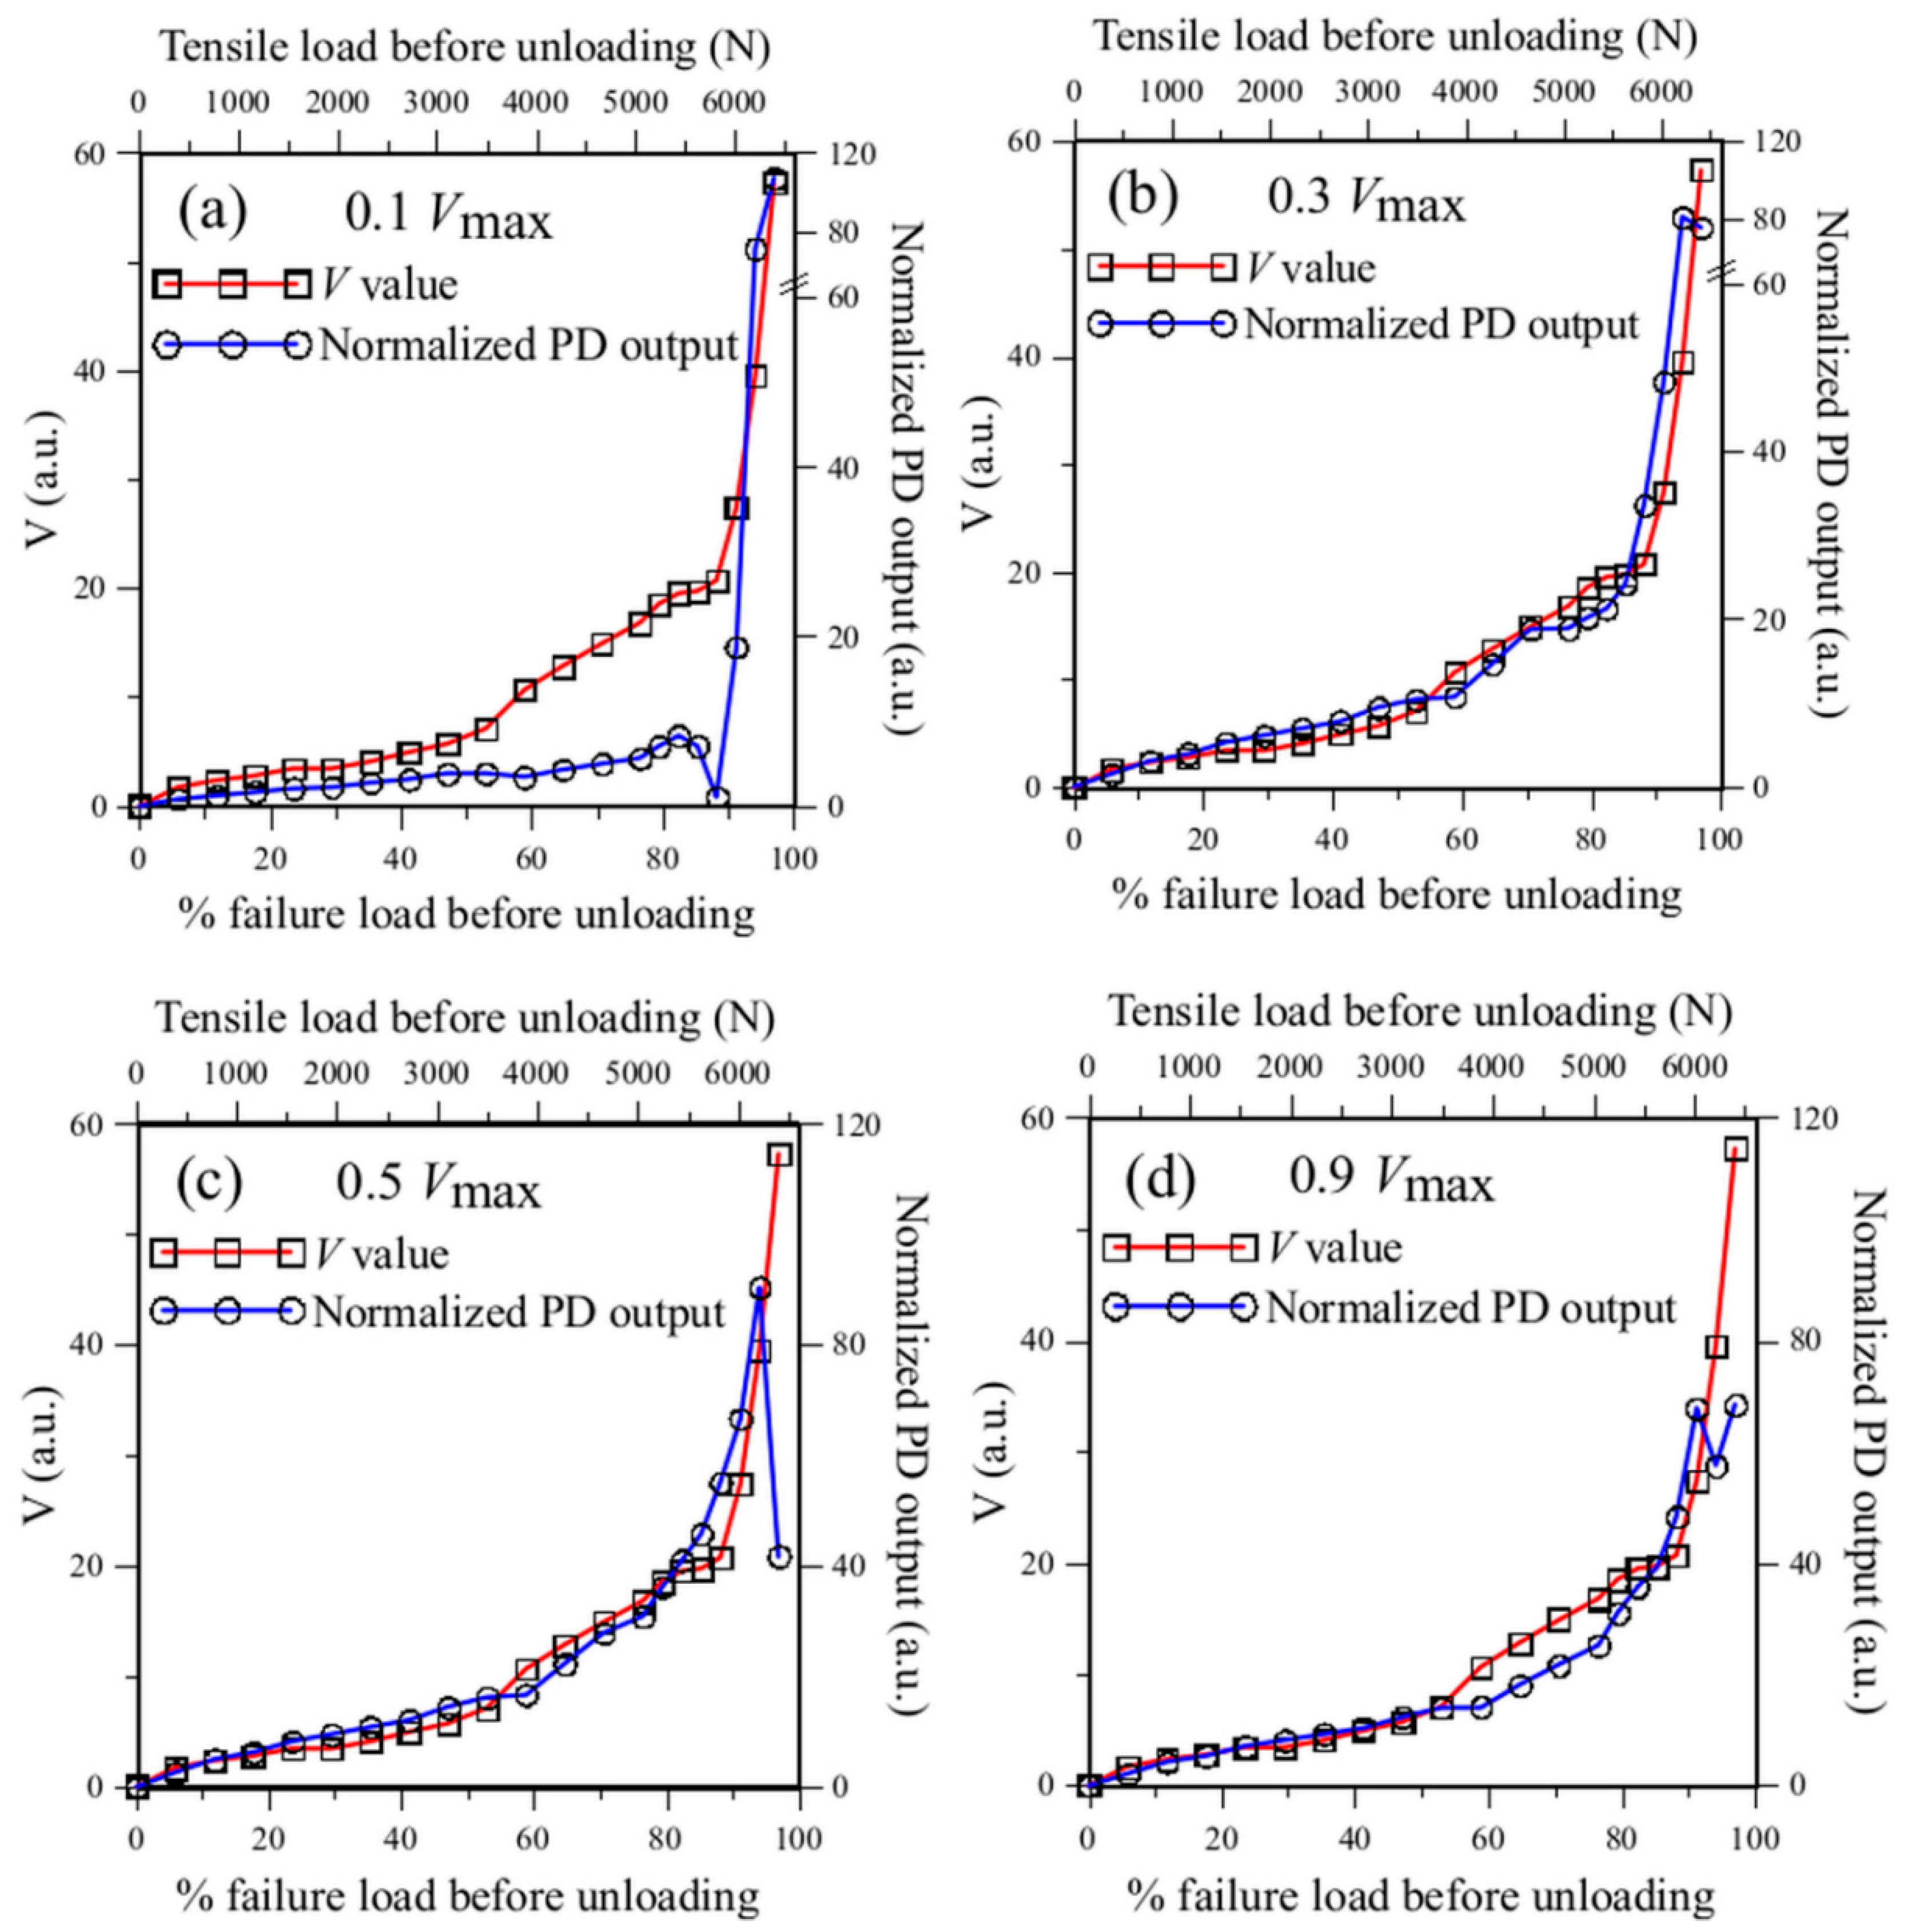
Figure 14.
Simulated PD output for filters with different FWHMs and initial overlap PD voltages compared with the V values : (a) FWHM = 3 nm, 0.4 ; (b) FWHM = 3 nm, 0.9 ; (c) FWHM = 5 nm, 0.4 ; and (d) FWHM = 5 nm, 0.9 .
Figure 14.
Simulated PD output for filters with different FWHMs and initial overlap PD voltages compared with the V values : (a) FWHM = 3 nm, 0.4 ; (b) FWHM = 3 nm, 0.9 ; (c) FWHM = 5 nm, 0.4 ; and (d) FWHM = 5 nm, 0.9 .
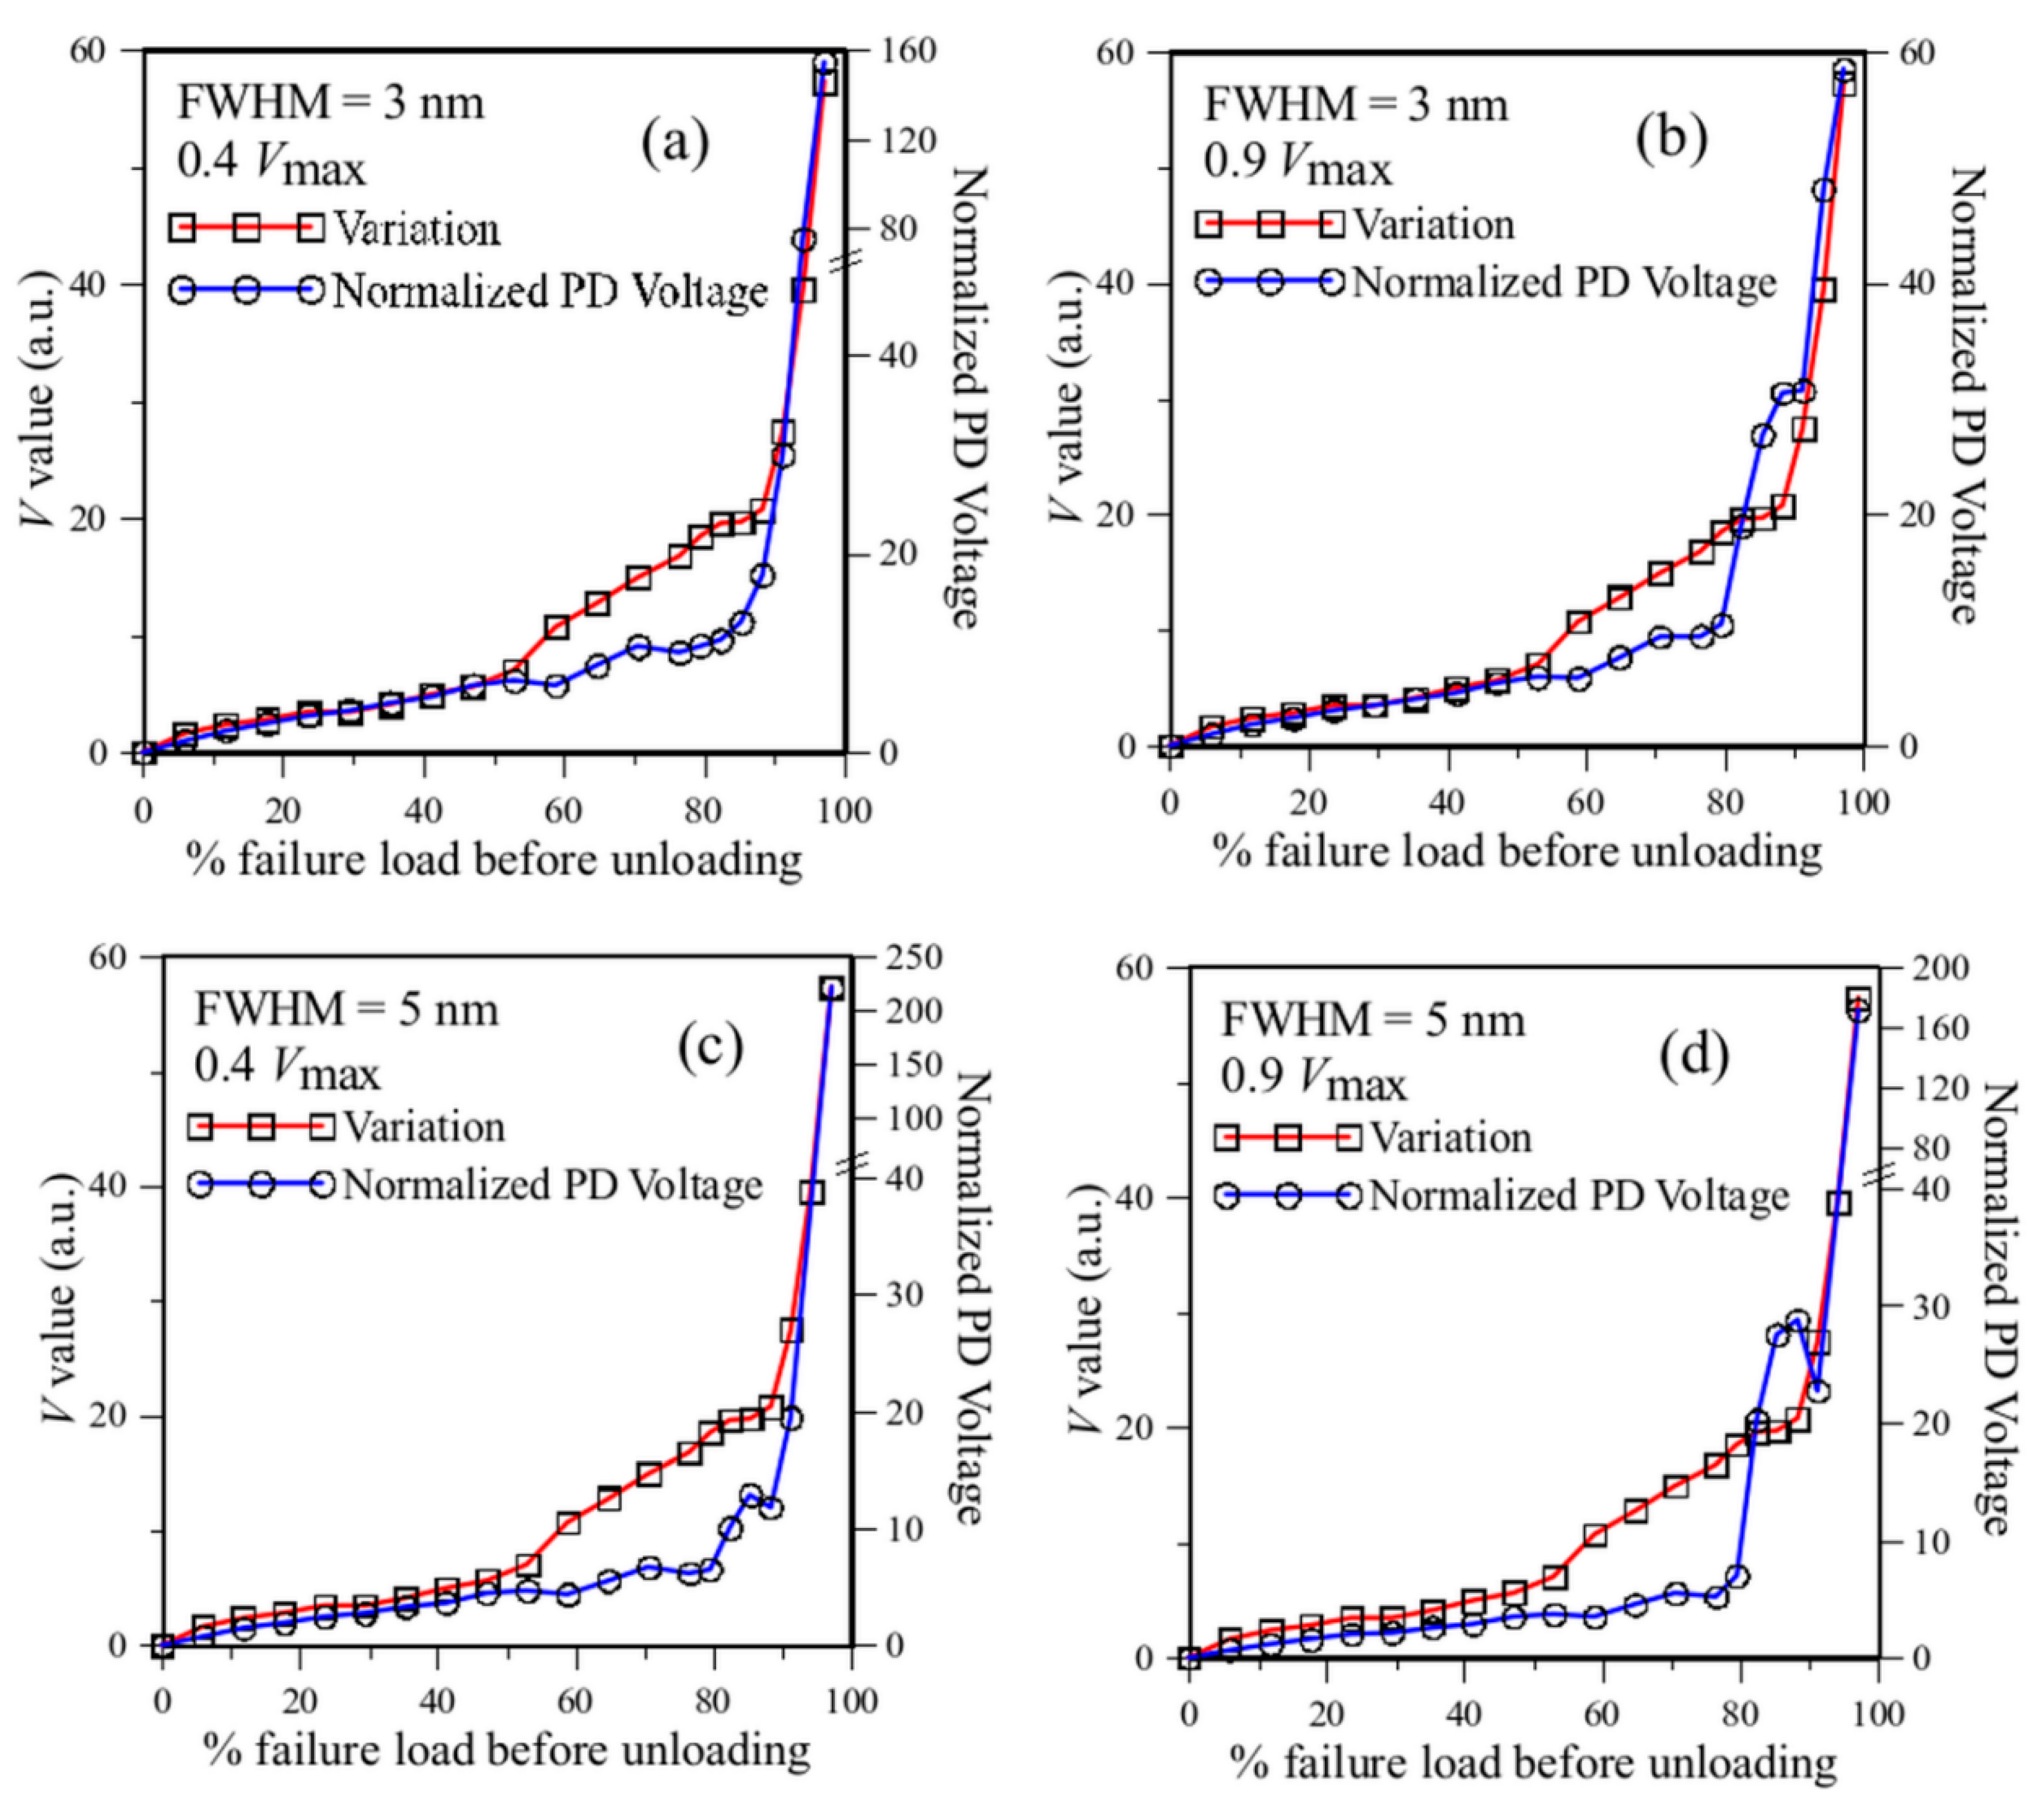
Figure 15.
Evolution of the load-free spectra during tensile tests in (a) FBG 3; (c) FBG 4 and (e) FBG 5; and comparison of the corresponding V values and simulated PD output for filters FWHM = 5 nm and initial overlap of 0.4 for (b) FBG 3; (d) FBG 4, and (f) FBG 5. (the bracketed numbers after the loading values in the figure legends indicated the loading as a percentage of the failure load.).
Disclaimer/Publisher’s Note: The statements, opinions and data contained in all publications are solely those of the individual author(s) and contributor(s) and not of MDPI and/or the editor(s). MDPI and/or the editor(s) disclaim responsibility for any injury to people or property resulting from any ideas, methods, instructions or products referred to in the content. |
© 2024 by the authors. Licensee MDPI, Basel, Switzerland. This article is an open access article distributed under the terms and conditions of the Creative Commons Attribution (CC BY) license (http://creativecommons.org/licenses/by/4.0/).
Copyright: This open access article is published under a Creative Commons CC BY 4.0 license, which permit the free download, distribution, and reuse, provided that the author and preprint are cited in any reuse.


