
Submitted:
11 March 2025
Posted:
11 March 2025
You are already at the latest version
Abstract
The paper studies the distribution of relative displacement of a composite plate with integrated fiber Bragg gratings. The analysis of the methods for manufacturing composite plates with embedded optical fibers containing FBG sensors, as well as the spectral characteristics of the gratings under various bending conditions, is performed. The effect of sensor arrangement on the accuracy of determining stresses and relative elongations of the material is experimentally studied. The features of spectral shifts that occur under non-uniform stresses are revealed, which can reduce the accuracy of measurements when using interrogators. The patterns of change in the central wavelength of Bragg gratings depending on the type and magnitude of plate bending are established. The research results confirm that the use of a network of embedded FBG sensors allows one to accurately determine the areas of maximum deformations, as well as the nature and magnitude of bending of composite structures. The data obtained can be used to develop more accurate systems for monitoring the stress-strain state of composite materials.
Keywords:
fiber optic Bragg sensor
; composite material
; composite plate
; spectra
; Deformation
1. Introduction
In modern construction materials, composites occupy a special place due to their high strength, low weight and resistance to external influences. However, to ensure the reliability and durability of such materials, methods for monitoring their condition during operation are required. One promising approach is the use of fiber Bragg gratings (FBG) as embedded sensors that allow measuring mechanical deformations and stresses in the material in real time.
Compared with conventional structural materials, such as aluminum or steel, carbon fiber composites have some unique properties [1–56]. In terms of specific strength and rigidity, carbon fiber composites are superior to almost all of the most widely used structural materials and metallic materials. It is interesting to note that such a relatively weak structural polymer material as polyamide, when carbon fibers are introduced into it, approaches metallic structural materials in terms of specific strength and rigidity [2]. Along with high mechanical properties and chemical resistance, carbon fiber composites have good antifriction characteristics, a relatively low friction coefficient, and increased wear resistance. The friction coefficient of carbon fiber composites ranges from 0.1 to 0.17 depending on the test conditions, and in terms of wear resistance they are 5-10 times superior to antifriction grades of bronze used to make plain bearings [3]. The advantages of using carbon fiber reinforced plastics are that they allow to reduce the weight of the structure by 15-45%, high resistance to corrosion and various deformations, the possibility of creating highly complex products. The following main methods of manufacturing products from carbon fiber exist [3].
Optical fiber sensors embedded in materials are very useful for strain/temperature monitoring in extreme environmental conditions. Smart composite materials with embedded optical fiber sensors can significantly improve the safety of modern machines, structures and devices [4]. For strain/temperature measurements in composite materials, various types of FBGs are used, including the fiber Bragg grating [5,6]. Fiber - optic sensors suitable for monitoring CM products can be classified according to the type of physical effect used in them as follows [7]: amplitude, interference, diffraction, distributed.
Bragg gratings (FBGs) are usually used. Here, the effect is used, according to which the wavelength of the reflected light peak is proportional to the change in the Bragg grating period, which, in turn, is determined by the deformation and temperature [8]. The deformation at the location of the FBG is determined by the shift in the wavelength of the signal peak [9]. The advantages of FBGs are as follows: high value of the useful signal-to-noise ratio; high sensitivity to deformations (less than 0.5 × 10 − 6); the possibility of interrogation via one fiber; multiplexing into many FBGs; three-axis deformation sensitivity.
The most common manufacturing processes used by laboratory and small-scale industrial manufacturers are the hand lay-up and pre-lay-up methods [3]. The hand lay-up method is the process of arranging fiber-reinforced layers in a laminate and shaping it to produce the desired part. This is accomplished by laying up the reinforcing fibers or fabrics by applying a matrix between them. Once laid up, the polymer matrix is cured (or polymerized), and the multilayer composite specimen can be shaped to the manufacturer's specifications. Prepregs are individual laminates of "pre-impregnated" composite fibers with a matrix material such as epoxy resin. In the prepreg lay-up method, multiple layers of prepreg composites are laid up and cured either unassisted or by applying heat and/or pressure. The molding process can be either vacuum bag molding or autoclave molding [4]. FBGs are the most commonly used fiber optic sensors for composite materials [10,11,12]. The Bragg grating consists of a region in which the refractive index is periodically changed in the core region of the optical fiber [13]. The strain components acting in different directions inside the composite structure can be measured by multiplexed FBGs [14]. In addition, the anisotropic strain distribution in the composite material can be measured by FBG recorded in the microstructured fiber with high birefringence [15]. Fiber Bragg grating (FBG) sensors are ideal for health monitoring of composite materials and concrete structures [16]. Among the various multiplexing methods of FBG sensors, the wavelength division multiplexing method WDM is one of the most widely used [17].
2. Materials and Methods
In this work, control plates were manufactured consisting of a selected number of layers of carbon fabric impregnated with epoxy resin. Fiber -optic Bragg sensors were additionally placed between the layers of carbon fabric. Technical parameters of the carbon fabric used to manufacture the control plates:
- weight: 200 g/m2,
- thickness: 0.15–0.30 mm.
The epoxy resin was mixed with the hardener in a ratio of 2:1 and, using a brush, evenly distributed over the addition of each layer of carbon fabric. The layers impregnated with the appropriate amount of carbon fiber were placed between two glasses, which made it relatively easy to separate the finished plate from the glass.
The glass panels, between which the control board was placed, were pressed together, which ensured the displacement of air bubbles from the structure. In addition, the plates were given a smooth upper surface. The study of the possibility of determining the relative elongation/stress distribution in a composite plate with built-in Bragg grating sensors was continued on another control plate that I made. In this case, 3 optical fibers with three Bragg gratings of different wavelengths in each fiber were used. The actual appearance of the composite board with built-in sensors is shown in Figure 1.
The test plate was made of 8 layers of carbon fabric impregnated with epoxy resin. In the plate made for this experiment, optical fibers were embedded between layers 1 and 2 of the carbon fabric, creating a network of 9 sensors distributed in different places on the plate at the same "depth" (between layers 1 and 2 of the fabric).
3. Results
3.1. Uniform Bending of the Plate with a Network of Built-in Sensors
Figure 2 shows a diagram of the internal structure of the board, showing where the fibers with the sensors stored in them are mounted.
The plate shown in the figures above was loaded in two ways. The first is shown in Figure 3, where the element was clamped on one side and the bending element was applied against the opposite side. The amount of bending of the plate was set by an electronically controlled micrometer rod.
It should be noted that the load was applied pointwise, along the axis of symmetry of te plate (along the axis on which the central optical fiber Fiber 2 was also fixed). Observation of the central shift of the Bragg wavelengths will allow us to determine the relative elongations at the points of the control plate in which the Bragg sensors are embedded. Figure 4 shows the transmission spectra measured for successive optical fibers embedded in the plate subjected to upward bending according to the scheme shown in Figure 3.
In the described case, it is evident that the spectra of each of the presented Bragg gratings are shifted toward longer wavelengths. Based on the measured spectra, the characteristics of the change in the central wavelength from the plate bending value were determined by the method of identifying the minima . These dependencies are shown in Figure 5 , which shows the characteristics for each of the Bragg gratings embedded in the composite.
FBG 3 gratings were embedded in the edge of the plate closest to the mount. The absence or slight shift of the spectrum observed at strains from 0 to 4 mm indicates the absence of contact of the bending head at the initial values of the micrometer screw elongation. Figure 5b shows the Bragg wavelength shift characteristics determined for the gratings recorded in Fiber 2. The characteristics determined for Fiber 1 and Fiber 3 have almost the same range of wavelength change for a given bending of the test plate. Fiber 2 was subjected to the strongest stretch, as evidenced by the largest value of the central wavelength shift.

Table 1.
Results of changes in the Bragg wavelength of gratings embedded in the internal structure of the composite plate.
Table 1.
Results of changes in the Bragg wavelength of gratings embedded in the internal structure of the composite plate.
| Bending | Difference in wavelengths when bending a plate | ||||||||
|---|---|---|---|---|---|---|---|---|---|
| Fiber 1 | Fiber 2 | Fiber 3 | |||||||
| [mm] | FBG1 | FBG2 | FBG3 | FBG1 | FBG2 | FBG3 | FBG1 | FBG2 | FBG3 |
| [nm] | [nm] | [nm] | [nm] | [nm] | [nm] | [nm] | [nm] | [nm] | |
| 0 | 0 | 0 | 0 | 0 | 0.005 | 0 | 0 | 0 | 0 |
| 2 | 0.005 | 0.005 | 0.006 | 0.02 | 0.01 | 0.01 | 0 | 0.005 | 0 |
| 4 | 0.05 | 0.035 | 0.015 | 0.06 | 0.035 | 0.04 | 0.04 | 0.025 | 0.007 |
| 6 | 0.09 | 0.055 | 0.031 | 0.11 | 0.05 | 0.045 | 0.08 | 0.05 | 0.024 |
| 8 | 0.125 | 0.08 | 0.043 | 0.16 | 0.1 | 0.06 | 0.12 | 0.075 | 0.035 |
| 10 | 0.16 | 0.105 | 0.055 | 0.2 | 0.13 | 0.08 | 0.158 | 0.1 | 0.047 |
| 12 | 0.21 | 0.13 | 0.07 | 0.255 | 0.14 | 0.09 | 0.205 | 0.13 | 0.058 |
| 14 | 0.235 | 0.16 | 0.078 | 0.3 | 0.18 | 0.11 | 0.25 | 0.16 | 0.074 |
| 16 | 0.28 | 0.19 | 0.09 | 0.345 | 0.205 | 0.13 | 0.285 | 0.19 | 0.087 |
| 18 | 0.32 | 0.22 | 0.1 | 0.4 | 0.24 | 0.15 | 0.33 | 0.215 | 0.104 |
| 20 | 0.35 | 0.245 | 0.119 | 0.45 | 0.26 | 0.16 | 0.365 | 0.24 | 0.118 |
| 22 | 0.4 | 0.27 | 0.129 | 0.495 | 0.3 | 0.18 | 0.405 | 0.275 | 0.126 |
| 23 | 0.41 | 0.28 | 0.135 | 0.52 | 0.31 | 0.19 | 0.43 | 0.29 | 0.134 |
Studying the distribution of relative displacements using FBG sensors arranged in a sensor network allows us to find the parts of the test plate that are subject to the heaviest loads. The technique of embedding the sensors in the internal structure ensures that the tensile strain of the material is directly transferred to the elongation of the fiber sensor. The effect of the strongest stretching of the material along the axis of symmetry of the plate, observed in Figure 5, is due to the fact that the force bending the plate is applied precisely along the axis of symmetry. In addition, this may be due to the fact that the plate was fastened in accordance with Figure 5b, where two corners of the composite plate are fastened. This effect can be seen in the graphs presented in Figure 6, where the curves of the change in wavelength shift of gratings with the same number (FBG 1/ FBG 2/ FBG 3), placed on three fibers, are compared in one window.
An analysis of the graphs in Figure 6 shows that for each of the grating rows ( FBG 1/ FBG 2/ FBG 3) the sensors located on Fiber 1 and Fiber 3 have the same wavelength shift. At the same time, in each of the grating rows it is clear that the Bragg wavelength shift of the sensors stored in Fiber 2 is the largest.
3.2. Investigation of Stress Distribution in a Plate in a Three-Point Support System
The fourth case of displacement distribution testing is loading the plate when it is supported on three corners. This loading characteristic allows obtaining non-uniform bending, which manifests itself in the form of local compressive and local tensile stresses. Six layers of carbon fabric impregnated with epoxy resin were used to manufacture the control plate, into which 13 FBG sensors were embedded. The Bragg sensor arrangement for this case is shown in Figure 7.
Nine of them were arranged identically to the previous case, i.e. three fibers with 3 fiber sensors were embedded between the first and second layers. In addition, two fibers (each with 2 Bragg gratings) were embedded between the fifth and sixth layers. Figure 8. schematically shows how the control board with embedded sensors is supported and loaded.
By arranging the VBG sensors at 90 degrees to each other, it is possible to monitor changes in relative elongation that also occur along the entire length of the test plate. Figure 9 shows the stress distribution in a control plate, clamped and loaded as described in this chapter.
The stress analysis shown in Figure 9 shows that the stresses and, therefore, the plate deformation reach their greatest values at the supported corner of the plate. Placing the sensor in such a place can change the shape of the spectrum of the FBG sensor located in the zone of non-uniform stresses. If the relative elongation of the material in which it is embedded has different values along the length of the grating, then the period of the periodic structure becomes non-uniform, which can be compared to the appearance of a chirp.
3.3. Analysis of Stresses in Fibers Along the Test Plate
First, the measurement results and processing characteristics determined from the spectra of the fibers embedded along the test plate will be presented. Figure 10 shows the transmission spectra measured for Fibers1, Fibers2 and Fibers3 embedded in a plate constructed according to the structure for Example III. An analysis of the spectra of successive Bragg gratings shows that, especially in the case of Fiber 1 (embedded on the side of the supported corner), deformations of the spectrum are observed. This is due to the fact that the stresses in the plate structure near the additional reinforced corner show a large change over short distance. Therefore, a non-uniform elongation of the Bragg grating along its entire length is possible. This results in the grating period not having the same length along the entire Bragg grating, so that the resulting spectrum is essentially an average spectrum measured over a number of short gratings with different periods.
The transmission spectra shown in Figure 10 indicate a much more complex stress distribution than in the case of a single-sided supported plate. The spectral shape change effect can also be caused by imprecise bonding of the Bragg grid to the composite structure of the plate, but this effect is very unlikely in the case of epoxy resin embedding of carbon fiber.
Despite the spectral shape change observed for some FBGs, it is possible to determine the spectral shift caused by the tension or compression of the control plate at the location of the embedded sensor. Figure 10 shows the change in the shift of the central wavelength of the FBG spectra recorded on Fiber 1, Fiber 2, and Fiber 3. Fiber 1 was subjected to non-uniform deformation along the length of the FBG grating. Because of this, the determination of the characteristic wavelength shifts of the grating based on the basic method of finding the spectral minimum is subject to a large error. Figure 11 shows the transmission spectra of FBG1 recorded on Fiber1 embedded in the composite plate structure subjected to bending in accordance with the assumptions of this chapter.
Analysis of the spectra shown in the figure above clearly shows that the spectrum is deformed as a result of the introduction of a specific chirp into the Bragg grating structure.
Due to the change in the shape of the spectrum, the determination of the spectrum shift based on finding the minimum of the characteristic has a large error. For this reason, the shifts in this case were determined using the " Centroid " algorithm, which consists of calculating the geometric center of the spectrum using the formula:
Thus, the shift value is determined based on a certain wavelength range, which, as presented in [18], has a beneficial effect on the accuracy of shift determination in the case of irregular spectra.
Figure 12.
Spectral shift characteristics of Bragg gratings made on optical fibers embedded in a plate.
Figure 12.
Spectral shift characteristics of Bragg gratings made on optical fibers embedded in a plate.
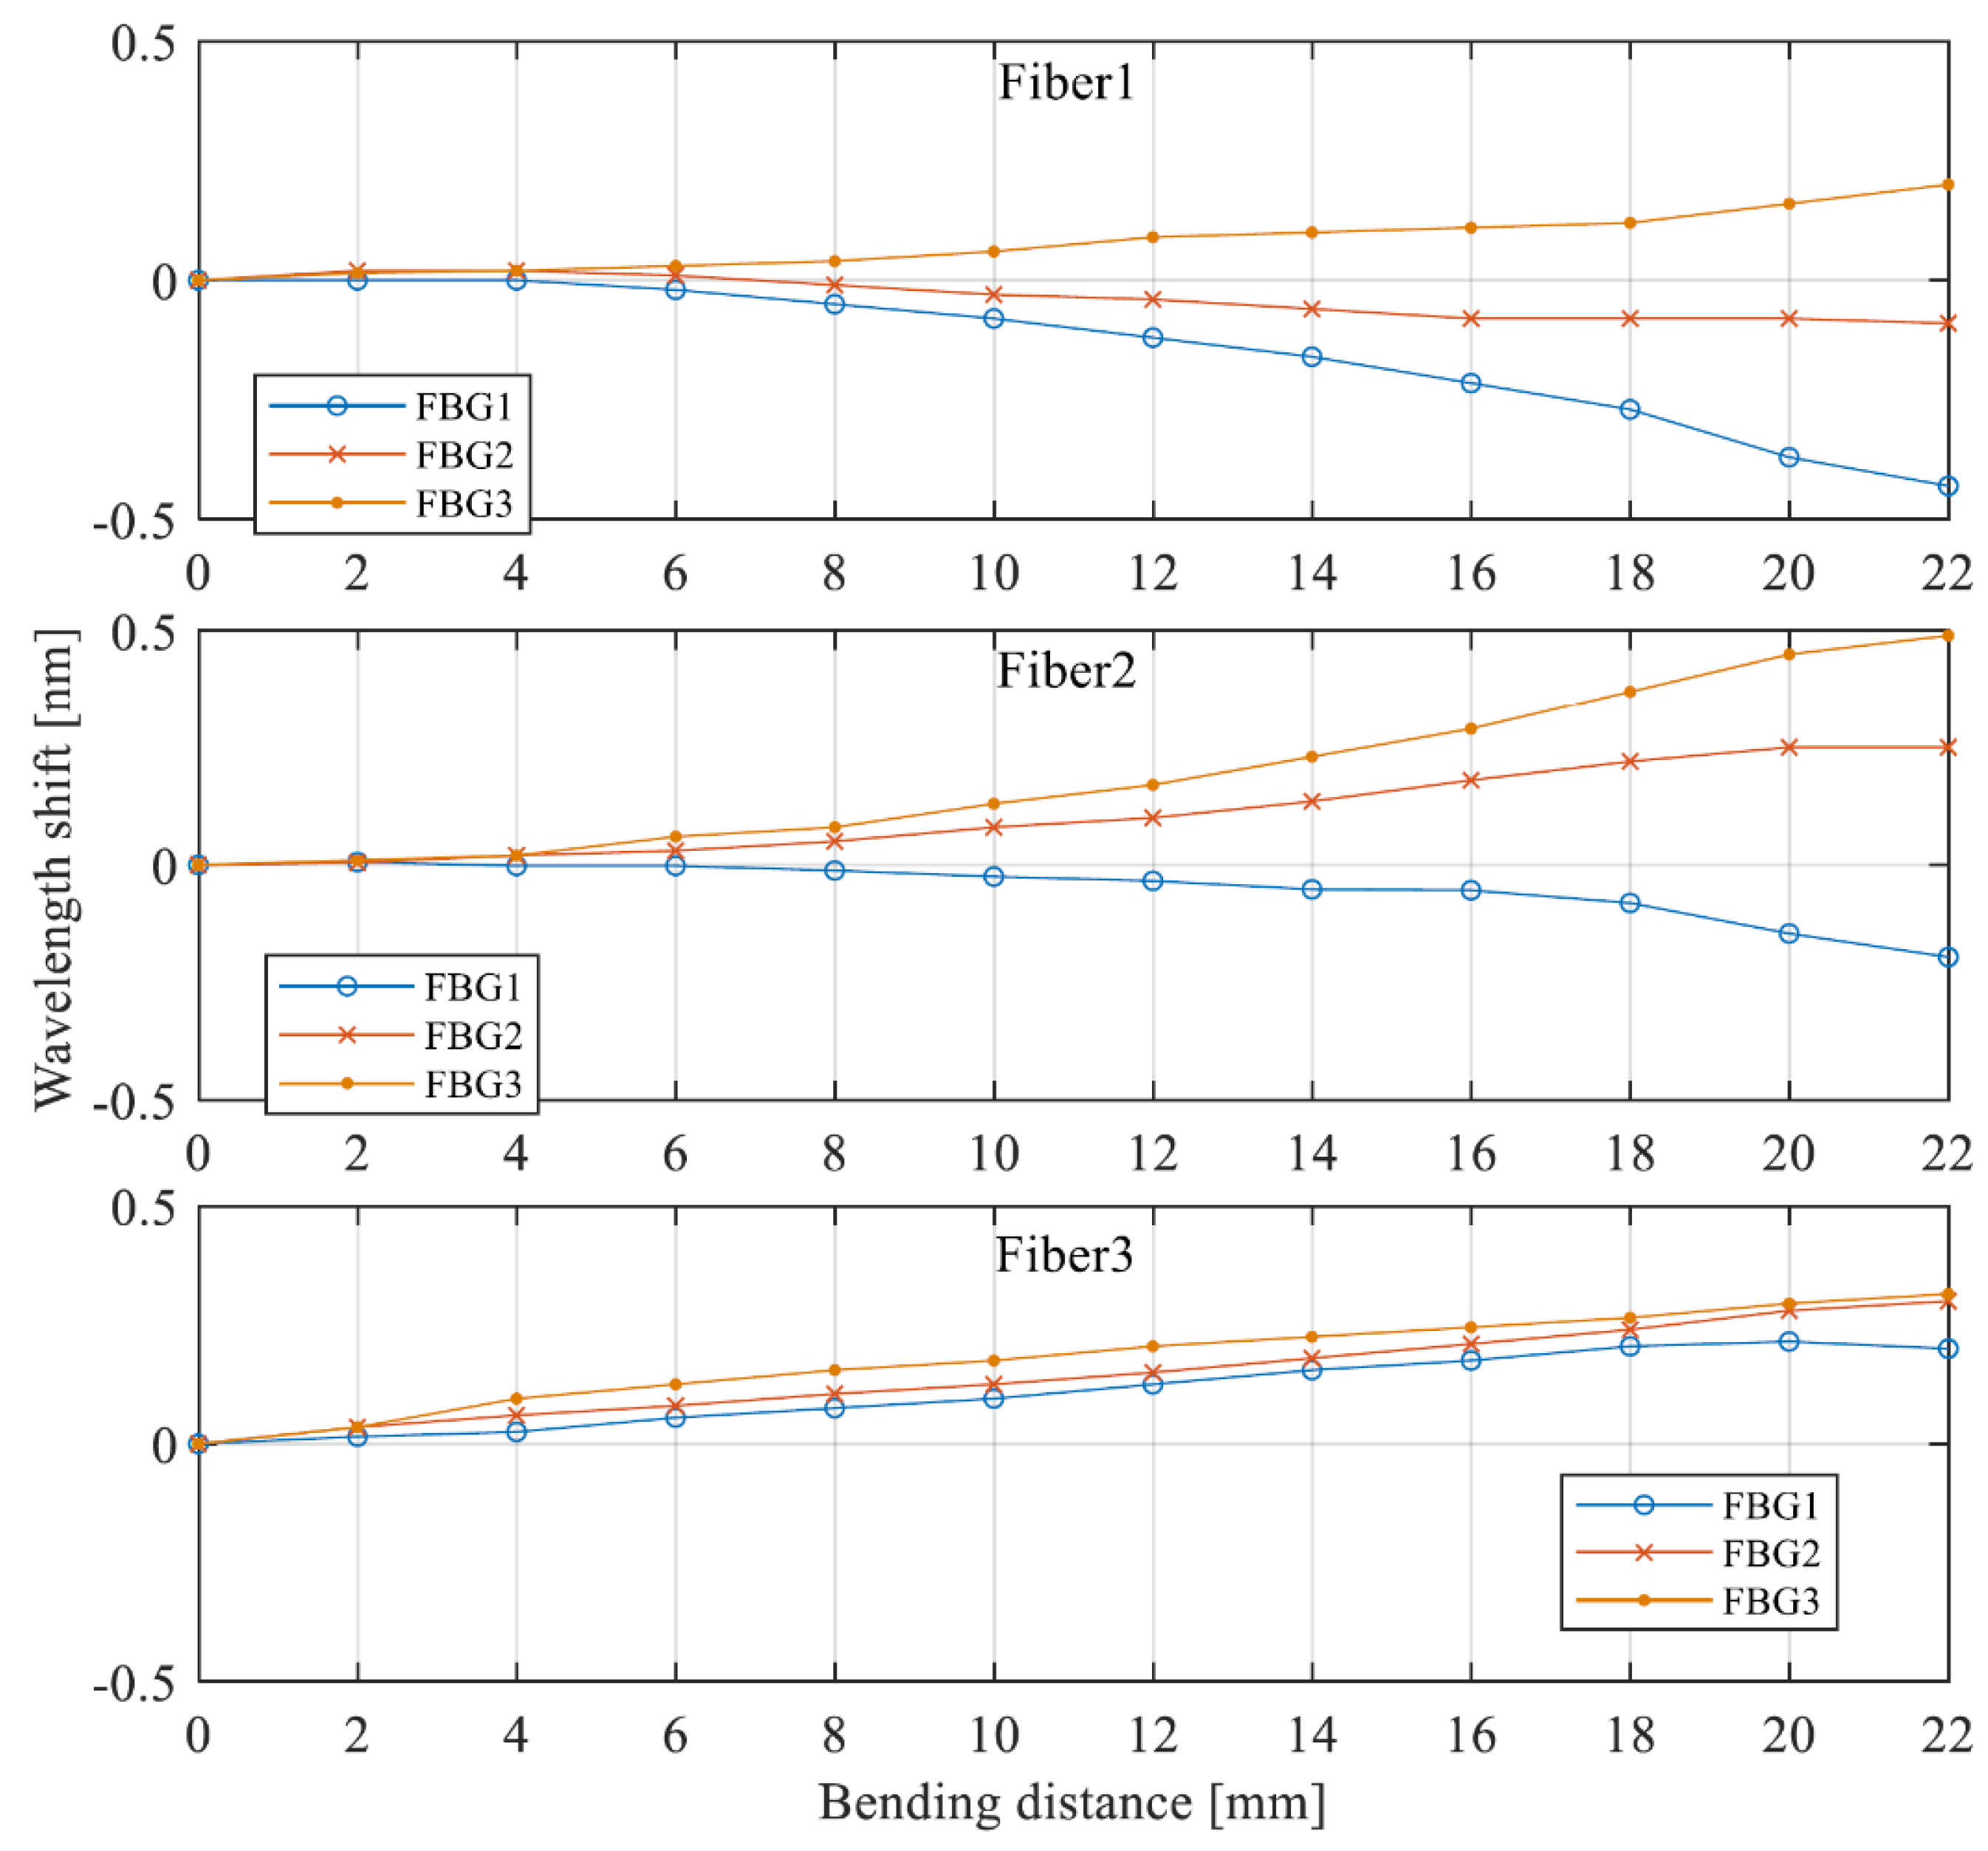
The waveforms representing the wavelength variation of individual Bragg modules associated with successive FBGs clearly show that the material is stretched and stressed non-uniformly. As predicted from the stress distribution shown in Figure 10, the center wavelengths of the gratings recorded on fiber 3 shift toward longer wavelengths, which is due to the stretching of the plate along the length of the fiber. The characteristics associated with fiber 2 and fiber 1, on the other hand, indicate that the fibers were subjected to both stretching and compression at different points along their lengths.
3.4. Analysis of Stresses in Fibers Passing Through a Test Plate
The spectral shifts of the FBG sensors recorded in Fiber 4 and Fiber 5, which were embedded in the internal structure across the composite plate – i.e. at right angles to Fibers 1–3 – can be analyzed separately. A schematic of the sensor network embedded in the composite structure is shown in Figure 13. The image of the stress distribution in the plate loaded according to the assumptions of this chapter shows that, as in the case of embedded fibers along the plate, strong stress non-uniformities are to be expected. An additional image of the stress distribution with the optical fibers and Bragg gratings schematically indicated is shown in Figure 14. With this arrangement of sensors, the relative strain in the direction along the shorter side of the test plate can be investigated.
Figure 13 shows the transmission spectra measured for Fiber 4 and Fiber 5. For each fiber, two minima are visible, associated with the periodic structures stored in the fiber.
The first case analyzed for shifts in the spectra of the Bragg sensors attached along the short side of the test board is the case schematically described in Figure 8. a, the gratings were placed at the bottom of the board between layers 5 and 6. The transmission spectra measured for the fiber with two Bragg sensors attached are shown in Figure 14. The characteristics associated with Fiber 5 are shown in Figure 14 a. It can be seen that the spectrum of FBG 1 recorded on this fiber (embedded in the plate structure closest to the corner with the highest stresses) is distorted with increasing magnitude of the bending element displacement. This indicates a strongly varying stress distribution along the 10 mm long sensor. In contrast, Figure 14 b shows the spectra of Fiber 4, placed closer to the central axis of the test plate. It can be seen that the spectral shift caused by the bending of the control element in this case only causes a shift in the characteristics.
4. Discussion
The spectral distortion occurs similarly to the Bragg gratings placed on the fiber Fiber 1 embedded perpendicular to the discussed Fiber 4 and Fiber 5. For this reason, the determination of the spectral shift based on the simplest method of finding the wavelength for which the minimum of the spectrum is observed is burdened with a large uncertainty. The results of the tests presented in the section above on the deformation of a control plate supported at three angles show that placing a network of sensors embedded in a composite structure at an angle of 90 degrees makes it possible to detect the relative stretching of the composite structure in different directions. In addition, a limitation is revealed due to the fact that the spectrum of a Bragg sensor subjected to non-uniform stresses along its length is distorted. For this reason, the methods for determining the Bragg wavelength of sensors used in commercial interrogators can be subject to large errors. For example, the SmartFiber system uses a method of fitting a Gaussian curve with selected parameters to an approximately measured reflectance spectrum. Distortion of the spectrum, causing a significant deviation from the Gaussian curve shape, in this case leads to very large errors in the wavelength shift readings.
5. Conclusions
The conducted studies confirmed the efficiency of using fiber Bragg gratings for measuring the distribution of relative displacement and stresses in composite plates. Analysis of spectral characteristics showed that different bending methods lead to significant changes in Bragg wavelengths, which allows for accurate determination of the stress-strain state of the material.
The influence of non-uniform stresses on the spectral shape of the signal was revealed, which requires the use of special data processing algorithms, such as the "Centroid" method, which provides a more accurate determination of the wavelength shift. It was also shown that the integration of sensor networks at different angles allows for a detailed analysis of the stress distribution under complex loading conditions.
The results of the work can be used for further optimization of composite material condition monitoring systems, as well as for improving spectral data interpretation methods. Promising areas for further research include the development of new FBG signal processing algorithms, improving the technology of sensor integration into composite structures, and expanding the scope of these methods in the aviation, construction, and automotive industries. This section is not mandatory but can be added to the manuscript if the discussion is unusually long or complex.
Author Contributions
A.K. (Aliya Kalizhanova), A.K. (Ainur Kozbakova) and M.K.; software, T.K., G.K. and M.K.; validation, A.K. (Aliya Kalizhanova), A.K. (Ainur Kozbakova) and T.K.; investigation, G.K.; resources M.K., G.K. and T.K.; data curation, A.K. (Aliya Kalizhanova), A.K. (Ainur Kozbakova) and M.K.; supervision, A.K. (Aliya Kalizhanova) and A.K. (Ainur Kozbakova); project administration, A.K. (Aliya Kalizhanova). All authors have read and agreed to the published version of the manuscript.
Funding
The work was supported by a grant and funding from the Ministry of Science and Higher Education of the Republic of Kazakhstan within the framework of the Project № AP19679153, Institute Information and Computational Technologies CS MSHE RK.
Data Availability Statement
The original contributions presented in the study are included in the article, further inquiries can be directed to the corresponding author.
Conflicts of Interest
The authors declare no conflicts of interest.
References
- Belova N.A.; Composite materials based on carbon fibers; Young scientist, 2015; No. 24.1 (104.1).
- Liu, H.; Liang, D.; Han, X.; Rui, S. An FBG staged monitoring method for carbon fiber reinforced plastics composite fracture status based on modulus/strain wave coupling property. Journal of Vibroengineering 2014, 16, 2735–2746. [Google Scholar]
- Li, J.; Yao, X.; Liu, Y.; Cen, Z.; Kou, Z.; Dai, D. A study of the integrated composite material structures under different fabrication processing. Composites Part A: Applied Science and Manufacturing 2009, 40, 455–462. [Google Scholar] [CrossRef]
- Ramakrishnan, M.; Rajan, G.; Semenova, Y.; Farrell, G. Overview of fiber optic sensor technologies for strain/temperature sensing applications in composite materials. Sensors 2016, 16, 99. [Google Scholar] [CrossRef] [PubMed]
- Fedotov M. Yu.; Development of technology for optical control of PCM structures using fiber -optic sensors; Closed Joint-Stock Company " Research Institute of Introscopy MNPO "Spectr", UDC 620.179.18, Moscow, 2019.
- Larin A.A., Fedotov M.Yu., Bukharov S.V., Reznicenko V.I.; New areas of application of fiber -optic sensor systems; Applied Photonics , UDC: 681.586.5, 310 ̶323, 2017.
- Lobanov D.S., Shipunov G.S., Voronkov A.A.; Evaluation of the performance and feasibility of using fiber optic sensors embedded in a composite material at elevated temperatures; Bulletin of PNIPU. Aerokos.
- Sahota, J.K.; Gupta, N.; Dhawan, D. Fiber Bragg grating sensors for monitoring of physical parameters: a comprehensive review. Optical Engineering 2020, 59, 060901. [Google Scholar]
- Fedotov M.Yu., Beylina N.Yu., Gareev A.R.; Features of the integration of fiber optic sensors into three-layer composite parts; Collection of abstracts of reports of the International Conference of Young Scientists Working in the Field of Carbon Materials, pp. 143–144, 2017.
- Kolosov, A.E.; Sivetskii, V.I.; Kolosova, E.P.; Vanin, V.V.; Gondlyakh, A.V.; Sidorov, D.E.; Ivitskiy, I.I. Creation of structural polymer composite materials for functional application using physicochemical modification. Advances in Polymer Technology 2019, 2019, 3501456. [Google Scholar] [CrossRef]
- Kolosova, A.S.; Sokolskaya, M.K.; Vitkalova, I.A.; Torlova, A.S.; Pikalov, E.S. Modern polymer composite materials and their applications. International Journal of Applied and Fundamental Research 2018, 5(Part 1), 245–256. [Google Scholar]
- Ramakrishnan, M.; Rajan, G.; Semenova, Y.; Boczkowska, A.; Domanski, A.; Wolinski, T.; Farrell, G. Measurement of thermal elongation induced strain of a composite material using a polarization maintaining photonic crystal fiber sensor. Sensors and Actuators A–physics 2013, 190, 44–51. [Google Scholar] [CrossRef]
- Grattan K., Meggit B.: Optical fiber sensors technology. Fundamentals. Kluver Academic Publishers, Boston, Dordrecht, London, 2000.
- Harasim, D.; Kisała, P. Układy przesłuchujące multipleksowane światłowodowe czujniki bragga. Informatyka Automatyka Pomiary w Gospodarce i Ochronie Środowiska 2015, 5, 77–84. [Google Scholar]
- Lesiak, P.; Szelag, M.; Awietjan, S.; Kuczkowski, M.; Ertman, S.; Budaszewski, D.; Domanski, A.; Wolinski, T. lnfluence of lamination process on plastic optical fiber sensors embedded in composite material; Proceedings of SPIE, 2013, 8774, 877405 ̶1.
- Ou, Y.; Zhou, C.; Qian, L.; Fan, D.; Cheng, C.; Guo, H. Large ̶capacity multiplexing of near ̶identical weak fiber Bragg gratings using frequency–shifted interferometry. Optics Express 2015, 23, 31484. [Google Scholar] [PubMed]
- Zhao, Y.; Liao, Y. Discrimination methods and demodulation techniques for fiber Bragg grating sensors. Optics and Laser Engineering 2004, 41, 1–18. [Google Scholar]
- Harasim D., Yussupova G.; Improvement of FBG peak wavelength demodulation using digital signal processing algorithms; Proceedings of SPIE, 2015; ISSN 0277–786X ; nr 9662.
Figure 1.
Photograph of a composite carbon fiber and epoxy resin test plate with embedded FBG sensors.
Figure 1.
Photograph of a composite carbon fiber and epoxy resin test plate with embedded FBG sensors.
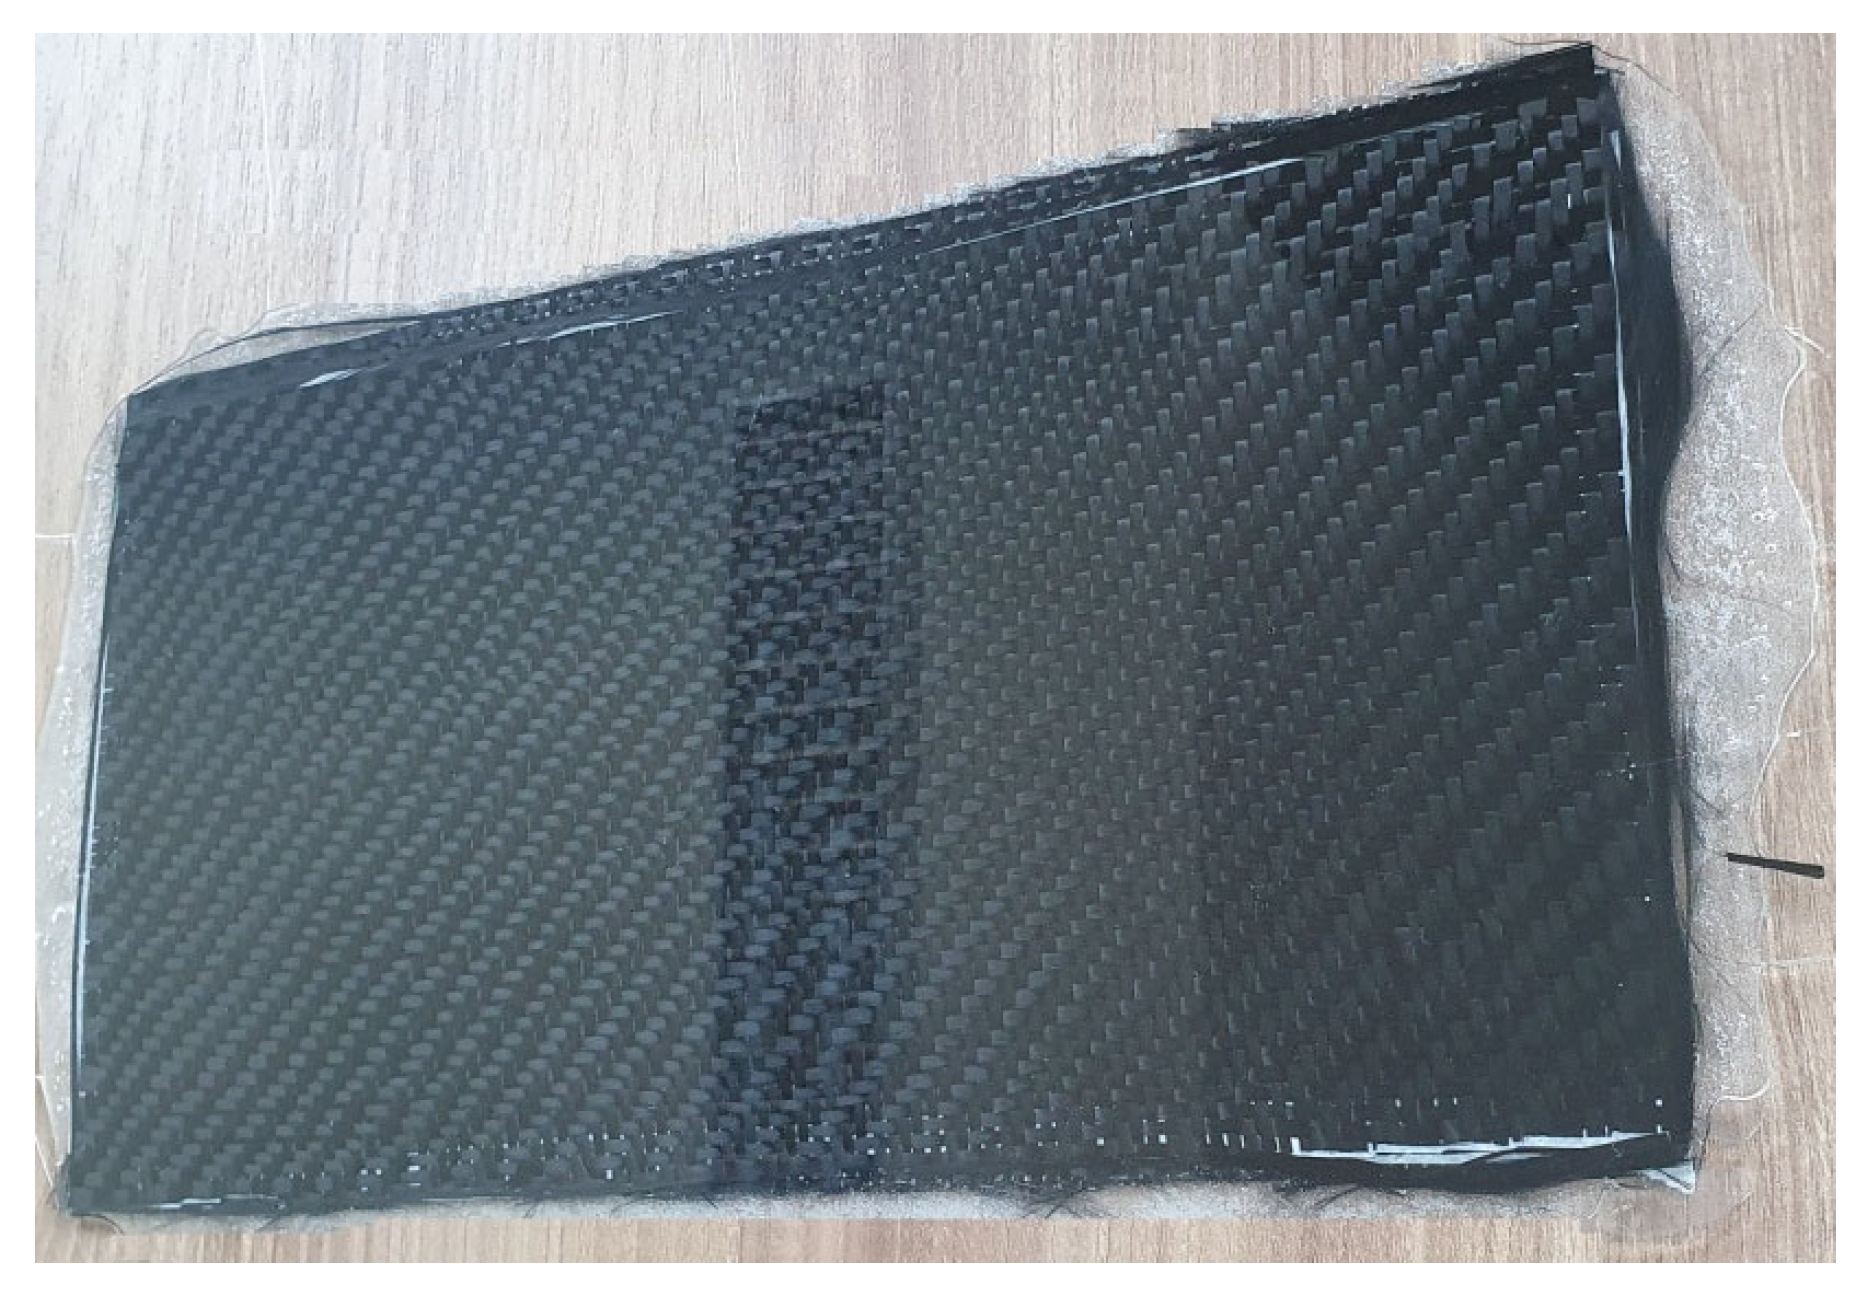
Figure 2.
Schematic diagram of the arrangement of Bragg gratings embedded in the internal structure of the control plate.
Figure 2.
Schematic diagram of the arrangement of Bragg gratings embedded in the internal structure of the control plate.
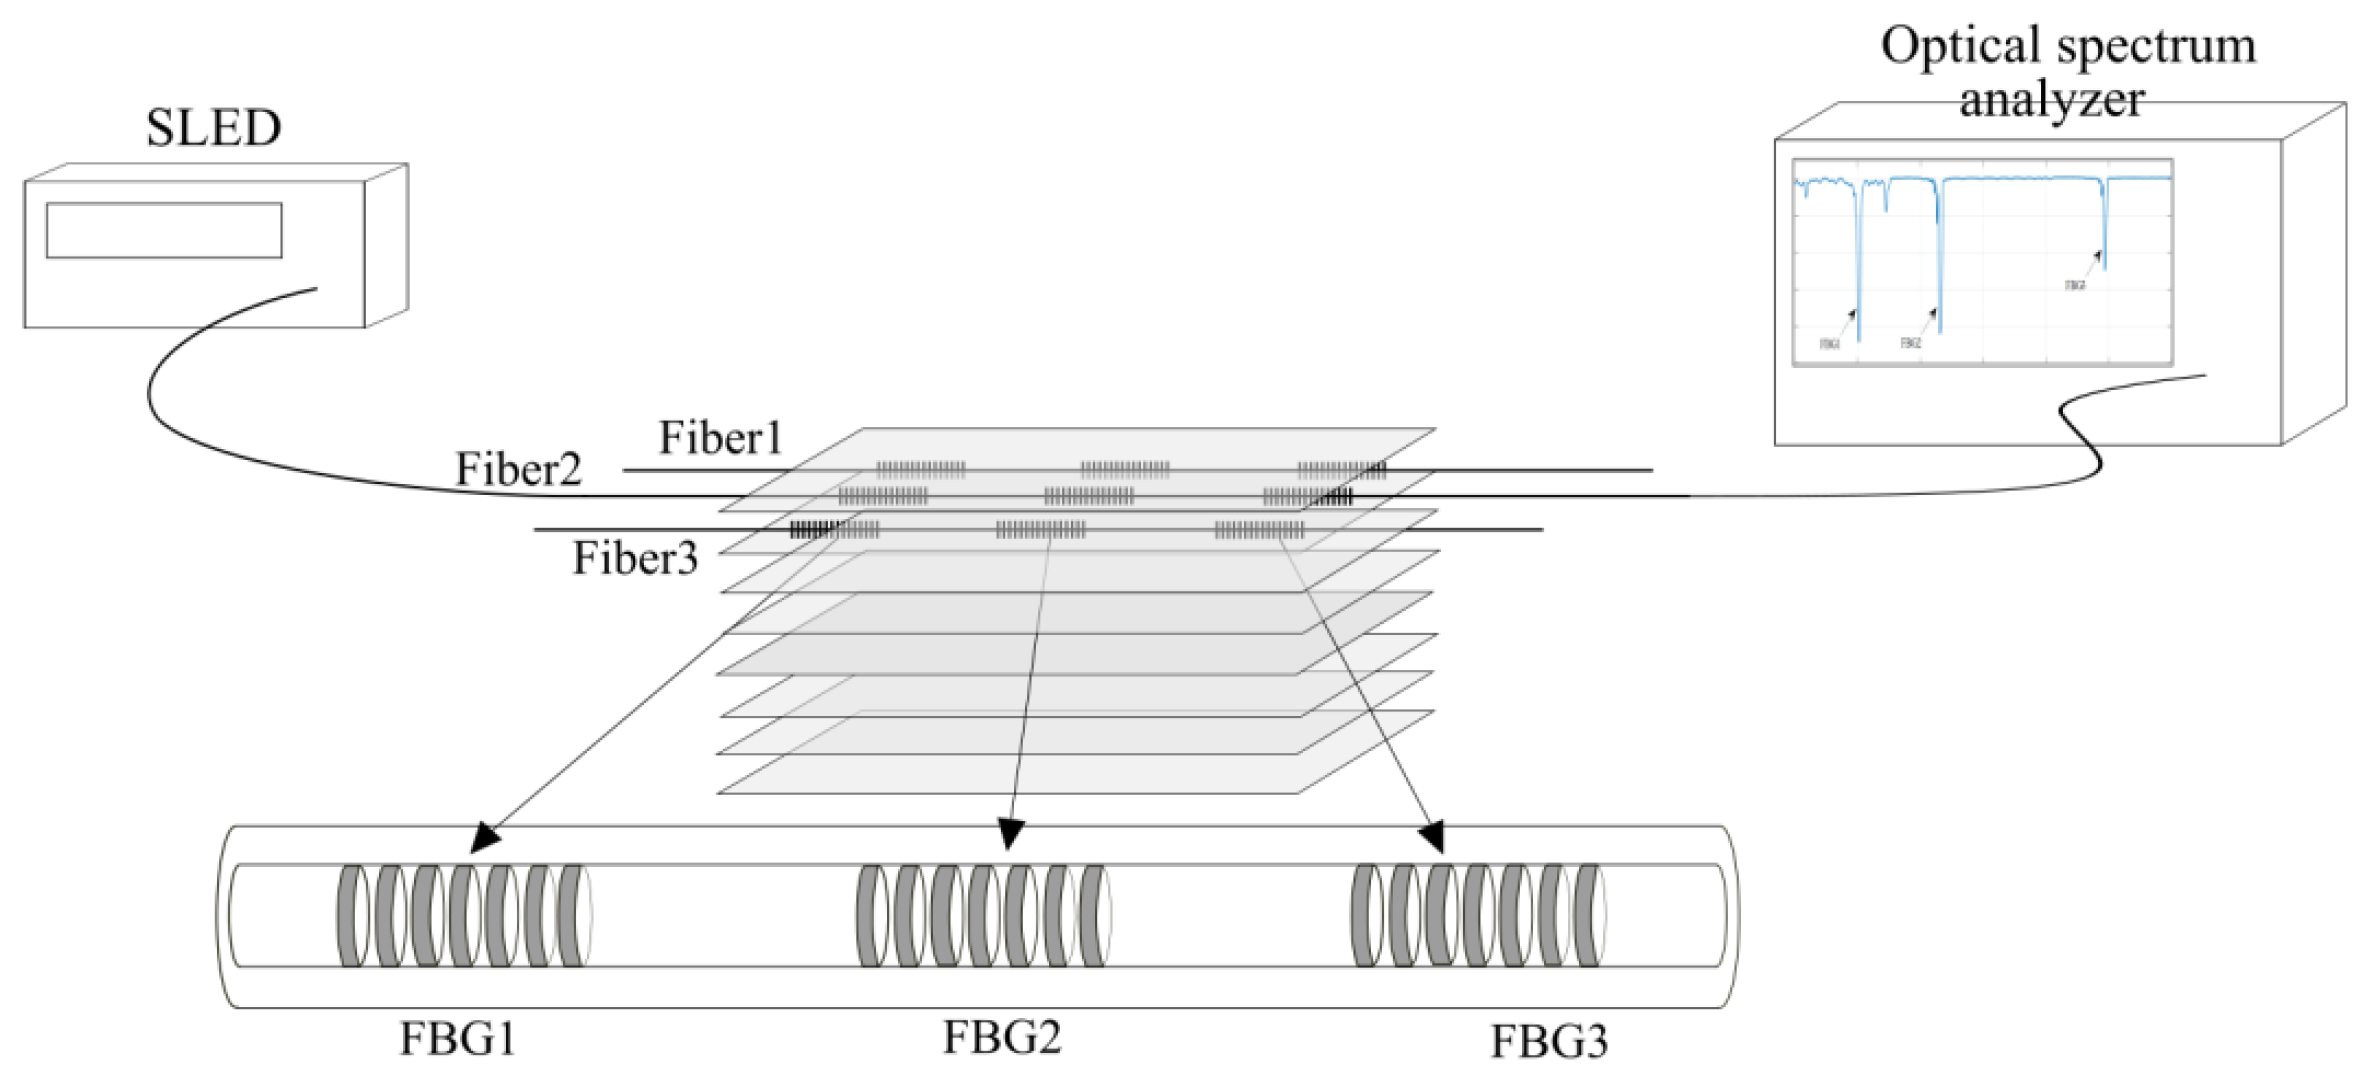
Figure 3.
Schematic diagram of the internal structure of the test plate and the measuring system with the applied plate deforming element.
Figure 3.
Schematic diagram of the internal structure of the test plate and the measuring system with the applied plate deforming element.
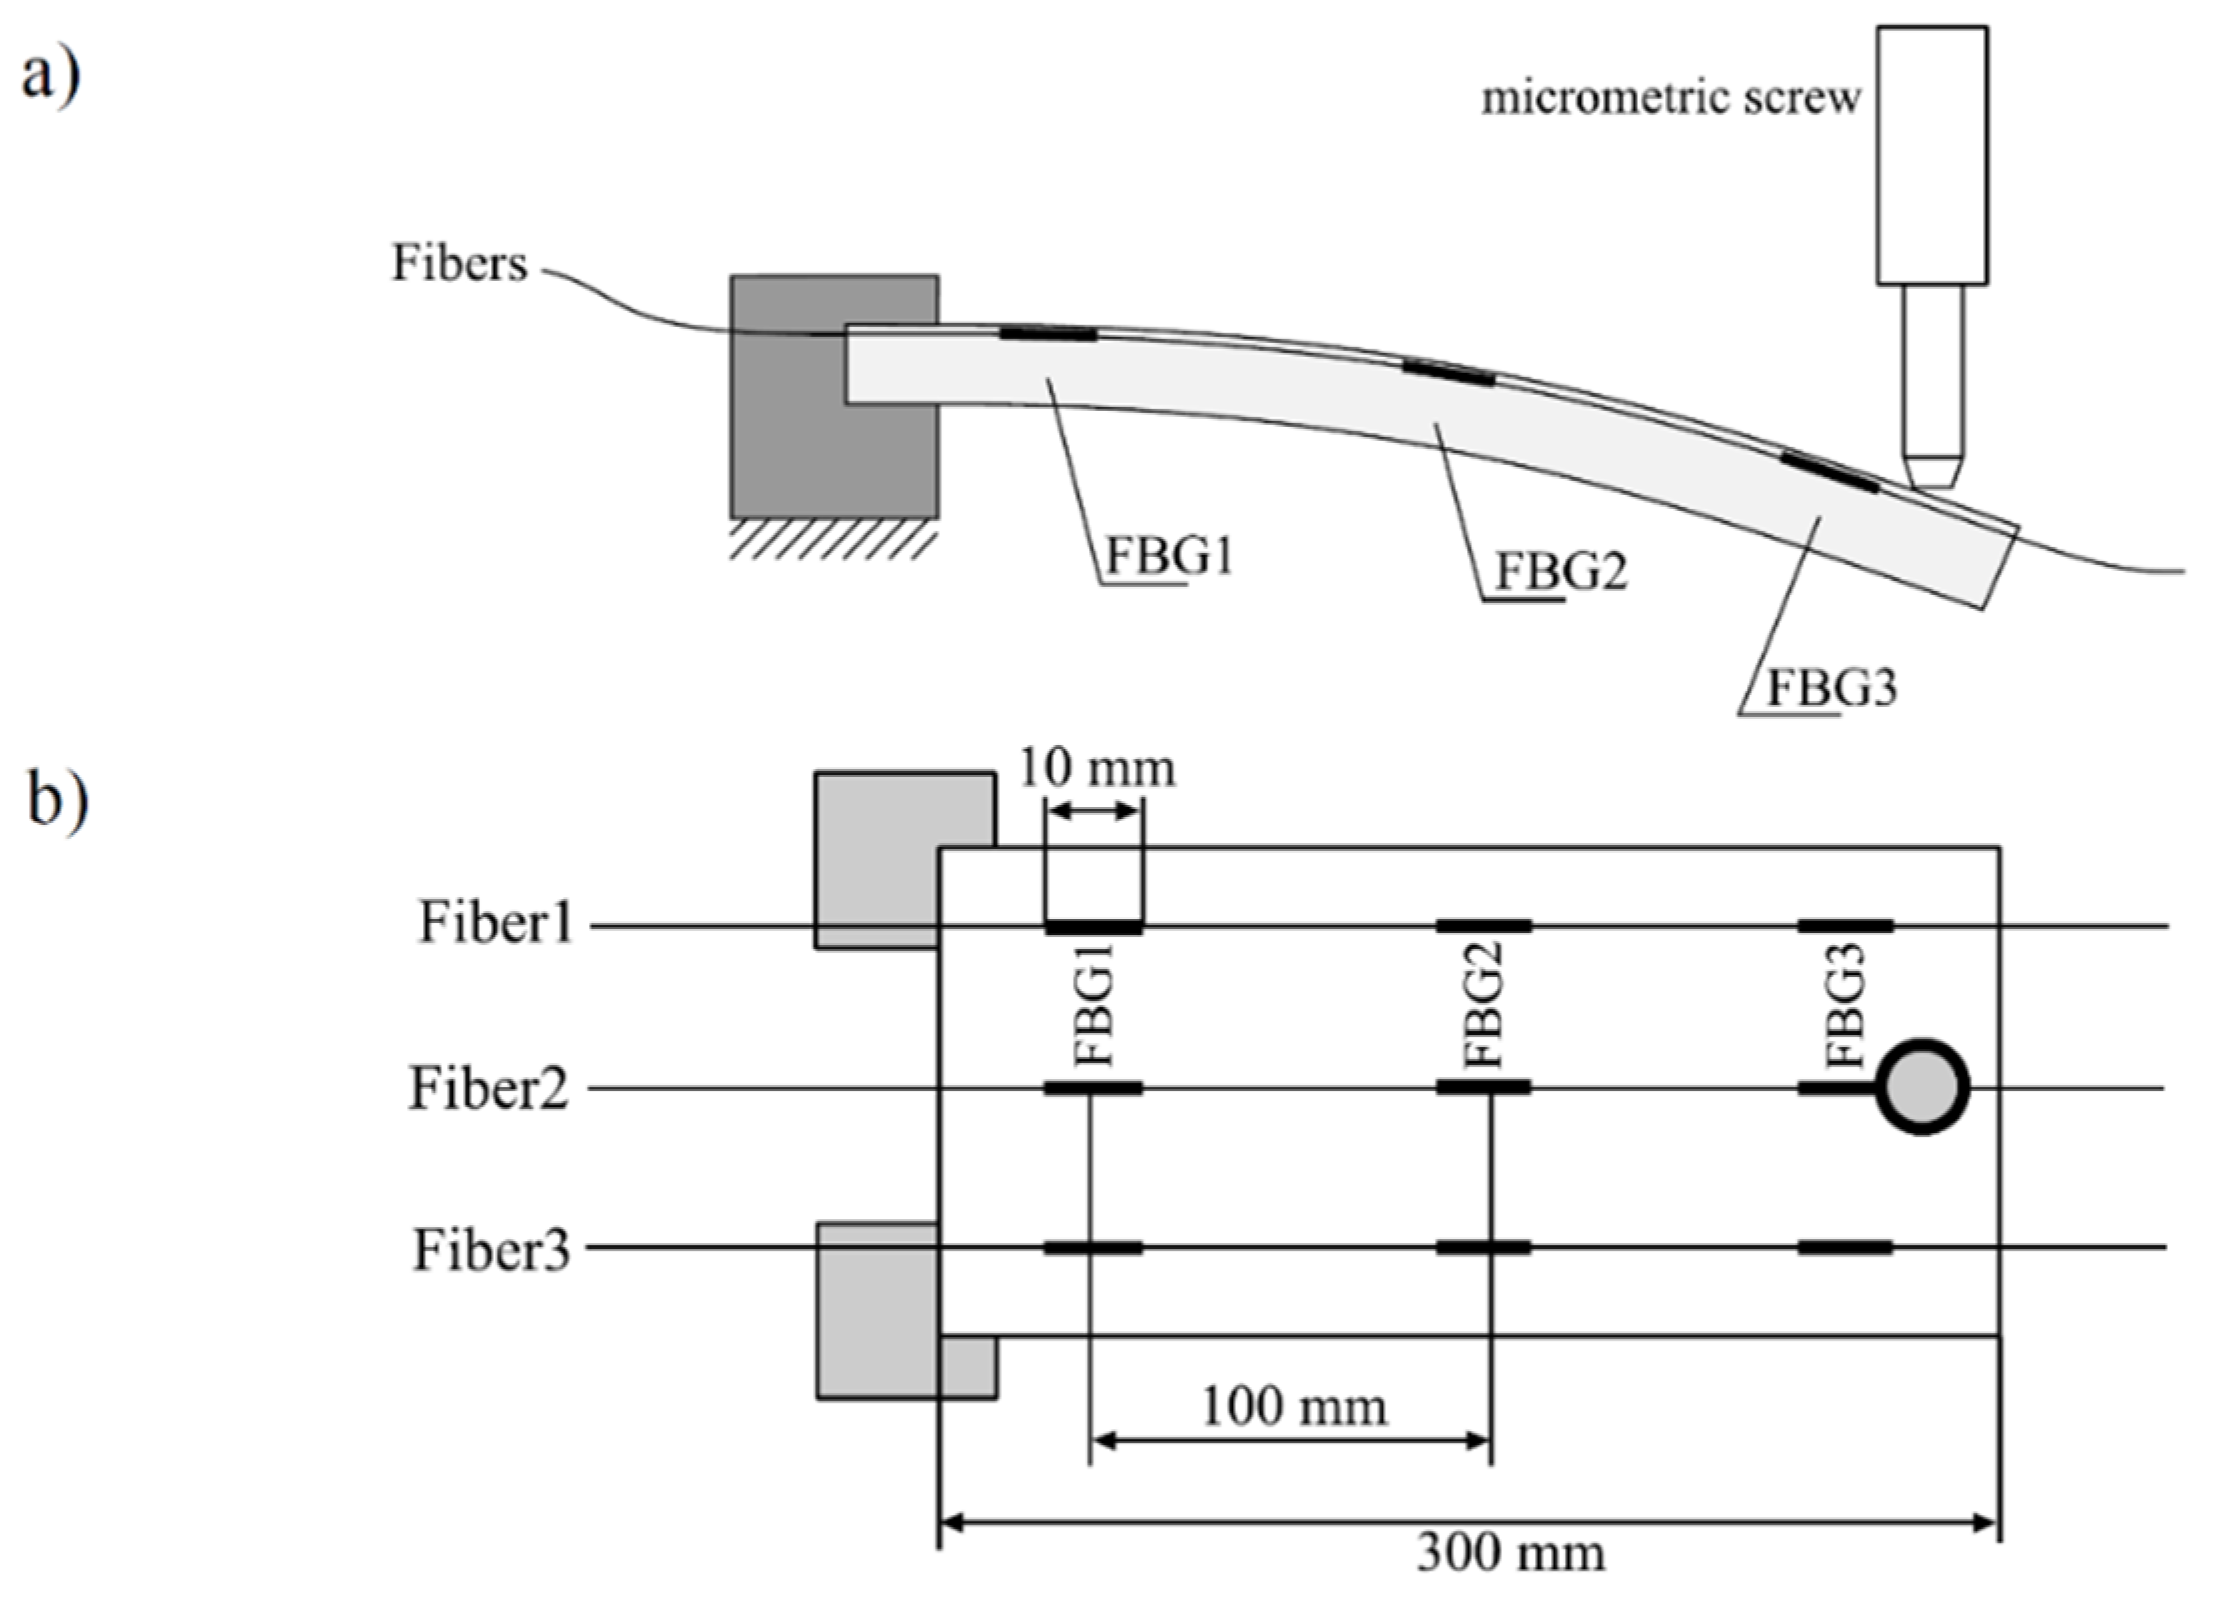
Figure 4.
Transmission spectra measured for successive optical fibers embedded in a composite plate.
Figure 4.
Transmission spectra measured for successive optical fibers embedded in a composite plate.
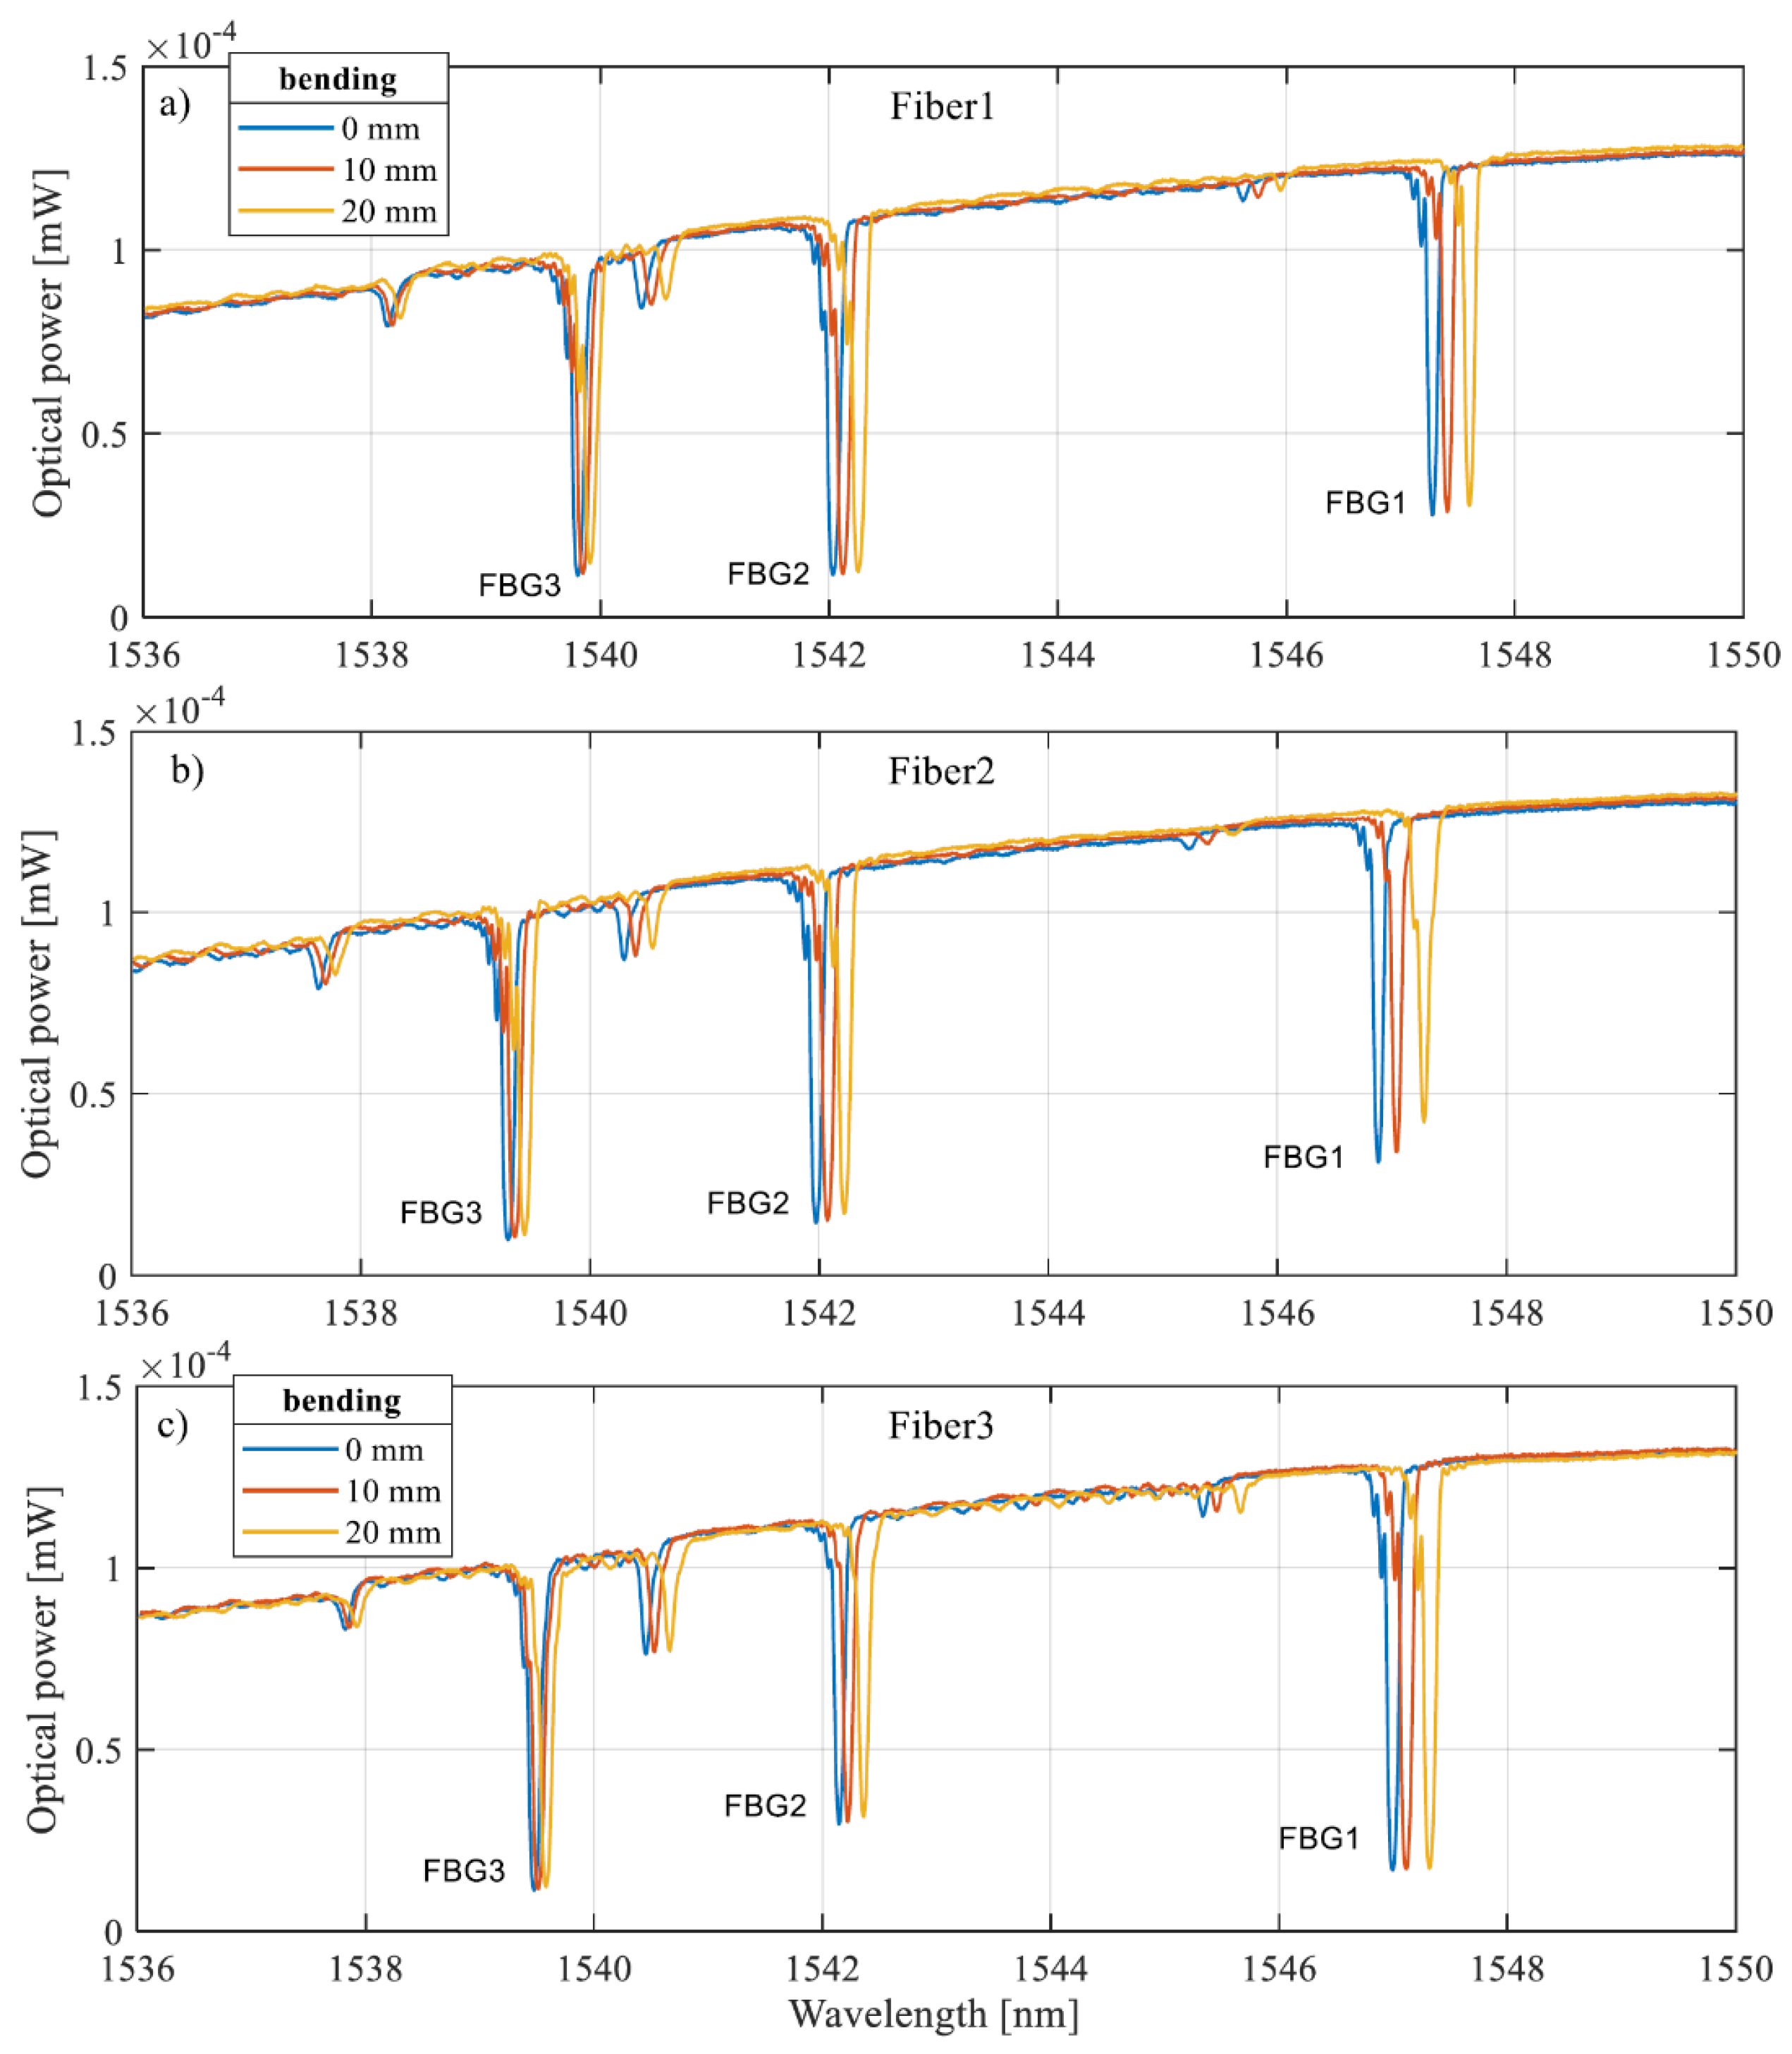
Figure 5.
Characteristics of the central wavelength change determined for optical fibers with recorded FBG sensors.
Figure 5.
Characteristics of the central wavelength change determined for optical fibers with recorded FBG sensors.
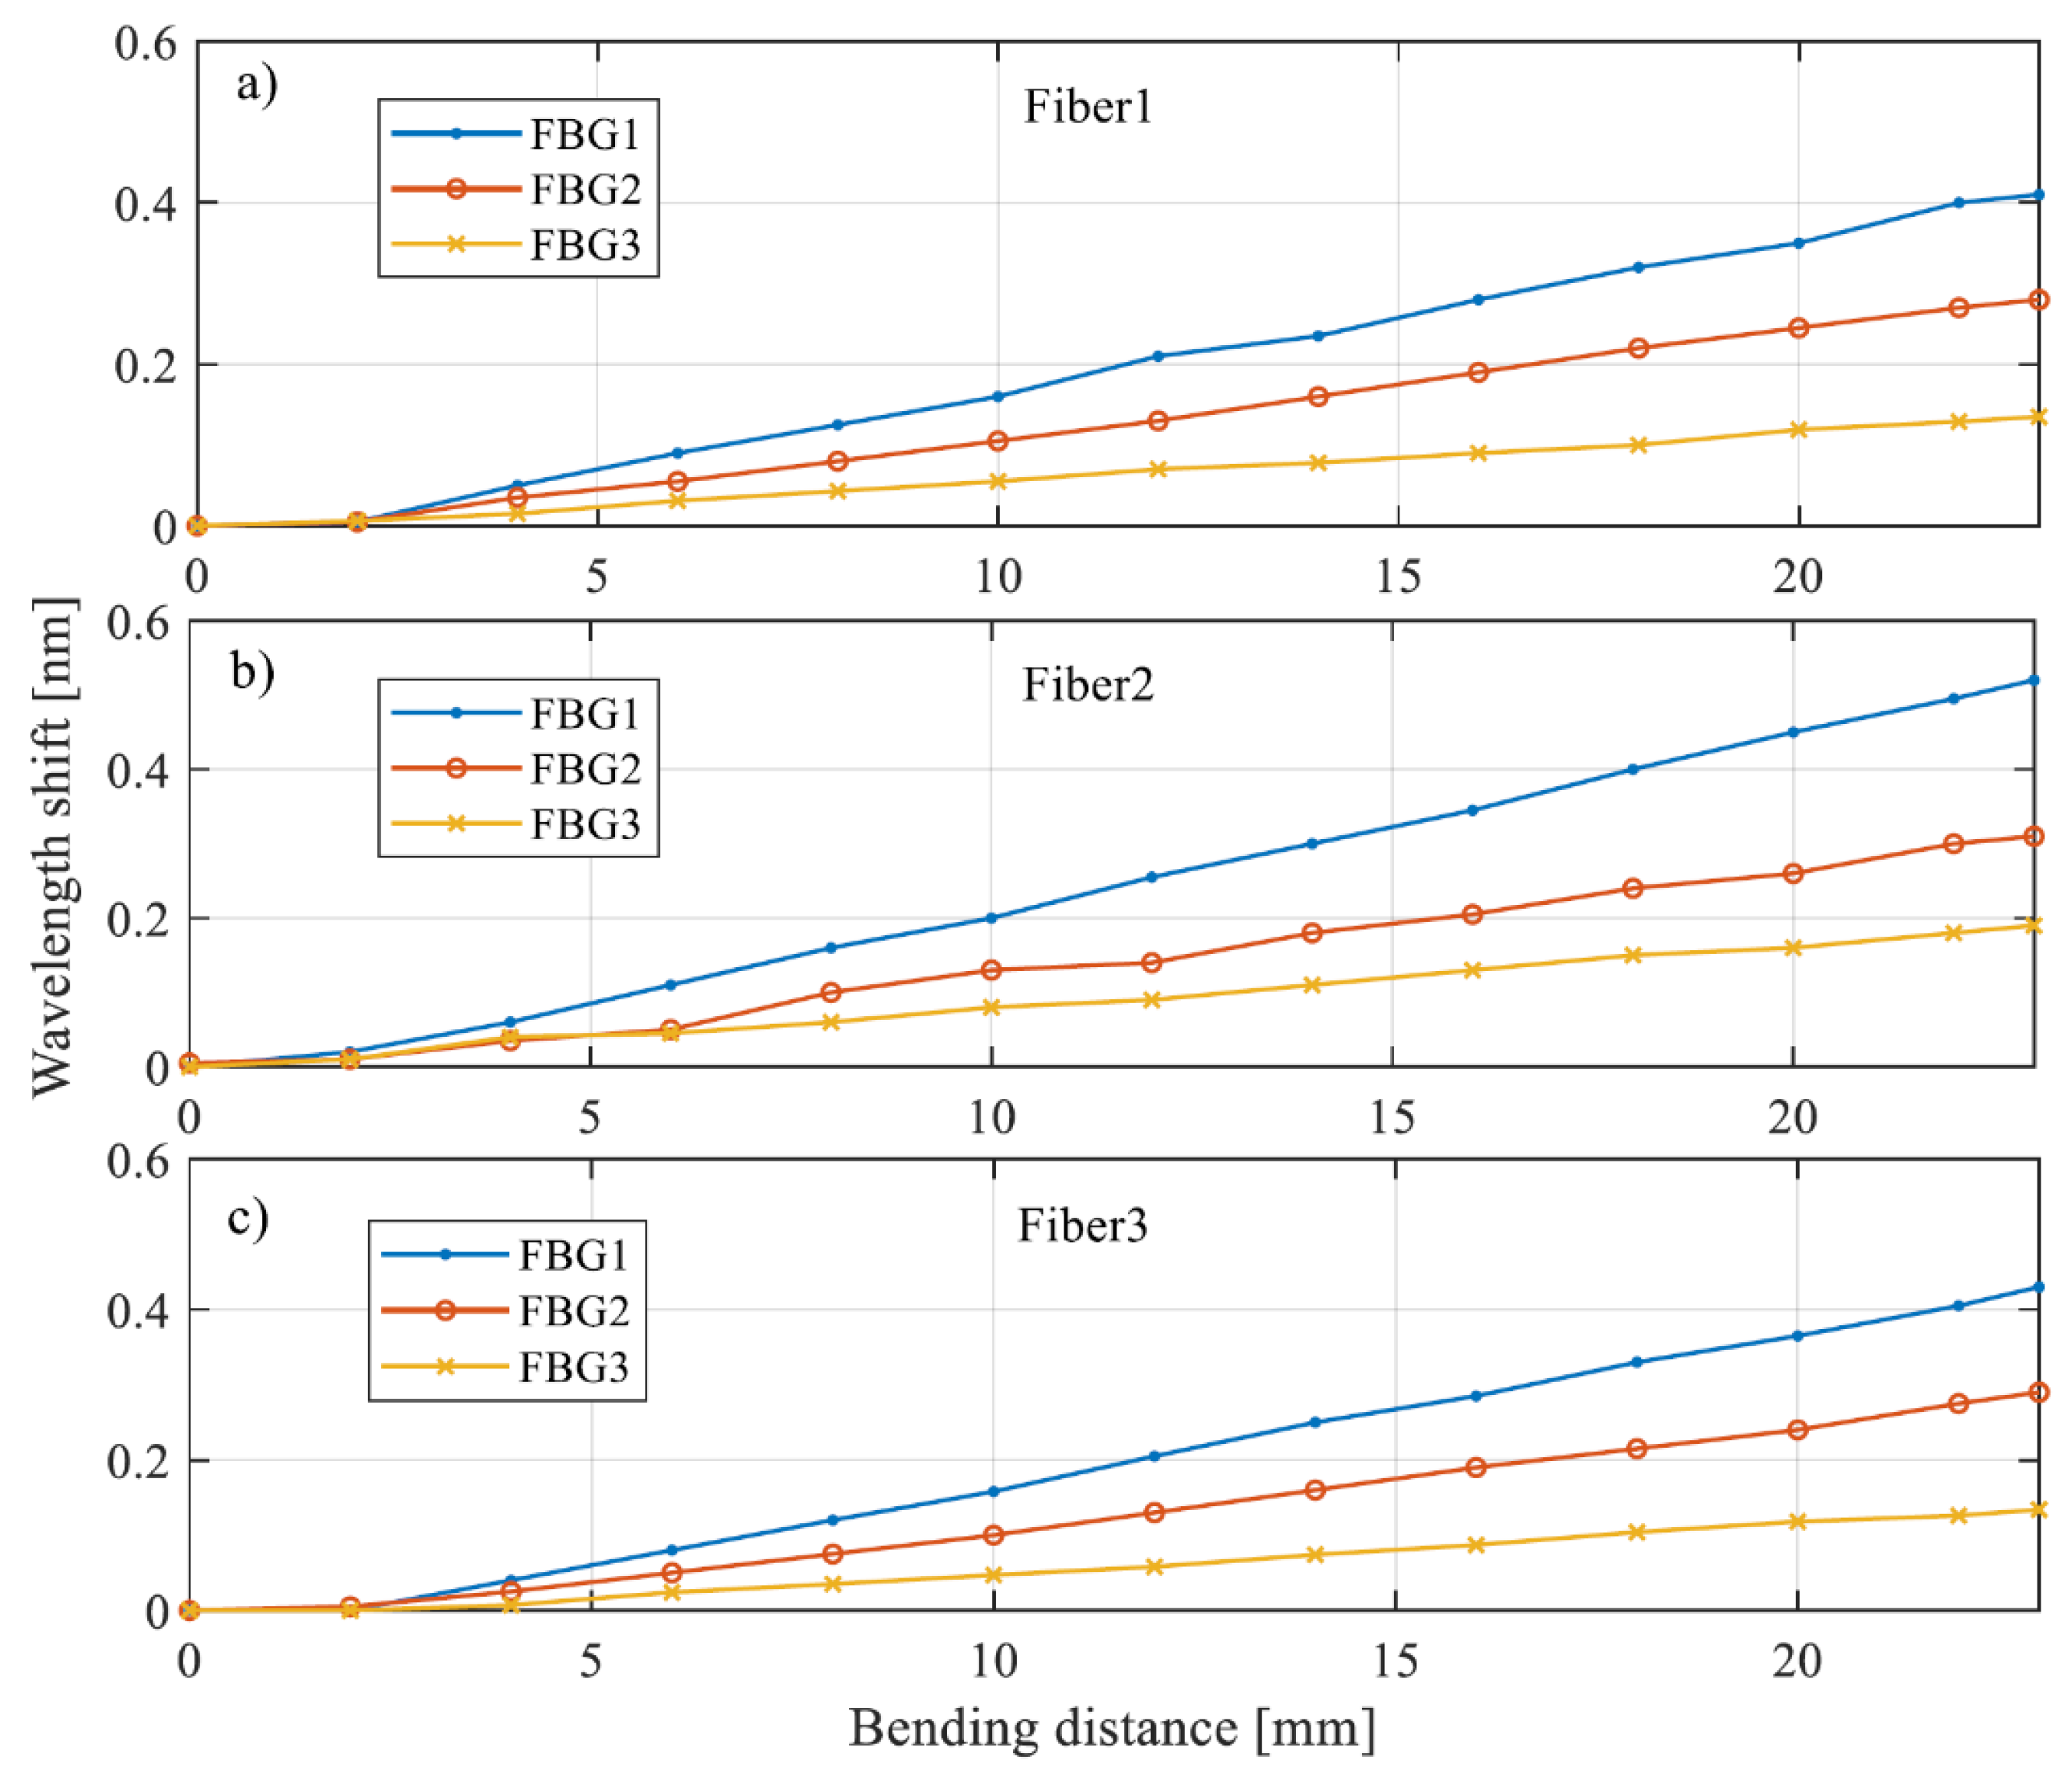
Figure 6.
Characteristics of the central wavelength change determined for gratings recorded in three fibers grouped with the same type number.
Figure 6.
Characteristics of the central wavelength change determined for gratings recorded in three fibers grouped with the same type number.
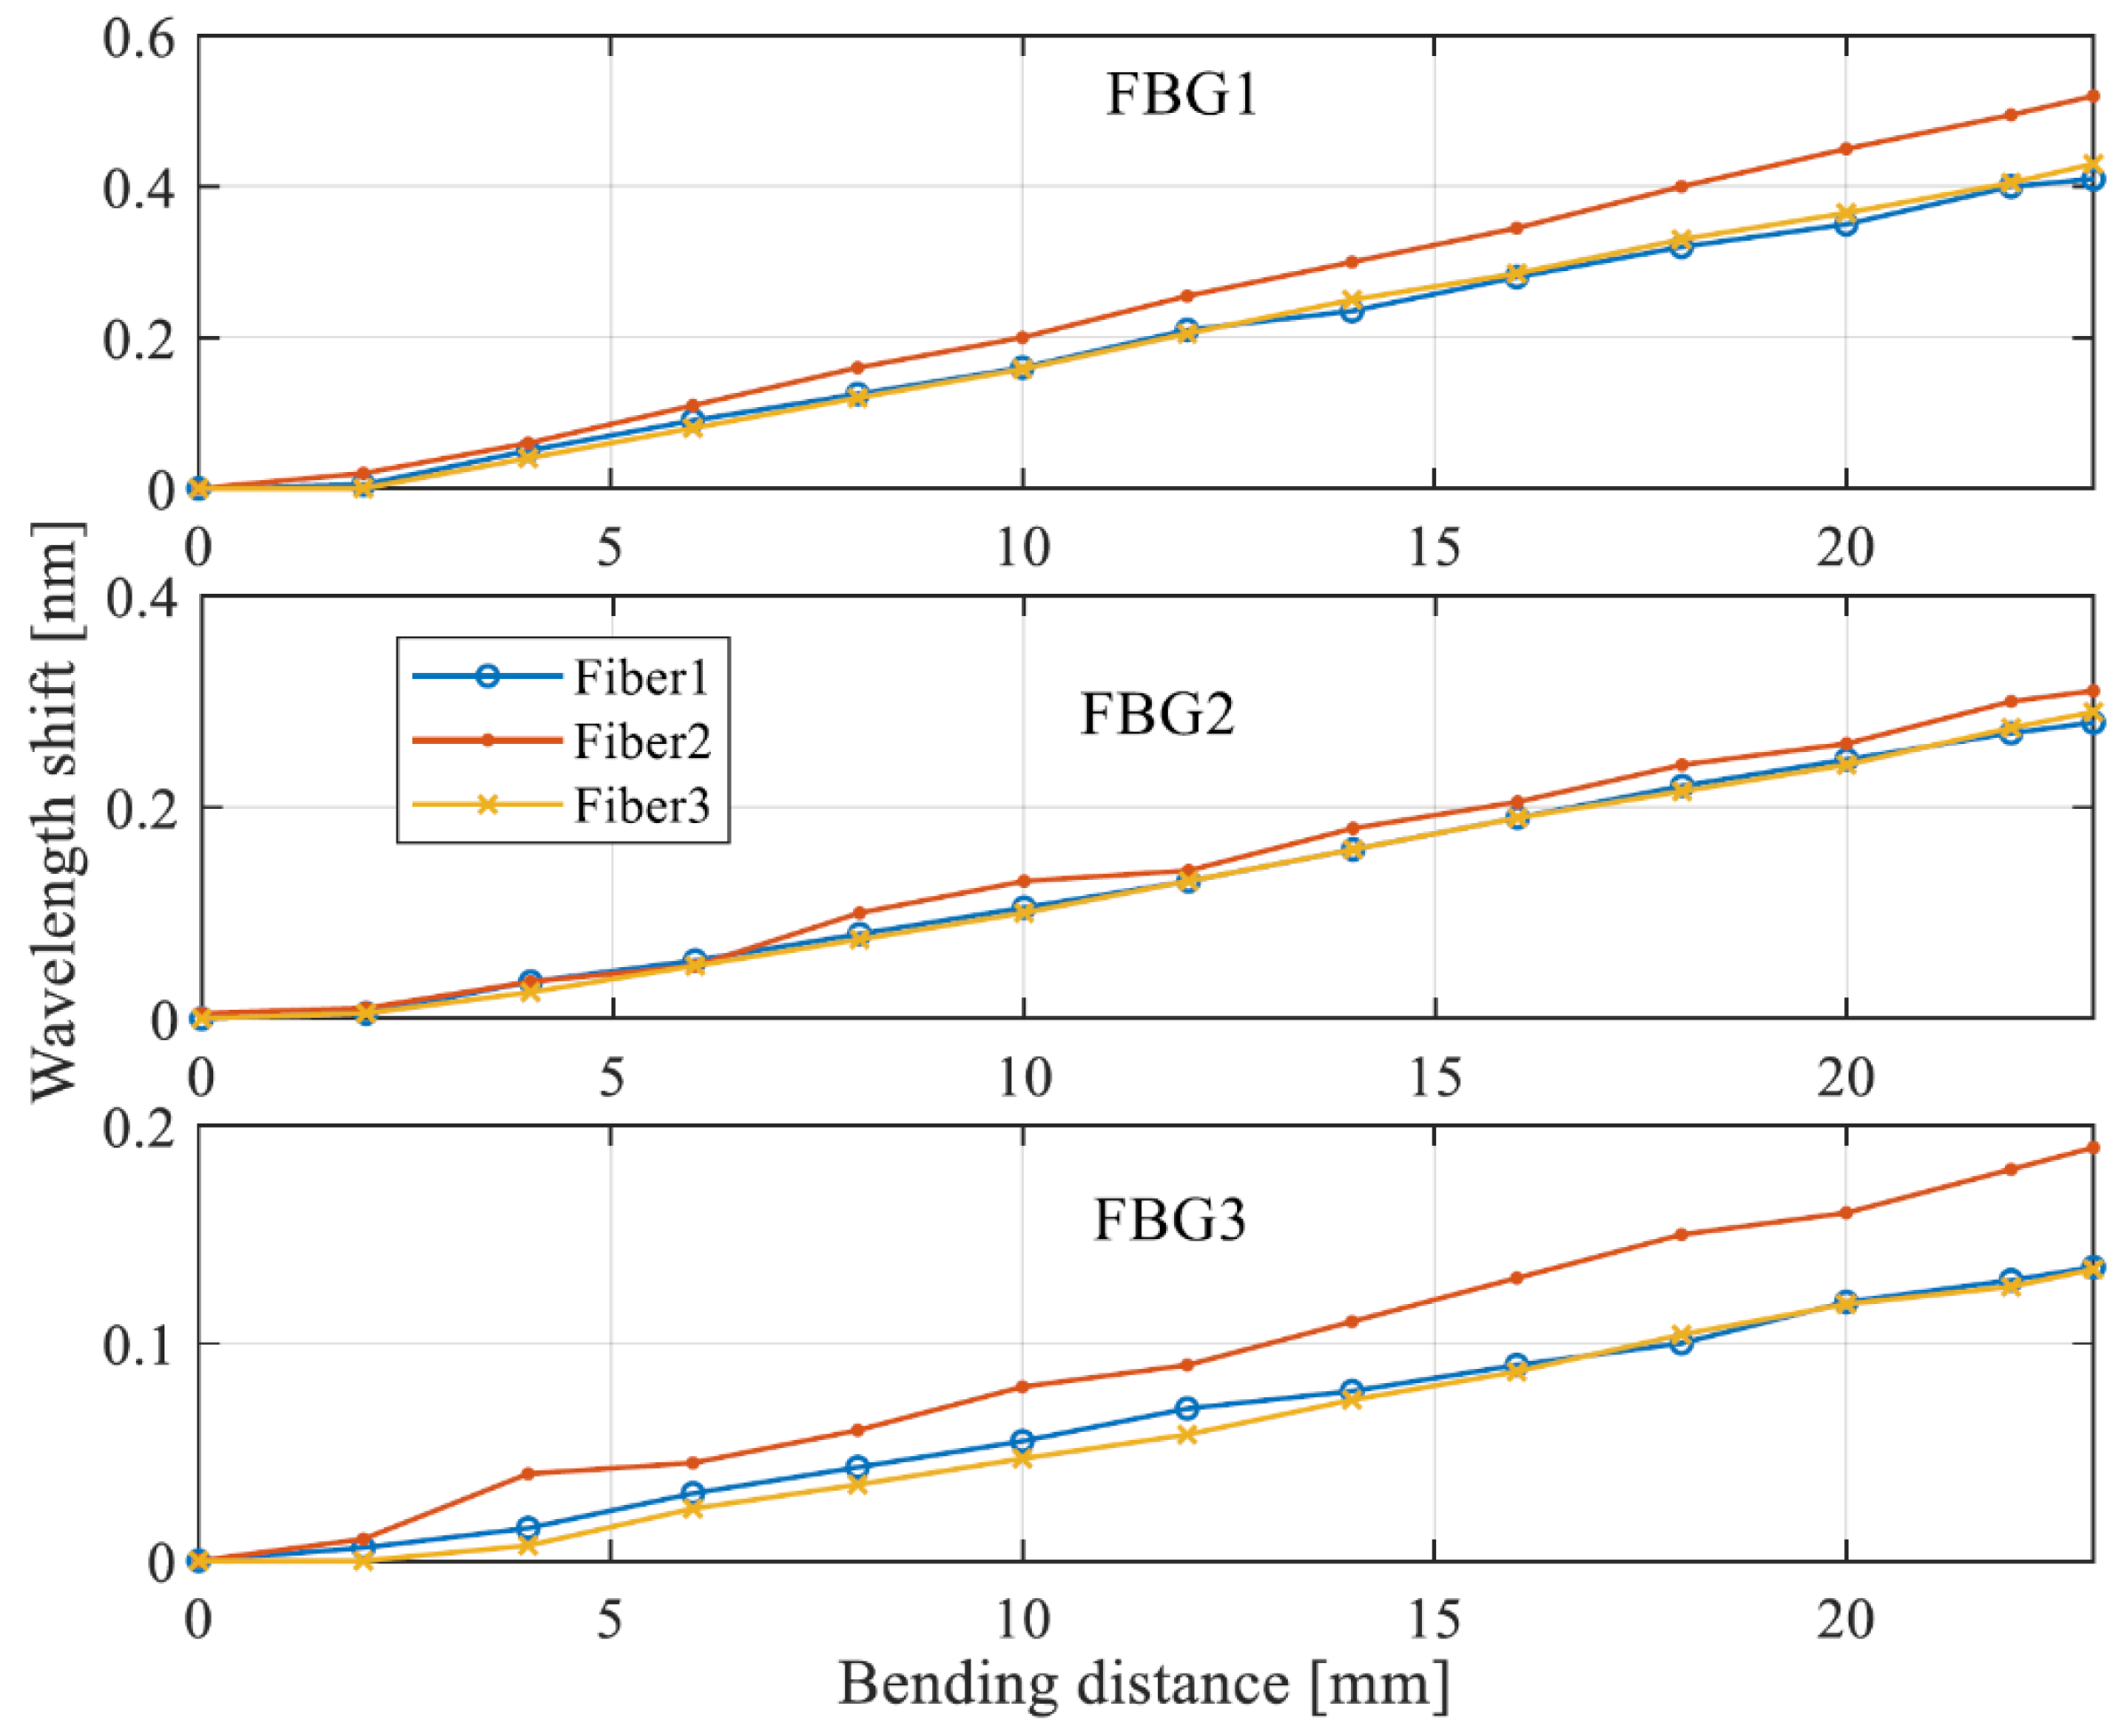
Figure 7.
Schematic diagram of the internal structure of the control plate with 13 Bragg sensors embedded between layers of carbon fabric.
Figure 7.
Schematic diagram of the internal structure of the control plate with 13 Bragg sensors embedded between layers of carbon fabric.
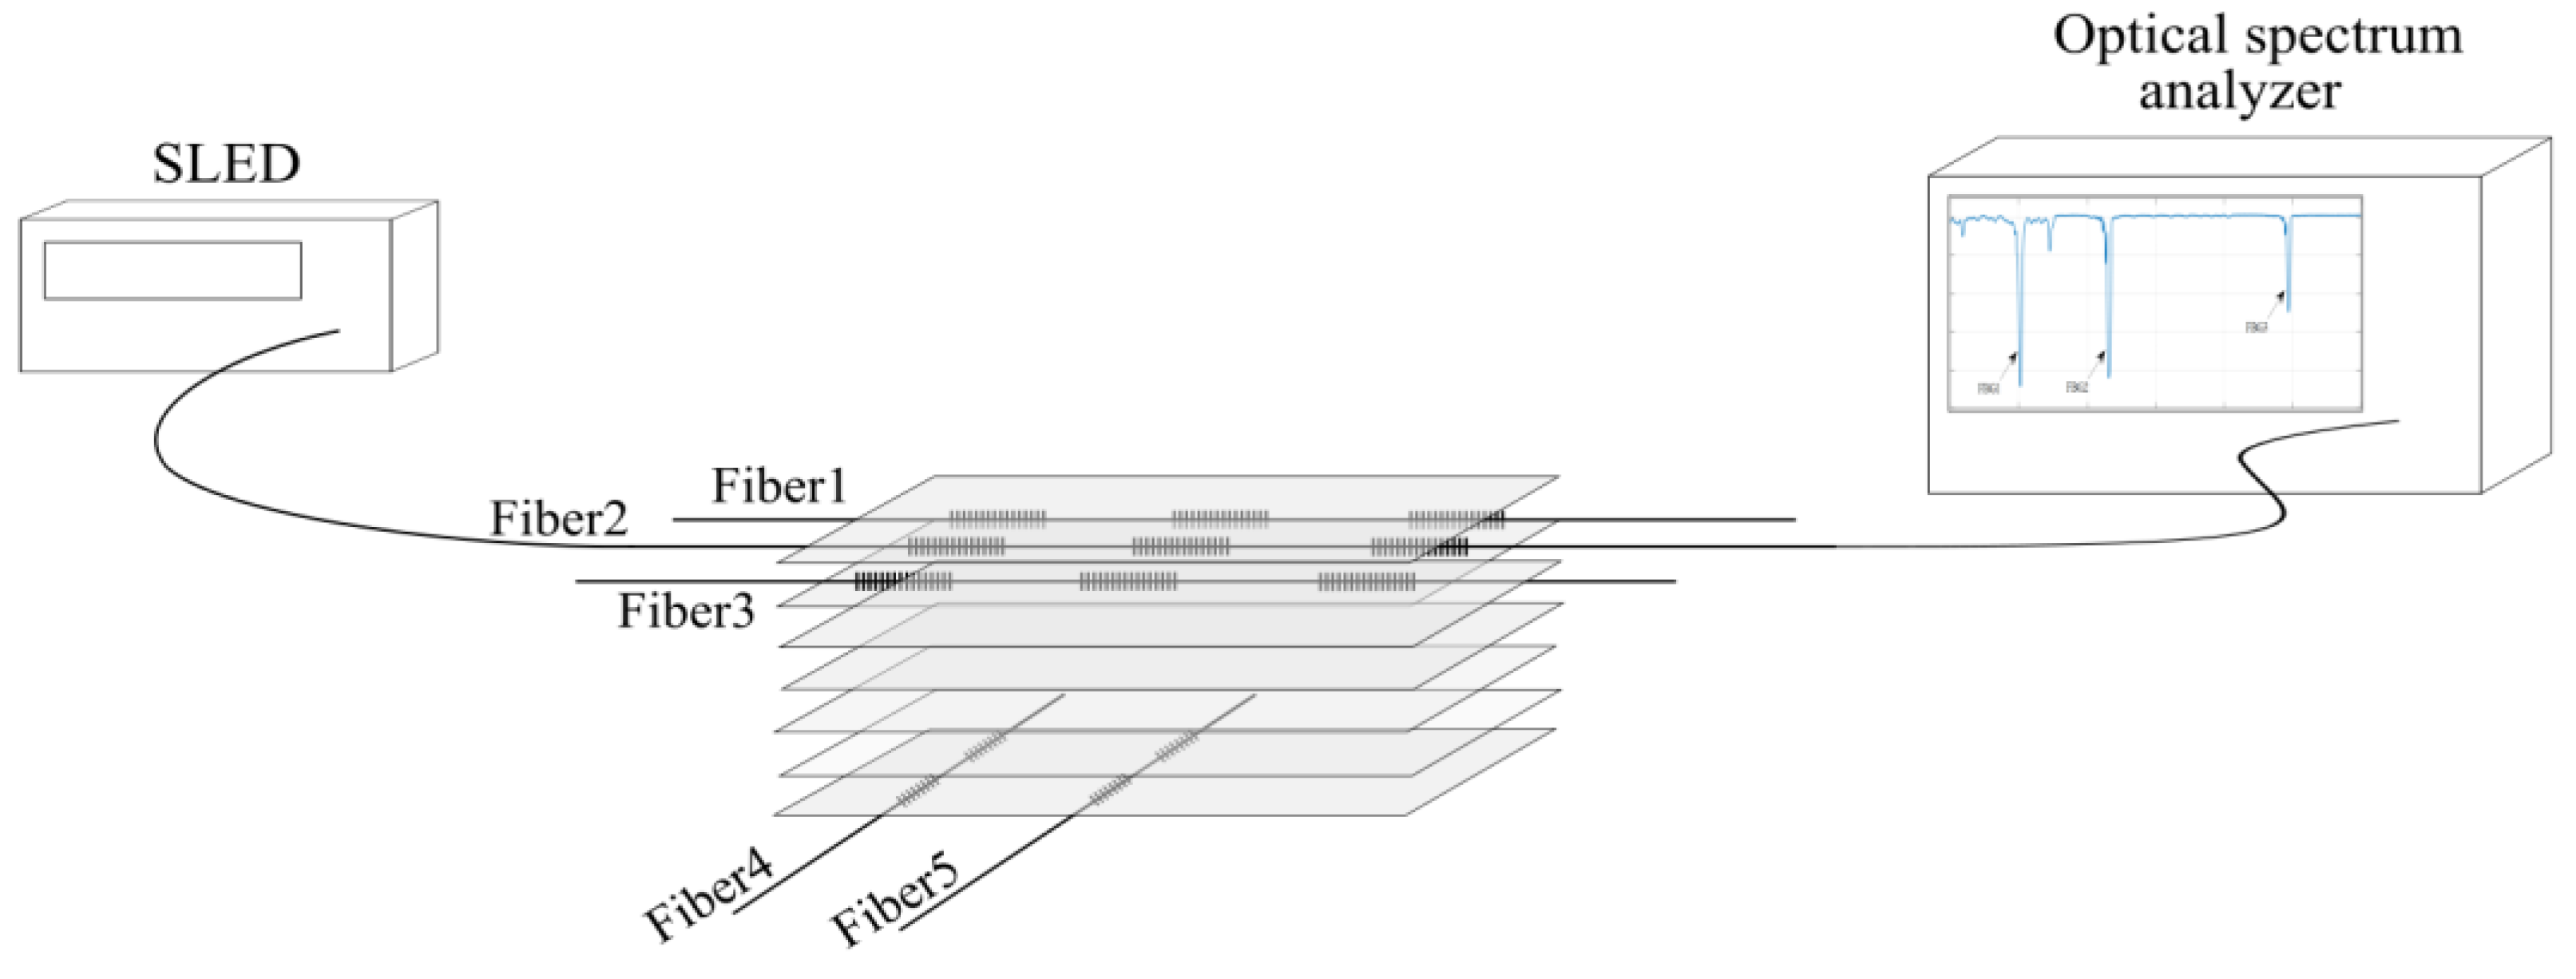
Figure 8.
Loading and mounting diagram of the plate with an integrated network of Bragg sensors.
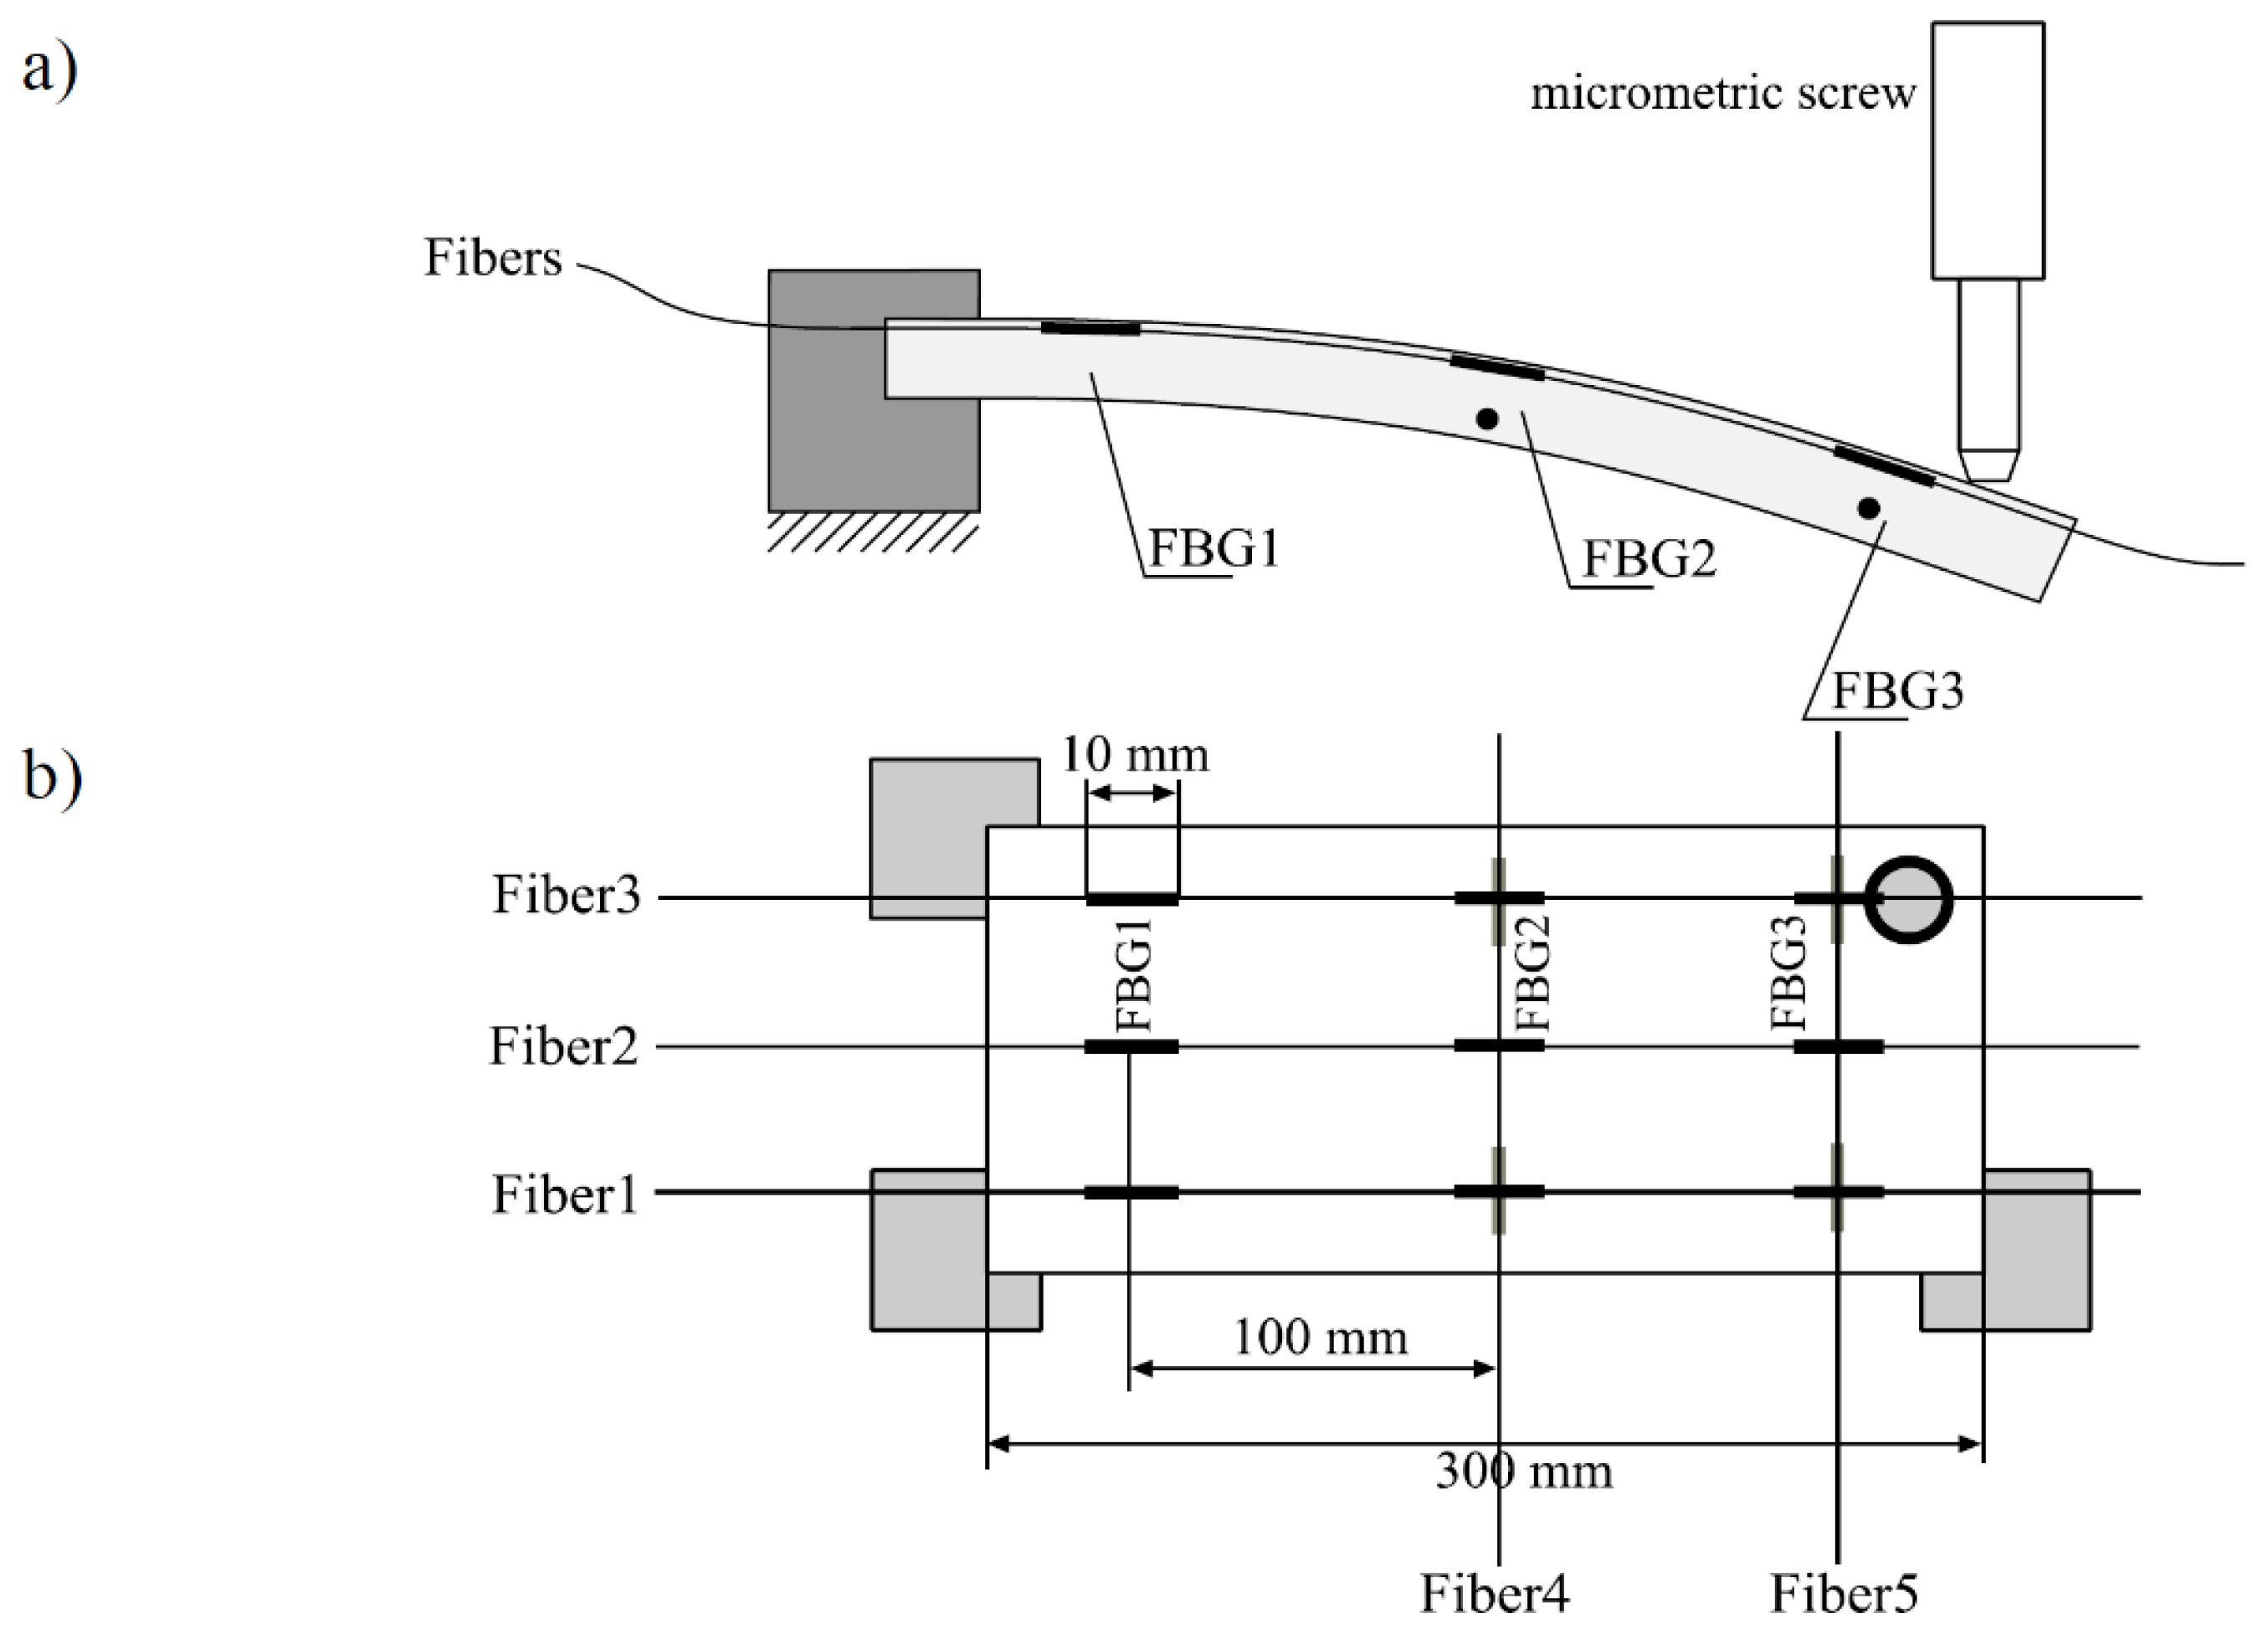
Figure 9.
Stress distribution in a test plate with integrated Bragg sensors loaded as in Example III.
Figure 9.
Stress distribution in a test plate with integrated Bragg sensors loaded as in Example III.
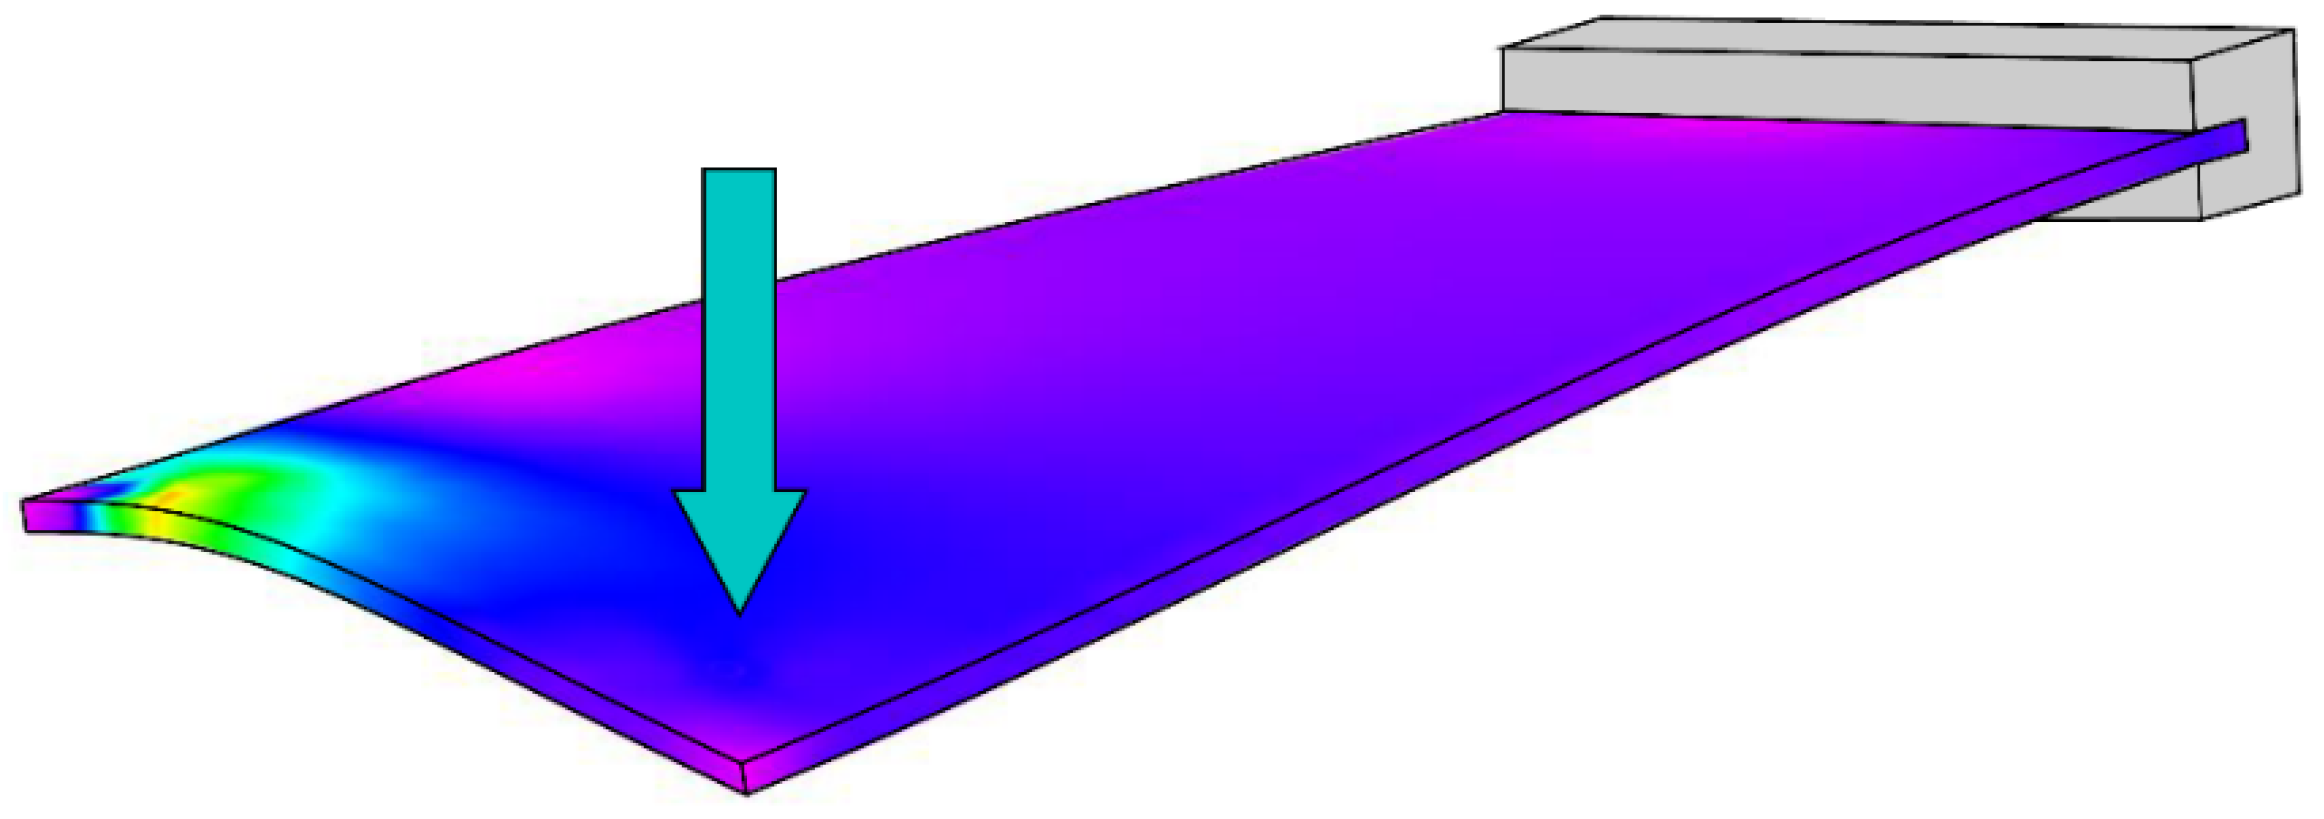
Figure 10.
Transmission spectra measured for serial optical fibers embedded in a control board with an embedded network of 13 FBG sensors.
Figure 10.
Transmission spectra measured for serial optical fibers embedded in a control board with an embedded network of 13 FBG sensors.
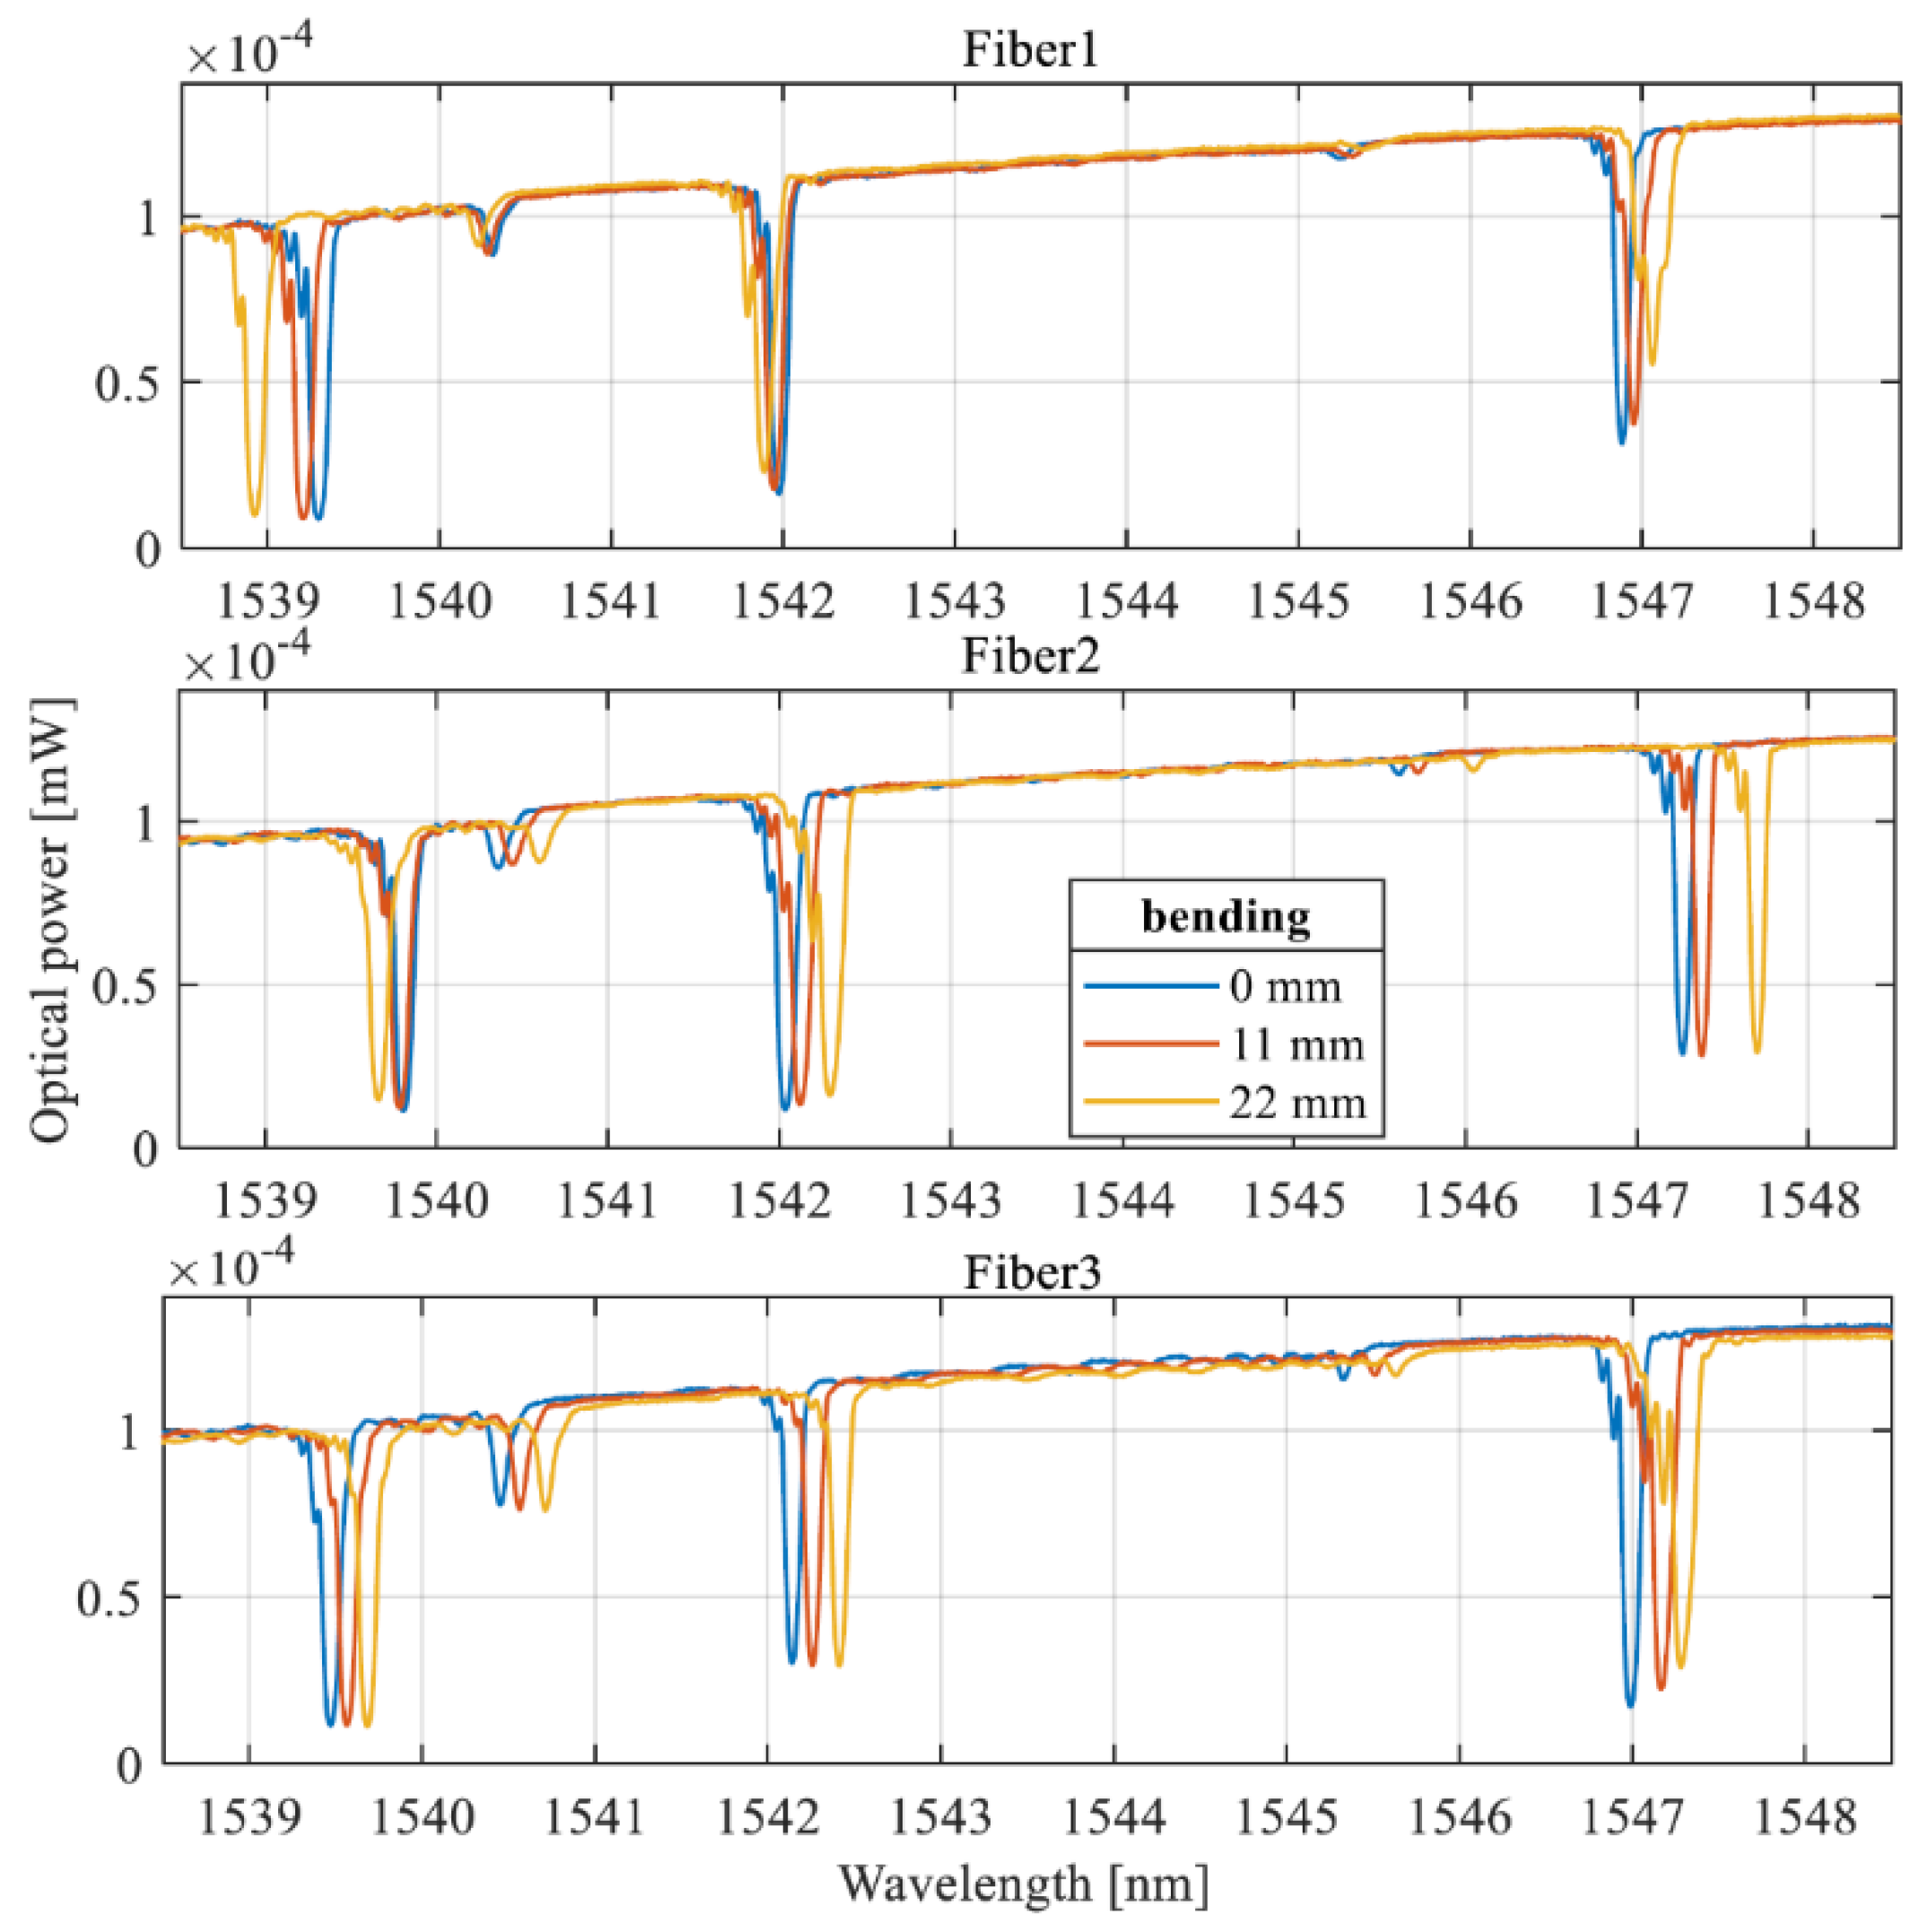
Figure 11.
Transmission spectra of FBG 1 recorded in fiber 1 subjected to non-uniform stretching by bending the control plate.
Figure 11.
Transmission spectra of FBG 1 recorded in fiber 1 subjected to non-uniform stretching by bending the control plate.
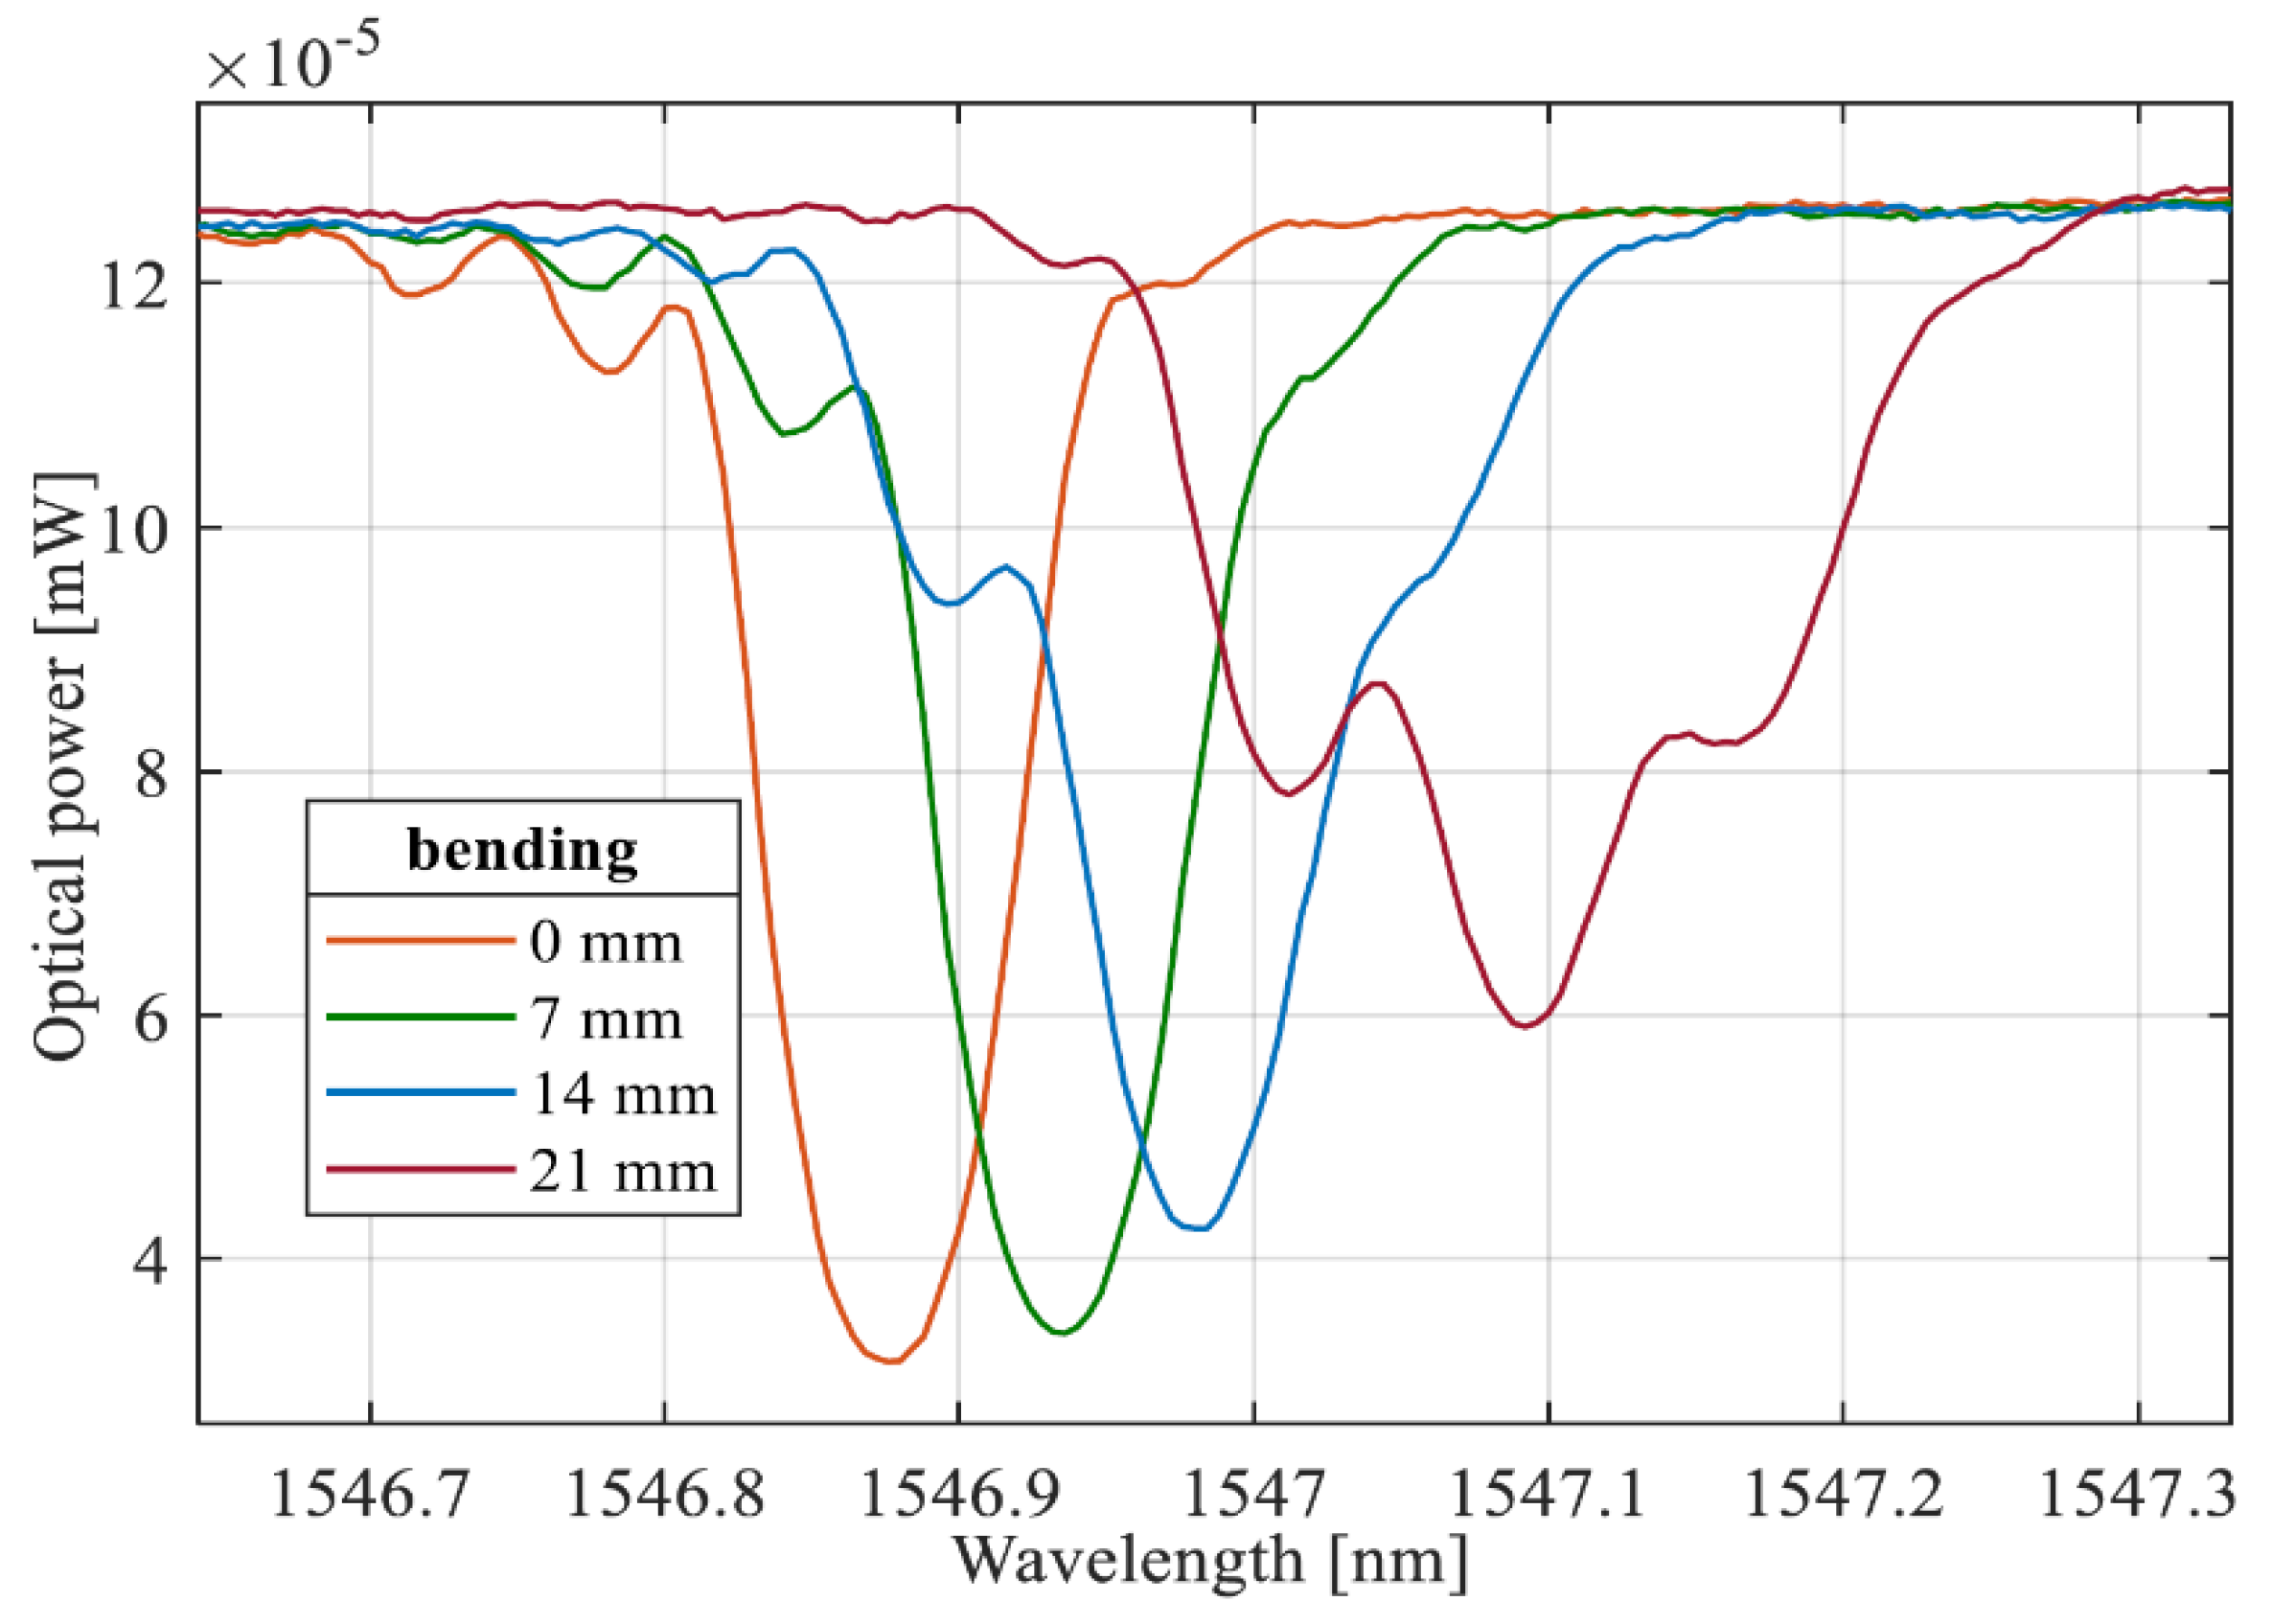
Figure 13.
Spectral shift characteristics of Bragg gratings fabricated on optical fibers embedded in a plate.
Figure 13.
Spectral shift characteristics of Bragg gratings fabricated on optical fibers embedded in a plate.
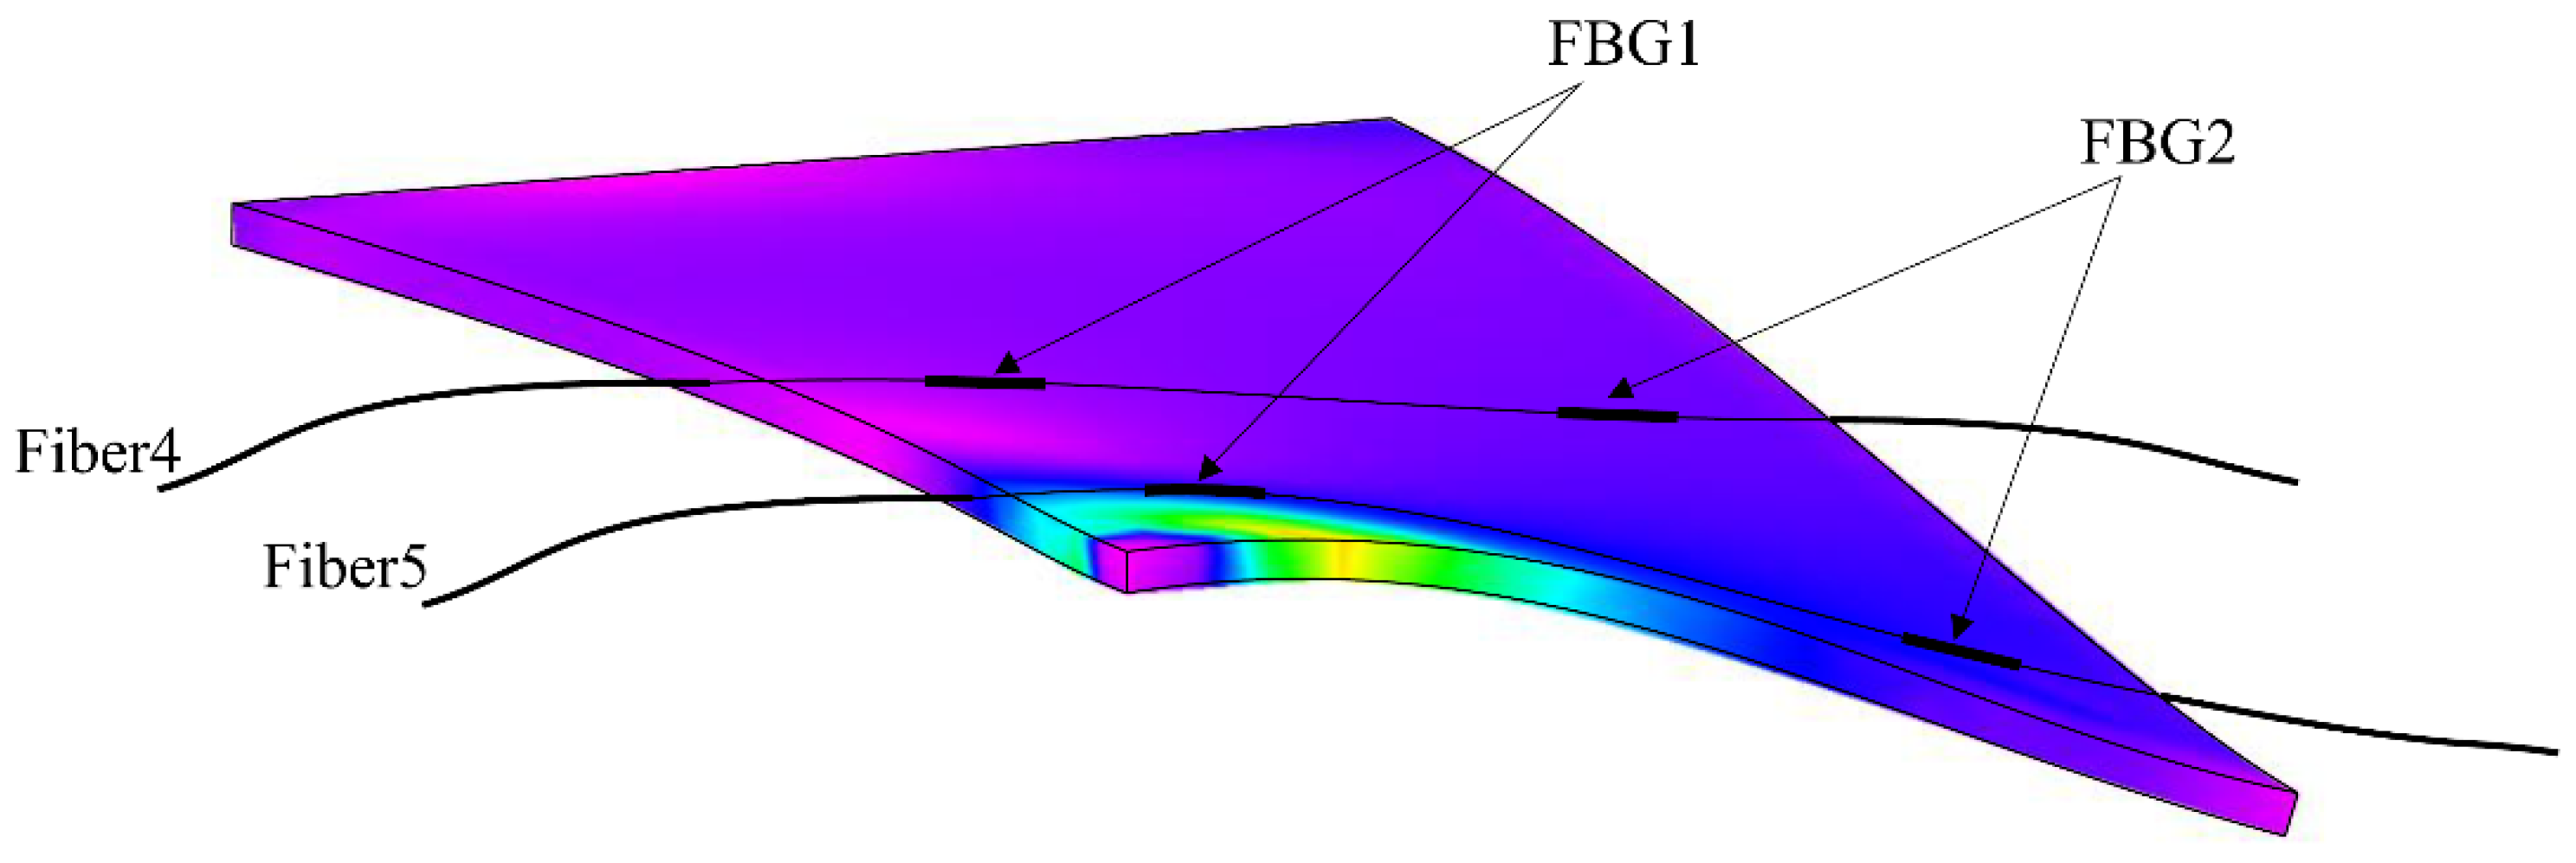
Figure 14.
Spectral shift characteristics of Bragg gratings made on optical fibers embedded in a plate.
Figure 14.
Spectral shift characteristics of Bragg gratings made on optical fibers embedded in a plate.
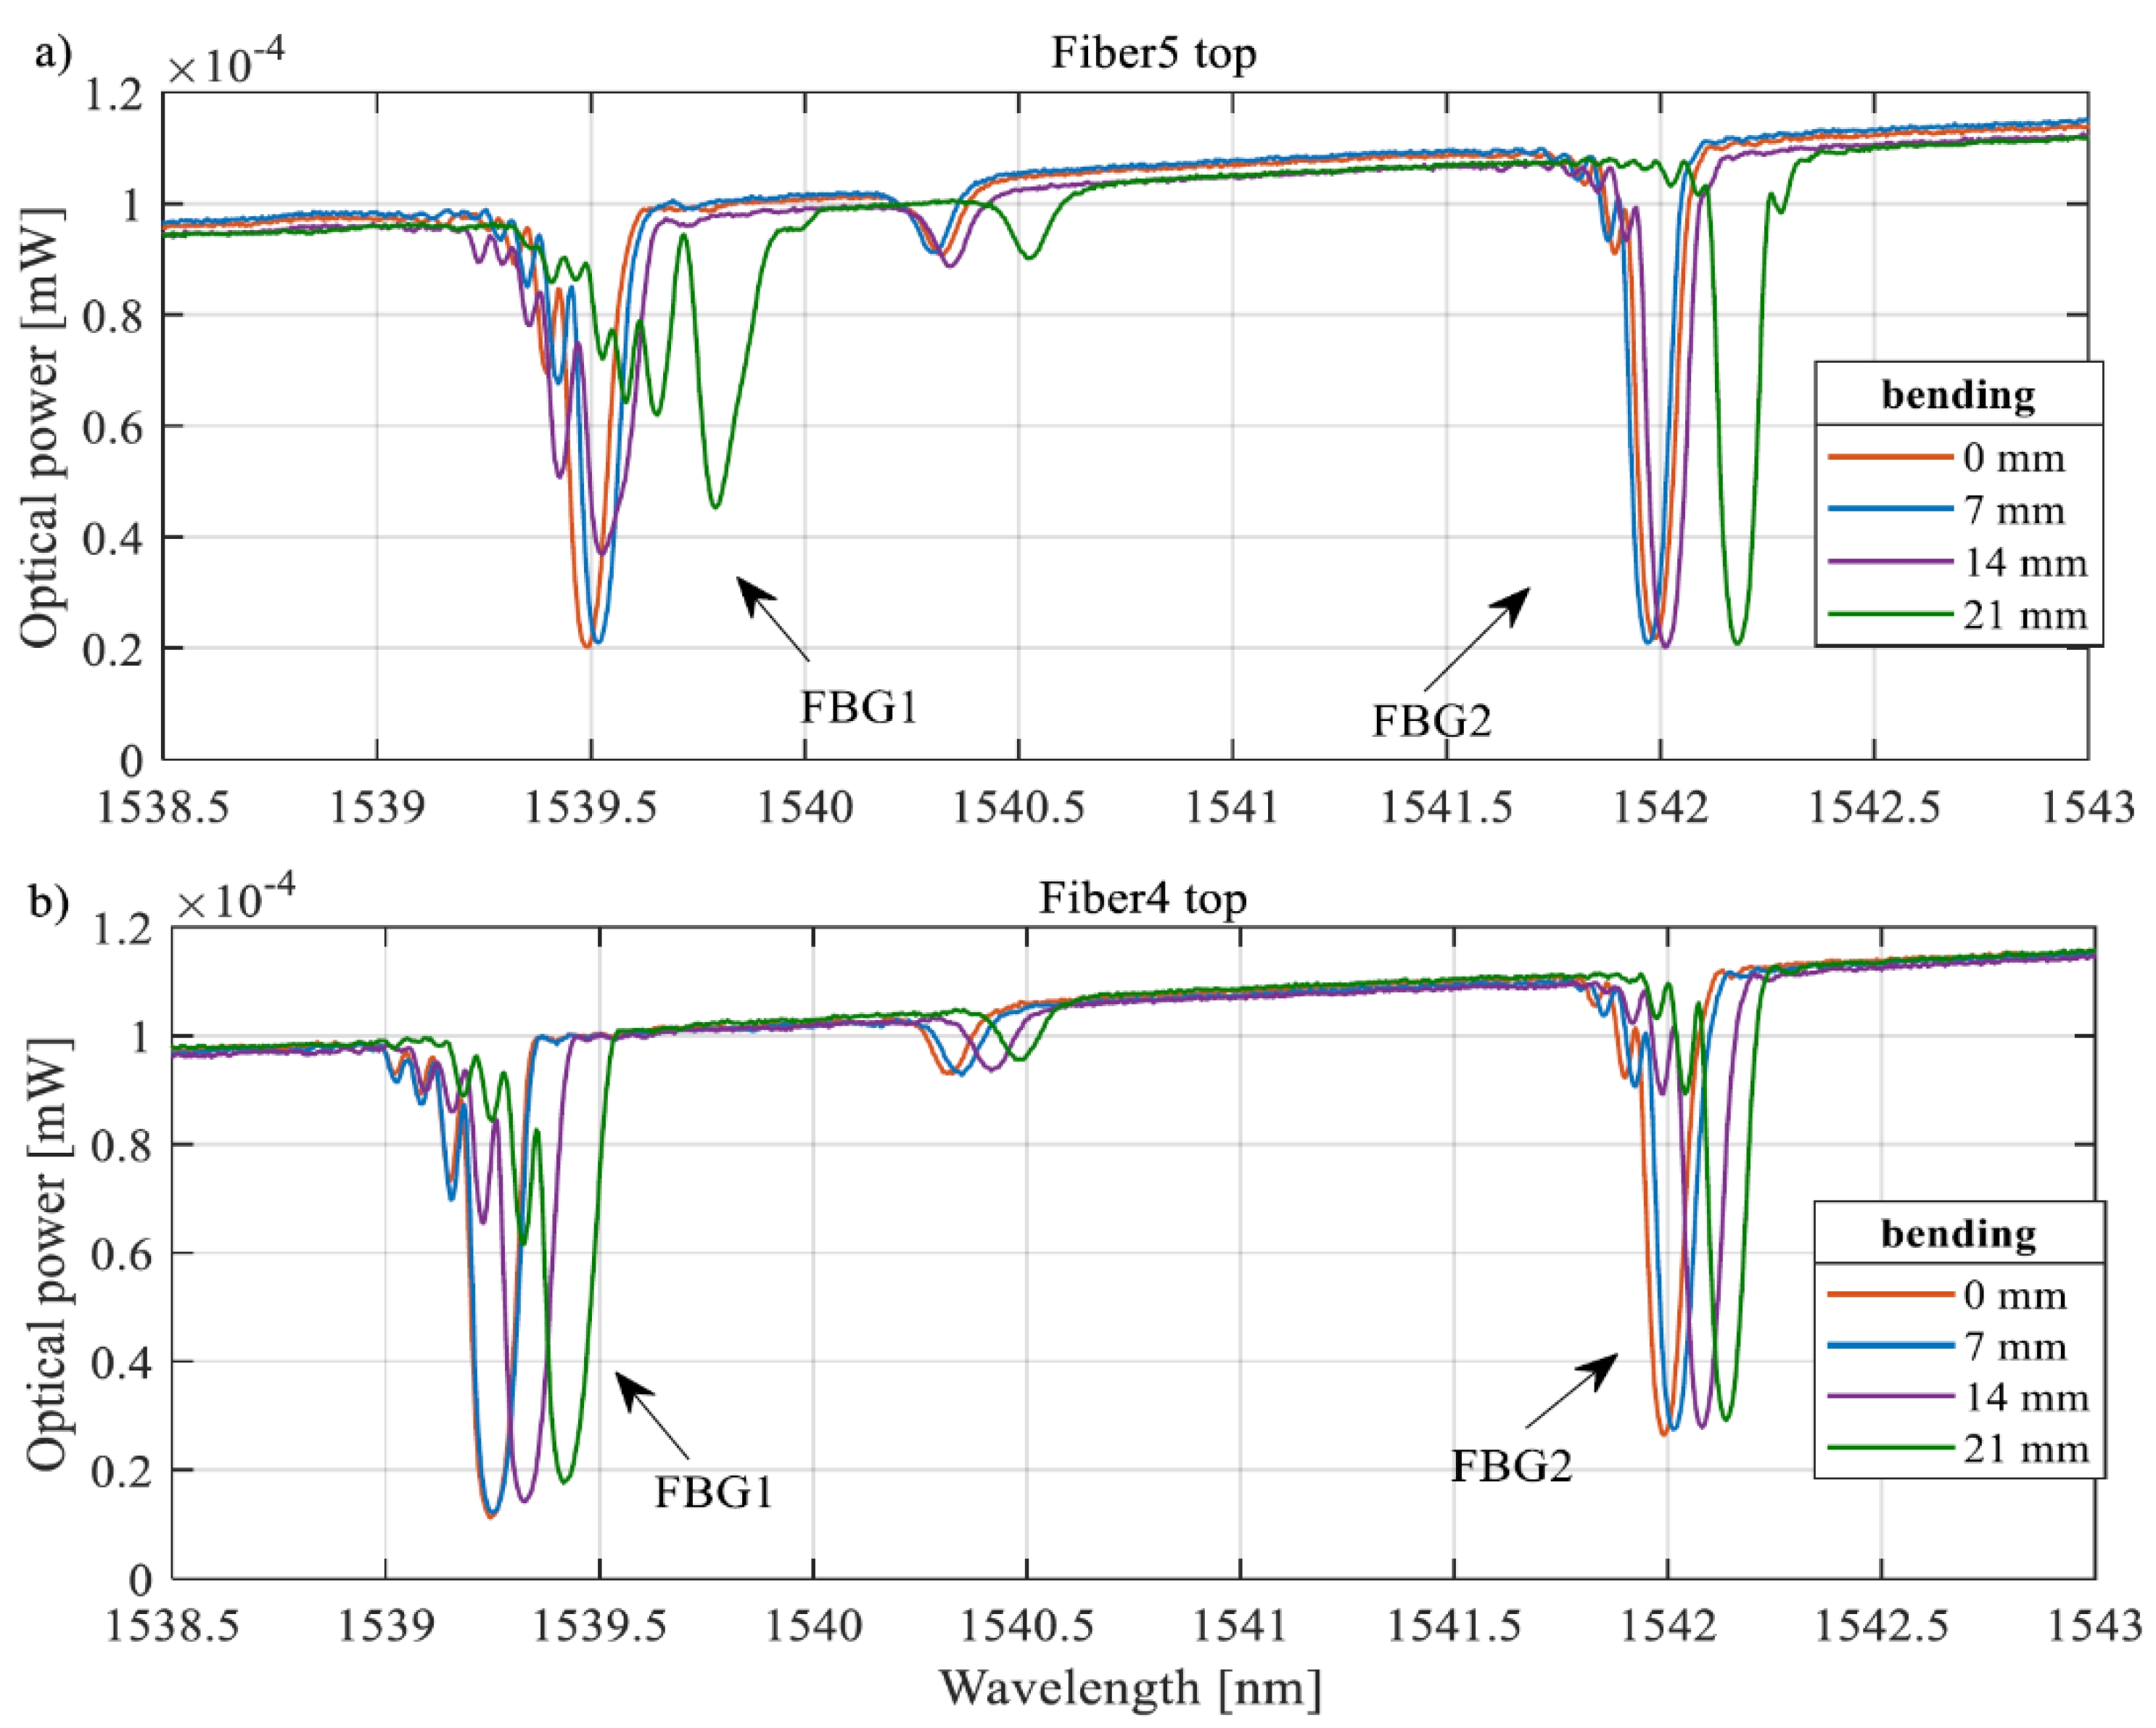
Table 2.
Results of changes in the Bragg wavelength of gratings embedded in the internal structure of the composite plate along the long side of the plate.
Table 2.
Results of changes in the Bragg wavelength of gratings embedded in the internal structure of the composite plate along the long side of the plate.
| Bending | Difference in wavelengths when bending a plate | ||||||||
|---|---|---|---|---|---|---|---|---|---|
| Fiber 1 | Fiber 2 | Fiber 3 | |||||||
| [mm] | FBG1 | FBG2 | FBG3 | FBG 1 | FBG 2 | FBG 3 | FBG 1 | FBG 2 | FBG3 |
| [nm] | [nm] | [nm] | [nm] | [nm] | [nm] | [nm] | [nm] | [nm] | |
| 0 | 0 | 0 | 0.000 | 0 | 0 | 0 | 0 | 0 | 0 |
| 2 | 0 | 0.02 | 0.015 | 0.006 | 0.005 | 0.01 | 0.015 | 0.035 | 0.035 |
| 4 | 0 | 0.02 | 0.020 | ̶ 0.002 | 0.02 | 0.02 | 0.025 | 0.06 | 0.095 |
| 6 | ̶ 0.02 | 0.01 | 0.030 | ̶ 0.002 | 0.03 | 0.06 | 0.055 | 0.08 | 0.125 |
| 8 | ̶ 0.05 | ̶ 0.01 | 0.040 | ̶ 0.012 | 0.05 | 0.08 | 0.075 | 0.105 | 0.155 |
| 10 | ̶ 0.08 | ̶ 0.03 | 0.060 | ̶ 0.025 | 0.08 | 0.13 | 0.095 | 0.125 | 0.175 |
| 12 | ̶ 0.12 | ̶ 0.04 | 0.090 | ̶ 0.034 | 0.1 | 0.17 | 0.125 | 0.15 | 0.205 |
| 14 | ̶ 0.16 | ̶ 0.06 | 0.100 | ̶ 0.052 | 0.135 | 0.23 | 0.155 | 0.18 | 0.225 |
| 16 | ̶ 0.215 | ̶ 0.08 | 0.110 | ̶ 0.054 | 0.18 | 0.29 | 0.175 | 0.21 | 0.245 |
| 18 | ̶ 0.27 | ̶ 0.08 | 0.120 | ̶ 0.081 | 0.22 | 0.37 | 0.205 | 0.24 | 0.265 |
| 20 | ̶ 0.37 | ̶ 0.08 | 0.160 | ̶ 0.146 | 0.25 | 0.45 | 0.215 | 0.28 | 0.295 |
| 22 | ̶ 0.43 | ̶ 0.09 | 0.200 | ̶ 0.196 | 0.25 | 0.49 | 0.2 | 0.3 | 0.315 |
Table 3.
Summary of relative elongation of the control plate along the length of the Bragg gratings embedded in the composite plate along the long side of the plate.
Table 3.
Summary of relative elongation of the control plate along the length of the Bragg gratings embedded in the composite plate along the long side of the plate.
| Bending | Difference in wavelengths when bending a plate | ||||||||
|---|---|---|---|---|---|---|---|---|---|
| Fiber 1 | Fiber 2 | Fiber 3 | |||||||
| [mm] | FBG1 | FBG2 | FBG3 | FBG1 | FBG2 | FBG3 | FBG1 | FBG2 | FBG3 |
| [µm] | [µm] | [µm] | [µm] | [µm] | [µm] | [µm] | [µm] | [µm] | |
| 0 | 0 | 0 | 0.000 | 0 | 0 | 0 | 0 | 0 | 0 |
| 2 | 0 | 0.02 | 0.015 | 0.006 | 0.005 | 0.01 | 0.015 | 0.035 | 0.035 |
| 4 | 0 | 0.02 | 0.020 | ̶ 0.002 | 0.02 | 0.02 | 0.025 | 0.06 | 0.095 |
| 6 | ̶ 0.02 | 0.01 | 0.030 | ̶ 0.002 | 0.03 | 0.06 | 0.055 | 0.08 | 0.125 |
| 8 | ̶ 0.05 | ̶ 0.01 | 0.040 | ̶ 0.012 | 0.05 | 0.08 | 0.075 | 0.105 | 0.155 |
| 10 | ̶ 0.08 | ̶ 0.03 | 0.060 | ̶ 0.025 | 0.08 | 0.13 | 0.095 | 0.125 | 0.175 |
| 12 | ̶ 0.12 | ̶ 0.04 | 0.090 | ̶ 0.034 | 0.1 | 0.17 | 0.125 | 0.15 | 0.205 |
| 14 | ̶ 0.16 | ̶ 0.06 | 0.100 | ̶ 0.052 | 0.135 | 0.23 | 0.155 | 0.18 | 0.225 |
| 16 | ̶ 0.215 | ̶ 0.08 | 0.110 | ̶ 0.054 | 0.18 | 0.29 | 0.175 | 0.21 | 0.245 |
| 18 | ̶ 0.27 | ̶ 0.08 | 0.120 | ̶ 0.081 | 0.22 | 0.37 | 0.205 | 0.24 | 0.265 |
| 20 | ̶ 0.37 | ̶ 0.08 | 0.160 | ̶ 0.146 | 0.25 | 0.45 | 0.215 | 0.28 | 0.295 |
| 22 | ̶ 0.43 | ̶ 0.09 | 0.200 | ̶ 0.196 | 0.25 | 0.49 | 0.2 | 0.3 | 0.315 |
Disclaimer/Publisher’s Note: The statements, opinions and data contained in all publications are solely those of the individual author(s) and contributor(s) and not of MDPI and/or the editor(s). MDPI and/or the editor(s) disclaim responsibility for any injury to people or property resulting from any ideas, methods, instructions or products referred to in the content. |
© 2025 by the authors. Licensee MDPI, Basel, Switzerland. This article is an open access article distributed under the terms and conditions of the Creative Commons Attribution (CC BY) license (http://creativecommons.org/licenses/by/4.0/).
Copyright: This open access article is published under a Creative Commons CC BY 4.0 license, which permit the free download, distribution, and reuse, provided that the author and preprint are cited in any reuse.


