
Submitted:
22 November 2024
Posted:
25 November 2024
You are already at the latest version
Abstract
Investigating the impact of textile preforms on the mechanical characteristics of composite plates made of glass textile structures and epoxy resin using compression molding technique was the goal of this work. An epoxy resin system served as the matrix, and various woven (plain, twill, basket), nonwoven (mat), and unidirectional (UD) textile structures made from E-glass fibers were employed as reinforcement elements. Compression molding of pre-impregnated semi-finished textile materials (prepregs) was used to create the composites. Fiber pull-out and delamination are the main challenges in the manufacturing of polymer textile composites. As a result, the most crucial aspects of producing polymer textile composites were making ensuring that the textile structures were well-impregnated with resin into the prepreg and that the layers in the composites had a good interface. The generated composites were then subjected to micro/macro examinations using a SEM microscope and DSC thermal analysis. Flexural strength and modulus of elasticity were measured using a three-point flexural method to assess the mechanical behavior of all manufactured textile composites. The performance of polymer textile composite materials is directly influenced by the type of textile structures used as a reinforcing composite constituent, according to the results obtained.
Keywords:
textile structure
; polymer composite
; thermal analysis
; mechanical properties
1. Introduction
The textile reinforcement in polymer composite materials plays a crucial role in determining the mechanical behavior of the composite. The structure, type, and orientation of the textile reinforcement can significantly influence properties such as strength, stiffness, toughness, fatigue resistance, and failure mechanisms. Below is an in-depth exploration of how different textile reinforcements impact the mechanical behavior of polymer composites [1,2,3,4,5,6,7,8]. Textile reinforcements for polymer composites typically come in several forms, including: woven fabrics (comprising two sets of yarns -warp and weft interlaced at right angles), knitted fabrics (made by interlocking yarns in a loop formation, which provides flexibility), nonwoven fabrics (these are created by bonding fibers together without weaving or knitting) and braided fabrics (yarns are interlaced in a braid-like structure, providing good through-thickness properties). As a result of their specific geometry and characteristics they have different behavior and can be used in various applications [9,10,11,12,13]. Each type of textile reinforcement offers distinct benefits and compromises: woven fabrics are typically chosen for their high stiffness, knitted fabrics for their flexibility, nonwovens for their impact resistance, and braided fabrics for their superior strength through the thickness.
The mechanical strength of textile reinforced polymer composites is primarily determined by the fiber properties (e.g., tensile strength, fiber diameter) and the fiber-matrix interaction. The textile reinforcement orientation plays a key role: unidirectional (UD) fabrics have fibers oriented in one direction, providing maximum strength in that direction, however, the composite will be weak in the transverse direction. Woven textiles offer strength in both directions (warp and weft), but their strength is generally lower than that of unidirectional textiles because of the inherent crimp (bending) in the fibers due to the weaving process. Braided textiles provide balanced strength in multiple directions, making them suitable for applications requiring isotropic strength characteristics (equal strength in all directions). Stiffness (measured by the modulus of elasticity) is influenced by the fiber orientation and the volume fraction of reinforcement. Unidirectional fibers typically result in higher stiffness in the fiber direction. However, woven fabrics can offer more balanced stiffness in multiple directions, making them more isotropic but typically less stiff compared to unidirectional composites [14,15,16,17,18,19,20]. In composite materials, fatigue failure often occurs due to repeated cyclic loading, which leads to matrix cracking and delamination. Textile reinforcements can influence the fatigue resistance of the composite. Woven and braided fabrics can help delay fatigue failure because they provide more resistance to crack propagation due to the interlocking nature of the fibers, so unidirectional fabrics are more susceptible to fatigue damage in the transverse direction since the matrix is more likely to experience delamination when subjected to cyclic loads [16,17,18,19,20,21,22]. The development of textile composite, their design and manufacturing technologies is one of the most important achievements in the engineering of materials [14]. The outstanding achievements in the field of computer-aided design and manufacturing have facilitated the adaptation of many traditional textile processes to create 2-D and 3-D textile structures at low production costs. Textile composites have numerous applications across various industries, such as aerospace industry, automotive industry, railway, marine industry, commercial mechanical engineering applications, civil engineering, and buildings, protective and sports equipment etc. This is due to the outstanding physical, thermal, and favorable mechanical properties, particularly light weight, high stiffness and strength, good fatigue resistance, excellent corrosion resistance and dimensional stability [16,17,18,19,20,21,22,23,24,25,26,27,28,29,30,31,32,33]. Chowdhury at. all in paper [34] give review and detailed information for different textile woven and nonwoven textile structure, also discussions, including the fabrication processes, relationship between fabric structure and composite properties, and morphological characteristics encompassing the current state-of-the-art in woven fabrics for composite reinforcement.
In many final composite products for different applications, fabrics are first produced in the form of prepregs for better resin control and better impregnation - soaking of the fibers in order to have better mechanical characteristics. Pre-impregnated semi-finished textile products (prepregs) are a type of composite material that combines reinforcement fibers (such as glass, carbon, or aramid) with a resin matrix (usually epoxy, polyester, or phenolic) that has already been impregnated into the fibers. The term “prepreg” is short for “pre-impregnated”, indicating that the fibers have already been impregnated with the resin before being used in manufacturing composite structures. Glass prepregs are used in composite materials for their excellent mechanical properties, ease of processing, and versatility in various industries. They are particularly valued in applications where high strength, durability, lightweight, and precision are critical, including aerospace, automotive, wind energy, and sporting goods, among others [35,36,37,38,39,40,41,42,43,44,45,46,47].
In this paper will be presents the influence of different textile preforms on the mechanical behavior of E-glass/epoxy composite plates. For that purpose, different types of textile structures from E -glass fibers were used as a reinforcing component in the composite materials. From all textiles preforms, prepregs with suitable characteristics were produced and subsequently processed into composite plates by using compression molding technology. Flexural strength and stiffness of manufactured samples were determined by using a three-point bending method. The resin content and baking method are the same for all products with different textile structures. The resulting composite structures meet the requirements for modern advanced materials that simultaneously provide excellent strength and low weight and that can be used as load-bearing structural parts in various industries. The results will give the selection of the textile preforms who is an important prerequisite for design and production of new high-performance textile-based composites for a wide range of applications.
2. Materials and Methods
2.1. Materials
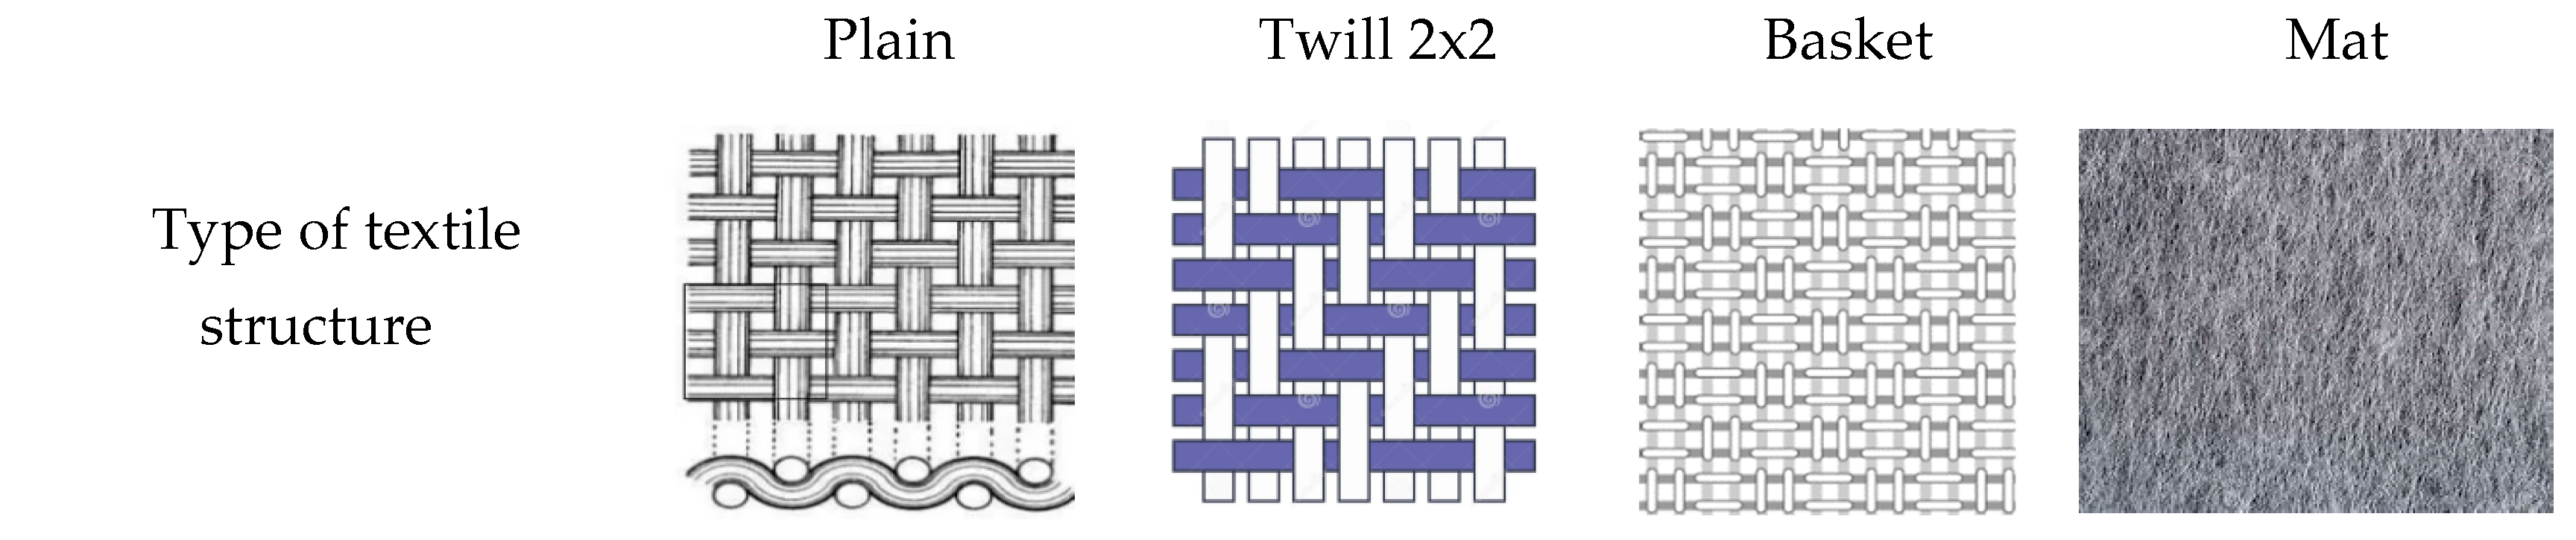
In this study, different textile structures (unidirectional, woven and nonwoven) from E -glass fibers as a reinforcement component and epoxy resin system as matrix were used for production of the polymer composites. Three types of woven fabrics with different weave patterns: plain, twill and basket and nonwoven (mat) material were used with areal mass for all of approximately 325 ± 15 g/m² and thickness of around 0.32 ± 0.05 mm. The physical characteristics and assignation of the textile structures (woven and non-woven) are summarized in Table 1 and the characteristics of components of epoxy resin system are presented in Table 2.
The structural characteristics of the woven fabrics have a significant influence on the appearance, durability, and behavior of woven fabrics in different applications. They are mostly determined by the type of yarns, as well as by the process parameters of the weaving machines. The key structural characteristics of woven fabrics are the type of weave structure, yarn type and count, yarn density, fabric weight and thickness etc. [34,36]. Electron microphotographs of the structure of the used E-glass woven fabrics were made using a binocular microscope ZOOM 645 and a scanning electron microscope type VEGA3 LMU from the Tescan company. These photos were taken to observe the differences in the weave structure of the applied woven fabrics, that is, the way of interweaving of the weft and warp yarns. Additionally, tensile strength and elongation at break in the longitudinal and transverse directions were determined according to the ASTM D 5035 standard [35]. A Schenck Universal Tensile Strength Testing Machine was used for this test. The tensile strength of woven fabrics made of the most important mechanical properties makes them superior for many industrial applications compared to knitted and nonwoven textile materials. For this purpose, from all three types of woven fabrics, three samples (strips) with dimensions (200 x 48) mm, were cut in the weft and warp direction. The samples were fixed in the test machine with the help of 60 mm wide clamps, (Figure 1).
From all woven fabrics, prepreg with suitable characteristics were produced in the laboratories of company Laminati Kom D.O.O. Prilep by using of the impregnation machine (Figure 1). Nonwoven textile structures were hand impregnated into prepreg and UD glass prepreg were used as a commercial product SIGRAPREG® by SGL company. Making a good prepreg requires precise control and a good understanding of the resin flow and how it behaves under the influence of heat or pressure being added in the cured state [24]. The basic characteristics for all produced prepregs are summarized in Table 3 and in the same table are presented the characteristics of the commercial UD prepreg.
2.2. Preparation of Composite Plates
From all five different prepregs, the laminate panels (composite plates) were produced by using compression molding technology. The samples were produced in the laboratories at the company Laminati Kom d.o.o. in Prilep. The laminate panels with dimensions 250 mm x 200 mm were produced by stacking of 10 prepreg layers from all five different types, wrapped with fireproof paper and carefully placed in the open mold press machines (Figure 3). The laminates were performed with specific pressure (from machine) of 14 kg/cm² (30 bar) for all five samples. But the compression temperature for the samples from produced prepregs (I, II, III and IV) was 80 °С for curing of 1h and 110 °C for post curing of 1h. To produce laminate samples from commercial UD prepreg the compression temperature was 90 °C for curing of 1h and 120 °C for post curing of 1h, based on the recommendation from its manufacturer (Table 4). After the press cycle, the composite plates are left to stand for a few hours to allow the resin mixture to fully combine and dry out, ensuring complete curing. Then, from all five specimens (composite plates) the test specimens were cut in MD and CD direction, according to testing standard for mechanical characterization.
2.3. Content of the Constituents and Voids in Manufacture Plates
The content of the constituents in manufacture plates was determined according to ASTM D3171 standard [36], while the content of voids was tested following ASTM D792 and ASTM D2734 standards [37,38]. Determining the content of the constituent’s components is significant from the aspect of modeling material properties (mechanical, physical, thermal) of the composite structure which depends on the reinforcing component and the matrix. Assessing the constituent content is crucial for evaluating the quality of the fabricated material. This helps ensure that the processes used during fabrication are producing materials that meet desired standards. The percentage of voids in the material is an important factor, as high void content can negatively affect mechanical properties. High void contents often lead to lower fatigue resistance, greater susceptibility to moisture and atmospheric influences and increased variation in strength [42]. Therefore, measuring void content serves as a critical quality indicator for composite materials.
2.4. Mechanical Characterization of the Manufacture Plates
Flexural properties of cut composite samples from manufacture plates (L-I, L-II, L-III, L-IV and L-V) were determined with help of three-point bending test in accordance with the procedure described in the standard EN ISO 14125 [39]. For that purpose, computer controlled universal testing machine (UTM) Hydraulic press, SCHENCK- Hidrauls PSB with maximal load of 250 kN, constant crosshead speed of 5 mm/min and span-to-depth ratio of 16:1 was used. The standard dimensions of the tested samples according to EN ISO 14125 are i.e. (15 x 60 x sample thickness) mm. The rectangular samples were cut in two orientations: machine direction (MD) and cross direction (CD) and were tested under the same conditions to ensure reproducibility. Dimensions (length, width, and thickness) of each specimen were measured with the help of a micrometer instrument. Flexural strength of prepared composite specimens was evaluated using a Universal Testing Machine (UTM), which is illustrated in Figure 4. Load and displacement were recorded by an automatic data acquisition system for each sample. A minimum of five reproducible tests were performed for each sample at room temperature.
The flexural strength flexural modulus of elasticity () and flexural strain () of the composite samples were calculated using Equations (1)–(3).
where:
- applied load to the specimen (N),
- width of the specimen (mm),
- thickness of the specimen (mm),
- length of the span between the supports (mm),
where:
- slope of the load (ΔF) versus deflection (Δs) curve, which represents the rate of change of load with respect to deflection (N/mm),
– maximum deflection of the specimen at the center (mm).
2.5. Differential Scanning Calorimeters (DSC) and Tests
In order to conclude that the degree of polymerization is complete of the epoxy resin system in all samples, DSC analysis of all composite plates was performed. A sample in a powder form was taken from each plate and DSC analyses were performed on the DSC Q2000 (TA Instruments) with rate 40 K/min, in accordance with the procedure described in the standard ISO 11357-1 [40]. DSC enables the measurements of the transition such as the glass transition - measure temperatures and heat flows associated with thermal transitions in a material.
2.6. Optical and Scanning Electron Microscopy
Fracture surface of the composites was studied using binocular microscope ZOOM 645 and a scanning electron microscope type VEGA3 LMU from the Tescan at the laboratories of Goce Delcev University in Stip. For the SEM analyses, the fracture surfaces of the investigated samples were coated with gold by sputter.
3. Results and Discussion
3.1. Structural and Mechanical Characteristics of E- Glass Woven Fabrics
The electron micrographs presented in Figure 6 for test samples I, II, and III at different magnifications reveal distinct differences in the interweaving of warp and weft yarns in the woven glass fabrics. In the first and second analyzed samples, two diverse types of weaves (plain and twill 2/2 Z) are represented, which belong to the group of basic types of interlacing, while in the third sample we find basket 2/2 weave structure (interlacing derived from plain weave).
From the micrographs for simple I, it is clear that the interlacing of warp and weft yarns is in a 1:1 ratio, where each warp yarn passes over one weft yarn and then under the next, creating a stable and balanced structure. This weave structure provides a firm and strong fabric with uniform appearance of the fabric. The interlocking nature of the plain weave provides good dimensional stability and minimizes fabric distortion during handling and processing. The tight weave structure offers a relatively smooth surface, which is important for ensuring a good bond between the fabric and the resin in composite applications. However, it has limitations in terms of conformability, resin absorption, and flexibility, which can affect its suitability for certain high-performance or complex composite applications. Due to its structure, plain weave fabrics can be less flexible and harder to conform to complex shapes or curved surfaces compared to other weaves like twill or satin. This can result in wrinkles or gaps when trying to mold the fabric into intricate designs. The tight, closely packed nature of the plain weave results in lower porosity, which can limit the resin flow and wet-out. This may lead to issues in achieving a complete and uniform impregnation of the fabric during composite fabrication, potentially creating voids or weak areas [48]. The electron micrographs for sample II, represent a 2/2 Z twill weave for which there is the characteristic connection of the warp and weft yarns, whereby Z diagonals are formed on the face of the fabric. In this structure, each warp yarn passes over two weft yarns and then under two, with the interlacing steps shifting by one yarn in each successive row, creating the diagonal pattern. The 2/2 twill weave offers a fabric with good drapability and there is a certain level of flexibility due to the fewer interlacing points compared to a plain weave. The diagonal structure also makes twill fabrics more resistant to wrinkles and abrasion. This type of weave is particularly advantageous for complex-shaped molds or curved surfaces, as the fabric can easily conform to intricate contours without wrinkling or bunching. The looser structure of twill weave (compared to plain weave) allows for better resin flow and impregnation.
The micrograph of basket 2/2 weave is represented on Figure 6c) and it is noticed that two warp threads pass together over two weft threads in a repeating pattern, giving a structure similar to a plain weave but with a more relaxed, bulkier texture. It’s sometimes called a “double plain weave” due to its interlacing pattern. In this type of weave, the empty spaces between the warps and weft yarns are clearly visible and this porosity will result in better soaking and infiltration of the resin system into the fabric itself.
The structural characteristics of the applied E-glass woven fabrics were determined using standard methods ASTM D3776, BS EN 1049-2 [49,50]. The analysis shows that each type of E-glass woven fabric has a higher density in the warp direction, with a greater number of yarns per centimeter compared to the weft direction. Both, the plain (Sample I) and twill (Sample II) weaves have similar warp densities (8 ± 1 ends/cm), whereas the basket (Sample III) weave has a slightly lower warp density (7 ± 1 ends/cm). This reduced density in the basket weave may be attributed to its distinct interlacing pattern, which is generally looser than that of plain and twill weaves. Sample II has a slightly higher weft count (7 ± 1 ends/cm) compared to the other two weaves (plain and basket), both of which have a weft count of 6 ± 1 ends/cm. This difference in weft count may influence the fabric’s flexibility and drapability, whereby Sample II potentially offers better pliability due to its higher weft count. These structural variations impact on mechanical properties, as plain and twill weaves, with their denser and more uniform configurations, typically provide higher strength and stability. In contrast, the basket weave’s lower warp density and looser structure might offer increased flexibility but with the potential of reducing its strength.
Figure 7 presents the obtained values for tensile strength (N) and tensile deformation (%) of the analyzed woven fabrics, determined according to the ASTM D 5035 standard [35]. The results are the mean values of three measurements of the tensile strength in the warp (longitudinal) direction and the weft (transverse) direction.
From the obtained results (Figure 7) it can be concluded that the E-glass fabric in plain interweaving (Sample I) has the highest resistance to tearing forces by warp and weft (3079 N and 2333,3 N). This is also understandable because this type of weave is characterized by the strongest interconnection of the warp and weft yarns. The tensile deformation in warp direction (4.7%) is moderate, indicating that while the fabric is strong, it is not highly flexible under tension. The tensile strength of the twill fabric (Sample II) in the longitudinal direction is about 20% lower than the tensile strength of the plain fabric, but about 18% higher than the tensile strength of the basket fabric (Sample III). Also, the twill fabric is distinguished by a lower tensile strength in the transverse direction (by about 35 %) compared to the tensile strength of the plain-woven fabric (Sample I). The tensile deformation in both directions (2.8% and 3%) is lower as well, indicating that the material is stiffer and less flexible under tension compared to the plain weave. Twill’s diagonal structure might improve its ability to distribute stress but results in a somewhat less efficient load-bearing capacity compared to plain weave. The sample III in the basket weave shows the lowest tensile strength in both directions (2008.3 N longitudinal, 1385.7 N transverse), likely due to the weave’s inherent structure. The basket weave, known for its balanced but more open structure, allows for larger interspaces between the yarns, which reduces the compactness and, consequently, the tensile resistance compared to denser weaves. The deformation in warp direction (2.7%) is also relatively low, suggesting that while the material is somewhat strong, it does not elongate significantly before failure. However, the tensile deformation in the weft direction (5.0%) is the highest, indicating that the fabric is more flexible and can elongate re before breaking, which is typical for basket weaves that offer more flexibility. The plain weave (Sample I) shows the highest tensile strength in the warp direction, followed by the twill weave (Sample II), and the basket weave (Sample III) has the lowest. This trend suggests that the warp count plays a significant role in strength, and the plain weave’s structure provides the most resistance to tensile forces. The tensile strength in the weft direction shows a similar pattern, with the plain weave being the strongest, followed by the twill, and the basket weave showing the weakest strength.
Based on the obtained results, it can be concluded that all analyzed woven fabrics exhibit anisotropic properties in terms of tensile strength, with a higher tensile strength in the longitudinal (warp) direction than in the transverse (weft) direction. The plain weave shows the highest tensile deformation (4.7%) in the warp direction, indicating it is more capable of stretching before failure. Twill and basket weaves have lower deformation, suggesting they are stiffer under tension, with the basket weave showing the least deformation. Interestingly, the basket weave has the highest deformation in the weft direction (5.0%), suggesting it is more flexible compared to the other weaves. The plain and twill weaves are less flexible in the weft direction (3.8% and 3%).
Nonwovens as a textile structure are made from a collection of asymmetrically ordered fibers or chopped yarns that have been stiffened by thermal, chemical, or mechanical bonding techniques. The composition and structure of nonwoven textiles determine their mechanical and structural qualities. The distinctive characteristics of a nonwoven are determined by the type of bonding, the type of fiber, and the manufacturing conditions; this is a different area of study. This textile structure isn’t weave, which is characterized by some interconnection of the warp and weft yarns, and because of that we didn’t do some structural and mechanical testing. However, the fiber composition and any chemical binders, fillers, or finishes that are applied to or in between the fabric’s fibers determine the structural and mechanical behavior of nonwoven textile constructions. In this research, only for the woven textile constructions, we made some examination of structural and mechanical characteristics.
This study examined the effects of UD prepreg, woven prepreg, and nonwoven prepreg on the mechanical and physical characteristics of composite plates.
3.3. Constituent Content and Void Content of the Composite Plates
The constituent content is crucial for evaluating the quality of the fabricated material. The results from Table 5 show that samples I to III demonstrate a balanced composition between glass woven fabrics and epoxy resin, with a reinforcing component mass ratio ranging from 67% to 70% and epoxy resin content at 30% to 33%. This ratio is promising, as a higher glass fabric content contributes significantly to mechanical strength, stiffness, and overall structural performance. Meanwhile, the resin percentage is sufficient to ensure effective bonding, stability, and load transfer within the matrix.
Actual density of the composite was find out on the basis of Archimedes principle. The difference between the theoretical density and actual density was found up to a maximum value 5.28% which represents the amount of void content present in the developed composites as shown in Table 1. Suitability of the processing method can be justified with the help of low void percentage present in the composites.
The fiber volume fraction, or the percentage of the fiber reinforcement into the composite, also affects the mechanical performance of the composite. Composites with higher fiber volume fractions tend to be stronger and stiffer, but as fiber content increases, processability and cost may become more difficult. According to standard ASTM D 2584 [51], were determine constituent content of the composite plates. Using the resin weight percentage and reinforcement weight percentage data found in the composite, we have calculated the theoretical density of a composite as follows:
where:
= theoretical composite density,
= resin in composite, weight %,
= density of resin,
= reinforcement in composite, weight %, and
= density of reinforcement.
The Archimedes principle was used to determine the measured composite density in accordance with ASTM D792 and ASTM D2734 standards [37,38]. The standard difference between the theoretical and measured composite density was used to determine the void content of the composite plates:
where:
= void content, volume %,
= theoretical composite density, and
= measured composite density.
Constituent content and void content of the composite plates (L-I, L-II, L-III, L-IV and L-V) are given in Table 5.
When assessing the quality of the manufactured material, the constituent content is essential. With a reinforcing component mass ratio ranging from 60,7% to 70% and an epoxy resin content of 30% to 39%, samples L-I through L-IV exhibit a balanced composition between glass woven fabrics and epoxy resin, according to the results in Table 5. This ratio is encouraging because mechanical strength, stiffness, and overall structural performance are all much enhanced by a larger glass fabric percentage. In the meantime, there is enough resin in the matrix to guarantee good bonding, stability, and load transfer. The mass ratio of the reinforcing component in composite samples reinforced with basket fabric is, in fact, the smallest at 67% due to the open structure of the fabric. Because of the wider inter-yarn spacing in the basket weave, more resin can infiltrate, increasing the resin concentration in comparison to the reinforcing fibers. The unidirectional (UD) reinforced composite samples (L-V) have a composition that is well-balanced. The UD structure has a remarkably high mass ratio of 76% for the reinforcing component and 23% for epoxy resin. Most likely, the fiber content in sample V results from the resin leaking out in only one direction during the compression process, allowing the resin to flow. As the distance between the two yarn systems increases, the overall mass percentage of the reinforcing component decreases [22,23]. In this instance, the decreased load-bearing fiber content may result in a loss in mechanical qualities such as flexural strength (Part 3.5 from this publication). Given that denser weaves typically offer higher fiber content and, as a result, stronger mechanical qualities, this realization emphasizes the significance of choosing the right weave structure in composite construction. Mat reinforced samples had the highest void percentage (5,28%), while basket fabric reinforced samples had the second highest proportion (0,85%). With the exception of samples L-IV, nearly all of these slabs met the criterion because the permissible percentage of voids in them was up to 3%.
3.4. Thermal Analysis (DSC) of the Composite Plates
Two factors may contribute to the accumulation of residual stress during the curing process of composite production: matrix and fiber shrinkage because of post-curing temperature reductions or contraction of matrix resin as a result of cross-link polymerization during curing. Damage initiation and progression are impacted by this residual stress, which ultimately leads to composite failure [41]. The mechanical performance of the final composite is also influenced by temperature and, thus, the degree of cure distributions [42]. That’s why a thermal analysis of all produced plates ( L-I, L-II, L-III, L-IV and L-V) was made to see how the curing process was completed.
Samples (in powder form) were extracted from each plate for DSC examination. The testing was conducted using TA DSC equipment that has a heating rate of 40 K/min. The curves obtained from the testing are shown in Figure 8.
The polymerization is complete, according to the diagrams in all samples, and the glass transition temperature range is from 106°C to 128°C. Compared to the other samples (L-I, L-II, L-III, and L-IV), where the curing temperature and time were the same, sample L-V has a higher Tg value because we used a higher curing temperature.
3.5. Static Mechanical Analysis - Flexural Strength and Modulus
Figure 9 displays the force-displacement curves for a few of the tested samples (samples L-V) that were acquired from the universal testing equipment. For the others tested samples the resulting curves have the same looks, i.e they increase linearly until they reach a maximum endurance strength, after which they decline until the test sample is completely destroyed.
Every curve achieves a maximum force known as the maximum endurance strength, which shows the highest load the material can bear before failing. When the maximum load is reached, the curves begin to decline, signifying a reduction in load-carrying ability. This process continues until the sample failure entirely. The flexural strength (), flexural modulus (), and flexural strain () for each group of composite plates were determined from the force-displacement curves with the use of equations 1, 2, and 3 (see Part 2.4 of this paper). The overall results (average value from three specimens for each of five type of composite simples) for the flexural properties of all tested composite simples are presented in Table 6. For improved analysis and comparison, flexural strength and modulus for all composite samples in both directions are also displayed in Figure 10 and Figure 11.
The composite samples reinforced with unidirectional prepregs (L-V) have the highest resistance to bending forces in the longitudinal direction (MD) and the lowest in the transversal direction (CD), according to a comparative analysis of the results obtained for the flexural properties of all sample composite plates. Namely, the test samples L-V-MD have about ten times higher flexural strength than the same sample tested in the transversal direction (L-V-CD). Because of the UD structure, the mechanical characteristics of these samples are unbalanced between the fiber direction and the transverse direction. The UD prepreg has advantages because of its non-weaving process, and for their application into composites, there is a possibility of utilizing the high load-bearing capacity of the fibers when they are loaded in their direction.
However, the woven prepregs (plain, twill, and basket) in the composite laminates L-I, L-II, and L-III exhibit balanced characteristics in both directions. Additionally, those samples exhibit comparable behavior under bending force loads. Although the composite samples reinforced with plain and basket fabrics have comparable flexural strengths, the samples L-II have a flexural strength that is almost 20% higher than them. Non-woven prepreg reinforced composite samples (L-IV) exhibit the least resistance to bending pressures in both longitudinal and transverse directions. Since mat reinforcements usually consist of randomly oriented fibers, which can result in lower directional strength compared to unidirectional or woven fibers, this reduced stress could be an indication of structural differences. The flexural properties of the composites from non-woven fabrics are strongly influenced by fiber content and fabric direction.
Woven fabric-reinforced composite structures offer certain advantages over conventional unidirectional laminates as well, particularly in applications where structural performance and complex shapes are critical. Using fabric-reinforced composites, thinner laminates and structures with complex geometry can be produced. These composites also have higher impact resistance, stiffness and dimensional stability compared to unidirectional laminates [23,24]. Their adaptability to complex geometries also makes them a preferred choice in industries like aerospace and automotive, where optimizing material efficiency and structural integrity is essential.
During flexural testing, the outer layers of the composites endure greater loads compared to the middle part. Thus, flexural strength and modulus are determined by the properties of these outer layers. Under flexural loading, one side of the composite faces tensile effect while the other side undergoes compressive load [42]. Zhang [43] investigated the effect of tensile-compression direction by applying flexural testing on unsymmetrical composites from two opposite sides. The asymmetric composites consist of a glass fiber layer in one side and carbon fiber layer in the other side. In the case of composite asymmetry, the axis of flexural bending can deviate from the material’s mid plane in contrary to the general assumption; thus, suitable modeling corrections should be considered [44,45,46,47].
Selecting the appropriate reinforcing textile for a composite structure hinges on the specific performance requirements of the final product and achieving an optimal price-to-performance ratio. The orientation of fibers in the textile reinforcement significantly affects the mechanical properties. Unidirectional reinforcement is ideal for applications where load is applied predominantly in one direction, such as beams, stiffeners, or other structural elements in aerospace and automotive applications. Woven reinforcement is beneficial when the composite needs to withstand loads from multiple directions, such as in the hulls of ships or in complex load-bearing parts. Nonwoven reinforced composites are widely used for non-structural parts of automobiles. In addition to the application of nonwoven fabric-based composites, nonwovens are also used for geotextiles, filtration, medicine, and acoustic purposes.
3.6. Optical and Scanning Electron Images of Prepregs and Composite Plates
Mechanical behavior is also significantly influenced by the matrix material. For the load to be transferred from the matrix to the fibers effectively, the matrix and textile reinforcement must form an effective bond. Several SEM pictures were captured to determine whether the reinforcements and resin in the composites had a good interaction. Almost all composite samples have a pleasant interface thanks to soaking, or the impregnation of the fibers, as seen in the various photos in Figure 12.
During the impregnation process and the creation of the permanent prepreg, the image (Figure 11a) demonstrates good resin impregnation of the glass fabric fibers. The textile reinforcement and its interactions with the matrix material play a major role in the failure mechanisms of polymer composites. A common failure mode is delamination, which occurs when inadequate interlaminar bonding causes layers of composite material to separate. Fiber interlacing in woven and braided fabrics strengthens the link between layers, resulting in improved resistance to delamination (Figure 12b,c). When the load is greater than the fibers’ tensile strength, fiber rupture is the predominant failure mode in unidirectional composites. With woven fabrics, this is less of an issue because the load is distributed throughout the warp and weft fibers (Figure 12b). These SEM analyses are consistent with the findings on the flexural characteristics of suitable composites.
4. Conclusions
The results of the study show that the mechanical characteristics of composite materials are greatly impacted using textile structure as reinforcement. The following conclusions are derived from this study:
- In terms of tensile strength for tested E-glass woven fabrics (plain, twill, and basket), the analysis shows that they have anisotropic qualities, with a greater tensile strength in the longitudinal (warp) direction than in the transverse (weft) direction. In both the warp and weft orientations, the plain weave fabric demonstrated the maximum tensile strength; on the other hand, the basket weave fabric, which had more noticeable interstitial voids, demonstrated the lowest tensile strength. The conclusion is that the structure of the plain weave offers the greatest resistance to tensile pressures and that the warp count has a major impact on strength. The plain weave is the strongest, followed by the twill, and the basket weave is the weakest, according to a similar pattern of tensile strength in the weft direction.
- According to the composite simples’ constituent and void content results, the reinforcement content is roughly 70% wt, and the plain reinforced composites and UD reinforced composites have a void content of roughly 2.5%. In contrast, the composites reinforced with twill and basket fabric showed comparatively low void percentages (about 1%). The reinforced mat samples showed the highest percentage of voids (5.28%), which resulted in decreased mechanical characteristics.
- The DSC analysis showed that the curing and post-curing process temperatures for composite production result in complete cross-linked polymerization of the polymer matrix in all composite samples.
- Mechanical testing indicates that the composite samples reinforced with unidirectional reinforcement have a particularly high load-bearing capacity in the longitudinal direction and the strongest resistance to bending forces in that direction. Although the composite samples reinforced with twill textiles show higher flexural strengths comparable to those reinforced with plain and basket fabrics, the composites reinforced with woven textile structures (plain, twill, and basket) exhibit balanced properties in both directions. When compared to composites reinforced with woven or unidirectional textiles, non-woven reinforced composites with randomly oriented fibers have lower flexural strengths.
- There is a good impregnation of the glass fabric (woven) with the resin during the impregnation process and during the fabrication of the permanent prepreg, according to the scanning electron images of prepregs. Because of the good interface between the fibers and epoxy resin, as well as the fact that the load is dispersed across the warp and weft threads, woven textiles have a better resistance to delamination, according to microphotographs taken from composite plates (after they ruptured during mechanical testing). However, in unidirectional composites, fiber rupture is the most common failure mode when the load exceeds the tensile strength of the fibers.
By carefully selecting the type of textile reinforcement and optimizing its design, manufacturers can tailor the mechanical properties of polymer composites to meet the demands of various applications, from aerospace and automotive to sporting goods and construction etc.
Author Contributions
Conceptualization, V.S., S.Z. and S.R.; methodology, S.Z., S.R. and V.S.; software, S.Z, S.R.; validation, S.Z., S.R. and V.S.; formal analysis, S.R., S.Z. and S.S.; investigation, S.Z, S.S and V.S.; resources, S.R. and V.S.; data curation, S.S, S.R, S.J; writing—original draft preparation, S.Z., V.S. and S.R.; writing—review and editing, S.J., S.R., S.G.L. and S.S.; visualization, S.R.and S.Z.; supervision, S.Z., V.S. and S.G.L. project administration, S.R. S.S. and S.Z..; funding acquisition S.Z, S.R, S.J. and S.G.L, All authors have read and agreed to the published version of the manuscript
Funding
This research received no external funding.
Institutional Review Board Statement
Not applicable; this study did not involve humans or animals.
Informed Consent Statement
Not applicable.
Data Availability Statement
Not applicable. Or The data presented in this study are available from the corresponding author upon request.
Acknowledgments
The production of the composite /prepregs and laminates was carried out in the Institute for Advanced Composites and Robotics and Laminati Kom from Prilep (North Macedonia). Mechanical analysis was performed at company Laminati Kom- Prilep, (North Macedonia), but SEM and DSC analysis the Faculty of Technology, Goce Delcev University Stip, (North Macedonia) and the Faculty of Technology, Leskovac (Srbia). The authors are very grateful to all these institutions for their support in the realization of this research project. These experiments are part of a doctoral thesis from author Silvana Zezova.
Conflicts of Interest
The authors declare no conflict of interest.
References
- Reber, R. Micro- and Macro mechanical Properties of Knitted Fabric Reinforced Composites (KFRCS) with Regard to Environmental Exposure. Ph.D. Thesis, Swiss Federal Institute of Technology, Zurich, Switzerland, 1999. [Google Scholar]
- Ko, F.K. Advanced Textile Structural Composites. In Advanced Topics in Materials Science and Engineering; Morán-López, J.L., Sanchez, J.M., Eds.; Springer: Boston, MA, USA, 1993; pp. 117–137. [Google Scholar]
- Zănoagă, M.; Tanasă, F. Complex Textile Structures as Reinforcement for Advanced Composite Materials. In Proceedings of the International Conference of Scientific Paper AFASES 2014, Brașov, Romania, 22–24 May 2014. p. p.1.
- Ko, F.K.; Du, G.W. Textile Preforming. In Handbook of Composites; Peters, S.T., Ed.; Chapman and Hall: London, UK, 1998; pp. 397–424. [Google Scholar]
- Axinte, A.; Țăranu, N.; Bejan, L. Modelling Patterns for Fabric Reinforced Composites. Buletinul Institutului Politehnic din Iași, 2016, 62 (66), 1, 397–424.
- Bilisik, K.; Sahbaz Karaduman, N.; Bilisik, N.E. 3D Fabrics for Technical Textile Applications. In Non-woven Fabrics; InTech: 2016; pp. 81–141.
- Hu, J. 3D Fibrous Assemblies: Properties, Applications and Modelling of Three-Dimensional Textile Structures., 1st ed.; Woodhead Publishing: Cambridge, UK, 2008. [Google Scholar]
- Ko, F.K. 3-D Textile Reinforcements in Composite Materials. In 3-D Textile Reinforcements in Composite Materials, Woodhead Publishing Series in Composites Science and Engineering; Miravete, A., Ed.; Woodhead Publishing: 1999; pp. 9–42.
- Solden, J.A.; Hill, J. Conventional Weaving of Shaped Preforms for Engineering Composites. Composites Part A 1998, 29A, 757–762. [Google Scholar] [CrossRef]
- Chen, X. Technical Aspect: 3D Woven Architectures. In Proceedings of the NWTexNet 2007 Conference, Blackburn UK, 2007.
- Ishmael, N.; Fernando, A.; Andrew, S.; Waterton Taylor, L. Textile technologies for the manufacture of three-dimensional textile preforms. Res. J. Text. Apparel 2017, 21, 342–362. [Google Scholar] [CrossRef]
- Cox, B.N.; Flanagan, G. Handbook of Analytical Methods for Textile Composites. Prepared for Langley Research Center under Contract NAS1-19243; National Aeronautics and Space Administration, Langley Research Center: Hampton, VA, 1997. [Google Scholar]
- Carlson, C. The Influence of Matrix Modification of the Properties of 3-D Woven Composite. Ph.D. Thesis, North Carolina State University, USA, 1995. [Google Scholar]
- Ogale, V.; Ramasamy, A. Textile Preforms for Advanced Composites. Indian J. Fibre Textile Res. 2004, 29, 366–375. [Google Scholar]
- Barbero, E.J. Introduction to Composite Material Design, 2nd ed.; CRC Press, Taylor & Francis Group: London, New York, 2011. [Google Scholar]
- Costa, M.L.; Botelho, E.C.; de Paiva, J.M.F.; Rezende, M.C. Characterization of Cure of Carbon/Epoxy Prepreg Used in Aerospace Field. Mater. Res. 2005, 8(3), 317–322. [Google Scholar] [CrossRef]
- X. S.; Yi, S., Du, L., Zhang, L. Composite Materials Engineering: An Introduction to Composite Materials, Eds.; Springer: Beijing, China, 2006, Vol. 1, pp. 1–61. [Google Scholar]
- Yılmaz, N.D.; Khan, G.M.A. Flexural Behavior of Textile-Reinforced Polymer Composites. In Mechanical and Physical Testing of Biocomposites, Fibre-Reinforced Composites and Hybrid Composites, Woodhead Publishing Series in Composites Science and Engineering; Jawaid, M., Thariq, M., Saba, N., Eds.; Woodhead Publishing: 2019; pp. 13–42. ISBN 9780081022924. [CrossRef]
- Iquilio, R.; Valin, J.L.; Villalobos, K.; Nunez, S.; Gonzalez, A.; Valin, M. Influence of Fiber Orientation on Mechanical Response of Jute Fiber-Reinforced Polymer Composites. Polymers 2024, 16, 2573. [Google Scholar] [CrossRef]
- Ahmad, F.; Yuvaraj, N.; Bajpai, P. Influence of Reinforcement Architecture on Static and Dynamic Mechanical Properties of Flax/Epoxy Composites for Structural Applications. Compos, Struct. 2021, 255, 112955. [Google Scholar] [CrossRef]
- Saba, N.; Jawaid, M. A Review on Thermomechanical Properties of Polymers and Fibers Reinforced Polymer Composites. J. Ind. Eng. Chem. 2018, 67, 1–11. [Google Scholar] [CrossRef]
- Dixit, A.; Mali, H.S.; Misra, R.K. Unit Cell Model of Woven Fabric Textile Composite for Multiscale Analysis. Procedia Eng. 2013, 68, 352–358. [Google Scholar] [CrossRef]
- Aliabadi, M.H. Woven Composites; Imperial College Press: London, UK, 2015. [Google Scholar]
- Chawla, K.K. Composite Materials: Science and Engineering. Springer Science & Business Media: New York, 2013.
- Wisnom, M.R. The Role of Delamination in the Failure of Fibre-Reinforced Composites. Trans. R. Soc. A 2012, 370, 1850–1870. [Google Scholar] [CrossRef]
- Dixit, A.; Mali, H.S. Modeling Techniques for Predicting the Mechanical Properties of Woven-Fabric Textile Composites: A Review. Mech. Compos. Mater. 2013, 49, 1–20. [Google Scholar] [CrossRef]
- Priyanka, P.; Dixit, A.; Mali, H.S. High-Strength Hybrid Textile Composites with Carbon, Kevlar, and E-Glass Fibers for Impact-Resistant Structures: A review. Mech. Compos. Mater. 2017, 53, 685–704. [Google Scholar] [CrossRef]
- Sharma, P.; Mali, H.S.; Dixit, A. Mechanical Behavior and Fracture Toughness Characterization of High Strength Fiber Reinforced Polymer Textile Composites. Iran. Polym. J. 2021, 30, 193–233. [Google Scholar] [CrossRef]
- Davallo, M. Factors Affecting Fracture Bbehaviour of Composite Materials. Int. J. ChemTech Res. 2010, 2, 2125–2130. [Google Scholar]
- Sathishkumar, T.P.; Satheeshkumar, S.; Naveen, J. Glass Fiber-Reinforced Polymer Composites—A review. J. Reinf. Plast. Compos. 2014, 33, 1258–1275. [Google Scholar] [CrossRef]
- Gu, H.; Zhili, Z. Tensile Behavior of 3D Woven Composites by Using Different Fabric Structures. Mater. Des. 2002, 23, 671–674. [Google Scholar] [CrossRef]
- Behera, B.K.; Dash, B.P. A Study on Structure-Property Relationship of 3D Woven Composites. Mater. Today Proc. 2015, 2, 2991–3007. [Google Scholar]
- Shang, X.; Marques, E.A.S.; Machado, J.J.M.; Carbas, R.J.C.; Jiang, D.; Silva, L.F.M. A Strategy to Reduce Delamination of Adhesive Joints with Composite Substrates. Proc. Inst. Mech. Eng., Part L: J. Mater. Des. Appl. 2019, 233, 521–530. [Google Scholar] [CrossRef]
- Chowdhury, I.R.; Summerscales, J. Woven Fabrics for Composite Reinforcement: A review. J. Compos. Sci. 2024, 8, 280. [Google Scholar] [CrossRef]
- ASTM Standards D 5035-03; Standard Test Method for Breaking Force and Elongation of Textile Fabrics (Strip Method). ASTM International: West Conshohocken, PA, USA, 2003.
- ASTM Standards D 3171-15; Standard Test Methods for Constituent Content of Composite Materials. ASTM International: West Conshohocken, PA, USA, 2015.
- ASTM Standards D 792-08; Standard Test Methods for Density and Specific Gravity (Relative Density) of Plastics by Displacement. ASTM International: West Conshohocken, PA, USA, 2008.
- ASTM Standards D 2734-11; Standard Test Methods for Void Content of Reinforced Plastics. ASTM International: West Conshohocken, PA, USA, 2011.
- EN ISO 14125-98; Fibre-Reinforced Plastic Composites, Determination of Flexural Properties. European Committee for Standardization, 1998.
- ISO 11357-1:2023(en); Plastics — Differential Scanning Calorimetry (DSC) — Part 1: General Principles. International Organization for Standardization, 2023.
- Zhao, L.G.; Warrior, N.A.; Long, A.C. A Micromechanical Study of Residual Stress and its Effect on Transverse Failure in Polymer Matrix Composites. Int. J. Solids Struct. 2006, 43, 5449–5467. [Google Scholar] [CrossRef]
- Chen, W.; Zhang, D. A Micromechanics-Based Processing Model for Predicting Residual Stress in Fiber-Reinforced Composites. In 58th AIAA/ASCE/AHS/ASC Structures, Structural Dynamics, and Materials Conference; Grapevine, TX, USA: AIAA SciTech Forum, 2017; pp. 1–14. [Google Scholar]
- Zhang, D. Progressive Damage and Failure Analysis of 3D Textile Composites Subjected to Flexural Loading. Ph.D. Dissertation, The University of Michigan, 2014.
- Khan, G.M.A.; Terano, M.; Gafur, M.A.; Alam, M.S. Studies on The Mechanical Properties of Woven Jute Fabric Reinforced Poly(L-Lactic Acid) Composites. J. King Saud Univ. Eng. Sci. 2013, 1–6. http://linkinghub.elsevier.com/retrieve/pii/S1018363913000548.
- Shembekar, P.; Naik, N. Elastic Behavior of Woven Fabric Composites: II—Laminate Analysis. J. Compos. Mater. 1992, 26, 2226–2246. [Google Scholar] [CrossRef]
- Naik, N.; Shembekar, P. Elastic Behavior of Woven Fabric Composites: III — Laminate Design. J. Compos. Mater. 2522. [Google Scholar]
- Naik, N.; Shembekar, P. Elastic Analysis of Woven Fabric Laminates: Part II. Mixed Composites. J. Compos. Technol. Res. 1993, 15, 34–37. [Google Scholar]
- Gandhi, K.L. The Fundamentals of Weaving Technology. In Gandhi, K.L. (Ed.), Woven Textiles: Principles, Technologies, and Applications, 2nd ed.; Elsevier: Amsterdam, Netherlands, 2020; pp. 167–270. [Google Scholar]
- ASTM D 3776-02; Standard Test Method for Mass Per Unit Area (Weight) of Fabric. ASTM International: West Conshohocken, PA, USA, 2002.
- BS EN 1049-2 (1994); Textiles - Woven Fabrics - Construction - Methods of Analysis - Determination of Number of Threads per Unit Length. British Standards Institution, 1994.
- ASTM D 2584-18; Standard Test Method for Ignition Loss of Cured Reinforced Resins. ASTM International: West Conshohocken, PA, USA, 2018.
Figure 1.
Tensile strength test of universal test machine „Schenck”.
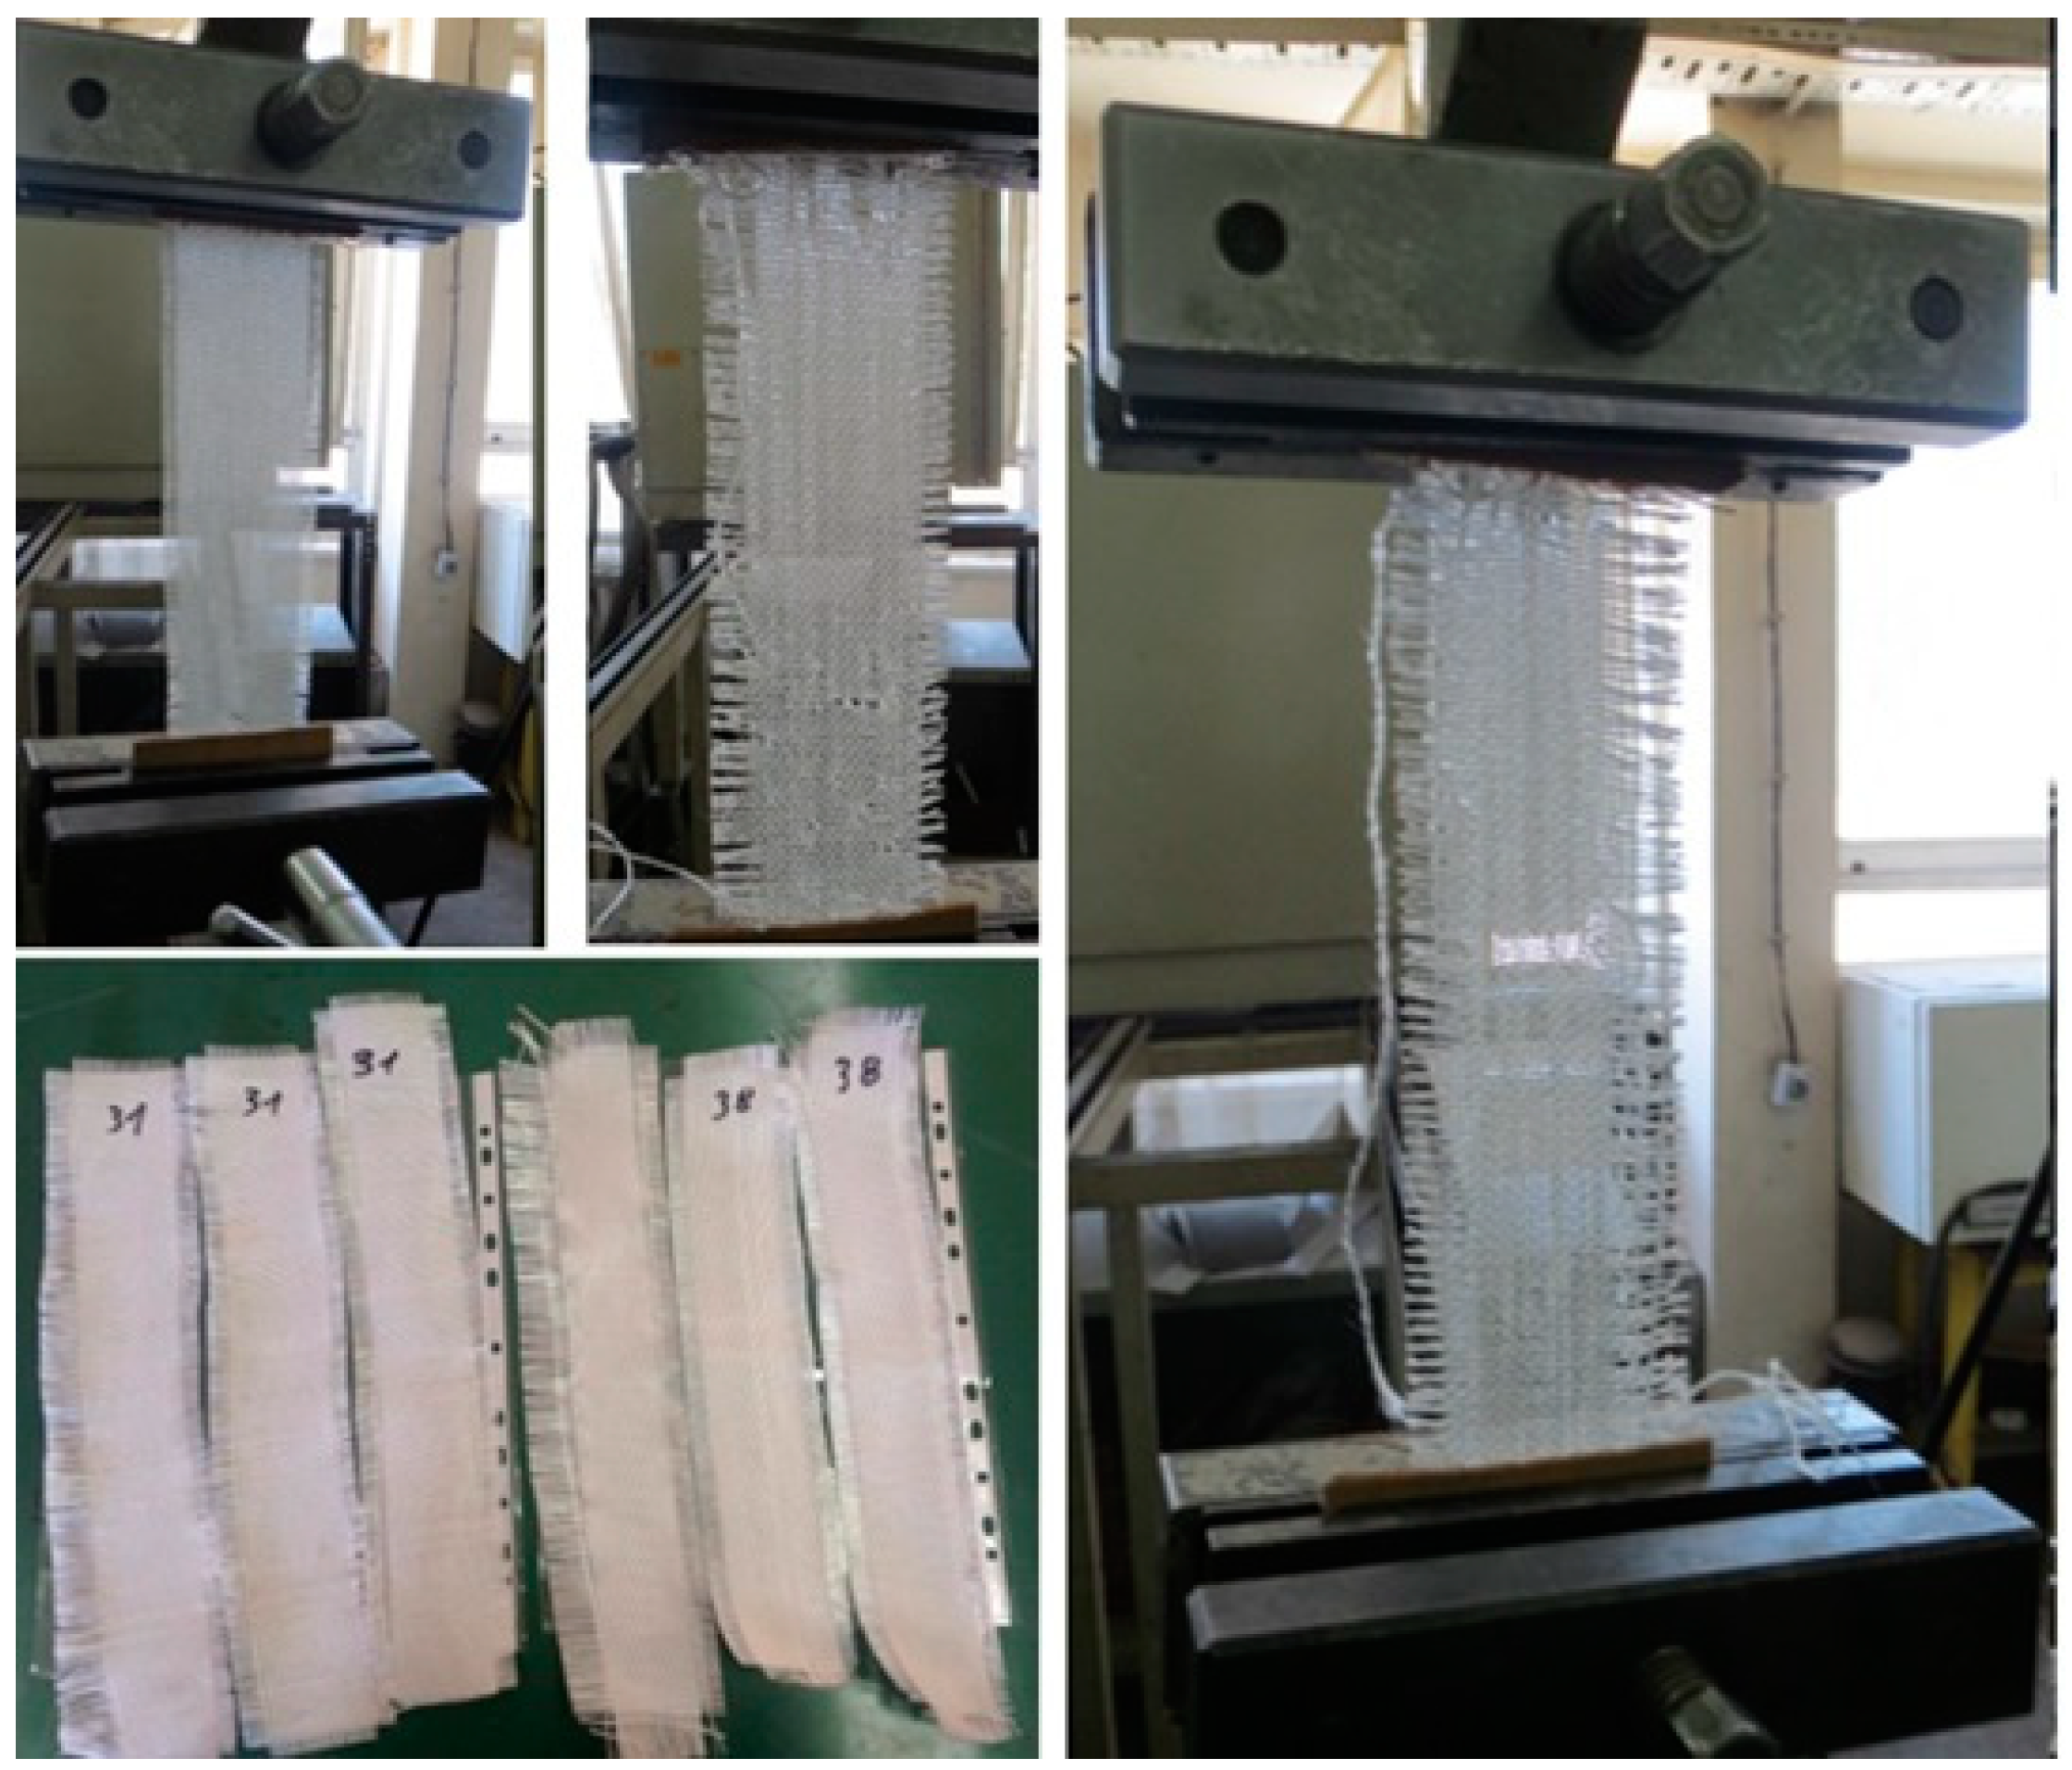
Figure 2.
a) Machine impregnation b) Hand impregnation.
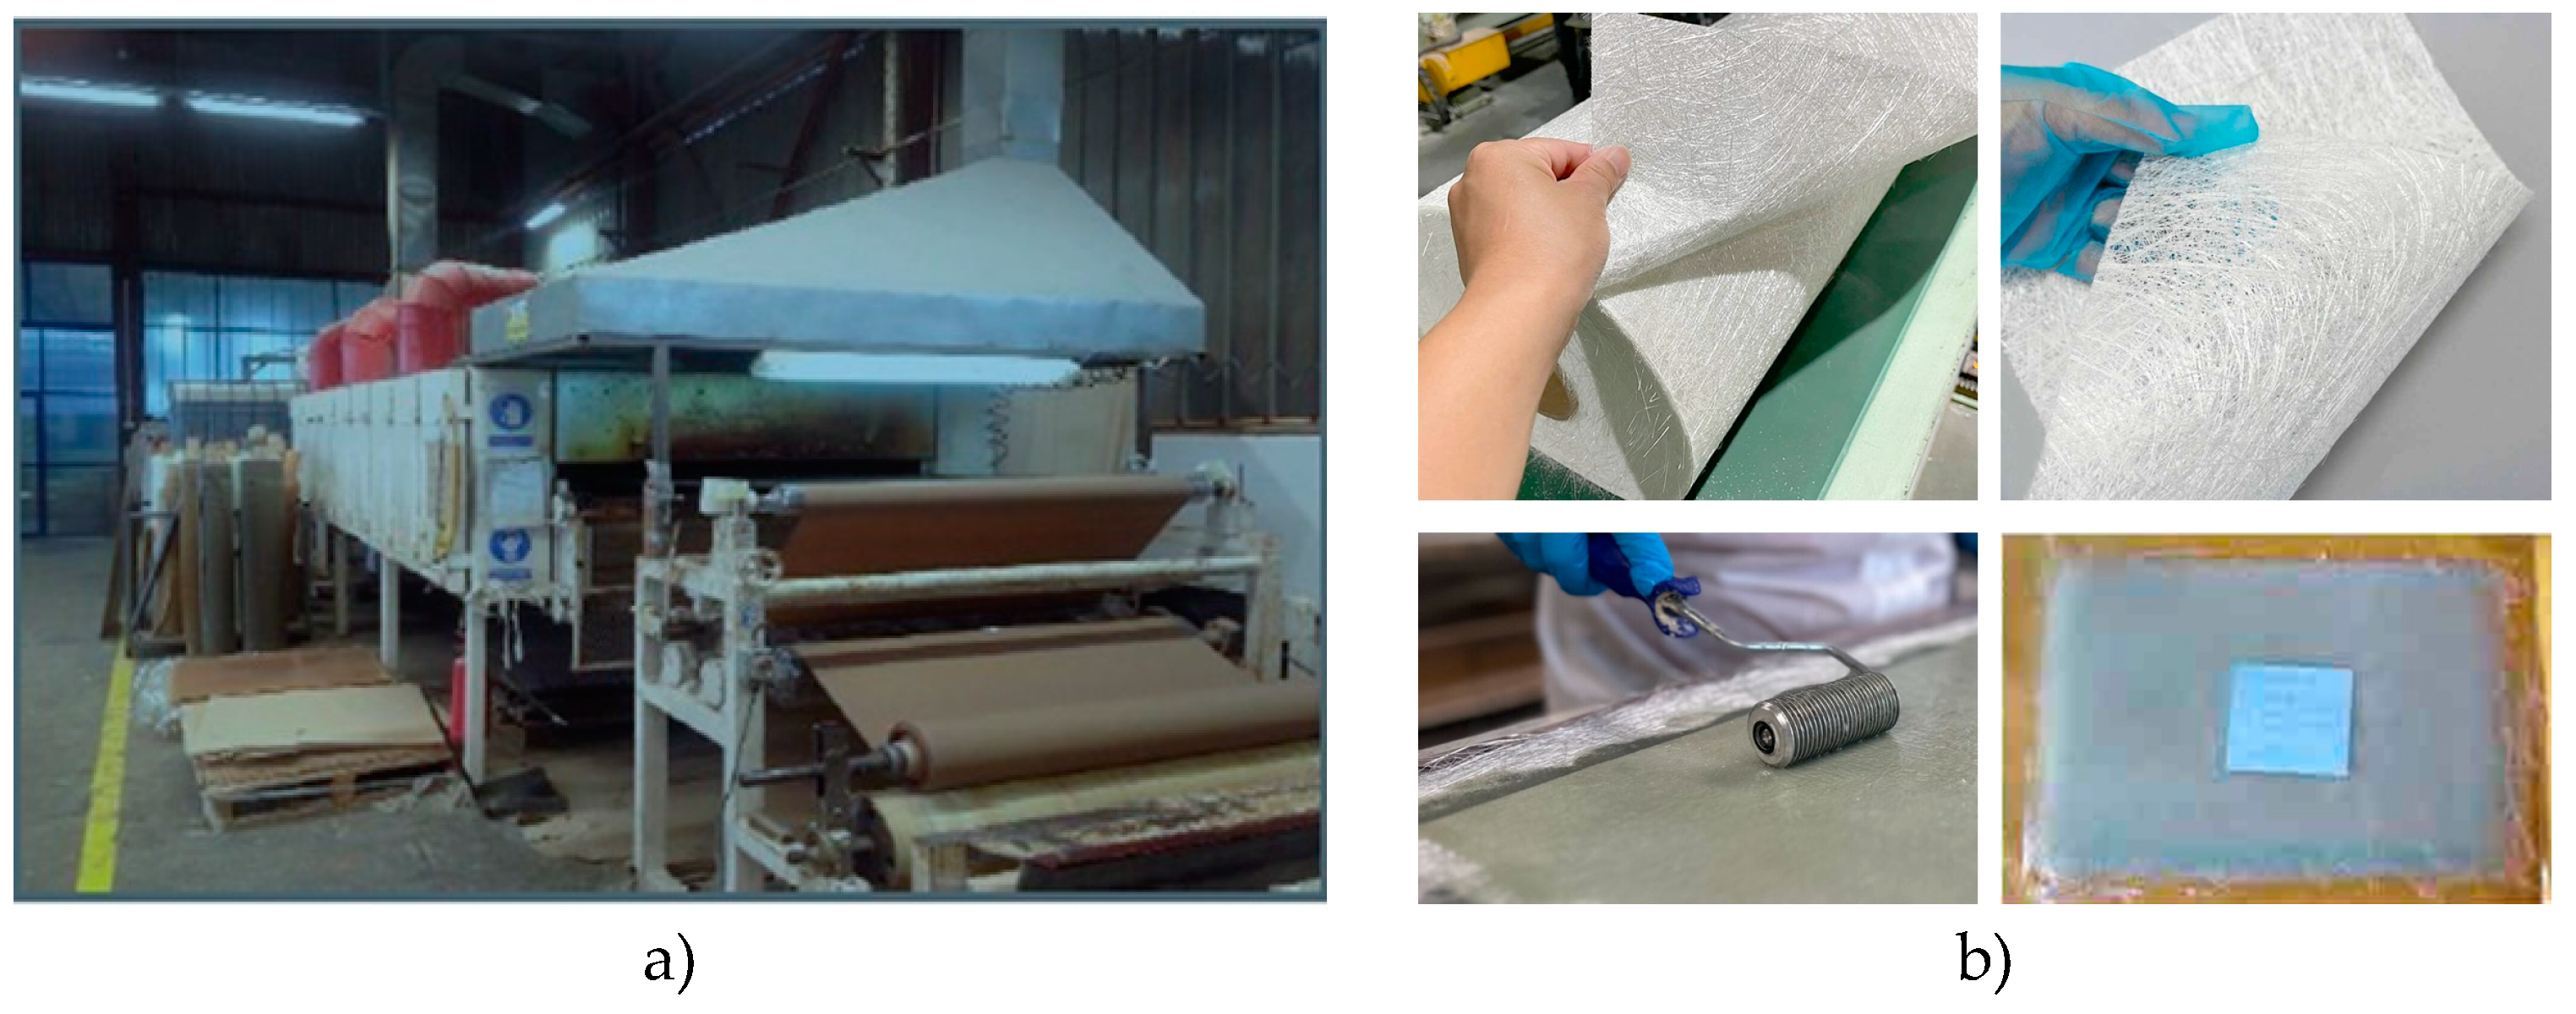
Figure 3.
Press machine.
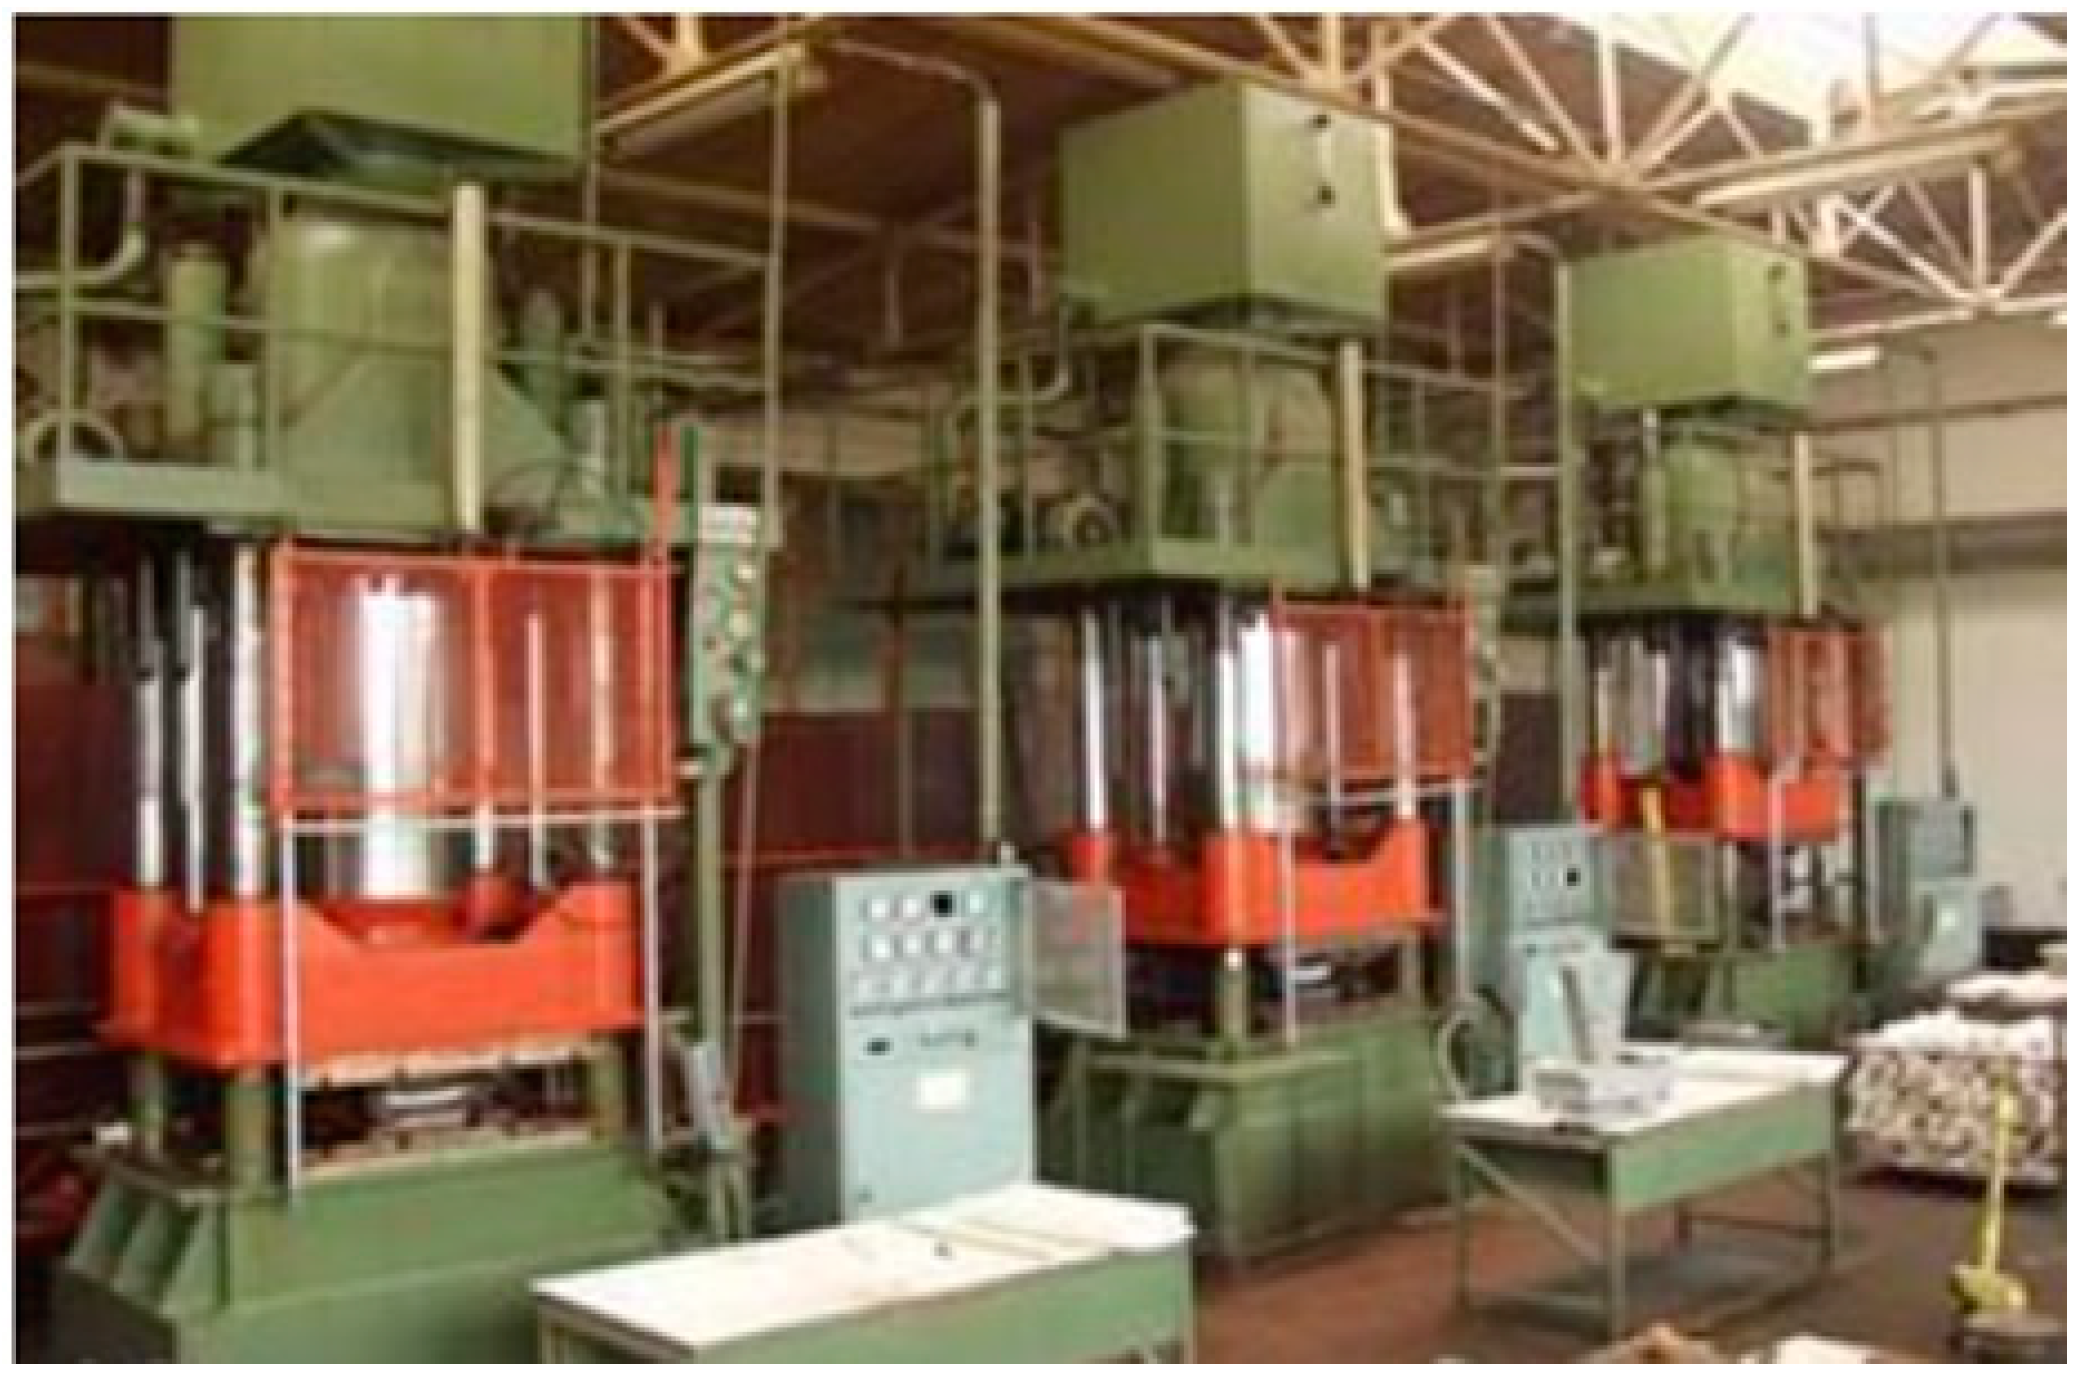
Figure 4.
Flexural strength test using a three-point flexural method at Universal Testing Machine (UTM).
Figure 4.
Flexural strength test using a three-point flexural method at Universal Testing Machine (UTM).
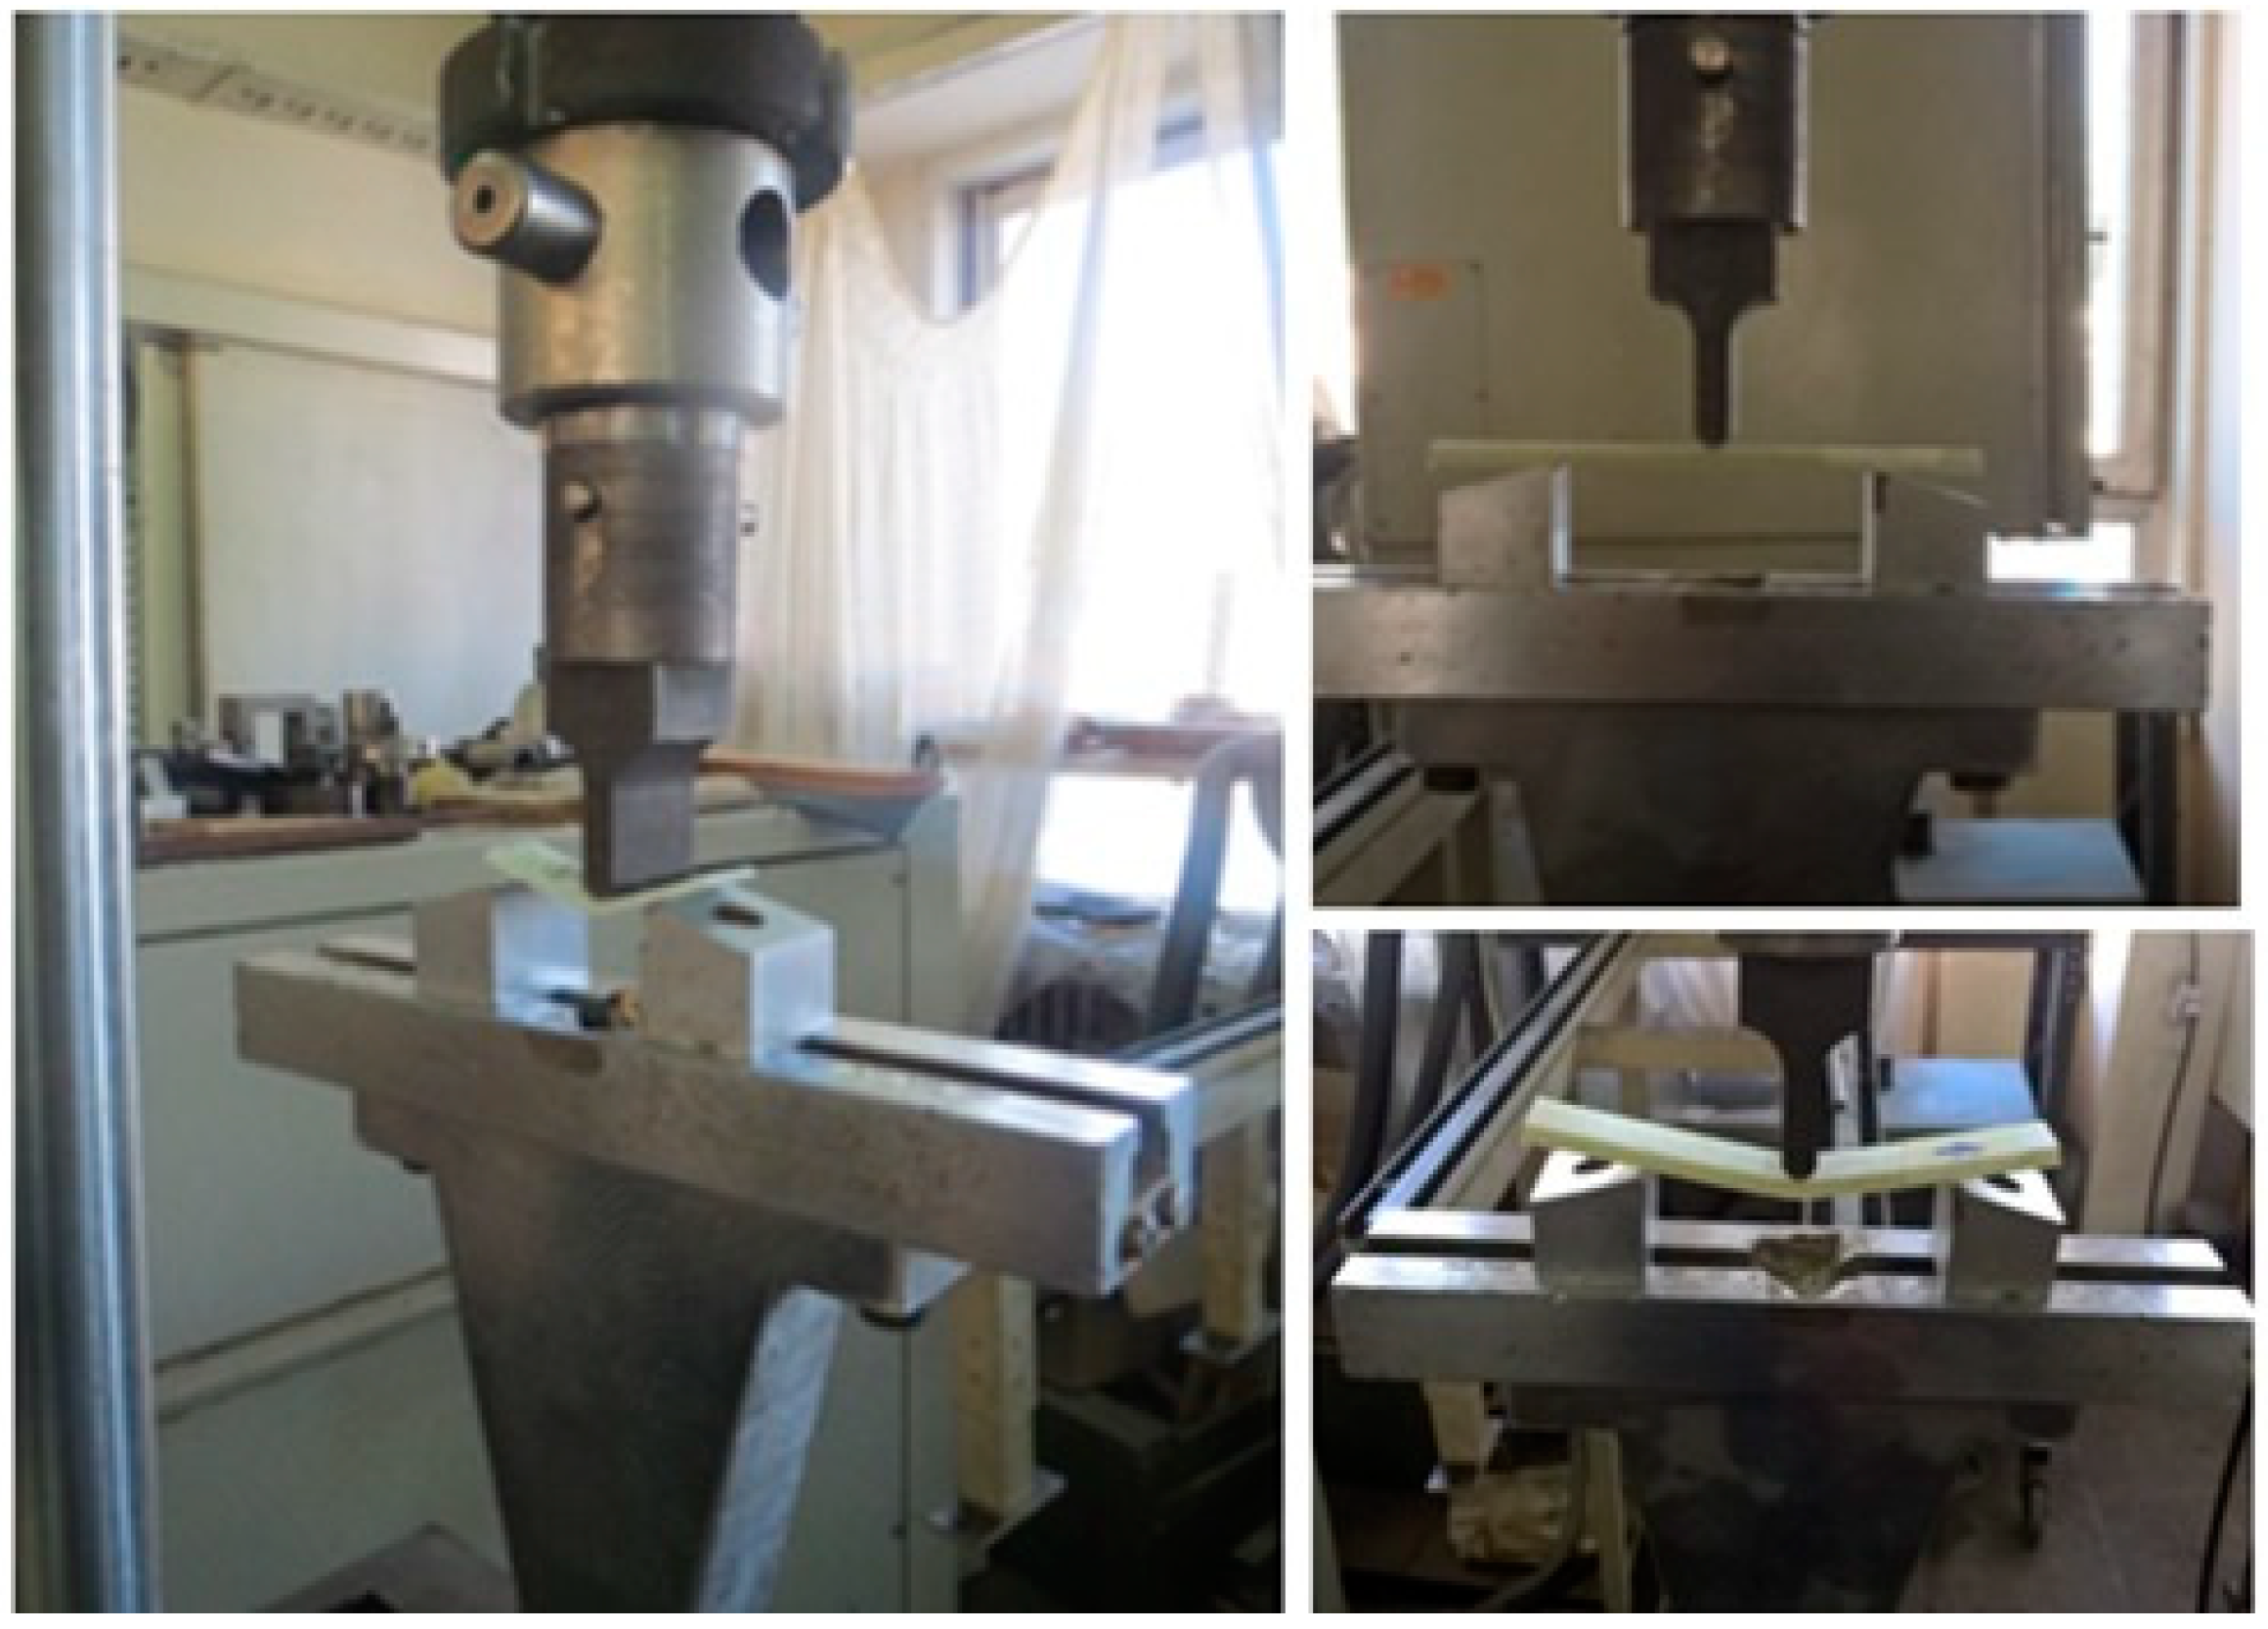
Figure 5.
Scanning electron microscope VEGA3 LMU from company Tescan.
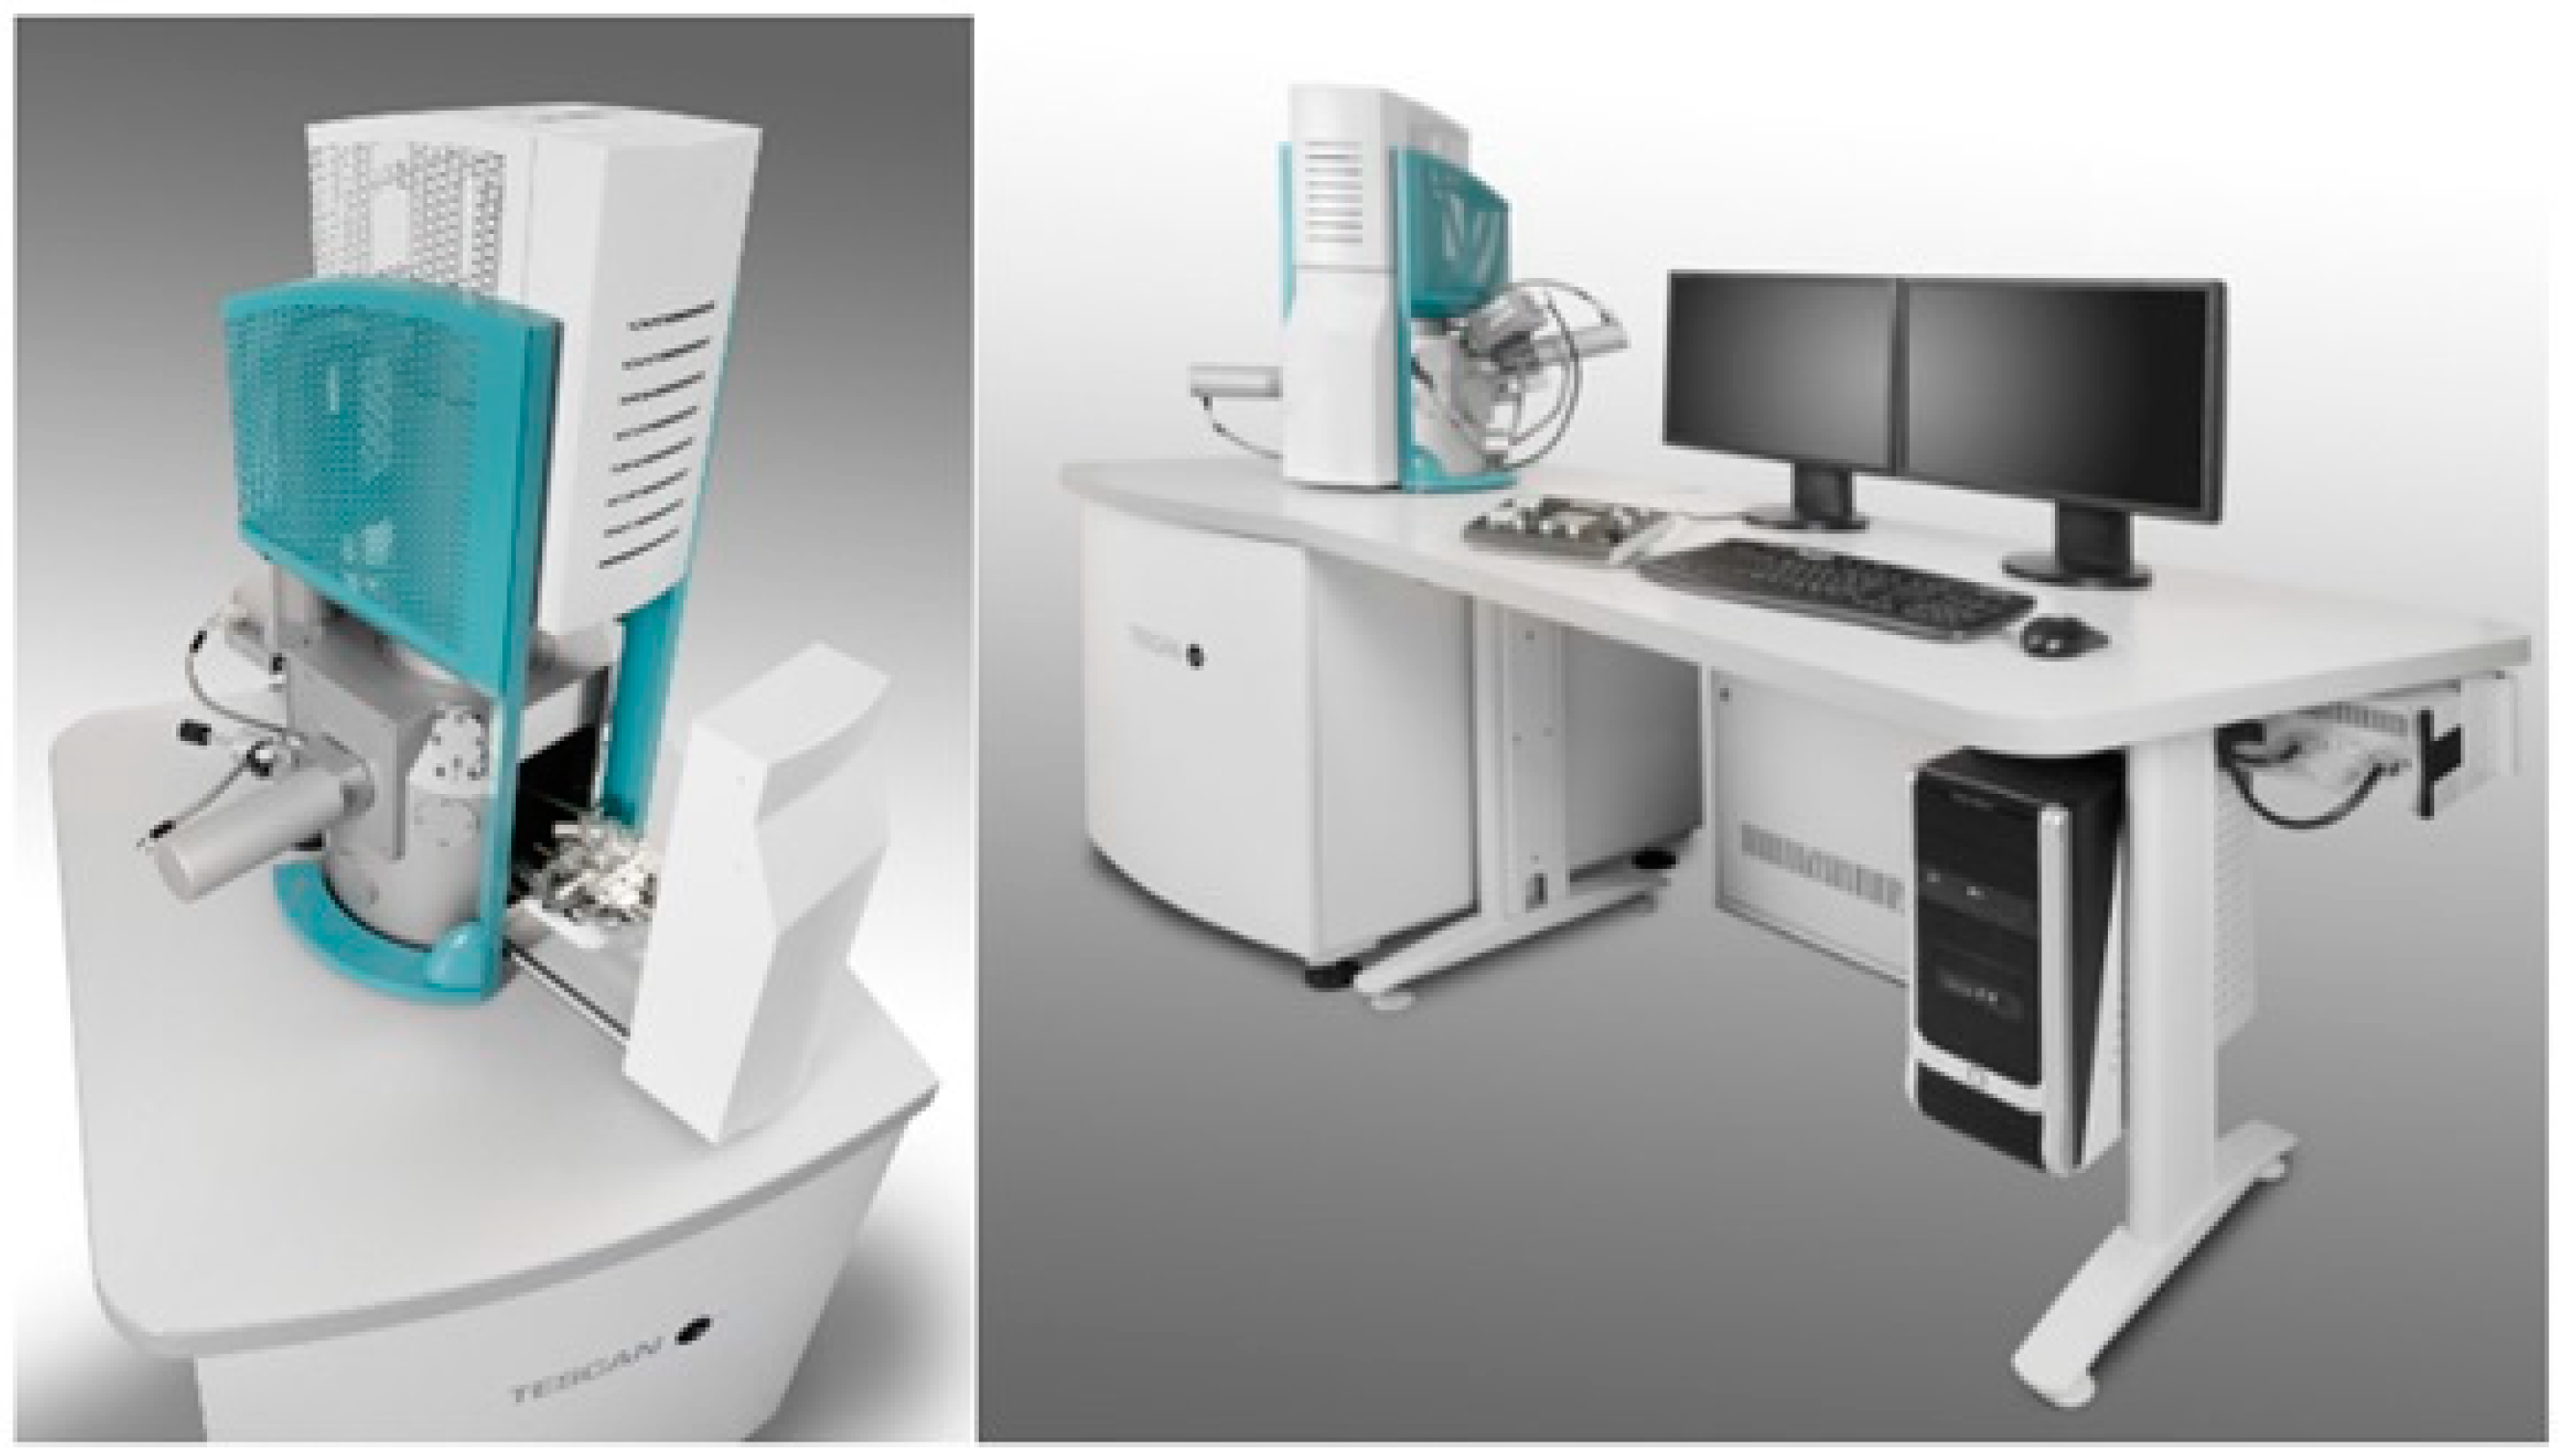
Figure 6.
Microphotographs from a) sample I, b) sample II and v) sample III.
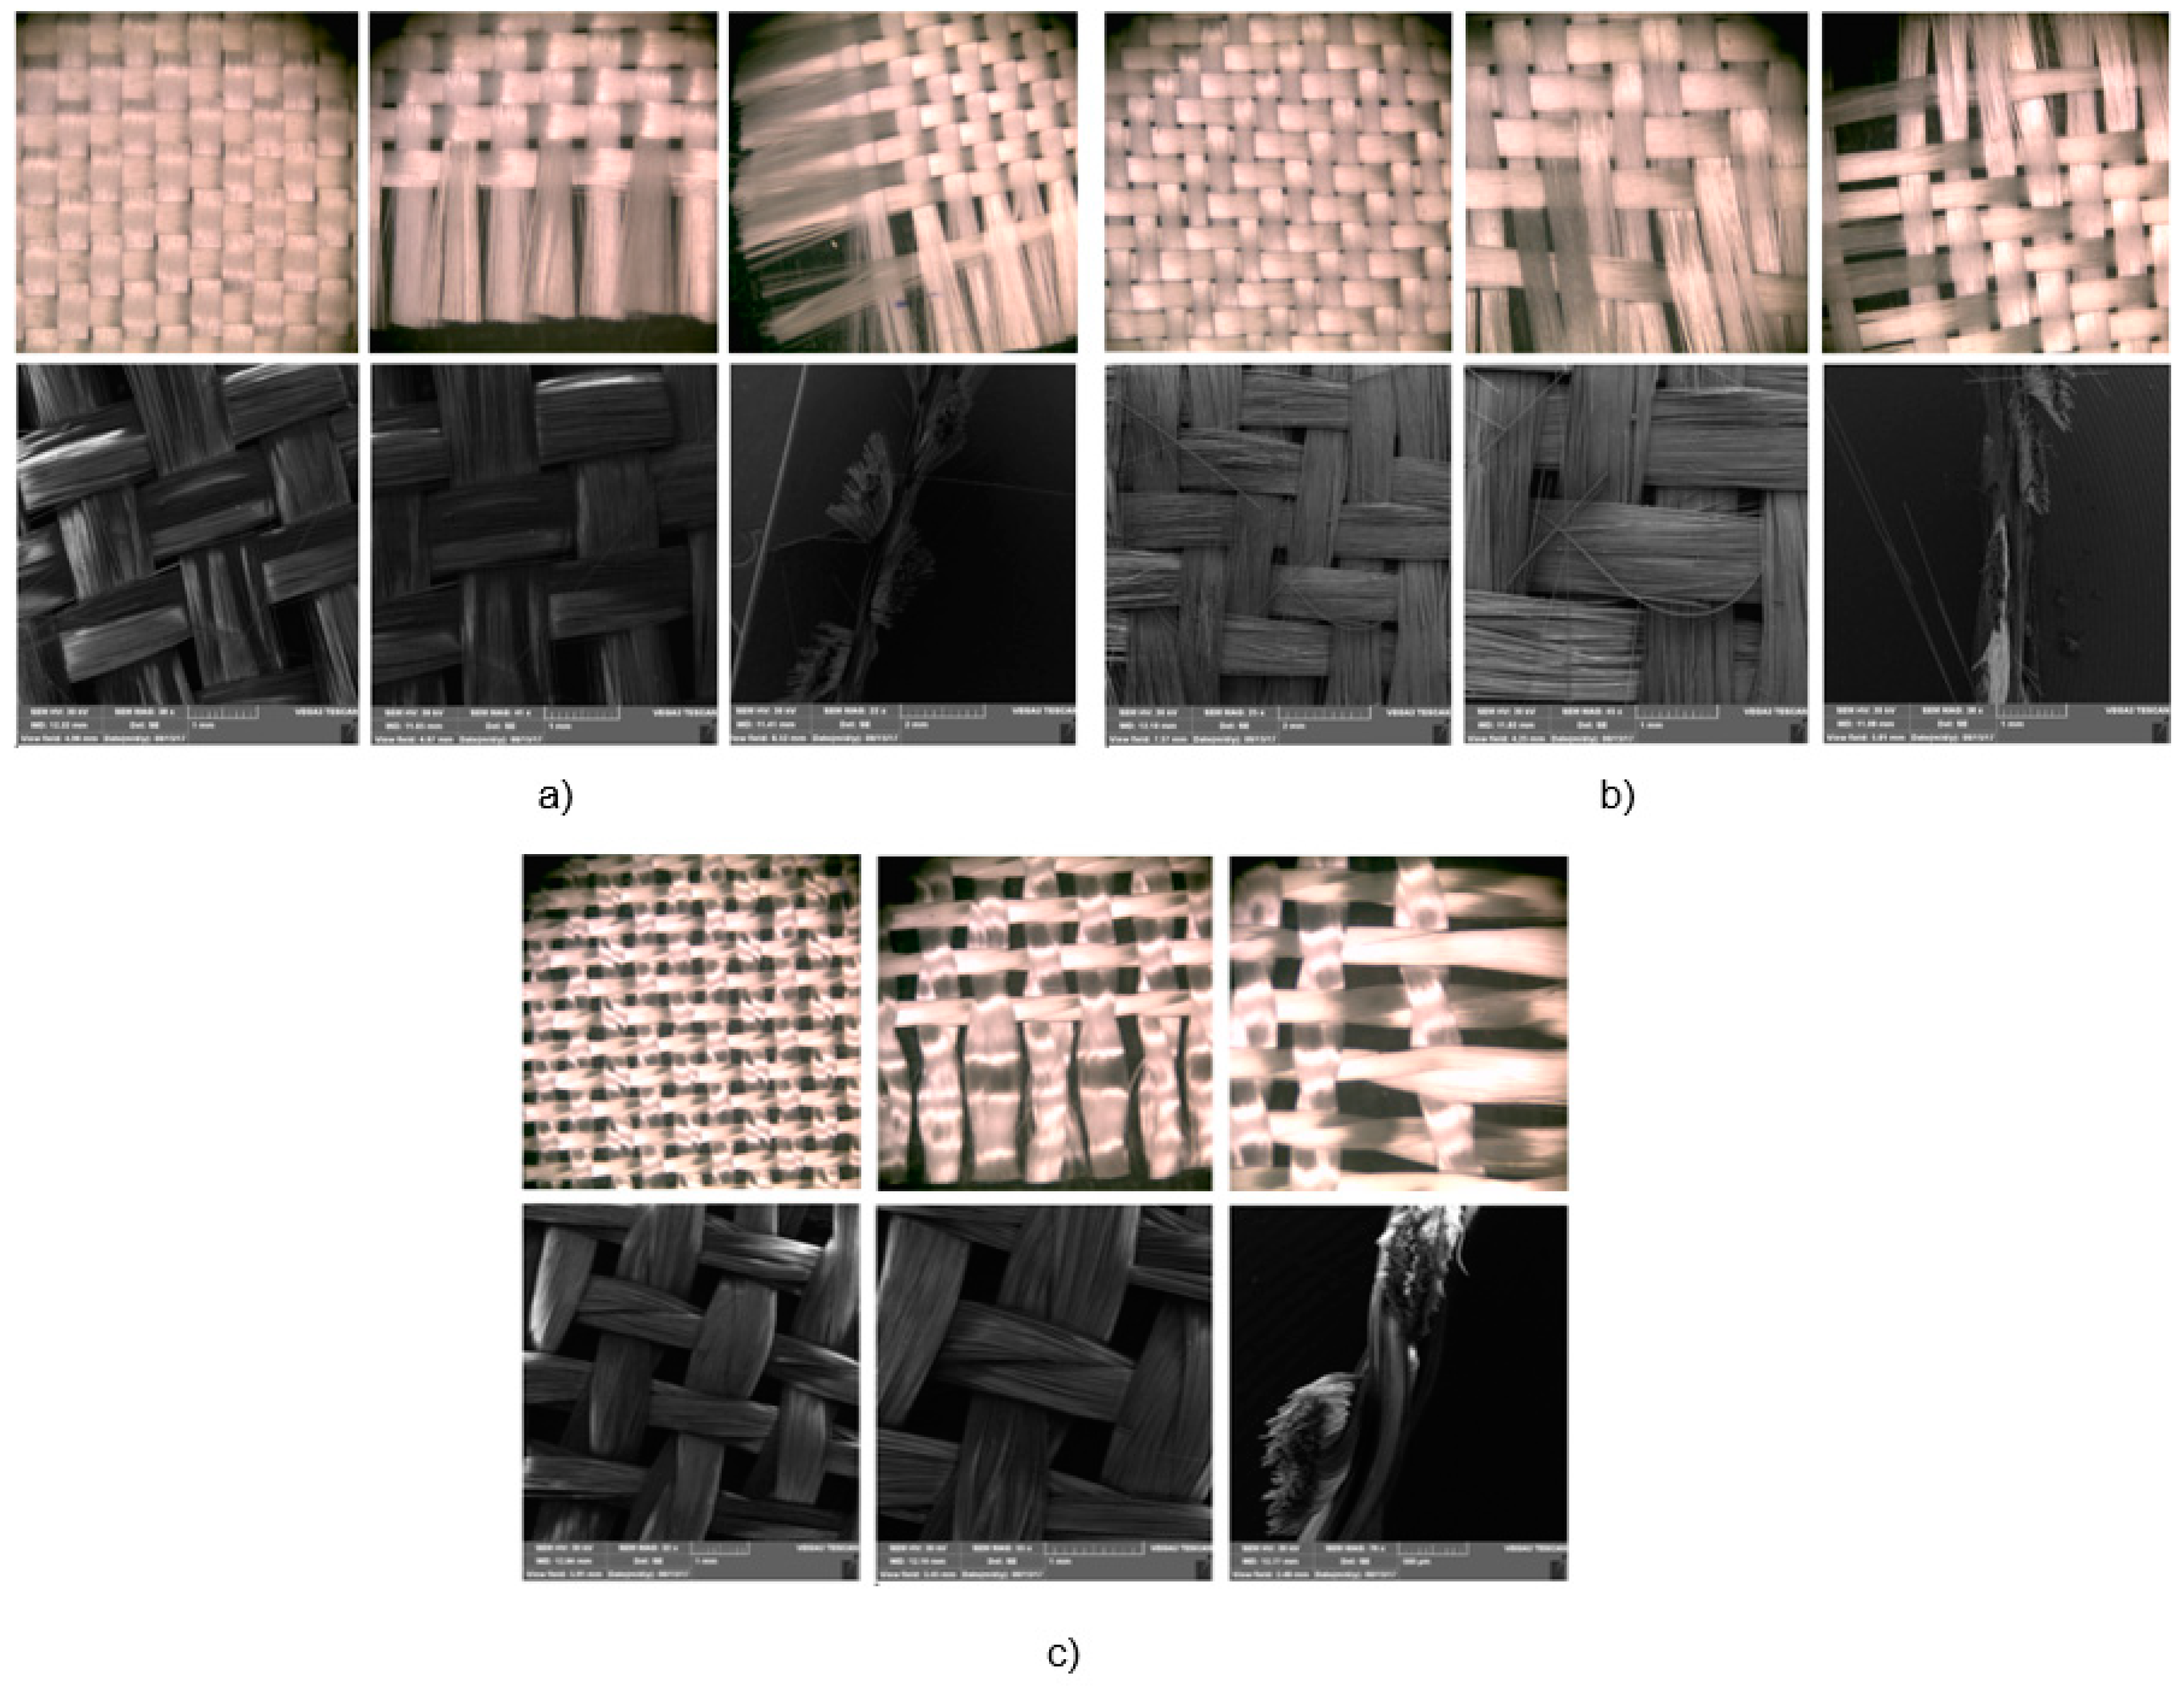
Figure 7.
Tensile strength and tensile deformation of applied woven fabric according to a) warp and b) weft.
Figure 7.
Tensile strength and tensile deformation of applied woven fabric according to a) warp and b) weft.
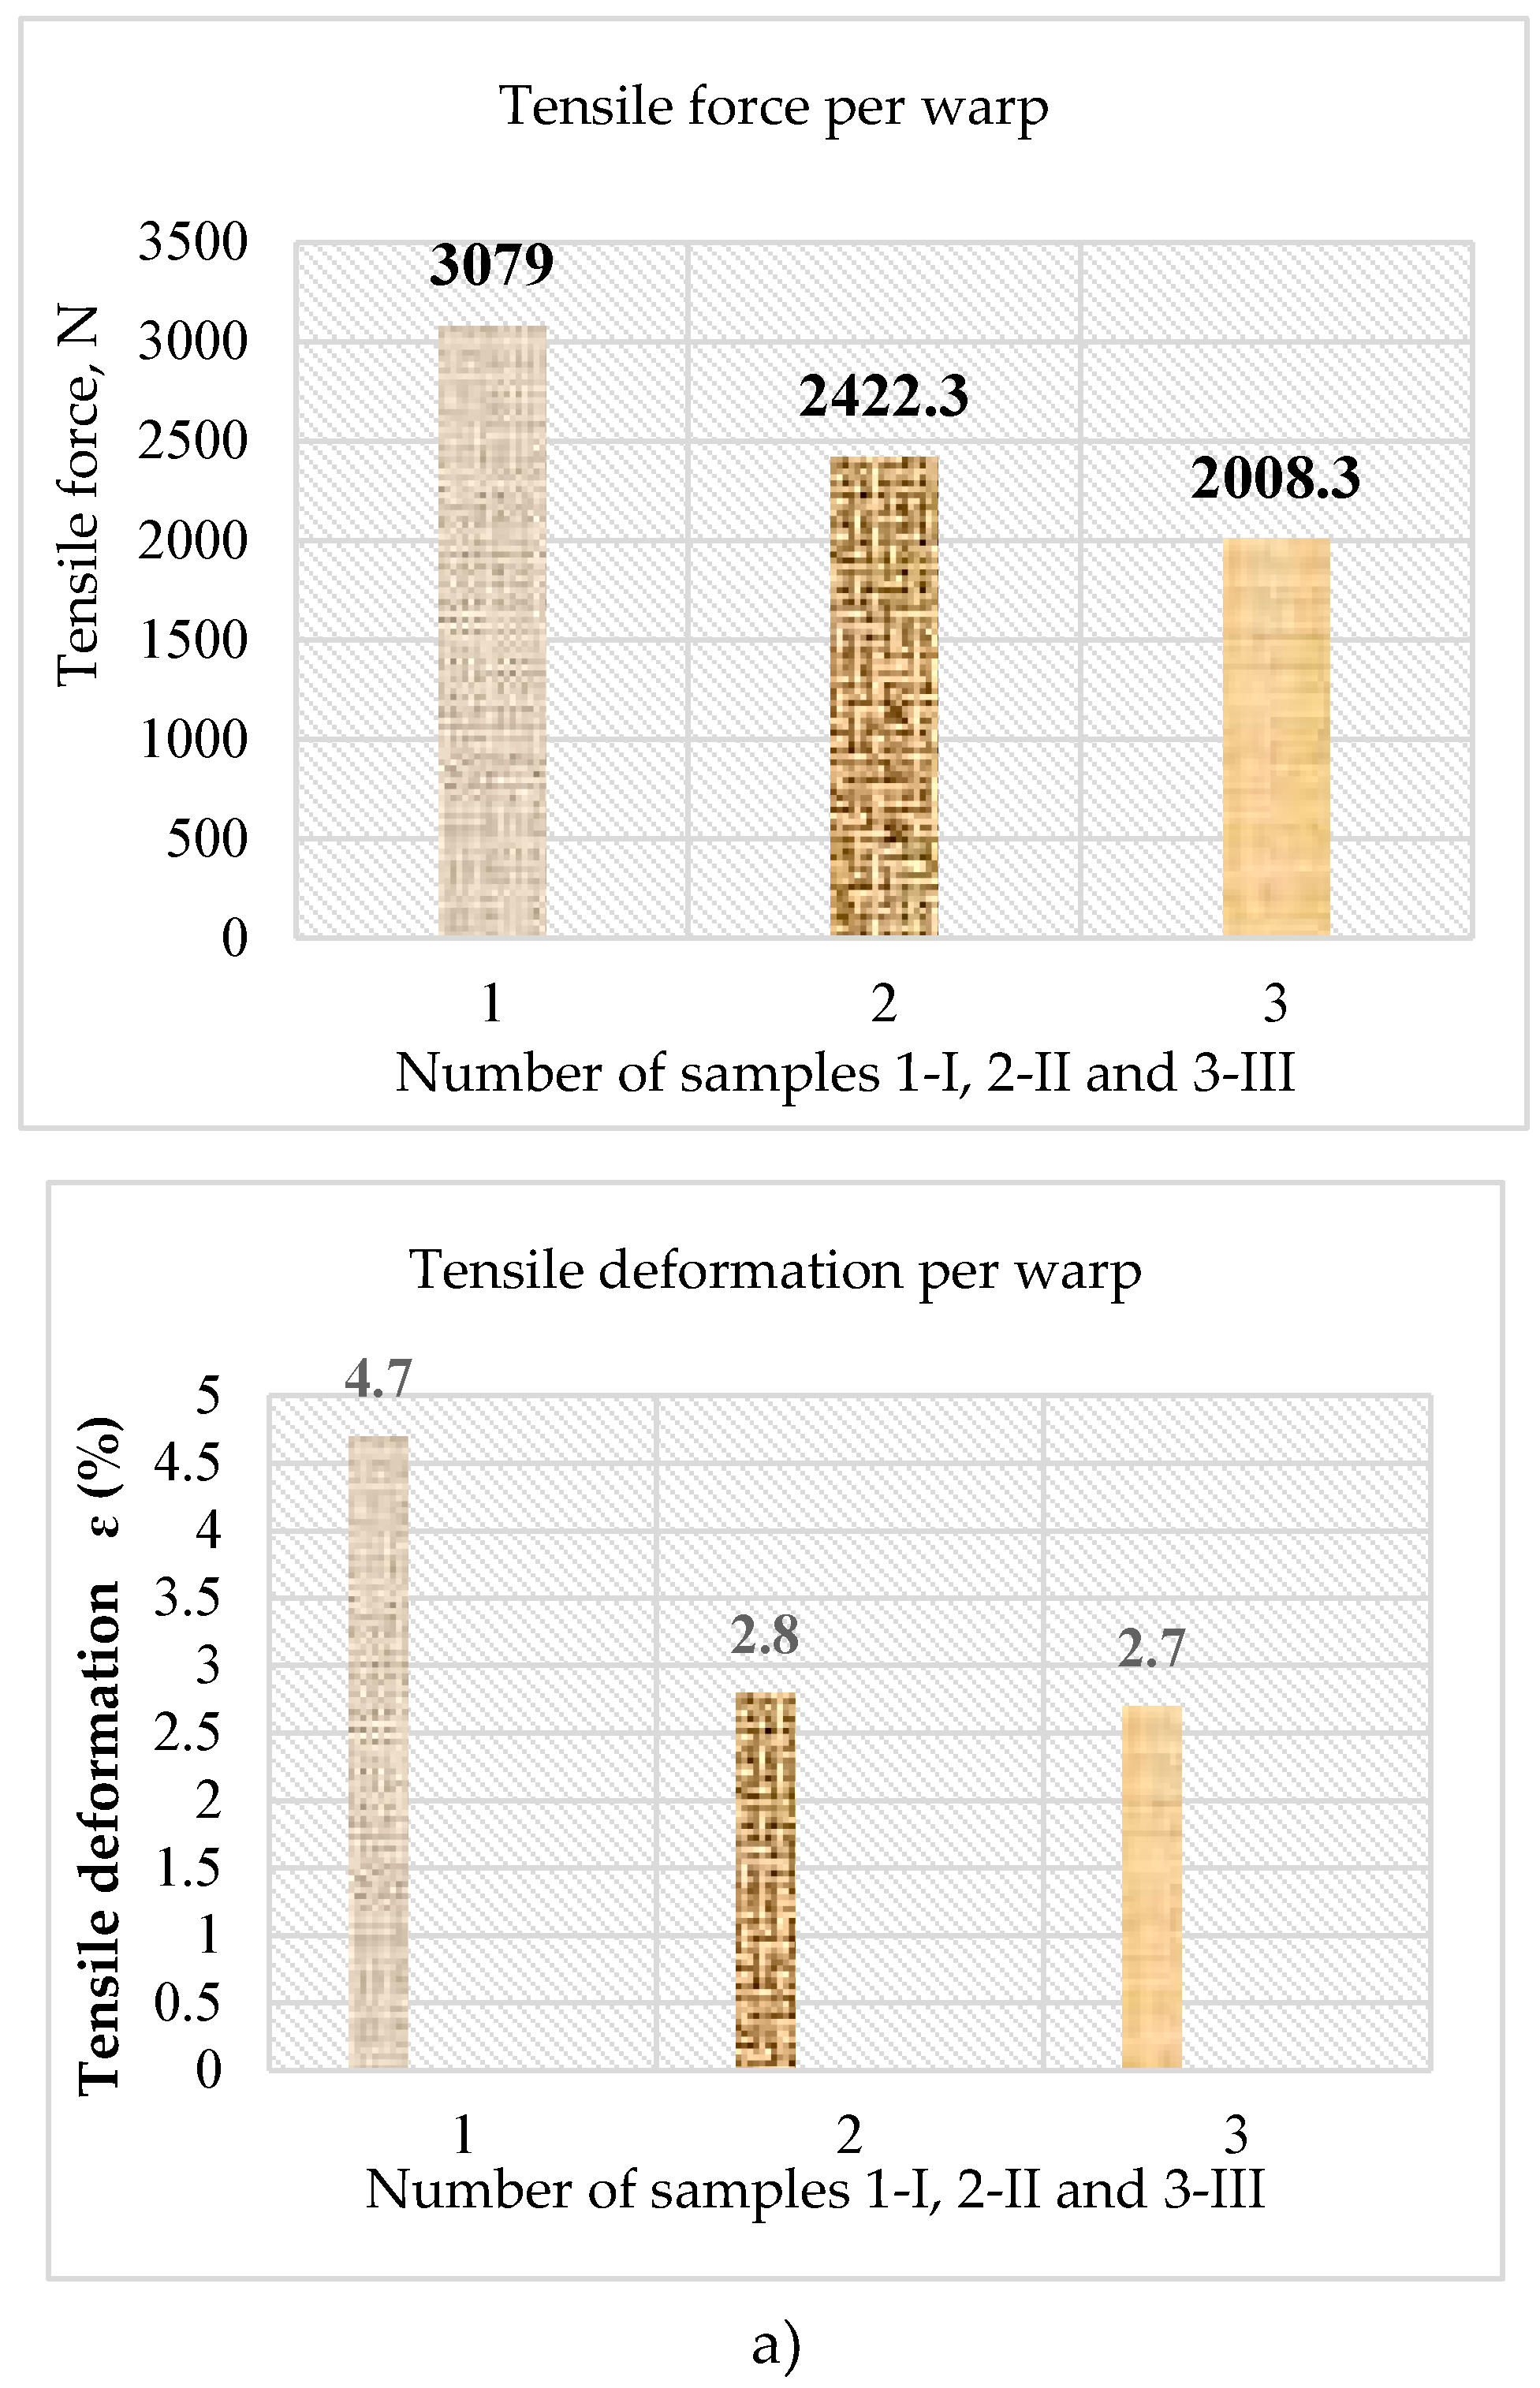
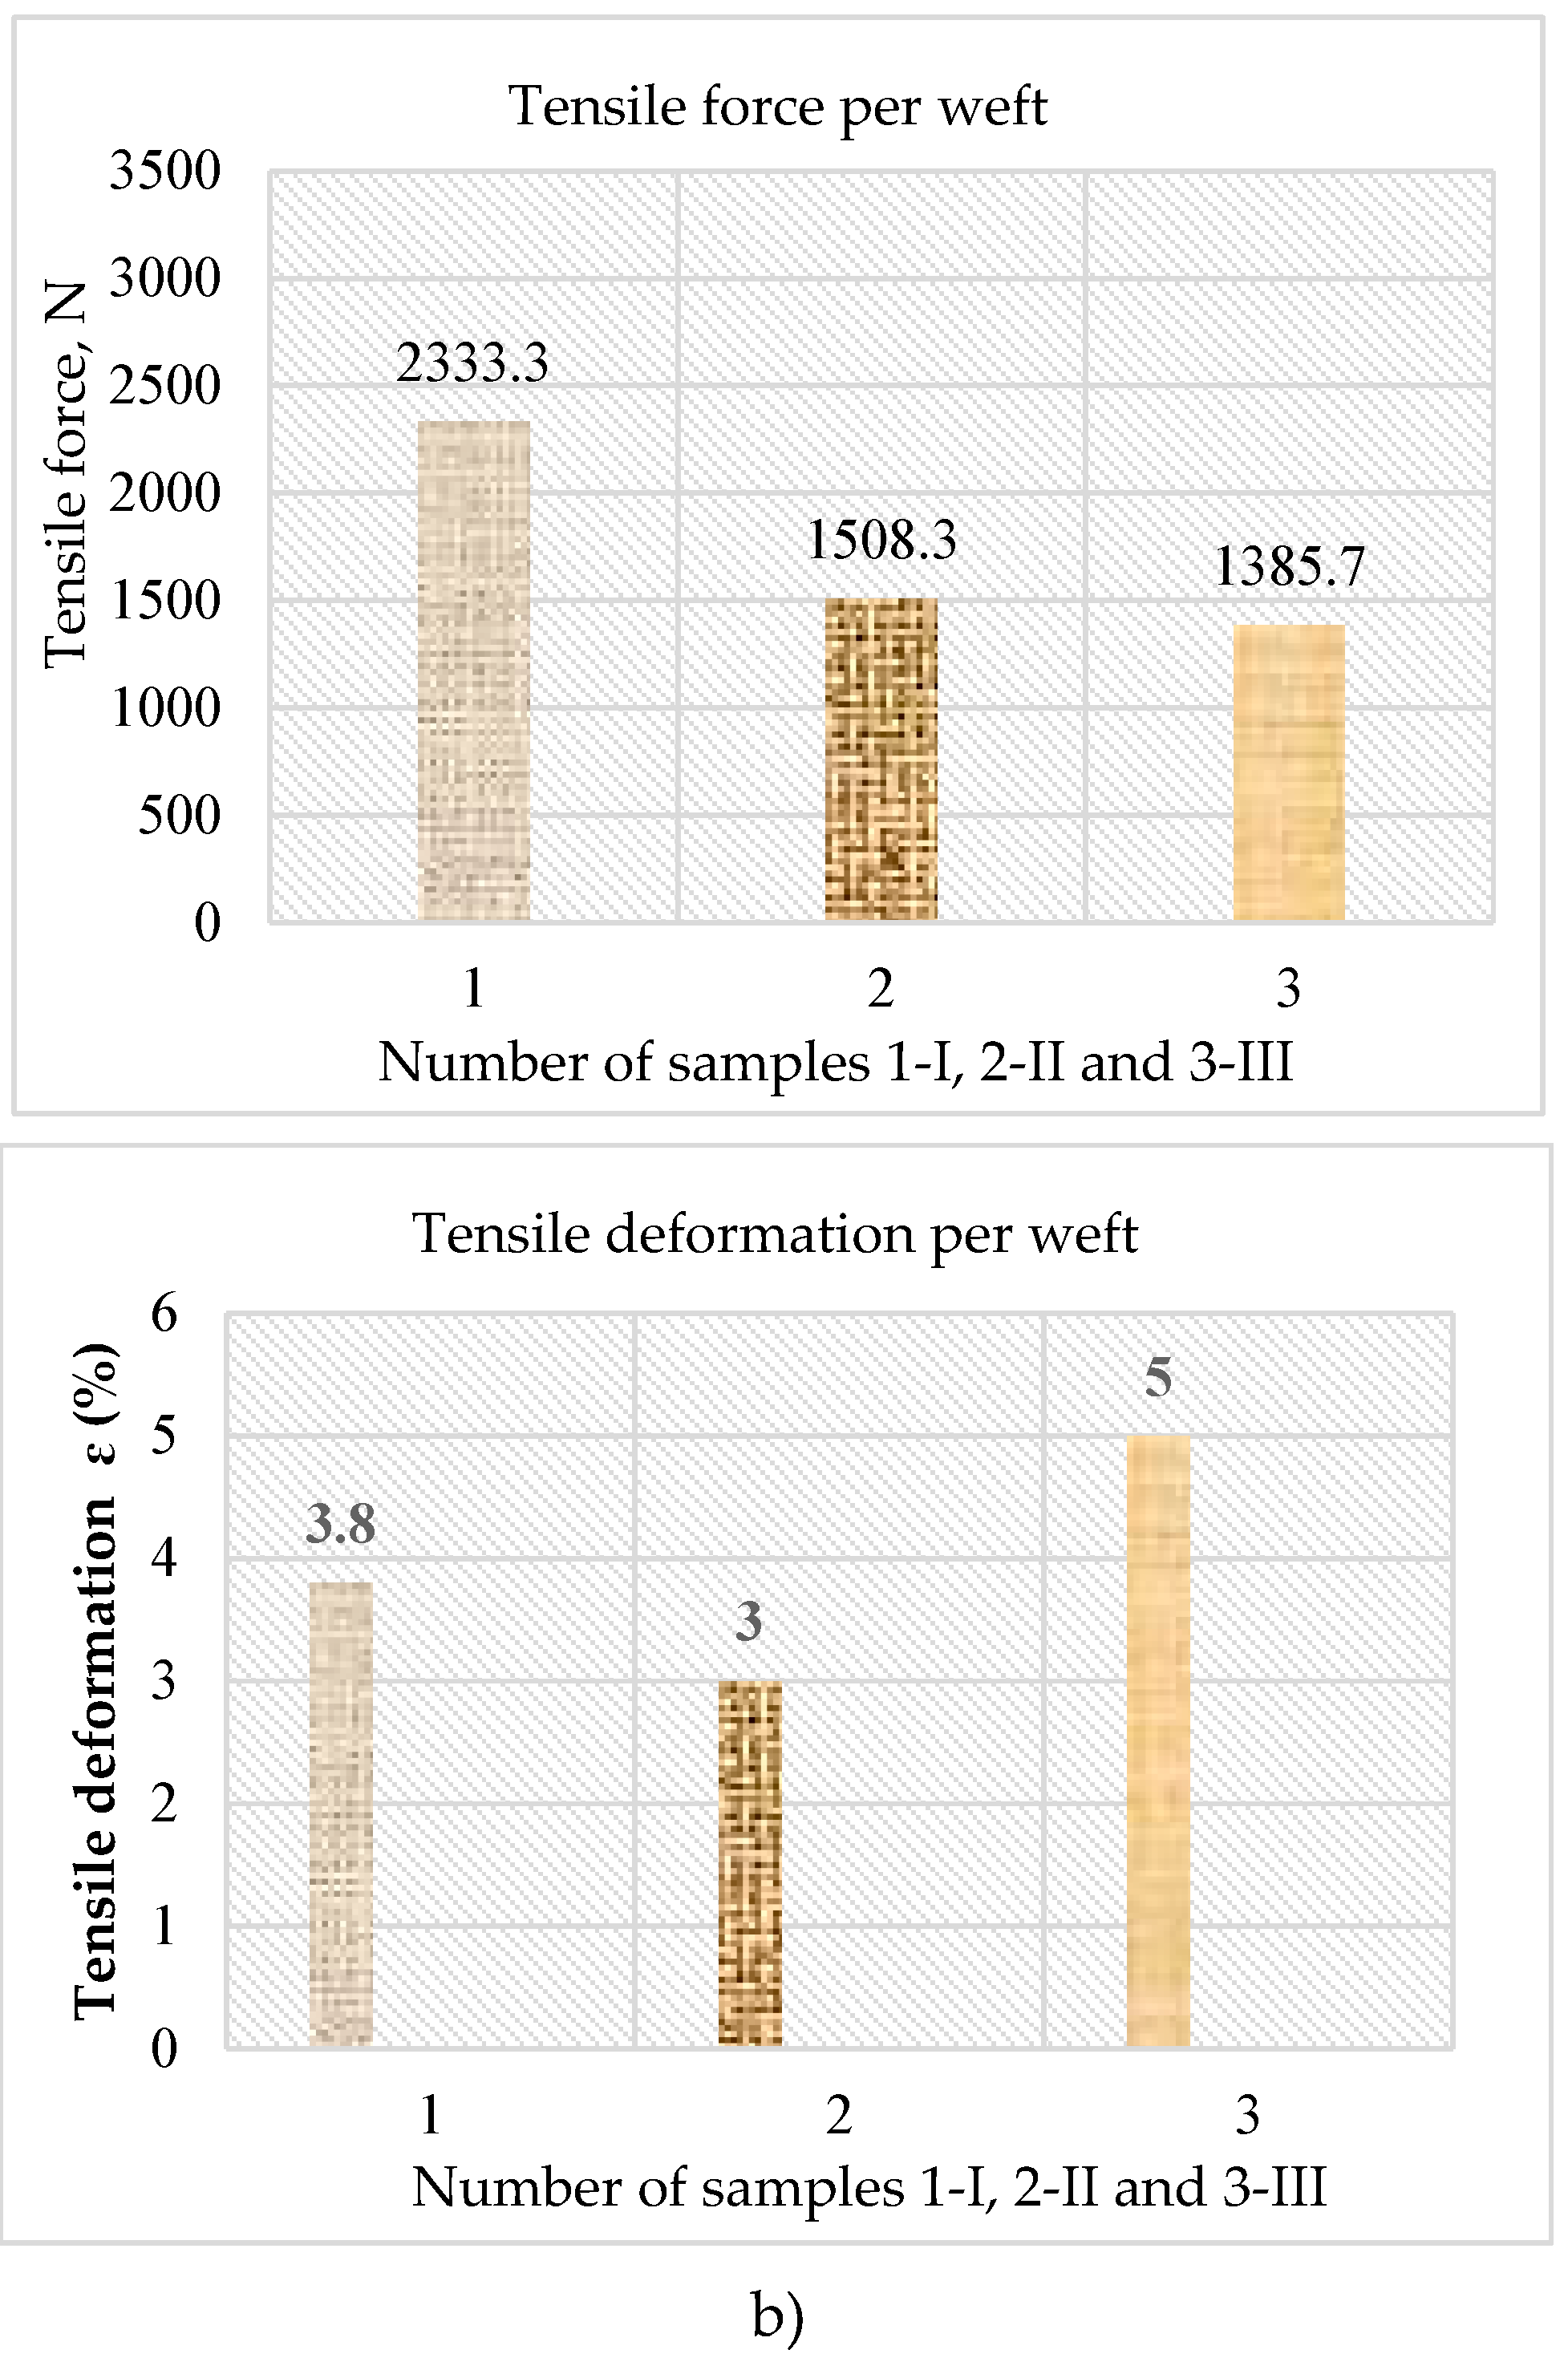
Figure 8.
Diagrams from DSC instrument.
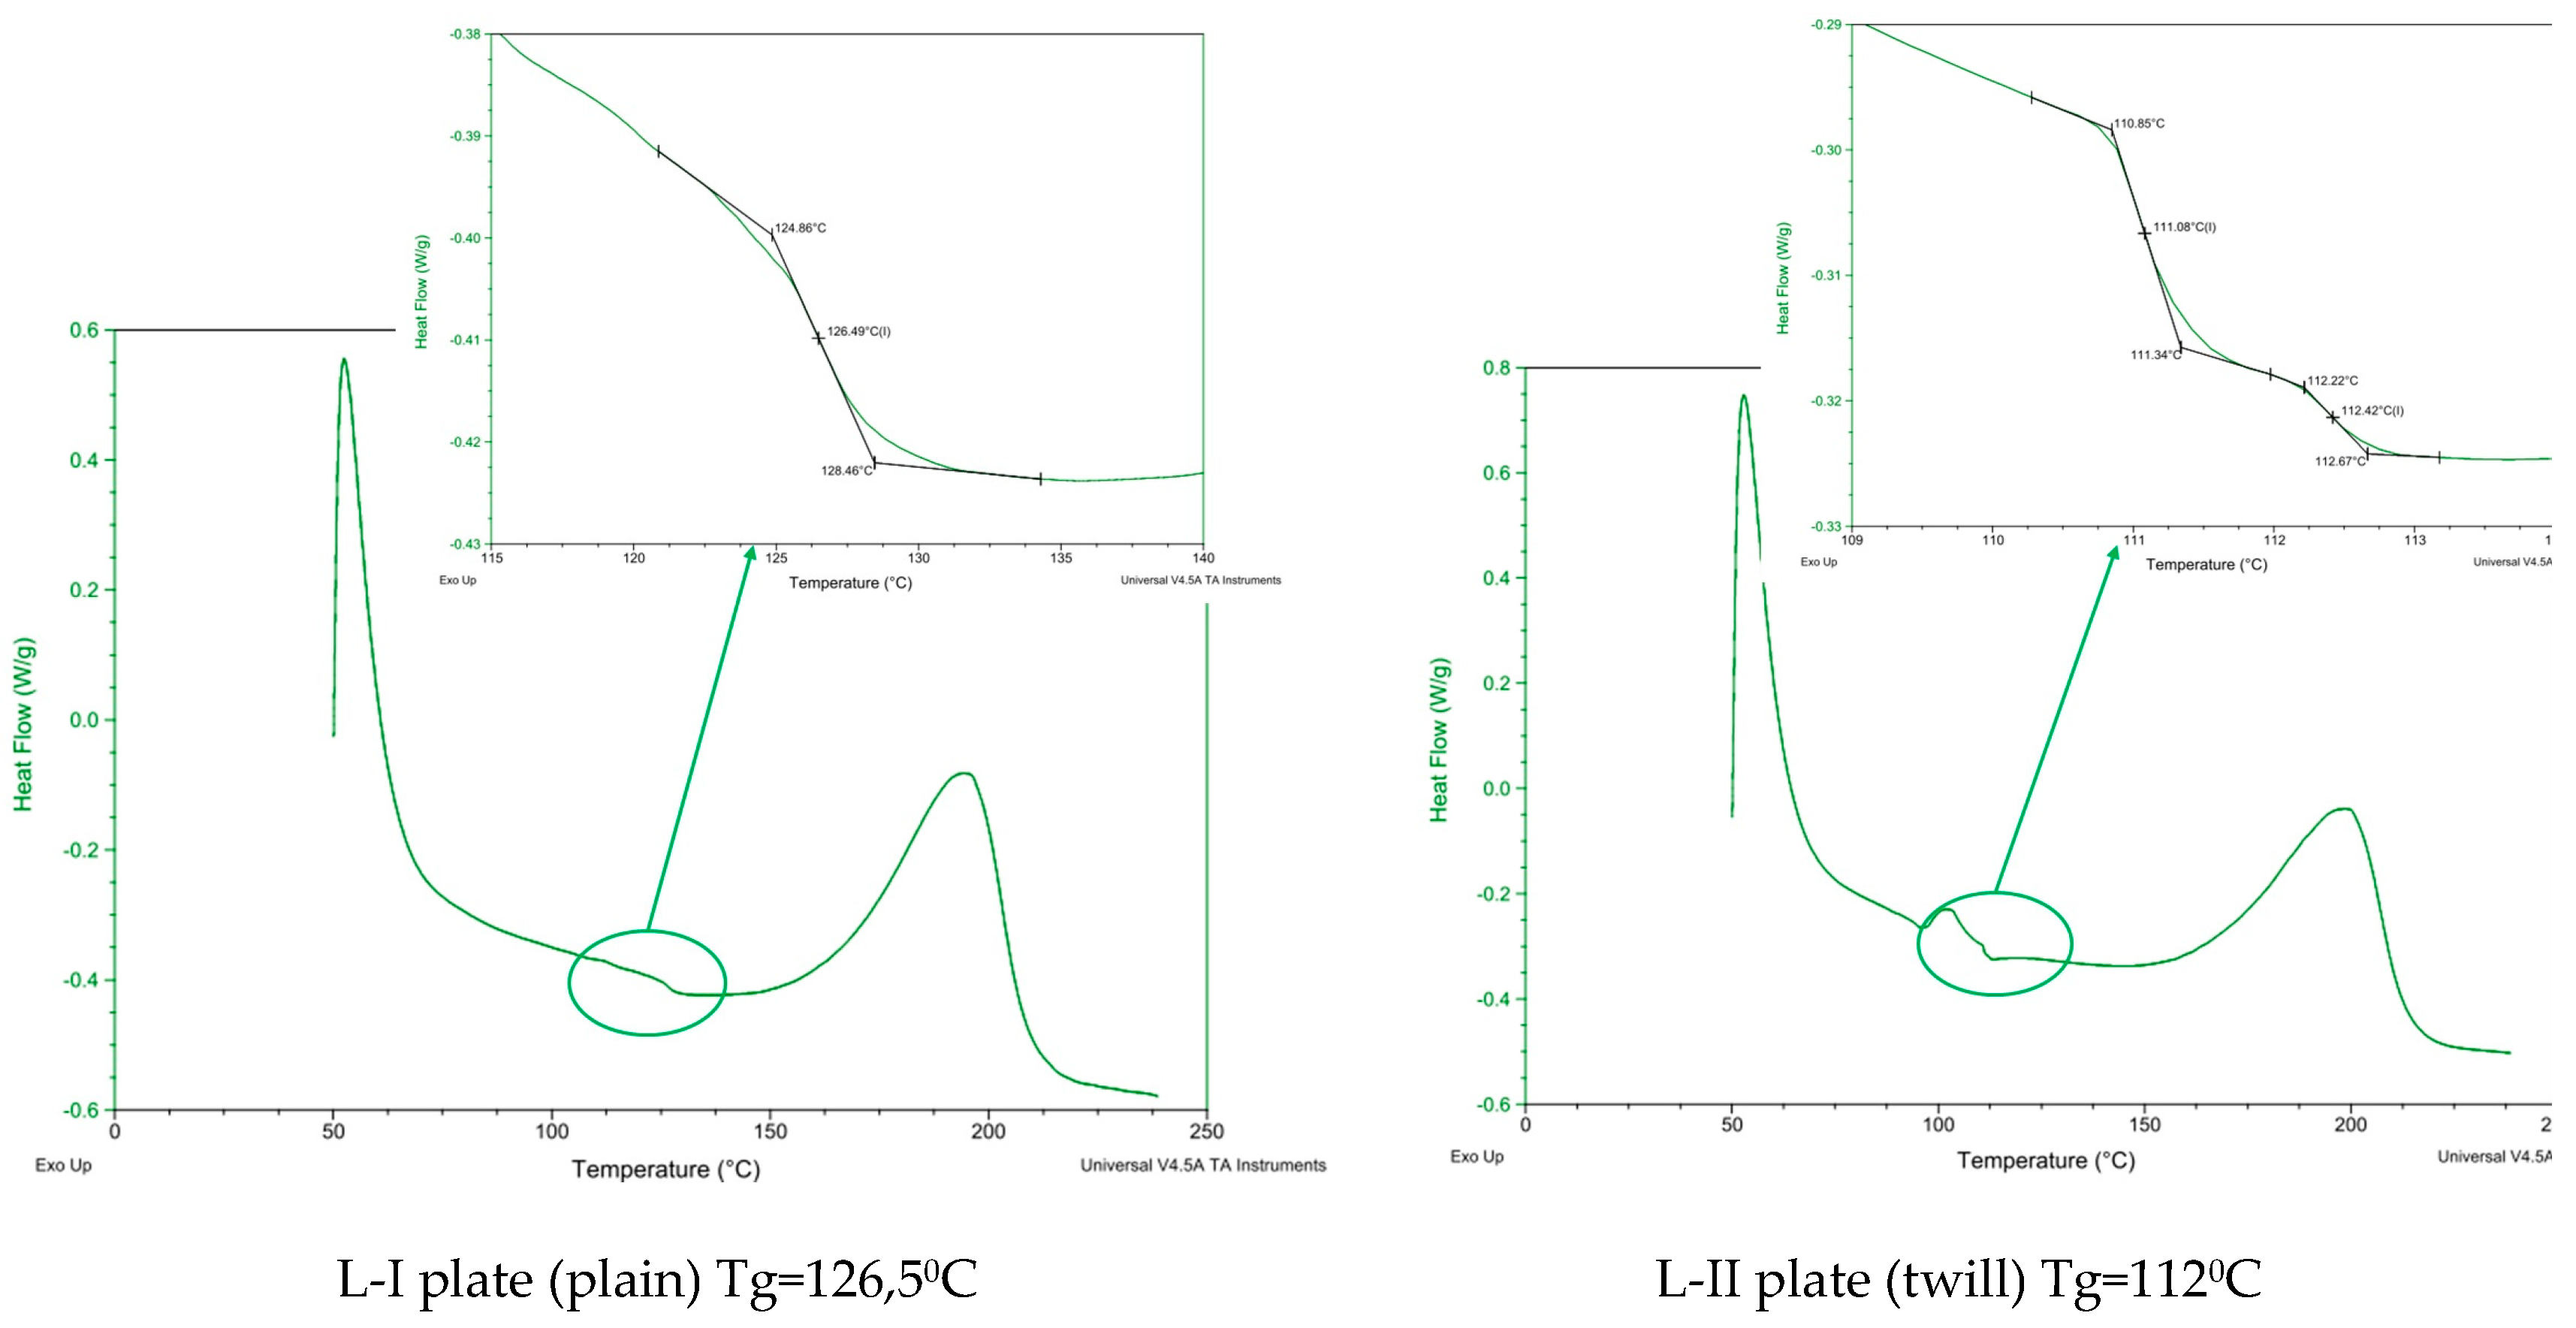
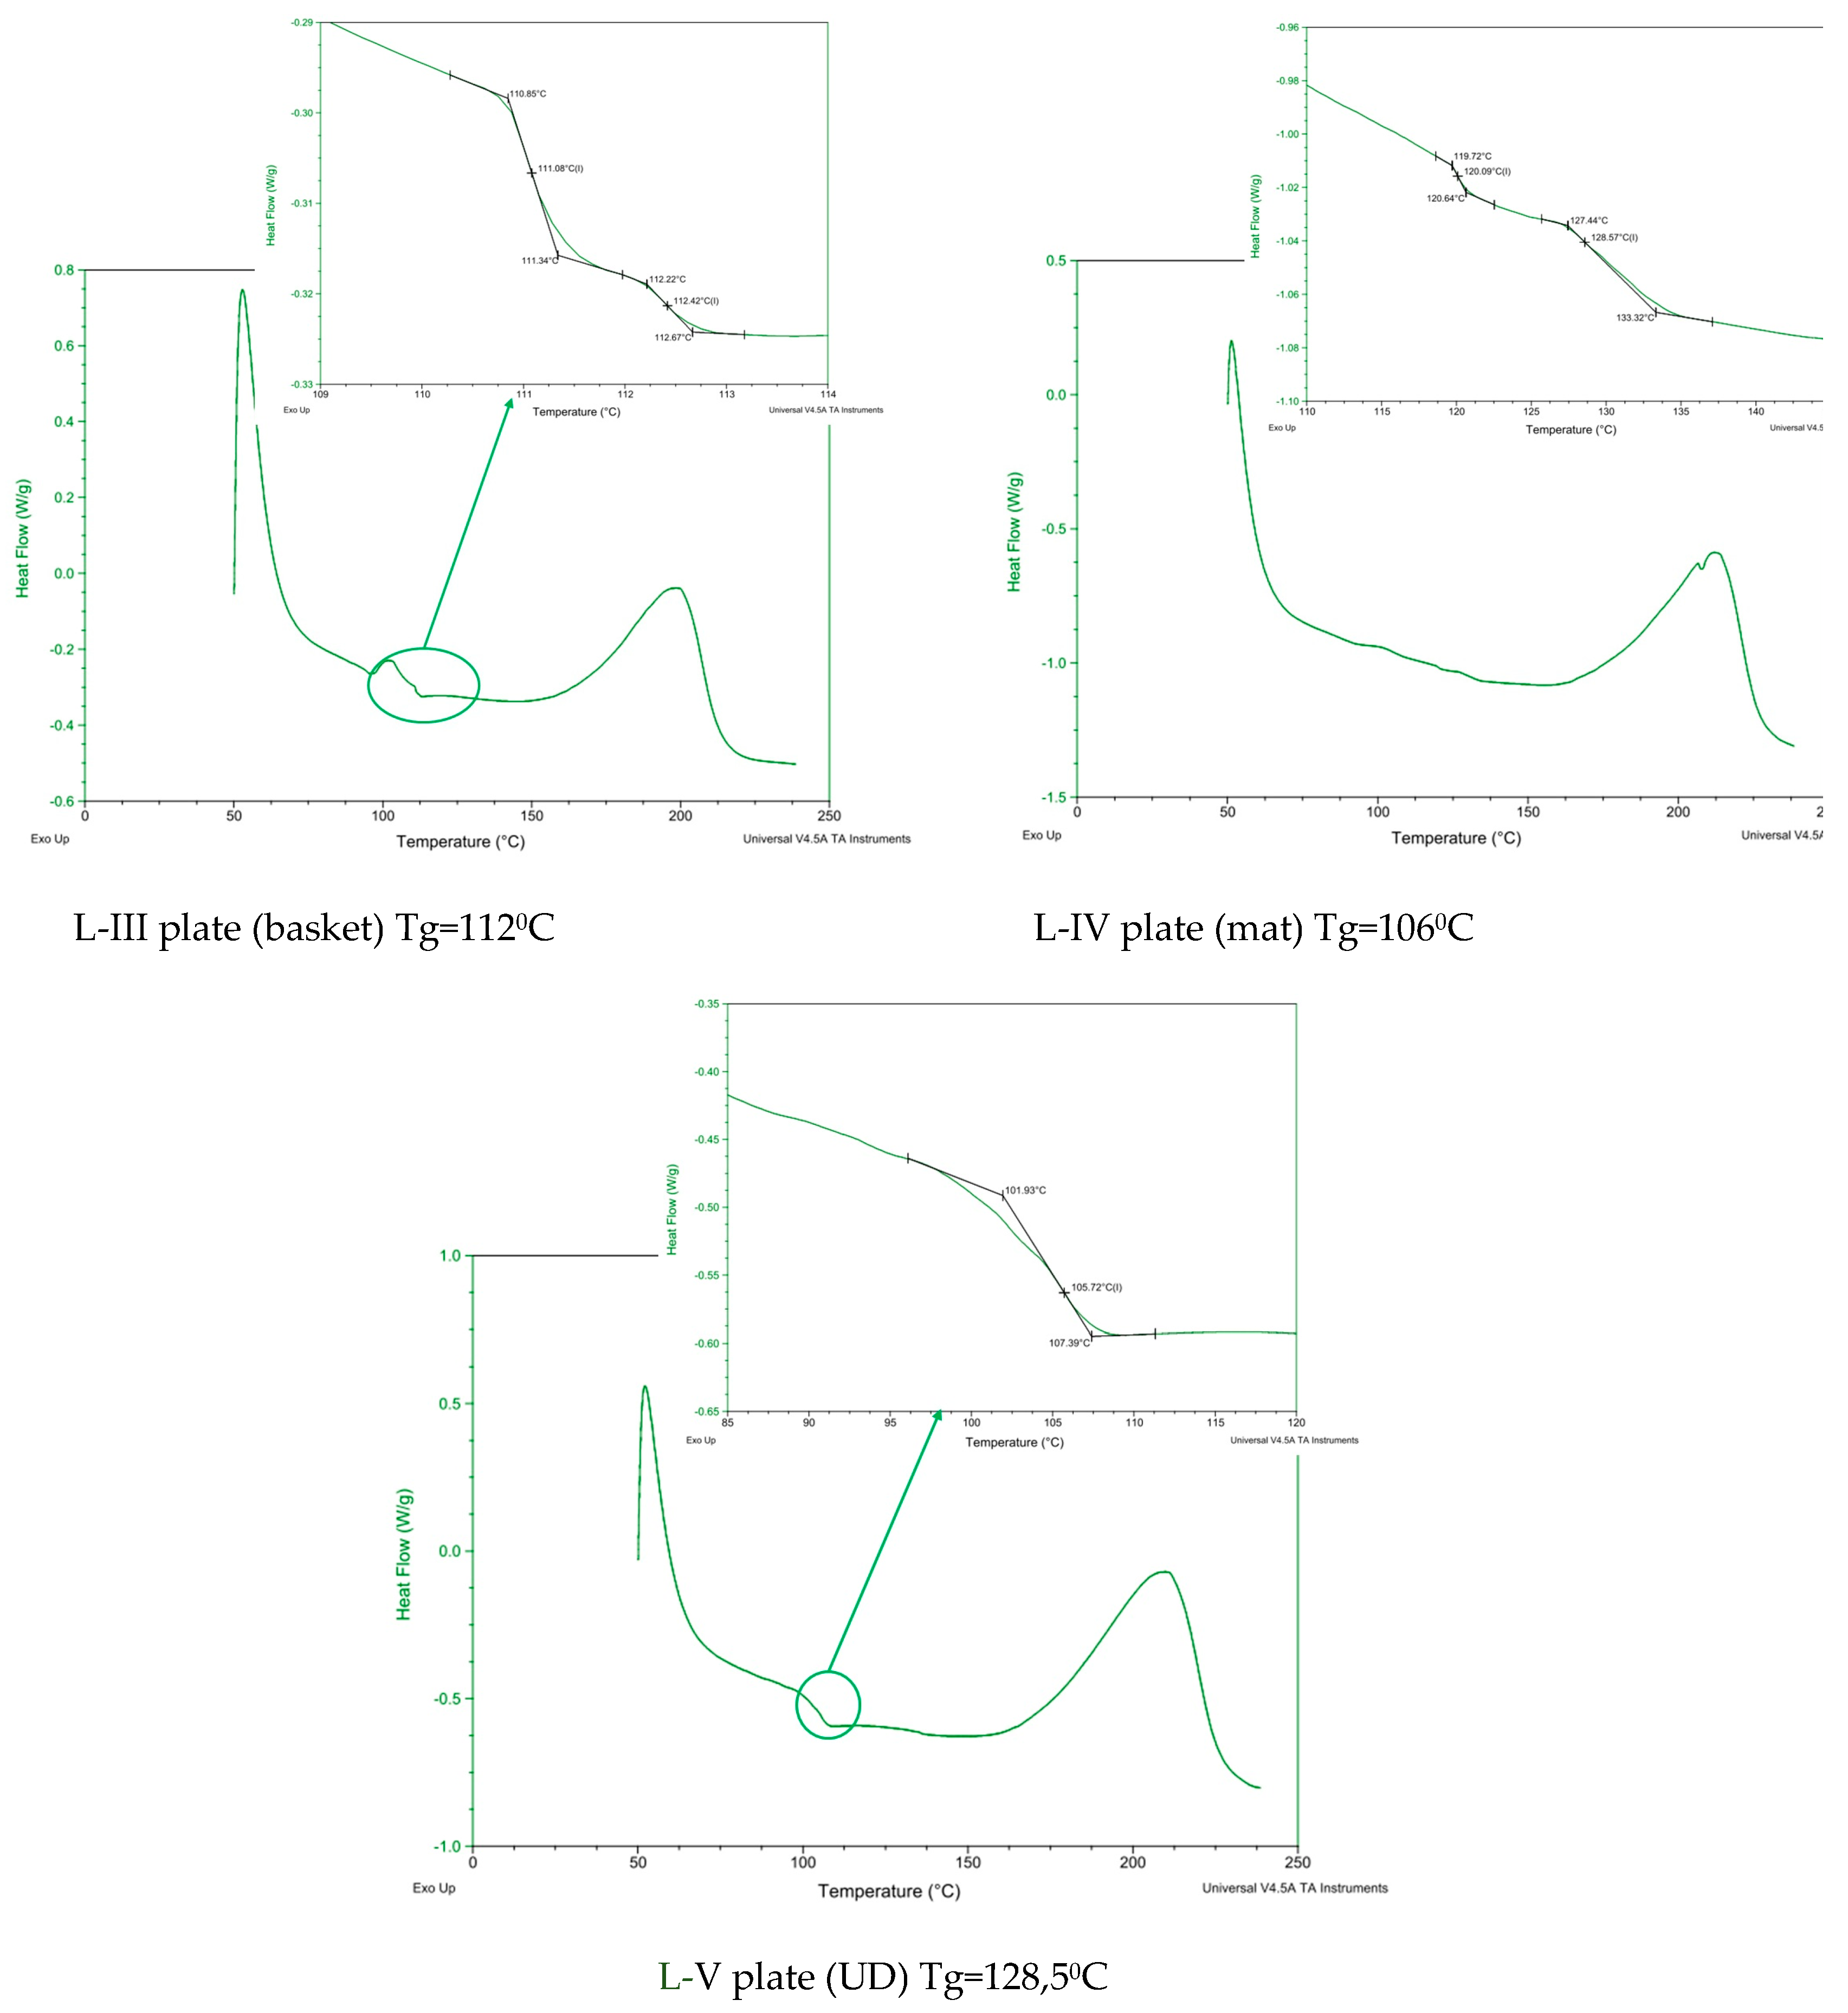
Figure 9.
Force and displacement graphs for L-V MD and L-V CD test samples.

Figure 10.
Flexural strength of composite plates.
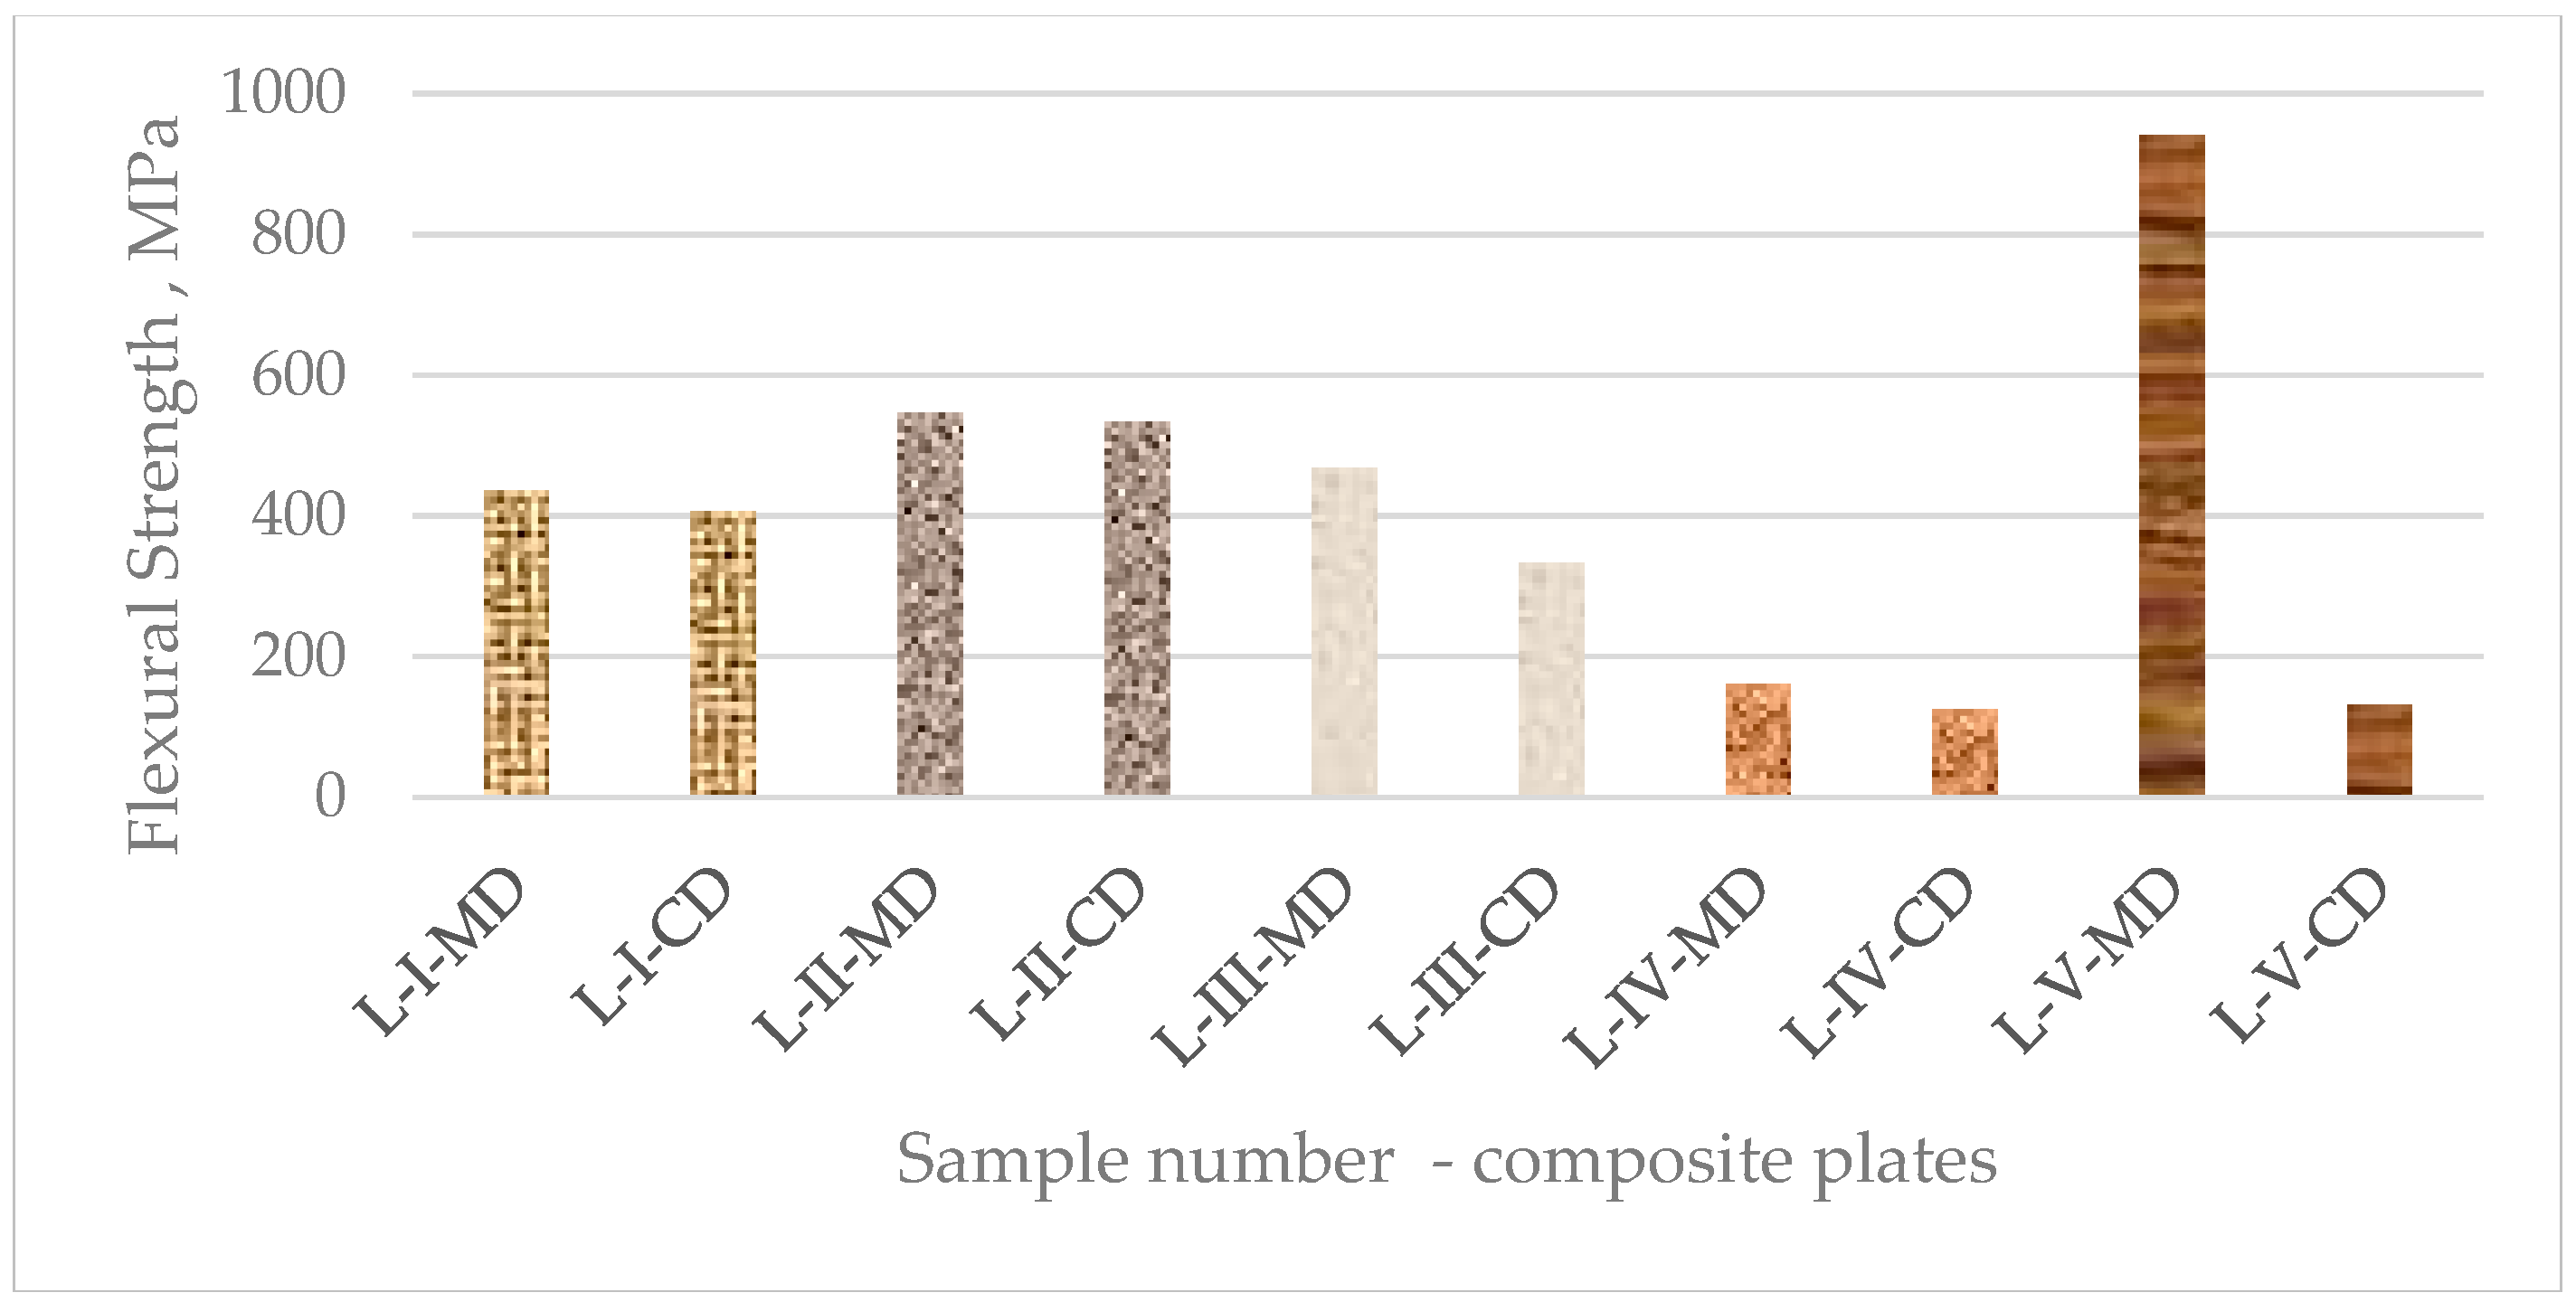
Figure 11.
Flexural modulus of composite plates.
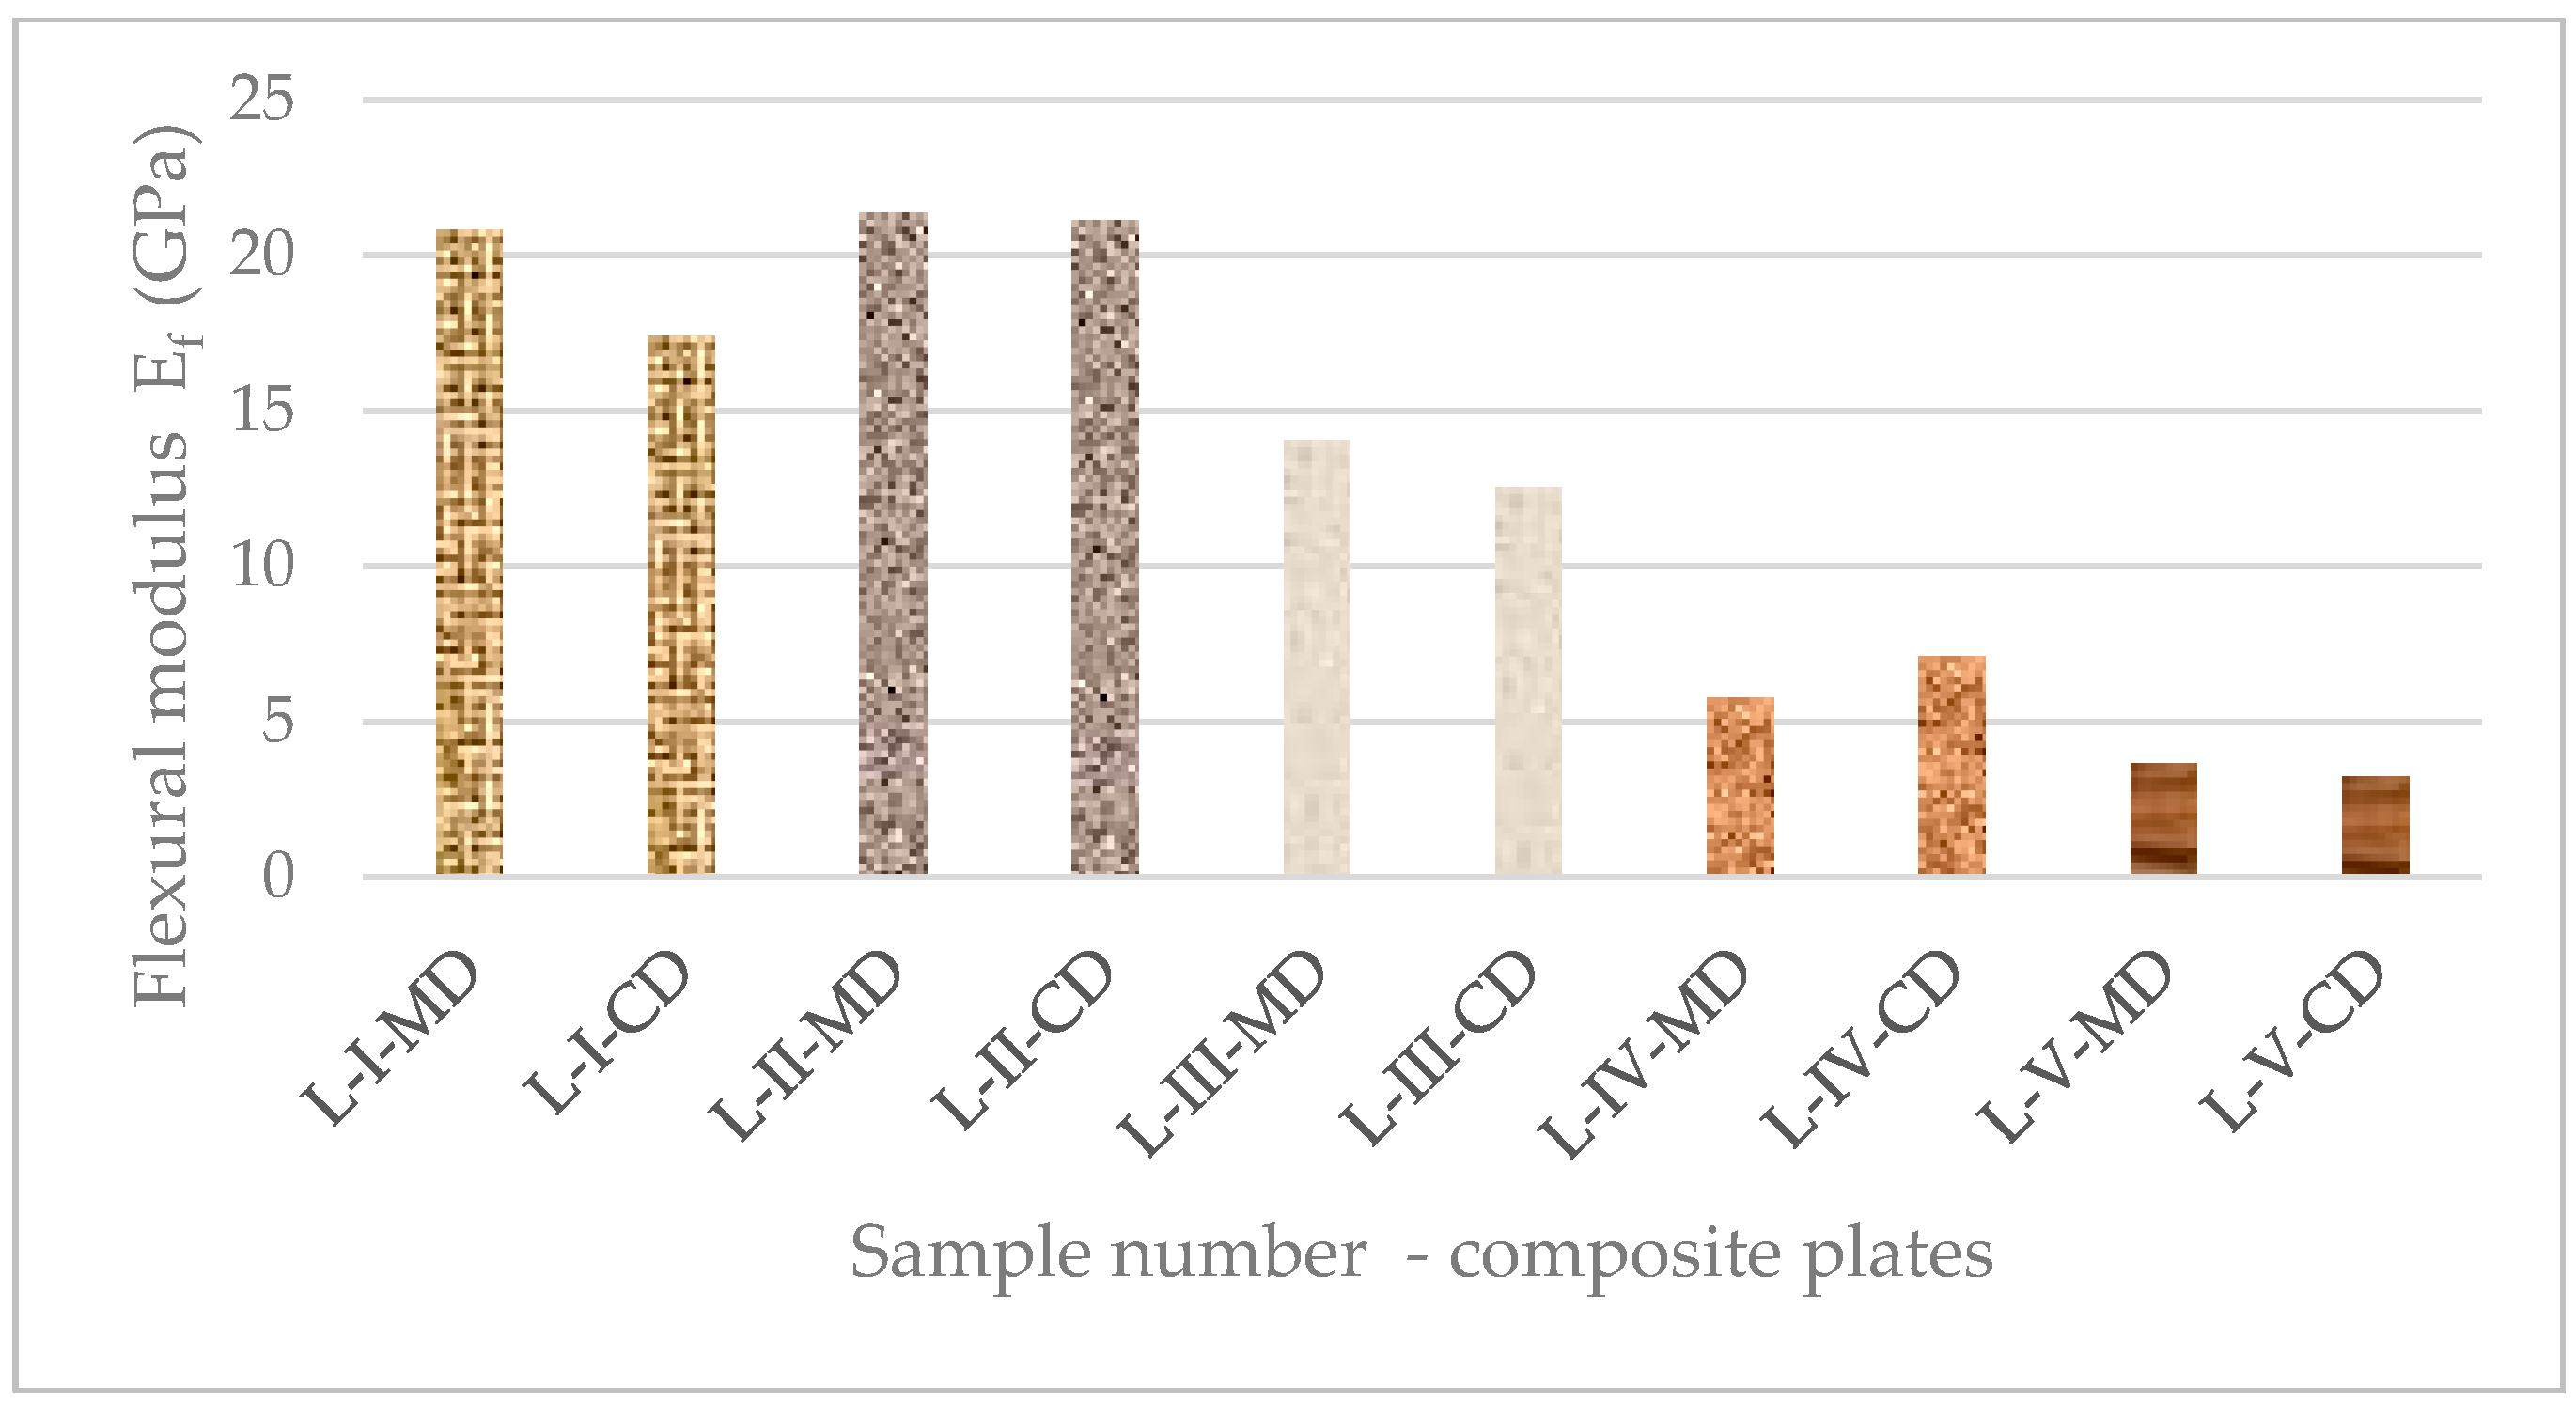
Figure 12.
a) SEM Microphotographs from glass fabric epoxy prepreg b, c) Optical and SEM Microphotographs from composite palates.
Figure 12.
a) SEM Microphotographs from glass fabric epoxy prepreg b, c) Optical and SEM Microphotographs from composite palates.
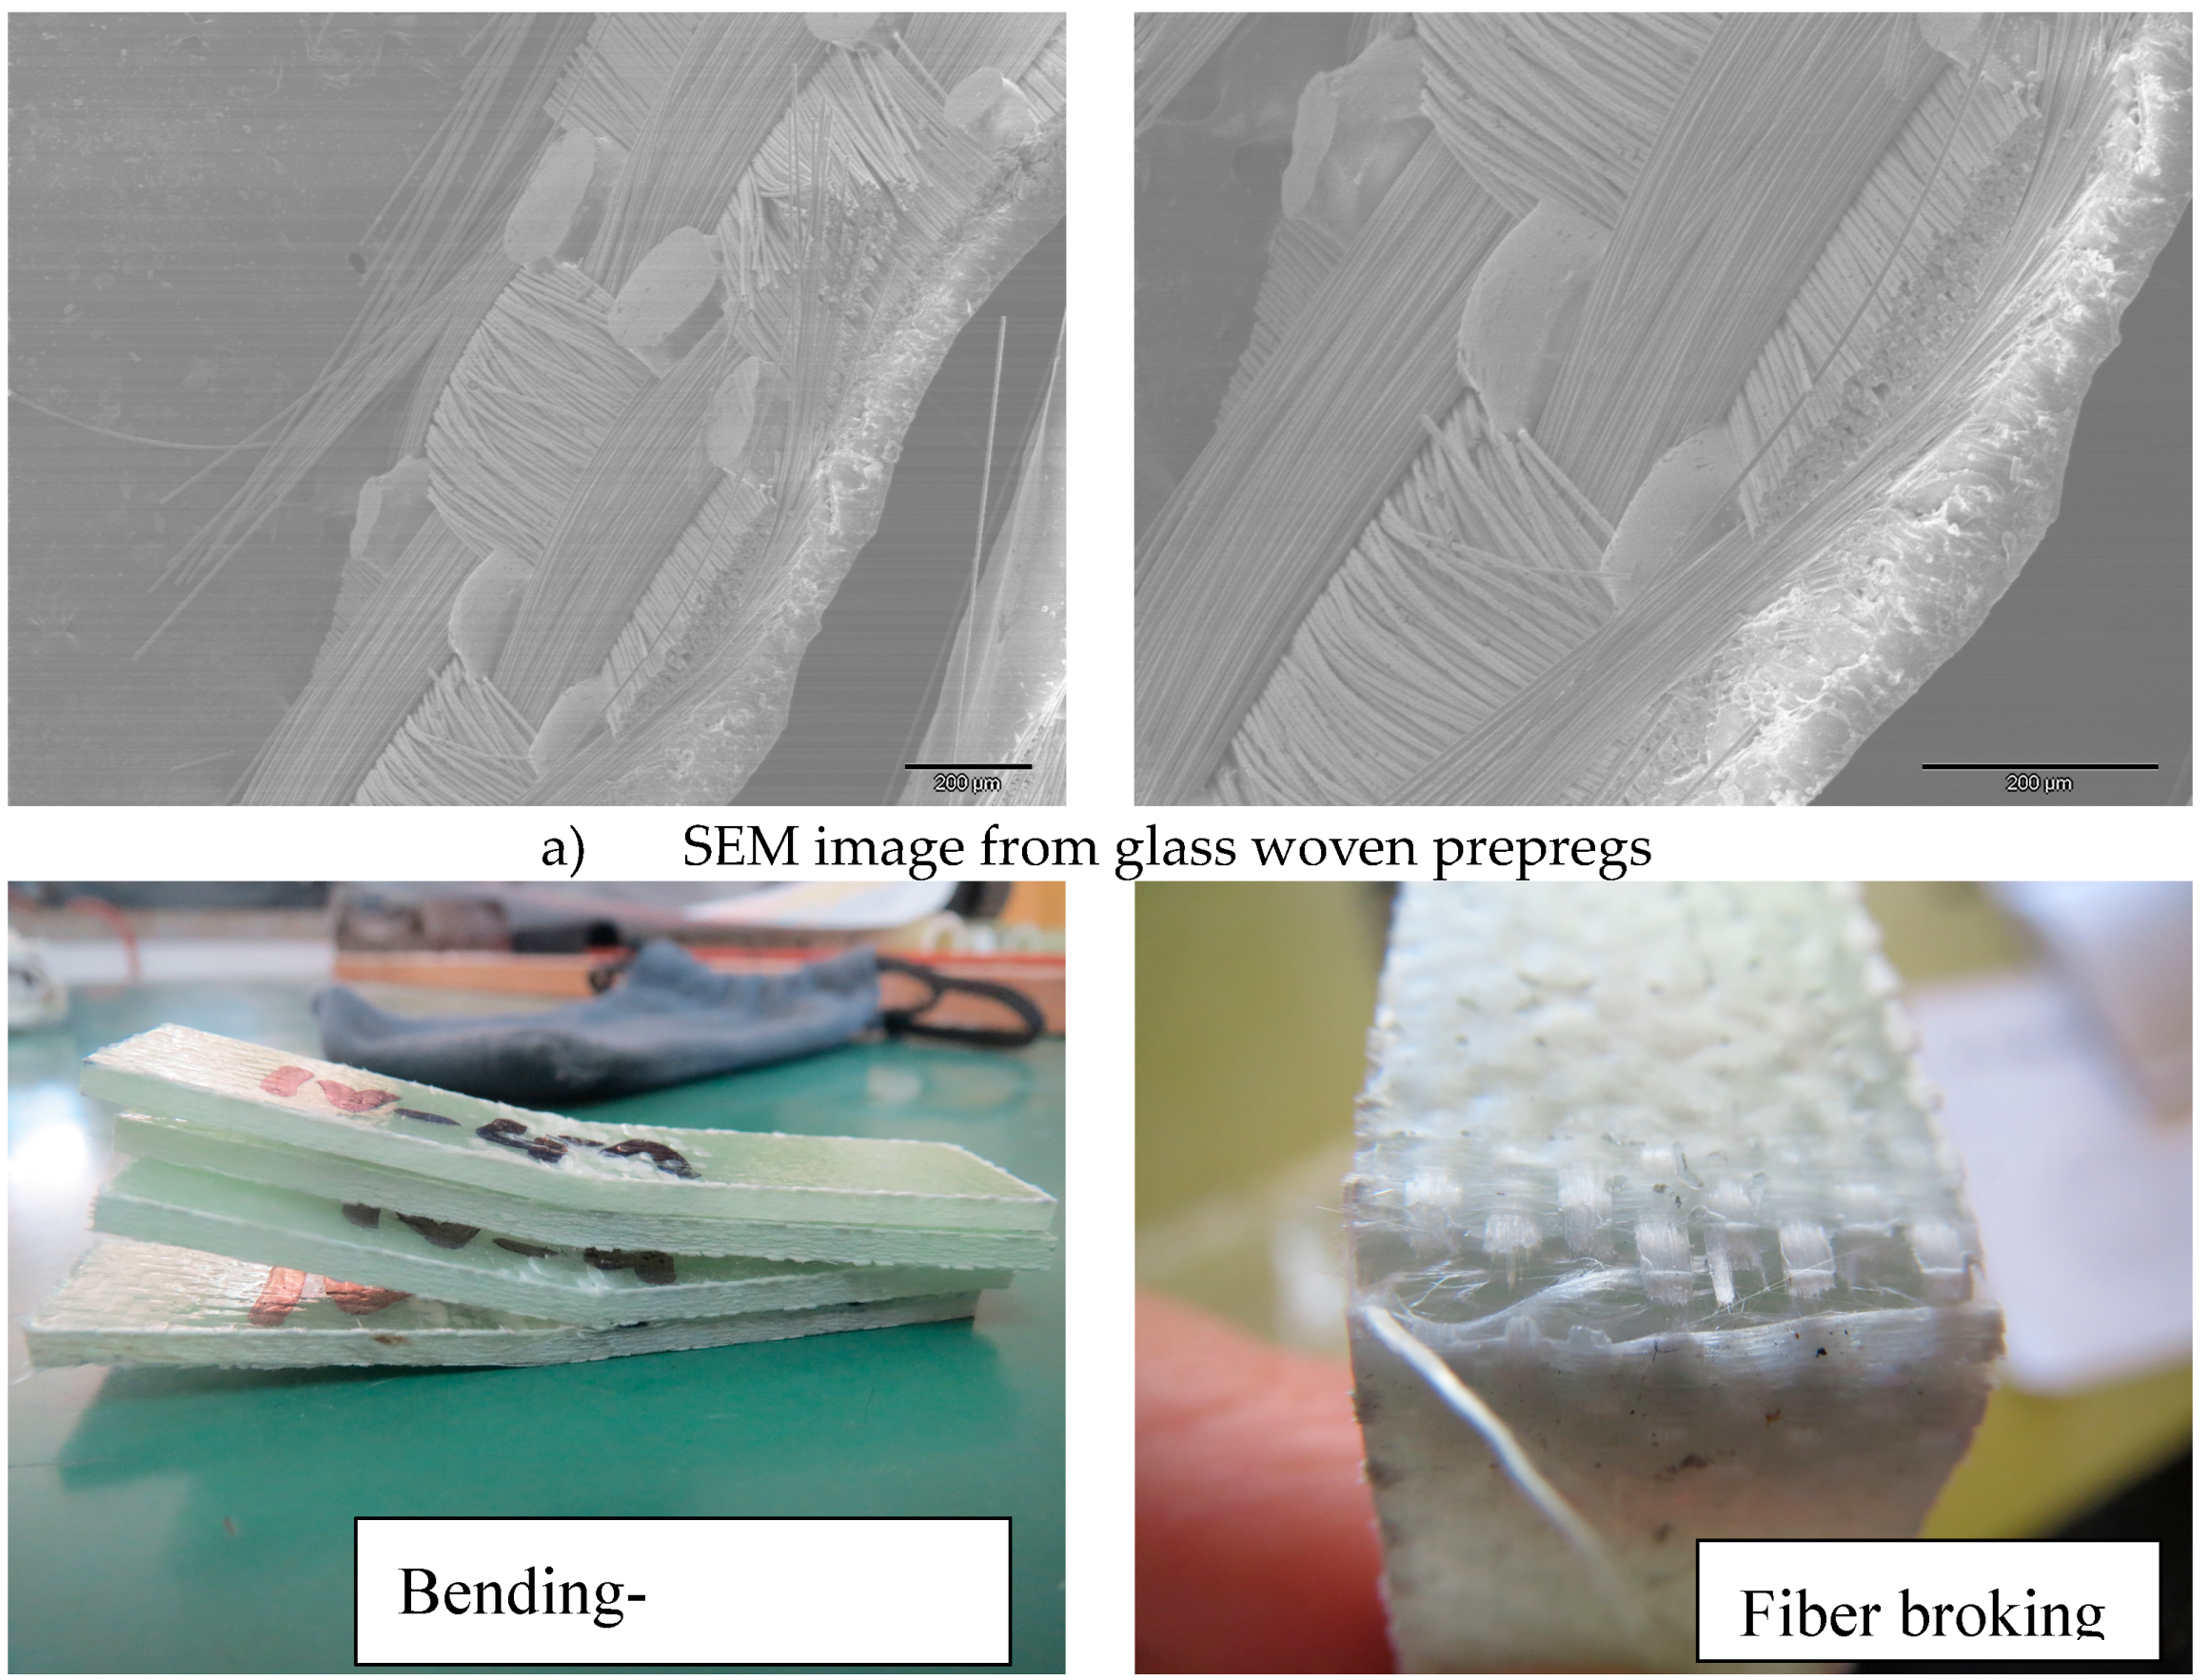
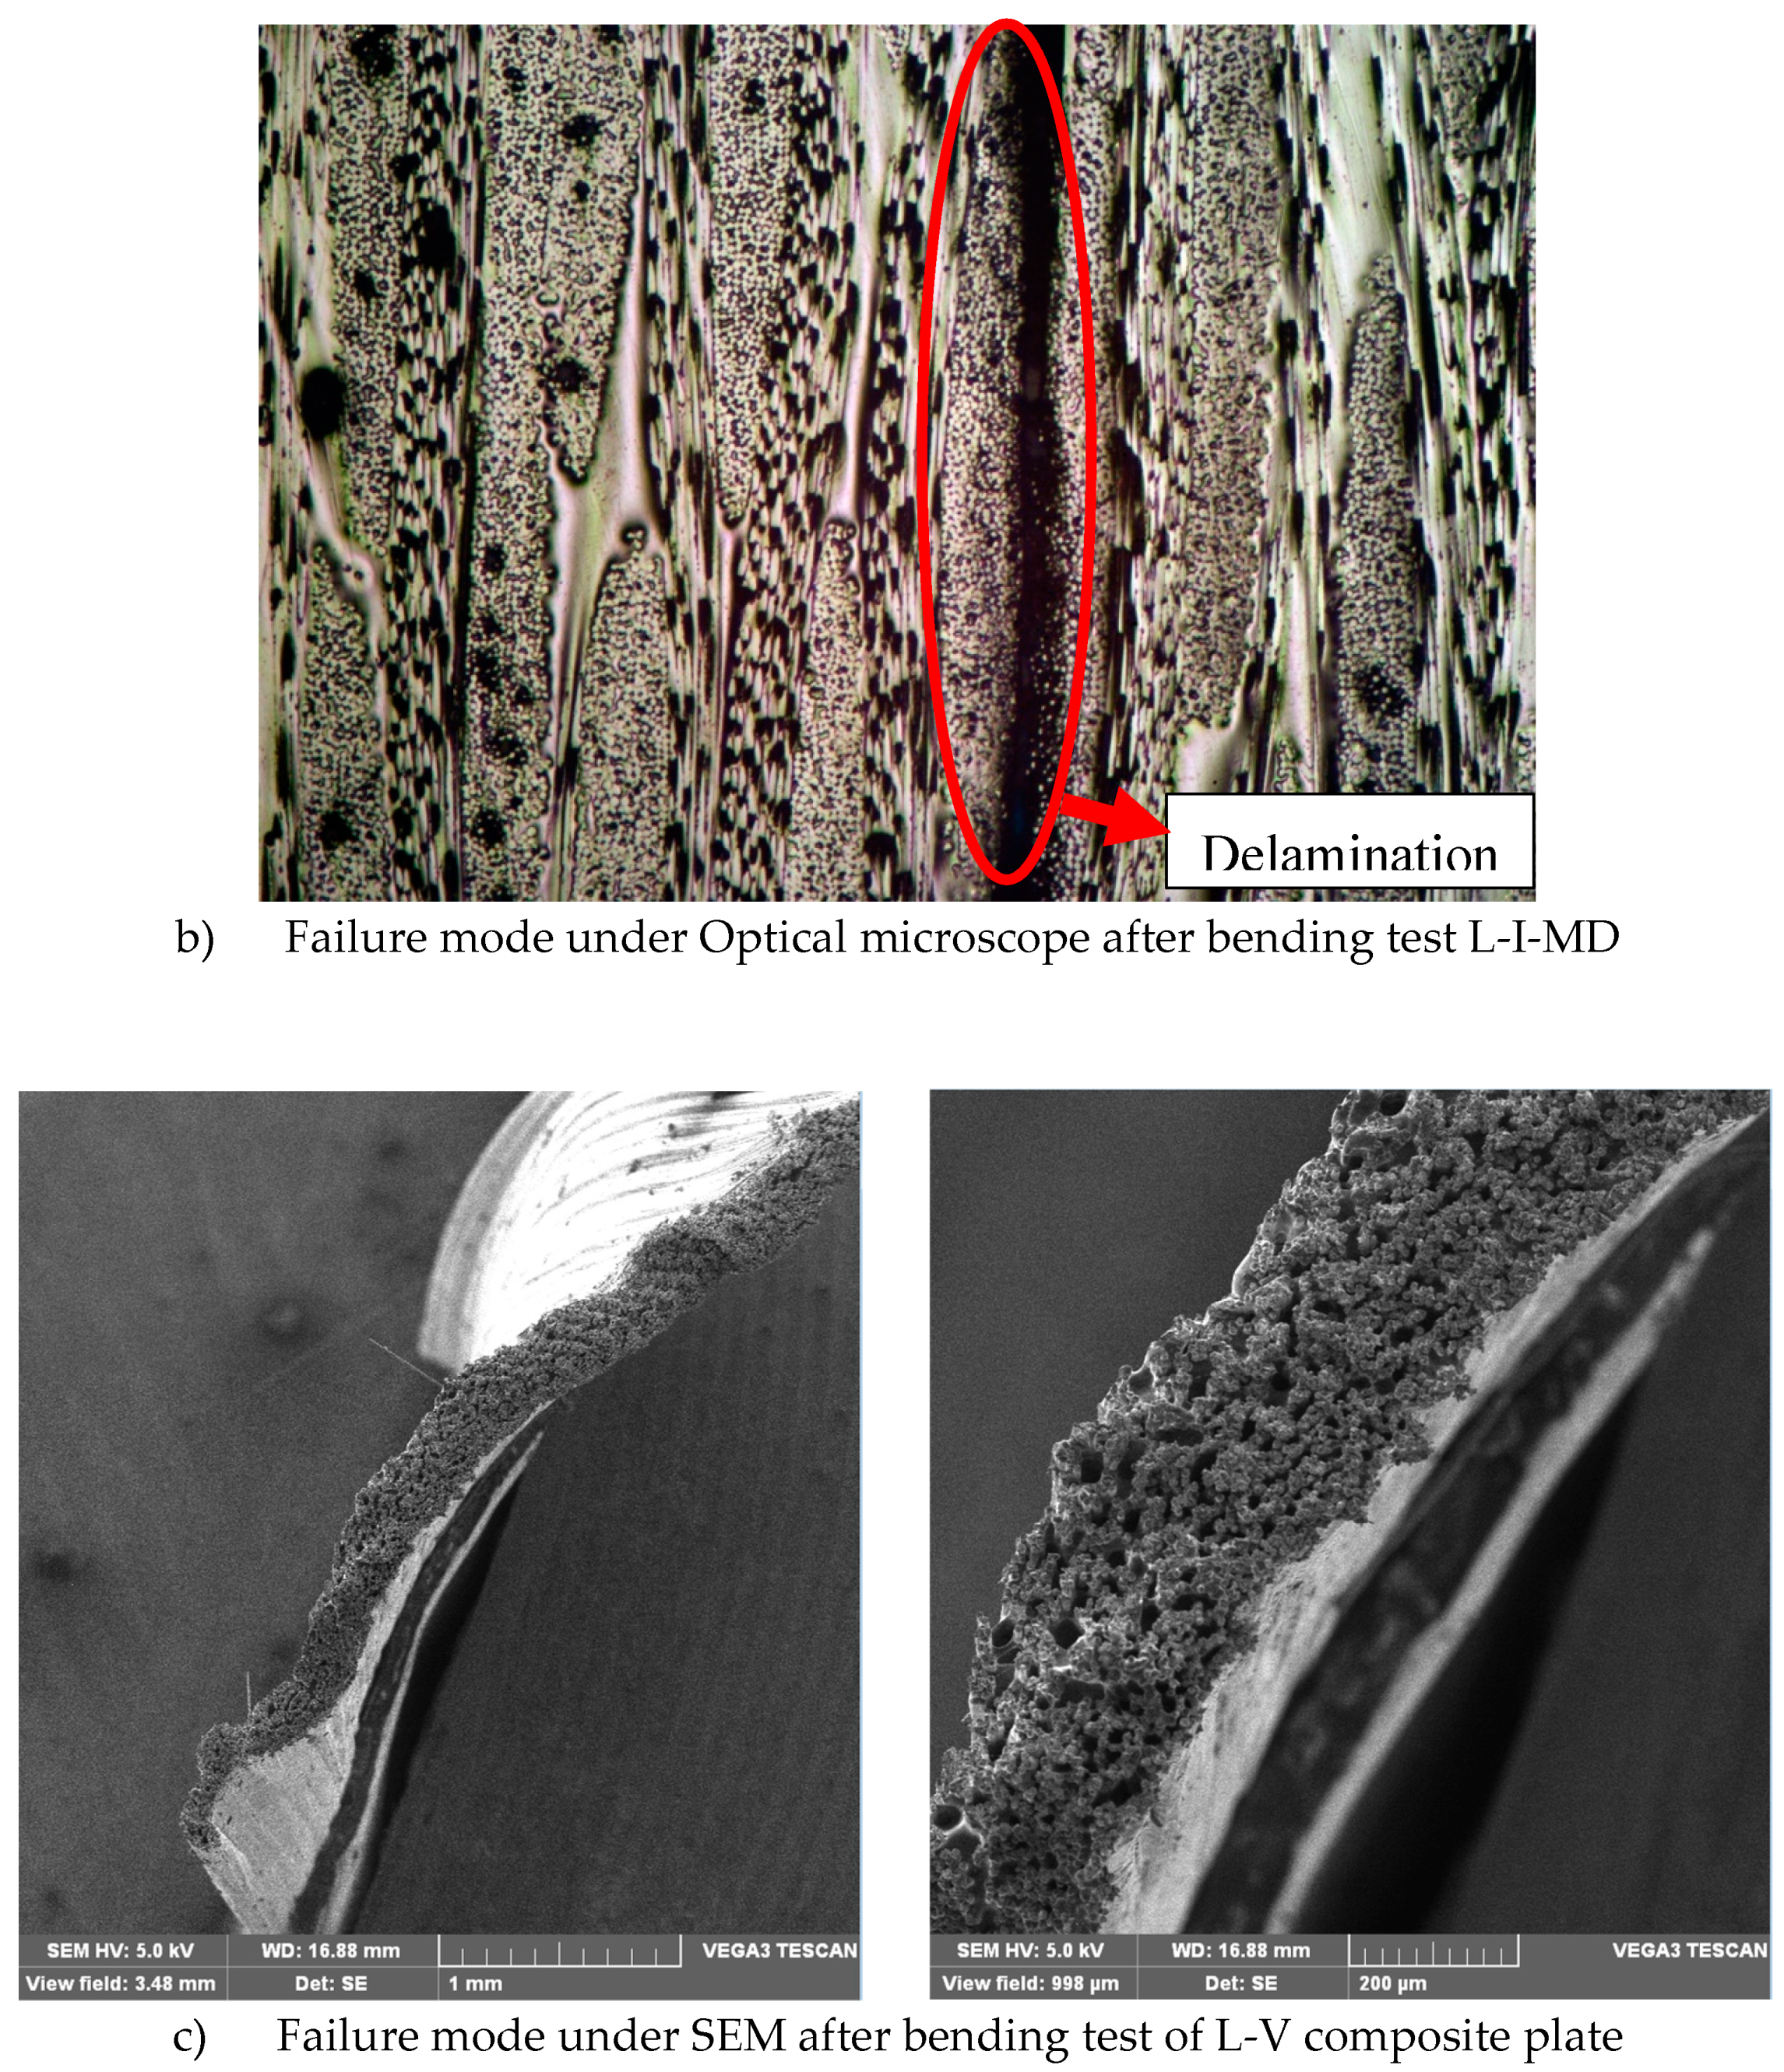

Table 1.
Basic characteristics and assignation of textile structures.
| Characteristic | Assignation | ||||
|---|---|---|---|---|---|
| woven | non-woven | ||||
| Sample I | Sample II | Sample III | Sample IV | ||
 | |||||
| Fiber type | E-glass | E-glass | E-glass | E-glass | |
| Mass per unit area (g/m2) | 300±20 | 320±20 | 320±25 | 300±25 | |
| Thickness (mm) | 0,3 | 0,32±0,05 | 0,31 | 0,3 | |
| Width (cm) | 100 | 92 | 100 | 125 | |
| Count (ends/cm) | Warp | 8±1 | 8±1 | 6±1 | Moisture content (%) < 30 |
| Weft | 7±1 | 6±1 | 5±1 | ||
| Strength (N/25mm) | Warp | ≥2000 | ≥2000 | ≥1800 | |
| Weft | ≥1200 | ≥1400 | ≥1200 | ||
Table 2.
Characteristics of the components of the epoxy resin system.
| Epoxy resin (D.E.R 3821) | Polypox H 766 | ||||
|---|---|---|---|---|---|
| Epoxide equiv. weight (g/eq) | 176 – 183 | H – equivalent weight (g/Equiv.) | 55 | ||
| Epoxide percentage (%) | 23,5 – 24,4 | / | / | ||
| Epoxide group content (mmol/kg) | 5460 – 5680 | Amine number (mg KOH/g) | 540 ± 15 | ||
| Color (Platinum cobalt) | 125 Маx. | Color (Gardner) | blue | ||
| Viscosity @ 25°C (mPa∙s) | 9000 – 10500 | Viscosity at 25°C, (mPa∙s) | 14 | ||
| Density at 25°C, (g/cm3) | 1,16 | Density at 25°C, (g/cm3) | 0,94 ± 0,05 | ||
| Epichlorohydrin content (ppm) | 5 Маx. | / | / | ||
Table 3.
Characteristics of prepregs.
| Unit | Produced prepregs (woven/nonwoven) |
Commercial UD prepreg (SIGRAPREG® G U300-0/NF-E320/35%) |
|
|---|---|---|---|
| Fiber type | / | E-glass | E-glass |
| Volatile content | % wt. | Less than 2% | Less than 1% |
| Resin content | % wt. | 30-33% (+/-5%) | 35% (+/-2%) |
| Prepreg areal weight | gr/m2 | 500 | 462 |
| Fiber areal weight | gr/m2 | 300-310 | 300 |
| Thickness | mm | 0,5 | 0,46 |
| Width | mm | 920-1000 | 420 |
Table 4.
Assignation of the composite plates and processing conditions.
| Sample L-I | Sample L-II | Sample L-III | Sample L-IV | Sample L-V | |
|
Structure of laminate panel |
10 layers prepreg with plain fabric |
10 layers prepreg with twill fabric |
10 layers prepreg with basket fabric |
10 layers prepreg with mat |
10 layers UD prepreg |
| Temperature of curing (°С) | 80 | 80 | 80 | 80 | 90 |
| Curing time (min) | 60 | ||||
| Temperature of post curing (°С) | 110 | 110 | 110 | 110 | 110 |
| Post curing time (min) | 60 | ||||
| Specific pressure kg/cm² (bar) | 14 (30) | ||||
Table 5.
Constituent content and void content in the composite samples.
| Sample number | (%) | (%) | (%) | (%) | Average voids, (%) |
|---|---|---|---|---|---|
| L -I | 30,94 | 69,06 | 49,74 | 47,70 | 2,56 |
| L -II | 29,81 | 70,19 | 49,08 | 49,67 | 1,25 |
| L - III | 33,40 | 66,60 | 53,59 | 45,92 | 0,85 |
| L - IV | 39,22 | 60,78 | 58,41 | 38.87 | 5,28 |
| L - V | 23,30 | 76,10 | 41,18 | 56,37 | 2,46 |
Table 6.
Flexural strength, modulus, and strain at all composite plates.
| Sample number | ) | (MPa) | (% ) | ||
|---|---|---|---|---|---|
| L-I | L-I - MD | 543,364 | 436,733 | 2,265 | 20,832 |
| L-I - CD | 506,286 | 406,544 | 3,259 | 17,420 | |
| L-II | L-II - MD | 603,63 | 546,934 | 3,726 | 21,360 |
| L- II - CD | 612,79 | 534,399 | 3,453 | 21,120 | |
| L-III | L-III- MD | 904,85 | 468,808 | 3,774 | 14,045 |
| L-III - CD | 659,18 | 333,63 | 3,767 | 12,547 | |
| L-IV | L-IV - MD | 648,70 | 161,589 | 5,081 | 5,771 |
| L-IV - CD | 647,31 | 125,053 | 3,812 | 7,101 | |
| L-V | L-V - MD | 3189,5 | 940,108 | 86,922 | 3,662 |
| L-V - CD | 472,36 | 131,3775 | 23,938 | 3,25 | |
Disclaimer/Publisher’s Note: The statements, opinions and data contained in all publications are solely those of the individual author(s) and contributor(s) and not of MDPI and/or the editor(s). MDPI and/or the editor(s) disclaim responsibility for any injury to people or property resulting from any ideas, methods, instructions or products referred to in the content. |
© 2024 by the authors. Licensee MDPI, Basel, Switzerland. This article is an open access article distributed under the terms and conditions of the Creative Commons Attribution (CC BY) license (http://creativecommons.org/licenses/by/4.0/).
Copyright: This open access article is published under a Creative Commons CC BY 4.0 license, which permit the free download, distribution, and reuse, provided that the author and preprint are cited in any reuse.


