
Submitted:
23 November 2024
Posted:
26 November 2024
You are already at the latest version
Preprints on COVID-19 and SARS-CoV-2
Abstract
The coronavirus disease 2019 (COVID-19) pandemic profoundly disrupted respiratory virus epidemiology through widespread non-pharmaceutical interventions (NPIs), such as mask-wearing and social distancing. This retrospective study explores the seasonal patterns and incidence of influenza virus, respiratory syncytial virus (RSV), and other respiratory viruses over an eight-year period in Jalisco, Mexico, to understand shifts in virus circulation across the prepandemic, pandemic, and postpandemic phases. Weekly case counts were analyzed using an interrupted time series (ITS) model, segmenting the timeline into these three distinct phases. The ITS results revealed abrupt reductions in viral incidence during the pandemic, followed by notable resurgences as NPIs were relaxed. Influenza A (H3) predominated in 2022, while influenza B surged in 2023, and Influenza A H1N1 cases increased subsequently. RSV exhibited an earlier onset and heightened activity compared to prepandemic trends. Other viruses, including human enterovirus/rhinovirus and human parainfluenza virus, showed altered patterns, with some failing to return to prepandemic seasonality. These findings highlight the complex interplay between viral ecology and population immunity, influenced by pandemic-related behavioral shifts. The results underscore the need for adaptive surveillance systems and targeted vaccination strategies to address evolving respiratory pathogen dynamics and mitigate future public health impacts.
Keywords:
Respiratory virus trends
; COVID-19 impact
; Virus seasonality
; Respiratory infections
; Influenza seasonality
; Virus resurgence
; Interrupted time series analysis
1. Introduction
Influenza and respiratory syncytial virus (RSV) are well-known for causing substantial respiratory illnesses, particularly among infants and older adults [1,2]. The COVID-19 pandemic significantly altered the transmission patterns of various respiratory viruses, including influenza virus, RSV, and other seasonal pathogens [3,4].
Before the pandemic, respiratory viruses typically exhibited predictable seasonal patterns, with peaks often occurring during the winter months in temperate regions [5,6]. However, the COVID-19 pandemic disrupted this predictability due to widespread non-pharmaceutical interventions (NPIs), such as masking and social distancing [7,8]. During the 2020–2021 influenza and RSV season, circulation levels dropped to historically low levels, and the usual winter epidemics failed to materialize in many regions of the Northern and Southern Hemispheres [8,9,10]. Similar reductions and altered seasonal patterns were observed globally, including in Europe, Australia, New Zealand, and other regions [11,12,13].
As NPIs were relaxed, respiratory viruses, including influenza viruses and RSV, gradually returned to prepandemic circulation levels, often outside their traditional seasons. For instance, in the Northern Hemisphere, the 2021–2022 season saw earlier RSV peaks compared to prepandemic norms [13,14]. Off-season increases were particularly evident in 2021, especially among children and young adults, coinciding with the relaxation of public health measures [12,14]. In China, a year-round RSV outbreak was reported in 2021, with heightened detection rates and a lack of the typical seasonal pattern observed in prior years [15,16]. The 2022–2023 RSV season witnessed a significant resurgence of cases, nearing prepandemic incidence levels [17].
The resurgence of influenza following COVID-19 has been complex, with regional differences and changes in population immunity playing key roles. For example, in 2021, influenza A resurged in the United States, whereas influenza B predominated in China, highlighting regional variability in resurgence patterns [18]. In South Korea, the incidence of influenza returned to prepandemic levels during the 2022–2023 season, following the relaxation of COVID-19 prevention policies [19]. Similarly, in Victoria, Australia, influenza re-emerged after travel restrictions were lifted, with young adults and international travelers contributing significantly to transmission dynamics [20]. In the United States, the 2021–2022 influenza season was associated with an increased risk of household transmission of influenza A (H3N2), likely due to reduced population immunity [21]. In China, during the 2022–2023 season, a notable increase in influenza cases and susceptibility was observed, attributed to the lifting of COVID-19 restrictions and the resulting “immunity debt” [22,23].
This resurgence of influenza, RSV, and other respiratory viruses in the postpandemic era has raised significant public health concerns [22]. Following the influenza A (H1N1) pandemic in 2009, the seasonality and age distribution of other respiratory viruses changed, suggesting that pandemics can have lasting effects on the epidemiology of these pathogens [24]. The unpredictability of seasonal patterns complicates traditional models of disease prediction and management [25].
This study aims to describe the incidence, trends, and seasonality of influenza, RSV, and other respiratory viruses before and after the COVID-19 pandemic. The goal is to enhance surveillance and diagnostics, which are essential for guiding effective public health responses to these respiratory pathogens.
2. Materials and Methods
2.1. Ethics
This study involving human participants was reviewed by the Research Committee of the Ministry of Health of Jalisco and approved for inclusion in the State Research Registry under number 73/LESP/JAL/2024. Ethical approval was granted by the “Comité de Ética en Investigación de la Secretaría de Salud de Jalisco” (approval number SSJ/DGEICS/DIS/CEI/12/24), as well as by the Research Committee (approval number SSJ/DGEICS/DIS/CI/13/24). The research was conducted in accordance with the principles of the Declaration of Helsinki, applicable national legislation, and institutional guidelines. Due to the retrospective nature of the study and the exclusive use of de-identified data, informed consent was waived.
2.2. Population and Eligibility Criteria
We retrospectively reviewed the state laboratory registry of symptomatic patients with influenza-like illness (ILI) tested for respiratory viruses from January 2017 to October 2024. A suspected case of ILI was defined as the sudden onset of symptoms accompanied by at least one of the following systemic symptoms: fever or feverishness, cough, or headache; and at least one of the following localized symptoms: dyspnea, myalgias, arthralgias, odynophagia, chills, chest pain, rhinorrhea, tachypnea, anosmia, dysgeusia, or conjunctivitis [26]. Demographic data and the presence of comorbidities were systematically collected from patient records. Cases with more than 10% missing data in sociodemographic or clinical records were excluded from the analysis.
2.3. Viral Testing
The respiratory viruses of interest included SARS-CoV-2, influenza A, influenza B, respiratory syncytial virus (RSV), human parainfluenza viruses 1–4 (HPIV1, HPIV2, HPIV3, HPIV4), human metapneumovirus (hMPV), seasonal human coronaviruses (HCoV-229E, HCoV-OC43, HCoV-NL63, and HCoV-HKU1), human adenovirus (HAdV), human bocavirus (HBoV), and human enterovirus/rhinovirus (HEV/HRV). Viral detection was performed using Health Mexico-approved assays with single or multiplex reverse transcriptase real-time PCR (RT‒PCR) assays. A case was defined as a laboratory-confirmed positive test for any of the respiratory viruses. Nasopharyngeal swabs were collected in viral transport media and transported to the State Laboratory under cold chain conditions. Upon arrival, laboratory procedures included viral inactivation, nucleic acid extraction, and viral gene amplification using RT‒PCR.
2.4. Testing Restrictions
According to local guidelines prior to the COVID-19 pandemic, respiratory virus surveillance primarily focused on influenza but improved significantly with the onset of COVID-19. Before the pandemic, only 10% of outpatients with suspected influenza and all hospitalized patients with suspected influenza were tested for influenza A and B. Additionally, 10% of patients who tested negative for influenza were screened for other respiratory viruses [27]. Following the onset of the COVID-19 pandemic, 100% of suspected cases were tested for SARS-CoV-2 and influenza A and B using multiplex RT‒PCR. Other respiratory viruses were tested in 10% of these cases [28].
2.5. Statistical Analysis
Demographic data were reported as simple relative frequencies. The percentage of positive test results was calculated by dividing the number of positive tests by the total number of tests conducted during a specified period, expressed as a percentage for each virus. The normality of the data distribution was evaluated using the Shapiro–Wilk test. To compare proportions, Pearson’s chi-square test and Fisher’s exact test were employed as appropriate. Quantitative variables were compared using Student’s t-test for normally distributed data and the Wilcoxon–Mann–Whitney test for non-normally distributed data.
To assess the impact of the COVID-19 pandemic on respiratory virus circulation, an interrupted time series (ITS) analysis was performed on weekly case numbers for multiple respiratory viruses. A generalized linear model with a negative binomial distribution was used to address overdispersion, enabling the quantification of both immediate and gradual effects of pandemic interventions on viral activity. The timeline was divided into three distinct phases: the prepandemic phase (January 2017–March 2020), the pandemic phase (April 2020–December 2021), and the postpandemic phase (January 2022 onward). The prepandemic period served as the baseline, while the pandemic phase captured the initial effects of strict lockdowns and subsequent public health measures. The postpandemic phase reflected the changes observed following the relaxation of these interventions.
The ITS model was designed to estimate both abrupt changes in level and gradual changes in slope, effectively capturing dynamic shifts in viral incidence over time. Seasonal trends were accounted for by analyzing data on a weekly basis, allowing the model to reflect typical fluctuations in respiratory virus activity. Sensitivity analyses were performed using three distinct models to ensure the robustness of the findings. The first model assessed the impact of strict lockdown periods by examining level changes and trends during the early stages of the pandemic. The second model focused on seasonal effects, analyzing intra-year fluctuations to gain a more detailed understanding of variations in viral circulation. The third model incorporated weekly COVID-19 case counts to evaluate their concurrent influence on the incidence of other respiratory viruses. A significance level of 5% (p < 0.05) was applied to all statistical tests to identify meaningful changes in respiratory virus activity across the different pandemic phases.
All statistical analyses were conducted using Python (version 3.12). Data management was performed using the Pandas library (version 1.5.0), while interrupted time series regression models were implemented with the Statsmodels library (version 0.14.0). Statistical computations were conducted using the SciPy library (version 1.11.0). To address overdispersion, the ITS models were constructed using negative binomial regression. The variance inflation factor (VIF) was calculated using the Statsmodels package to assess multicollinearity.
3. Results
A total of 157,418 subjects were identified from laboratory registries, of whom 155,352 met the inclusion criteria. Among these, 57,507 tests were conducted for respiratory viruses other than SARS-CoV-2. This included 57,389 influenza tests and 17,253 tests for respiratory viruses distinct from SARS-CoV-2 and influenza, as shown in Figure 1.
The median age of individuals tested was 37 years (IQR 25–53), with 53.97% being female (n = 83,841). After excluding those positive for SARS-CoV-2, the median age among individuals with laboratory-confirmed viral respiratory infections (n = 9,283) was 22 years (IQR 2–38), with females accounting for 55.24% (n = 5,128). Table 1 provides descriptive statistics of respiratory virus cases before and after the onset of the COVID-19 pandemic, categorized by sex and age group. Notably, the proportion of cases among females increased significantly, from 53.20% (n = 1,106) before the pandemic to 55.75% (n = 4,022) after (P = 0.036). Additionally, the age distribution shifted significantly toward the 15–65 age group, which accounted for 36.41% of cases (n = 757) before the pandemic and 53.02% (n = 3,825) after (P < 0.001). A detailed breakdown by respiratory virus type is provided in Table S1 of the supplementary material.
Comorbidities were present in 30.25% of the confirmed cases (n=2,808). The most frequently documented comorbidities were hypertension (n=816), obesity (n=652), smoking (n=624), diabetes (n=605), and asthma (n=598). Additional sociodemographic data are summarized in Table 2.
Among confirmed cases of respiratory viruses, 55,153 were SARS-CoV-2, 5,325 were influenza virus, and 3,958 were other respiratory viruses distinct from SARS-CoV-2 and influenza. Regarding influenza subtypes, influenza A H3 was the most prevalent (n = 2,968), followed by influenza B Victoria lineage (n = 1,511) and influenza A H1N1 (n = 326). Among ORVs, RSV was the most frequently identified (n = 1,534), followed by HEV/HRV (n = 1,458), hMPV (n = 485), and HPIV (n = 375). Additional details on the remaining detected viruses are provided in Table 3.
A total of 994 coinfections were documented, with the most frequent being SARS-CoV-2 and influenza (27.87%, n = 277), HEV/HRV and RSV (17.71%, n = 176), HAdV and HEV/HRV (8.55%, n = 85), SARS-CoV-2 and HEV/HRV (6.44%, n = 64), HAdV and RSV (6.24%, n = 62), HPIV and HEV/HRV (6.03%, n = 60), and SARS-CoV-2 and RSV (5.63%, n = 56). The remaining coinfections are detailed in Figure 2, with an extended version including influenza and parainfluenza virus subtypes available in Figure S1 of the supplementary material.
Seasonal patterns were observed for laboratory-confirmed cases of influenza and RSV among patients from late autumn to early spring during the 2016–2017 to 2018–2019 seasons. The end of the 2019–2020 season coincided with the arrival of SARS-CoV-2 in March 2020, when stringent NPIs were implemented. These measures led to historically low detection rates, with only one case reported in April 2021 (April positivity rate: 0.76%), compared to prepandemic influenza winter seasons (mean positivity rate: 12.63%), as illustrated in Figure 3a. With the gradual relaxation of NPIs in late 2021, a surge in influenza cases was observed, accompanied by an out-of-season, year-round detection pattern during 2022 and 2023 (mean positivity rate: 13.01% from December 2021 to July 2023), including a peak positivity rate of 39.80% in November 2022.
Influenza detection persisted throughout 2022 but decreased in frequency by July 2023, remaining at low levels (positivity rate: 2–5%) until the winter season of 2023–2024, which saw a peak positivity rate of 21%. Interestingly, alternating patterns among influenza subtypes were observed during the two years of persistent detection (2022 and 2023) following the heightened NPI period. Influenza A H3 was the predominant subtype in 2022, followed by a surge in influenza B Victoria lineage cases in February 2023 and a subsequent increase in influenza A H1 in August 2023. Influenza activity declined further by July 2024. Notably, no influenza B Yamagata lineage cases were detected from July 2019 until the time of this report. Detection frequencies and positive test numbers for influenza virus subtypes are presented in Figure 3b.
For RSV, an early onset of activity was observed in August 2021, whereas in previous seasons (2017–2018 to 2019–2020), the season typically began in late October or early November. The early onset of RSV in August 2021, along with its subsequent extension until April 2022, was accompanied by an increase in cases and higher positivity rates compared to the winter seasons of 2017–2018 to 2019–2020. After April 2022, RSV activity declined, aligning with its usual seasonal pattern during the 2022–2023 and 2023–2024 seasons. The detection frequencies, number of positive tests, and positivity rates for RSV are presented in Figure 4.
For respiratory viruses distinct from influenza and RSV, group positivity rates declined beginning in May 2020 but returned to prepandemic levels by August 2021. Early re-emergence and continuous detection were observed throughout 2023. Notably, HEV/HRV, hMPV, and HPIV experienced declines following the implementation of NPIs but exhibited early increases in August 2021, preceding the winter season. HEV/HRV, hMPV, and HPIV virus displayed activity throughout 2021 without showing a seasonal winter-associated pattern. For HBoV, HCoV-229E, HCoV-HKU1, HCoV-NL63, and HCoV-OC43, no distinct seasonal pattern could be determined due to their low detection frequencies. Individual detection frequencies and positivity rates for other respiratory viruses as a group are shown in Figure 5, while individual virus detection frequencies are detailed in Figure S2 of the supplementary material.
The segmented interrupted time series (ITS) analysis for respiratory viruses is summarized in Table 3. During the 2020–2021 period, significant decreases were observed in the levels of influenza (β₂ = -4.266, P < 0.001), RSV (β₂ = -6.428, P < 0.001), HEV/HRV (β₂ = -1.170, P < 0.001), HPIV (β₂ = -5.912, P < 0.001), and HAdV (β₂ = -2.268, P < 0.001). These results highlight a substantial reduction in the number of cases of all analyzed respiratory viruses during the initial years of the COVID-19 pandemic. hMPV also exhibited a significant decline during this period (β₂ = -1.200, P = 0.001), although the magnitude of reduction was smaller compared to the other viruses.
In contrast, during 2022, significant increases were observed for influenza (β₂ = 9.418, P < 0.001), RSV (β₂ = 5.367, P < 0.001), and HPIV (β₂ = 4.720, P < 0.001), suggesting a resurgence of these pathogens following the relaxation of pandemic-related public health interventions. Interestingly, hMPV did not exhibit a significant change during this period (β₂ = 0.679, P = 0.112), while HAdV slightly but not significantly decreased (β₂ = -0.331, P = 0.561). HEV/HRV continued to show a slight but significant decline (β₂ = -1.250, P = 0.002), indicating a different postpandemic recovery pattern compared to the other viruses.
Trend dynamics across the analyzed periods revealed additional insights. During the 2020–2021 period, significant positive trends were observed for influenza (β₃ = 0.066, P < 0.001), RSV (β₃ = 0.086, P < 0.001), HPIV (β₃ = 0.056, P < 0.001), and hMPV (β₃ = 0.011, P = 0.043), reflecting a gradual recovery in activity. In contrast, HEV/HRV displayed a slight but significant negative trend (β₃ = -0.016, P = 0.002), while HAdV showed no significant trend (β₃ = -0.006, P = 0.412), suggesting stable incidence during this period.
During 2022, trends varied further. Influenza exhibited a slight but significant negative trend (β₃ = -0.013, P < 0.001), as did RSV (β₃ = -0.024, P < 0.001) and HEV/HRV (β₃ = -0.044, P < 0.001). HPIV continued to show a significant negative trend (β₃ = -0.017, P < 0.001), while hMPV also demonstrated a negative trend (β₃ = -0.016, P < 0.001). HAdV followed a similar pattern, with a notable negative trend during this period (β₃ = -0.043, P < 0.001). The complete ITS model of respiratory virus circulation before, during, and after the COVID-19 pandemic is provided in Table S1 of the supplementary material.

Table 3.
Interrupted time series analysis of respiratory virus circulation before, during, and after the COVID-19 pandemic in Jalisco, Mexico.
Table 3.
Interrupted time series analysis of respiratory virus circulation before, during, and after the COVID-19 pandemic in Jalisco, Mexico.
| Influenza | RSV* | HEV/HRV* | hMPV* | HPIV* | |||||||||||
|---|---|---|---|---|---|---|---|---|---|---|---|---|---|---|---|
| Variable | β | SE | P-value | β | SE | P-value | β | SE | P-value | β | SE | P-value | β | SE | P-value |
| Constant (β0) | 2.365 | 0.166 | <0.001 | 0.215 | 0.193 | 0.265 | -2.821 | 0.360 | <0.001 | 0.016 | 0.208 | 0.937 | -0.964 | 0.254 | <0.001 |
| Time (β1) | -1.030 | 0.180 | <0.001 | 0.939 | 0.191 | <0.001 | 2.988 | 0.301 | 0.566 | 0.405 | 0.210 | 0.054 | 1.049 | 0.240 | <0.001 |
| Level (β2) | |||||||||||||||
| 2020-2021 | -4.266 | 0.670 | <0.001 | -6.428 | 0.629 | <0.001 | -1.170 | 0.308 | <0.001 | -1.200 | 0.364 | 0.001 | -5.912 | 1.035 | <0.001 |
| 2022 | 9.418 | 0.686 | <0.001 | 5.367 | 0.658 | <0.001 | -1.250 | 0.402 | 0.002 | 0.679 | 0.428 | 0.112 | 4.720 | 1.060 | <0.001 |
| Trend (β3) | |||||||||||||||
| 2020-2021 | 0.066 | 0.010 | <0.001 | 0.086 | 0.009 | <0.001 | -0.016 | 0.005 | 0.002 | 0.011 | 0.005 | 0.043 | 0.056 | 0.014 | <0.001 |
| 2022 | -0.013 | 0.003 | <0.001 | -0.024 | 0.003 | <0.001 | -0.044 | 0.004 | <0.001 | -0.016 | 0.003 | <0.001 | -0.017 | 0.004 | <0.001 |
* RSV, respiratory syncytial virus. HEV/HRV, human enterovirus/rhinovirus. HPIV, human parainfluenza virus (HPIV), and hMPV (Human Metapneumovirus).
Sensitivity analyses were conducted to ensure the robustness of the ITS models, with findings summarized in supplementary Table S2. These analyses evaluated three distinct models, each providing additional insights into the dynamics of respiratory virus activity during the COVID-19 pandemic. Model 1, which included the strict lockdown period, revealed significant reductions in virus circulation for most pathogens, including influenza (β₂ for 2020–2021 = -19.809, P < 0.001) and RSV (β₂ for 2020–2021 = -16.821, P < 0.001). These findings underscore the substantial suppression of viral transmission due to pandemic-related public health measures. Similar reductions were observed for hMPV and HPIV during the lockdown phase, with β₂ values of -14.700 (P < 0.001) and -5.784 (P < 0.001), respectively. In contrast, Model 2, which aimed to evaluate seasonal patterns, could not be computed for certain viruses, such as influenza and RSV, due to the limited number of cases during the 2020–2021 season, resulting in insufficient statistical power. Model 3, which incorporated weekly COVID-19 case counts, offered additional insights by demonstrating that the resurgence of certain viruses, including influenza (β₂ for 2022 = 8.954, P < 0.001) and RSV (β₂ for 2022 = 5.438, P < 0.001), coincided with fluctuations in COVID-19 cases. For other viruses, such as HEV/HRV and HAdV, distinct dynamics were noted, with varying trends observed during and after the pandemic phases. These findings highlight the nuanced interplay between pandemic control measures and viral activity, reflecting the complex and diverse effects of the pandemic on respiratory viruses. The detailed results of these analyses are presented in Table S2 of the supplementary material.
4. Discussion
This study provides a comprehensive analysis of respiratory virus patterns over an eight-year period in a middle-income Latin American country, emphasizing significant changes in the seasonal dynamics of influenza virus, RSV, and other respiratory viruses following the COVID-19 pandemic. Our findings align with global reports of decreased respiratory virus activity during the pandemic, attributed to NPIs such as social distancing, mask-wearing, and restrictions on travel and gatherings [3,4,5,6,7,8,9,10,11,12,13,14,15,16]. These measures led to a marked reduction in cases, supporting the hypothesis that NPIs played a critical role in limiting the spread of respiratory pathogens beyond SARS-CoV-2 [11].
Postpandemic data, however, reveal a resurgence of influenza and RSV cases, often occurring outside their traditional seasonal patterns [29]. Influenza cases, for instance, spiked during the off-peak season, suggesting a possible recalibration of viral seasonality. Similarly, RSV cases, although primarily within the winter period, exhibited an earlier onset, higher case numbers, and increased positivity rates in 2021, following 19 months of low detection due to limited exposure. These findings raise important questions about the pandemic’s long-term effects on respiratory virus epidemiology and underscore the need for adaptive public health strategies to address these emerging trends.
Our ITS analysis demonstrated distinct patterns across the prepandemic, pandemic, and postpandemic phases. Abrupt reductions in virus incidence were observed at the onset of the pandemic, followed by gradual increases in activity as NPIs were lifted. Notably, while influenza and RSV showed significant postpandemic rebounds, some viruses, such as hMPV and HAdV, displayed more muted responses, reflecting virus-specific variability in resilience to public health interventions. ITS analysis has proven invaluable for evaluating the impact of interventions, such as the COVID-19 pandemic and associated NPIs, on disease incidence over time [6]. This method quantifies both the immediate and long-term effects of interventions on viral transmission and has been instrumental in understanding the dynamics of viral rebounds following the relaxation of NPIs [30,31]. To our knowledge, this is the first study to apply an ITS analysis to respiratory virus trends over an eight-year period in a middle-income Latin American country.
One notable finding was the alternating dominance of influenza subtypes in the postpandemic period. Influenza A H3 predominated in 2022, followed by an increase in influenza B cases during 2023 and the re-emergence of Influenza A H1N1 later that year. These shifts may reflect declines in population immunity to these subtypes, driven by changes in transmission dynamics during the pandemic. Previous studies have shown similar patterns of alternating dominance among influenza A subtypes, such as A(H1N1) and A(H3N2), across different seasons [32,33]. These subtype-specific dynamics hold critical implications for vaccine development and highlight the importance of continuous surveillance and flexibility in public health planning to address evolving viral threats. Interestingly, no influenza B Yamagata lineage cases have been identified since July 2019, consistent with international reports indicating that this lineage has not been definitively detected since April 2020, raising the possibility of its extinction [34,35].
The observed postpandemic seasonality and incidence of other respiratory viruses, including human HEV/HRV and HPIV, further reflect the pandemic’s impact on viral ecology. While some viruses returned to prepandemic levels, others exhibited altered dynamics, suggesting complex restructuring of viral ecosystems with implications that warrant further investigation [36,37].
The resurgence of multiple respiratory viruses following the COVID-19 pandemic can be attributed to several factors. The reduced circulation of these viruses during the pandemic, driven by widespread NPIs, could have led to a decline in natural immunity within the population, particularly among individuals who missed typical exposure to these pathogens [37,38]. This phenomenon, often referred to as “immunity debt,” describe the diminished population immunity resulting from reduced exposure to common pathogens during periods of strict NPIs [37,39]. Consequently, the pool of susceptible individuals might have expanded, and the relaxation of NPIs could have facilitated increased transmission and outbreaks of respiratory infections, such as RSV and influenza, in some cases surpassing prepandemic levels [39,40]. Furthermore, changes in testing practices and increased public awareness may have contributed to the observed rise in reported cases, as heightened surveillance identified more infections [41]. This complex interplay between immunity debt and enhanced diagnostic practices highlights the need for further investigation to better understand postpandemic infectious disease trends. Another factor that may have contributed is viral exclusion, as reports worldwide have documented reduced coinfection rates for SARS-CoV-2, influenza, and RSV, supporting the hypothesis of a viral exclusionary effect [42]. This phenomenon suggests that these viruses could compete for the same host resources or immune responses, thereby reducing the likelihood of simultaneous infections and potentially leading to an increase in the incidence of other viruses following the decline of SARS-CoV-2 [42,43].
The limitations of this study primarily stem from its retrospective design. Certain variables were unavailable during data collection and could not be included in the analyses. Additionally, local testing guidelines for respiratory viruses, excluding SARS-CoV-2 and influenza, resulted in significantly fewer tests for other viruses, which may have limited the scope of the findings.
Future research should focus on elucidating the mechanisms underlying these shifts in viral seasonality and incidence, including potential changes in host immunity following reduced viral exposure during the pandemic. Further studies should also assess the impact of altered seasonality on clinical outcomes, healthcare burden, and vaccination strategies, particularly for high-risk populations.
5. Conclusions
This study highlights significant disruptions and shifts in the seasonal dynamics of respiratory viruses following the COVID-19 pandemic, particularly for influenza and other respiratory viruses. The interrupted time series analysis demonstrated that non- NPIs implemented during the pandemic resulted in substantial reductions in respiratory virus circulation, followed by atypical resurgences as NPIs were lifted. Notably, influenza showed alternating subtype dominance, with A(H3) prevailing in 2022, influenza B surging in 2023, and a subsequent rise in influenza A H1N1 cases, suggesting potential immunity gaps and shifts in population susceptibility. RSV exhibited earlier and more intense seasonal peaks postpandemic, highlighting changes in virus-host dynamics. These findings underline the complexity of postpandemic viral ecology, emphasizing the need for adaptable public health strategies, robust surveillance systems, and targeted vaccination programs to address emerging patterns in viral transmission. Further research should explore the long-term implications of these shifts for disease burden and healthcare systems, particularly in vulnerable populations
Supplementary Materials
The following supporting information can be downloaded at the website of this paper posted on Preprints.org. Table S1. Distribution of respiratory virus cases before and after the COVID-19 pandemic by virus, sex and age group. Table S2. Complete interrupted time series analysis of respiratory virus circulation before, during, and after the COVID-19 pandemic in Jalisco, Mexico. Table S3. Sensitivity analysis of ITS models for respiratory virus circulation before, during, and after the COVID-19 pandemic in Jalisco, Mexico. Figure S1. Coinfections detected among different respiratory viruses during the study period. Figure S2 Monthly distribution of positive respiratory virus tests.
Author Contributions
Conceptualization, EQ-S, JCDA-J, and JB-R.; methodology, JCDA-J and JB-R.; software, JB-R.; validation, JCDA-J and JB-R,; formal analysis, JB-R and JCDA-J; investigation, EQ-S, RD-N, GV-C, GR-C, JCDA-J; resources, EQ-S, JCDA-J; data curation, EQ-S, JB-R, RD-N, GV-C, GR-C, JCDA-J; writing—original draft preparation, EQ-S, JB-R, RD-N, GV-C, GR-C, JCDA-J; writing—review and editing, EQ-S, JCDA-J, and JB-R; visualization, EQ-S, JB-R, RD-N, GV-C, GR-C, JCDA-J; supervision, JCDA-J; project administration, JCDA-J and JB-R. All authors have read and agreed to the published version of the manuscript.
Funding
This research received no external funding.
Institutional Review Board Statement
The study was conducted in accordance with the principles of the Declaration of Helsinki, applicable national legislation, and institutional guidelines. It was reviewed by the Research Committee of the Ministry of Health of Jalisco and approved for inclusion in the State Research Registry under number 73/LESP/JAL/2024.
Informed Consent Statement
Due to the retrospective nature of the study and the exclusive use of de-identified data, informed consent was waived, as approved by the Comité de Ética en Investigación de la Secretaría de Salud de Jalisco (approval number SSJ/DGEICS/DIS/CEI/12/24) and the Comité de Investigación de la Secretaría de Salud de Jalisco (approval number SSJ/DGEICS/DIS/CI/13/24).
Data Availability Statement
The raw data supporting the conclusions of this article will be made available by the authors on request.
Acknowledgments
The authors have no acknowledgments to report.
Conflicts of Interest
The authors declare no conflicts of interest.
Abbreviations
COVID-19 - Coronavirus Disease 2019
RSV - Respiratory Syncytial Virus
NPIs - Nonpharmaceutical Interventions
HFNC - High-Flow Nasal Cannula
NIV - Noninvasive Ventilation
ILI - Influenza-Like Illness
SARS-CoV-2 - Severe Acute Respiratory Syndrome Coronavirus 2
RT‒PCR - Reverse Transcriptase Polymerase Chain Reaction
HPIV - Human Parainfluenza Virus
hMPV - Human Metapneumovirus
HCoV - Human Coronavirus
HAdV - Human Adenovirus
HBoV - Human Bocavirus
HEV/HRV - Human Enterovirus/Rhinovirus
ITS - Interrupted Time Series
VIF - Variance Inflation Factor
CI - Confidence Interval
IQR - Interquartile Range
References
- Costa VGD, Gomes AJC, Bittar C, Geraldini DB, Previdelli da Conceição PJ, Cabral ÁS, Carvalho T, Biselli JM, Provazzi PJS, Campos GRF, Sanches PRDS, Costa PI, Nogueira ML, Araujo JP Jr, Spilki FR, Calmon MF, Rahal P. Burden of Influenza and Respiratory Syncytial Viruses in Suspected COVID-19 Patients: A Cross-Sectional and Meta-Analysis Study. Viruses. 2023 Mar 1;15(3):665. [CrossRef]
- Matias G, Taylor R, Haguinet F, Schuck-Paim C, Lustig R, Shinde V. Estimates of hospitalization attributable to influenza and RSV in the US during 1997-2009, by age and risk status. BMC Public Health. 2017 Mar 21;17(1):271. [CrossRef]
- Thindwa D, Li K, Cooper-Wootton D, Zheng Z, Pitzer VE, Weinberger DM. Global patterns of rebound to normal RSV dynamics following COVID-19 suppression. BMC Infect Dis. 2024 Jun 25;24(1):635. [CrossRef]
- Del Riccio M, Caini S, Bonaccorsi G, Lorini C, Paget J, van der Velden K, Meijer A, Haag M, McGovern I, Zanobini P. Global analysis of respiratory viral circulation and timing of epidemics in the pre-COVID-19 and COVID-19 pandemic eras, based on data from the Global Influenza Surveillance and Response System (GISRS). Int J Infect Dis. 2024 Jul;144:107052. [CrossRef]
- Hu W, Fries AC, DeMarcus LS, Thervil JW, Kwaah B, Brown KN, Sjoberg PA, Robbins AS. Circulating Trends of Influenza and Other Seasonal Respiratory Viruses among the US Department of Defense Personnel in the United States: Impact of the COVID-19 Pandemic. Int J Environ Res Public Health. 2022 May 13;19(10):5942. [CrossRef]
- Guadalupe-Fernández V, Martínez-Solanas E, Sabrià-Sunyé A, Ferrer-Mikoly C, Martínez-Mateo A, Ciruela-Navas P, Mendioroz J, Basile L; Epidemiological Surveillance Network of Catalonia. Investigating epidemiological distribution (temporality and intensity) of respiratory pathogens following COVID-19 de-escalation process in Catalonia, September 2016-June 2021: Analysis of regional surveillance data. PLoS One. 2024 Feb 9;19(2):e0285892. [CrossRef]
- Almeida T, Guimarães JT, Rebelo S. Epidemiological Changes in Respiratory Viral Infections in Children: The Influence of the COVID-19 Pandemic. Viruses. 2023 Sep 5;15(9):1880. [CrossRef]
- Olsen SJ, Azziz-Baumgartner E, Budd AP, Brammer L, Sullivan S, Pineda RF, Cohen C, Fry AM. Decreased Influenza Activity During the COVID-19 Pandemic - United States, Australia, Chile, and South Africa, 2020. MMWR Morb Mortal Wkly Rep. 2020 Sep 18;69(37):1305-1309. [CrossRef]
- Agha R, Avner JR. Delayed Seasonal RSV Surge Observed During the COVID-19 Pandemic. Pediatrics. 2021 Sep;148(3):e2021052089. [CrossRef]
- Kurai D, Natori M, Yamada M, Zheng R, Saito Y, Takahashi H. Occurrence and disease burden of respiratory syncytial virus and other respiratory pathogens in adults aged ≥65 years in community: A prospective cohort study in Japan. Influenza Other Respir Viruses. 2022 Mar;16(2):298-307. [CrossRef]
- Huang QS, Wood T, Jelley L, Jennings T, Jefferies S, Daniells K, Nesdale A, Dowell T, Turner N, Campbell-Stokes P, Balm M, Dobinson HC, Grant CC, James S, Aminisani N, Ralston J, Gunn W, Bocacao J, Danielewicz J, Moncrieff T, McNeill A, Lopez L, Waite B, Kiedrzynski T, Schrader H, Gray R, Cook K, Currin D, Engelbrecht C, Tapurau W, Emmerton L, Martin M, Baker MG, Taylor S, Trenholme A, Wong C, Lawrence S, McArthur C, Stanley A, Roberts S, Rahnama F, Bennett J, Mansell C, Dilcher M, Werno A, Grant J, van der Linden A, Youngblood B, Thomas PG; NPIsImpactOnFlu Consortium; Webby RJ. Impact of the COVID-19 nonpharmaceutical interventions on influenza and other respiratory viral infections in New Zealand. Nat Commun. 2021 Feb 12;12(1):1001. [CrossRef]
- Bardsley M, Morbey RA, Hughes HE, Beck CR, Watson CH, Zhao H, Ellis J, Smith GE, Elliot AJ. Epidemiology of respiratory syncytial virus in children younger than 5 years in England during the COVID-19 pandemic, measured by laboratory, clinical, and syndromic surveillance: a retrospective observational study. Lancet Infect Dis. 2023 Jan;23(1):56-66. [CrossRef]
- Yeoh DK, Foley DA, Minney-Smith CA, Martin AC, Mace AO, Sikazwe CT, Le H, Levy A, Blyth CC, Moore HC. Impact of Coronavirus Disease 2019 Public Health Measures on Detections of Influenza and Respiratory Syncytial Virus in Children During the 2020 Australian Winter. Clin Infect Dis. 2021 Jun 15;72(12):2199-2202. [CrossRef]
- Falsey AR, Cameron A, Branche AR, Walsh EE. Perturbations in Respiratory Syncytial Virus Activity During the SARS-CoV-2 Pandemic. J Infect Dis. 2022 Dec 28;227(1):83-86. [CrossRef]
- Li M, Cong B, Wei X, Wang Y, Kang L, Gong C, Huang Q, Wang X, Li Y, Huang F. Characterising the changes in RSV epidemiology in Beijing, China during 2015-2023: results from a prospective, multi-centre, hospital-based surveillance and serology study. Lancet Reg Health West Pac. 2024 Mar 27;45:101050. [CrossRef]
- Zhou T, Chen D, Chen Q, Jin X, Su M, Zhang H, Tian L, Wen S, Zhong L, Ma Y, Ma D, Liang L, Lu X, Ni Q, Yang N, Pi G, Zhu Y, Chen X, Ma J, Jiang M, Wang J, Luo X, Li L, Zhang X, Ma Z, Zhang M, Zhang H, Lin L, Xiao N, Jiang W, Gu W, Cai D, Chen H, Chen L, Lei J, Du H, Li Y, Shao L, Shang Y, Xie N, Lei X, Ding S, Liang Y, Dong L, Chen X, Li Y, Zhang X, He B, Ren L, Liu E. The impact of the COVID-19 pandemic on RSV outbreaks in children: A multicenter study from China. Respir Med. 2024 Oct 3;234:107828. [CrossRef]
- Hamid S, Winn A, Parikh R, Jones JM, McMorrow M, Prill MM, Silk BJ, Scobie HM, Hall AJ. Seasonality of Respiratory Syncytial Virus - United States, 2017-2023. MMWR Morb Mortal Wkly Rep. 2023 Apr 7;72(14):355-361. [CrossRef]
- Chen B, Zhu Z, Li Q, He D. Resurgence of different influenza types in China and the US in 2021. Math Biosci Eng. 2023 Feb 1;20(4):6327-6333. [CrossRef]
- Kim H, Son HS. Analysis of the incidence of influenza before and after the COVID-19 pandemic in South Korea. Trop Med Int Health. 2024 Nov 6. [CrossRef]
- Pendrey CG, Strachan J, Peck H, Aziz A, Moselen J, Moss R, Rahaman MR, Barr IG, Subbarao K, Sullivan SG. The re-emergence of influenza following the COVID-19 pandemic in Victoria, Australia, 2021 to 2022. Euro Surveill. 2023 Sep;28(37):2300118. [CrossRef]
- Rolfes MA, Talbot HK, McLean HQ, Stockwell MS, Ellingson KD, Lutrick K, Bowman NM, Bendall EE, Bullock A, Chappell JD, Deyoe JE, Gilbert J, Halasa NB, Hart KE, Johnson S, Kim A, Lauring AS, Lin JT, Lindsell CJ, McLaren SH, Meece JK, Mellis AM, Moreno Zivanovich M, Ogokeh CE, Rodriguez M, Sano E, Silverio Francisco RA, Schmitz JE, Vargas CY, Yang A, Zhu Y, Belongia EA, Reed C, Grijalva CG. Household Transmission of Influenza A Viruses in 2021-2022. JAMA. 2023 Feb 14;329(6):482-489. [CrossRef]
- Cao G, Guo Z, Liu J, Liu M. Change from low to out-of-season epidemics of influenza in China during the COVID-19 pandemic: A time series study. J Med Virol. 2023 Jun;95(6):e28888. [CrossRef]
- Wang Q, Jia M, Jiang M, Cao Y, Dai P, Yang J, Yang X, Xu Y, Yang W, Feng L. Increased population susceptibility to seasonal influenza during the COVID-19 pandemic in China and the United States. J Med Virol. 2023 Oct;95(10):e29186. [CrossRef]
- Yang L, Chan KH, Suen LK, Chan KP, Wang X, Cao P, He D, Peiris JS, Wong CM. Impact of the 2009 H1N1 Pandemic on Age-Specific Epidemic Curves of Other Respiratory Viruses: A Comparison of Pre-Pandemic, Pandemic and Post-Pandemic Periods in a Subtropical City. PLoS One. 2015 Apr 30;10(4):e0125447. Erratum in: PLoS One. 2015 Jul 20;10(7):e0133946. doi: 10.1371/journal.pone.0133946. [CrossRef]
- Roberts MG, Hickson RI, McCaw JM, Talarmain L. A simple influenza model with complicated dynamics. J Math Biol. 2019 Feb;78(3):607-624. [CrossRef]
- Secretaría de Salud, Subsecretaría de Prevención y Promoción de la Salud. Lineamiento Estandarizado para la Vigilancia Epidemiológica y por Laboratorio de la Enfermedad Respiratoria Viral. Dirección General de Epidemiología, 2023, p. 34. Available at: https://epidemiologia.salud.gob.mx/gobmx/salud/documentos/manuales/12_Manual_VE_Influenza.pdf.
- Instituto de Diagnóstico y Referencia Epidemiológicos. (2015). Lineamientos para la vigilancia de Influenza por laboratorio (Versión 1). Secretaría de Salud. Available at: https://www.gob.mx/cms/uploads/attachment/file/20769/lineamientos_para_la_vigilancia_de_influenza.pdf.
- Instituto de Diagnóstico y Referencia Epidemiológicos. (2024). Lineamientos para la vigilancia por laboratorio de virus respiratorios (Versión 2). Secretaría de Salud. Available at: https://www.gob.mx/cms/uploads/attachment/file/884541/LVL_Virus_respiratorios_190124.pdf.
- Lavoie PM, Reicherz F, Solimano A, Langley JM. Potential resurgence of respiratory syncytial virus in Canada. CMAJ. 2021 Jul 26;193(29):E1140-E1141. [CrossRef]
- Zhou Q, Hu J, Hu W, Li H, Lin GZ. Interrupted time series analysis using the ARIMA model of the impact of COVID-19 on the incidence rate of notifiable communicable diseases in China. BMC Infect Dis. 2023 Jun 5;23(1):375. [CrossRef]
- Li J, Yuan F, Fan S, Tian J, Yang J. The impact of COVID-19 pandemic on reported notifiable infectious diseases in China: An interrupted time series analysis. Am J Infect Control. 2024 Oct 23:S0196-6553(24)00763-6. [CrossRef]
- Zhu W, Gu L. Resurgence of seasonal influenza driven by A/H3N2 and B/Victoria in succession during the 2023-2024 season in Beijing showing increased population susceptibility. J Med Virol. 2024 Jun;96(6):e29751. [CrossRef]
- Fossum E, Rohringer A, Aune T, Rydland KM, Bragstad K, Hungnes O. Antigenic drift and immunity gap explain reduction in protective responses against influenza A(H1N1)pdm09 and A(H3N2) viruses during the COVID-19 pandemic: a cross-sectional study of human sera collected in 2019, 2021, 2022, and 2023. Virol J. 2024 Mar 6;21(1):57. Erratum in: Virol J. 2024 Mar 18;21(1):66. [CrossRef]
- Koutsakos M, Wheatley AK, Laurie K, Kent SJ, Rockman S. Influenza lineage extinction during the COVID-19 pandemic? Nat Rev Microbiol. 2021 Dec;19(12):741-742. [CrossRef]
- Dhanasekaran V, Sullivan S, Edwards KM, Xie R, Khvorov A, Valkenburg SA, Cowling BJ, Barr IG. Human seasonal influenza under COVID-19 and the potential consequences of influenza lineage elimination. Nat Commun. 2022 Mar 31;13(1):1721. [CrossRef]
- Chow EJ, Uyeki TM, Chu HY. The effects of the COVID-19 pandemic on community respiratory virus activity. Nat Rev Microbiol [Internet]. 2022 Oct 17 [cited 2024 Nov 17]; Available from: https://www.nature.com/articles/s41579-022-00807-9.
- Munro AP, House T. Cycles of susceptibility: Immunity debt explains altered infectious disease dynamics post -pandemic. Clin Infect Dis. 2024 Oct 11:ciae493. [CrossRef]
- Lee PI, Hsueh PR, Chuang JH, Liu MT. Changing epidemic patterns of infectious diseases during and after COVID-19 pandemic in Taiwan. J Microbiol Immunol Infect. 2024 Oct;57(5):685-690. [CrossRef]
- Leung C, Konya L, Su L. Postpandemic immunity debt of influenza in the USA and England: an interrupted time series study. Public Health. 2024 Feb;227:239-242. [CrossRef]
- Principi N, Autore G, Ramundo G, Esposito S. Epidemiology of Respiratory Infections during the COVID-19 Pandemic. Viruses. 2023 May 13;15(5):1160. [CrossRef]
- Petros BA, Milliren CE, Sabeti PC, Ozonoff A. Increased Pediatric Respiratory Syncytial Virus Case Counts Following the Emergence of SARS-CoV-2 Can Be Attributed to Changes in Testing. Clin Infect Dis. 2024 Jun 14;78(6):1707-1717. [CrossRef]
- Alhumaid S, Alabdulqader M, Al Dossary N, Al Alawi Z, Alnaim AA, Al Mutared KM, Al Noaim K, Al Ghamdi MA, Albahrani SJ, Alahmari AA, Al Hajji Mohammed SM, Almatawah YA, Bayameen OM, Alismaeel AA, Alzamil SK, Alturki SA, Albrahim ZR, Al Bagshi NA, Alshawareb HY, Alhudar JA, Algurairy QA, Alghadeer SM, Alhadab HA, Aljubran TN, Alabdulaly YA, Al Mutair A, Rabaan AA. Global Coinfections with Bacteria, Fungi, and Respiratory Viruses in Children with SARS-CoV-2: A Systematic Review and Meta-Analysis. Trop Med Infect Dis. 2022 Nov 15;7(11):380. [CrossRef]
- Weidmann MD, Green DA, Berry GJ, Wu F. Assessing respiratory viral exclusion and affinity interactions through co-infection incidence in a pediatric population during the 2022 resurgence of influenza and RSV. Front Cell Infect Microbiol. 2023 Jun 14;13:1208235. [CrossRef]
Figure 1.
Flowchart of case selection.
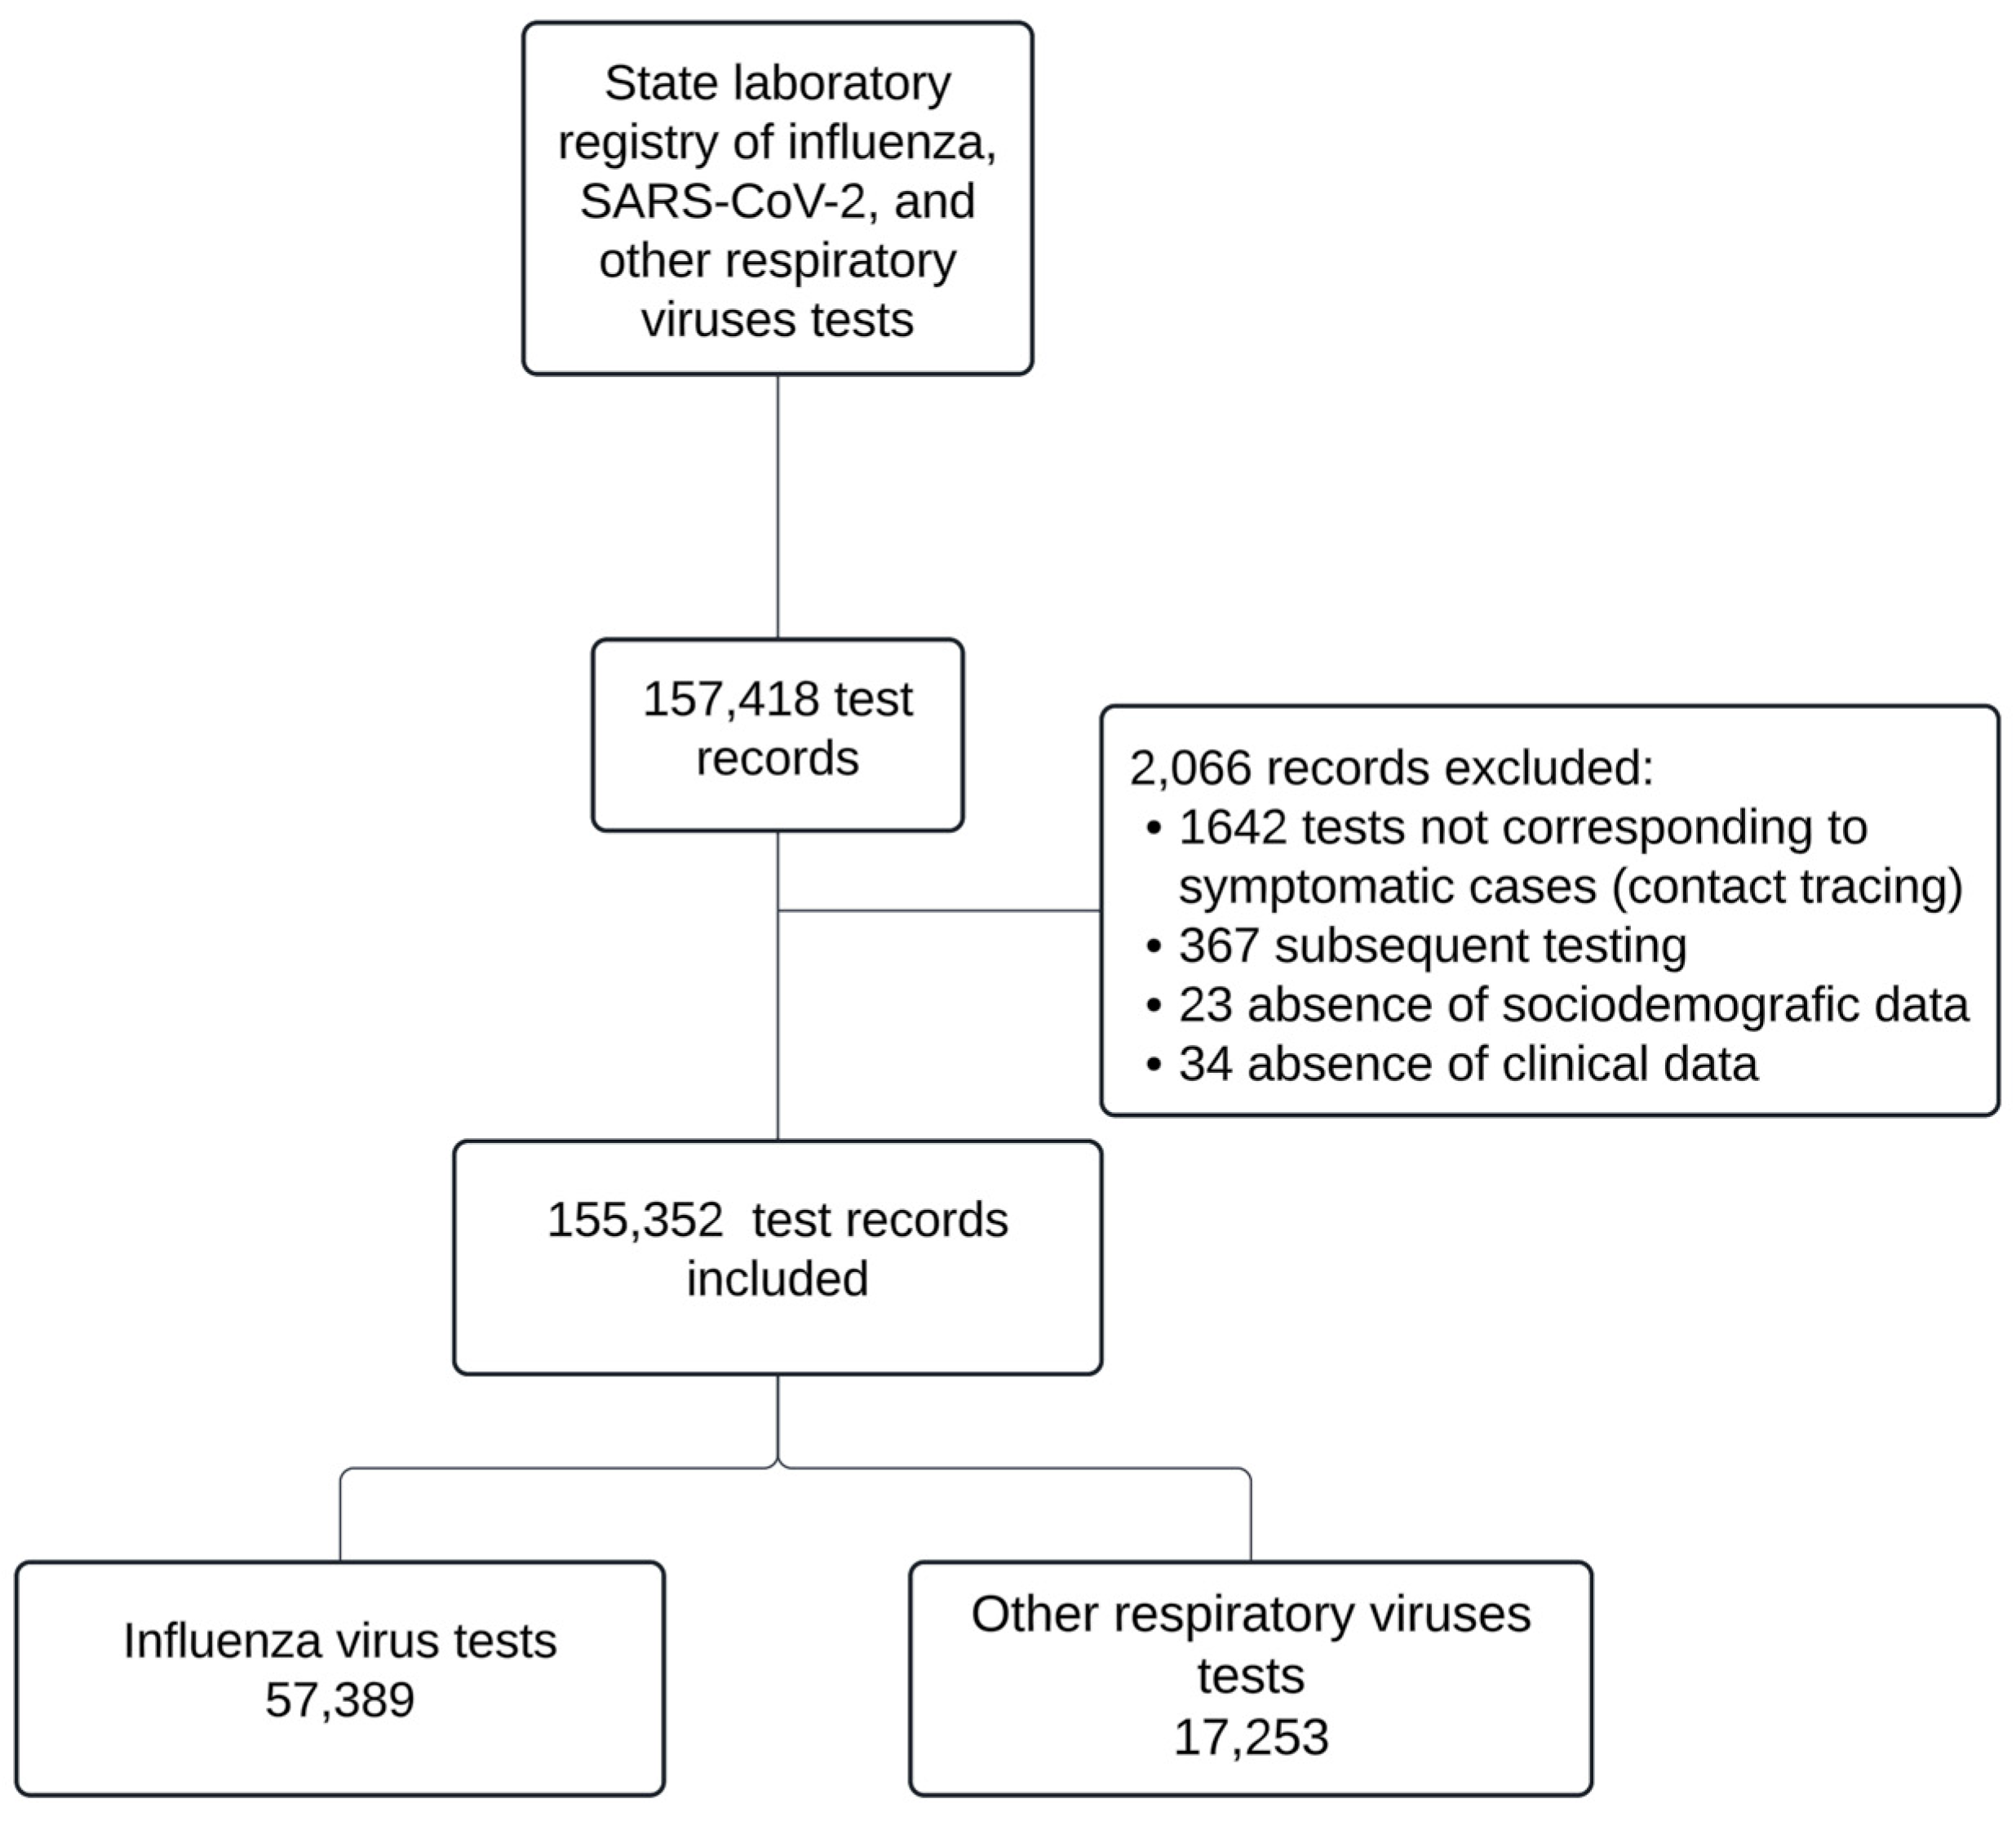
Figure 2.
Coinfections detected among different respiratory viruses during the study period.
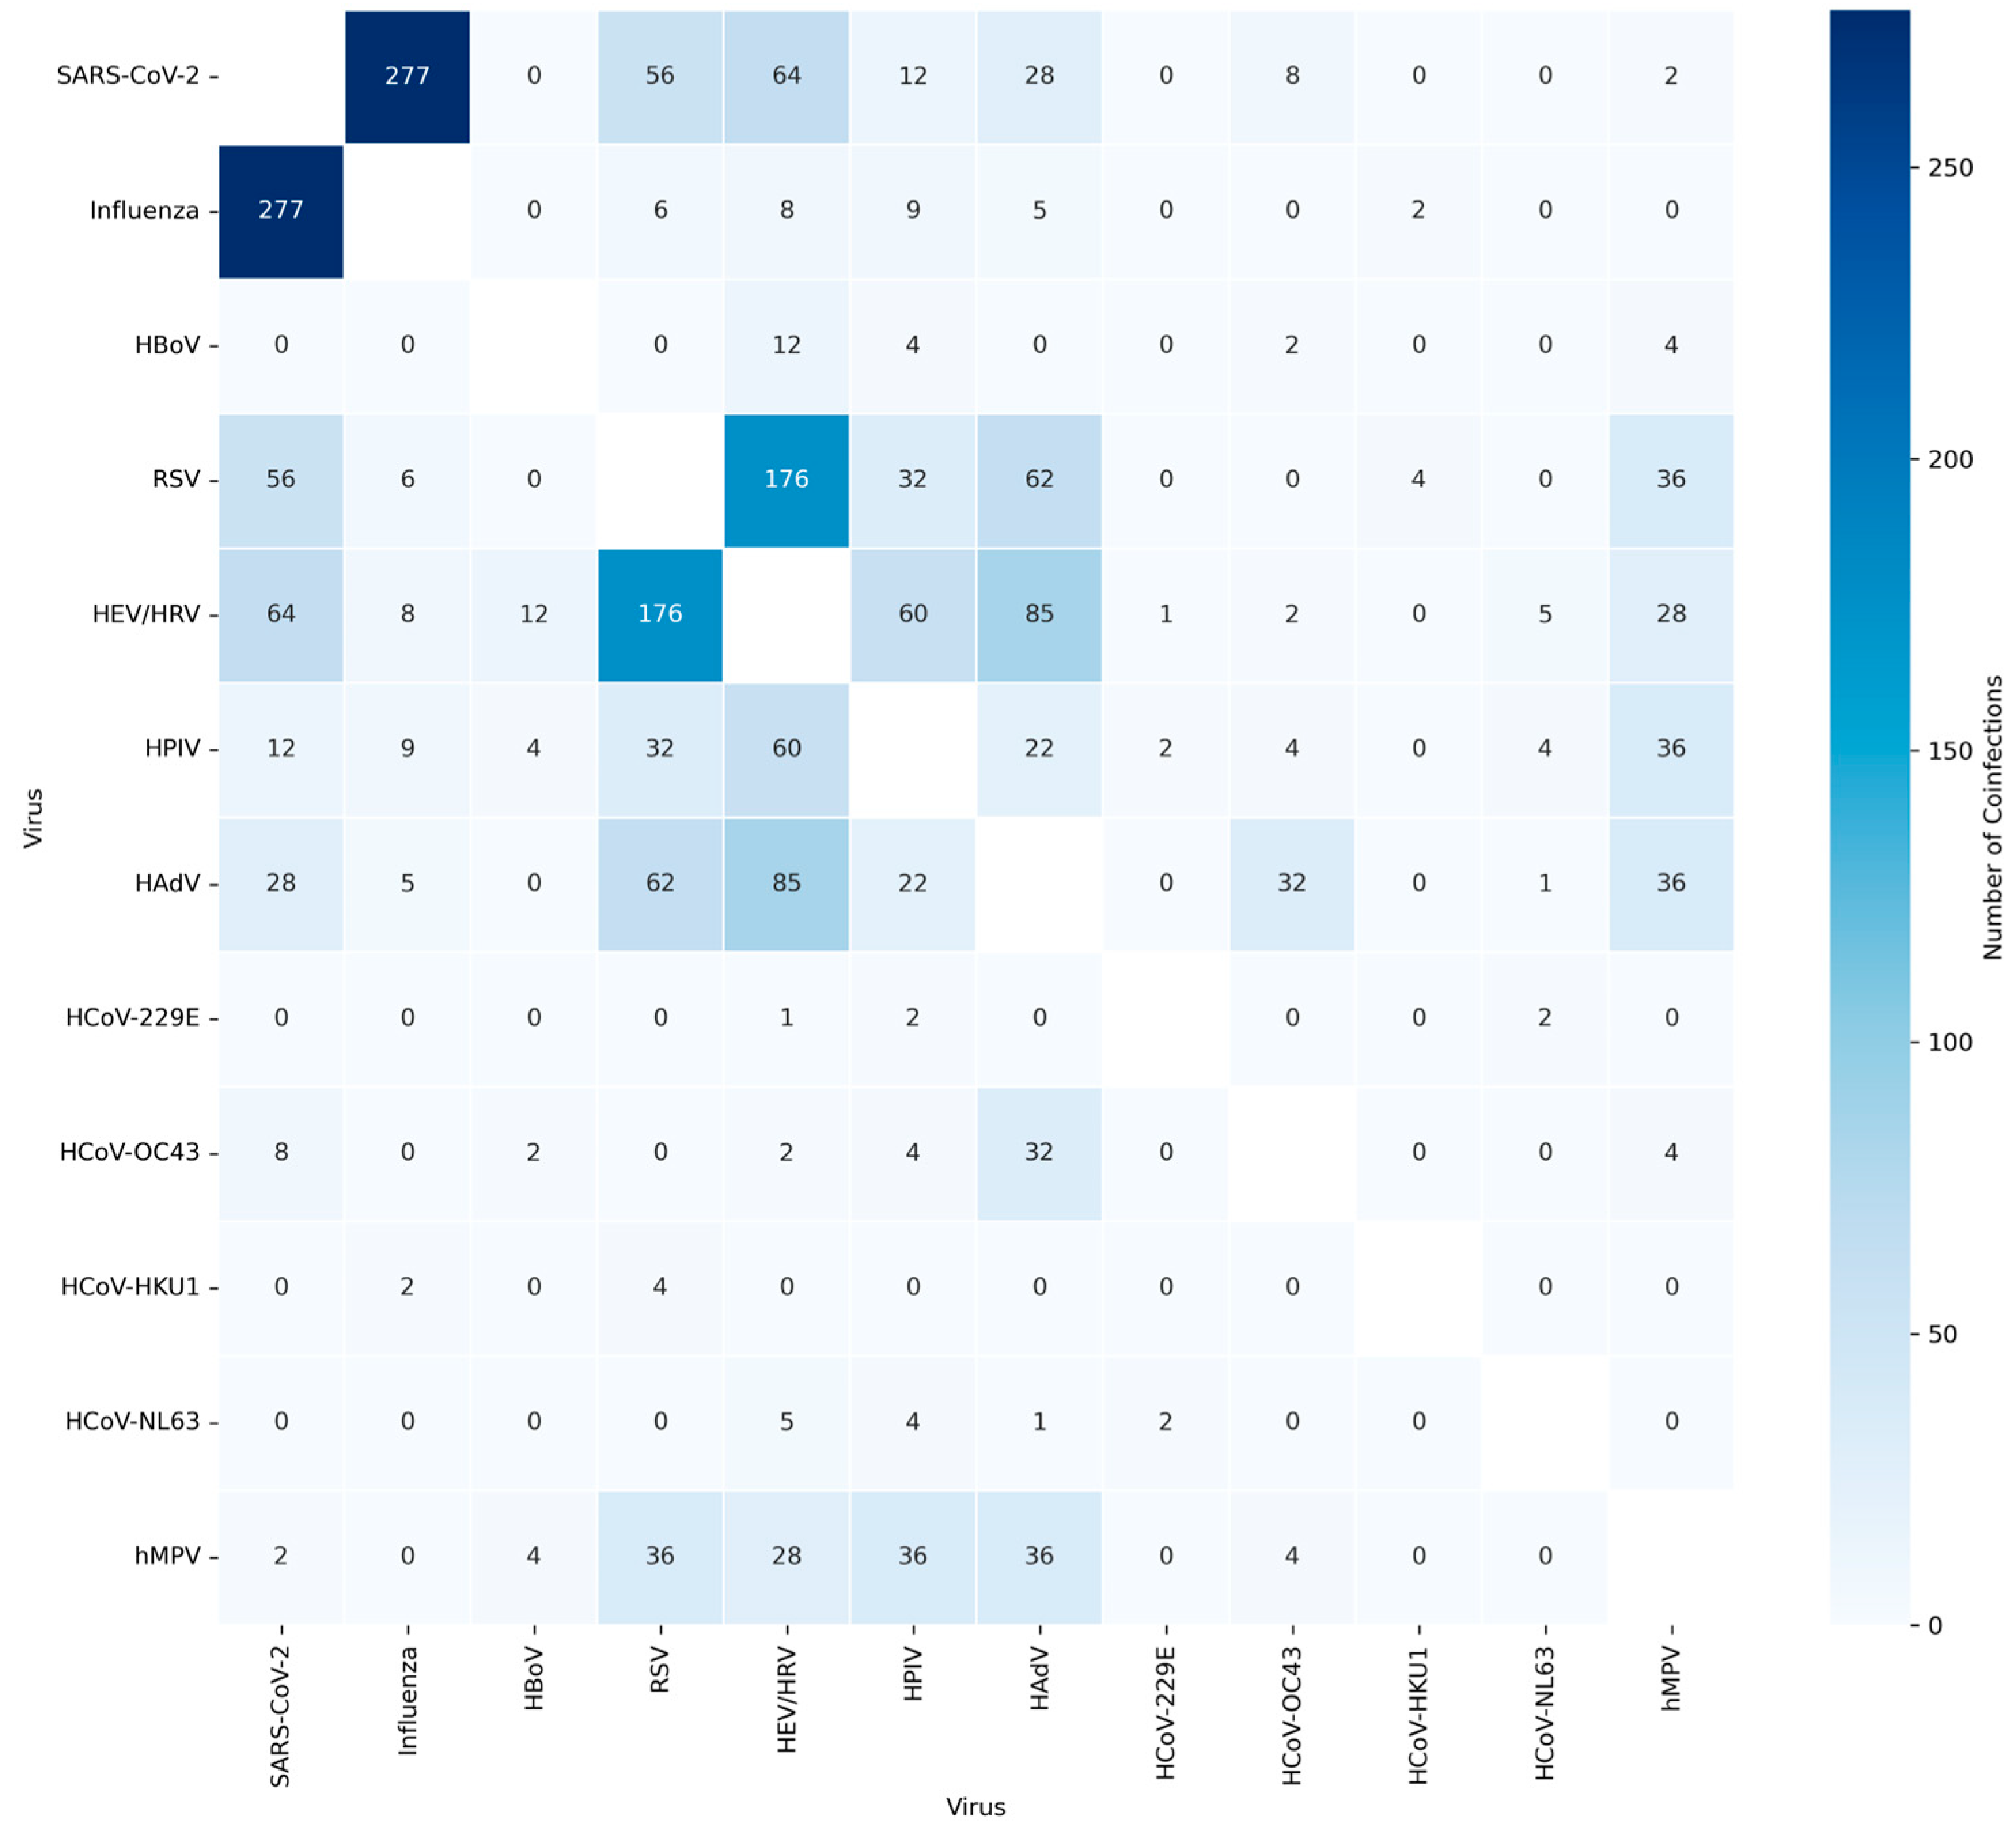
Figure 3.
Monthly distribution of 57,389 influenza virus tested patients: (a) Monthly distribution of tested patients (bars) and positivity rates (lines); (b) Monthly distribution of positive cases by influenza subtype.
Figure 3.
Monthly distribution of 57,389 influenza virus tested patients: (a) Monthly distribution of tested patients (bars) and positivity rates (lines); (b) Monthly distribution of positive cases by influenza subtype.
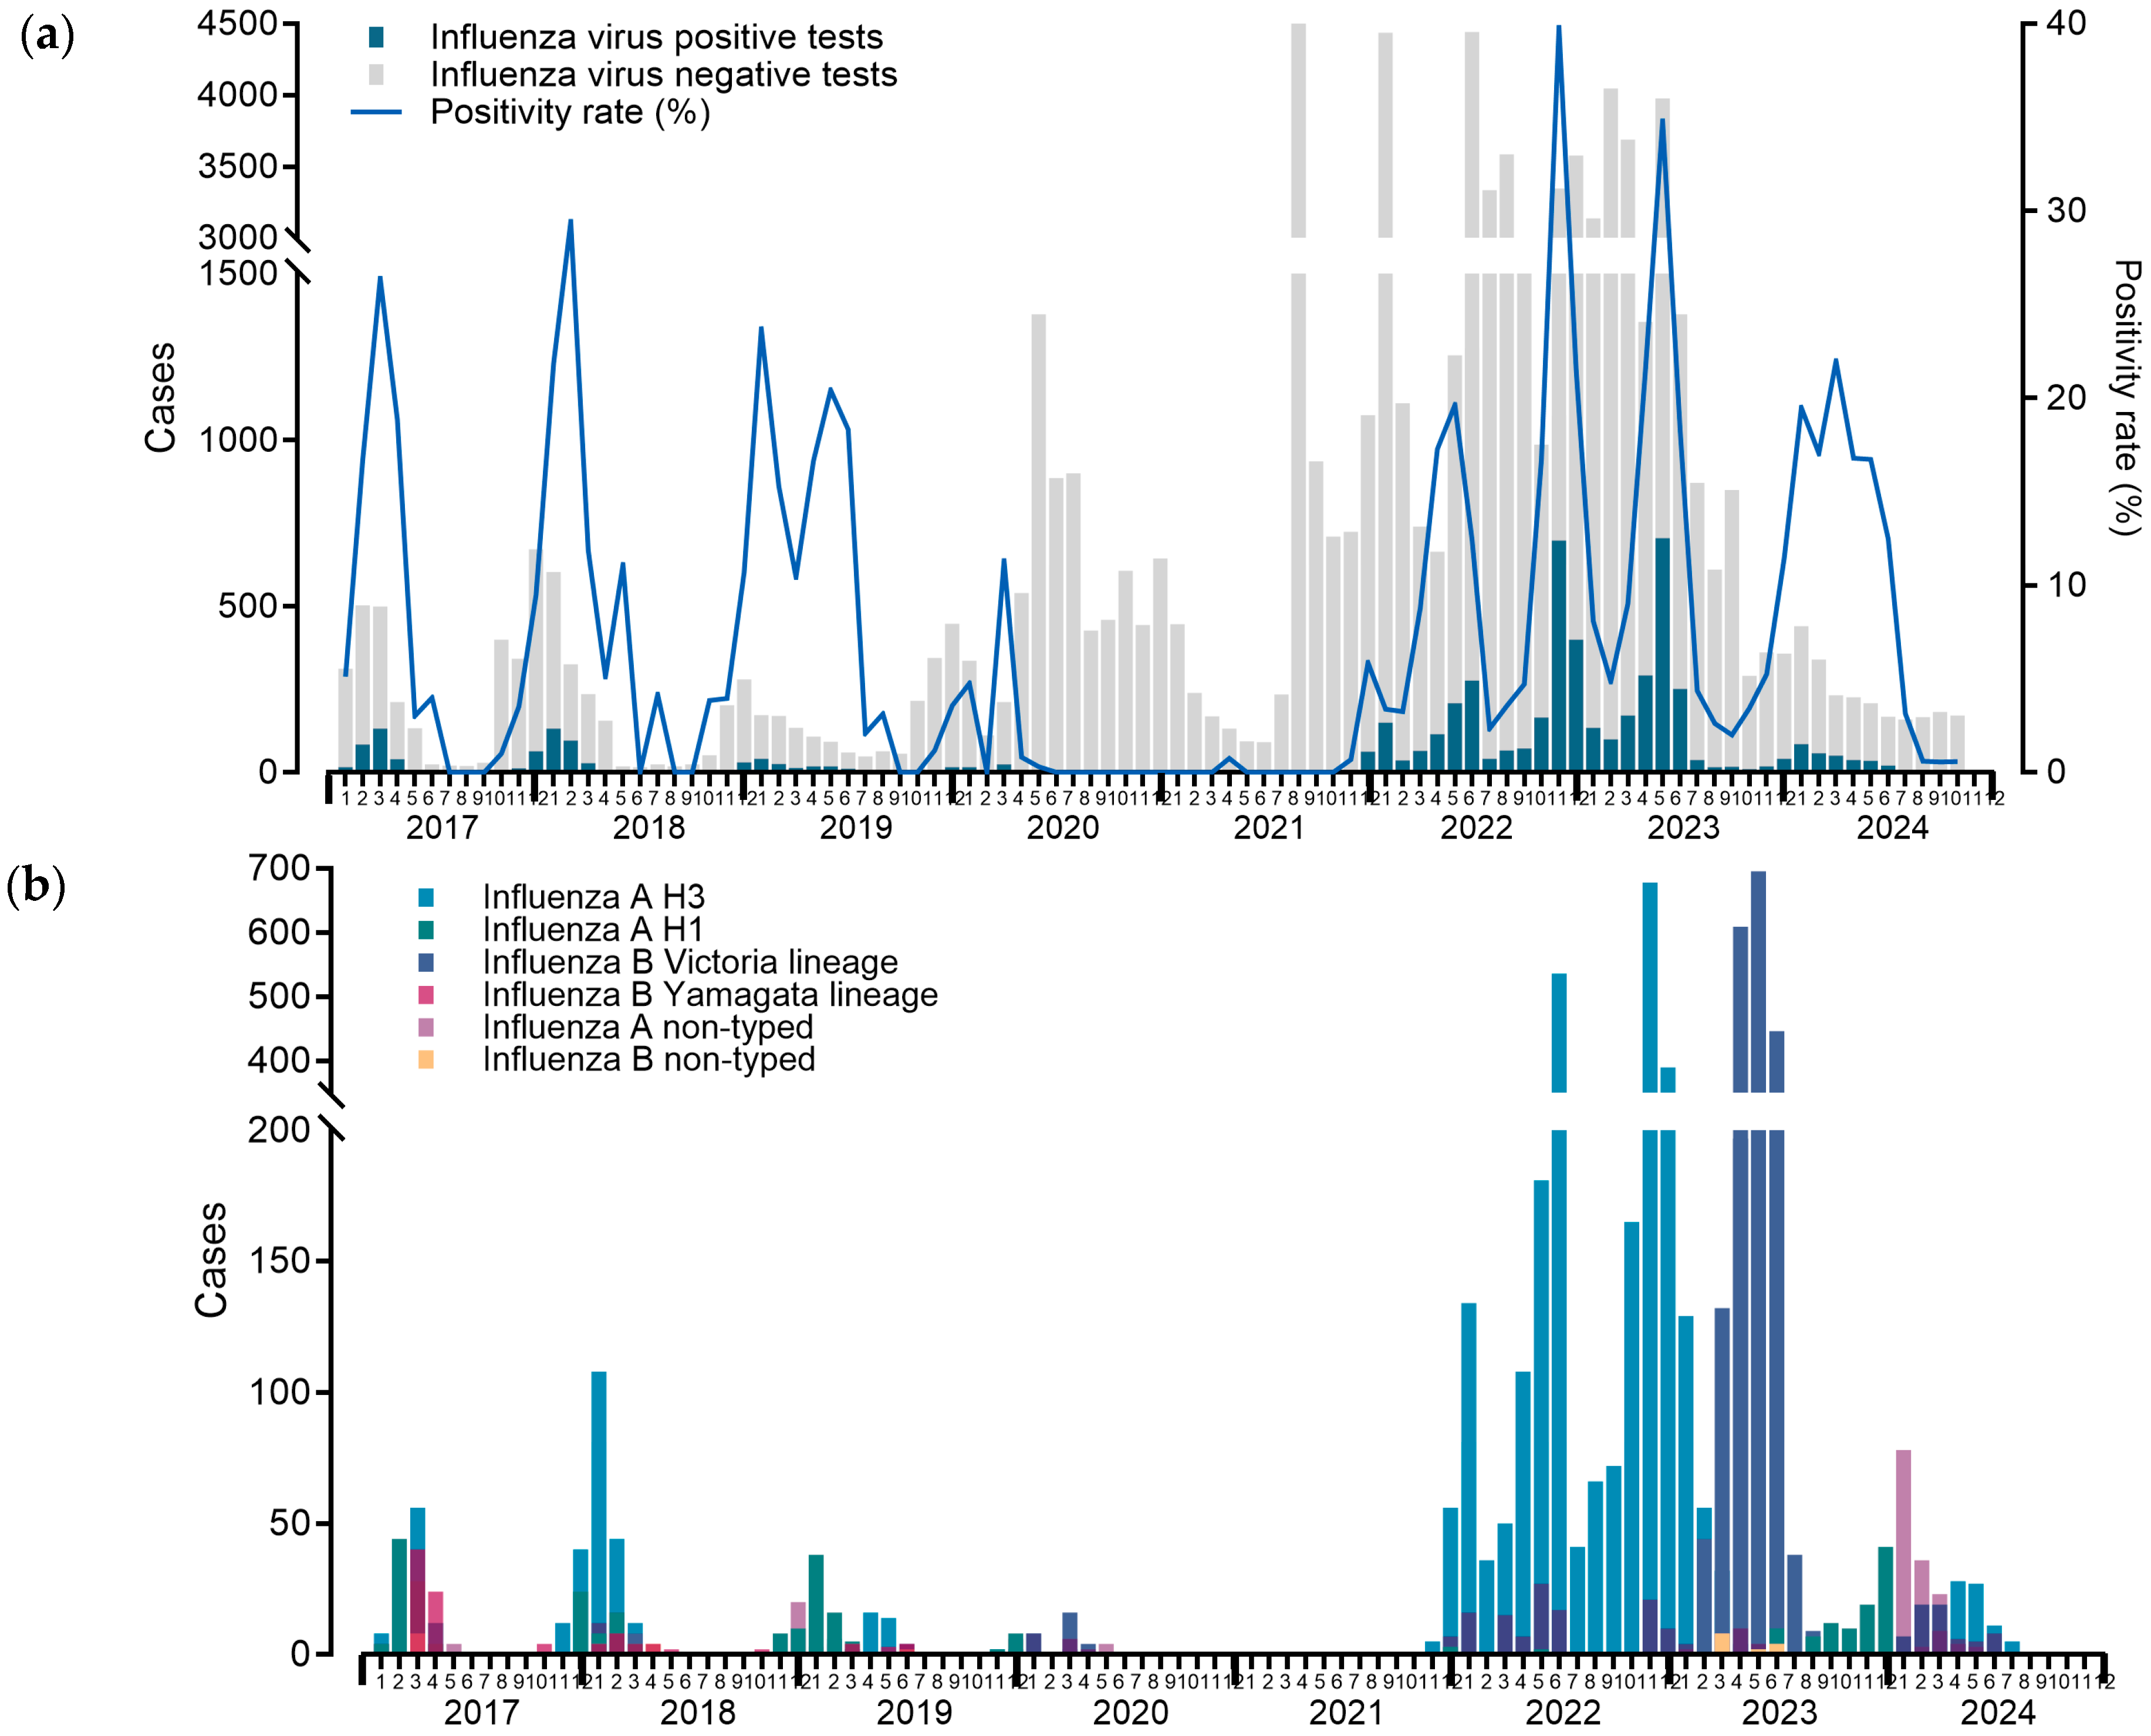
Figure 4.
Monthly distribution of RSV tested patients (bars) and positivity rates (lines).
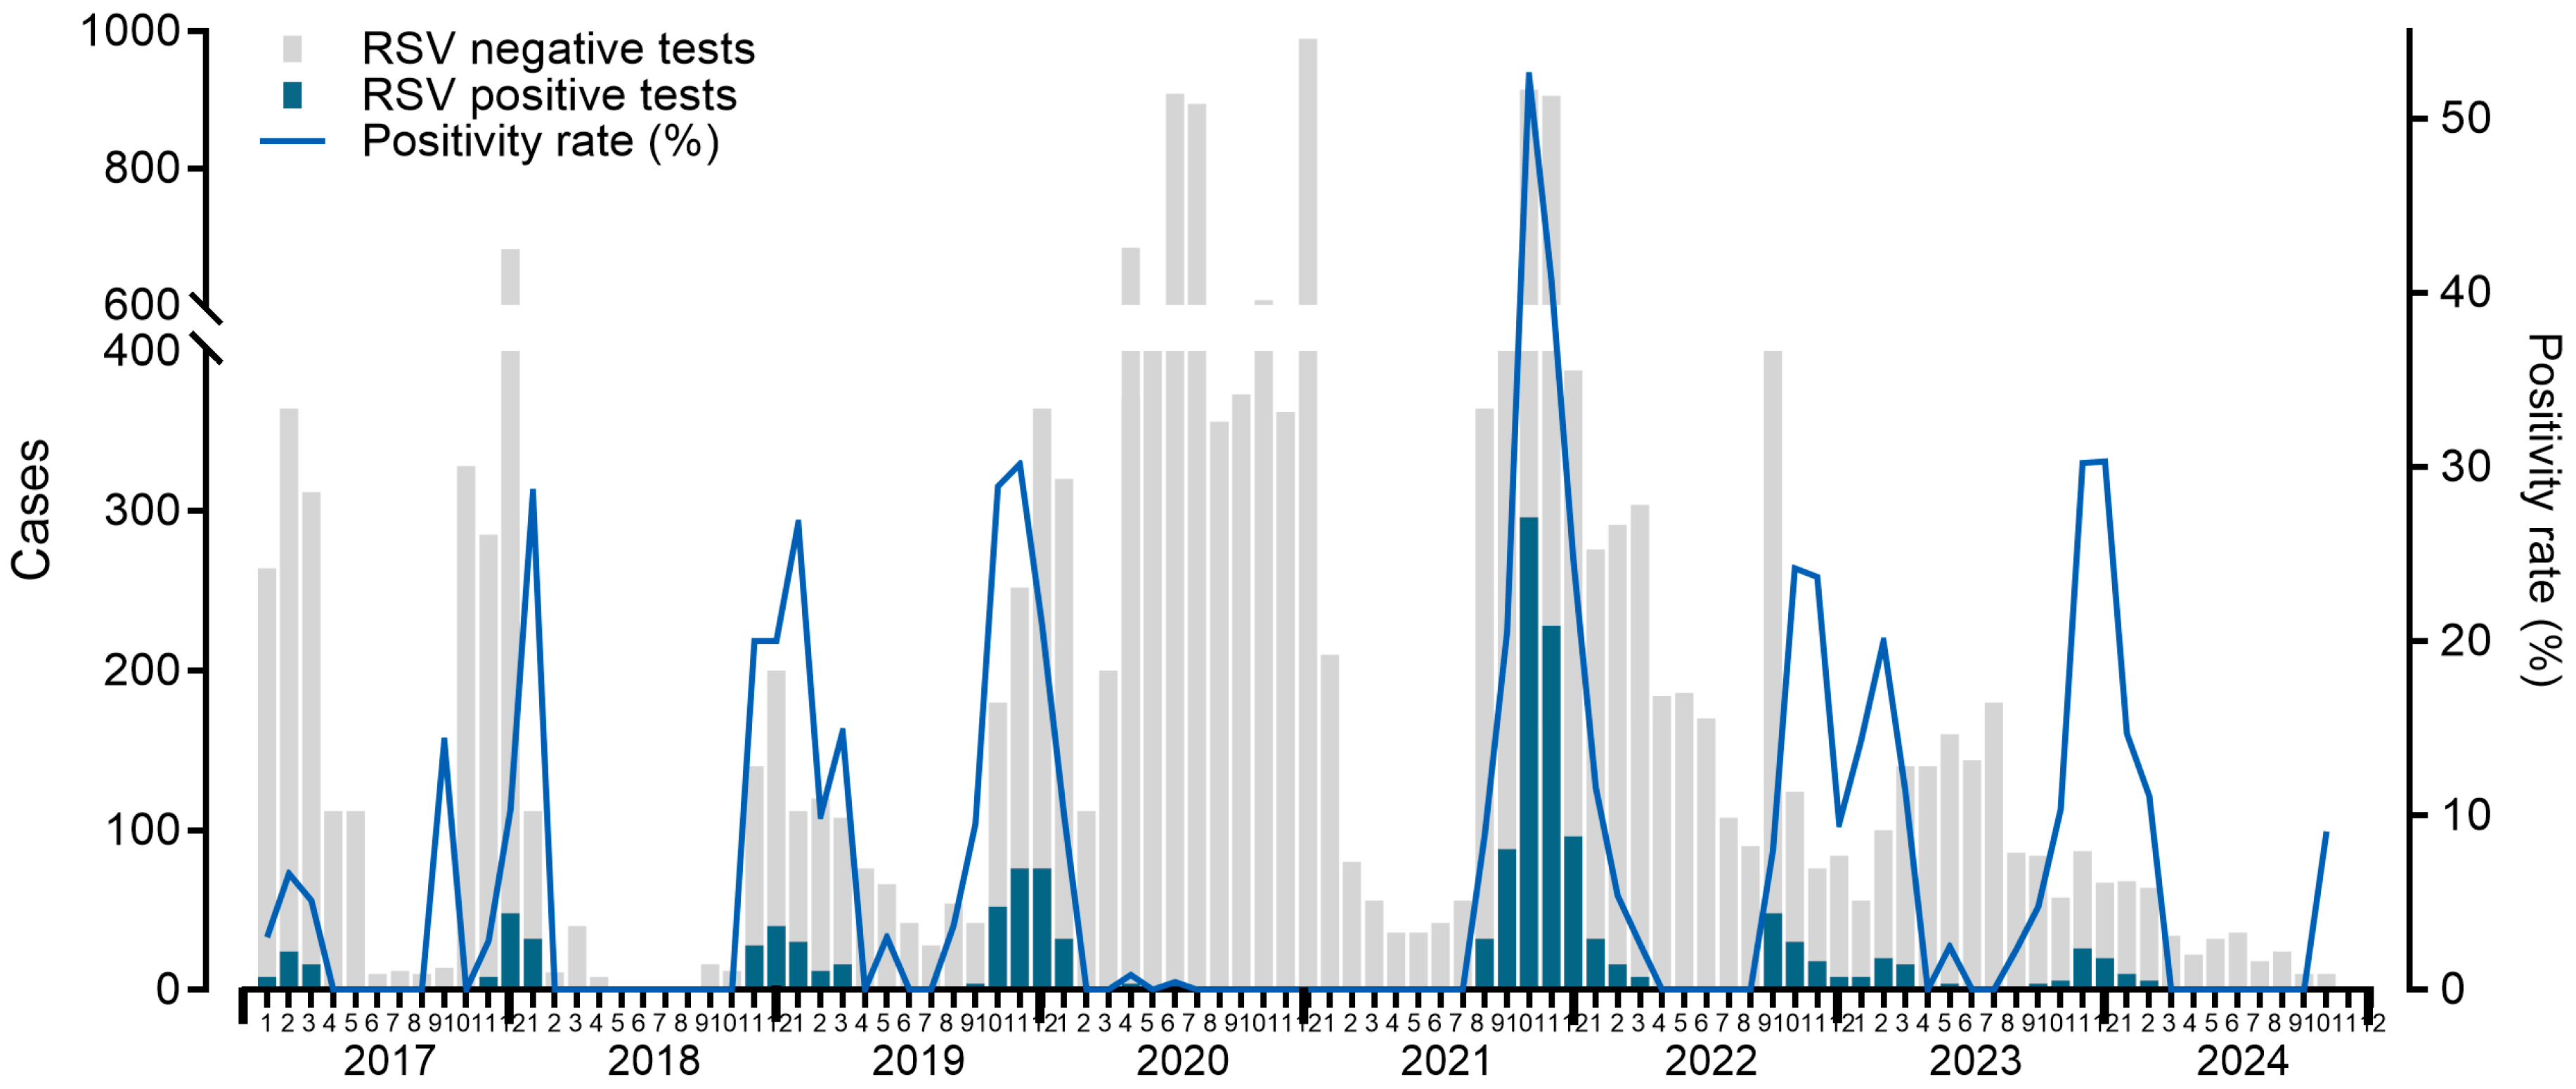
Figure 5.
Monthly distribution of patients with positive tests for other respiratory viruses (bars) and positivity rates (lines).
Figure 5.
Monthly distribution of patients with positive tests for other respiratory viruses (bars) and positivity rates (lines).
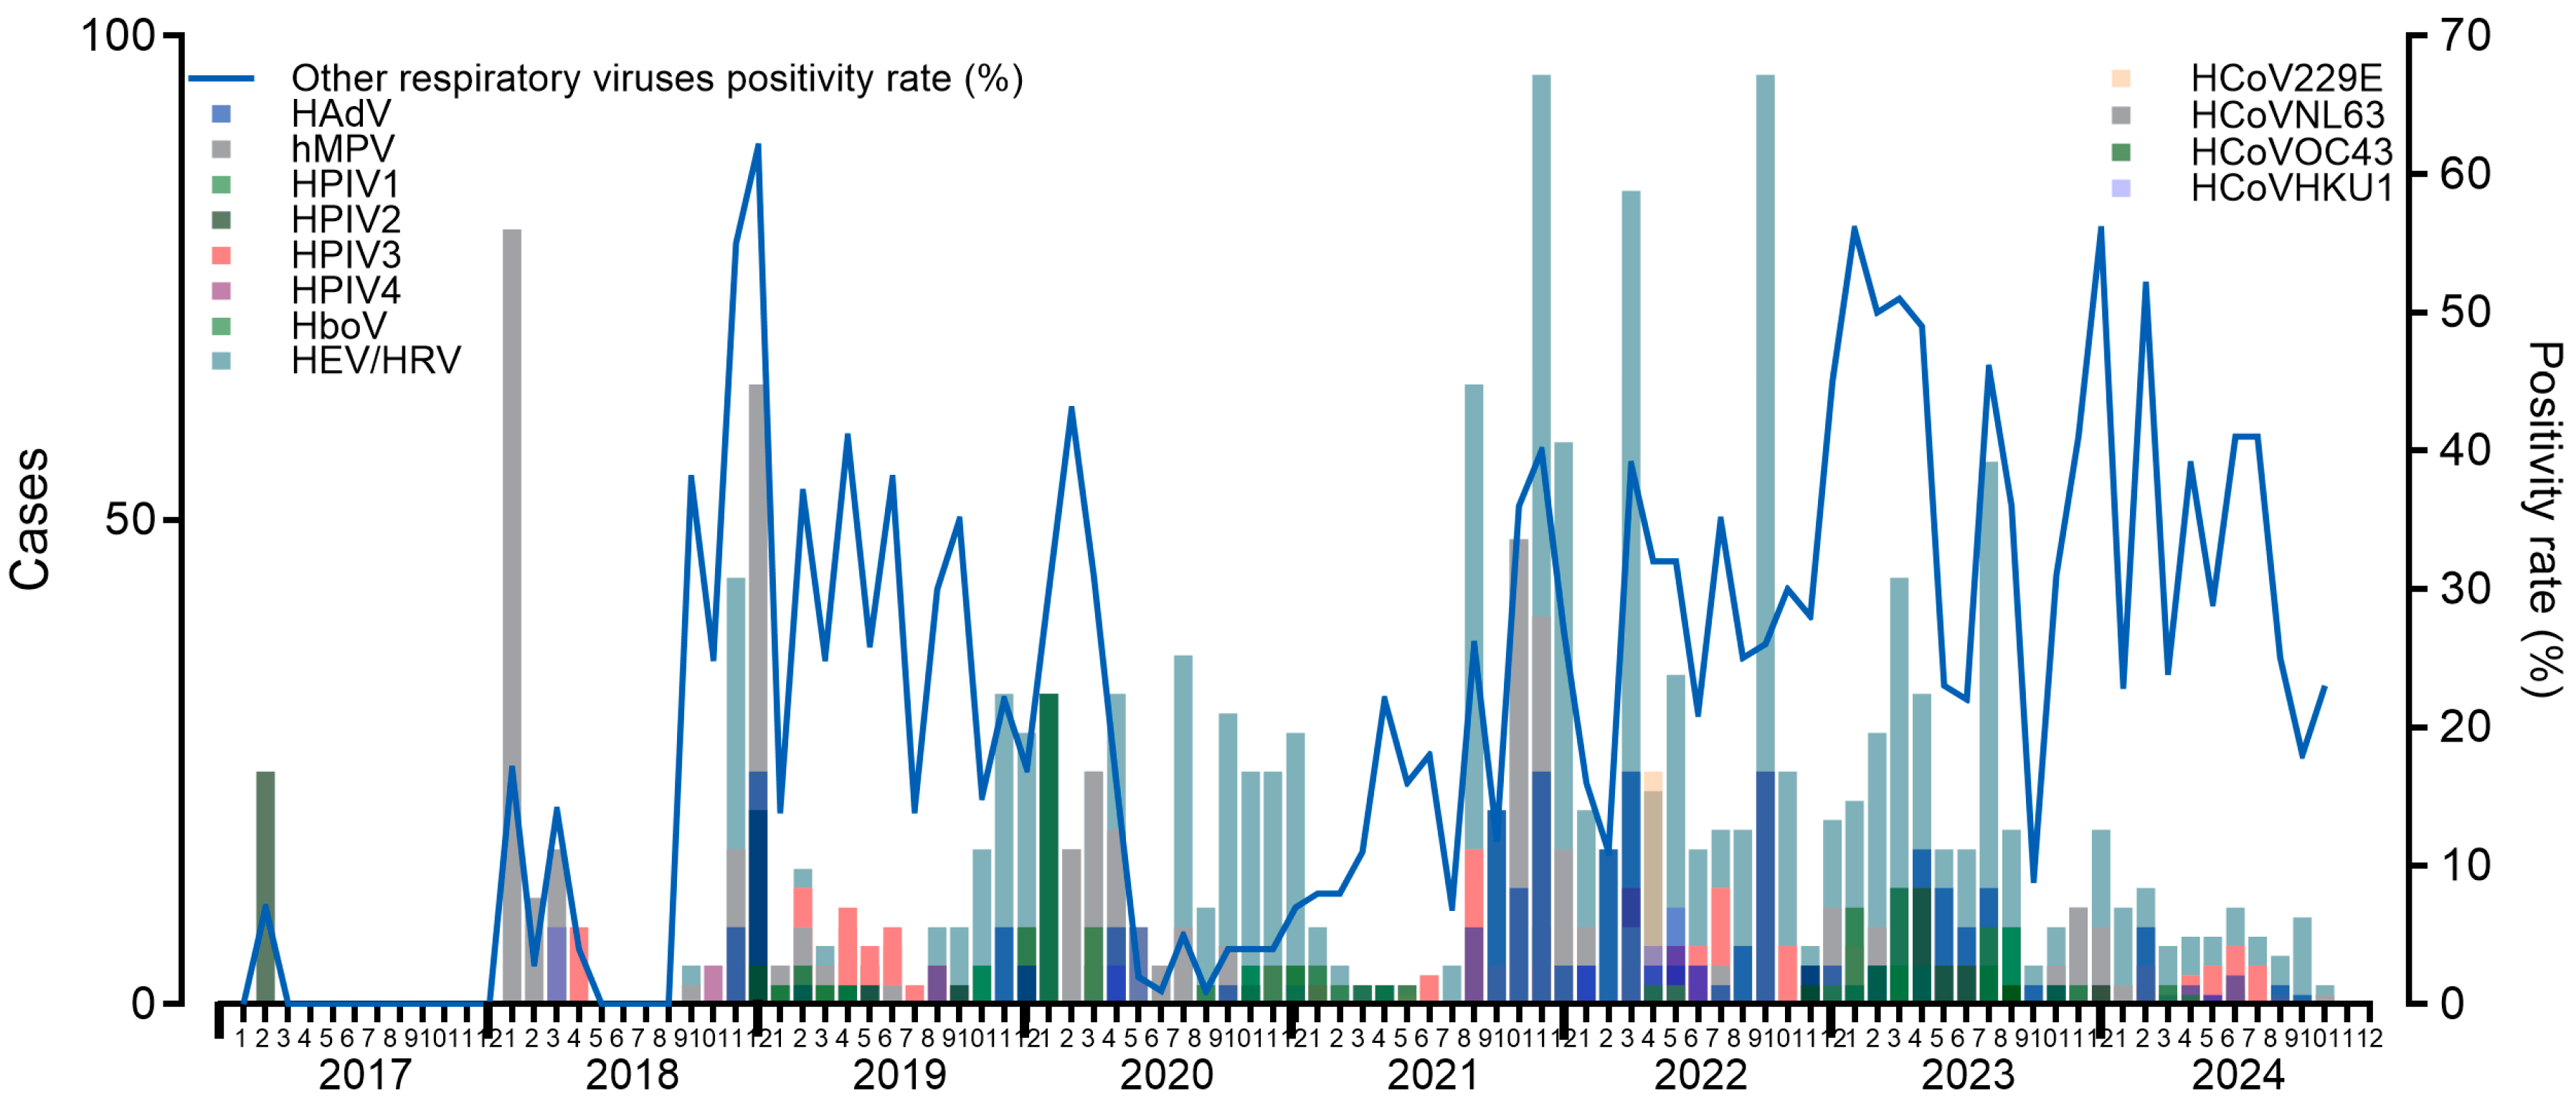
Table 1.
Distribution of respiratory virus cases before and after the COVID-19 pandemic by sex and age group.
Table 1.
Distribution of respiratory virus cases before and after the COVID-19 pandemic by sex and age group.
| Before pandemic | After pandemic | P-value | ||||||
|---|---|---|---|---|---|---|---|---|
| cases (N) | (%) | Annual mean | cases (N) | (%) | Annual mean | |||
| Sex | ||||||||
| Female | 1106 | 53.20 | 272 | 4022 | 55.75 | 800.8 | 0.036 | |
| Male | 973 | 46.80 | 240.25 | 3192 | 44.25 | 635.8 | ||
| Age group | ||||||||
| 0-2 | 758 | 36.46 | 187.25 | 1691 | 23.44 | 336.6 | <0.001 | |
| 3-5 | 199 | 9.57 | 48 | 460 | 6.38 | 90.8 | ||
| 6-14 | 150 | 7.22 | 36.25 | 780 | 10.81 | 154.8 | ||
| 15-65 | 757 | 36.41 | 188 | 3825 | 53.02 | 763.4 | ||
| >65 | 215 | 10.34 | 52.75 | 458 | 6.35 | 91 | ||
Table 2.
Sociodemographic and clinical characteristics of patients with detected respiratory viruses.
Table 2.
Sociodemographic and clinical characteristics of patients with detected respiratory viruses.
| Variable | Total of positive tests (n=9,283) |
Total of positive tests in men (n=4,165) |
Total of positive tests in women (n= 5,128) |
P-value |
|---|---|---|---|---|
| Age – median, (IQR) | 22.0 (IQR 2.0-38.0) | 16.0 (IQR 1.0-36.0) | 24.0 (IQR 3.0-39.0) | <0.001 |
| Comorbidities - n, (%) | 2808 (30.25) | 1250 (30.10) | 1558 (30.38) | 0.651 |
| Asthma - n, (%) | 598.0 (6.44) | 212.0 (5.10) | 386.0 (7.53) | <0.001 |
| COPD - n, (%) | 390.0 (4.20) | 155.0 (3.73) | 235.0 (4.58) | 0.041 |
| Smoking - n, (%) | 624.0 (6.72) | 374.0 (9.01) | 250.0 (4.88) | <0.001 |
| Diabetes - n, (%) | 605.0 (6.52) | 261.0 (6.28) | 344.0 (6.71) | 0.392 |
| Hypertension - n, (%) | 816.0 (8.79) | 348.0 (8.38) | 468.0 (9.13) | 0.188 |
| Cardiovascular disease - n, (%) | 245.0 (2.64) | 123.0 (2.96) | 122.0 (2.38) | 0.104 |
| Chronic kidney disease - n, (%) | 177.0 (1.91) | 96.0 (2.31) | 81.0 (1.58) | 0.014 |
| Obesity - n, (%) | 652.0 (7.02) | 278.0 (6.69) | 374.0 (7.29) | 0.245 |
| Immunosuppression - n, (%) | 365.0 (3.93) | 222.0 (5.35) | 143.0 (2.79) | <0.001 |
| HIV infection - n, (%) | 86.0 (0.93) | 58.0 (1.40) | 28.0 (0.55) | <0.001 |
| Pregnancy - n, (%) | 186.0 (2.00) | - | 186.0 (3.63) | - |
Table 3.
Respiratory virus detections other than SARS-CoV-2 in patients who presented with respiratory symptoms.
Table 3.
Respiratory virus detections other than SARS-CoV-2 in patients who presented with respiratory symptoms.
| Virus - n, (%) | Total of positive tests (n=9,283) |
Total of positive tests in men (n=4,165) |
Total of positive tests in women (n= 5,128) |
P-value |
|---|---|---|---|---|
| Influenza virus* | 5325.0 (9.28) | 2198.0 (3.83) | 3127.0 (5.45) | <0.001 |
| Influenza A | 3677.0 (69.05) | 1528.0 (36.79) | 2149.0 (42.15) | 0.569 |
| Influenza A H3 | 2968.0 (55.73) | 1208.0 (29.09) | 1760.0 (34.52) | 0.346 |
| Influenza A H1N1 | 326.0 (6.12) | 169.0 (4.07) | 157.0 (3.08) | <0.001 |
| Influenza A nonsubtyped | 387.0 (7.27) | 153.0 (3.68) | 234.0 (4.59) | 0.501 |
| Influenza B | 1647.0 (30.93) | 670.0 (16.13) | 977.0 (19.16) | 0.569 |
| Influenza B Victoria lineage | 1511.0 (28.38) | 611.0 (14.71) | 900.0 (17.65) | 0.447 |
| Influenza B Yamagata lineage | 105.0 (1.97) | 43.0 (1.04) | 62.0 (1.22) | 1 |
| Influenza B nonsubtyped | 32.0 (0.60) | 17.0 (0.41) | 15.0 (0.29) | 0.236 |
| Other respiratory viruses* | 3958.0 (22.94) | 1967.0 (11.40) | 2001.0 (11.59) | 0.177 |
| Respiratory syncytial virus | 1534.0 (38.76) | 760.0 (18.30) | 774.0 (15.18) | 0.924 |
| Human enterovirus/rhinovirus | 1458.0 (36.84) | 719.0 (17.31) | 739.0 (14.49) | 0.756 |
| Human metapneumovirus | 485.0 (12.25) | 222.0 (5.35) | 263.0 (5.16) | 0.074 |
| Human parainfluenza virus 1 | 76.0 (1.92) | 48.0 (1.16) | 28.0 (0.55) | 0.024 |
| Human parainfluenza virus 2 | 86.0 (2.17) | 74.0 (1.78) | 12.0 (0.24) | <0.0010 |
| Human parainfluenza virus 3 | 167.0 (4.22) | 95.0 (2.29) | 72.0 (1.41) | 0.068 |
| Human parainfluenza virus 4 | 46.0 (1.16) | 25.0 (0.60) | 21.0 (0.41) | 0.624 |
| Human adenovirus | 366.0 (9.25) | 150.0 (3.61) | 216.0 (4.24) | 0.001 |
| Human coronavirus 229E | 71.0 (1.79) | 28.0 (0.67) | 43.0 (0.84) | 0.105 |
| Human coronavirus OC43 | 104.0 (2.63) | 42.0 (1.01) | 62.0 (1.22) | 0.069 |
| Human coronavirus HKU1 | 42.0 (1.06) | 21.0 (0.51) | 21.0 (0.41) | <0.0011 |
| Human coronavirus NL63 | 59.0 (1.49) | 32.0 (0.77) | 27.0 (0.53) | 0.565 |
| Human bocavirus | 58.0 (1.47) | 36.0 (0.87) | 22.0 (0.43) | 0.077 |
* The percentage calculations for influenza and ORVs were based on the total number of tests conducted (57,389 for influenza and 17,253 for ORVs), whereas the proportions for specific influenza subtypes and ORVs were calculated relative to the total number of detected influenza cases and ORVs, respectively.
Disclaimer/Publisher’s Note: The statements, opinions and data contained in all publications are solely those of the individual author(s) and contributor(s) and not of MDPI and/or the editor(s). MDPI and/or the editor(s) disclaim responsibility for any injury to people or property resulting from any ideas, methods, instructions or products referred to in the content. |
© 2024 by the authors. Licensee MDPI, Basel, Switzerland. This article is an open access article distributed under the terms and conditions of the Creative Commons Attribution (CC BY) license (http://creativecommons.org/licenses/by/4.0/).
Copyright: This open access article is published under a Creative Commons CC BY 4.0 license, which permit the free download, distribution, and reuse, provided that the author and preprint are cited in any reuse.


