
Submitted:
24 November 2024
Posted:
25 November 2024
You are already at the latest version
Abstract
Supply chains operate under the changing influences of multiple external and internal factors. Sustainable supply chain development requires an assessment of these factors, as well as drivers and barriers. The authors' analysis of supply chain research has not found a universally accepted methodology for selecting harmonized implementation of methods and instruments for designing sustainable supply chains, as well as assessing sustainability. Various sustainability assessment criteria, methods, and models based on the consideration of the influence of different factors are used depending on the type and structure of the supply chain. This study proposes a system of drivers for sustainable supply chain development. The peculiarity of the used supply chain model is the universality of its structure, which ensures the realization by the structural elements of the chain of all known functional areas of logistics. A framework for sustainable supply chain drivers' multi-criteria assessment based on the use of the original two-level system of drivers' assessment criteria is developed. The combination of DEMATEL and CRADIS multi-criteria methods is applied to rank the efficiency of drivers for achieving sustainable development goals, both for the supply chain as a whole and for each of its structural elements. The results of the supply chain sustainability drivers' ranking and the framework developed by the authors are intended to justify decisions on the green logistics methods and instruments selection.
Keywords:
sustainable development
; sustainable supply chain
; drivers
; factors
; barriers
; MCDM
; DEMATEL
; CRADIS
; green logistics
1. Introduction
The variability and uncertainty of many supply chain performance factors complicate decision-making. Globalization, shorter product life cycles, government regulation, and the development of innovations lead to the emergence of new products and services, changes in the goals and behavior of stakeholders in supply chains [1]. However, each supply chain participant assesses the impact of environmental factors differently. Such assessments do not always coincide with the objective intensity and strength of the impact of factors that have a different impact on the elements of supply chains. This complicates the coordinated functioning of the supply chain links and reduces their efficiency. Therefore, solving the problem of prioritizing factors, determining their importance and the degree of their influence on supply chain elements is necessary for effective decision-making.
At present, the efficiency of supply chain performance is increasingly being assessed by the sustainability criterion — a complex criterion for achieving economic, social and environmental goals. This is the peculiarity of the supply chain structure, when the elements of the same chain can be in regions with different natural, climatic and political conditions, different socio-economic levels. The only factor that has a similar impact on different elements of supply chains is the need to address a set of global environmental problems related to greenhouse gas emissions, environmental pollution, exhaustion of natural resources and climate change.
According to UN Secretary General Antonio Guterres “Every country, city, financial institution and company must adopt zero emission plans and act now to get on the right track towards this goal, which means reducing global emissions by 45% by 2030 compared to 2010 levels” [2]. Following this trend, many of the world's leading organizations are planning to achieve carbon neutrality in their operations and supply chains [3]. Most countries have adopted Sustainable Development Goals (SDGs) and are implementing the concept of Sustainable Development. Growing pressure from stakeholders, governmental and non-governmental organizations forces various industries to implement sustainable supply chain management initiatives — Sustainable Supply Chain Management (SSCM) [4]. Integrating the concept of sustainable development into supply chain operations allows companies to create a competitive advantage [5]. Therefore, sustainability and SDGs are becoming increasingly relevant for inclusion in business logistics and supply chain management [6].
The implementation of sustainability initiatives depends on various internal and external drivers and barriers [7]. Recently, the composition of these drivers and barriers of sustainable and green supply chains has been actively debated in the scientific community [5,8,9]. Answers are sought as to what drivers influence sustainability [10,11,12], how to measure the performance of sustainable supply chains [8,13], and what models and methods to use for evaluation [14]. Many researchers have investigated individual drivers of SSCM. Despite the acknowledged importance of addressing this issue, the task of systematizing the known drivers of SSCM, determining their significance and the degree of their influence on supply chain elements to make effective decisions remains unsolved.
The main goal of our study is to systematize the factors, drivers, and barriers of supply chain sustainability to design a universal sustainability assessment framework using multi-criteria analysis. This study makes both theoretical and practical contributions to the field of sustainable supply chain management. First, based on the literature review and the structural-functional approach, we performed the identification and developed a universal system of supply chain sustainability drivers. The main idea of the systematization is to identify and group various factors that affect the performance of supply chain elements in their logistics functions. Second, we developed a methodology for ranking supply chain sustainability drivers using multi-criteria decision-making (MCDM) techniques. The methodology will help stakeholders to make effective decisions on logistics flow management using a justified sustainability assessment of supply chain elements as well as the factors impacting the performance of their logistics functions.
The paper is organized as follows. The second part reviews the existing research in the field of assessing the drivers and barriers of supply chain sustainability, identifies the main shortcomings of the existing approaches to sustainability assessment. The third part contains the description of the original methodology for assessing the drivers of supply chain sustainability. The methodology is based on the proposed universal system of sustainable supply chain drivers, which considers the structure and functions of supply chain elements, as well as a combined multi-criteria model of driver ranking. The fourth part presents a case study of sustainable supply chain driver ranking using the developed MCDM model. The conclusion presents the main results and the prospects of the future research.
2. Literature Review
The paper analyzes 89 articles on the problems of supply chain sustainability assessment (Table 1). The review of the publications allowed us to identify the following main research areas:
- factors, drivers, and barriers of supply chain sustainability, as well as indicators of their assessment.
- models and methods for assessing the performance and sustainability of different types of supply chains.
- case studies of supply chains of different types and structures.
The generalized results of the analysis are presented in Fig. 1.
Figure 1.
Results of the grouping of studies SSCM factors, drivers, and barriers.
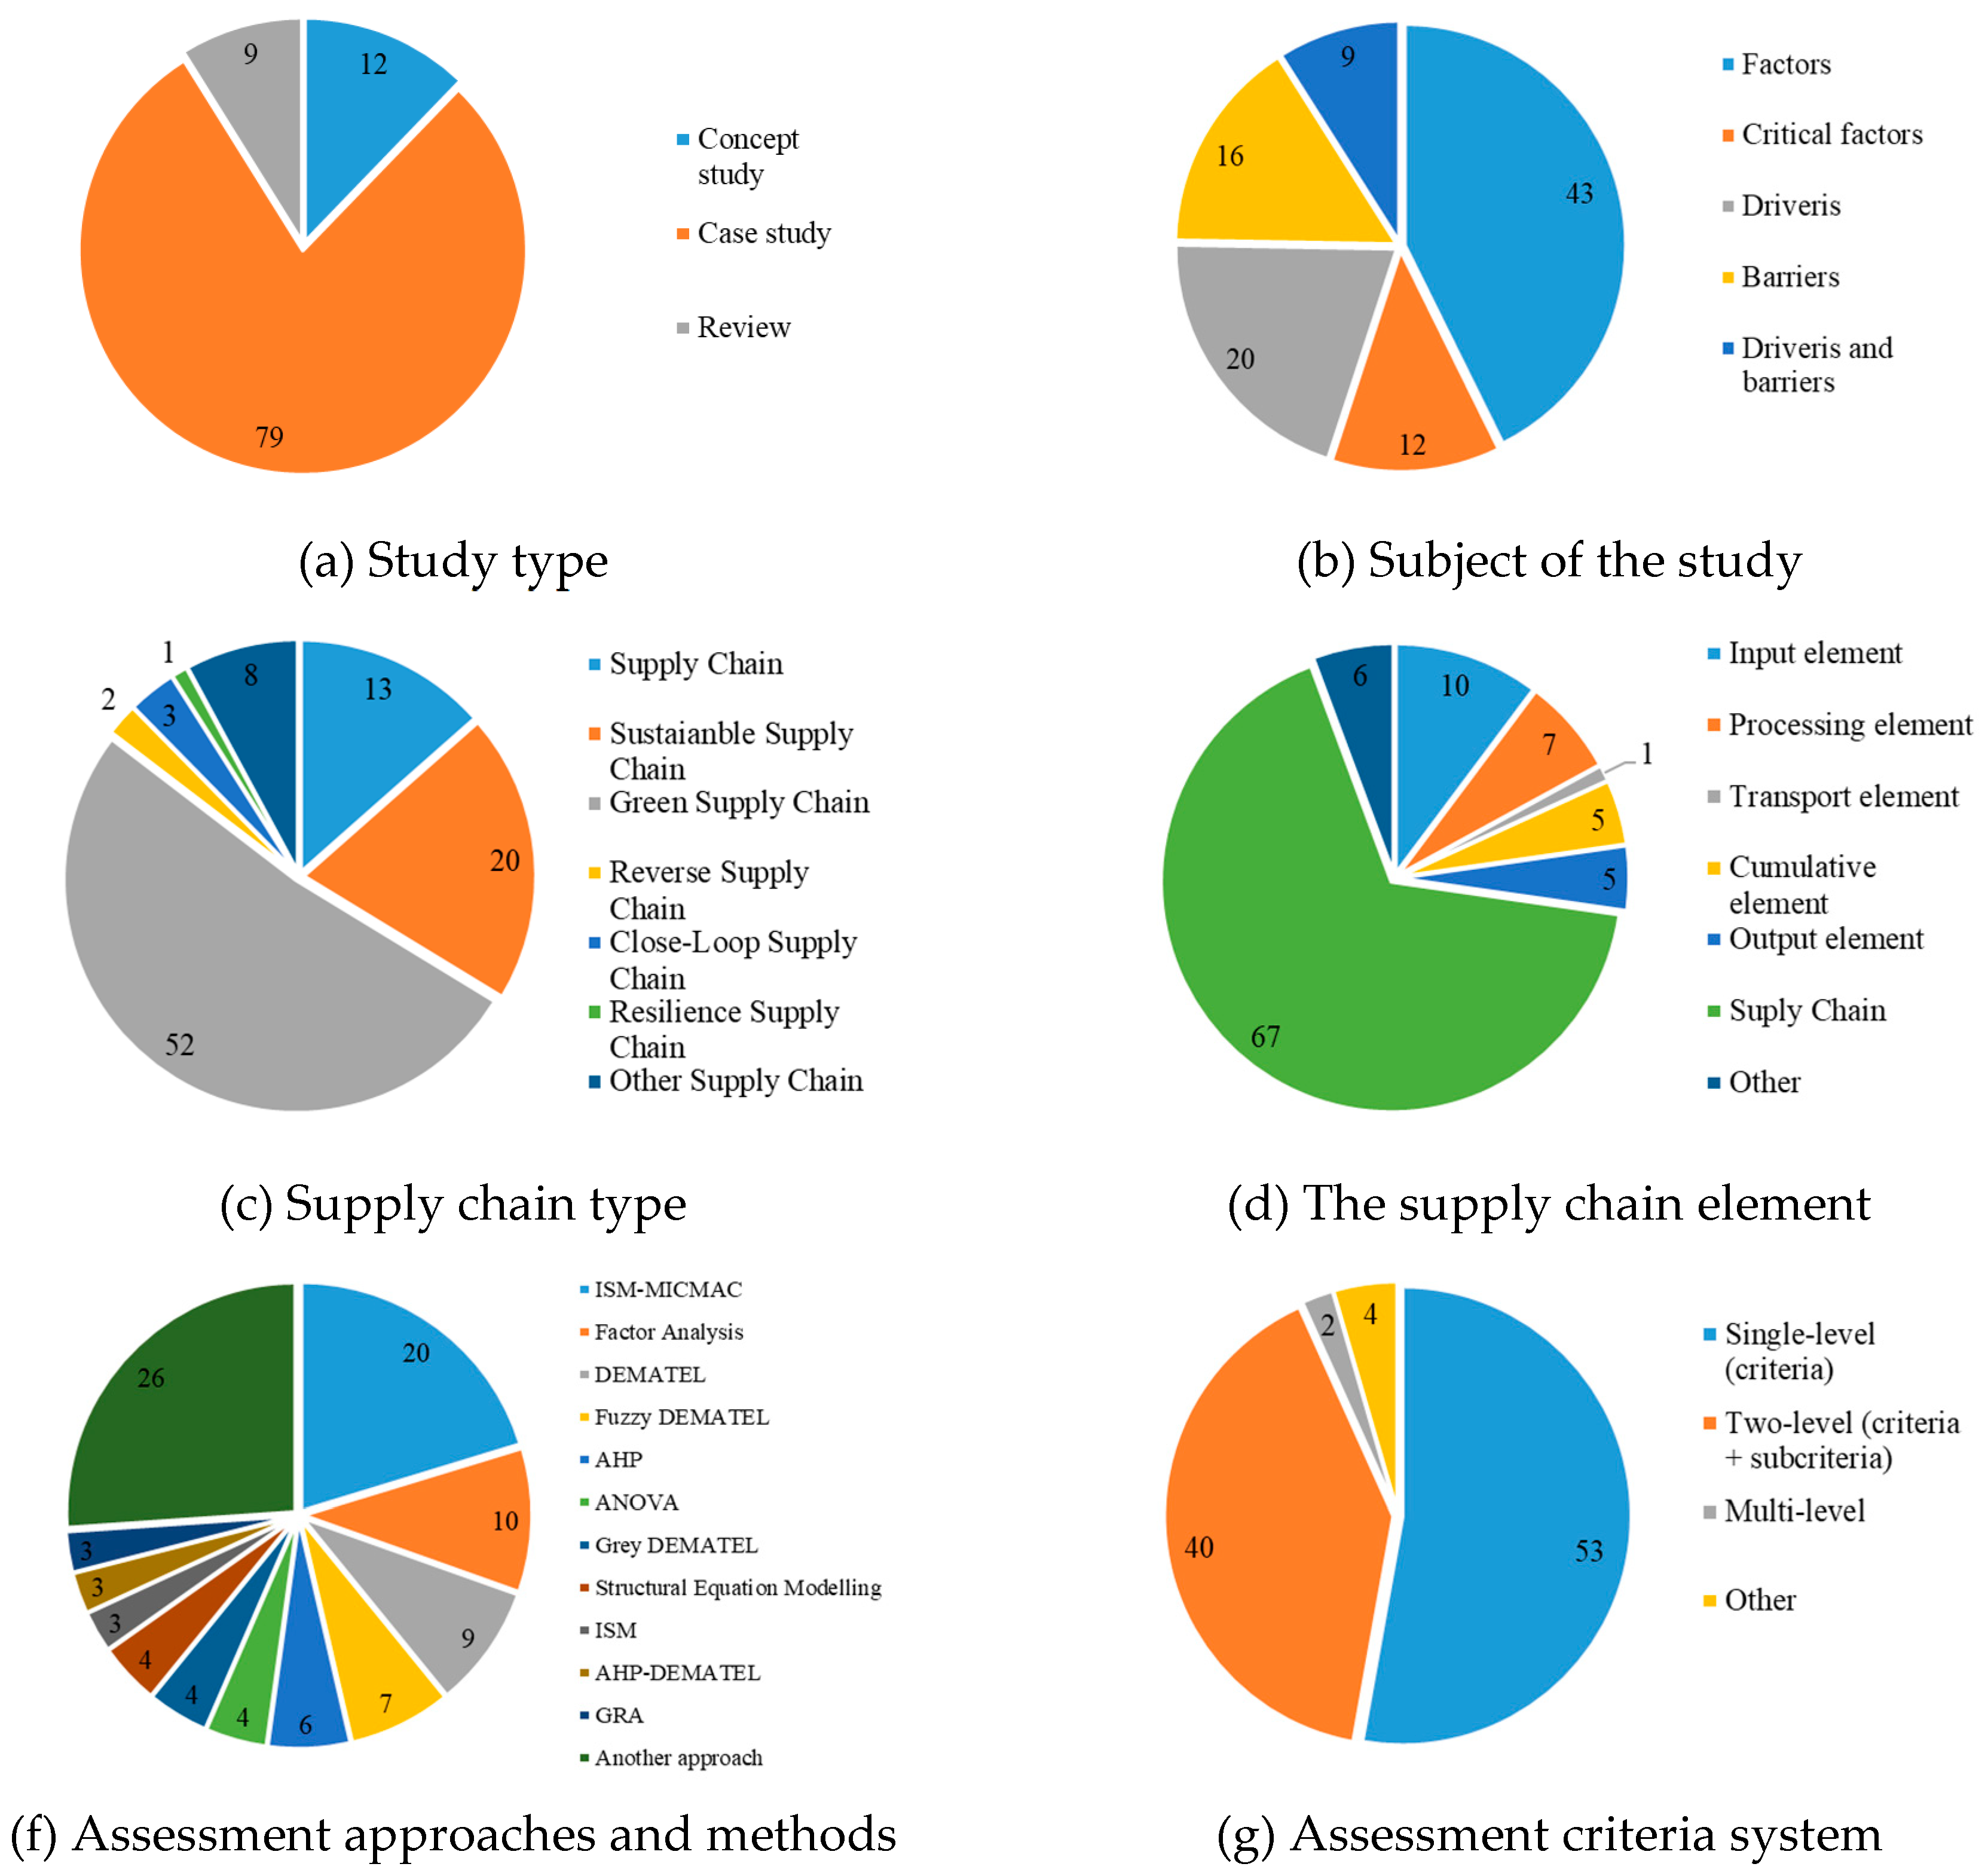
The distribution of articles by type of research indicated that case studies predominate, with a share of 79%. Conceptual studies and review articles account for 12% and 9%, respectively. The results for each group of articles are analyzed below.
2.1. Review Papers
Paper [8] emphasizes supply chain structure, inventory control policy, information sharing, customer demand, forecasting method, lead time and review period length as the main factors of supply chain efficiency. According to the authors [8], an optimal set of parameters of these factors increases the efficiency of the supply chain. By analyzing 1559 sustainable supply chain drivers (from 217 papers) [9], the authors compiled a list of 40 unique SSCM drivers. All SSCM drivers are grouped into two groups — internal and external drivers. The group of internal drivers includes corporate strategy, organizational culture, organizational resources, organizational characteristics. The group of external drivers includes regulatory pressures, societal pressures, market pressures. In [12] the results of the study of critical factors for the realization of sustainable supply chain innovations are presented. Fourteen main categories of critical factors are identified, the most significant of which are cooperation, strategic orientation, culture, practice and political context. The paper [15] investigated the realization of sustainable supply chains. The authors researched 115 papers and identified 69 attributes of supply chain visibility, which were grouped into 15 groups of factors. In [11], based on the review of 47 articles, an ABCDE framework is proposed which includes five groups of supply chain visibility factors: antecedents (A), barriers and challenges (BC), drivers (D), and effects (E), and provides a holistic view of supply chain visibility. In [16], based on the analysis of 59 research papers, 37 drivers and 36 barriers are systematized as the main factors affecting the performance of reverse logistics. In [17], based on a literature review, a grouping of 10 drivers and 15 barriers of green supply chains is proposed considering internal and external factors. A review of 188 papers [18] identified 15 success factors to implement sustainable supply chain management. Based on a systematic review of 362 papers [5], authors found 22 drivers and 19 barriers of sustainable supply chains. The authors note the prevalence of case studies, which help to analyze the latest advances in SSCM for a specific supply chain.
2.2. Conceptual Studies
The authors in [19] concluded that empirical studies on green supply chain management factors show different results. They investigated six factors and showed that green manufacturing is the most influential and the green logistics factor is influenced by all other factors. The results of ranking 13 green supply chain factors in [20] found a strong influence of lack of leadership activity. This is due to the view of the management that implementing a green supply chain will bring negative effects on finance. Authors [21] investigated synchromodal logistics critical success factors. Six groups of factors were identified: network, collaboration, and trust; sophisticated planning; ICT (Information and Communication Technologies) and ITS (Intelligent Transportation Systems); physical infrastructure; legal and political framework; awareness and mental shift; pricing/cost/service. Furthermore, the technologies that influence these critical factors are substantiated.
Paper [10] investigated the internal environment factors of supply chains and identified eight groups of factors, the most significant of which are top management commitment, reverse logistic management, materials store and management. Out of the 8 green supply chain factors investigated in [22], stakeholder cooperation is the most important factor of eco design. Analyzing the factors underlying successful sustainable supply chain management [23] found that signaling, information provision and the adoption of standards are crucial preconditions for strategy commitment, mutual learning, the establishment of ecological cycles and hence for the overall success of SSCM. In [24] the factors influencing the development of supply chains are considered and a model for the development of the regional logistics industry is proposed. The authors in [25] suggested a model of lean and sustainable supply chain management considering 8 factors with 29 influencing determinants. The model [26] of green-lean supply chain management integration considers 15 factors. The paper [7] identifies exogenous drivers and endogenous drivers of supply chains and recommends initiatives to move towards a sustainable state.
2.3. Case Studies
The Green Supply Chain and Sustainable Supply Chain are the most frequent objects of study in case studies. They account for 57% and 18% of all case studies, respectively. Other case studies investigate the drivers [27] and barriers [28] of Close-Loop Supply Chain, Resilience Supply Chain factors [29], critical success factors of reverse logistics [30]. The distribution of case study by country shows the predominance of India (31% of articles) and China (12% of articles). Bangladesh, Germany, UK, Turkey each account for 5% of the analyzed articles, while Taiwan, EU, Thailand, Vietnam each account for 2%. Examples of supply chain research in Thailand, the Middle East, Brasília, Egypt, Iran, Jordan, Korea, Lithuania, Malaysia, New Zealand, Pakistan, Spain, USA are represented by one article in the analyzed sample.
Factors (37% of the total number of case study articles), drivers (22% of the articles) and barriers (19% of the articles) are the most frequent subjects of study. Simultaneous study of drivers and barriers is found in 7% of case study articles. Several studies focus on the study of drivers, drivers, and barriers of individual supply chain elements: input element [31,32,33,34], processing element [35,36,37,38,39], cumulative element [40], transport element [41,42], output element [43,44,45,46]. However, most studies (about 50% of all studies) focus on the comprehensive assessment of the impact of factors on the entire supply chain.
The most used methods for assessing supply chain sustainability factors are: Interpretive Structural Modelling (ISM); Matriced' Impacts Cruoses Multiplication Applique a un Classement (MICMAC) and factor analysis. These methods account for 20% and 10% respectively. The most frequent MCDM methods are DEcision-Making Trial and Evaluation Laboratory, DEMATEL (9% of articles), Fuzzy DEMATEL (7% of articles), Analytic Hierarchy Process, AHP (6% of articles).
Analyzing and evaluating factors, drivers, and barriers use two types of grouping: one-level (53% of articles) or two-level (40%). The number of factors (drivers) can vary and depends on the type of supply chain. In a one-level grouping, the number of factors (drivers) ranges from 3 to 41. In two-level grouping: at the first level — from 2 to 14; at the second level — from 6 to 73.

Table 1.
Supply chain factor assessment studies.
| № | Supply Chain Type | Object of Assessment | Number of Factors, Drivers, and Barriers | Methods and Models** | Reference |
|---|---|---|---|---|---|
| 1 | Supply Chain | Other | 7 factors | — | [8] |
| 2 | Green Supply Chain | Supply Chain | 7 factors | DEMATEL | [19] |
| 3 | Green Supply Chain | Other | 13 factors | ISM | [20] |
| 4 | Sustainable Supply Chain | Supply Chain | 7 drivers / 40 sub-drivers | SLR | [9] |
| 5 | Green Supply Chain | Supply Chain | 8 factors | ISM-MICMAC | [10] |
| 6 | Green Supply Chain | Other | 8 factors | FQFD | [22] |
| 7 | Sustainable Supply Chain | Supply Chain | 8 factors | SLR/Survey | [23] |
| 8 | Green Supply Chain | Supply Chain | 16 factors | DEMATEL | [4] |
| 9 | Green Supply Chain | Supply Chain | 5 factors / 24 sub-factors | AHP-DEMATEL | [47] |
| 10 | Other Supply Chain | Other | 6 factors | ANOVA | [48] |
| 11 | Green Supply Chain | Supply Chain | 11 drivers | ISM-MICMAC | [49] |
| 12 | Green Supply Chain | Supply Chain | 4 critical factors / 20 sub-factors | Factor Analysis | [50] |
| 13 | Other Supply Chain | Other | 3 factors / 20 sub-factors | ANOVA | [51] |
| 14 | Reverse Supply Chain | Supply Chain | 5 factors / 25 sub-factors | AHP-DEMATEL | [30] |
| 15 | Close-Loop Supply Chain | Other | 3 drivers | — | [52] |
| 16 | Supply Chain | Supply Chain | 3 drivers | AHP | [53] |
| 17 | Green Supply Chain | Processing element* | 12 drivers | Fuzzy AHP | [35] |
| 18 | Sustainable Supply Chain | Supply Chain | 13 factors | Hesitant Fuzzy DEMATEL | [54] |
| 19 | Sustainable Supply Chain | Supply Chain | 14 critical factors / 62 sub-factors | SLR | [12] |
| 20 | Sustainable Supply Chain | Supply Chain | 4 critical factors / 20 sub-factors | Factor Analysis | [55] |
| 21 | Resilience Supply Chain | Supply Chain | 15 factors | Data Analysis | [29] |
| 22 | Sustainable Supply Chain | Supply Chain | 15 factors | SLR | [15] |
| 23 | Supply Chain | Supply Chain | 4 factors / 43 sub-factors | SLR | [11] |
| 24 | Supply Chain | Supply Chain | 4 barriers | Cross-case Analysis | [3] |
| 25 | Green Supply Chain | Supply Chain | 5 barriers / 22 sub-barriers | AHP | [56] |
| 26 | Reverse Supply Chain | Supply Chain | 7 drivers / 37 sub-drivers 7 barriers / 36 sub-barriers |
SLR | [16] |
| 27 | Green Supply Chain | Supply Chain | 2 drivers / 10 sub-drivers 2 barriers / 15 sub-barriers |
SLR | [17] |
| 28 | Green Supply Chain | Supply Chain | 19 factors | ISM-MICMAC | [57] |
| 29 | Green Supply Chain | Supply Chain | 26 critical factors | ISM-MICMAC | [58] |
| 30 | Sustainable Supply Chain | Supply Chain | 7 critical factors / 32 sub-factors | ISM-MICMAC | [59] |
| 31 | Green Supply Chain | Input element* | 7 drivers / 26 sub-drivers | Structural Equation Modelling | [31] |
| 32 | Sustainable Supply Chain | Input element* | 7 drivers / 17 sub-drivers | Hierarchical Linear Modelling | [32] |
| 33 | Green Supply Chain | Supply Chain | 8 drivers | ISM-MICMAC | [60] |
| 34 | Green Supply Chain | Input element* | 5 factors / 15 sub-factors | Fuzzy DEMATEL | [61] |
| 35 | Green Supply Chain | Processing element* | 13 drivers | ISM-MICMAC | [36] |
| 36 | Other Supply Chain | Output element* | 8 barriers | Grey DEMATEL | [43] |
| 37 | Sustainable Supply Chain | Supply Chain | 7 factors | GRA | [62] |
| 38 | Green Supply Chain | Supply Chain | 18 barriers | ISM | [63] |
| 39 | Green Supply Chain | Output element* | 13 factors | DEMATEL | [44] |
| 40 | Green Supply Chain | Supply Chain | 5 factors / 28 sub-factors | Factor Analysis | [64] |
| 41 | Green Supply Chain | Supply Chain | 15 barriers | Hierarchical Clustering Analysis | [65] |
| 42 | Green Supply Chain | Supply Chain | 4 critical factors / 25 sub-factors | DEMATEL | [66] |
| 43 | Green Supply Chain | Supply Chain | 10 factors | Fuzzy DEMATEL | [67] |
| 44 | Green Supply Chain | Transport element* | 10 factors | Statistical Analysis | [41] |
| 45 | Green Supply Chain | Supply Chain | 5 drivers / 18 sub-drivers | ANOVA | [68] |
| 46 | Green Supply Chain | Transport element* | 8 drivers | Structural Equation Modelling | [42] |
| 47 | Green Supply Chain | Supply Chain | 3 drivers | Survey | [69] |
| 48 | Sustainable Supply Chain | Input element* | 17 drivers and 16 barriers | Delphi method | [33] |
| 49 | Supply Chain | Supply Chain | 32 drivers | Structural Equation Modelling | [70] |
| 50 | Green Supply Chain | Supply Chain | 26 barriers | ISM-MICMAC | [71] |
| 51 | Green Supply Chain | Supply Chain | 14 barriers | ISM-MICMAC | [72] |
| 52 | Green Supply Chain | Input element* | 10 barriers | ISM-MICMAC | [45] |
| 53 | Sustainable Supply Chain | Supply Chain | 13 barriers | ISM-MICMAC | [73] |
| 54 | Supply Chain | Processing element* | 10 drivers and 4 barriers | — | [37] |
| 55 | Green Supply Chain | Supply Chain | 7 drivers and 10 barriers | Semi-structured interviews | [74] |
| 56 | Sustainable Supply Chain | Supply Chain | 11 drivers | Fuzzy TISM-MICMAC | [75] |
| 57 | Sustainable Supply Chain | Supply Chain | 3 drivers / 11 sub-drivers 2 barriers / 11 sub-barriers |
— | [76] |
| 58 | Green Supply Chain | Supply Chain | 5 barriers / 22 sub-barriers | DEMATEL-Fuzzy EDAS-Fuzzy COPRAS | [77] |
| 59 | Supply Chain | Supply Chain | 14 barriers | Fuzzy TISM-MICMAC | [78] |
| 60 | Close-Loop Supply Chain | Supply Chain | 4 drivers / 21 sub-drivers | Grey DEMATEL | [27] |
| 61 | Close-Loop Supply Chain | Supply Chain | 6 barriers / 35 sub-barriers | Pythagorean Fuzzy AHP-DEMATEL | [28] |
| 62 | Green Supply Chain | Supply Chain | 9 critical factors | Fuzzy DEMATEL | [79] |
| 63 | Green Supply Chain | Output element* | 25 critical factors | Factor Analysis | [46] |
| 64 | Other Supply Chain | Supply Chain | 6 factors | GRA | [80] |
| 65 | Supply Chain | Supply Chain | 6 factors / 13 sub-factors | AHP | [81] |
| 66 | Supply Chain | Supply Chain | 2 factors / 10 sub-factors | — | [24] |
| 67 | Other Supply Chain | Transport element* | 7 critical factors | — | [21] |
| 68 | Sustainable Supply Chain | Supply Chain | 15 factors | ISM-MICMAC | [18] |
| 69 | Sustainable Supply Chain | Supply Chain | 7 drivers and 6 barriers | AHP-TOPSIS, AHP-COPRAS | [82] |
| 70 | Green Supply Chain | Input element* | 11 factors | SWARA-TOPSIS | [83] |
| 71 | Green Supply Chain | Supply Chain | 3 critical factors / 12 sub-factors | DEMATEL | [84] |
| 72 | Green Supply Chain | Supply Chain | 12 factors | ISM-MICMAC | [85] |
| 73 | Green Supply Chain | Input element* | 5 factors / 17 sub-factors | ANP-TOPSIS | [86] |
| 74 | Green Supply Chain | Supply Chain | 5 drivers | SEM | [87] |
| 75 | Other Supply Chain | Supply Chain | 3 factors / 8 sub-factors | ANP-AHP-BOCR | [25] |
| 76 | Green Supply Chain | Processing element* | 5 factors / 21 sub-factors | Confirmatory factor analysis | [88] |
| 77 | Sustainable Supply Chain | Processing element* | 4 factors / 14 sub-factors | Factor Analysis | [38] |
| 78 | Supply Chain | Processing element* | 3 barriers / 15 sub-barriers | Grey DEMATEL | [39] |
| 79 | Supply Chain | Cumulative element* | 15 factors | ISM-MICMAC | [40] |
| 80 | Other Supply Chain | Transport element* | 8 factors | — | [89] |
| 81 | Green Supply Chain | Supply Chain | 5 drivers / 17 sub-drivers | Fuzzy DEMATEL-Fuzzy ANP-Fuzzy TOPSIS | [90] |
| 82 | Green Supply Chain | Supply Chain | 3 barriers / 13 sub-barriers | AHP-ELECTRE I | [91] |
| 83 | Sustainable Supply Chain | Input element* | 3 factors / 10 sub-factors | DEMATEL | [92] |
| 84 | Green Supply Chain | Input element* | 5 factors / 21 sub-factors | AHP | [34] |
| 85 | Green Supply Chain | Input element* | 15 factors | Fuzzy DEMATEL | [26] |
| 86 | Supply Chain | Supply Chain | 10 factors | Grey system theory | [1] |
| 87 | Sustainable Supply Chain | Supply Chain | 22 drivers and 19 barriers | SLR | [5] |
| 88 | Green Supply Chain | Supply Chain | 2 drivers / 6 sub-drivers | — | [7] |
| 89 | Green Supply Chain | Supply Chain | 7 factors / 47 sub-factors | Factor Analysis | [93] |
* The authors identified the elements of the supply chain based on a structural-functional approach. A detailed description of the structural elements of the supply chain and their functions is presented in [94] and section 3.1 of this paper. ** AHP – Analytic Hierarchy Process; ANOVA – Analysis of Variance; ANP – Analytic Network Process; BOCR – Benefit, Opportunity, Cost, and Risk; COPRAS – Complex Proportional Assessment; DEMATEL – DEcision MAking Trial and Evaluation Laboratory; EDAS – Evaluation based on Distance from Average Solution; ELECTRE – ELimination and Choice Expressing the Reality; FQFD – Fuzzy Quality Function Deployment; GRA – Grey Relation Analysis; ISM – Interpretive Structural Modeling; MICMAC – Matriced Impacts Cruoses Multiplication Applique a un Classement techniques; SWARA – Stepwise Weight Assessment Ratio Analysis; SLR – Sytematic literature review; TISM – Total Interpretive Structural Modelling; TOPSIS – Technique for the Order of Preference by Similarity to Ideal Solution; SEM – Structural Equation Modelling.
Thus, the analysis of scientific works in the field of supply chain sustainability assessment allows us to draw the following general conclusions.
1. There is an increase in the number of scientific publications devoted to sustainable and green supply chain management, including works related to the identification of factors, drivers, and barriers of SSCM. At the same time, there is a discrepancy in the terminology used. The authors use different concepts — “factors”, “critical factors”, “critical success factors”, “drivers and barriers” to identify the causes that affect the sustainability of supply chains. This variety of concepts makes it difficult to understand and systematize the causes of supply chain sustainability. Moreover, there is a frequent duplication of the same reasons with different names, which, as a consequence, complicates the assessment of supply chain sustainability.
2. We were unable to find generally accepted systems of factors and indicators for assessing the impact of these factors on SSCM. Researchers use different factors and indicators for assessing these factors, depending on the type of supply chain, the elements under study or the tasks to be solved. In most cases, two grouping types of sustainability factors are used. The first one-level type contains only factors. In the second type, a second additional level of sub-factors is introduced. In one-level grouping, the number of factors ranges from 3 to 41 (average 13). The number of factor groups ranges from 2 to 14 (average 5) in the two-level grouping, and the number of sub-factors in the groups ranges from 6 to 73 (average 24).
3. We have identified a wide variety of supply chain sustainability factors. Many authors note the complexity of collecting input data for their assessment. This explains the researchers' wide use of multi-criteria analysis methods, expert methods, including those based on the provisions of fuzzy set theory, gray systems theory and similar. The most frequently used methods are Interpretive Structural Modeling and MICMAC approach (20% of the total number of methods used), Factor Analysis (about 10%), DEMATEL and Fuzzy DEMATEL (respectively 9% and 7%), AHP (about 6%) and others (see Table 1). The use of Crisp prevails in the studies (74% of the total number of papers analyzed). The statements of Fuzzy Set Theory and Gray System Theory are found in 18% and 8% of the analyzed papers, respectively.
4. The disadvantage of most of the approaches used by researchers is the lack of a systematic approach to assessing the sustainability of all elements and processes in supply chains in interconnection. The most frequent objects of assessment are individual elements of the supply chain and their functions — “sustainable supply (input element)” and “sustainable production (processing element)” (11% and 8%, respectively). The least number of studies falls on “sustainable warehousing (cumulative element)”.
3. Methodology for Assessing Sustainable Supply Chain Drivers
The proposed methodology for assessment of sustainable supply chain (SSC) drivers includes methods for describing the structure and functions of SSC, a system of SSC drivers, and a substantiated system of SSC assessment criteria. This methodology formed the basis of the driver assessment and ranking framework.
3.1. Sustainable Supply Chain Structure and Functions
The structural elements of the supply chain and their functions are identified in accordance with the concept proposed in [94]. The supply chain is considered as a fragment of the global logistics system and is linearly ordered along the logistics flows, a set of logistics elements. The specification of logistics elements is based on the idea of functional isolation of an element and the limitation of its decomposition within a certain management task. In addition, the specificity of the element is determined by a set of certain functions, the fulfillment of which ensures the achievement of both its local goal and the goal for the entire logistics system. In [94] the following supply chain elements are identified: input, processing, cumulative, transport, output, and control elements.
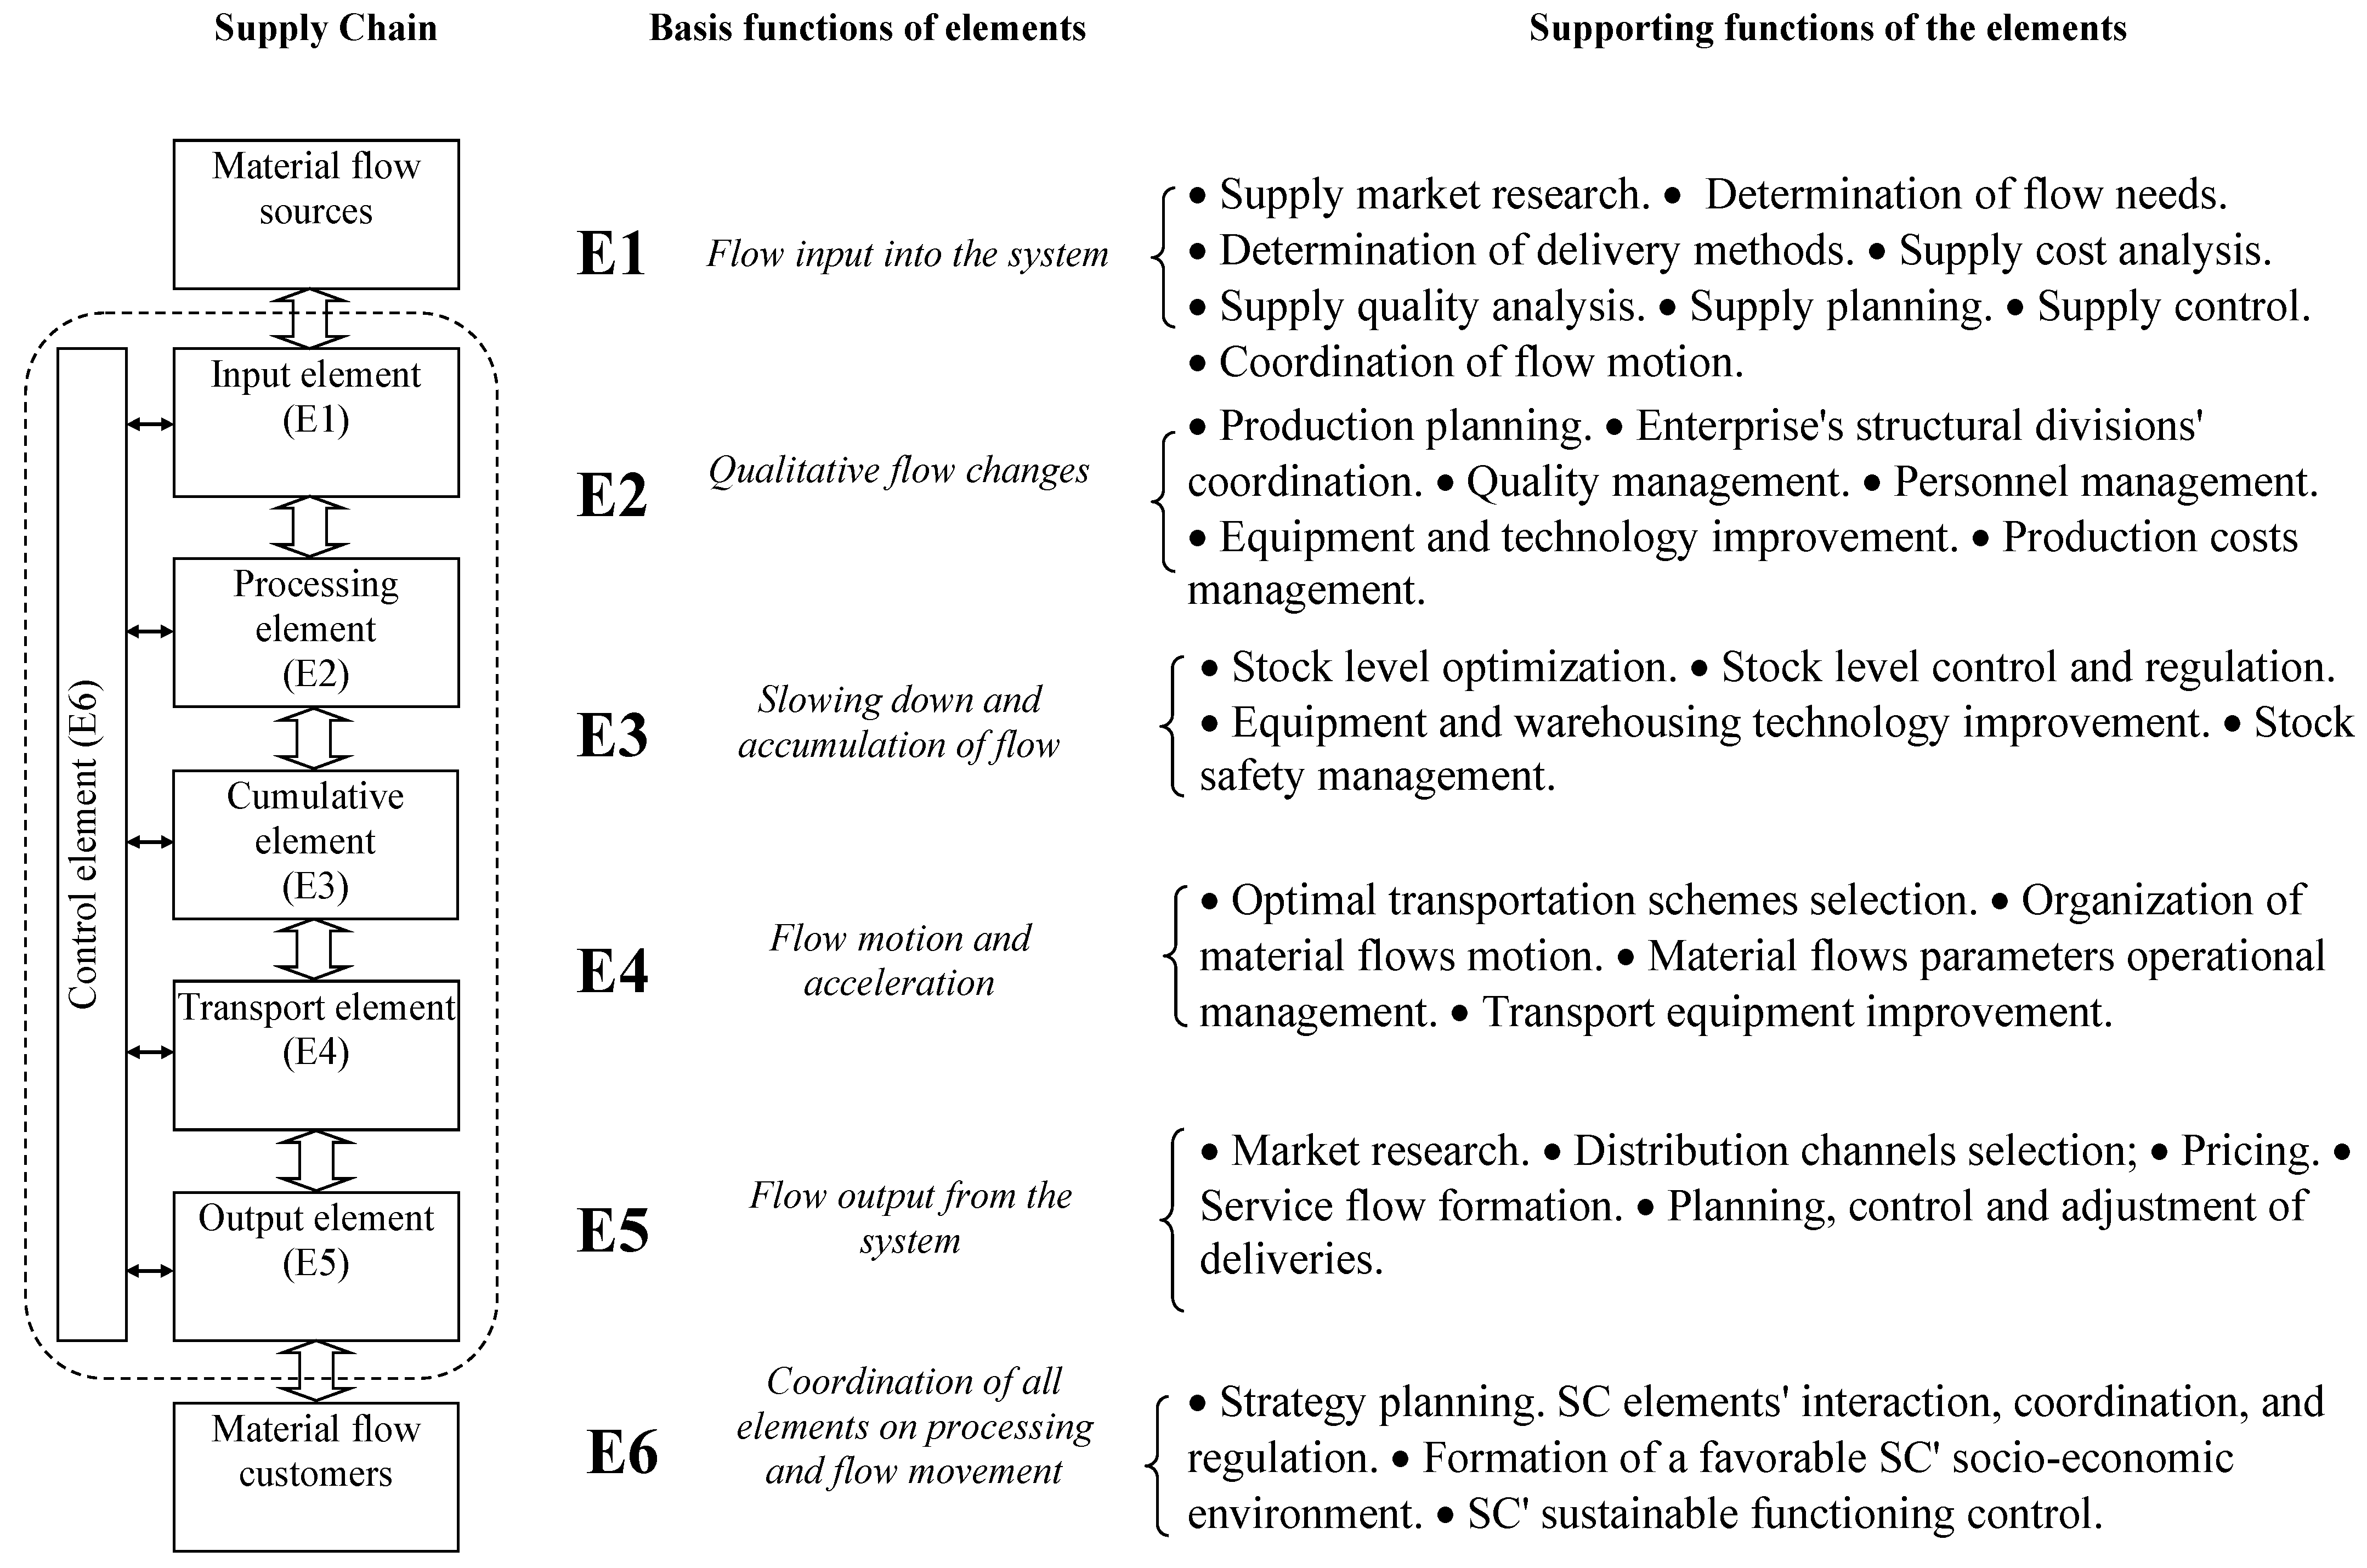
Each element of the supply chain (SC) performs the following basic functions to influence logistics flows (Fig. 2):
- Input element (E1) the entry of material flows into the system, i.e., the purchase of necessary raw materials, supplies, or services.
- Processing element (E2) changes the qualitative properties of material flows, their transformation from raw materials into finished products.
- Cumulative element (E3) regulation of the speed of material flows as a result of their inhibition, accumulation, and storage.
- Transport element (E4) acceleration and movement of material flows.
- Output element (E5) withdrawal of material flow from the system, marketing, and distribution of finished products and services.
- Control element (E6) providing information and financial connection between other LS elements, controlling their functions and operations, regulating the promotion of information and financial flows in the SC.
The basis functions are logistic elements' generalized functions. The realization of basis functions is achieved by performing specific supporting functions accordingly [95,96,97].
Figure 2.
Supply chain structure and functions.
The presented structural-functional approach to describing the logistics system is fundamentally different from the common way of identifying functional areas of logistics, such as transportation, sales, production, supply, and warehousing logistics. The disadvantage of this traditional functional approach is the “binding” of logistics functions and operations to infrastructural elements of logistics chains — warehouses, industrial enterprises, supply and sales departments, transportation. As a result, one and the same method of logistics flow management can be realized in different functional areas of logistics [98]. For example, the same “green” solutions are implemented using different methodological frameworks, regulated by different, often contradictory, regulatory and legal rules [94].
SC sustainability is achieved as a result of orientation of each of its elements to the overall objectives of the logistics system — economic, technological, social and environmental. Effective coordination of SC elements requires systematization and research of SC sustainability factors (drivers). Assessment of the impact of these factors (drivers) on SC elements is necessary for making decisions to achieve the goals of the concept of sustainable development in relation to supply chains.
3.2. Sustainable Supply Chain Driver System
Supply Chain Sustainability Drivers are a causes, resources, and actions that have a meaningful impact on accelerating the process of supply chain sustainability. Table 2 presents the results of the systematization of sustainability SC drivers. As the main feature of systematization, we used the supporting functions of the SC elements.
Table 2.
Sustainable supply chain driver system.
| Supply chain elements | Sustainable supply chain drivers | References |
|---|---|---|
| Input element | D1.1 – Environmentally friendly raw materials (at supplier) | [19,31,43,50,55,56,59,60,61,64,66,67,68,69,72,77] |
| D1.2 – Raw materials able to reuse or recycle | [12,16,19,27,31,33,44,46,49,56,64] | |
| D1.3 – Raw materials procurement system | [30,31,36,50,52,53,57,59,60,64,66,67,81] | |
| D1.4 – Eco-friendly suppliers | [4,10,11,17,22,28,32,33,42,47,48,49,50,55,57,58,60,61,63,64,66,67,68,72,75,76,77] | |
| D1.5 – Delivery distance of raw materials | [31,32,64] | |
| D1.6 – Type of packaging for raw materials | [10,16,36,46,52,53,60,61,64,68,73] | |
| D1.7 – Raw material eco-labeling | [16,46,59] | |
| D1.8 – E-commerce with supplier | [62,75] | |
| Processing element | D2.1 – Eco-friendly raw materials from the manufacturer | [10,12,19,43,51,56,59,60,64,66,68,69,72,77] |
| D2.2 – Reusable or recyclable raw materials | [16,27,44,46,56,64,77] | |
| D2.3 – Eco-friendly equipment | [9,19,33,44,51,59,64,69] | |
| D2.4 – Energy and resource saving technologies | [4,22,33,35,36,44,47,49,69,72] | |
| D2.5 – Eco-friendly production technologies | [4,9,19,22,33,35,36,44,47,51,56,57,58,61,63,64,65,69,70,71,72,73,77,78,81] | |
| D2.6 – Environmental protection systems | [20,32,35,51,61,64] | |
| D2.7 – Industrial waste | [10,12,16,20,28,30,31,36,41,44,50,52,58,64,66,67,72,73,77] | |
| D2.8 – Labor conditions | [51,55,58,59] | |
| D2.9 – Eco-learning | [4,9,12,16,19,23,28,30,31,32,36,47,48,54,56,57,58,59,62,64,65,72,73,74,77,78,79,81] | |
| Transport element | D3.1 – Transport type | [19,51,61,69,81] |
| D3.2 – Transport links type | [51] | |
| D3.3 – Route of transportation | [64] | |
| D3.4 – Cargo flow structure | [81] | |
| D3.5 – Frequency and size of shipments | [31,36,50,52,53,57,59,60,81] | |
| D3.6 – Compliance of transportation vehicles with legal regulations | [19,35,44,51,61,64,69] | |
| D3.7 – Fuel type | [51,64] | |
| D3.8 – Technical condition of vehicle fleet | [64] | |
| D3.9 – Vehicle type and model | [61,64] | |
| D3.10 – Vehicles loading degree | [64] | |
| D3.11 – Equipment of rolling stock with navigation and telecommunication systems | [11] | |
| D3.12 – Eco-driving | [41,89] | |
| Cumulative element | D4.1 – Eco raw materials and materials for warehouse construction | [72] |
| D4.2 – Warehouse type | [40,83,86] | |
| D4.3 – Spatial organization of warehouse facilities | [44] | |
| D4.4 – Energy-saving technologies | [4,22,33,36,44,47,49,69,72,73] | |
| D4.5 – Environment protection systems | [20,35,61,64] | |
| D4.6 – Eco-friendly loading and unloading equipment | [19,35,44,64] | |
| D4.7 – Mechanization and automation of loading and unloading operations | [15,29,44] | |
| D4.8 – Inventory management system | [8,10,32] | |
| D4.9 – Placement and storage of products and waste | [10,12,16,20,36,44,47,50,52,53,58,66,72] | |
| D4.10 – Type of packaging for products | [36,46,52,53,61,64,68,73] | |
| D4.11 – Labor conditions | [19,59] | |
| Output element | D5.1 – Eco-marketing | [4,16,20,22,27,28,30,33,35,36,41,43,46,47,48,49,58,59,63,64,65,67,68,69,72,75,76,77,81] |
| D5.2 – Eco-friendly sales channels | [11,12,16,17,22,27,33,46,48,50,51,55,57,58,59,64,72,75,76] | |
| D5.3 – Tare and packaging return system | [10,16,27,36,50,60,61,64] | |
| D5.4 – Type of packaging for products | [10,16,36,46,52,53,61,64,68,73] | |
| D5.5 – Eco-labeling of products | [15,29,46,58,59,60] | |
| D5.6 – E-commerce with consumer | [62,75] | |
| Control element | D6.1 – Environment strategy | [4,9,11,12,16,19,20,22,23,27,28,30,31,32,33,35,36,41,42,46,47,48,49,50,52,53,55,56,57,58,61,63,65,66,68,70,71,73,74,75,76,77,78,79,80,81] |
| D6.2 – Environmental audit | [16,20,22,36,48,50,59,66] | |
| D6.3 – Corporate Information Systems | [9,11,12,15,16,17,23,29,31,33,43,47,50,54,56,59,62,63,65,66,70,71,74,75,76,79,80,81] | |
| D6.4 – Information and communication technologies | [3,8,10,11,15,23,27,29,30,33,35,42,46,50,57,58,59,62,63,66,70,71,72,73,75,76,78,79,80,81] | |
| D6.5 – Intelligent Transportation Systems | [21,83,89] | |
| D6.6 – Corporate social responsibility | [3,4,9,12,15,17,19,20,22,23,28,29,32,35,36,41,46,47,50,51,52,53,54,55,56,58,59,63,64,65,66,72,74,76,78,79] | |
| D6.7 – Return and reverse flow management systems | [4,10,16,27,28,36,46,47,49,52,53,56,60,61,65,73,77] | |
| D6.8 – Recycling processes for waste, packaging, finished products | [10,12,16,20,22,27,28,30,31,41,44,46,47,50,52,53,58,61,64,66,67,68,69,72,77] |
3.3. Sustainable supply Chain Drivers’ Assessment Criteria System
It is proposed to evaluate SSC drivers using a two-level system of criteria developed by the authors [99]. The system of criteria is based on the systematization of research and practice of using different indicators for assessing logistics flows and individual elements of supply chains for compliance with the goals and principles of sustainable development. The main distinguishing feature of the proposed system is the comprehensiveness of the assessment of all logistics flows and SSC elements for compliance with the concept of sustainable development. The system includes five groups of criteria of the first level and fifteen sub-criteria of the second level (Table 2).
Table 3.
Sustainable supply chain drivers assessment criteria system [99].
Table 3.
Sustainable supply chain drivers assessment criteria system [99].
| Criteria | Characteristic | Sub-criteria | Characteristic |
|---|---|---|---|
| Economic criteria (С1) | The efficiency of using all types of resources in the SSC | Profit (C1.1) | Difference between total revenue and operating costs |
| Operating expenses (C1.2) | The sum of all costs associated with converting investments into profits | ||
| Fixed investment (C1.3) | Cash flow for the formation of fixed assets | ||
| Energy-ecological criteria (С2) | The efficiency of energy use during the movement of logistics flows and their impact on the environment | The energy intensity (C2.1) | The amount of energy spent on the movement of the logistics flow |
| Greenhouse gas emissions of CO2 (C2.2) | The total volume of greenhouse gas emissions from all sources involved in the movement of the logistics flow | ||
| Quality criteria (С3) | The safety and timeliness of movement and processing of logistics flows, as well as the quality of their management | Safety of cargo transportation (C3.1) | Comprehensive indicator of the material flow movement without damage, pollution, and loss |
| Timeliness of cargo transportation (C3.2) | Comprehensive indicator of the material flow movement by the appointed date, regularly, or at the required speed | ||
| The coefficient of flow controllability (C3.3) | The ratio of the number of information messages on compliance with the indicators of safety and timeliness of transportation to the total number of management decisions | ||
| Statistical criteria (С4) | The patterns of change in the controlled sub-criteria of logistics flows | The coefficient of flows irregularity (C4.1) | Deviation of the logistics flows physical parameters of from their average values |
| The coefficient of complexity structure of flow (C4.2) | The number of streams within the logistic flow | ||
| The coefficient of flows discreteness (C.4.3) | The number of elements of the logistic flow in the stream | ||
| The coefficient of differentiability of flow (C4.4) | Changing the structure of the logistics flow (number of streams) in the process of movement | ||
| Flow’s physical criteria (С5) | The intensity of logistics flows and their spatio-temporal changes | The mass (quantity) of flow (C5.1) | The total number of elements in the logistics flow |
| The speed of flow (C5.2) | The speed of movement of the logistics flow elements | ||
| The length of the route (C5.3) | Distance traveled by a logistic flow element while moving along a route |
3.4. A Framework for Sustainable Supply Chain Drivers’ Multi-Criteria Assessment
The two-level criteria system presented in the previous section is proposed to be used to evaluate SSC drivers by multi-criteria methods. The flow chart of the developed assessment framework is presented in Fig. 3. This framework is universal and can be applied both for evaluating the set of drivers identified by the authors and for any other combination of drivers. The combination of drivers depends on the structure of a particular SSC as well as the specific elements that comprise it.
Figure 3.
A framework for sustainable supply chain drivers’ multi-criteria assessment.
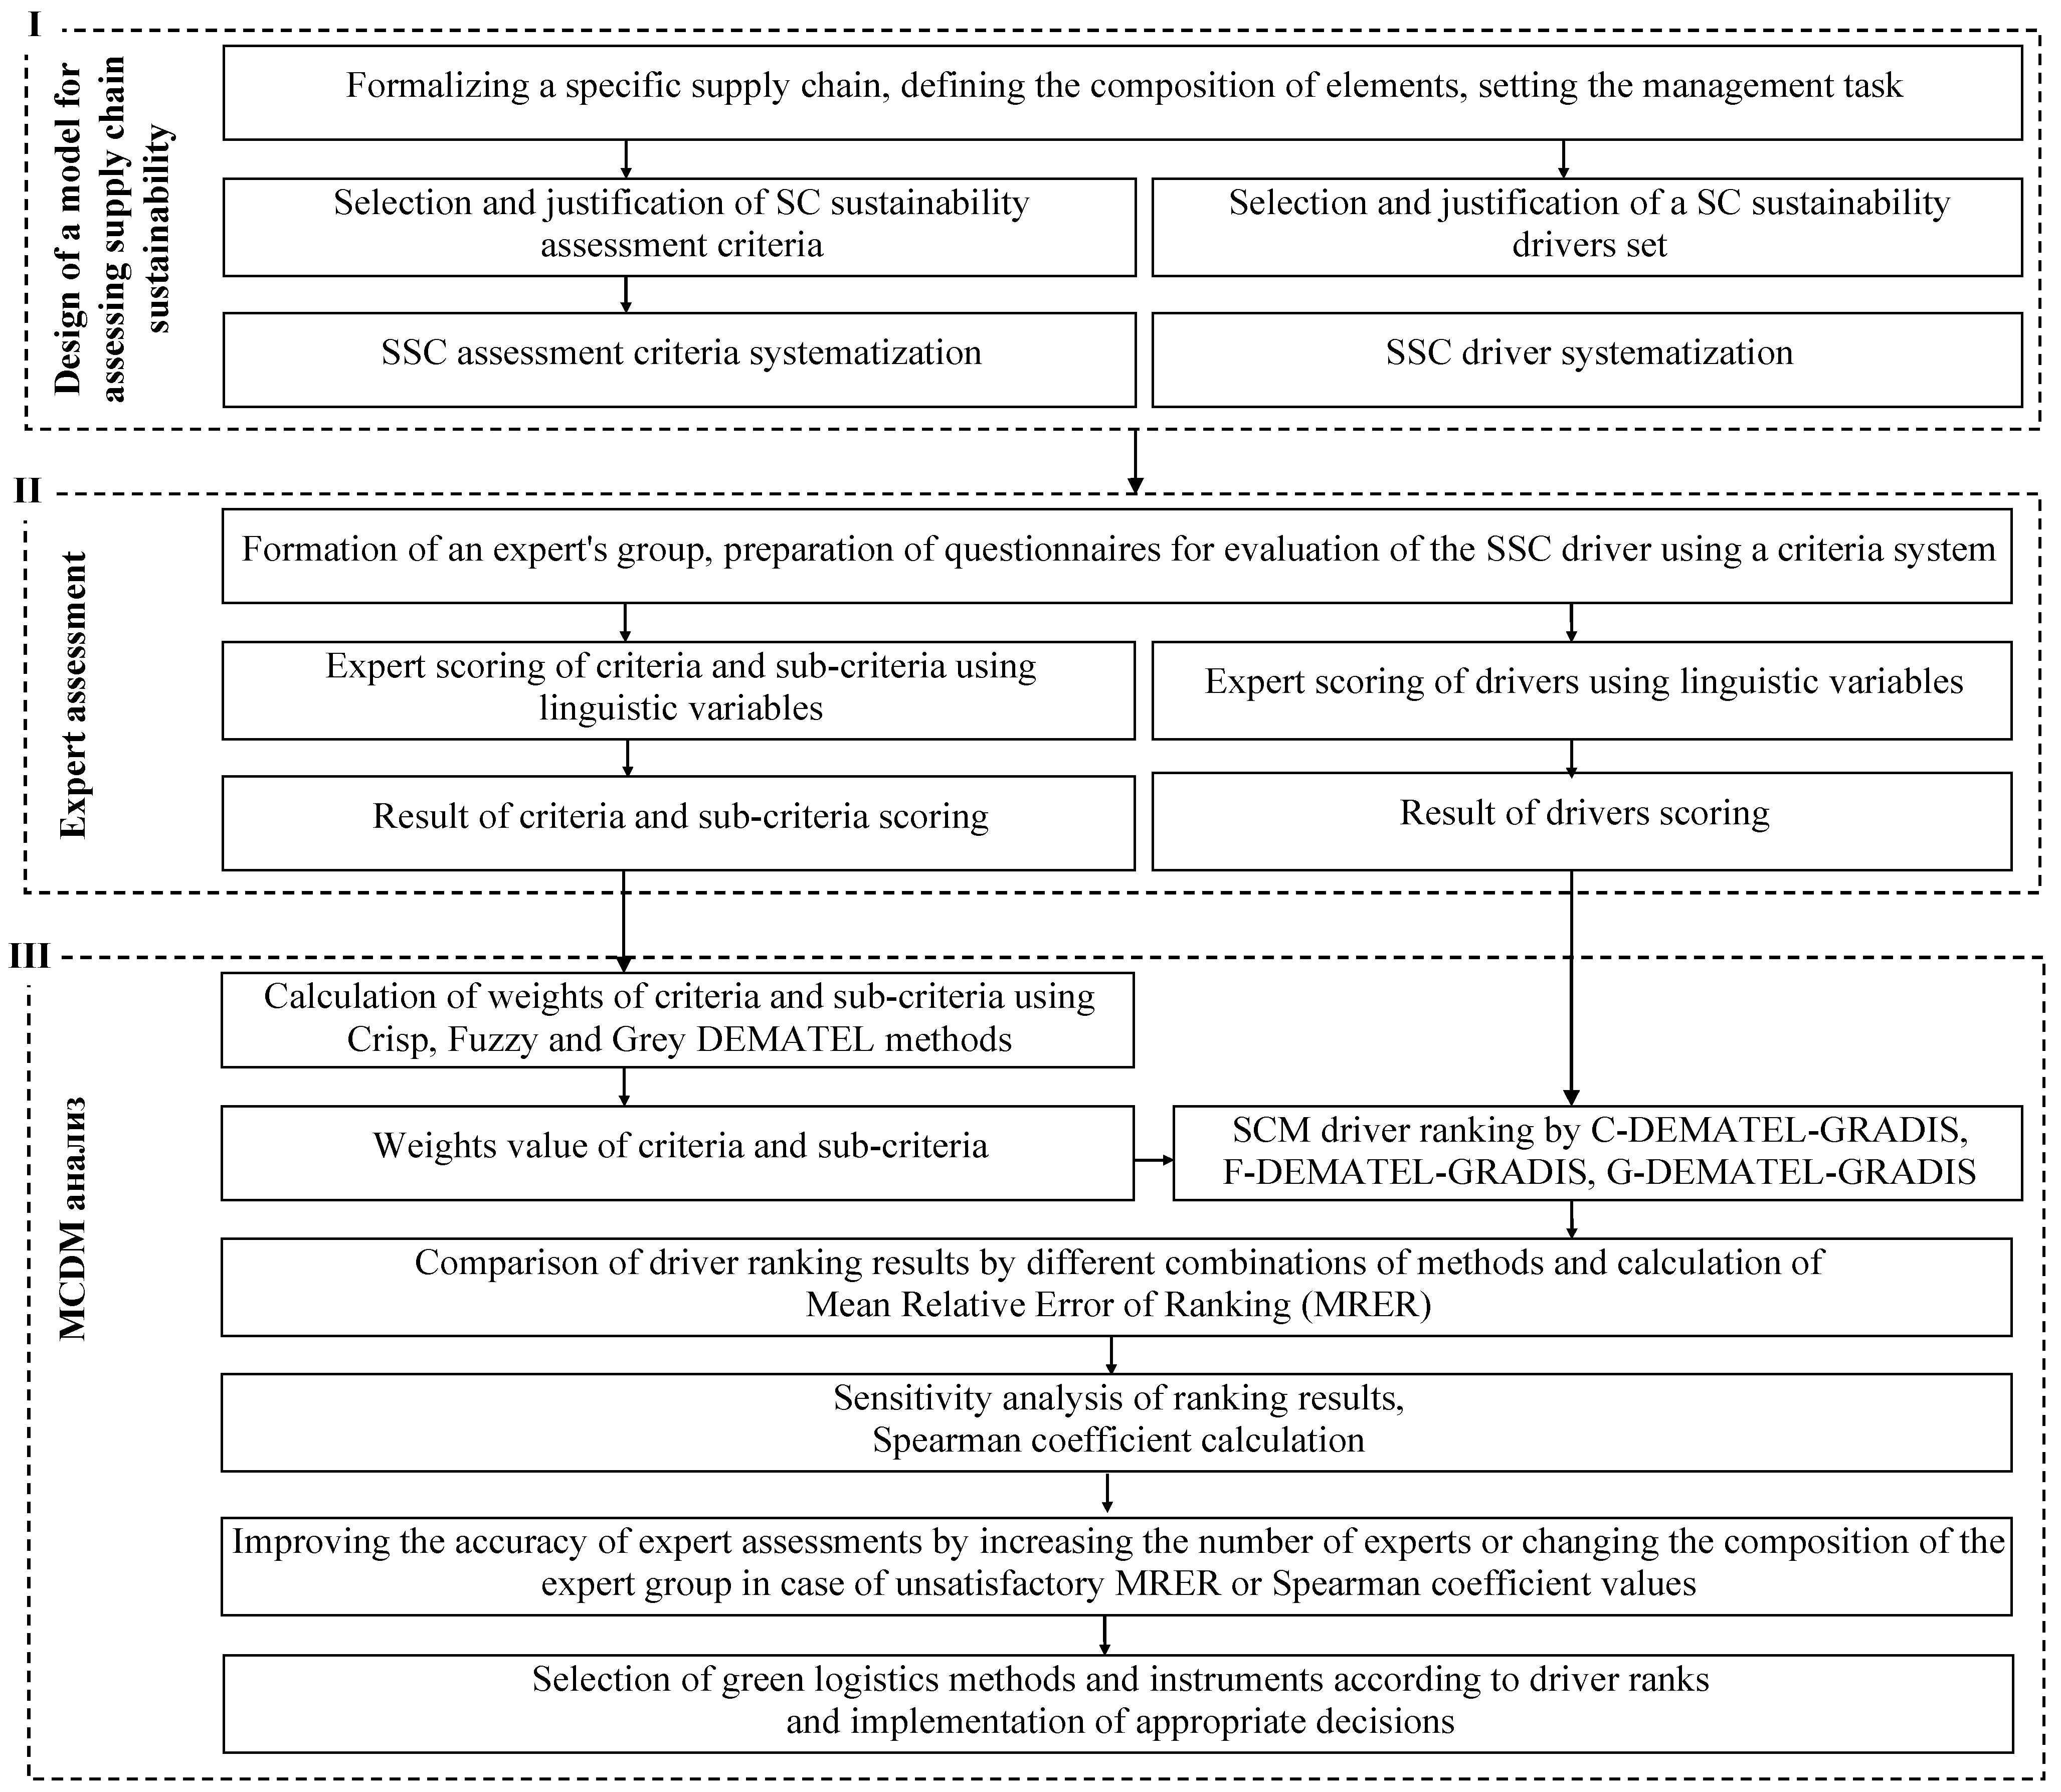
Stage I. A specific supply chain is formalized as a model consisting of certain logistic elements. The boundaries of the supply chain are defined. Management objectives for achieving sustainability goals are selected. The supply chain structure [94] and management objectives determine the composition of indicators (criteria) [99] for assessing and selecting SSC drivers (alternatives). Scientific literature and best practices of implementing green principles and technologies are sources of information for justification and systematization of SSC drivers and criteria for their evaluation. Supporting functions of SC elements [98] are recommended to be used as the main feature of systematization. The system of driver evaluation criteria should meet the requirements of comprehensiveness of logistics flows assessment and consistency of logistics flows [99].
We recommend using the criteria and drivers’ systems presented in Sections 3.2 and 3.3 to be considered as the most comprehensive and universal systems. Systems with a smaller number of criteria and drivers can be used for supply chains with fewer logistics elements or sustainability objectives.
Stage II. Expert scoring of the identified criteria, sub-criteria and drivers. Expert assessment is performed using a standardized methodology. The methodology of expert scoring includes the formation of an expert group of at least five people, development of questionnaires, filling out questionnaires and verification of the data obtained. It is recommended to use simple linguistic variables (Table 4) for scoring. The obtained scores are the initial data for ranking the criteria and sub-criteria at the next stage of the framework.
Stage III. Ranking of criteria, sub-criteria and drivers. The weight of criteria and sub-criteria is calculated using the DEMATEL method. Our research has shown that the accuracy of the ranking results depends on the composition and size of the expert group. Therefore, we recommend using different scales to assess the importance of criteria and sub-criteria and then comparing the results obtained. Crisp, Fuzzy and Grey number scales are used in the present study. The correspondence of these scales to the experts' linguistic scores is presented in Table 4.
The scores obtained using the three scales are used to rank the criteria and sub-criteria using the C-DEMATEL, F-DEMATEL and G-DEMATEL methods, respectively. DEcision MAking Trial and Evaluation Laboratory (DEMATEL) [100] allows establishing direct and inverse relationships between criteria, and to visualize these causal relationships in the form of a map of network relationships. DEMATEL is used to assess the strength of influence of criteria on each other. The combination of DEMATEL with fuzzy set theory and gray systems' theory provides decision-making considering uncertain, ambiguous or incomplete information and thus provides more reliable analysis and evaluation results. The main steps of DEMATEL using Crisp, Fuzzy and Grey are presented in Table 5.
The three versions of the criteria and sub-criteria scores are further used to rank the drivers in combination with the CRADIS method – Compromise Ranking of Alternatives from Distance to Ideal Solution [101]. CRADIS allows you to calculate the deviations of alternatives from ideal and anti-ideal solutions. The CRADIS method is not a new method, but it is a new approach to combining known MCDMs: ARAS (Additive Ratio ASsessment), MARCOS (Measurement of Alternatives and Ranking according to Compromise Solution), and TOPSIS (Technique for the Order of Preference by Similarity to Ideal Solution) methods.
The calculations using CRADIS are performed in the following steps.
Step III.6. Formation of an initial decision-making matrix consisting of a set of n criteria and m alternatives
where xmn – assessment of i-th alternative, i=1, 2,…,m according to the j-th criterion, j=1,2,…,n.
Step III.7. Normalization of the initial decision matrix X using the following formulas
where C – cost criteria, B – benefit criteria.
Step III.8. Calculation of the weighted matrix V by multiplying the values of the normalized matrix elements nij by the corresponding weight coefficients wj of the criteria
Step III.9. Calculation of ideal and anti-ideal solutions. Ideal solutions ti are the largest values of vij in the weighted matrix of solutions, and anti-ideal solutions tai, respectively, are the smallest values
Step III.10. Calculation of deviations from ideal and anti-ideal solutions
Step III.11. Calculation of the degree of deviation of alternatives from ideal and anti-ideal solutions
Step III.11. Calculation of the utility functions for each alternative regarding deviations from the optimal alternatives
where – optimal alternative with the smallest distance from the ideal solution, i.e. , – optimal alternative, as far as possible from the anti-ideal solution, i.e. .
Step III.12. Calculation of average values of utility functions for alternatives Qi and ranking of alternatives according to their values
The best alternative is the alternative with the maximum value of the utility function Qi.
Stage IV. Quality assessment of ranking results and development of management decisions. The value of the Mean Relative Error of the Ranking results (MRER) of drivers obtained by different methods is proposed to be generally calculated by the following formula
where Ril – rank of the i-th alternative, calculated by the l-th method, M – number of alternatives, L – number of ranking methods, L ≥ 3.
Finally, the sensitivity of the obtained results is assessed by ranking the alternatives by different MCDMs and then calculating the Spearman coefficient. If the MRER or Spearman coefficient values exceed the acceptable values, it is necessary to increase the size of the expert group or change its composition.
The resulting SSC driver ranks are used to develop and justify decisions on the implementation of green logistics methods and instruments [96].
4. Numerical Example
An example of driver ranking for all elements of the supply chain is presented in this section. The supply chain model under study is presented in Section 3.1. The SSC driver system for this model is described in Section 3.2 (Table 2) and contains 54 alternatives. The drivers were ranked using a criteria system containing 15 attributes (Section 3.3, Table 3).
In the second stage of the framework for ranking the identified drivers (Figure 3), we formed a panel of five experts (Table 6).
Initially, the experts performed an assessment of the importance of criteria and sub-criteria of logistic flows in SSC. The linguistic scale presented in Table 4 was used for the assessment. Then the experts assessed the impact of drivers on criteria and sub-criteria on a five-point scale: 1 — very low, 2 — low, 3 — medium, 4 — high, 5 — very high. The results of expert assessments are presented in Table 7 and Table 8.
Total matrices of links between criteria and network relationship maps obtained as a result of DEMATEL method calculation are presented in Figure 4. The shaded cells in the tables show the presence of significant relationships between the criteria. Significant are the relationships whose value is higher than the threshold values set by the experts: αCrisp=0,755, αFuzzy=0,373 and αGrey=0,345. The threshold value is calculated as the average of all estimates of the total direct linkage matrix T. Criteria C1, C3 and C5 are assigned to the “cause” group and C2 and C4 to the “effect” group in all models according to the values of (Di – Ri).
Similar calculations are performed for the evaluation of sub-criteria. Maps of network relations of sub-criteria are presented in Figure 5.
Criteria and sub-criteria are ranked according to the value of weighting coefficients, which are calculated based on the results of assessing the number of relationships (Di + Ri) and the strength of influence (Di – Ri) between criteria or sub-criteria (Table 9).
The obtained criterion and sub-criteria ranks are used to evaluate the SSC drivers using the CRADIS method. The results of SCC driver ranking using the three models C-DEMATEL-CRADIS, F-DEMATEL-CRADIS and G-DEMATEL-CRADIS are presented in Table 10 and Figure 6.
The three most significant SSC drivers are D6.3 “Corporate Information Systems” (rank #1), D6.5 “Intelligent Transportation Systems” (rank #2), and D3.8 “Technical condition of vehicle fleet” (rank #3). The three least significant drivers are D1.1 “Environmentally friendly raw materials (at supplier)” (rank #54), D2.2 “Reusable or recyclable raw materials” (rank #53), and D6.8 “Recycling processes for waste, packaging, finished products” (rank #52).
The ranking of SCC drivers separately for each element of the supply chain allowed to establish the most important (rank #1) drivers of each element: D1.8 “E-commerce with supplier” (Input element), D2.3 “Eco-friendly equipment” (Processing element), D3.8 “Technical condition of vehicle fleet” (Transport element), D4.3 “Spatial organization of warehouse facilities” (Cumulative element), D5.6 “E-commerce with consumer” (Output element), D6.3 “Corporate Information Systems” (Control element).
The following drivers have the least impact: D1.1 “Environmentally friendly raw materials (at supplier)” (Input element, rank #8), D2.2 “Reusable or recyclable raw materials” (Processing element, rank #9), D3.6 “Compliance of transportation vehicles with legal regulations” (Transport element, rank #12), D4.9 “Placement and storage of products and waste” (Cumulative element, rank #11), D5.3 “Tare and packaging return system” (Output element, rank #6), D6.8 “Recycling processes for waste, packaging, finished products” (Control element, rank #8).
The results of the SSC drivers’ ranking for each supply chain element are presented in Fig. 7.
The evaluation of the quality of ranking by the three methods using MRER (17) showed a satisfactory result, MRER = 188/54×3 = 1.16. That is, the average difference between the ranks calculated by different methods is close to one.
Sensitivity analysis of the ranking results was performed by comparing the results of CRADIS, with the results of three other multi-criteria methods. We chose for comparison the methods TOPSIS (Technique for the Order of Preference by Similarity to Ideal Solution) [102], ARAS (Additive Ratio Assessment) [103], MARCOS (Measurement of Alternatives and Ranking according to COmpromise Solution) [104]. Table 11 and Figure 8 show the results of the comparison.
Spearman rank correlation coefficient calculation showed a high correlation between the ranking results of different MCDM methods. The average correlation coefficient was for all models 0.966, for Crisp models – 0.9679, for Fuzzy models – 0.9647, and for Grey models – 0.9658 (Table 12).
5. Conclusions
The paper presents a framework for assessing and ranking the drivers of sustainable supply chain development. The peculiarities of the framework are the use of a universal supply chain model, which includes structural elements that realize all known functional areas of logistics. An original two-level system of criteria and sub-criteria for evaluating logistics flows is used as assessing criteria. It is shown how the use of these criteria allows the evaluation of supply chain sustainability drivers. Fifty-four sustainability drivers are identified based on a literature review of logistics research and supply chain management practices. The assessment and ranking of the drivers is proposed to be performed using a combination of DEMATEL and CRADIS multi-criteria methods.
The three most significant SSC drivers are identified. These drivers are “Corporate Information Systems”, “Intelligent Transportation Systems”, and “Technical condition of vehicle fleet”. The three least significant drivers are “Environmentally friendly raw materials (at supplier)”, “Reusable or recyclable raw materials”, and “Recycling processes for waste, packaging, finished products”. Similar ranking is performed for each structural element of the studied supply chain model.
An example of using the ranked drivers to select sustainable development methods and instruments is shown. Thus, it is proposed to consider the identified drivers and the framework for their selection as a universal basis for justification and implementation of management decisions on coordinated supply chain sustainability. The limitation of the study is the assumption of coordination by the managing element of the supply chain of the functioning of its participants for the realization of sustainability goals. The proposed framework and the approach used generally do not sufficiently account for supply chain actors' competition and conflicting economic objectives. Future research will be aimed at improving the framework, supply chain model, systems of sustainability criteria and drivers for the conditions of competitive environment and justification of dynamic equilibrium of supply chain participants' interests.
Author Contributions
Conceptualization, A.R. and N.O.; methodology, A.R. and N.O.; software, N.O.; validation, N.O. and A.R.; formal analysis, N.O.; investigation, N.O.; resources, A.R.; data curation, N.O.; writing—original draft preparation, N.O.; writing—review and editing, A.R.; visualization, N.O.; supervision, A.R.; project administration, N.O.; funding acquisition, N.O. and A.R. All authors have read and agreed to the published version of the manuscript.
Funding
The work was carried out with the financial support of the Russian Science Foundation No. 23-21-10038, https://rscf.ru/en/project/23-21-10038/ (accessed on 24 November 2024).
Data Availability Statement
Data is contained within the article.
Acknowledgments
Thanks in advance to the anonymous reviewers for their help with the article.
Conflicts of Interest
The authors declare no conflicts of interest.
References
- Alfaro-Saiz, J.-J.; Bas, M.C.; Giner-Bosch, V.; Rodríguez-Rodríguez, R.; Verdecho, M.-J. An evaluation of the environmental factors for supply chain strategy decisions using grey systems and composite indicators. Applied Mathematical Modelling 2020, 79, 490–505. [CrossRef]
- Guterres, A. Carbon neutrality by 2050: the world’s most urgent mission. Available online: https://www.un.org/sg/en/content/sg/articles/2020-12-11/carbon-neutrality-2050-the-world%E2%80%99s-most-urgent-mission (accessed on 11 December 2020).
- Zhang, A.; Alvi, M.F.; Gong, Y.; Wang, J.X. Overcoming barriers to supply chain decarbonization: Case studies of first movers. Resources, Conservation and Recycling 2022, 186, 106536. [CrossRef]
- Gandhi, S.; Mangla, S.K.; Kumar, P.; Kumar, D. Evaluating factors in implementation of successful green supply chain management using DEMATEL: A case study. International Strategic Management Review 2015, 3, 96–109. [CrossRef]
- Rehman Khan, S.A.; Yu, Z.; Golpîra, H.; Sharif, A.; Mardani, A. A state-of-the-art review and meta-analysis on sustainable supply chain management: Future research directions. Journal of Cleaner Production 2021, 278, 123357. [CrossRef]
- Lazar, S.; Klimecka-Tatar, D.; Obrecht, M. Sustainability orientation and focus in logistics and supply chains. Sustainability 2021, 13, 3280. [CrossRef]
- Schrettle, S.; Hinz, A.; Scherrer-Rathje, M.; Friedli, T. Turning sustainability into action: Explaining firms’ sustainability efforts and their impact on firm performance. International Journal of Production Economics 2014, 147, 73–84. [CrossRef]
- George, J.; Pillai, V.M. A study of factors affecting supply chain performance. Journal of Physics: Conference Series 2019, 1355, 12018. [CrossRef]
- Saeed, M.; Kersten, W. Drivers of sustainable supply chain management: Identification and classification. Sustainability 2019, 11, 1137. [CrossRef]
- Chakraborty, A.; Al Amin, M.; Baldacci, R. Analysis of internal factors of green supply chain management: An interpretive structural modeling approach. Cleaner Logistics and Supply Chain 2023, 7, 100099. [CrossRef]
- Kalaiarasan, R.; Olhager, J.; Agrawal, T.K.; Wiktorsson, M. The ABCDE of supply chain visibility: A systematic literature review and framework. International Journal of Production Economics 2022, 248, 108464. [CrossRef]
- Nilsson, F.; Göransson, M. Critical factors for the realization of sustainable supply chain innovations - Model development based on a systematic literature review. Journal of Cleaner Production 2021, 296, 126471. [CrossRef]
- Ahi, P.; Searcy, C. An analysis of metrics used to measure performance in green and sustainable supply chains. Journal of Cleaner Production 2015, 86, 360–377. [CrossRef]
- Paul, A.; Shukla, N.; Paul, S.K.; Trianni, A. Sustainable supply chain management and multi-criteria decision-making methods: A systematic review. Sustainability 2021, 13, 7104. [CrossRef]
- Apeji, U.D.; Sunmola, F.T. Principles and factors influencing visibility in sustainable supply chains. Procedia Computer Science 2022, 200, 1516–1527. [CrossRef]
- Govindan, K.; Bouzon, M. From a literature review to a multi-perspective framework for reverse logistics barriers and drivers. Journal of Cleaner Production 2018, 187, 318–337. [CrossRef]
- Walker, H.; Di Sisto, L.; McBain, D. Drivers and barriers to environmental supply chain management practices: Lessons from the public and private sectors. Journal of Purchasing and Supply Management 2008, 14, 69–85. [CrossRef]
- Yang, M.; Movahedipour, M.; Zeng, J.; Xiaoguang, Z.; Wang, L. Analysis of success factors to implement sustainable supply chain management using interpretive structural modeling technique: A real case perspective. Mathematical Problems in Engineering 2017, 2017, 1–14. [CrossRef]
- Anand, K.R.; Ramalingaiah; Parthiban, P. Evaluation of green supply chain factors using DEMATEL. Applied Mechanics and Materials 2014, 592-594, 2619–2627. [CrossRef]
- Liu, M.; Fan, H.H.; Zhou, Y.W. Analysis of influencing factors to green supply chain based on ISM. Applied Mechanics and Materials 2012, 220-223, 309–314. [CrossRef]
- Giusti, R.; Manerba, D.; Bruno, G.; Tadei, R. Synchromodal logistics: An overview of critical success factors, enabling technologies, and open research issues. Transportation Research Part E: Logistics and Transportation Review 2019, 129, 92–110. [CrossRef]
- Anand, K.R.; Ramalingaiah; Parthiban, P. Fuzzy quantitative approach to prioritize green factors in supply chain. Applied Mechanics and Materials 2014, 592-594, 2645–2653. [CrossRef]
- Wittstruck, D.; Teuteberg, F. Understanding the success factors of sustainable supply chain management: Empirical evidence from the electrics and electronics industry. Corporate Social Responsibility and Environmental Management 2012, 19, 141–158. [CrossRef]
- Jiang, F. Analysis of the potential and influencing factors of regional logistics industry development from the perspective of supply chain. Advances in Multimedia 2022, 2022, 1–10. [CrossRef]
- Zhu, Q.; Shah, P.; Sarkis, J. Addition by subtraction: integrating product deletion with lean and sustainable supply chain management. International Journal of Production Economics 2018, 205, 201–214. [CrossRef]
- Hossain, M.I.; Al Amin, M.; Baldacci, R.; Rahman, M.H. Identification and prioritization of green lean supply chain management factors using fuzzy DEMATEL. Sustainability 2023, 15, 10523. [CrossRef]
- Nag, U.; Sharma, S.K.; Govindan, K. Investigating drivers of circular supply chain with product-service system in automotive firms of an emerging economy. Journal of Cleaner Production 2021, 319, 128629. [CrossRef]
- Lahane, S.; Kant, R. Evaluating the circular supply chain implementation barriers using Pythagorean fuzzy AHP-DEMATEL approach. Cleaner Logistics and Supply Chain 2021, 2, 100014. [CrossRef]
- Sunmola, F.; Burgess, P.; Tan, A.; Chanchaichujit, J.; Balasubramania, S.; Mahmud, M. Prioritising visibility influencing factors in supply chains for resilience. Procedia Computer Science 2023, 217, 1589–1598. [CrossRef]
- Mangla, S.K.; Govindan, K.; Luthra, S. Critical success factors for reverse logistics in Indian industries: a structural model. Journal of Cleaner Production 2016, 129, 608–621. [CrossRef]
- Large, R.O.; Gimenez Thomsen, C. Drivers of green supply management performance: Evidence from Germany. Journal of Purchasing and Supply Management 2011, 17, 176–184. [CrossRef]
- Sancha, C.; Longoni, A.; Giménez, C. Sustainable supplier development practices: Drivers and enablers in a global context. Journal of Purchasing and Supply Management 2015, 21, 95–102. [CrossRef]
- Giunipero, L.C.; Hooker, R.E.; Denslow, D. Purchasing and supply management sustainability: Drivers and barriers. Journal of Purchasing and Supply Management 2012, 18, 258–269. [CrossRef]
- Tsai, J.-F.; Wu, S.-C.; Pham, T.K.L.; Lin, M.-H. Analysis of key factors for green supplier selection: A case study of the electronics industry in Vietnam. Sustainability 2023, 15, 7885. [CrossRef]
- Govindan, K.; Diabat, A.; Madan Shankar, K. Analyzing the drivers of green manufacturing with fuzzy approach. Journal of Cleaner Production 2015, 96, 182–193. [CrossRef]
- Seth, D.; Rehman, M.A.A.; Shrivastava, R.L. Green manufacturing drivers and their relationships for small and medium (SME) and large industries. Journal of Cleaner Production 2018, 198, 1381–1405. [CrossRef]
- Olatunji, O.O.; Akinlabi, S.A.; Ayo, O.O.; Madushele, N.; Adedeji, P.A.; Fatoba, S.O. Drivers and barriers to competitive carbon footprint reduction in manufacturing supply chain: a brief review. Procedia Manufacturing 2019, 35, 992–1000. [CrossRef]
- Zailani, S.; Jeyaraman, K.; Vengadasan, G.; Premkumar, R. Sustainable supply chain management (SSCM) in Malaysia: A survey. International Journal of Production Economics 2012, 140, 330–340. [CrossRef]
- Xia, X.; Govindan, K.; Zhu, Q. Analyzing internal barriers for automotive parts remanufacturers in China using grey-DEMATEL approach. Journal of Cleaner Production 2015, 87, 811–825. [CrossRef]
- Verma, A.; Tripathy, S.; Singhal, D. The significance of warehouse management in supply chain: An ISM approach. Decision Making: Applications in Management and Engineering 2023, 6, 92–110. [CrossRef]
- Zhang, Y.; Thompson, R.G.; Bao, X.; Jiang, Y. Analyzing the promoting factors for adopting green logistics practices: a case study of road freight industry in Nanjing, China. Procedia - Social and Behavioral Sciences 2014, 125, 432–444. [CrossRef]
- Jasmi, M.F.A.; Fernando, Y. Drivers of maritime green supply chain management. Sustainable Cities and Society 2018, 43, 366–383. [CrossRef]
- Shao, J.; Taisch, M.; Ortega-Mier, M. A grey-DEcision-MAking Trial and Evaluation Laboratory (DEMATEL) analysis on the barriers between environmentally friendly products and consumers: Practitioners’ viewpoints on the European automobile industry. Journal of Cleaner Production 2016, 112, 3185–3194. [CrossRef]
- Shih-Hsiung Cheng; Shih Ming Ou; Su-Mei Lin. Using decision-making trial and evaluation laboratory (DEMATEL) to explore the key success factors for green logistics manufacturers. African Journal of Business Management 2018, 12, 58–65. [CrossRef]
- Kumar, S.; Luthra, S.; Haleem, A. Customer involvement in greening the supply chain: an interpretive structural modeling methodology. Journal of Industrial Engineering International 2013, 9. [CrossRef]
- Kumar, S.; Luthra, S.; Haleem, A. Critical success factors of customer involvement in greening the supply chain: an empirical study. International Journal of Logistics Systems and Management 2014, 19, 283. [CrossRef]
- Gandhi, S.; Mangla, S.K.; Kumar, P.; Kumar, D. A combined approach using AHP and DEMATEL for evaluating success factors in implementation of green supply chain management in Indian manufacturing industries. International Journal of Logistics Research and Applications 2016, 19, 537–561. [CrossRef]
- Sureeyatanapas, P.; Poophiukhok, P.; Pathumnakul, S. Green initiatives for logistics service providers: An investigation of antecedent factors and the contributions to corporate goals. Journal of Cleaner Production 2018, 191, 1–14. [CrossRef]
- Diabat, A.; Govindan, K. An analysis of the drivers affecting the implementation of green supply chain management. Resources, Conservation and Recycling 2011, 55, 659–667. [CrossRef]
- Hu, A.H.; Hsu, C.-W. Critical factors for implementing green supply chain management practice. Management Research Review 2010, 33, 586–608. [CrossRef]
- Wiśniewski, T.; Tundys, B. Comparative analysis of sustainability factors in supply chain links. Evidence of empirical research. Procedia Computer Science 2022, 207, 3358–3366. [CrossRef]
- Brito, M.P. de; Dekker, R. Reverse Logistics – a framework. In Reverse Logistics: Quantitative models for closed-loop supply chains; Dekker, R., Ed.; Springer-Verlag: Berlin, 2010; pp 3–27, ISBN 978-3-642-07380-9.
- Akdoğan, M.; Coşkun, A. Drivers of reverse logistics activities: An empirical investigation. Procedia - Social and Behavioral Sciences 2012, 58, 1640–1649. [CrossRef]
- Kumar, A.; Moktadir, M.A.; Khan, S.A.R.; Garza-Reyes, J.A.; Tyagi, M.; Kazançoğlu, Y. Behavioral factors on the adoption of sustainable supply chain practices. Resources, Conservation and Recycling 2020, 158, 104818. [CrossRef]
- Prasad, D.S.; Pradhan, R.P.; Gaurav, K.; Sabat, A.K. Critical success factors of sustainable supply chain management and organizational performance: An exploratory study. Transportation Research Procedia 2020, 48, 327–344. [CrossRef]
- Pradeep, C.C. Assessment and analysis of GSCM barriers using AHP. International Research Journal of Engineering and Technology 2017, 4, 1777-1782.
- Agi, M.A.N.; Nishant, R. Understanding influential factors on implementing green supply chain management practices: An interpretive structural modelling analysis. J. Environ. Manage. 2017, 188, 351–363. [CrossRef]
- Luthra, S.; Garg, D.; Haleem, A. An analysis of interactions among critical success factors to implement green supply chain management towards sustainability: An Indian perspective. Resources Policy 2015, 46, 37–50. [CrossRef]
- Raut, R.D.; Narkhede, B.; Gardas, B.B. To identify the critical success factors of sustainable supply chain management practices in the context of oil and gas industries: ISM approach. Renewable and Sustainable Energy Reviews 2017, 68, 33–47. [CrossRef]
- Refaie, A.A.; Momani, D. ISM approach for modelling drivers to practices of green supply chain management in Jordanian industrial firms. International Journal of Business Performance and Supply Chain Modelling 2018, 10, 91. [CrossRef]
- Reza Kiani Mavi; Sajad Kazemi; Ali Fallahian Najafabadi; Hosein Bemani Mousaabadi. Identification and assessment of logistical factors to evaluate a green supplier using the fuzzy logic DEMATEL method. Polish Journal of Environmental Studies 2013, 22, 445–455.
- Sharma, Y.K.; Sharma, S. IT success factors in sustainable food supply chain management. Materials Today: Proceedings 2022, 56, Part 1, 43–45. [CrossRef]
- Shibin, K.T.; Gunasekaran, A.; Papadopoulos, T.; Dubey, R.; Singh, M.; Wamba, S.F. Enablers and barriers of flexible green supply chain management: A total interpretive structural modeling approach. Global Journal of Flexible Systems Management 2016, 17, 171–188. [CrossRef]
- Tippayawong, K.; Niyomyat, N.; Sopadang, A.; Ramingwong, S. Factors affecting green supply chain operational performance of the Thai auto parts industry. Sustainability 2016, 8, 1161. [CrossRef]
- Tumpa, T.J.; Ali, S.M.; Rahman, M.H.; Paul, S.K.; Chowdhury, P.; Rehman Khan, S.A. Barriers to green supply chain management: An emerging economy context. Journal of Cleaner Production 2019, 236, 117617. [CrossRef]
- Wu, H.-H.; Chang, S.-Y. A case study of using DEMATEL method to identify critical factors in green supply chain management. Applied Mathematics and Computation 2015, 256, 394–403. [CrossRef]
- Wu, K.-J.; Liao, C.-J.; Tseng, M.-L.; Chiu, A.S. Exploring decisive factors in green supply chain practices under uncertainty. International Journal of Production Economics 2015, 159, 147–157. [CrossRef]
- Zhu, Q.; Sarkis, J. An inter-sectoral comparison of green supply chain management in China: drivers and practices. Journal of Cleaner Production 2006, 14, 472–486. [CrossRef]
- Drohomeretski, E.; Gouvea da Costa, S.; Pinheiro de Lima, E. Green supply chain management: drivers, barriers and practices within the Brazilian automotive industry. Journal of Manufacturing Technology Management 2014, 25, 1105–1134. [CrossRef]
- Attia, E.-A.; Alarjani, A.; Uddin, M.S.; Kineber, A.F. Examining the influence of sustainable construction supply chain drivers on sustainable building projects using mathematical structural equation modeling approach. Sustainability 2023, 15, 10671. [CrossRef]
- Mathiyazhagan, K.; Govindan, K.; NoorulHaq, A.; Geng, Y. An ISM approach for the barrier analysis in implementing green supply chain management. Journal of Cleaner Production 2013, 47, 283–297. [CrossRef]
- Kshitij Dashore, N.S. Green supply chain management: A hierarchical framework for barriers. International Journal of Engineering Trends and Technology 2013, 4, 2172–2182.
- Al Zaabi, S.; Al Dhaheri, N.; Diabat, A. Analysis of interaction between the barriers for the implementation of sustainable supply chain management. The International Journal of Advanced Manufacturing Technology 2013, 68, 895–905. [CrossRef]
- Meager, S.; Kumar, V.; Ekren, B.; Paddeu, D. Exploring the drivers and barriers to green supply chain management implementation: A study of independent UK restaurants. Procedia Manufacturing 2020, 51, 1642–1649. [CrossRef]
- Karmaker, C.L.; Ahmed, T.; Ahmed, S.; Ali, S.M.; Moktadir, M.A.; Kabir, G. Improving supply chain sustainability in the context of COVID-19 pandemic in an emerging economy: Exploring drivers using an integrated model. Sustainable Production and Consumption 2021, 26, 411–427. [CrossRef]
- Sajjad, A.; Eweje, G.; Tappin, D. Managerial perspectives on drivers for and barriers to sustainable supply chain management implementation: Evidence from New Zealand. Business Strategy and the Environment 2020, 29, 592–604. [CrossRef]
- Özaşkın, A.; Görener, A. An integrated multi-criteria decision-making approach for overcoming barriers to green supply chain management and prioritizing alternative solutions. Supply Chain Analytics 2023, 3, 100027. [CrossRef]
- Sumrit, D.; Jongprasittiphol, O. Exploring barriers in supply chain disaster management using fuzzy total interpretative structure modeling approach: Insight from Thai automotive industry. Asia Pacific Management Review 2023. [CrossRef]
- Malviya, R.K.; Kant, R. Identifying critical success factors for green supply chain management implementation using fuzzy DEMATEL method. In 2014 IEEE International Conference on Industrial Engineering and Engineering Management. 2014 IEEE International Conference on Industrial Engineering and Engineering Management (IEEM), Selangor Darul Ehsan, Malaysia, 09–12 Dec. 2014; IEEE, 122014; pp 214–218, ISBN 978-1-4799-6410-9.
- Fan, L.; Yi, H. The influence factors analysis on response speed of agile supply chain. Advanced Materials Research 2012, 472-475, 3269–3272. [CrossRef]
- Guritno, A.D.; Fujianti, R.; Kusumasari, D. Assessment of the supply chain factors and classification of inventory management in suppliers’ level of fresh vegetables. Agriculture and Agricultural Science Procedia 2015, 3, 51–55. [CrossRef]
- Mohseni, S.; Baghizadeh, K.; Pahl, J. Evaluating barriers and drivers to sustainable food supply chains. Mathematical Problems in Engineering 2022, 2022, 1–24. [CrossRef]
- Akcan, S.; Taş, M.A. Green supplier evaluation with SWARA-TOPSIS integrated method to reduce ecological risk factors. Environmental Monitoring and Assessment 2019, 191, 226. [CrossRef]
- Mumtaz, U.; Ali, Y.; Petrillo, A.; Felice, F. de. Identifying the critical factors of green supply chain management: Environmental benefits in Pakistan. Sci. Total Environ. 2018, 640-641, 144–152. [CrossRef]
- Muduli, K.; Govindan, K.; Barve, A.; Kannan, D.; Geng, Y. Role of behavioural factors in green supply chain management implementation in Indian mining industries. Resources, Conservation and Recycling 2013, 76, 50–60. [CrossRef]
- Akman, G.; Pışkın, H. Evaluating green performance of suppliers via analytic network process and TOPSIS. Journal of Industrial Engineering 2013, 2013, 1–13. [CrossRef]
- Aslam, H.; Rashid, K.; Wahla, A.R.; Tahira, U. Drivers of green supply chain management practices and their impact on firm Performance: A developing country perspective. Journal of Quantitative Methods 2018, 2, 87–113. [CrossRef]
- Zhu, Q.; Sarkis, J.; Lai, K.-H. Confirmation of a measurement model for green supply chain management practices implementation. International Journal of Production Economics 2008, 111, 261–273. [CrossRef]
- Vasiliauskas, A.V.; Zinkevičiūtė, V.; Šimonytė, E. Implementation of the concept of green logistics reffering to it applications for road freight transport enterprises. Business: Theory and Practice 2013, 14, 43–50. [CrossRef]
- Uygun, Ö.; Dede, A. Performance evaluation of green supply chain management using integrated fuzzy multi-criteria decision making techniques. Computers & Industrial Engineering 2016, 102, 502–511. [CrossRef]
- Uddin, S.; Ali, S.M.; Kabir, G.; Suhi, S.A.; Enayet, R.; Haque, T. An AHP-ELECTRE framework to evaluate barriers to green supply chain management in the leather industry. International Journal of Sustainable Development & World Ecology 2019, 26, 732–751. [CrossRef]
- Song, W.; Xu, Z.; Liu, H.-C. Developing sustainable supplier selection criteria for solar air-conditioner manufacturer: An integrated approach. Renewable and Sustainable Energy Reviews 2017, 79, 1461–1471. [CrossRef]
- Kim, J.; Rhee, J. An empirical study on the impact of critical success factors on the balanced scorecard performance in Korean green supply chain management enterprises. International Journal of Production Research 2012, 50, 2465–2483. [CrossRef]
- Osintsev, N.; Rakhmangulov, A.; Sładkowski, A.; Dyorina, N. Logistic flow control system in green supply chains. In Ecology in Transport: Problems and Solutions; Sładkowski, A., Ed.; Springer International Publishing: Cham, 2020; pp 311–380, ISBN 978-3-030-42322-3.
- Kornilov, S.; Rakhmangulov, A.; Shaulsky, B. Logistics Basics. Moscow: FGBOU "Uchebno-metodicheskii tsentr po obrazovaniiu na zheleznodorozhnom transporte, 2016, ISBN 978-5-89035-918-6.
- Rakhmangulov, A.; Sladkowski, A.; Osintsev, N.; Muravev, D. Green logistics: a system of methods and instruments - Part 2. Naše more 2018, 65, 49–55. [CrossRef]
- Rakhmangulov, A.; Sładkowski, A.; Osintsev, N. Design of an ITS for industrial enterprises. In Intelligent Transportation Systems – Problems and Perspectives; Sładkowski, A., Pamuła, W., Eds.; Springer International Publishing: Cham, 2016; pp 161–215, ISBN 978-3-319-19149-2.
- Osintsev, N.; Kazarmshchikova, E. Factors of sustainable development of transport and logistics systems. Modern Problems of Russian Transport Complex 2017, 7, 13–21. [CrossRef]
- Osintsev, N.; Rakhmangulov, A.; Baginova, V. Evaluation of logistic flows in green supply chains based on the combined DEMATEL-ANP method. Facta Universitatis, Series: Mechanical Engineering 2021, 19, 473–498. [CrossRef]
- Gabus, A.; Fontela, E. World problems, an invitation to further thought within the framework of DEMATEL; Battelle Geneva Research Centre: Geneva, Switzerland, 1972.
- Puška, A.; Stević, Ž.; Pamučar, D. Evaluation and selection of healthcare waste incinerators using extended sustainability criteria and multi-criteria analysis methods. Environment, Development and Sustainability 2021, 32, 688. [CrossRef]
- Hwang, C.-L.; Yoon, K. Multiple attribute decision making: Methods and applications: a state-of-the-art survey; Springer Berlin Heidelberg: Berlin, Heidelberg, 1981, ISBN 3642483186.
- Zavadskas, E.K.; Turskis, Z. A new additive ratio assessment (ARAS) method in multicriteria decision-making. Technological and Economic Development of Economy 2010, 16, 159–172. [CrossRef]
- Stević, Ž.; Pamučar, D.; Puška, A.; Chatterjee, P. Sustainable supplier selection in healthcare industries using a new MCDM method: Measurement of alternatives and ranking according to COmpromise solution (MARCOS). Computers & Industrial Engineering 2020, 140, 106231. [CrossRef]
Figure 4.
Network relationship maps and total criterion linkage matrices: а – C-DEMATEL; b – F-DEMATE; c – G-DEMATEL.
Figure 4.
Network relationship maps and total criterion linkage matrices: а – C-DEMATEL; b – F-DEMATE; c – G-DEMATEL.
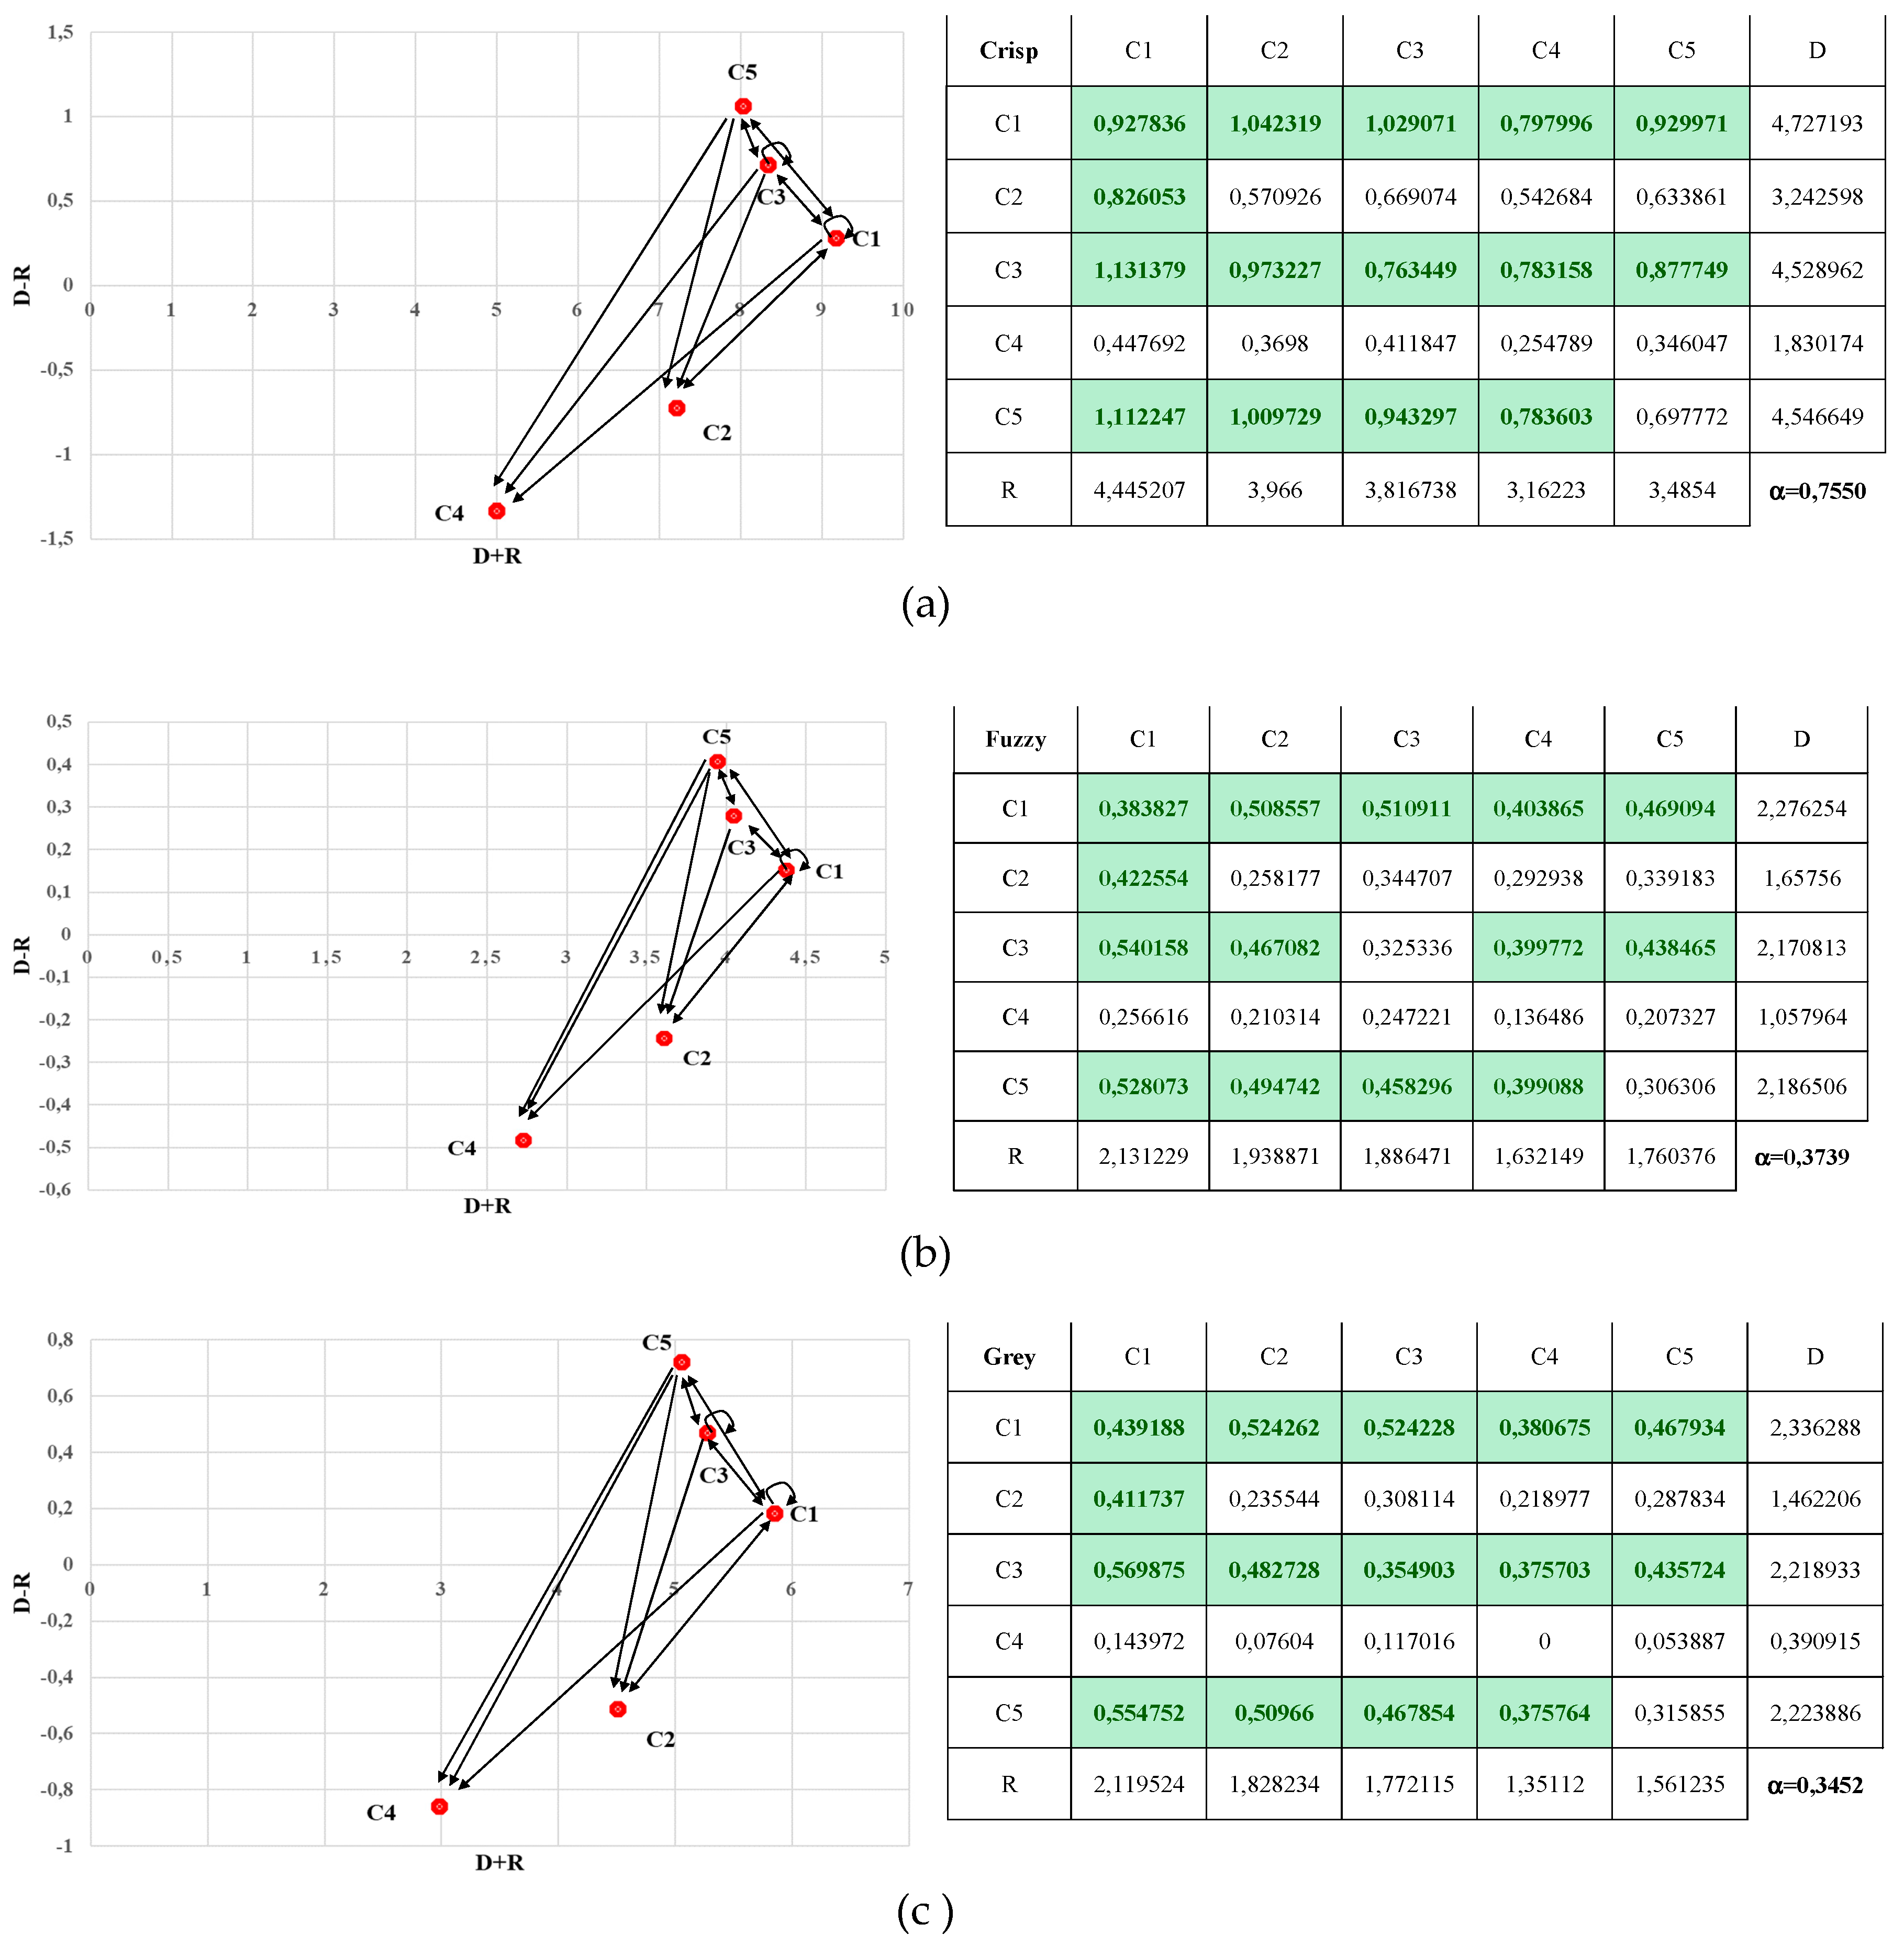
Figure 5.
Sub-criteria network relationship maps.
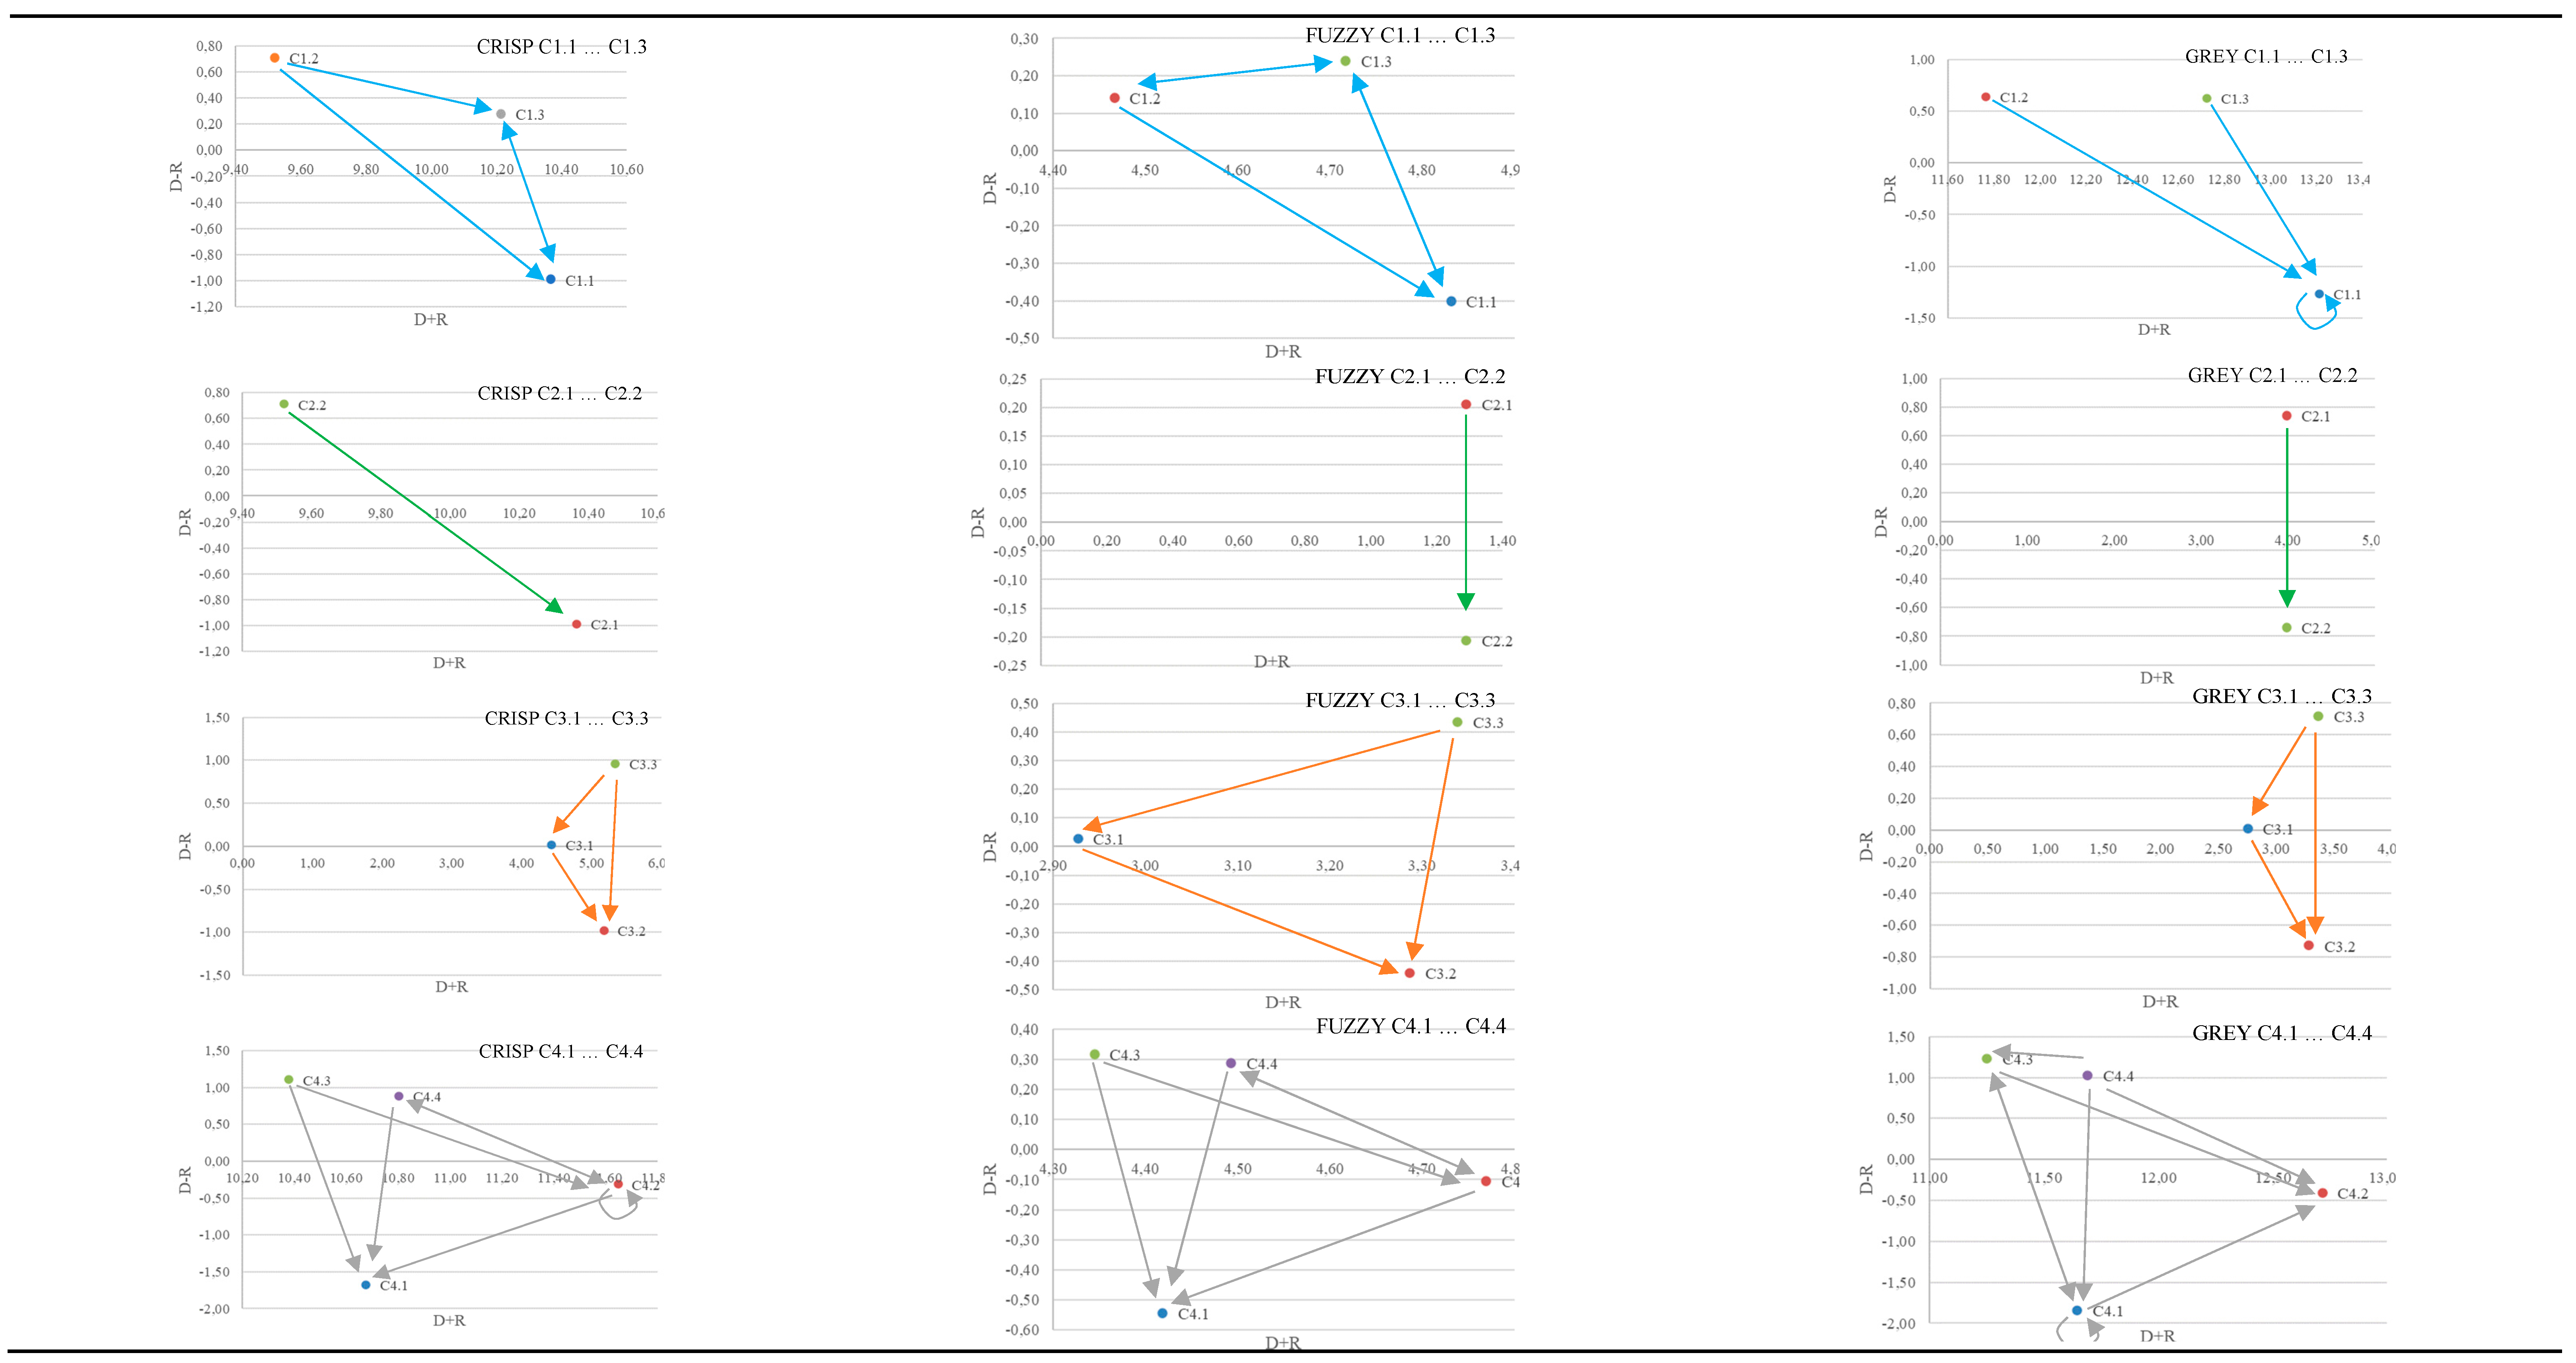
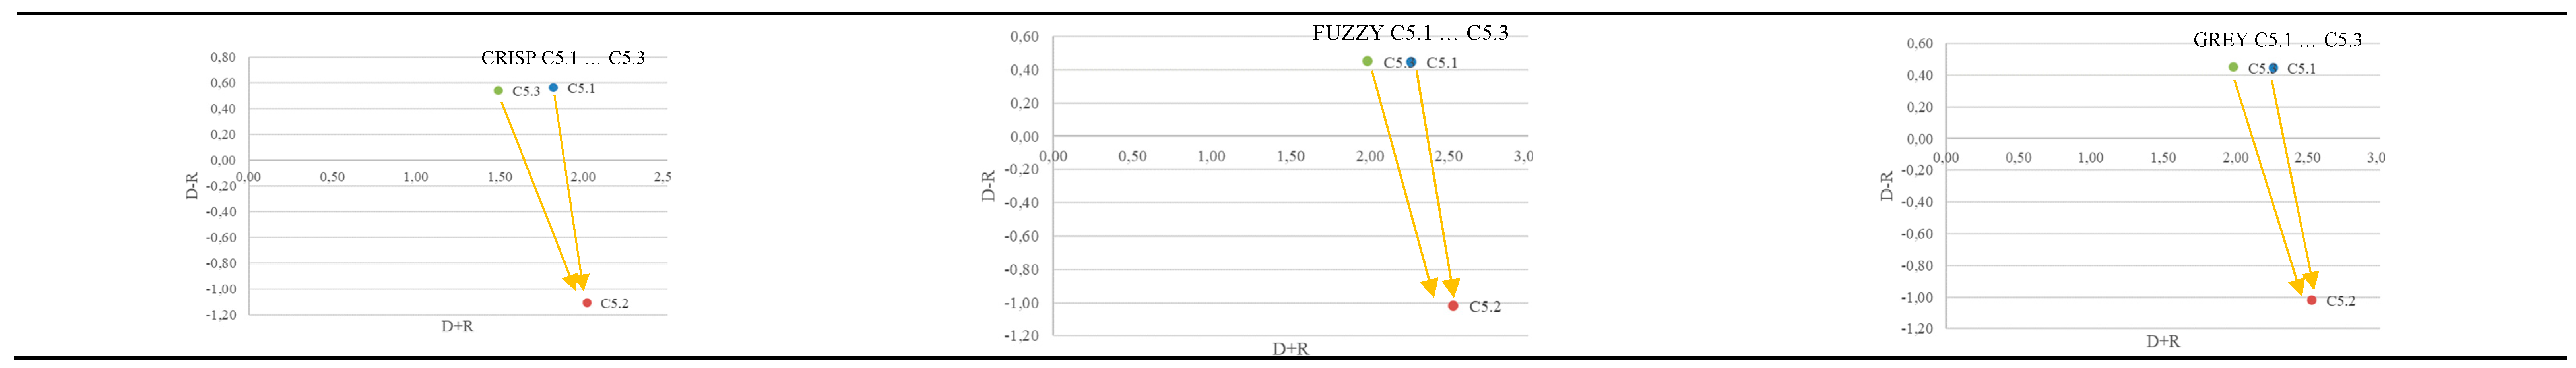
Figure 6.
Result of driver ranking.
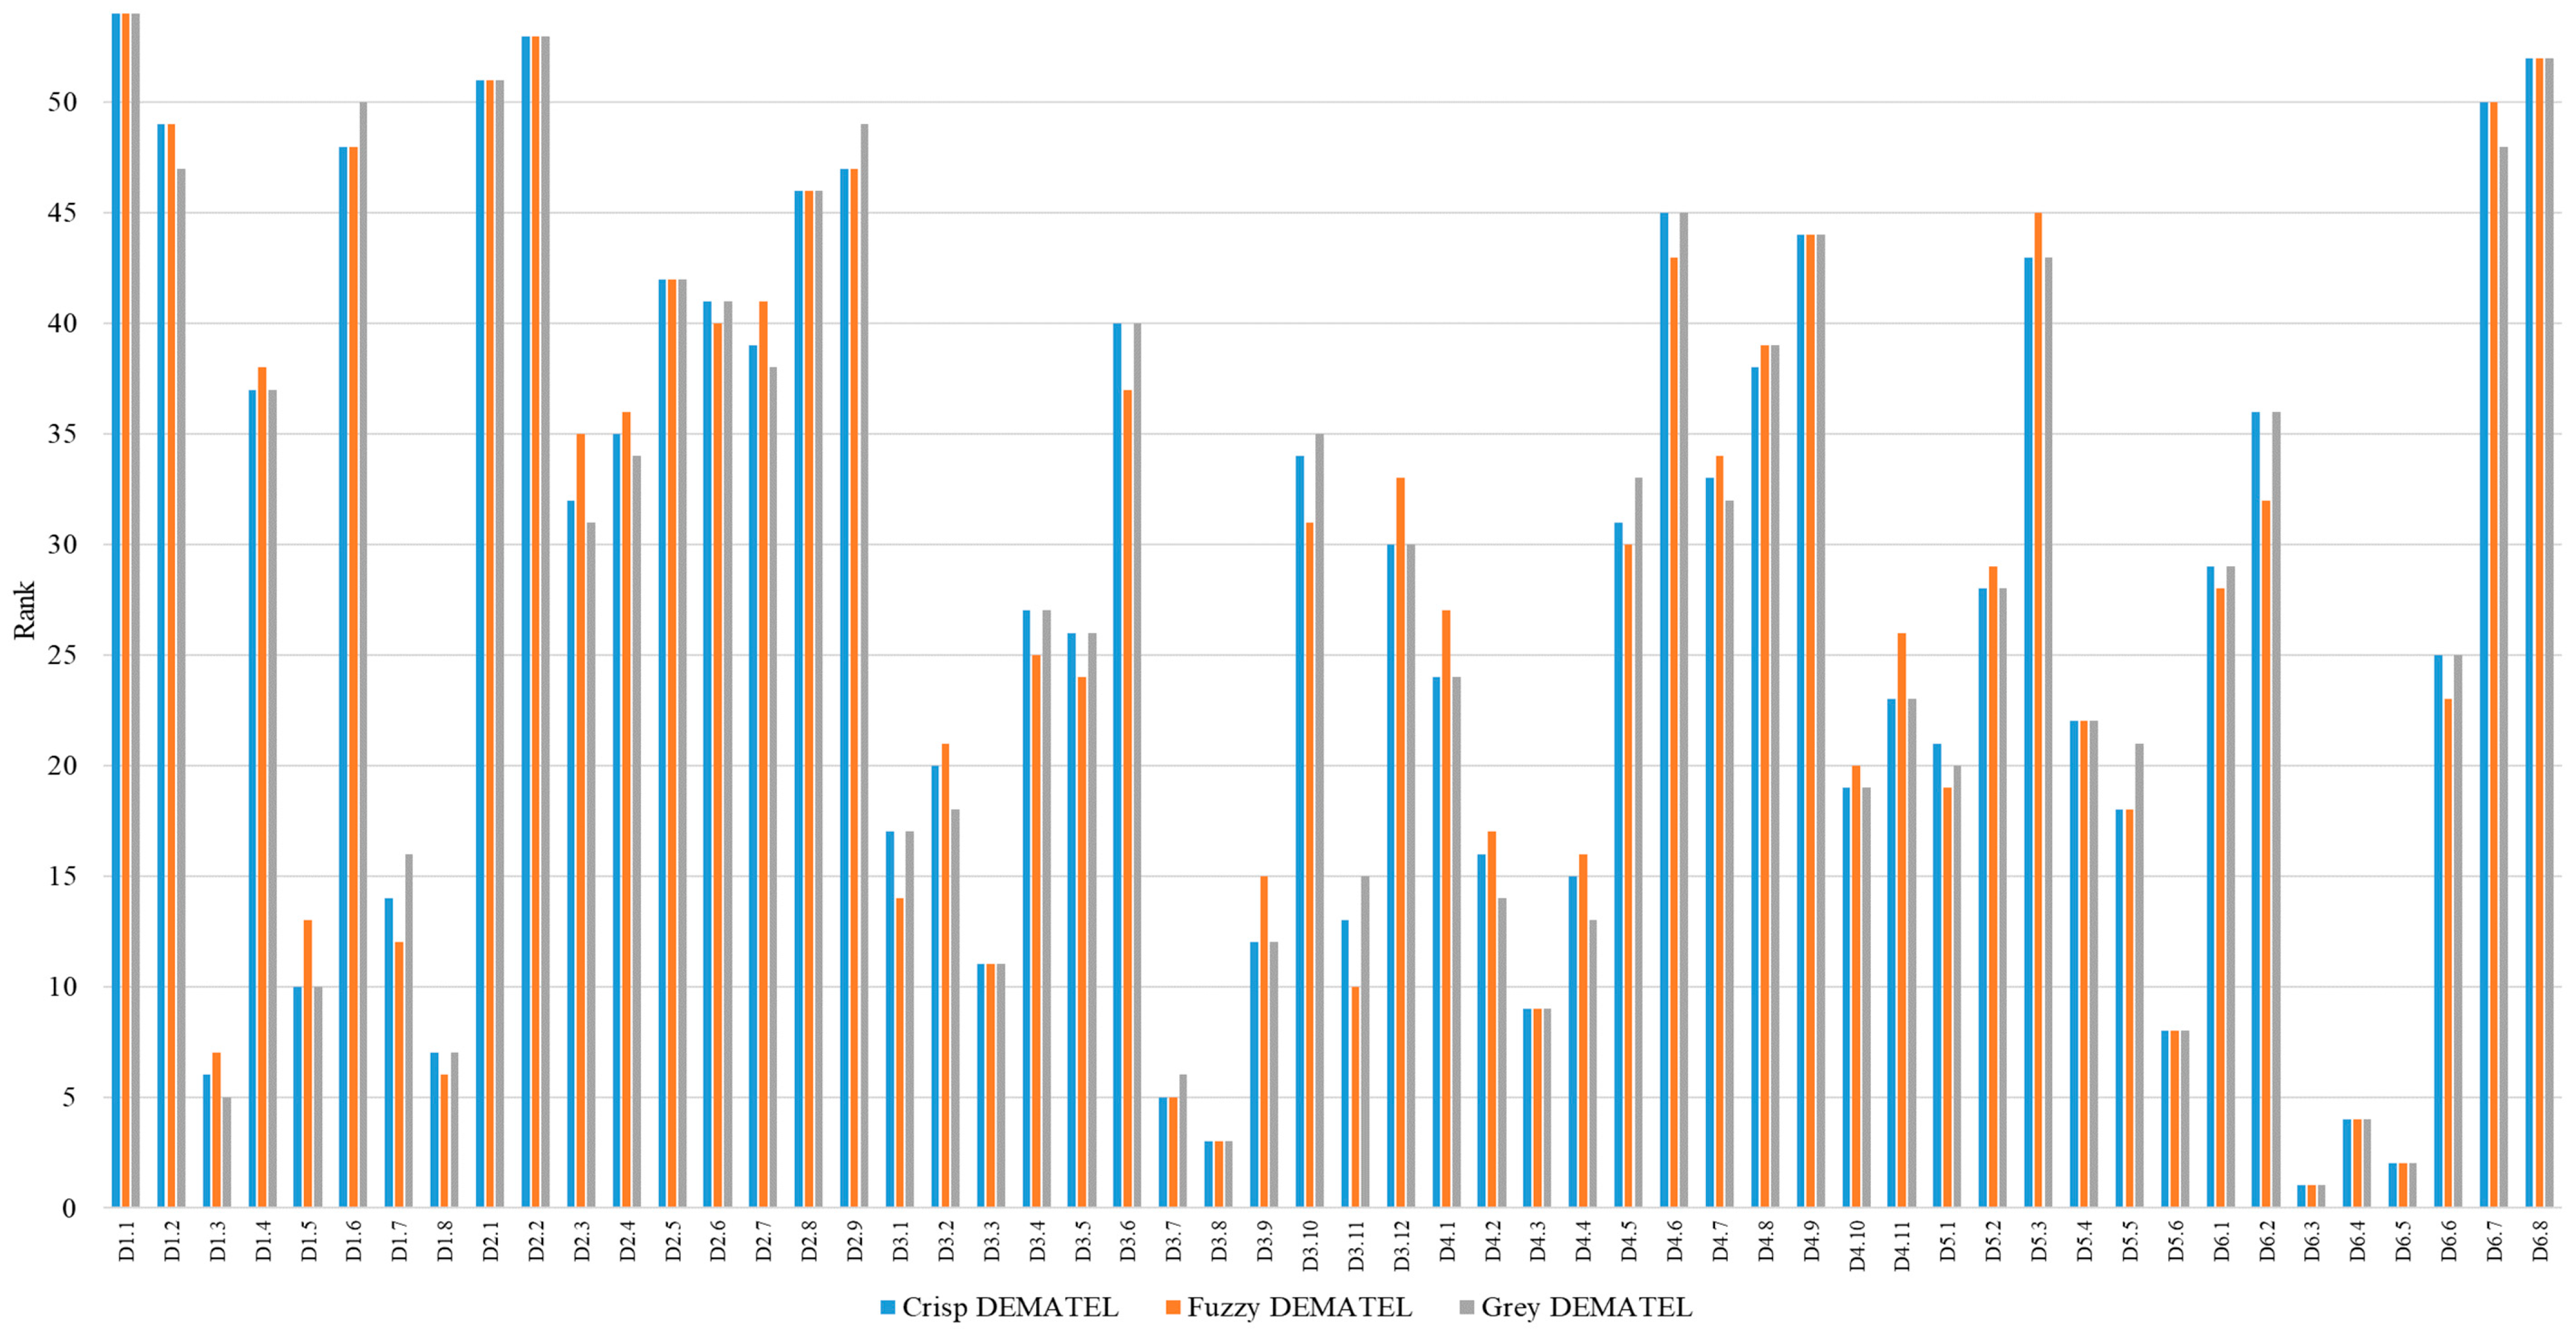
Figure 7.
Results of driver ranking by SC elements.
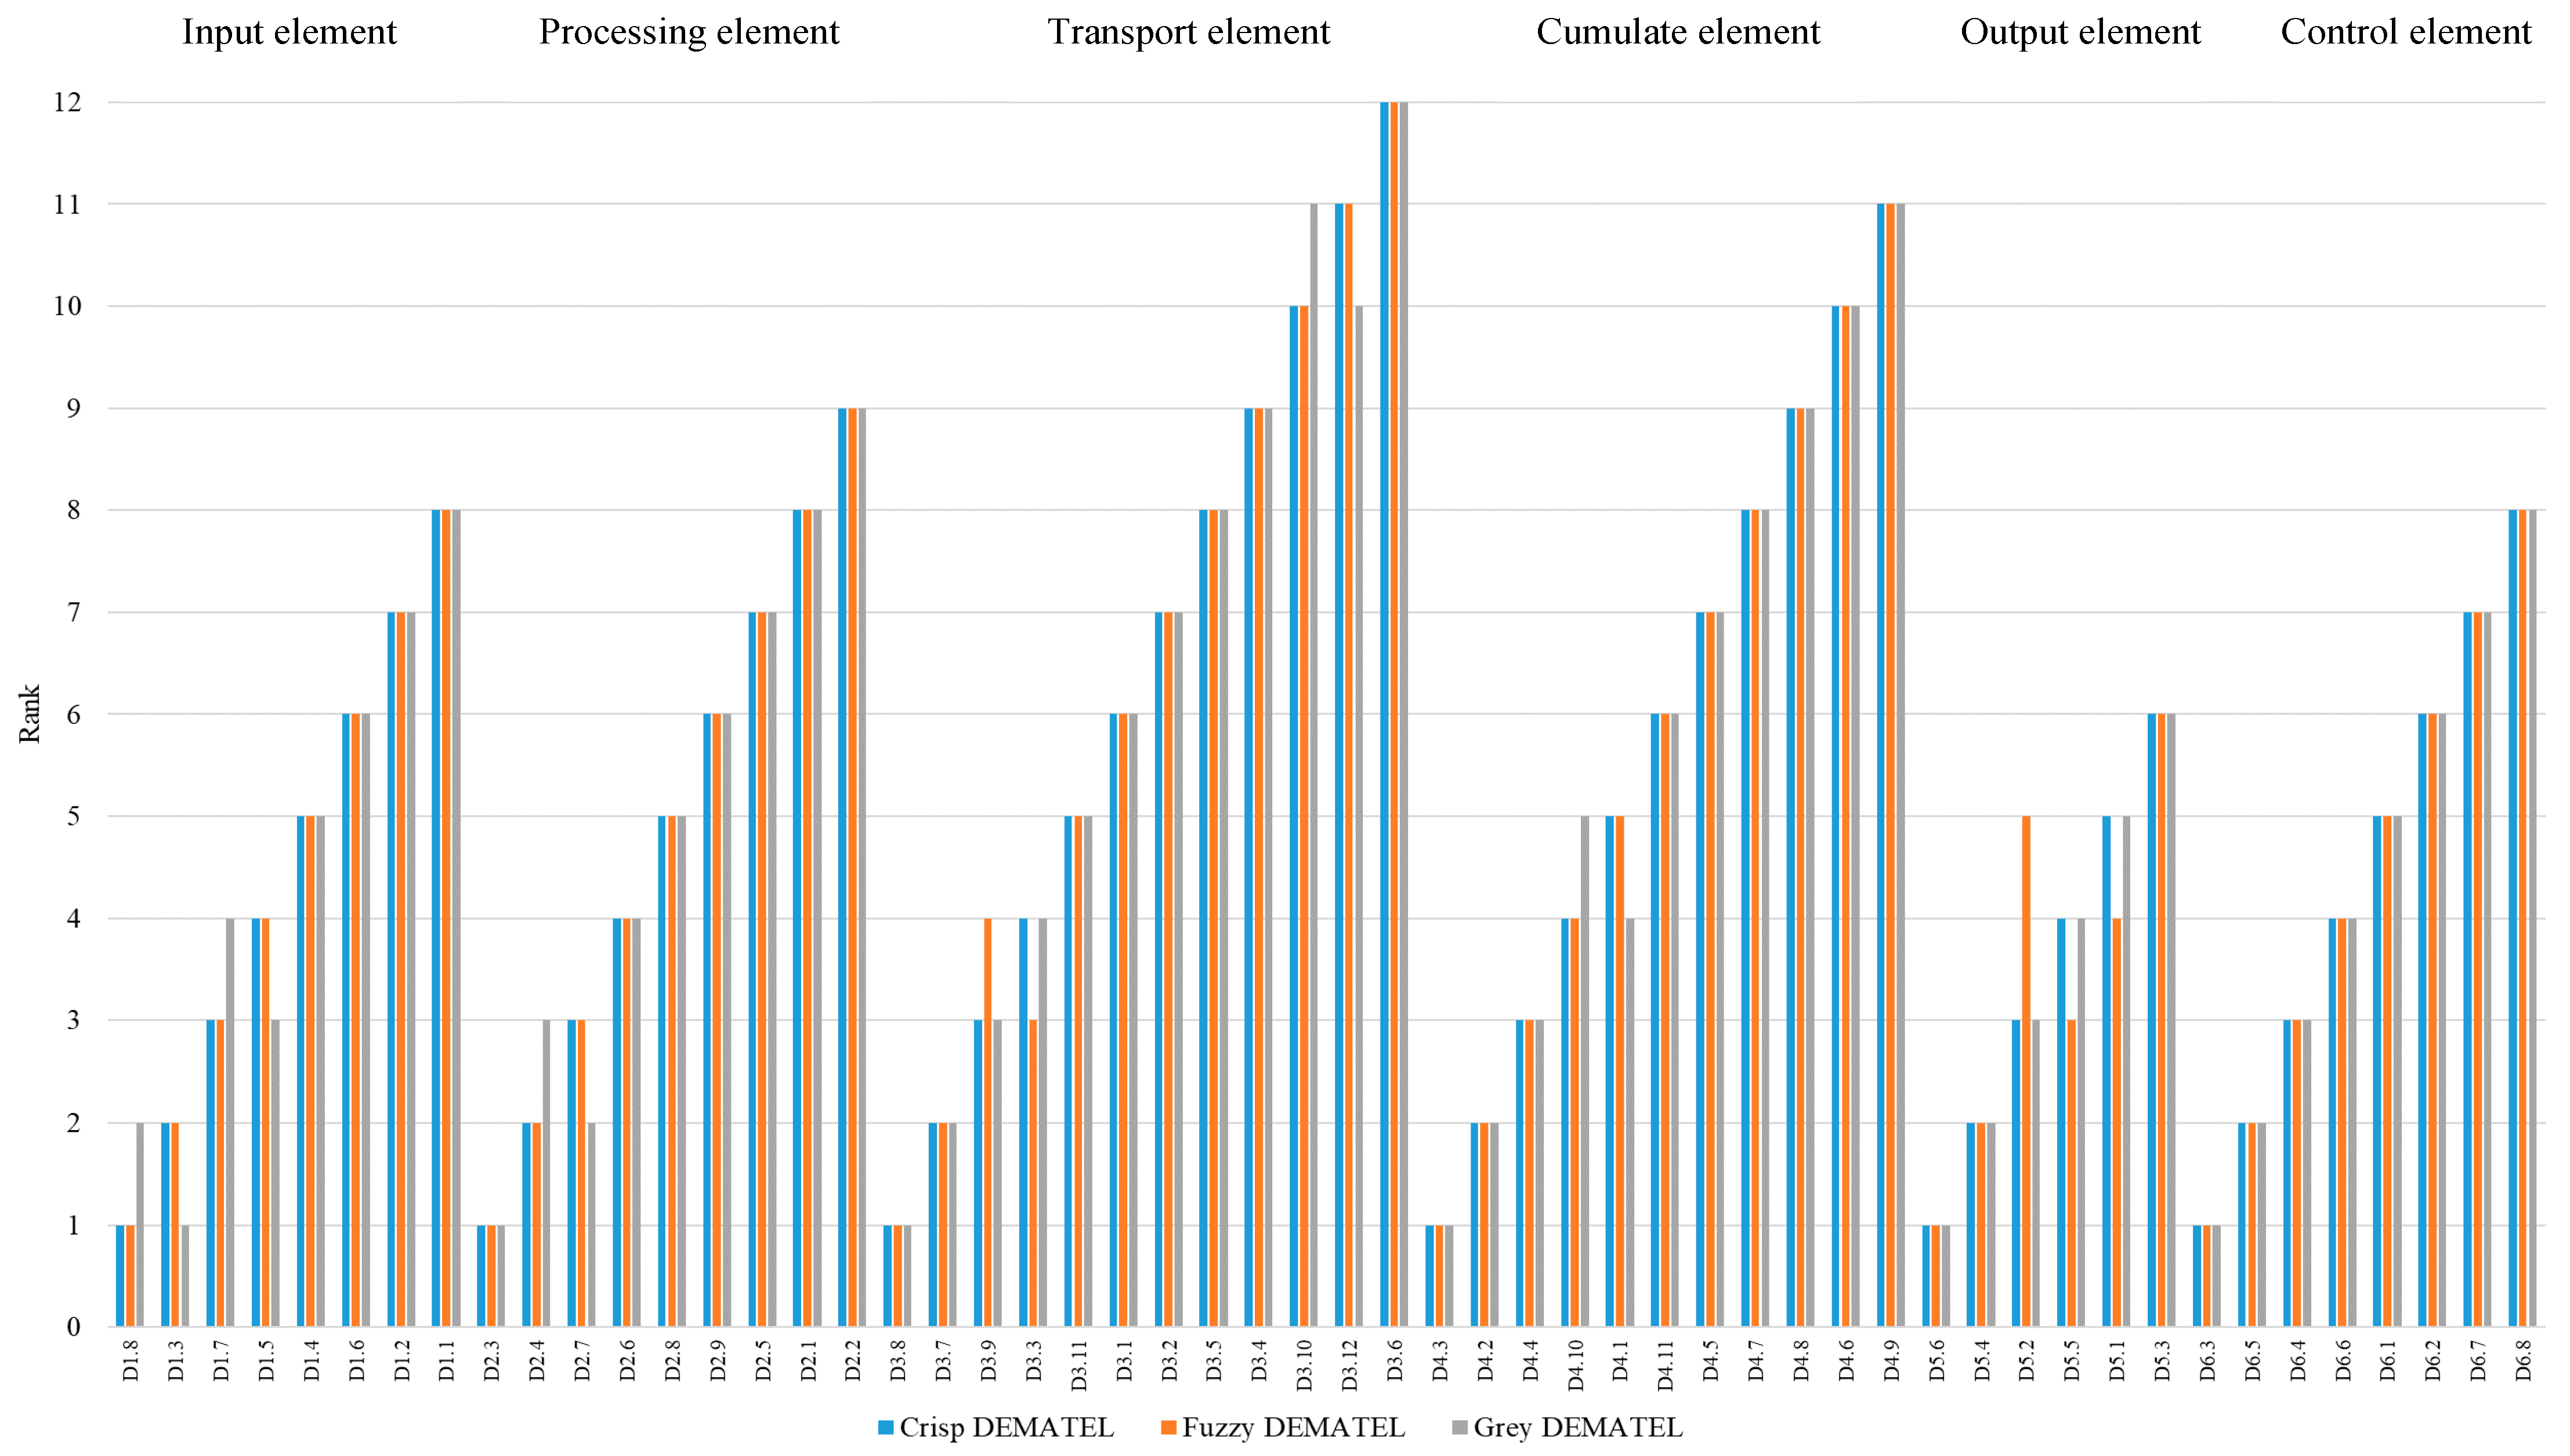
Figure 8.
Comparison of SSC driver ranking results by different MCDM methods.
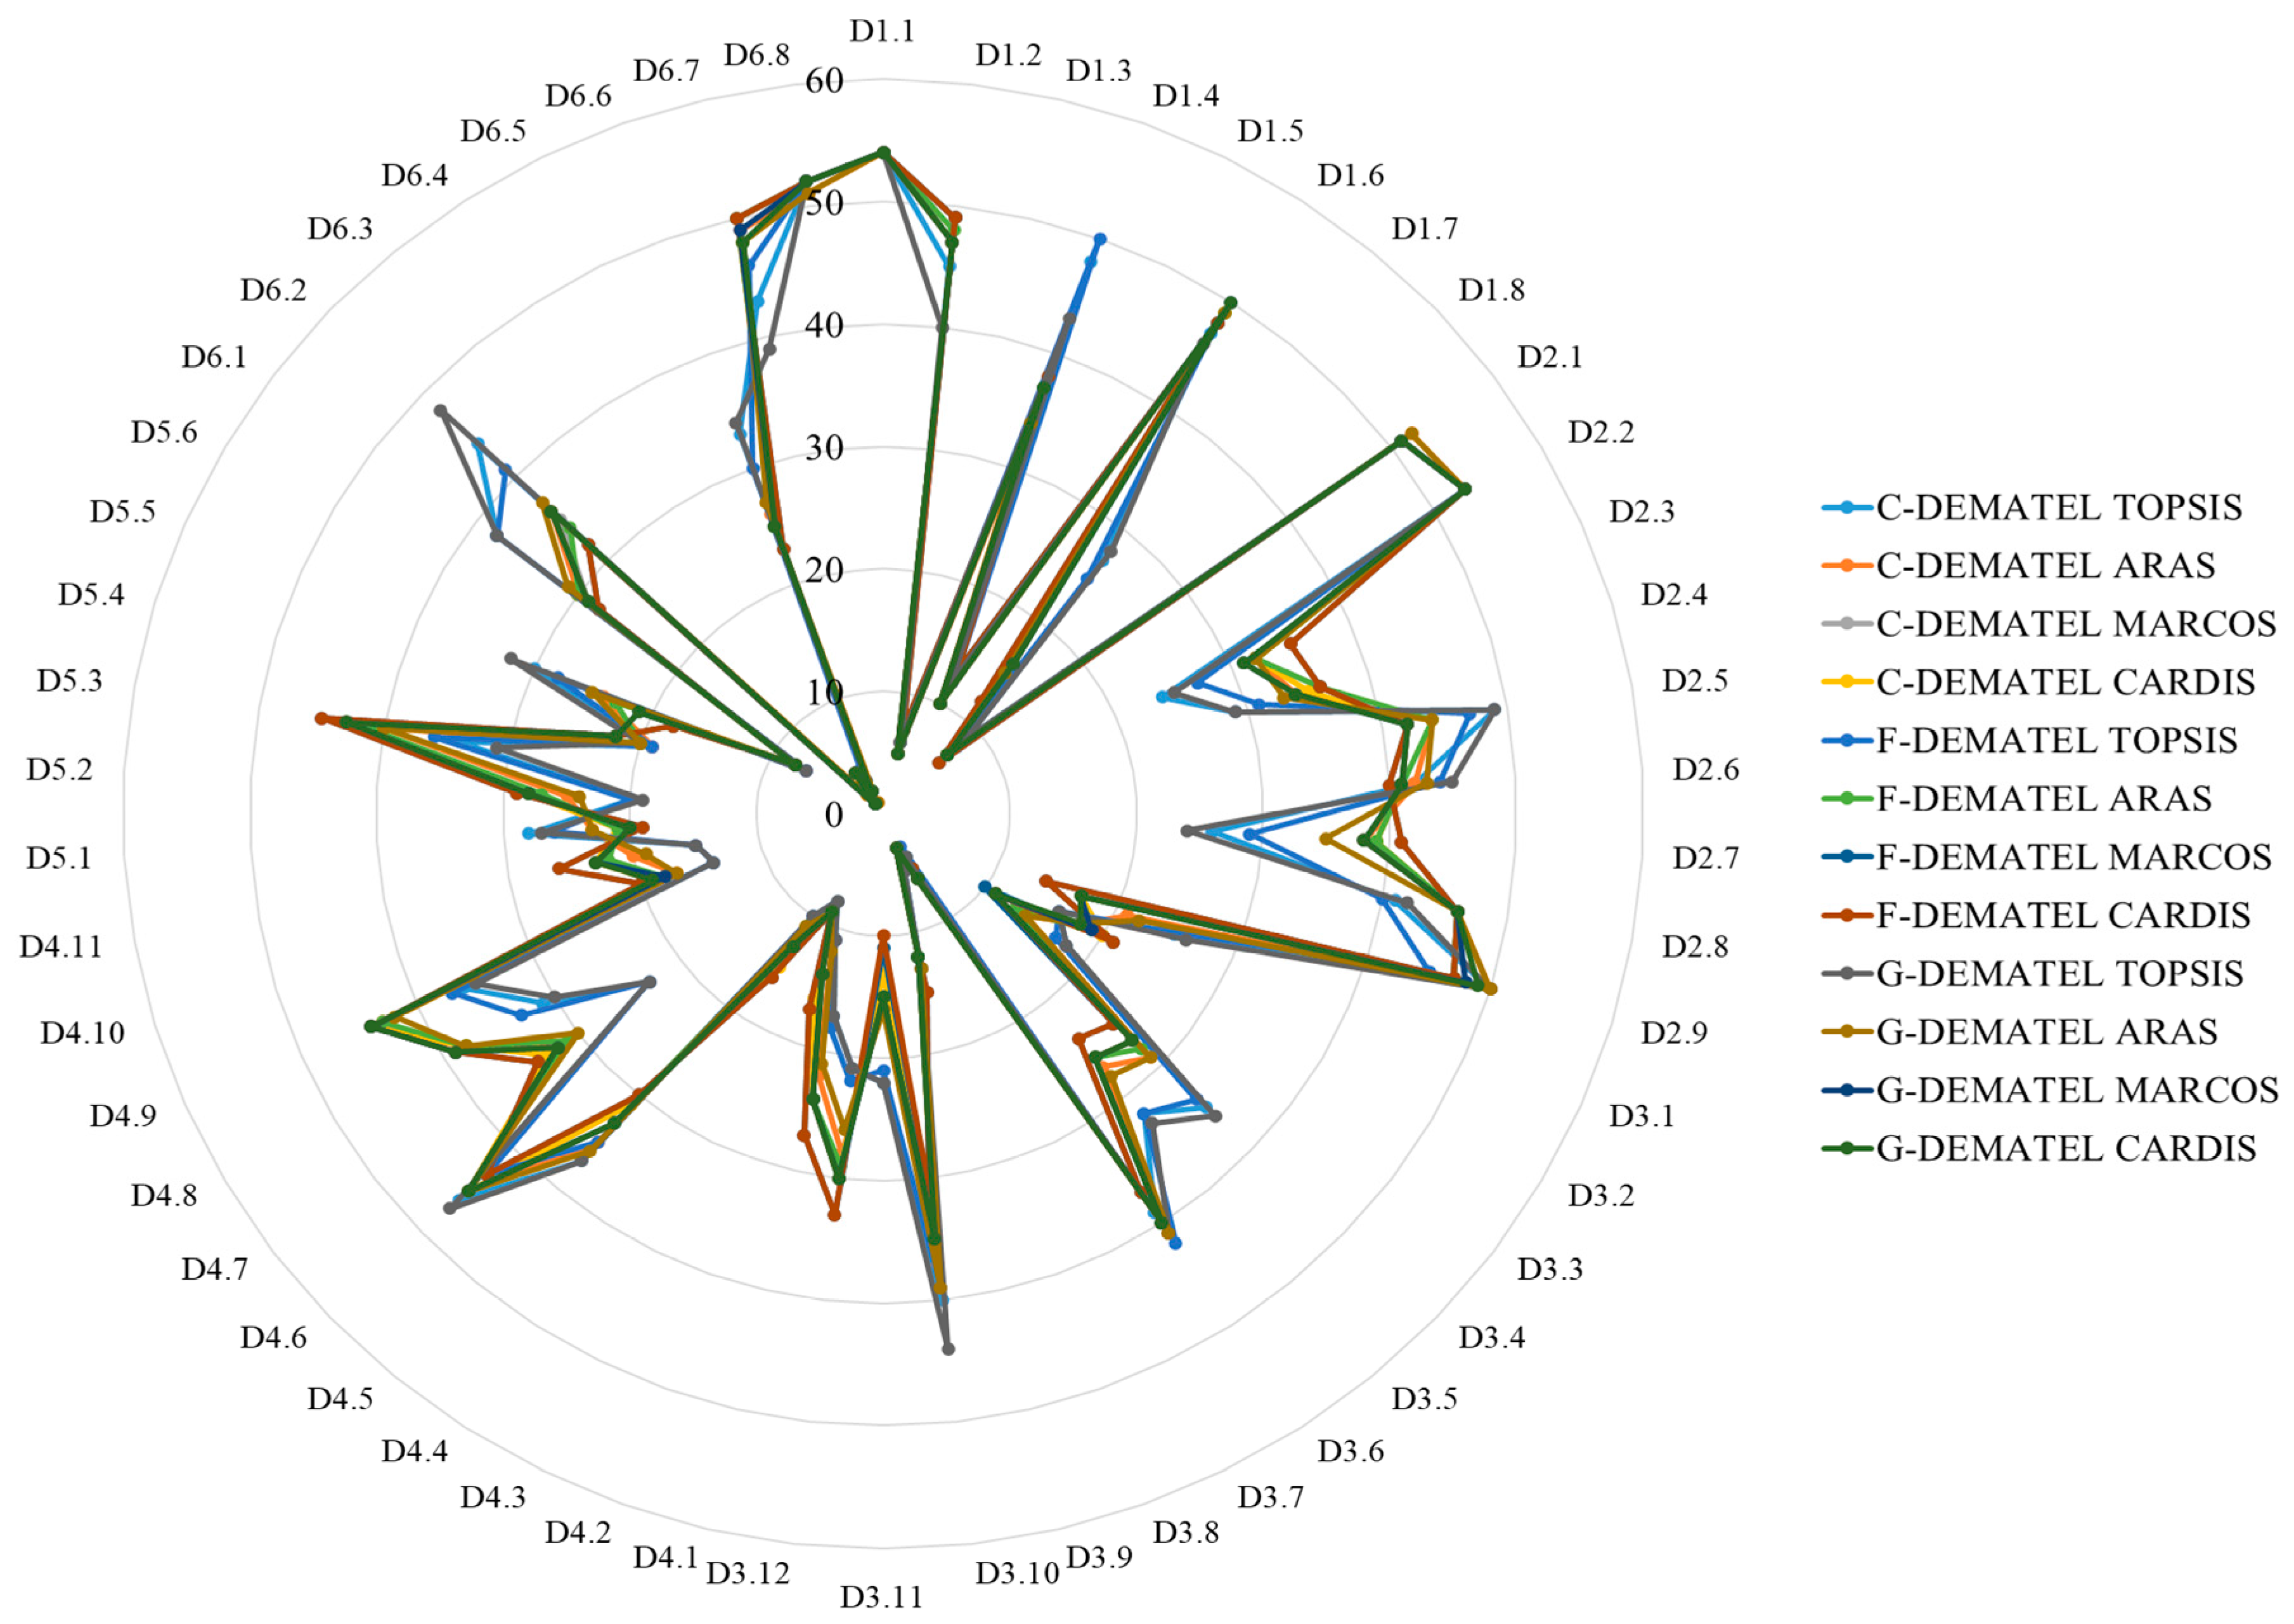
Table 4.
Scales for scoring criteria and alternatives.
| Linguistic variables | Scale numbers | ||
|---|---|---|---|
| Crisp | Fuzzy | Grey | |
| No influence (N) | 0 | [0,0,0] | [0,0] |
| Low influence (L) | 1 | [0,1,2] | [0,1] |
| Medium influence (M) | 2 | [1,2,3] | [1,2] |
| High influence (H) | 3 | [2,3,4] | [2,3] |
| Very high influence (VH) | 4 | [3,4,4] | [3,4] |
Table 5.
DEMATEL basic steps.
| Steps | C-DEMATEL | F-DEMATEL | G-DEMATEL |
|---|---|---|---|
| III.1. Construction of the initial matrix of direct links between the criteria |
where C – initial matrix of direct relations, aij - degree of influence of i-th criterion on j-th criterion |
where – initial fuzzy matrix of direct relations, – degree of influence of i-th criterion on j-th criterion, represented by triangular fuzzy numbers |
where G – the initial gray matrix of direct relations, ⊗gij – the gray number showing the degree of influence of the i-th criterion on the j-th criterion. If is the upper boundary of the gray number and is its lower boundary, then |
| III.2. Normalization of the direct relations matrix |
, where – normalized matrix of direct relations |
where – normalized fuzzy matrix of direct relations, It is considered that there is at least one value i such that where 3 – number of values defining the fuzzy number |
where – normalized matrix of direct relations, – respectively, the lower and upper limits of the gray number, n - criteria number |
| III.3. Calculation of the total matrix of direct relations |
where – total matrix of direct relations between criteria |
тoгда где – total fuzzy matrix of direct relations between criteria; – fuzzy numbers of the total relational matrix, , |
где – total matrix of direct relations between criteria, I – single matrix |
| III.4. Calculation of the number of relationships (Di+Ri) and forces of influence (Di–Ri) between criteria | The sum of rows and the sum of columns are denoted, respectively, as vectors D and R in the total relation matrix T and are calculated by the following formulas |
Compute and , where and is the sum of the rows and the sum of the columns in the overall fuzzy relations matrix . Then the fuzzy numbers are converted to absolute values | The sums of rows ⊗Ri and the sums of columns ⊗Di in the total relation matrix Tg is calculated by the following formulas |
| III.5. Building a network relationship map of the criteria. Ranking of criteria according to the values of weighting coefficients calculated based on the results of the assessment of the number of interrelationships (Di + Ri) and the strength of influence (Di – Ri) between the criteria | |||
Table 6.
Information about experts.
| № | Academic degree | Number of experts | Expert science interests | Work experience in the field of research |
|---|---|---|---|---|
| 1 | Professor, Doctor (Technical Science) | 1 | Supply chain management, Transport systems | 41 |
| 1 | Supply chain management, Logistics | 34 | ||
| 1 | Transport systems, Logistics | 18 | ||
| 2 | Assistant Professor (PhD) | 1 | Supply chain management | 17 |
| 1 | Transport systems, Warehouse systems | 17 |
Table 7.
Results of experts' assessment of the importance of criteria and sub-criteria of logistics flows.
Table 7.
Results of experts' assessment of the importance of criteria and sub-criteria of logistics flows.
| Criteria | C1 | C2 | C3 | C4 | C5 | |||||||||||||||||||||
|---|---|---|---|---|---|---|---|---|---|---|---|---|---|---|---|---|---|---|---|---|---|---|---|---|---|---|
| Experts | Ex1 | Ex2 | Ex3 | Ex4 | Ex5 | Ex1 | Ex2 | Ex3 | Ex4 | Ex5 | Ex1 | Ex2 | Ex3 | Ex4 | Ex5 | Ex1 | Ex2 | Ex3 | Ex4 | Ex5 | Ex1 | Ex2 | Ex3 | Ex4 | Ex5 | |
| Criteria | C1 | N | N | N | N | N | H | H | VH | H | H | H | H | VH | VH | VH | L | VH | M | M | M | VH | H | H | M | H |
| C2 | VH | H | L | VH | M | N | N | N | N | N | M | M | L | H | N | L | M | N | H | N | M | H | M | M | N | |
| C3 | VH | VH | VH | VH | H | H | VH | M | M | M | N | N | N | N | N | H | H | L | M | M | H | VH | H | L | M | |
| C4 | L | N | L | M | M | N | N | N | M | L | L | N | N | M | VH | N | N | N | N | N | L | N | N | M | L | |
| C5 | VH | VH | H | H | H | H | VH | M | H | VH | H | VH | H | M | L | H | VH | L | M | L | N | N | N | N | N | |
| Sub-criteria | C1.1 | C1.2 | C1.3 | C2.1 | C2.2 | |||||||||||||||||||||
| Experts | Ex1 | Ex2 | Ex3 | Ex4 | Ex5 | Ex1 | Ex2 | Ex3 | Ex4 | Ex5 | Ex1 | Ex2 | Ex3 | Ex4 | Ex5 | Ex1 | Ex2 | Ex3 | Ex4 | Ex5 | Ex1 | Ex2 | Ex3 | Ex4 | Ex5 | |
| Sub-criteria | C1.1 | N | N | N | N | N | M | M | VH | H | N | VH | VH | VH | VH | L | M | M | VH | L | N | L | H | VH | L | N |
| C1.2 | VH | VH | VH | H | VH | N | N | N | N | N | L | H | VH | H | N | M | H | VH | H | L | L | M | M | L | L | |
| C1.3 | H | H | VH | VH | VH | H | M | VH | H | H | N | N | N | N | N | L | VH | VH | H | H | L | H | VH | H | H | |
| C2.1 | H | VH | VH | H | L | VH | VH | VH | H | M | M | L | H | M | L | N | N | N | N | N | VH | VH | H | H | M | |
| C2.2 | M | H | L | L | N | H | H | L | L | H | M | L | H | M | H | H | VH | N | L | L | N | N | N | N | N | |
| C3.1 | VH | VH | H | H | VH | M | VH | M | H | H | L | L | N | L | M | L | H | VH | L | N | L | M | N | N | N | |
| C3.2 | H | H | H | H | VH | H | H | M | H | H | L | L | N | M | L | H | VH | L | M | N | M | M | N | L | N | |
| C3.3 | M | VH | L | L | M | H | VH | L | M | H | L | L | N | L | H | L | VH | M | L | L | M | M | N | L | M | |
| C4.1 | M | VH | L | L | M | H | VH | L | M | H | L | L | N | L | L | L | VH | M | M | M | L | VH | N | L | N | |
| C4.2 | L | VH | N | M | L | M | VH | M | H | M | L | L | N | L | M | M | H | M | H | L | M | H | N | M | N | |
| C4.3 | L | VH | L | L | M | M | VH | L | M | H | L | L | N | L | M | M | VH | L | M | N | H | H | N | L | N | |
| C4.4 | L | M | N | L | M | M | M | M | M | H | L | L | N | L | M | M | H | L | M | N | M | H | N | L | N | |
| C5.1 | H | VH | VH | VH | VH | H | VH | VH | VH | VH | H | H | N | M | M | VH | VH | VH | H | M | VH | VH | L | VH | H | |
| C5.2 | M | VH | VH | H | M | H | VH | L | VH | VH | M | M | N | M | VH | H | VH | M | VH | VH | M | VH | N | M | M | |
| C5.3 | M | L | M | H | L | M | VH | M | VH | L | L | H | N | L | L | H | VH | H | VH | L | M | VH | N | H | M | |
| Sub-criteria | C3.1 | C3.2 | C3.3 | C4.1 | C4.2 | |||||||||||||||||||||
| Experts | Ex1 | Ex2 | Ex3 | Ex4 | Ex5 | Ex1 | Ex2 | Ex3 | Ex4 | Ex5 | Ex1 | Ex2 | Ex3 | Ex4 | Ex5 | Ex1 | Ex2 | Ex3 | Ex4 | Ex5 | Ex1 | Ex2 | Ex3 | Ex4 | Ex5 | |
| Sub-criteria | C1.1 | M | H | VH | M | N | M | H | M | M | N | M | H | M | M | N | L | H | L | M | N | L | H | N | L | N |
| C1.2 | H | H | M | M | M | H | H | L | H | M | L | M | L | L | L | L | L | N | M | L | L | L | N | M | N | |
| C1.3 | M | M | H | M | VH | M | M | L | M | H | M | H | L | M | M | L | L | M | L | M | L | L | M | M | M | |
| C2.1 | L | L | M | L | N | L | L | L | H | N | L | H | L | M | N | L | VH | N | M | N | L | H | N | H | N | |
| C2.2 | L | N | N | L | N | L | N | N | L | N | L | N | N | L | N | L | N | N | L | N | L | N | N | L | N | |
| C3.1 | N | N | N | N | N | M | H | N | VH | L | M | H | N | L | L | L | L | L | M | L | M | N | N | H | N | |
| C3.2 | L | H | N | M | N | N | N | N | N | N | M | H | L | M | L | M | VH | L | H | M | L | VH | N | H | N | |
| C3.3 | M | H | H | L | M | VH | VH | H | M | H | N | N | N | N | N | L | VH | VH | M | M | L | VH | H | H | M | |
| C4.1 | L | H | L | M | L | H | VH | H | H | H | H | VH | L | H | L | N | N | N | N | N | M | VH | N | H | N | |
| C4.2 | H | H | H | M | M | M | VH | H | H | H | M | VH | M | H | VH | M | VH | M | M | H | N | N | N | N | N | |
| C4.3 | M | H | N | M | N | M | VH | L | H | N | M | VH | L | H | M | M | VH | VH | H | M | M | VH | L | H | H | |
| C4.4 | M | M | H | L | N | M | VH | H | M | N | M | VH | M | M | M | M | VH | M | M | L | H | VH | H | M | VH | |
| C5.1 | H | H | L | H | L | M | VH | H | H | L | H | H | L | H | L | M | VH | L | M | M | L | VH | N | VH | M | |
| C5.2 | M | VH | N | M | N | VH | VH | VH | VH | N | H | H | M | H | M | M | H | L | M | VH | L | M | N | H | L | |
| C5.3 | M | H | N | H | M | H | VH | VH | H | H | M | VH | L | H | N | M | VH | L | M | L | L | H | N | M | L | |
| Sub-criteria | C4.3 | C4.4 | C5.1 | C5.2 | C5.3 | |||||||||||||||||||||
| Experts | Ex1 | Ex2 | Ex3 | Ex4 | Ex5 | Ex1 | Ex2 | Ex3 | Ex4 | Ex5 | Ex1 | Ex2 | Ex3 | Ex4 | Ex5 | Ex1 | Ex2 | Ex3 | Ex4 | Ex5 | Ex1 | Ex2 | Ex3 | Ex4 | Ex5 | |
| Sub-criteria | C1.1 | L | H | N | L | N | L | H | N | L | N | M | VH | H | M | M | L | H | L | M | M | L | L | N | L | N |
| C1.2 | L | L | N | L | L | L | L | N | L | L | L | L | H | H | N | L | L | L | H | L | L | L | N | L | N | |
| C1.3 | M | M | L | L | M | L | L | N | L | M | L | L | H | M | H | M | M | M | H | H | L | L | L | M | L | |
| C2.1 | M | VH | N | H | N | M | H | L | H | N | H | L | VH | M | N | M | L | H | M | N | M | L | L | L | N | |
| C2.2 | L | N | N | L | N | L | N | N | L | N | L | N | N | L | N | L | N | N | L | N | L | N | N | L | N | |
| C3.1 | L | L | L | M | L | L | L | L | M | L | M | M | L | L | N | L | H | L | M | N | L | H | N | M | N | |
| C3.2 | L | VH | N | H | N | L | VH | N | H | N | L | L | L | L | N | H | M | VH | L | N | M | M | VH | L | N | |
| C3.3 | L | VH | VH | M | L | L | VH | H | M | L | L | L | M | L | N | M | H | VH | L | H | M | L | M | L | N | |
| C4.1 | M | VH | N | M | N | L | H | L | H | L | L | L | H | L | N | M | L | M | H | L | L | N | N | L | N | |
| C4.2 | L | H | L | H | M | M | VH | L | H | M | L | H | N | M | L | L | M | L | H | M | L | L | L | M | N | |
| C4.3 | N | N | N | N | N | L | M | L | H | L | L | L | H | H | N | H | M | L | H | M | M | M | N | L | N | |
| C4.4 | L | M | M | M | M | N | N | N | N | N | L | L | L | M | L | L | H | M | M | L | M | M | L | L | N | |
| C5.1 | H | VH | L | M | M | M | H | L | H | M | N | N | N | N | N | VH | H | M | H | VH | L | N | N | L | H | |
| C5.2 | H | M | M | M | L | L | H | M | H | L | L | N | N | H | N | N | N | N | N | N | L | N | N | L | N | |
| C5.3 | M | M | N | M | N | M | M | N | M | N | L | N | N | M | M | VH | M | M | H | L | N | N | N | N | N | |
Table 8.
Averaged results of SSC driver's expert assessment.
| Supply chain elements | Drivers | Sub-criteria | ||||||||||||||
|---|---|---|---|---|---|---|---|---|---|---|---|---|---|---|---|---|
| C1.1 | C1.2 | C1.3 | C2.1 | C2.2 | C3.1 | C3.2 | C3.3 | C4.1 | C4.2 | C4.3 | C4.4 | C5.1 | C5.2 | C5.3 | ||
| Input element | D1.1 | 3.10 | 4.00 | 1.78 | 2.70 | 3.76 | 1.00 | 1.00 | 1.15 | 1.15 | 2.70 | 2.05 | 2.64 | 2.17 | 1.89 | 2.76 |
| D1.2 | 3.81 | 4.32 | 2.05 | 3.59 | 4.32 | 1.52 | 1.52 | 1.43 | 1.32 | 2.70 | 2.17 | 2.49 | 3.29 | 2.55 | 2.72 | |
| D1.3 | 4.13 | 4.37 | 2.41 | 3.29 | 3.10 | 3.90 | 4.32 | 4.32 | 4.13 | 3.37 | 3.57 | 3.57 | 2.86 | 3.10 | 2.86 | |
| D1.4 | 2.55 | 2.70 | 1.74 | 2.22 | 3.64 | 2.35 | 2.40 | 2.09 | 1.89 | 2.22 | 2.05 | 2.17 | 1.64 | 2.17 | 4.18 | |
| D1.5 | 3.90 | 4.32 | 1.74 | 3.52 | 3.13 | 3.57 | 4.32 | 4.18 | 3.81 | 2.86 | 3.37 | 3.00 | 2.17 | 2.76 | 4.78 | |
| D1.6 | 3.10 | 4.00 | 2.35 | 2.70 | 4.13 | 1.64 | 1.32 | 1.64 | 1.52 | 2.70 | 2.49 | 2.49 | 2.55 | 2.35 | 2.14 | |
| D1.7 | 2.05 | 2.55 | 1.89 | 2.00 | 1.82 | 1.89 | 1.43 | 1.52 | 1.43 | 1.93 | 1.32 | 1.32 | 1.32 | 1.43 | 1.55 | |
| D1.8 | 2.70 | 3.10 | 2.70 | 2.35 | 2.05 | 2.93 | 3.29 | 2.95 | 2.40 | 2.17 | 1.89 | 2.05 | 1.52 | 2.14 | 1.43 | |
| Processing element | D2.1 | 3.39 | 4.57 | 2.61 | 3.47 | 3.31 | 1.38 | 1.15 | 1.15 | 1.52 | 2.35 | 1.93 | 2.05 | 2.05 | 2.17 | 1.89 |
| D2.2 | 3.13 | 4.32 | 2.35 | 3.39 | 4.32 | 1.15 | 1.32 | 1.32 | 1.64 | 2.22 | 2.05 | 2.05 | 2.76 | 2.05 | 2.27 | |
| D2.3 | 3.10 | 3.57 | 3.98 | 3.59 | 4.78 | 1.74 | 1.74 | 1.78 | 1.89 | 1.78 | 1.78 | 1.64 | 2.35 | 2.22 | 2.05 | |
| D2.4 | 3.29 | 3.95 | 3.98 | 3.98 | 4.32 | 1.52 | 1.52 | 1.43 | 1.64 | 1.52 | 1.43 | 1.64 | 2.49 | 2.17 | 2.05 | |
| D2.5 | 2.86 | 3.18 | 3.98 | 3.59 | 5.00 | 1.15 | 1.32 | 1.32 | 1.32 | 1.43 | 1.32 | 1.32 | 1.52 | 1.89 | 1.89 | |
| D2.6 | 2.55 | 3.18 | 3.64 | 3.39 | 4.51 | 1.52 | 1.15 | 1.64 | 1.52 | 1.32 | 1.15 | 1.52 | 1.64 | 1.74 | 1.74 | |
| D2.7 | 3.68 | 3.90 | 3.18 | 3.44 | 4.08 | 1.15 | 1.32 | 2.55 | 2.22 | 2.70 | 2.22 | 2.70 | 3.29 | 2.49 | 2.76 | |
| D2.8 | 2.35 | 3.95 | 2.83 | 3.10 | 2.86 | 1.52 | 1.52 | 1.78 | 1.78 | 1.74 | 1.64 | 1.64 | 1.52 | 1.52 | 1.52 | |
| D2.9 | 2.70 | 3.57 | 1.32 | 2.83 | 3.13 | 1.32 | 1.32 | 2.00 | 1.74 | 1.52 | 1.52 | 1.64 | 1.52 | 1.64 | 1.32 | |
| Transport element | D3.1 | 1.74 | 3.10 | 4.37 | 2.72 | 2.40 | 1.15 | 1.15 | 1.15 | 1.15 | 1.15 | 1.15 | 1.15 | 1.32 | 1.15 | 1.15 |
| D3.2 | 2.49 | 3.95 | 4.57 | 3.81 | 3.39 | 2.27 | 2.05 | 2.09 | 2.00 | 1.89 | 1.78 | 1.64 | 2.35 | 2.35 | 1.78 | |
| D3.3 | 1.74 | 2.70 | 4.08 | 2.46 | 2.83 | 1.43 | 1.74 | 1.74 | 1.52 | 1.52 | 1.52 | 1.52 | 2.17 | 2.49 | 1.82 | |
| D3.4 | 3.25 | 3.68 | 4.13 | 4.37 | 4.32 | 1.52 | 1.32 | 1.43 | 1.15 | 1.15 | 1.15 | 1.15 | 1.43 | 1.32 | 1.15 | |
| D3.5 | 2.00 | 2.83 | 3.95 | 3.37 | 3.95 | 1.74 | 1.43 | 1.74 | 1.32 | 1.15 | 1.15 | 1.15 | 1.15 | 1.15 | 1.15 | |
| D3.6 | 2.35 | 3.06 | 3.95 | 3.73 | 4.78 | 1.58 | 1.52 | 1.52 | 1.43 | 1.52 | 1.32 | 1.32 | 1.43 | 1.43 | 1.32 | |
| D3.7 | 3.59 | 4.08 | 4.37 | 3.18 | 3.10 | 3.13 | 3.25 | 3.13 | 2.99 | 2.22 | 2.35 | 2.05 | 1.74 | 3.59 | 1.82 | |
| D3.8 | 4.32 | 3.90 | 2.40 | 4.13 | 3.13 | 3.44 | 3.98 | 3.98 | 3.98 | 3.81 | 3.81 | 3.44 | 3.73 | 3.98 | 2.40 | |
| D3.9 | 2.49 | 2.86 | 2.35 | 2.49 | 2.40 | 3.17 | 2.61 | 2.27 | 2.61 | 2.61 | 2.46 | 2.61 | 2.35 | 2.30 | 2.17 | |
| D3.10 | 2.09 | 2.67 | 1.78 | 2.70 | 3.64 | 1.52 | 1.64 | 1.74 | 1.32 | 1.32 | 1.32 | 1.32 | 1.32 | 1.32 | 1.15 | |
| D3.11 | 2.49 | 2.83 | 3.68 | 3.95 | 3.39 | 3.68 | 1.32 | 1.32 | 1.52 | 1.15 | 1.15 | 1.15 | 1.32 | 1.32 | 1.15 | |
| D3.12 | 3.39 | 3.68 | 3.39 | 4.32 | 4.51 | 2.55 | 2.70 | 2.86 | 2.49 | 2.49 | 2.30 | 2.17 | 1.89 | 2.55 | 2.72 | |
| Cumulate element | D4.1 | 2.99 | 2.99 | 2.61 | 3.17 | 3.44 | 2.64 | 2.55 | 2.83 | 2.22 | 2.49 | 2.35 | 2.17 | 1.52 | 2.93 | 2.67 |
| D4.2 | 3.25 | 3.52 | 1.89 | 3.52 | 3.73 | 2.67 | 3.90 | 3.44 | 3.44 | 2.27 | 2.61 | 2.37 | 1.78 | 4.13 | 3.98 | |
| D4.3 | 2.99 | 3.64 | 2.41 | 3.29 | 2.86 | 2.22 | 3.44 | 4.08 | 3.31 | 3.47 | 3.31 | 3.47 | 3.31 | 3.47 | 3.10 | |
| D4.4 | 2.17 | 3.59 | 2.05 | 3.57 | 3.10 | 1.89 | 3.73 | 3.10 | 3.59 | 3.25 | 3.17 | 2.70 | 3.57 | 3.81 | 2.00 | |
| D4.5 | 2.35 | 2.70 | 3.02 | 3.31 | 3.90 | 1.64 | 1.64 | 1.32 | 1.32 | 1.43 | 1.32 | 1.32 | 1.15 | 1.89 | 1.32 | |
| D4.6 | 3.31 | 4.08 | 2.27 | 3.39 | 3.59 | 1.58 | 1.58 | 1.82 | 1.58 | 1.52 | 1.52 | 1.52 | 1.32 | 1.82 | 1.58 | |
| D4.7 | 2.86 | 3.25 | 3.31 | 4.08 | 4.57 | 2.17 | 2.35 | 1.89 | 2.00 | 1.74 | 2.00 | 1.89 | 1.74 | 2.35 | 1.52 | |
| D4.8 | 2.35 | 2.70 | 3.31 | 3.59 | 4.51 | 1.64 | 1.78 | 1.74 | 1.74 | 1.89 | 1.74 | 1.52 | 1.52 | 2.55 | 1.64 | |
| D4.9 | 3.29 | 3.44 | 2.51 | 3.90 | 4.32 | 1.97 | 1.97 | 1.64 | 2.30 | 2.27 | 2.17 | 1.78 | 2.40 | 2.14 | 1.64 | |
| D4.10 | 2.35 | 2.99 | 1.64 | 3.18 | 3.10 | 1.74 | 2.70 | 3.17 | 2.35 | 2.00 | 1.52 | 1.89 | 1.52 | 3.31 | 1.58 | |
| D4.11 | 2.40 | 3.10 | 2.05 | 3.44 | 3.52 | 2.00 | 2.49 | 3.03 | 2.17 | 2.14 | 1.82 | 1.82 | 1.58 | 3.44 | 1.55 | |
| Output element | D5.1 | 2.46 | 2.70 | 1.55 | 2.22 | 1.89 | 1.32 | 1.32 | 2.05 | 1.78 | 1.64 | 1.55 | 1.43 | 1.52 | 1.89 | 1.74 |
| D5.2 | 3.06 | 3.25 | 2.30 | 3.78 | 4.13 | 2.83 | 3.18 | 3.52 | 2.35 | 2.22 | 2.30 | 2.30 | 1.52 | 2.55 | 3.37 | |
| D5.3 | 2.86 | 3.57 | 2.35 | 3.64 | 3.44 | 2.17 | 1.52 | 2.70 | 2.35 | 2.61 | 1.89 | 2.00 | 2.64 | 2.05 | 2.61 | |
| D5.4 | 2.86 | 3.52 | 2.17 | 3.29 | 3.90 | 2.99 | 2.05 | 2.35 | 1.89 | 2.00 | 1.64 | 1.74 | 2.86 | 1.89 | 1.43 | |
| D5.5 | 1.89 | 2.17 | 1.89 | 2.05 | 3.68 | 1.64 | 1.52 | 1.52 | 1.32 | 1.32 | 1.32 | 1.32 | 1.64 | 1.89 | 1.52 | |
| D5.6 | 2.55 | 2.64 | 2.35 | 2.70 | 2.49 | 2.35 | 3.57 | 3.81 | 2.35 | 2.55 | 2.05 | 1.89 | 1.52 | 3.13 | 1.89 | |
| Control element | D6.1 | 2.35 | 2.30 | 2.14 | 3.03 | 3.81 | 1.64 | 1.52 | 1.93 | 1.32 | 1.25 | 1.15 | 1.32 | 1.78 | 1.55 | 1.89 |
| D6.2 | 2.05 | 2.77 | 1.64 | 2.64 | 3.59 | 1.64 | 1.52 | 1.89 | 1.32 | 1.15 | 1.15 | 1.32 | 1.64 | 1.43 | 1.64 | |
| D6.3 | 3.52 | 3.25 | 3.73 | 3.10 | 2.49 | 2.83 | 3.52 | 3.98 | 3.44 | 2.70 | 2.55 | 2.70 | 2.70 | 3.37 | 1.89 | |
| D6.4 | 3.44 | 3.73 | 4.08 | 3.29 | 3.29 | 3.52 | 3.73 | 3.76 | 3.59 | 3.44 | 3.03 | 3.03 | 2.55 | 3.90 | 2.86 | |
| D6.5 | 3.73 | 3.68 | 4.13 | 3.73 | 3.29 | 3.73 | 4.13 | 4.32 | 3.59 | 3.13 | 3.17 | 3.17 | 2.35 | 4.32 | 3.73 | |
| D6.6 | 2.35 | 2.35 | 1.32 | 2.17 | 2.93 | 1.89 | 1.74 | 1.64 | 1.52 | 1.43 | 1.43 | 1.43 | 1.15 | 1.15 | 1.15 | |
| D6.7 | 3.52 | 3.73 | 2.64 | 3.81 | 4.13 | 1.52 | 1.32 | 2.22 | 2.27 | 2.40 | 1.97 | 2.09 | 2.99 | 1.78 | 2.27 | |
| D6.8 | 3.10 | 3.95 | 2.30 | 3.48 | 3.90 | 1.64 | 1.32 | 1.78 | 2.05 | 2.40 | 2.17 | 2.00 | 2.61 | 2.05 | 2.35 | |
Table 9.
Results of the ranking of criteria and sub-criteria for the SSC drivers’ assessments.
| Criteria | Sub-criteria | Local weight | Global weight | ||||||||
|---|---|---|---|---|---|---|---|---|---|---|---|
| Crisp | Fuzzy | Grey | Crisp | Fuzzy | Grey | ||||||
| Economic (С1) | Profit (C1.1) | 0.241 | 0.345 | 0.233 | 0.345 | 0.244 | 0.351 | 0.083 | 0.081 | 0.086 | |
| Operating expenses (C1.2) | 0.316 | 0.318 | 0.311 | 0.076 | 0.074 | 0.076 | |||||
| Fixed investment (C1.3) | 0.338 | 0.336 | 0.337 | 0.082 | 0.078 | 0.083 | |||||
| Energy-ecological (С2) | The energy intensity (C2.1) | 0.190 | 0.521 | 0.192 | 0.500 | 0.189 | 0.500 | 0.099 | 0.096 | 0.095 | |
| Greenhouse gas emissions of CO2 (C2.2) | 0.478 | 0.500 | 0.500 | 0.091 | 0.096 | 0.095 | |||||
| Quality (С3) | Safety of cargo transportation (C3.1) | 0.220 | 0.292 | 0.215 | 0.304 | 0.221 | 0.288 | 0.064 | 0.066 | 0.064 | |
| Timeliness of cargo transportation (C3.2) | 0.348 | 0.345 | 0.351 | 0.077 | 0.075 | 0.078 | |||||
| The coefficient of flow controllability (C3.3) | 0.358 | 0.350 | 0.360 | 0.079 | 0.076 | 0.080 | |||||
| Statistical (С4) | The coefficient of flows irregularity (C4.1) | 0.135 | 0.247 | 0.147 | 0.246 | 0.130 | 0.247 | 0.034 | 0.036 | 0.032 | |
| The coefficient of complexity structure of flow (C4.2) | 0.266 | 0.263 | 0.267 | 0.036 | 0.039 | 0.035 | |||||
| The coefficient of flows discreteness (C.4.3) | 0.238 | 0.240 | 0.237 | 0.032 | 0.036 | 0.031 | |||||
| The coefficient of differentiability of flow (C4.4) | 0.247 | 0.249 | 0.246 | 0.034 | 0.037 | 0.032 | |||||
| Flow physical (С5) |
The mass (quantity) of flow (C5.1) | 0.212 | 0.329 | 0.211 | 0.326 | 0.213 | 0.330 | 0.070 | 0.069 | 0.071 | |
| The speed of flow (C5.2) | 0.397 | 0.385 | 0.404 | 0.085 | 0.081 | 0.086 | |||||
| The length of the route (C5.3) | 0.273 | 0.288 | 0.264 | 0.058 | 0.061 | 0.057 | |||||
Table 10.
Result of driver ranking by GRADIS method.
| Drivers | Method | |||||||||||||||||
|---|---|---|---|---|---|---|---|---|---|---|---|---|---|---|---|---|---|---|
| C-DEMATEL-CRADIS | F-DEMATEL-CRADIS | G-DEMATEL-CRADIS | ||||||||||||||||
| s+ | s- | K+ | K- | Q | Rank | s+ | s- | K+ | K- | Q | Rank | s+ | s- | K+ | K- | Q | Rank | |
| D1.1 | 0.995 | 0.348 | 0.487 | 0.405 | 0.446 | 54 | 0.953 | 0.339 | 0.466 | 0.400 | 0.433 | 54 | 0.937 | 0.355 | 0.453 | 0.409 | 0.431 | 54 |
| D1.2 | 0.951 | 0.392 | 0.510 | 0.456 | 0.483 | 49 | 0.911 | 0.381 | 0.487 | 0.449 | 0.468 | 49 | 0.891 | 0.401 | 0.476 | 0.462 | 0.469 | 47 |
| D1.3 | 0.810 | 0.533 | 0.599 | 0.621 | 0.610 | 6 | 0.775 | 0.517 | 0.572 | 0.609 | 0.591 | 7 | 0.745 | 0.546 | 0.569 | 0.629 | 0.599 | 5 |
| D1.4 | 0.925 | 0.419 | 0.525 | 0.488 | 0.506 | 37 | 0.885 | 0.408 | 0.502 | 0.480 | 0.491 | 38 | 0.866 | 0.426 | 0.490 | 0.491 | 0.490 | 37 |
| D1.5 | 0.862 | 0.481 | 0.563 | 0.561 | 0.562 | 10 | 0.826 | 0.466 | 0.537 | 0.550 | 0.543 | 13 | 0.798 | 0.494 | 0.531 | 0.569 | 0.550 | 10 |
| D1.6 | 0.951 | 0.392 | 0.510 | 0.457 | 0.483 | 48 | 0.911 | 0.381 | 0.487 | 0.449 | 0.468 | 48 | 0.892 | 0.400 | 0.476 | 0.461 | 0.468 | 50 |
| D1.7 | 0.871 | 0.472 | 0.557 | 0.550 | 0.554 | 14 | 0.823 | 0.469 | 0.539 | 0.553 | 0.546 | 12 | 0.813 | 0.478 | 0.521 | 0.551 | 0.536 | 16 |
| D1.8 | 0.815 | 0.529 | 0.595 | 0.616 | 0.606 | 7 | 0.773 | 0.520 | 0.574 | 0.613 | 0.594 | 6 | 0.754 | 0.538 | 0.563 | 0.620 | 0.591 | 7 |
| D2.1 | 0.968 | 0.375 | 0.501 | 0.437 | 0.469 | 51 | 0.925 | 0.367 | 0.480 | 0.433 | 0.456 | 51 | 0.908 | 0.384 | 0.467 | 0.442 | 0.455 | 51 |
| D2.2 | 0.980 | 0.363 | 0.495 | 0.423 | 0.459 | 53 | 0.939 | 0.353 | 0.473 | 0.417 | 0.445 | 53 | 0.921 | 0.371 | 0.461 | 0.428 | 0.444 | 53 |
| D2.3 | 0.917 | 0.426 | 0.529 | 0.497 | 0.513 | 32 | 0.877 | 0.416 | 0.506 | 0.490 | 0.498 | 35 | 0.857 | 0.434 | 0.495 | 0.501 | 0.498 | 31 |
| D2.4 | 0.920 | 0.423 | 0.527 | 0.493 | 0.510 | 35 | 0.878 | 0.415 | 0.506 | 0.489 | 0.497 | 36 | 0.860 | 0.431 | 0.493 | 0.497 | 0.495 | 34 |
| D2.5 | 0.935 | 0.408 | 0.519 | 0.475 | 0.497 | 42 | 0.891 | 0.401 | 0.498 | 0.473 | 0.485 | 42 | 0.877 | 0.414 | 0.483 | 0.477 | 0.480 | 42 |
| D2.6 | 0.930 | 0.413 | 0.521 | 0.481 | 0.501 | 41 | 0.885 | 0.407 | 0.501 | 0.480 | 0.490 | 40 | 0.872 | 0.419 | 0.486 | 0.483 | 0.485 | 41 |
| D2.7 | 0.929 | 0.414 | 0.522 | 0.483 | 0.502 | 39 | 0.891 | 0.401 | 0.498 | 0.473 | 0.485 | 41 | 0.867 | 0.424 | 0.489 | 0.489 | 0.489 | 38 |
| D2.8 | 0.947 | 0.396 | 0.512 | 0.461 | 0.487 | 46 | 0.902 | 0.390 | 0.492 | 0.460 | 0.476 | 46 | 0.888 | 0.403 | 0.477 | 0.465 | 0.471 | 46 |
| D2.9 | 0.949 | 0.394 | 0.511 | 0.459 | 0.485 | 47 | 0.904 | 0.389 | 0.491 | 0.458 | 0.475 | 47 | 0.891 | 0.400 | 0.476 | 0.461 | 0.469 | 49 |
| D3.1 | 0.877 | 0.467 | 0.553 | 0.544 | 0.548 | 17 | 0.827 | 0.465 | 0.537 | 0.548 | 0.542 | 14 | 0.820 | 0.471 | 0.517 | 0.543 | 0.530 | 17 |
| D3.2 | 0.887 | 0.456 | 0.547 | 0.532 | 0.539 | 20 | 0.846 | 0.447 | 0.525 | 0.526 | 0.526 | 21 | 0.826 | 0.465 | 0.513 | 0.536 | 0.525 | 18 |
| D3.3 | 0.862 | 0.481 | 0.562 | 0.560 | 0.561 | 11 | 0.820 | 0.473 | 0.541 | 0.557 | 0.549 | 10 | 0.804 | 0.487 | 0.527 | 0.562 | 0.544 | 11 |
| D3.4 | 0.899 | 0.444 | 0.540 | 0.518 | 0.529 | 27 | 0.851 | 0.441 | 0.521 | 0.520 | 0.521 | 25 | 0.841 | 0.450 | 0.504 | 0.519 | 0.511 | 27 |
| D3.5 | 0.897 | 0.446 | 0.541 | 0.520 | 0.530 | 26 | 0.849 | 0.443 | 0.523 | 0.522 | 0.522 | 24 | 0.841 | 0.451 | 0.504 | 0.520 | 0.512 | 26 |
| D3.6 | 0.929 | 0.414 | 0.522 | 0.483 | 0.502 | 40 | 0.884 | 0.408 | 0.502 | 0.481 | 0.492 | 37 | 0.872 | 0.420 | 0.486 | 0.484 | 0.485 | 40 |
| D3.7 | 0.808 | 0.535 | 0.600 | 0.623 | 0.612 | 5 | 0.771 | 0.521 | 0.575 | 0.614 | 0.595 | 5 | 0.746 | 0.546 | 0.568 | 0.629 | 0.599 | 6 |
| D3.8 | 0.798 | 0.545 | 0.608 | 0.636 | 0.622 | 3 | 0.764 | 0.529 | 0.581 | 0.623 | 0.602 | 3 | 0.732 | 0.559 | 0.579 | 0.645 | 0.612 | 3 |
| D3.9 | 0.868 | 0.475 | 0.559 | 0.554 | 0.556 | 12 | 0.828 | 0.465 | 0.536 | 0.548 | 0.542 | 15 | 0.807 | 0.485 | 0.526 | 0.559 | 0.542 | 12 |
| D3.10 | 0.919 | 0.424 | 0.528 | 0.494 | 0.511 | 34 | 0.872 | 0.421 | 0.509 | 0.496 | 0.502 | 31 | 0.863 | 0.429 | 0.491 | 0.494 | 0.493 | 35 |
| D3.11 | 0.869 | 0.474 | 0.558 | 0.552 | 0.555 | 13 | 0.820 | 0.472 | 0.541 | 0.556 | 0.549 | 11 | 0.812 | 0.480 | 0.522 | 0.553 | 0.538 | 15 |
| D3.12 | 0.913 | 0.430 | 0.531 | 0.502 | 0.516 | 30 | 0.875 | 0.417 | 0.507 | 0.492 | 0.500 | 33 | 0.851 | 0.441 | 0.498 | 0.508 | 0.503 | 30 |
| D4.1 | 0.896 | 0.448 | 0.542 | 0.522 | 0.532 | 24 | 0.857 | 0.435 | 0.518 | 0.513 | 0.516 | 27 | 0.834 | 0.457 | 0.508 | 0.527 | 0.517 | 24 |
| D4.2 | 0.873 | 0.470 | 0.555 | 0.547 | 0.551 | 16 | 0.837 | 0.455 | 0.530 | 0.536 | 0.533 | 17 | 0.811 | 0.481 | 0.523 | 0.554 | 0.539 | 14 |
| D4.3 | 0.851 | 0.493 | 0.570 | 0.574 | 0.572 | 9 | 0.816 | 0.477 | 0.544 | 0.562 | 0.553 | 9 | 0.787 | 0.505 | 0.539 | 0.582 | 0.560 | 9 |
| D4.4 | 0.873 | 0.470 | 0.556 | 0.548 | 0.552 | 15 | 0.836 | 0.456 | 0.531 | 0.538 | 0.534 | 16 | 0.810 | 0.482 | 0.523 | 0.555 | 0.539 | 13 |
| D4.5 | 0.917 | 0.426 | 0.529 | 0.497 | 0.513 | 31 | 0.871 | 0.421 | 0.510 | 0.497 | 0.503 | 30 | 0.860 | 0.432 | 0.493 | 0.498 | 0.496 | 33 |
| D4.6 | 0.944 | 0.400 | 0.514 | 0.466 | 0.490 | 45 | 0.899 | 0.393 | 0.494 | 0.464 | 0.479 | 43 | 0.885 | 0.407 | 0.479 | 0.469 | 0.474 | 45 |
| D4.7 | 0.918 | 0.426 | 0.529 | 0.496 | 0.512 | 33 | 0.876 | 0.416 | 0.506 | 0.490 | 0.498 | 34 | 0.858 | 0.434 | 0.494 | 0.500 | 0.497 | 32 |
| D4.8 | 0.926 | 0.417 | 0.523 | 0.486 | 0.504 | 38 | 0.885 | 0.408 | 0.502 | 0.480 | 0.491 | 39 | 0.868 | 0.424 | 0.489 | 0.488 | 0.489 | 39 |
| D4.9 | 0.940 | 0.403 | 0.516 | 0.470 | 0.493 | 44 | 0.899 | 0.393 | 0.494 | 0.464 | 0.479 | 44 | 0.880 | 0.412 | 0.482 | 0.475 | 0.478 | 44 |
| D4.10 | 0.887 | 0.456 | 0.547 | 0.532 | 0.539 | 19 | 0.846 | 0.447 | 0.525 | 0.527 | 0.526 | 20 | 0.827 | 0.465 | 0.513 | 0.536 | 0.524 | 19 |
| D4.11 | 0.892 | 0.451 | 0.544 | 0.525 | 0.534 | 23 | 0.852 | 0.441 | 0.521 | 0.519 | 0.520 | 26 | 0.832 | 0.459 | 0.510 | 0.530 | 0.520 | 23 |
| D5.1 | 0.887 | 0.456 | 0.547 | 0.531 | 0.539 | 21 | 0.841 | 0.451 | 0.528 | 0.532 | 0.530 | 19 | 0.828 | 0.463 | 0.512 | 0.534 | 0.523 | 20 |
| D5.2 | 0.907 | 0.436 | 0.534 | 0.508 | 0.521 | 28 | 0.869 | 0.423 | 0.511 | 0.499 | 0.505 | 29 | 0.846 | 0.446 | 0.501 | 0.514 | 0.507 | 28 |
| D5.3 | 0.940 | 0.403 | 0.516 | 0.470 | 0.493 | 43 | 0.899 | 0.393 | 0.494 | 0.463 | 0.478 | 45 | 0.879 | 0.412 | 0.482 | 0.475 | 0.479 | 43 |
| D5.4 | 0.889 | 0.454 | 0.545 | 0.529 | 0.537 | 22 | 0.846 | 0.446 | 0.524 | 0.526 | 0.525 | 22 | 0.830 | 0.462 | 0.511 | 0.532 | 0.522 | 22 |
| D5.5 | 0.885 | 0.458 | 0.548 | 0.534 | 0.541 | 18 | 0.840 | 0.453 | 0.529 | 0.534 | 0.531 | 18 | 0.830 | 0.462 | 0.511 | 0.532 | 0.522 | 21 |
| D5.6 | 0.823 | 0.520 | 0.589 | 0.606 | 0.598 | 8 | 0.784 | 0.508 | 0.566 | 0.599 | 0.583 | 8 | 0.762 | 0.530 | 0.557 | 0.611 | 0.584 | 8 |
| D6.1 | 0.908 | 0.435 | 0.534 | 0.507 | 0.521 | 29 | 0.862 | 0.431 | 0.515 | 0.507 | 0.511 | 28 | 0.851 | 0.441 | 0.498 | 0.508 | 0.503 | 29 |
| D6.2 | 0.920 | 0.423 | 0.527 | 0.493 | 0.510 | 36 | 0.873 | 0.420 | 0.509 | 0.494 | 0.501 | 32 | 0.864 | 0.428 | 0.491 | 0.493 | 0.492 | 36 |
| D6.3 | 0.780 | 0.564 | 0.622 | 0.657 | 0.639 | 1 | 0.744 | 0.549 | 0.597 | 0.647 | 0.622 | 1 | 0.716 | 0.576 | 0.592 | 0.664 | 0.628 | 1 |
| D6.4 | 0.802 | 0.541 | 0.605 | 0.630 | 0.618 | 4 | 0.768 | 0.524 | 0.578 | 0.618 | 0.598 | 4 | 0.738 | 0.553 | 0.574 | 0.638 | 0.606 | 4 |
| D6.5 | 0.782 | 0.561 | 0.620 | 0.654 | 0.637 | 2 | 0.749 | 0.543 | 0.592 | 0.640 | 0.616 | 2 | 0.717 | 0.574 | 0.591 | 0.662 | 0.626 | 2 |
| D6.6 | 0.896 | 0.447 | 0.541 | 0.521 | 0.531 | 25 | 0.849 | 0.443 | 0.523 | 0.522 | 0.522 | 23 | 0.840 | 0.452 | 0.505 | 0.521 | 0.513 | 25 |
| D6.7 | 0.952 | 0.391 | 0.509 | 0.456 | 0.482 | 50 | 0.912 | 0.380 | 0.487 | 0.448 | 0.467 | 50 | 0.891 | 0.400 | 0.476 | 0.461 | 0.469 | 48 |
| D6.8 | 0.970 | 0.374 | 0.500 | 0.435 | 0.468 | 52 | 0.929 | 0.364 | 0.478 | 0.429 | 0.453 | 52 | 0.909 | 0.382 | 0.466 | 0.441 | 0.453 | 52 |
| s0 | 0.485 | 0.858 | 0.444 | 0.849 | 0.424 | 0.867 | ||||||||||||
Table 11.
Ranks of SSC drivers according to the results of different MCDM methods.
| Supply chain elements |
Drivers | C-DEMATEL TOPSIS | C-DEMATEL ARAS | C-DEMATEL MARCOS | C-DEMATEL CARDIS | F-DEMATEL TOPSIS | F-DEMATEL ARAS | F-DEMATEL MARCOS | F-DEMATEL CARDIS | G-DEMATEL TOPSIS | G-DEMATEL ARAS | G-DEMATEL MARCOS | G-DEMATEL CARDIS |
|---|---|---|---|---|---|---|---|---|---|---|---|---|---|
| Input element | D1.1 | 54 | 54 | 54 | 54 | 54 | 54 | 54 | 54 | 54 | 54 | 54 | 54 |
| D1.2 | 45 | 47 | 49 | 49 | 49 | 48 | 49 | 49 | 40 | 47 | 47 | 47 | |
| D1.3 | 6 | 5 | 6 | 6 | 6 | 5 | 7 | 7 | 6 | 5 | 5 | 5 | |
| D1.4 | 48 | 33 | 37 | 37 | 50 | 37 | 38 | 38 | 43 | 34 | 37 | 37 | |
| D1.5 | 12 | 10 | 10 | 10 | 13 | 10 | 13 | 13 | 12 | 10 | 10 | 10 | |
| D1.6 | 47 | 48 | 48 | 48 | 48 | 49 | 48 | 48 | 46 | 49 | 50 | 50 | |
| D1.7 | 27 | 16 | 14 | 14 | 25 | 16 | 12 | 12 | 28 | 15 | 16 | 16 | |
| D1.8 | 9 | 7 | 7 | 7 | 8 | 7 | 6 | 6 | 9 | 7 | 7 | 7 | |
| Processing element | D2.1 | 51 | 52 | 51 | 51 | 51 | 51 | 51 | 51 | 51 | 52 | 51 | 51 |
| D2.2 | 53 | 53 | 53 | 53 | 53 | 53 | 53 | 53 | 53 | 53 | 53 | 53 | |
| D2.3 | 24 | 32 | 32 | 32 | 27 | 32 | 35 | 35 | 25 | 32 | 31 | 31 | |
| D2.4 | 29 | 34 | 36 | 35 | 31 | 36 | 36 | 36 | 29 | 33 | 34 | 34 | |
| D2.5 | 49 | 44 | 42 | 42 | 47 | 44 | 42 | 42 | 49 | 44 | 42 | 42 | |
| D2.6 | 42 | 42 | 41 | 41 | 44 | 41 | 40 | 40 | 45 | 43 | 41 | 41 | |
| D2.7 | 26 | 38 | 39 | 39 | 29 | 39 | 41 | 41 | 24 | 35 | 38 | 38 | |
| D2.8 | 41 | 46 | 46 | 46 | 40 | 46 | 46 | 46 | 42 | 46 | 46 | 46 | |
| D2.9 | 50 | 50 | 47 | 47 | 45 | 47 | 47 | 47 | 50 | 50 | 48 | 49 | |
| Transport element | D3.1 | 25 | 21 | 17 | 17 | 24 | 17 | 14 | 14 | 26 | 22 | 17 | 17 |
| D3.2 | 16 | 18 | 20 | 20 | 16 | 19 | 21 | 21 | 16 | 18 | 19 | 18 | |
| D3.3 | 18 | 14 | 11 | 11 | 17 | 13 | 10 | 11 | 18 | 14 | 11 | 11 | |
| D3.4 | 35 | 29 | 27 | 27 | 34 | 28 | 25 | 25 | 36 | 29 | 27 | 27 | |
| D3.5 | 32 | 27 | 26 | 26 | 32 | 26 | 24 | 24 | 33 | 28 | 26 | 26 | |
| D3.6 | 39 | 41 | 40 | 40 | 42 | 40 | 37 | 37 | 41 | 41 | 40 | 40 | |
| D3.7 | 4 | 6 | 5 | 5 | 3 | 6 | 5 | 5 | 4 | 6 | 6 | 6 | |
| D3.8 | 5 | 3 | 3 | 3 | 5 | 3 | 3 | 3 | 5 | 3 | 3 | 3 | |
| D3.9 | 13 | 13 | 12 | 12 | 12 | 12 | 15 | 15 | 13 | 13 | 12 | 12 | |
| D3.10 | 40 | 37 | 34 | 34 | 39 | 35 | 31 | 31 | 44 | 39 | 35 | 35 | |
| D3.11 | 22 | 15 | 13 | 13 | 21 | 15 | 11 | 10 | 22 | 16 | 15 | 15 | |
| D3.12 | 21 | 28 | 30 | 30 | 22 | 29 | 33 | 33 | 21 | 26 | 30 | 30 | |
| Cumulate element | D4.1 | 17 | 22 | 24 | 24 | 18 | 24 | 27 | 27 | 17 | 21 | 24 | 24 |
| D4.2 | 11 | 12 | 16 | 16 | 11 | 14 | 17 | 17 | 11 | 12 | 14 | 14 | |
| D4.3 | 8 | 9 | 9 | 9 | 9 | 9 | 9 | 9 | 8 | 9 | 9 | 9 | |
| D4.4 | 10 | 11 | 15 | 15 | 10 | 11 | 16 | 16 | 10 | 11 | 13 | 13 | |
| D4.5 | 37 | 35 | 31 | 31 | 35 | 33 | 30 | 30 | 37 | 36 | 33 | 33 | |
| D4.6 | 46 | 45 | 45 | 45 | 43 | 45 | 43 | 43 | 47 | 45 | 45 | 45 | |
| D4.7 | 23 | 31 | 33 | 33 | 23 | 31 | 34 | 34 | 23 | 30 | 32 | 32 | |
| D4.8 | 31 | 39 | 38 | 38 | 33 | 38 | 39 | 39 | 30 | 38 | 39 | 39 | |
| D4.9 | 36 | 43 | 44 | 44 | 37 | 43 | 44 | 44 | 35 | 42 | 44 | 44 | |
| D4.10 | 14 | 17 | 19 | 19 | 14 | 18 | 20 | 20 | 14 | 17 | 18 | 19 | |
| D4.11 | 15 | 20 | 23 | 23 | 15 | 22 | 26 | 26 | 15 | 19 | 23 | 23 | |
| Output element | D5.1 | 28 | 23 | 21 | 21 | 26 | 21 | 19 | 19 | 27 | 23 | 20 | 20 |
| D5.2 | 20 | 25 | 28 | 28 | 20 | 27 | 29 | 29 | 19 | 24 | 28 | 28 | |
| D5.3 | 34 | 40 | 43 | 43 | 36 | 42 | 45 | 45 | 31 | 40 | 43 | 43 | |
| D5.4 | 19 | 19 | 22 | 22 | 19 | 20 | 22 | 22 | 20 | 20 | 22 | 22 | |
| D5.5 | 30 | 24 | 18 | 18 | 28 | 23 | 18 | 18 | 32 | 25 | 21 | 21 | |
| D5.6 | 7 | 8 | 8 | 8 | 7 | 8 | 8 | 8 | 7 | 8 | 8 | 8 | |
| Control element | D6.1 | 38 | 30 | 29 | 29 | 38 | 30 | 28 | 28 | 38 | 31 | 29 | 29 |
| D6.2 | 44 | 36 | 35 | 36 | 41 | 34 | 32 | 32 | 48 | 37 | 36 | 36 | |
| D6.3 | 1 | 2 | 1 | 1 | 1 | 1 | 1 | 1 | 1 | 2 | 1 | 1 | |
| D6.4 | 2 | 4 | 4 | 4 | 2 | 4 | 4 | 4 | 2 | 4 | 4 | 4 | |
| D6.5 | 3 | 1 | 2 | 2 | 4 | 2 | 2 | 2 | 3 | 1 | 2 | 2 | |
| D6.6 | 33 | 26 | 25 | 25 | 30 | 25 | 23 | 23 | 34 | 27 | 25 | 25 | |
| D6.7 | 43 | 49 | 50 | 50 | 46 | 50 | 50 | 50 | 39 | 48 | 49 | 48 | |
| D6.8 | 52 | 51 | 52 | 52 | 52 | 52 | 52 | 52 | 52 | 51 | 52 | 52 |
Table 12.
Spearman rank correlation coefficient.
| MCDM model | C-DEMATEL TOPSIS | C-DEMATEL ARAS | C-DEMATEL MARCOS | C-DEMATEL CARDIS | F-DEMATEL TOPSIS | F-DEMATEL ARAS | F-DEMATEL MARCOS | F-DEMATEL CARDIS | G-DEMATEL TOPSIS | G-DEMATEL ARAS | G-DEMATEL MARCOS | G-DEMATEL CARDIS |
|---|---|---|---|---|---|---|---|---|---|---|---|---|
| C-DEMATEL TOPSIS | 1.000 | 0.945 | 0.917 | 0.918 | 0.994 | 0.934 | 0.884 | 0.884 | 0.995 | 0.955 | 0.929 | 0.929 |
| C-DEMATEL ARAS | 0.945 | 1.000 | 0.991 | 0.991 | 0.957 | 0.996 | 0.978 | 0.977 | 0.932 | 0.999 | 0.994 | 0.994 |
| C-DEMATEL MARCOS | 0.917 | 0.991 | 1.000 | 1.000 | 0.937 | 0.997 | 0.995 | 0.995 | 0.898 | 0.986 | 0.998 | 0.998 |
| C-DEMATEL CARDIS | 0.918 | 0.991 | 1.000 | 1.000 | 0.938 | 0.996 | 0.994 | 0.994 | 0.899 | 0.987 | 0.998 | 0.998 |
| F-DEMATEL TOPSIS | 0.994 | 0.957 | 0.937 | 0.938 | 1.000 | 0.951 | 0.909 | 0.908 | 0.983 | 0.965 | 0.945 | 0.945 |
| F-DEMATEL ARAS | 0.934 | 0.996 | 0.997 | 0.996 | 0.951 | 1.000 | 0.989 | 0.988 | 0.917 | 0.993 | 0.998 | 0.998 |
| F-DEMATEL MARCOS | 0.884 | 0.978 | 0.995 | 0.994 | 0.909 | 0.989 | 1.000 | 1.000 | 0.861 | 0.970 | 0.991 | 0.990 |
| F-DEMATEL CARDIS | 0.884 | 0.977 | 0.995 | 0.994 | 0.908 | 0.988 | 1.000 | 1.000 | 0.861 | 0.970 | 0.990 | 0.990 |
| G-DEMATEL TOPSIS | 0.995 | 0.932 | 0.898 | 0.899 | 0.983 | 0.917 | 0.861 | 0.861 | 1.000 | 0.945 | 0.912 | 0.913 |
| G-DEMATEL ARAS | 0.955 | 0.999 | 0.986 | 0.987 | 0.965 | 0.993 | 0.970 | 0.970 | 0.945 | 1.000 | 0.991 | 0.991 |
| G-DEMATEL MARCOS | 0.929 | 0.994 | 0.998 | 0.998 | 0.945 | 0.998 | 0.991 | 0.990 | 0.912 | 0.991 | 1.000 | 1.000 |
| G-DEMATEL CARDIS | 0.929 | 0.994 | 0.998 | 0.998 | 0.945 | 0.998 | 0.990 | 0.990 | 0.913 | 0.991 | 1.000 | 1.000 |
Table 13.
Matching green logistics methods and instruments to supply chain sustainability drivers.
| Supply chain elements | Highest-ranked drivers | Solutions for the implementation of green logistics methods and instruments [96] |
|
|---|---|---|---|
| Green logistics method | Green logistics instrument | ||
| Input element | D1.8 – E-commerce with supplier | Procurement planning, execution and supply controlling | Electronic document management with organizations-suppliers |
| Processing element |
D2.3 – Eco-friendly equipment | The use of Eco-friendly equipment and technologies | Equipment with minimal impact on the environment |
| Transport element |
D3.8 – Technical condition of vehicle fleet | Selection of Eco-friendly vehicles | Vehicles with the least impact on the environment |
| Selection of vehicles relevant requirements in the field of ecology | |||
| Transport management and transport planning | Provision of technological unity for transport and warehouse process | ||
| Cumulative element |
D4.3 – Spatial organization of warehouse facilities | Environmental design of warehouse complexes | Environmentally sound spatial organization of elements of a warehouse complex |
| Output element | D5.6 – E-commerce with consumer | Work with consumers of products and services | Electronic document circulation in the organization of interaction with consumers |
| Control element | D6.3 – Corporate Information Systems | Development and implementation of corporate information systems | ERP (Enterprise Resource Planning System) |
| CRM (Customer Relationship Management System) | |||
| MES (Manufacturing Execution System) | |||
| WMS (Warehouse Management System) | |||
| EAM (Enterprise Asset Management) | |||
| HRM (Human Resources Management) | |||
| D6.5 – Intelligent Transportation Systems | Development and implementation of intelligent transport systems | Implementation of advanced information technologies (RFID, GPS, GIS, EDI, GPRS, GSM) |
|
Disclaimer/Publisher’s Note: The statements, opinions and data contained in all publications are solely those of the individual author(s) and contributor(s) and not of MDPI and/or the editor(s). MDPI and/or the editor(s) disclaim responsibility for any injury to people or property resulting from any ideas, methods, instructions or products referred to in the content. |
© 2024 by the authors. Licensee MDPI, Basel, Switzerland. This article is an open access article distributed under the terms and conditions of the Creative Commons Attribution (CC BY) license (http://creativecommons.org/licenses/by/4.0/).
Copyright: This open access article is published under a Creative Commons CC BY 4.0 license, which permit the free download, distribution, and reuse, provided that the author and preprint are cited in any reuse.


