Submitted:
24 November 2024
Posted:
25 November 2024
You are already at the latest version
Abstract
Genomic characterization of Cannabis sativa has accelerated rapidly in the last decade as sequencing costs have decreased and public and private interest in the species has increased. Two emerging challenges for the C. sativa research community are to 1) comprehensively capture the genomic diversity of the species and 2) reconcile and leverage the large amounts of genomic data to make meaningful contributions to fundamental research and commercial production systems. Here, we present seven new chromosome-level haplotype-phased genomes of C. sativa. All of these genotypes were alive at the time of publication, and several have numerous years of associated phenotype data. We used a kmer-based pangenome analysis to place these new assemblies in the context of more than 200 existing assemblies. We leveraged linkage maps constructed from F2 progeny of two of the assembled genotypes to characterize the recombination rate across the genome. Lastly, we re-aligned a bulk segregant analysis dataset for the major-effect flowering locus Early1 to several of the new assemblies to evaluate the impact of reference bias on the mapping results. These new assemblies, combined with the continued propagation of the genotypes, will contribute to the growing body of genomic resources for C. sativa to accelerate future research efforts.
Keywords:
Hemp
; Cannabis
; genome assembly
; synteny
; kmer
; recombination
; reference bias
1. Introduction
Cannabis sativa has long been cultivated by humans for its durable fiber, nutritious seeds, and culturally and medicinally valuable secondary metabolites. Thought to have originated in Central or East Asia, C. sativa now has a global distribution [1,2]. As the range of C. sativa expanded, natural and human selection shaped genotypic and phenotypic differentiation adapting populations for use in different market classes and local environments. Research on C. sativa has been restricted as a result of the plant’s decades-long classification as a controlled substance but has accelerated in recent years as regulations have been lifted on the cultivation of hemp and marijuana in many jurisdictions. Among those areas of research, C. sativa genetics and genomics has rapidly expanded. In the decade after the first C. sativa genome assembly was published by van Bakel et al. [3], numerous assemblies have been published [4,5,6]. These resources enabled significant progress in various areas of genetic and genomic research including quantitative trait locus (QTL) mapping [7,8,9,10,11,12], genome-wide association studies (GWAS) [13,14,15,16], phylogenetics and population structure [2,17,18,19], and gene family characterization [20,21,22].
Despite these advances, it is well established that genome assemblies of one or a few individuals are insufficient to capture the genetic diversity of a species [23,24]. There has been a dramatic rise of high-quality publicly available C. sativa genome assemblies in the past year, from less than 20 to more than 200, including more than 40 chromosome-level phased diploid assemblies [25,26]. As we move into the era of C. sativa pangenomics, we will be able to simultaneously consider diverse haplotypes from all of these assemblies when analyzing genetic and genomic data.
As the C. sativa genomics research community works towards a comprehensive pangenome, specific consideration is necessary for robust characterization of the sex chromosomes. Cannabis sativa is predominately dioecious, with a long-established XY sex determination system, where males are heterogametic [27]. It shares this XY system with its sister taxon, hop (Humulus spp.), both members of the Cannabaceae [1]. The first assembled C. sativa Y chromosomes were made publicly available in 2024 [25,26]. Despite this progress, there are still less than 10 assembled Y chromosome sequences compared to the dozens of assembled X chromosome sequences.
In addition to sampling sex chromosome diversity, targeted sampling will be necessary to capture the global diversity of C. sativa germplasm. There is evidence of strong population structure in C. sativa both associated with geographic origin and post-harvest market class (Table 1). Over the past decade, studies have broadly differentiated between high-cannabinoid germplasm and European fiber/grain hemp germplasm, which some taxonomists classify as two subspecies, subsp. indica and subsp. sativa, respectively [28,29]. The terms “marijuana” or “drug-type” are commonly used to encompass all high-cannabinoid C. sativa, where “hemp” is used to group primarily European grain and fiber germplasm. In addition to separating these two groups broadly, some studies resolve additional population structure within them (Table 1). Distinct sub-populations of Asian hemp germplasm, more closely related to high-cannabinoid germplasm than European hemp germplasm, as well as United States (U. S.) feral hemp, which is sometimes grouped with European fiber hemp, have been repeatedly identified [18,19]. Several studies have proposed additional groups of wild and feral material from Asia, but this region is severely under-sampled, especially as the presumed center of origin and domestication [1,2]. Considering this genetic diversity, the majority of the assembled genome sequences are from a relatively narrow group of high-cannabinoid genotypes, many of which are breeding lines sampled from the Oregon CBD (OCBD) program [25]. Assemblies of related individuals will be valuable for phasing and tracking the inheritance of different haplotypes, but additional sampling of diverse germplasm will be necessary to fully capture the genetic diversity of the species.
One result of capturing diverse haplotypes in high-quality assemblies will be a more robust analysis of new genetic and genomic data. A common challenge in these analyses is the significant reference bias that arises when mapping reads to different genome assemblies. This bias occurs in part because reads derived from reference haplotypes achieve higher quality mapping than those derived from non-reference haplotypes [32,33]. Strategies to mitigate this bias include the development of pangenome graphs as references [24,34] and comparison of alignments using multiple high-quality haploid assemblies as references [35]. Availability of diverse genome assemblies will also provide resources for selection of targets for molecular markers genome editing.
Assemblies that capture diverse haplotypes can also accelerate plant breeding by positioning beneficial and deleterious haplotypes and providing information about linkage disequilibrium (LD) among haplotypes. Plant breeders rely on meiotic recombination to break LD and generate novel haplotypes that can be selected on to develop improved cultivars [36]. There is growing interest in the potential of modifying the frequency and location of crossover events to improve selection efficiency [36,37], however, plant breeders are largely limited by the existing recombination landscape. Although limited data has been published investigating variation in recombination rates across the C. sativa genome, analyses with assemblies of ‘Purple Kush’ and ‘FINOLA’ found bias towards the gene-rich repeat-poor regions at chromosome ends [4].
The objectives of this study were to 1) construct high-quality genome assemblies for seven new C. sativa genotypes, including 2 XY staminate individuals 2) analyze the new genome assemblies in the context of existing assemblies and identify unique haplotypes 3) leverage two assemblies, parents of a bi-parental F2 mapping population, to characterize the recombination landscape of C. sativa and 4) use new genome assemblies to investigate the impact of reference bias in bulk segregant analysis (BSA) for trait mapping.
2. Results
2.1. Genomes Assemblies Are High-Quality and Contiguous
For the seven genotypes sequenced and assembled (Table 2) the average assembly size was 754 Mb for haplotypes with chromosome X (ChrX) and 782 Mb for haplotypes with chromosome Y (ChrY) (Supp. Table S1). The haplotypes with ChrY were 6.02% and 3.93% larger than the haplotypes with ChrX for the GVA-H-21-1003-002 and GVA-H-22-1061-002 assemblies, respectively. The number of scaffolds not incorporated in to chromosomes ranged from 58 to 469, comprising between 1.40% and 3.55% of the assemblies (Supp. Table S1). The number of structural annotations identified by Helixer [38] ranged from 23,182 to 28,296 with a mean of 24,752 (Supp. Table S1). BUSCO scores for raw assembly FASTAs ranged from 96 to 98.5, and for Helixer-predicted proteins from 95.7 to 98.1 (Supp. Table S1). BUSCO scores were consistently lower for haplotypes with ChrY compared to their counterparts with ChrX. In the GVA-H-22-1061-002 and GVA-H-21-1003-002 assemblies, 49 BUSCOs were identified in each of the ChrX-specific regions, but only 5 and 4 were identified in the ChrY sex determining regions (SDRs), respectively.
2.2. Phased Chromosome-Level Assemblies Cluster in Agreement with Established Population Structure
Jaccard clustering based on a PanKmer [39] index of 50 phased chromosome-level assemblies broadly separated the high-cannabinoid assemblies from the European hemp assemblies (Figure 1A, Supp. Figure S1) in accordance with previous population structure analyses conducted in C. sativa (Table 1). Within the high-cannabinoid group, the Asian hemp assemblies, YMv2 and GVA-H-22-1061-002, formed a distinct cluster adjacent to a set of OCBD F1 assemblies. Likewise, the U.S. feral assemblies, Boone County (BCM) and GVA-H-21-1003-002, formed a subgroup within the European hemp cluster, positioned near the Italian fiber cultivar ‘Carmagnola.’ Both haplotypes of the high-CBD cultivar ‘BoAx’ (BOAX) loosely clustered with the European hemp assemblies. Apart from ‘Panakeia v2.0’ hap1 and ‘TJ’s CBD’ hap 2, most haplotypes of the new high-cannabinoid assemblies presented in this study clustered near each other.
2.3. Assemblies Vary in Number and Position of Unique k-mers
Unique k-mers were extracted from a PanKmer index of 217 C. sativa assemblies. The PanKmer collector’s curve (Figure 1D) shows a continued increase in the cumulative number of k-mers as more assemblies are added to the index. The number of unique k-mers in each assembly was somewhat associated with the population or diversity group origin of the assembly. Overall, high-cannabinoid assemblies, particularly the OCBD F1 assemblies, had lower numbers of unique k-mers, most with fewer than 1 million per haplotype (Figure 1A, Supp. Table S2). In contrast, the European and U.S. feral assemblies tended to have a moderate number of unique k-mers with most between 1.5 and 8 million per haplotype (Figure 1A, Supp. Table S2). The Asian hemp assemblies had the greatest counts with greater than 10 million unique k-mers in each haplotype (Figure 1A, Supp. Table S2). The two additional phased contig-level Asian hemp assemblies, YMMv1 and CNBv1, further illustrate this with particularly large counts of 28.6 million and 43.2 million unique k-mers, respectively (Supp. Table S2).
Unique k-mer density also varies among chromosomes and assemblies, with greater densities indicating haplotypes that are unique among the assemblies included in the PanKmer index. Some assemblies, like GVA-H-19-1067-001 hap2 and ‘Panakeia v2.0’ hap1 contain isolated chromosomal regions with greater densities of unique-kmers (Figure 2). In contrast, both haplotypes of the GVA-H-22-1061-002 assembly have large numbers of unique k-mers across the majority of every chromosome (Figure 2). Within both haplotypes containing ChrY, the pseudoautosomal region (PAR) has a greater density of unique k-mers than the SDR (Figure 2).

Table 2.
Description of sequenced genotypes. Phenotypic sex is classified as either pistillate (P), staminate (S), or monoecious (Mo). Sex chromosomes are classified as either XX or XY. Chemotype is classified as CBD-dominant (III) or CBG-dominant (IV) as defined by de Mandolino and Carboni [40]. Entity or institution from which genotype was provided. If available, the National Plant Germplasm System (NPGS) accession is provided. The amount of raw sequence data generated by each platform is provided in gigabases (Gb) and number of reads. References are provided for studies where the genotypes were used. *paired 2 x 150 bp reads.
| Genotype | Sex | Chemotype | Source | U.S. NPGS Accession | PacBio HiFi Data (Gb / Reads) | Omni-C® Data (Gb / Reads*) | Refs. |
|---|---|---|---|---|---|---|---|
| ‘FL 58’ | P/XX | III | Sunrise Genetics | G 33236 | 17.9 / 1.25M | 126.8 / 43.0M | [10,18,41,42,43,44] |
| ‘Panakeia v2.0’ | P/XX | IV | Bazelet | - | 16.9 / 1.09M | 107.8 / 37.0M | [10] |
| ‘TJ’s CBD’ | P/XX | III | Stem Holdings Agri | G 33580 | 29.5 / 2.62M | 128.2 / 43.7M | [10,18,41,42,43,44,45,46,47,48] |
| GVA-H-19-1067-001 | P/XX | III | Cornell Hemp Breeding Prog. | - | 19.3 / 1.18M | 111.8 / 38.3M | [10,44] |
| GVA-H-19-1185-059 | Mo/XX | IV | Cornell Hemp Breeding Prog. | - | 33.9 / 2.17M | 86.2 / 29.3M | [10] |
| GVA-H-21-1003-002 | S/XY | III | Cornell Hemp Breeding Prog. | Derived from G 33199 | 21.9 / 2.66M | 92.3 / 31.6M | [10] |
| GVA-H-22-1061-002 | S/XY | III | Cornell Hemp Breeding Prog. | Derived from G 33545 | 24.3 / 1.50M | 81.9 / 28.0M | [10] |
2.4. Pairwise Haplotype Alignment Can Be Used as a Metric for Homozygosity
To investigate the position and coverage of putatively homozygous stretches in phased chromosome-level assemblies, minimap2 [49] alignments were filtered to identify aligned runs of homozygosity (AROH). The assemblies show substantial variation in the proportion of the genome covered by progressively larger AROH (Figure 1B); some assemblies lack AROH larger than 20 Mb, while others have up to 50% of their genome covered by AROH of 30 Mb or more. Notably, two assemblies, ‘FL 58’ and GERv1, exhibit extensive AROH coverage, suggesting a high level of inbreeding. As visualized in Figure 2, ‘FL 58’ shows nearly complete AROH coverage on Chr02, 03, 04, 07, 08, and X. Similarly, chromosome-spanning AROH are found in GVA-H-21-1003-002 on Chr06, 07, and 09 as well as GVA-H-19-1067-001 on Chr07, 09, and X (Figure 2).
Additional insights into highly heterozygous assemblies emerge when the number of unique k-mers per assembly is plotted against AROH coverage greater than 50 kb (Figure 1C). Asian hemp GVA-H-22-1061-002 and YMv2, along with the Hungarian cultivar ‘Kompolti’ (KOMP), have high heterozygosity, as evidenced by low AROH coverage, and have large numbers of unique k-mers. In contrast, the OCBD F1 assemblies, despite showing similar or greater levels of heterozygosity, contain dramatically fewer unique k-mers (Figure 1C).
2.5. Chromosomes Show Strong Periphery-Bias in Recombination Rate
Marker sequences from the GVA-H-21-1004, GVA-H-21-1005, and combined-family linkage maps were aligned to assemblies of the parental genotypes ‘FL 58’ and ‘TJ’s CBD’ [10] to estimate recombination rates across the genome. Analyses with all three linkage maps showed agreement in estimated recombination rates across the genome (Figure 3A). Recombination is significantly suppressed in the center of all 10 chromosomes, with most recombination events occurring within 15 Mb of a telomere (Figure 3A). Most chromosomes have regions 40 Mb or larger with recombination rates less than 0.5 cM per Mb (Figure 3A). In the GVA-H-21-1004 family, map recombination appears suppressed across the entire short arm of Chr08 (Figure 3A).
2.6. Segregation Distortion and Runs of Monomorphic Markers Restrict Linkage Map Coverage
Aligning marker-associated sequences from the ‘FL 58’ ✕ ‘TJ’s CBD’ F2 linkage maps to parental genomes provides a detailed view of how well the linkage groups cover the physical map. Three chromosomes—Chr03, Chr07, and Chr08—have large gaps in coverage in either the GVA-H-21-1004 or GVA-H-21-1005 F2 family maps, as well as the combined map using both families (Figure 3A). Plotting the minor allele frequency (MAF) of markers across these chromosomes highlights two major factors that limited linkage group construction (Figure 3B). Specifically, Chr03 in the GVA-H-21-1004 family and Chr07 in the GVA-H-21-1005 family contain long stretches of monomorphic markers, while the majority of Chr08 in the GVA-H-21-1005 family displays significant segregation distortion.
2.7. Bulk Segregant Analysis Mapping of Early1
Alignment of Chr01 from CBDRx v2 (cs10, NCBI GenBank GCA_900626175.2) and Pink Pepper (ASM2916894v1, NCBI GenBank GCA_029168945.1), the previous and current NCBI C. sativa reference genomes, respectively, to newly assembled genomes illustrated multiple assembly errors (Figure 4A). BSA data from Toth et al. [9] was re-analyzed using the both haplotypes of ‘Panakeia v2.0’ and GVA-H-19-1185-059. The G-statistic peaks in all four new assemblies showed strong agreement (Figure 4A), with slight positional variations in the peak markers among assemblies (Figure 4B). By considering consensus across analyses with all four assemblies as references, the most significant peak region for Early1 can be narrowed to a ~2 Mb syntenic region on Chr01. This is substantially smaller than the fragmented region observed in CBDRx v2 and Pink Pepper where numerous small peaks span over 40 Mb (Figure 4A).
Using the data from the BSA, SNPs associated with Early1 were identified in ‘Panakeia v2.0’ hap1 as well as 22 other C. sativa assemblies (Supp. Table S3). The ‘Panakeia v2.0’ hap1 assembly also has a large ~20 Mb inversion on the same arm of Chr01 which is found in 21 other C. sativa assemblies (Supp. Table S3). The only assembly with both the inversion and the Early1 associated SNPs is ‘Panakeia v2.0’ hap1 (Supp. Table S3).
3. Discussion
This study provides new insights into the architecture and composition of the C. sativa genome through analysis of seven high-quality, haplotype-phased assemblies spanning individuals with diverse cannabinoid profiles, market classes, and sex chromosomes. By presenting these assemblies into the context of other C. sativa assemblies, we were able to characterize uniqueness both within diploid individuals, comparing AROH, and among assemblies, using unique k-mers. By selecting individuals that were used for previous studies, we were able to leverage existing linkage map data to estimate recombination landscapes across the genome. Additionally, we were able to narrow the position of the Early1 locus by re-analyzing publicly available BSA data with improved assemblies and considering the impact of reference bias. These assemblies will not only contribute to a more comprehensive C. sativa pangenome, but through maintaining the associated living individuals and their progeny, will provide essential resources to support future research in C. sativa physiology, biochemistry, horticulture, breeding, and many other disciplines.
3.1. Priorities for Future C. sativa Genome Sequencing
Despite the recent surge in C. sativa genome assemblies, the PanKmer collector’s curve (Figure 1D) and unique k-mer analysis (Figure 1A, Supp. Table S2) suggest that substantial portions of C. sativa germplasm remain under-sampled or unsampled entirely. The unique k-mer metric is an effective indicator of the extent to which germplasm has been adequately sampled. As sampling increases, haplotypes and their associated k-mers are repeatedly captured, resulting in fewer unique k-mers in the index. Consequently, when germplasm is well-sampled, there will be fewer unique k-mers in any given haplotype.
According to this metric, one could argue that the only well-sampled germplasm is the OCBD breeding program. This makes sense considering the large number of high-quality assemblies derived from this high-cannabinoid breeding program, many of which are closely related [25]. Additionally, the French hemp cultivar ‘Santhica’ appears relatively well-sampled, with numerous assemblies from related individuals or derivatives, including FCS1b, GVA-H-19-1185-059, H3S1b, H3S7b, SAN2, SGVA, and SN1v3, all showing relatively low counts of unique k-mers. This cultivar and its derivatives have been a focus of sequencing efforts due to its uncommon CBG-dominant cannabinoid profile (a.k.a. chemotype IV) [50].
Given the vast genetic diversity yet to be sampled, future sequencing efforts should prioritize unsampled populations, particularly those originating from Central, South, and Southeast Asia, the Middle East, and Africa. These regions, especially around hypothesized centers of domestication, are likely to harbor extensive genetic diversity. Additional sampling of East Asian hemp should also be prioritized, as the large numbers of unique k-mers from relatively few individuals suggests this germplasm is under-sampled (Figure 1A).
Historical admixture resulting from intentional breeding and movement of C. sativa by humans will also contribute to haplotype diversity as more genomes are assembled. Crosses between Asian and European hemp populations are reported to have resulted in cultivars including ‘Carmagnola’, ‘Kompolti’, and many of their derivatives [51,52,53,54,55]. Genomic studies have also suggested that certain U.S. feral hemp populations are closely related to Italian fiber cultivars like ‘Carmagnola’ [18], while others may share ancestry with East Asian populations [2]. Early 20th-century breeding programs, such as those led by Lyster Dewey, likely contributed to this complex population structure through the development of germplasm pools like ‘Kentucky hemp’ resulting from crosses among Asian, European, and U.S. feral hemp populations [56]. Future sequencing of feral populations may be able to resolve admixed haplotypes that have been maintained over decades of natural selection. Admixture is also evident in the recent development of high-cannabidiol (CBD) germplasm resulting from the introgression of cannabidiolic acid synthase (CBDAS) from European hemp into marijuana germplasm [6]. For example, the high-CBD cultivar ‘BoAx’ clusters loosely with European hemp in the cladogram (Figure 1A), while also showing similarity to high-cannabinoid genotypes in the heatmap (Supp. Figure S1), indicative of admixed haplotypes.
3.2. Characterizing Homozygosity
Understanding the close relationship between inbreeding and heterosis is fundamental to developing inbred-hybrid breeding systems which dominate many cropping systems [57]. Dioecious species like C. sativa, which are typically obligate outcrossers, maintain high levels of heterozygosity and genetic load, resulting in inbreeding depression when plants are self-pollinated, complicating the development of inbred lines [58]. Generating genome assemblies and sequencing diversity panels will help to describe the architecture of genetic load in C. sativa, while also identifying haplotypes that can be homozygous without deleterious effects. By using alignment-based metrics, like AROH, we can leverage additional information, like structural variants from genome assemblies and long-read sequence data, to more precisely quantify heterozygosity and inform inbreeding strategies. The coverage of AROH in the ‘FL 58’ and GERv1 assemblies suggests that large portions of the genome can be homozygous while maintaining viability.
In this study, the length, coverage, and positions of AROH provide insights into the breeding histories of several lines. For instance, ‘FL 58’from Sunrise Genetics, an inbred line produced through multiple generations of self-pollination, is expected to have extensive homozygous regions (C. J. Schwartz, personal communication). This is consistent with the large regions of AROH. Similarly, GVA-H-21-1003-002, derived from an isolated small feral population in New York and subjected to further artificial selection and inbreeding, also exhibits long AROH.
3.3. Recombination Rates
Recombination rates play a crucial role in plant breeding, particularly in the introgression of desired alleles. In regions with low recombination rates, linkage drag is substantial, requiring multiple generations to break the LD between beneficial and deleterious alleles. Conversely, deleterious alleles in regions of higher recombination are more easily purged [59]. We detected a periphery-biased recombination pattern in C. sativa, consistent with the analysis by Laverty et al. [4], and common in organisms with long chromosomes [60,61]. This bias will have substantial implications for breeders accessing beneficial alleles found in the centers of chromosomes while also mitigating linkage drag. In addition to applied plant breeding, variation in recombination rate directly impacts linkage mapping resolution. Much larger population sizes will be necessary to narrow QTL in regions with low recombination rates.
An interesting case of repressed recombination is the short arm of Chr08. As Chr08 is subtelocentric, one hypothesis is that the proximity to the centromere represses recombination on the short arm. However, crossover inhibition explicitly due to the centromere typically extends only a few Mb, as is the case in rice [62], which would not be expected to cover the entire 8-10 Mb of the short arm [60]. Another hypothesis is that structural variants between haplotypes in an F1 could locally reduce recombination rates. Interestingly, both ‘FL 58’ and ‘TJ’s CBD’ have large structural variants in that region (Figure 2, Supp. Figure S2) which likely contribute to the locally repressed recombination. In other populations without structural variants, we would expect greater recombination rates on the short arm of Chr08.
3.4. Marker Segregation Impacts Linkage Map Construction
Linkage map construction relies on the predictable segregation patterns expected in structured populations to build genetic maps. Due to this assumption, distorted markers deviating from expected segregation ratios are often purged during map construction, which can leave gaps in genetics maps. This is the case for Chr08 in the linkage maps constructed from the GVA-H-21-1005 family and the combined families (Figure 3). The expected 1:2:1 segregation across Chr08 in the GVA-H-21-1004 map and the large AROH on Chr08 in ‘FL 58’, suggest that the segregation distortion is associated with inheriting one of the haplotypes from ‘TJ’s CBD’. Several factors including transmission ratio distortion, a recessive lethal locus, or a seed dormancy locus could result in observed segregation distortion, but more studies will be necessary to identify the specific factor in the parental genome.
Regions lacking segregating markers can also result in gaps during linkage map construction as we observed on Chr03 and 07 (Figure 3). In F2 populations, this could be a result of long stretches of homozygosity in the F1 that was self-pollinated. It is possible, for example that shared haplotypes exist in ‘FL 58’ and ‘TJ’s CBD’ that would always produce monomorphic markers as the regions are truly homozygous in F1 progeny. It is also possible that regions may be heterozygous but only have monomorphic markers due to ascertainment bias in design of marker panels. In the case of the array used to genotype the ‘FL 58’ ✕ ‘TJ’s CBD’ F2 populations, which was designed by a company primarily working with high-tetrahydrocannabinol (THC) germplasm, markers that more commonly segregate in high-CBD germplasm and not high-THC germplasm may have been excluded.
3.5. Reference Bias Impacts Trait Mapping Using BSA
Using high-quality genome assemblies for alignment is critical for high-resolution trait mapping as assembly errors introduce significant noise that complicates analyses. When re-analyzing BSA data for the Early1 flowering locus using several assemblies as references, assembly errors—particularly in CBDRx v2 and Pink Pepper—exemplify extreme cases of reference-specific results. By using higher-quality assemblies and integrating data across multiple references, a consensus was reached that substantially narrows the Early1 locus. This consensus approach not only enhances the precision of trait mapping but also mitigates alignment biases and errors inherent in single-reference analyses. Such multi-reference analyses, while more complex, provide a more robust foundation for identifying candidate genes associated with important traits in C. sativa.
Even in well assembled genomes, structural variants can introduce variation that influences alignment results. This is evident on Chr01 of ‘Panakeia v2.0’ hap1 as the large ~20 Mb inversion shifts part of the region above the BSA significance threshold to the end of the chromosome (Figure 4A). This pattern suggests that, despite ‘Panakeia v2.0’ hap1 having the SNPs associated with Early1, the ‘Umpqua’ population sequenced by Toth et al. [9] did not have the inversion linked to Early1. Interestingly, ‘Panakeia v2.0’ hap1 is the only haplotype from a phased chromosome-level assembly that has both the Early1 associated SNPs and the ~20 Mb inversion (Supp. Table S3). This could be a result of a recombination event between the locus and the inversion, or potentially an error in phasing some of the assemblies. In either case, specific consideration for structural variants, which could be causative or linked to causative loci, is critical when selecting assemblies for alignment.
3.6. Associated Phenotypes and Loci of Interest
Genome assemblies in isolation are valuable, but they are significantly more valuable when they are associated with meaningful phenotypic data, and exponentially more valuable when the sequenced individual is alive and available for other researchers to study. All seven genotypes sequenced in this manuscript are being maintained through cutting propagation and several have been contributed to the U.S. NPGS hemp collection. Additionally, there are numerous publications associated with the genotypes (Table 2).
Several loci with alleles known to impact disease resistance, flowering time, and secondary metabolism are present in this set of genomes. ‘FL 58’ is homozygous for a mutation in CsMLO1, a powdery mildew susceptibility gene on Chr01, and several other loci that contribute to powdery mildew resistance [10]. GVA-H-21-1003-002 is homozygous for the flowering time locus Autoflower2 [12]. Finally, GVA-H-19-1067-001 has a consistently high proportion of CBC(A) in its cannabinoid profile [44] and has sequence matching the “expressed” cannabichromenic acid synthase (CBCAS) described in the patent application from Canopy Growth Corporation [63].
3.7. Future Directions
Future research on C. sativa will benefit from the development of comprehensive pangenomic resources that capture the species’ full genetic diversity and mitigate reference bias. These efforts will deepen our understanding of sex chromosomes, structural variation, homozygosity, and population structure that will provide insight into local adaptation and phenotypic diversity. Future studies should also explore recombination rate variation among diverse populations, as well as artificial manipulation of recombination rates, which could accelerate breeding by reducing linkage drag associated with trait introgression and recurrent selection. As high-throughput phenotyping technologies evolve, pairing genome assemblies with phenotypic data from living and publicly available germplasm will support foundational and applied research on one of humanity’s oldest sources of food, fiber, and medicine.
4. Materials and Methods
4.1. DNA Isolation and Sequencing
High-molecular weight DNA was isolated from shoot tips etiolated for five-days of all seven genotypes using the protocol described by Schalamun and Schwessinger [64]. The material for GVA-H-19-1185-059 was sequenced at Oregon CBD (Independence, OR) and the remainder of the samples were sequenced at the University of Wisconsin—Madison Biotechnology Center. PacBio HiFi data was generated for all genotypes using a PacBio Sequel II. Tissue of all seven genotypes were sent to the HudsonAlpha Institute for Biotechnology (Huntsville, AL) to generate Dovetail® Omni-C® libraries. Libraries were constructed using standard protocols (Cantata Bio, Dovetail Omni-C Kit Catalog #21005). One gram of flash, frozen leaf tissue was ground and after nuclei isolation, the pellet was resuspended in 1X PBS, aliquoted into 3 tubes and centrifuged at 6000 rpm for 5 mins. The supernatant was then discarded and the nuclei pellets flash frozen for storage at -80 degrees. One aliquoted nuclei pellet was then processed using the Dovetail® Omni-C® protocol V2. Libraries were run on an Illumina NovaSeq 6000 PE150
4.2. Genome Assembly and Annotation
For each genotype, HiFi and Omni-C® sequence data were used to generate contig-level assemblies. First, Omni-C® data were trimmed and filtered using fastp [65] then both the HiFi and Omni-C® data were used as inputs for hifiasm [66]. To identify and phase the sex chromosomes in the two XY assemblies, we employed the method described by Carey et al. [26]. Briefly, male-specific k-mers (Y-mers) were mapped to the contig-level assemblies and a combined assembly using contigs from both haplotypes was constructed to verify that Y- and X-tigs were appropriately phased into separate haplotypes. For the five XX assemblies, we did not perform additional manual phasing prior to scaffolding. Contig-level assemblies were screened for contaminants using FCS-GX [67]. To scaffold the contig-level assemblies, the Omni-C® reads were aligned to their respective contigs for each of the 14 haplotypes using the Dovetail® Omni-C® pipeline [68]. These alignments and the contig-level assemblies were used as inputs for YaHS [69] to generate scaffolded assemblies. Finally, scaffolded assemblies were manually curated based on contact maps generated and visualized using Juicer and Juicebox [70] to generate chromosome-level assemblies. Chromosomes were ordered and oriented adhering to the CBDRx v2 genome assembly conventions [6] based on alignment to the ‘Carmagnola’ assembly [26] using D-GENIES [71] implementing minimap2 [49].
Structural gene annotations were predicted ab initio using Helixer v0.3.3 [38]. Protein sequences were extracted using GffRead [72] and used to generate functional gene annotations with eggNOG-mapper v2.1.12 [73]. To assess assembly quality, BUSCO v5.7.1 [74] using the embryophyta_odb10 database was run on the final manually-curated assemblies as well as the predicted proteins from Helixer.
PAR-SDR boundaries for the two phased XY assemblies were identified by mapping Y-mers from Carey et al. [26] to both X/Y haplotypes, then analyzing gene trees, of syntenic orthologs conserved in all eight available ChrY assemblies, for those spanning the putative PAR-SDR boundary (i.e., ChrY region with decreased Y-mer density). Y-mers were mapped to all four X/Y haplotypes using BWA mem v.0.7.17, requiring perfect alignments and multimapping up to 10 times. Orthologs were identified using OrthoFinder v2.5.4 with the multiple sequence alignment option. Blastn (BLAST+ v.2.14.1) and bedtools (v.2.31.0) getfasta was used to identify and extract nucleotide sequences from each X/Y assembly for 10 conserved orthologs spanning the putative PAR-SDR boundary. Each gene tree was estimated based on a MAFFT v.7.505 generated multiple sequence alignment, using the options --localpair and --maxiterate 1000, and maximum likelihood tree inference with IQ-TREE v.1.6.12 with the options -MFP and –bb 1000. The SDR starting position on the Y was defined 10 bp upstream of the first putatively SDR-linked gene model.
4.3. Generation of a PanKmer Index and Identification of Unique k-mers
PanKmer [39] was used to generate a kmer-based pangenomic index for all of the assemblies available from NCBI, Lynch et al. [25], Carey et al. [26], and those presented in this study. Subsequently, custom bash and python scripts were used to identify unique kmers from the index. For the assemblies presented in this study, unique kmers were aligned back to the chromosome-level assemblies using BWA-MEM [75] to identify regions with greater densities of unique kmers suggesting unique haplotypes that are not present in other assemblies included in the index.
To generate the hierarchical clustering tree, a second index was generated with only the phased assemblies. The index was initially constructed using sequence from all chromosomes of both chromosome-level and contig-level assemblies, but this resulted in clustering of haplotypes with Y chromosomes (Supp. Figure S3). To avoid bias in clustering due to the sex chromosomes, the index was reconstructed using only autosomal sequence data for the 100 haplotypes from the 50 phased chromosome-level assemblies. To reduce memory and run time an incomplete Q30 index was generated. The PanKmer adj-matrix and tree functions were then used to generate a hierarchical clustering and heatmap of genomes using Jaccard similarity scores.
4.4. Pairwise Alignment of Haplotypes
To visualize syntenic regions of homologous chromosomes, pairwise alignment of the two haplotypes for each of the diploid phased chromosome-level assemblies (n = 50) was performed using D-GENIES [71] implementing minimap2 [49]. The resulting PAF files were processed with a custom R [76] script to merge artificial breaks in alignments which were frequently introduced when aligned regions exceeded 10 Mb. A primary pairwise alignment between haplotypes was classified as an aligned run of homozygosity (AROH) when it was greater than 50 kb in length and had an estimated per-base sequence divergence of less than 0.01.
4.5. Recombination Frequency Estimation
An improved set of linkage maps was constructed from the ‘FL 58’ ✕ ‘TJ’s CBD’ biparental F2 mapping population data [10] and genetic map positions were used to estimate recombination frequency across the genome. The R packages ASMap [77] and qtl [78] were used to construct the linkage maps. Biallelic F2 marker data from the Illumina array were coded such that allele A was contributed by ‘FL 58’ and allele B was contributed by ‘TJ’s CBD’. A total of three linkage maps were constructed: one for each F2 population, GVA-H-21-1004 and GVA-H-21-1005, and one using marker data of both populations combined. Markers that had significant segregation distortion (threshold = for GVA-H-21-1004; for GVA-H-21-1005; for both populations), had a significant proportion of missing data (threshold > 0.35), and were in complete linkage disequilibrium with other markers were removed using the pullCross function. The mstmap function was used for genetic distance calculation, marker ordering, and linkage group clustering specifying the following p-value thresholds: for GVA-H-21-1004, GVA-H-21-1005, and both populations, respectively. Small linkage groups that did not represent an entire chromosome were merged with linkage groups whose markers had low estimated pairwise recombination and high LOD linkage. The calculation of double crossovers per marker was determined by the profileMark function. Through an iterative process, markers in the GVA-H-21-1004 and GVA-H-21-1005 populations that exceeded two double crossovers were removed, while markers with no more than one double crossover were dropped for the linkage map using the data of both populations. Linkage groups with less than or equal to 21, 20, and 10 markers were discarded in the maps of GVA-H-21-1004, GVA-H-21-1005, and both populations combined, respectively. Final linkage groups were assigned chromosome numbering and orientation using the flip.order function based on marker positions on the ‘FL 58’ hap1 assembly. Individual markers that excessively deviate from their expected physical location given their genetic location were dropped.
To estimate recombination rates, array probe sequences for markers in any of the three linkage maps were aligned to the ‘FL 58’ hap2 assembly using blastn [79]. Alignment of genetic and physical maps were visualized by plotting the coordinates of the markers in the genetic map against their positions in the physical map. Three regions that were duplicated and inverted on Chr03, 06, and 09 were manually removed from the GVA-H-21-1005 genetic map. LOESS models were fit for each chromosome using a span of 0.25 and the absolute value of the numerical derivative between successive fitted values was calculated to estimate the recombination rate at each marker position. MAF was calculated at the family level for all markers that were included in any of the three linkage maps.
4.6. Early1 BSA Aligning to Various Genome Assemblies
The Early1 BSA data from Toth et al. [9] (NCBI BioProject PRJNA856865) was downloaded and filtered with fastp [65] using default settings. Then NVIDIA Clara ParaBricks v4.3.1-1 fq2bam, a GPU-accelerated wrapper of BWA-MEM [75], was used to assign read groups, reference index, and align the reads to each of the six reference assemblies: CBDRx v2, Pink Pepper, both haplotypes of ‘Panakeia v2.0’, and both haplotypes of GVA-H-19-1185-059. Following alignment, Clara Parabricks haplotypecaller was used to call variants and generate GVCF files for each read group. GVCF files were combined and variants were joint called using CombineGVCFs and GenotypeGVCFs from GATK [80]. The VCF file was filtered to a minimum depth of 10 reads and converted to table format using VCFtools [81]. The table was converted to a CSV and PyBSASeq [82] using default parameters for a backcross population was used to conduct the BSA.
The output files from PyBSASeq were used to identify a consensus peak interval spanning ~2 Mb on Chr01. To identify molecular markers associated with the presence of Early1, 20 SNP sites were identified across the peak interval. SNPs were identified based on concurrence with expected allele frequencies and sufficient read depth. SNPs and flanking sequences were aligned to 105 chromosome-level assemblies using Persephone® [83]. Comparing the calls for the 20 SNPs, we narrowed the list to five SNPs which produced consistent calls among all genomes and are likely linked to the causative variant for Early1. These five SNPs were used to identify whether or not each of the 100 phased chromosome-level assemblies is likely to have Early1.
Supplementary Materials
The following supporting information can be downloaded at the website of this paper posted on Preprints.org, Figure S1: Jaccard clustering heatmap of autosomal index; Figure S2: Alignment of Chr08 in ‘TJ’s CBD’ and ‘FL 58’; Figure S3: Jaccard clustering heatmap of whole-genome index; Table S1: Assembly statistics for seven diploid phased chromosome-level genome assemblies of Cannabis sativa; Table S2: Presence and absence of Early1 SNPs and large inversions on Chr01.
Author Contributions
Conceptualization, G.M.S., D.G.W., J.A.T., and L.B.S.; methodology, G.M.S., M.A.Q., S.B.C., D.G.W., L.A.M., and P.C.B.; formal analysis, G.M.S., M.A.Q., L.A.M., and P.C.B.; investigation, G.M.S., M.A.Q., L.A.M., and P.C.B.; resources, A.H., J.G., and S.C.; data curation, G.M.S. and M.A.Q.; writing—original draft preparation, G.M.S.; visualization, G.M.S.; supervision, A.H. and L.B.S.; funding acquisition, A.H. and L.B.S. All authors contributed to writing—review and editing and have read and agreed to the published version of the manuscript.
Funding
This project was partially funded by a grant to L.B.S. from the New York State Department of Agriculture and Markets (CM04068) and by a National Science Foundation CAREER grant (#2239530) to A.H., a grant from United States Department of Agriculture National Institute for Food and Agriculture (USDA NIFA, #2023-67013-39620) to A.H., and a USDA NIFA Postdoctoral Fellowship #2022-67012-38987 to S.B.C.
Data Availability Statement
All of the genome assemblies are available as part of NBCI BioProject XXXX and raw sequence data is available on SRA as part of BioProject XXXX. Additional code and intermediate data analysis can be found at: https://github.com/GMStack/2024_Hemp_Genomes.
Acknowledgments
We are grateful for the contributions and feedback of the Smart lab, especially Alex Wares, Erica Miller, Lucía Vignale and Bahiya Zahl, and for the technical support of the Cornell AgriTech greenhouse staff. We are also grateful to Allen Mamerto and the Todd Michael lab for support troubleshooting PanKmer.
Conflicts of Interest
The authors declare no conflicts of interest.
References
- Kovalchuk, I.; Pellino, M.; Rigault, P.; van Velzen, R.; Ebersbach, J.; Ashnest, J.R.; Mau, M.; Schranz, M.E.; Alcorn, J.; Laprairie, R.B.; et al. The Genomics of Cannabis and Its Close Relatives. Annu. Rev. Plant Biol. 2020, 71, 713–739. [Google Scholar] [CrossRef] [PubMed]
- Ren, G.; Zhang, X.; Li, Y.; Ridout, K.; Serrano-Serrano, M.L.; Yang, Y.; Liu, A.; Ravikanth, G.; Nawaz, M.A.; Mumtaz, A.S.; et al. Large-Scale Whole-Genome Resequencing Unravels the Domestication History of Cannabis sativa. Sci Adv 2021, 7. [Google Scholar] [CrossRef] [PubMed]
- van Bakel, H.; Stout, J.M.; Cote, A.G.; Tallon, C.M.; Sharpe, A.G.; Hughes, T.R.; Page, J.E. The Draft Genome and Transcriptome of Cannabis sativa. Genome Biol. 2011, 12, R102. [Google Scholar] [CrossRef] [PubMed]
- Laverty, K.U.; Stout, J.M.; Sullivan, M.J.; Shah, H.; Gill, N.; Holbrook, L.; Deikus, G.; Sebra, R.; Hughes, T.R.; Page, J.E.; et al. A Physical and Genetic Map of Cannabis sativa Identifies Extensive Rearrangements at the THC/CBD Acid Synthase Loci. Genome Res. 2019, 29, 146–156. [Google Scholar] [CrossRef]
- Gao, S.; Wang, B.; Xie, S.; Xu, X.; Zhang, J.; Pei, L.; Yu, Y.; Yang, W.; Zhang, Y. A High-Quality Reference Genome of Wild Cannabis sativa. Hortic Res 2020, 7, 73. [Google Scholar] [CrossRef]
- Grassa, C.J.; Weiblen, G.D.; Wenger, J.P.; Dabney, C.; Poplawski, S.G.; Timothy Motley, S.; Michael, T.P.; Schwartz, C.J. A New Cannabis Genome Assembly Associates Elevated Cannabidiol (CBD) with Hemp Introgressed into Marijuana. New Phytol. 2021, 230, 1665–1679. [Google Scholar] [CrossRef]
- Mihalyov, P.D.; Garfinkel, A.R. Discovery and Genetic Mapping of PM1, a Powdery Mildew Resistance Gene in Cannabis sativa L. Frontiers in Agronomy 2021, 3. [Google Scholar] [CrossRef]
- Woods, P.; Campbell, B.J.; Nicodemus, T.J.; Cahoon, E.B.; Mullen, J.L.; McKay, J.K. Quantitative Trait Loci Controlling Agronomic and Biochemical Traits in Cannabis sativa. Genetics 2021, 219. [Google Scholar] [CrossRef]
- Toth, J.A.; Stack, G.M.; Carlson, C.H.; Smart, L.B. Identification and Mapping of Major-Effect Flowering Time Loci Autoflower1 and Early1 in Cannabis sativa L. Front. Plant Sci. 2022, 13, 991680. [Google Scholar] [CrossRef]
- Stack, G.M.; Cala, A.R.; Quade, M.A.; Toth, J.A.; Monserrate, L.A.; Wilkerson, D.G.; Carlson, C.H.; Mamerto, A.; Michael, T.P.; Crawford, S.; et al. Genetic Mapping, Identification, and Characterization of a Candidate Susceptibility Gene for Powdery Mildew in Cannabis sativa L. Mol. Plant. Microbe. Interact. 2023. [Google Scholar] [CrossRef]
- Steel, L.; Welling, M.; Ristevski, N.; Johnson, K.; Gendall, A. Comparative Genomics of Flowering Behavior in Cannabis sativa. Front. Plant Sci. 2023, 14, 1227898. [Google Scholar] [CrossRef] [PubMed]
- Dowling, C.A.; Shi, J.; Toth, J.A.; Quade, M.A.; Smart, L.B.; McCabe, P.F.; Schilling, S.; Melzer, R. A FLOWERING LOCUS T Ortholog Is Associated with Photoperiod-Insensitive Flowering in Hemp (Cannabis sativa L.). Plant J. 2024. [Google Scholar] [CrossRef]
- Petit, J.; Salentijn, E.M.J.; Paulo, M.-J.; Denneboom, C.; van Loo, E.N.; Trindade, L.M. Elucidating the Genetic Architecture of Fiber Quality in Hemp (Cannabis sativa L.) Using a Genome-Wide Association Study. Front. Genet. 2020, 11, 566314. [Google Scholar] [CrossRef] [PubMed]
- Petit, J.; Salentijn, E.M.J.; Paulo, M.-J.; Denneboom, C.; Trindade, L.M. Genetic Architecture of Flowering Time and Sex Determination in Hemp (Cannabis sativa L.): A Genome-Wide Association Study. Front. Plant Sci. 2020, 11, 569958. [Google Scholar] [CrossRef] [PubMed]
- Welling, M.T.; Liu, L.; Kretzschmar, T.; Mauleon, R. An Extreme-Phenotype Genome-wide Association Study Identifies Candidate Cannabinoid Pathway Genes in Cannabis. Sci. Rep. 2020. [Google Scholar] [CrossRef]
- de Ronne, M.; Lapierre, É.; Torkamaneh, D. Genetic Insights into Agronomic and Morphological Traits of Drug-Type Cannabis Revealed by Genome-Wide Association Studies. Sci. Rep. 2024, 14, 9162. [Google Scholar] [CrossRef]
- Sawler, J.; Stout, J.M.; Gardner, K.M.; Hudson, D.; Vidmar, J.; Butler, L.; Page, J.E.; Myles, S. The Genetic Structure of Marijuana and Hemp. PLoS One 2015, 10, e0133292. [Google Scholar] [CrossRef]
- Carlson, C.H.; Stack, G.M.; Jiang, Y.; Taşkıran, B.; Cala, A.R.; Toth, J.A.; Philippe, G.; Rose, J.K.C.; Smart, C.D.; Smart, L.B. Morphometric Relationships and Their Contribution to Biomass and Cannabinoid Yield in Hybrids of Hemp (Cannabis sativa). J. Exp. Bot. 2021, 72, 7694–7709. [Google Scholar] [CrossRef]
- Woods, P.; Price, N.; Matthews, P.; McKay, J.K. Genome-Wide Polymorphism and Genic Selection in Feral and Domesticated Lineages of Cannabis sativa. G3 2022, 13. [Google Scholar] [CrossRef]
- Allen, K.D.; McKernan, K.; Pauli, C.; Roe, J.; Torres, A.; Gaudino, R. Genomic Characterization of the Complete Terpene Synthase Gene Family from Cannabis sativa. PLoS One 2019, 14, e0222363. [Google Scholar] [CrossRef]
- Pépin, N.; Hebert, F.O.; Joly, D.L. Genome-Wide Characterization of the MLO Gene Family in Cannabis sativa Reveals Two Genes as Strong Candidates for Powdery Mildew Susceptibility. Front. Plant Sci. 2021, 12, 729261. [Google Scholar] [CrossRef]
- Borrego, E.J.; Robertson, M.; Taylor, J.; Schultzhaus, Z.; Espinoza, E.M. Oxylipin Biosynthetic Gene Families of Cannabis sativa. PLoS One 2023, 18, e0272893. [Google Scholar] [CrossRef]
- Hurgobin, B.; Edwards, D. SNP Discovery Using a Pangenome: Has the Single Reference Approach Become Obsolete? Biology 2017, 6. [Google Scholar] [CrossRef] [PubMed]
- Bradbury, P.J.; Casstevens, T.; Jensen, S.E.; Johnson, L.C.; Miller, Z.R.; Monier, B.; Romay, M.C.; Song, B.; Buckler, E.S. The Practical Haplotype Graph, a Platform for Storing and Using Pangenomes for Imputation. Bioinformatics 2022, 38, 3698–3702. [Google Scholar] [CrossRef]
- Lynch, R.C.; Padgitt-Cobb, L.K.; Garfinkel, A.R.; Knaus, B.J.; Hartwick, N.T.; Allsing, N.; Aylward, A.; Mamerto, A.; Kitony, J.K.; Colt, K.; et al. Domesticated Cannabinoid Synthases amid a Wild Mosaic Cannabis Pangenome. bioRxiv, 2024; 2024.05.21.595196. [Google Scholar]
- Carey, S.B.; Havill, J.S.; Bentz, P.C.; Akozbek, L.M.; Lovell, J.T.; Pagitt-Cobb, L.; Lynch, R.; Allsing, N.; Osmanski, A.; Easterling, K.; Orozco, L.; Hale, H.; Mueller, H.; Meharg, Z.; McKay, J.; Grimwood, J.; Guerrero, R.; Vergara, D.; Kane, N.; Michael, T.P.; Muehlbauer, G.J.; Harkess, A. The Evolution of Heteromorphic Sex Chromosomes in Plants. in prep.
- Hirata, K. Sex Determination in Hemp (Cannabis sativa L.). J. Genet. 1927, 19, 65–79. [Google Scholar] [CrossRef]
- Small, E.; Cronquist, A. A Practical and Natural Taxonomy for Cannabis. Taxon 1976, 25, 405–435. [Google Scholar] [CrossRef]
- McPartland, J.M.; Small, E. A Classification of Endangered High-THC Cannabis (Cannabis sativa Subsp. Indica) Domesticates and Their Wild Relatives. PhytoKeys 2020, 144, 81–112. [Google Scholar] [CrossRef] [PubMed]
- Soorni, A.; Fatahi, R.; Haak, D.C.; Salami, S.A.; Bombarely, A. Assessment of Genetic Diversity and Population Structure in Iranian Cannabis Germplasm. Sci. Rep. 2017, 7, 15668. [Google Scholar] [CrossRef]
- Lynch, R.C.; Vergara, D.; Tittes, S.; White, K.; Schwartz, C.J.; Gibbs, M.J.; Ruthenburg, T.C.; deCesare, K.; Land, D.P.; Kane, N.C. Genomic and Chemical Diversity in Cannabis. Critical Reviews in Plant Sciences 2016, 35, 349–363. [Google Scholar] [CrossRef]
- Brandt, D.Y.C.; Aguiar, V.R.C.; Bitarello, B.D.; Nunes, K.; Goudet, J.; Meyer, D. Mapping Bias Overestimates Reference Allele Frequencies at the HLA Genes in the 1000 Genomes Project Phase I Data. G3 2015, 5, 931–941. [Google Scholar] [CrossRef]
- Günther, T.; Nettelblad, C. The Presence and Impact of Reference Bias on Population Genomic Studies of Prehistoric Human Populations. PLoS Genet. 2019, 15, e1008302. [Google Scholar] [CrossRef]
- Hickey, G.; Monlong, J.; Ebler, J.; Novak, A.M.; Eizenga, J.M.; Gao, Y.; Human Pangenome Reference Consortium; Marschall, T. ; Li, H.; Paten, B. Pangenome Graph Construction from Genome Alignments with Minigraph-Cactus. Nat. Biotechnol. 2024, 42, 663–673. [Google Scholar] [CrossRef] [PubMed]
- Valiente-Mullor, C.; Beamud, B.; Ansari, I.; Francés-Cuesta, C.; García-González, N.; Mejía, L.; Ruiz-Hueso, P.; González-Candelas, F. One Is Not Enough: On the Effects of Reference Genome for the Mapping and Subsequent Analyses of Short-Reads. PLoS Comput. Biol. 2021, 17, e1008678. [Google Scholar] [CrossRef] [PubMed]
- Epstein, R.; Sajai, N.; Zelkowski, M.; Zhou, A.; Robbins, K.R.; Pawlowski, W.P. Exploring Impact of Recombination Landscapes on Breeding Outcomes. Proc. Natl. Acad. Sci. U. S. A. 2023, 120, e2205785119. [Google Scholar] [CrossRef] [PubMed]
- Taagen, E.; Bogdanove, A.J.; Sorrells, M.E. Counting on Crossovers: Controlled Recombination for Plant Breeding. Trends Plant Sci. 2020, 25, 455–465. [Google Scholar] [CrossRef]
- Holst, F.; Bolger, A.; Günther, C.; Maß, J.; Triesch, S.; Kindel, F.; Kiel, N.; Saadat, N.; Ebenhöh, O.; Usadel, B.; et al. Helixer–de Novo Prediction of Primary Eukaryotic Gene Models Combining Deep Learning and a Hidden Markov Model. bioRxiv, 2023; 2023.02.06.527280. [Google Scholar]
- Aylward, A.J.; Petrus, S.; Mamerto, A.; Hartwick, N.T.; Michael, T.P. PanKmer: K-Mer-Based and Reference-Free Pangenome Analysis. Bioinformatics 2023, 39. [Google Scholar] [CrossRef]
- Mandolino, G.; Carboni, A. Potential of Marker-Assisted Selection in Hemp Genetic Improvement. Euphytica 2004, 140, 107–120. [Google Scholar] [CrossRef]
- Lu, Y.; Young, S.; Linder, E.; Whipker, B.; Suchoff, D. Hyperspectral Imaging With Machine Learning to Differentiate Cultivars, Growth Stages, Flowers, and Leaves of Industrial Hemp (Cannabis sativa L.). Front. Plant Sci. 2021, 12, 810113. [Google Scholar] [CrossRef]
- Stack, G.M.; Toth, J.A.; Carlson, C.H.; Cala, A.R.; Marrero-González, M.I.; Wilk, R.L.; Gentner, D.R.; Crawford, J.L.; Philippe, G.; Rose, J.K.C.; et al. Season-long Characterization of High-cannabinoid Hemp (Cannabis sativa L.) Reveals Variation in Cannabinoid Accumulation, Flowering Time, and Disease Resistance. Glob. Change Biol. Bioenergy 2021, 13, 546–561. [Google Scholar] [CrossRef]
- Smart, L.B.; Toth, J.A.; Stack, G.M.; Monserrate, L.A.; Smart, C.D. Breeding of Hemp (Cannabis sativa). In Plant Breeding Reviews; Goldman, I., Ed.; Wiley, 2022; Vol. 46, pp. 239–288 ISBN 9781119874126.
- Stack, G.M.; Carlson, C.H.; Toth, J.A.; Philippe, G.; Crawford, J.L.; Hansen, J.L.; Viands, D.R.; Rose, J.K.C.; Smart, L.B. Correlations among Morphological and Biochemical Traits in High-Cannabidiol Hemp (Cannabis sativa L.). Plant Direct 2023, 7, e503. [Google Scholar] [CrossRef]
- Weldon, W.A.; Ullrich, M.R.; Smart, L.B.; Smart, C.D.; Gadoury, D.M. Cross-Infectivity of Powdery Mildew Isolates Originating from Hemp (Cannabis sativa) and Japanese Hop (Humulus japonicus) in New York. Plant Health Prog. 2020, 21, 47–53. [Google Scholar] [CrossRef]
- Ahmed, B.; Smart, L.B.; Hijri, M. Microbiome of Field Grown Hemp Reveals Potential Microbial Interactions With Root and Rhizosphere Soil. Front. Microbiol. 2021, 12, 741597. [Google Scholar] [CrossRef] [PubMed]
- Toth, J.A.; Smart, L.B.; Smart, C.D.; Stack, G.M.; Carlson, C.H.; Philippe, G.; Rose, J.K.C. Limited Effect of Environmental Stress on Cannabinoid Profiles in High-cannabidiol Hemp (Cannabis sativa L.). Glob. Change Biol. Bioenergy 2021, 13, 1666–1674. [Google Scholar] [CrossRef]
- Stephen, C.; Zayas, V.A.; Galic, A.; Bridgen, M.P. Micropropagation of Hemp (Cannabis sativa L.). HortScience 2023, 58, 307–316. [Google Scholar] [CrossRef]
- Li, H. Minimap2: Pairwise Alignment for Nucleotide Sequences. Bioinformatics 2018, 34, 3094–3100. [Google Scholar] [CrossRef] [PubMed]
- Fournier, G.; Beherec, O.; Bertucelli, S. Santhica 23 et 27: deux variétés de chanvre (Cannabis sativa L.) sans Δ-9-THC. Ann. Toxicol. Anal. 2004, 16, 128–132. [Google Scholar] [CrossRef]
- Bócsa, I. Interview Professor Dr. Iván Bócsa, the Breeder of Kompolti Hemp. J. Int. Hemp Assoc. 1994, 1, 61–62. [Google Scholar]
- de Meijer, E. Fibre Hemp Cultivars: A Survey of Origin, Ancestry, Availability and Brief Agronomic Characteristics. J. Int. Hemp Assoc. 1995, 2, 66–73. [Google Scholar]
- Ranalli, P. Current Status and Future Scenarios of Hemp Breeding. Euphytica 2004, 140, 121–131. [Google Scholar] [CrossRef]
- Salentijn, E.M.J.; Zhang, Q.; Amaducci, S.; Yang, M.; Trindade, L.M. New Developments in Fiber Hemp (Cannabis sativa L.) Breeding. Ind. Crops Prod. 2015, 68, 32–41. [Google Scholar] [CrossRef]
- Clarke, R.C.; Merlin, M.D. Cannabis Domestication, Breeding History, Present-Day Genetic Diversity, and Future Prospects. CRC Crit. Rev. Plant Sci. 2016, 35, 293–327. [Google Scholar] [CrossRef]
- Dewey, L. Hemp Varieties of Improved Type Are Result of Selection. In What ’s new in agriculture. Yearbook of the United States Department of Agriculture—1927; Government Printing Office: Washington, D.C, 1928; pp. 358–361. [Google Scholar]
- Charlesworth, D.; Willis, J.H. The Genetics of Inbreeding Depression. Nat. Rev. Genet. 2009, 10, 783–796. [Google Scholar] [CrossRef] [PubMed]
- Crnokrak, P.; Barrett, S.C.H. Perspective: Purging the Genetic Load: A Review of the Experimental Evidence. Evolution 2002, 56, 2347–2358. [Google Scholar] [CrossRef] [PubMed]
- Chun, S.; Fay, J.C. Evidence for Hitchhiking of Deleterious Mutations within the Human Genome. PLoS Genet. 2011, 7, e1002240. [Google Scholar] [CrossRef] [PubMed]
- Haenel, Q.; Laurentino, T.G.; Roesti, M.; Berner, D. Meta-Analysis of Chromosome-Scale Crossover Rate Variation in Eukaryotes and Its Significance to Evolutionary Genomics. Mol. Ecol. 2018, 27, 2477–2497. [Google Scholar] [CrossRef]
- Brazier, T.; Glémin, S. Diversity and Determinants of Recombination Landscapes in Flowering Plants. PLoS Genet. 2022, 18, e1010141. [Google Scholar] [CrossRef]
- Yan, H.; Jin, W.; Nagaki, K.; Tian, S.; Ouyang, S.; Buell, C.R.; Talbert, P.B.; Henikoff, S.; Jiang, J. Transcription and Histone Modifications in the Recombination-Free Region Spanning a Rice Centromere. Plant Cell 2005, 17, 3227–3238. [Google Scholar] [CrossRef]
- Fowler, D.K. Cannabis Plant with Increased Cannabichromenic Acid. World Patent 2022.
- Schalamun, M.; Schwessinger, B. High Molecular Weight GDNA Extraction after Mayjonade et al. Optimised for Eucalyptus for Nanopore Sequencing. 2017. [Google Scholar]
- Chen, S.; Zhou, Y.; Chen, Y.; Gu, J. Fastp: An Ultra-Fast All-in-One FASTQ Preprocessor. Bioinformatics 2018, 34, i884–i890. [Google Scholar] [CrossRef]
- Cheng, H.; Concepcion, G.T.; Feng, X.; Zhang, H.; Li, H. Haplotype-Resolved de Novo Assembly Using Phased Assembly Graphs with Hifiasm. Nat. Methods 2021, 18, 170–175. [Google Scholar] [CrossRef]
- Astashyn, A.; Tvedte, E.S.; Sweeney, D.; Sapojnikov, V.; Bouk, N.; Joukov, V.; Mozes, E.; Strope, P.K.; Sylla, P.M.; Wagner, L.; et al. Rapid and Sensitive Detection of Genome Contamination at Scale with FCS-GX. Genome Biol. 2024, 25, 1–25. [Google Scholar] [CrossRef] [PubMed]
- Dovetail Genomics Dovetail Omni-C 0.1 Documentation. Available online: https://omni-c.readthedocs.io/en/latest/index.html (accessed on 15 May 2024).
- Zhou, C.; McCarthy, S.A.; Durbin, R. YaHS: Yet Another Hi-C Scaffolding Tool. Bioinformatics 2023, 39. [Google Scholar] [CrossRef] [PubMed]
- Durand, N.C.; Shamim, M.S.; Machol, I.; Rao, S.S.P.; Huntley, M.H.; Lander, E.S.; Aiden, E.L. Juicer Provides a One-Click System for Analyzing Loop-Resolution Hi-C Experiments. Cell Syst 2016, 3, 95–98. [Google Scholar] [CrossRef] [PubMed]
- Cabanettes, F.; Klopp, C. D-GENIES: Dot Plot Large Genomes in an Interactive, Efficient and Simple Way. PeerJ 2018, 6, e4958. [Google Scholar] [CrossRef] [PubMed]
- Pertea, G.; Pertea, M. GFF Utilities: GffRead and GffCompare. F1000Res. 2020, 9, 304. [Google Scholar] [CrossRef]
- Cantalapiedra, C.P.; Hernández-Plaza, A.; Letunic, I.; Bork, P.; Huerta-Cepas, J. EggNOG-Mapper v2: Functional Annotation, Orthology Assignments, and Domain Prediction at the Metagenomic Scale. Mol. Biol. Evol. 2021, 38, 5825–5829. [Google Scholar] [CrossRef]
- Manni, M.; Berkeley, M.R.; Seppey, M.; Simão, F.A.; Zdobnov, E.M. BUSCO Update: Novel and Streamlined Workflows along with Broader and Deeper Phylogenetic Coverage for Scoring of Eukaryotic, Prokaryotic, and Viral Genomes. Mol. Biol. Evol. 2021, 38, 4647–4654. [Google Scholar] [CrossRef]
- Li, H. Aligning Sequence Reads, Clone Sequences and Assembly Contigs with BWA-MEM. arXiv [q-bio.GN], 2013. [Google Scholar]
- R Core Team R: A Language and Environment for Statistical Computing; R Foundation for Statistical Computing: Vienna, Austria, 2024.
- Taylor, J.; Butler, D. R Package ASMap: Efficient Genetic Linkage Map Construction and Diagnosis. J. Stat. Softw. 2017, 79, 1–29. [Google Scholar] [CrossRef]
- Broman, K.W.; Wu, H.; Sen, S.; Churchill, G.A. R/Qtl: QTL Mapping in Experimental Crosses. Bioinformatics 2003, 19, 889–890. [Google Scholar] [CrossRef]
- Camacho, C.; Coulouris, G.; Avagyan, V.; Ma, N.; Papadopoulos, J.; Bealer, K.; Madden, T.L. BLAST+: Architecture and Applications. BMC Bioinformatics 2009, 10, 421. [Google Scholar] [CrossRef]
- Van der Auwera, G.A.; Carneiro, M.O.; Hartl, C.; Poplin, R.; Del Angel, G.; Levy-Moonshine, A.; Jordan, T.; Shakir, K.; Roazen, D.; Thibault, J.; et al. From FastQ Data to High Confidence Variant Calls: The Genome Analysis Toolkit Best Practices Pipeline. Curr. Protoc. Bioinformatics 2013, 43, 11.10.1–11.10.33. [Google Scholar] [CrossRef] [PubMed]
- Danecek, P.; Auton, A.; Abecasis, G.; Albers, C.A.; Banks, E.; DePristo, M.A.; Handsaker, R.E.; Lunter, G.; Marth, G.T.; Sherry, S.T.; et al. The Variant Call Format and VCFtools. Bioinformatics 2011, 27, 2156–2158. [Google Scholar] [CrossRef] [PubMed]
- Zhang, J.; Panthee, D.R. PyBSASeq: A Simple and Effective Algorithm for Bulked Segregant Analysis with Whole-Genome Sequencing Data. BMC Bioinformatics 2020, 21, 99. [Google Scholar] [CrossRef] [PubMed]
- Persephone Software, L.L.C. Persephone® Genome Browser. 2024. [Google Scholar]
- Wickham, H. ggplot2: Elegant Graphics for Data Analysis; Springer, 2016; ISBN 9783319242774.
Figure 1.
Seven new C. sativa assemblies in the context of existing genomes A) Jaccard clustering of 100 haplotypes from 50 chromosome-level phased assemblies based on a 31-mer PanKmer index. Aligned bar plot shows the number of unique 31-mers identified in each haplotype from a 31-mer index of 217 C. sativa assemblies. B) The proportion of each of the 50 chromosome-level phased C. sativa assemblies covered by aligned runs of homozygosity (AROH) of various sizes derived from pairwise minimap2 alignments between haplotypes C) The number of unique k-mers found in both haplotypes plotted against the proportion of the genome covered by AROH greater than 50kb. D) PanKmer collector’s curve from the 31-mer index of 217 C. sativa assemblies. Colors in panels A-C indicate assemblies from this paper. Shapes in panels A and C indicate the name and group that each assembly is associated with based on provided metadata per the legend in panel C.
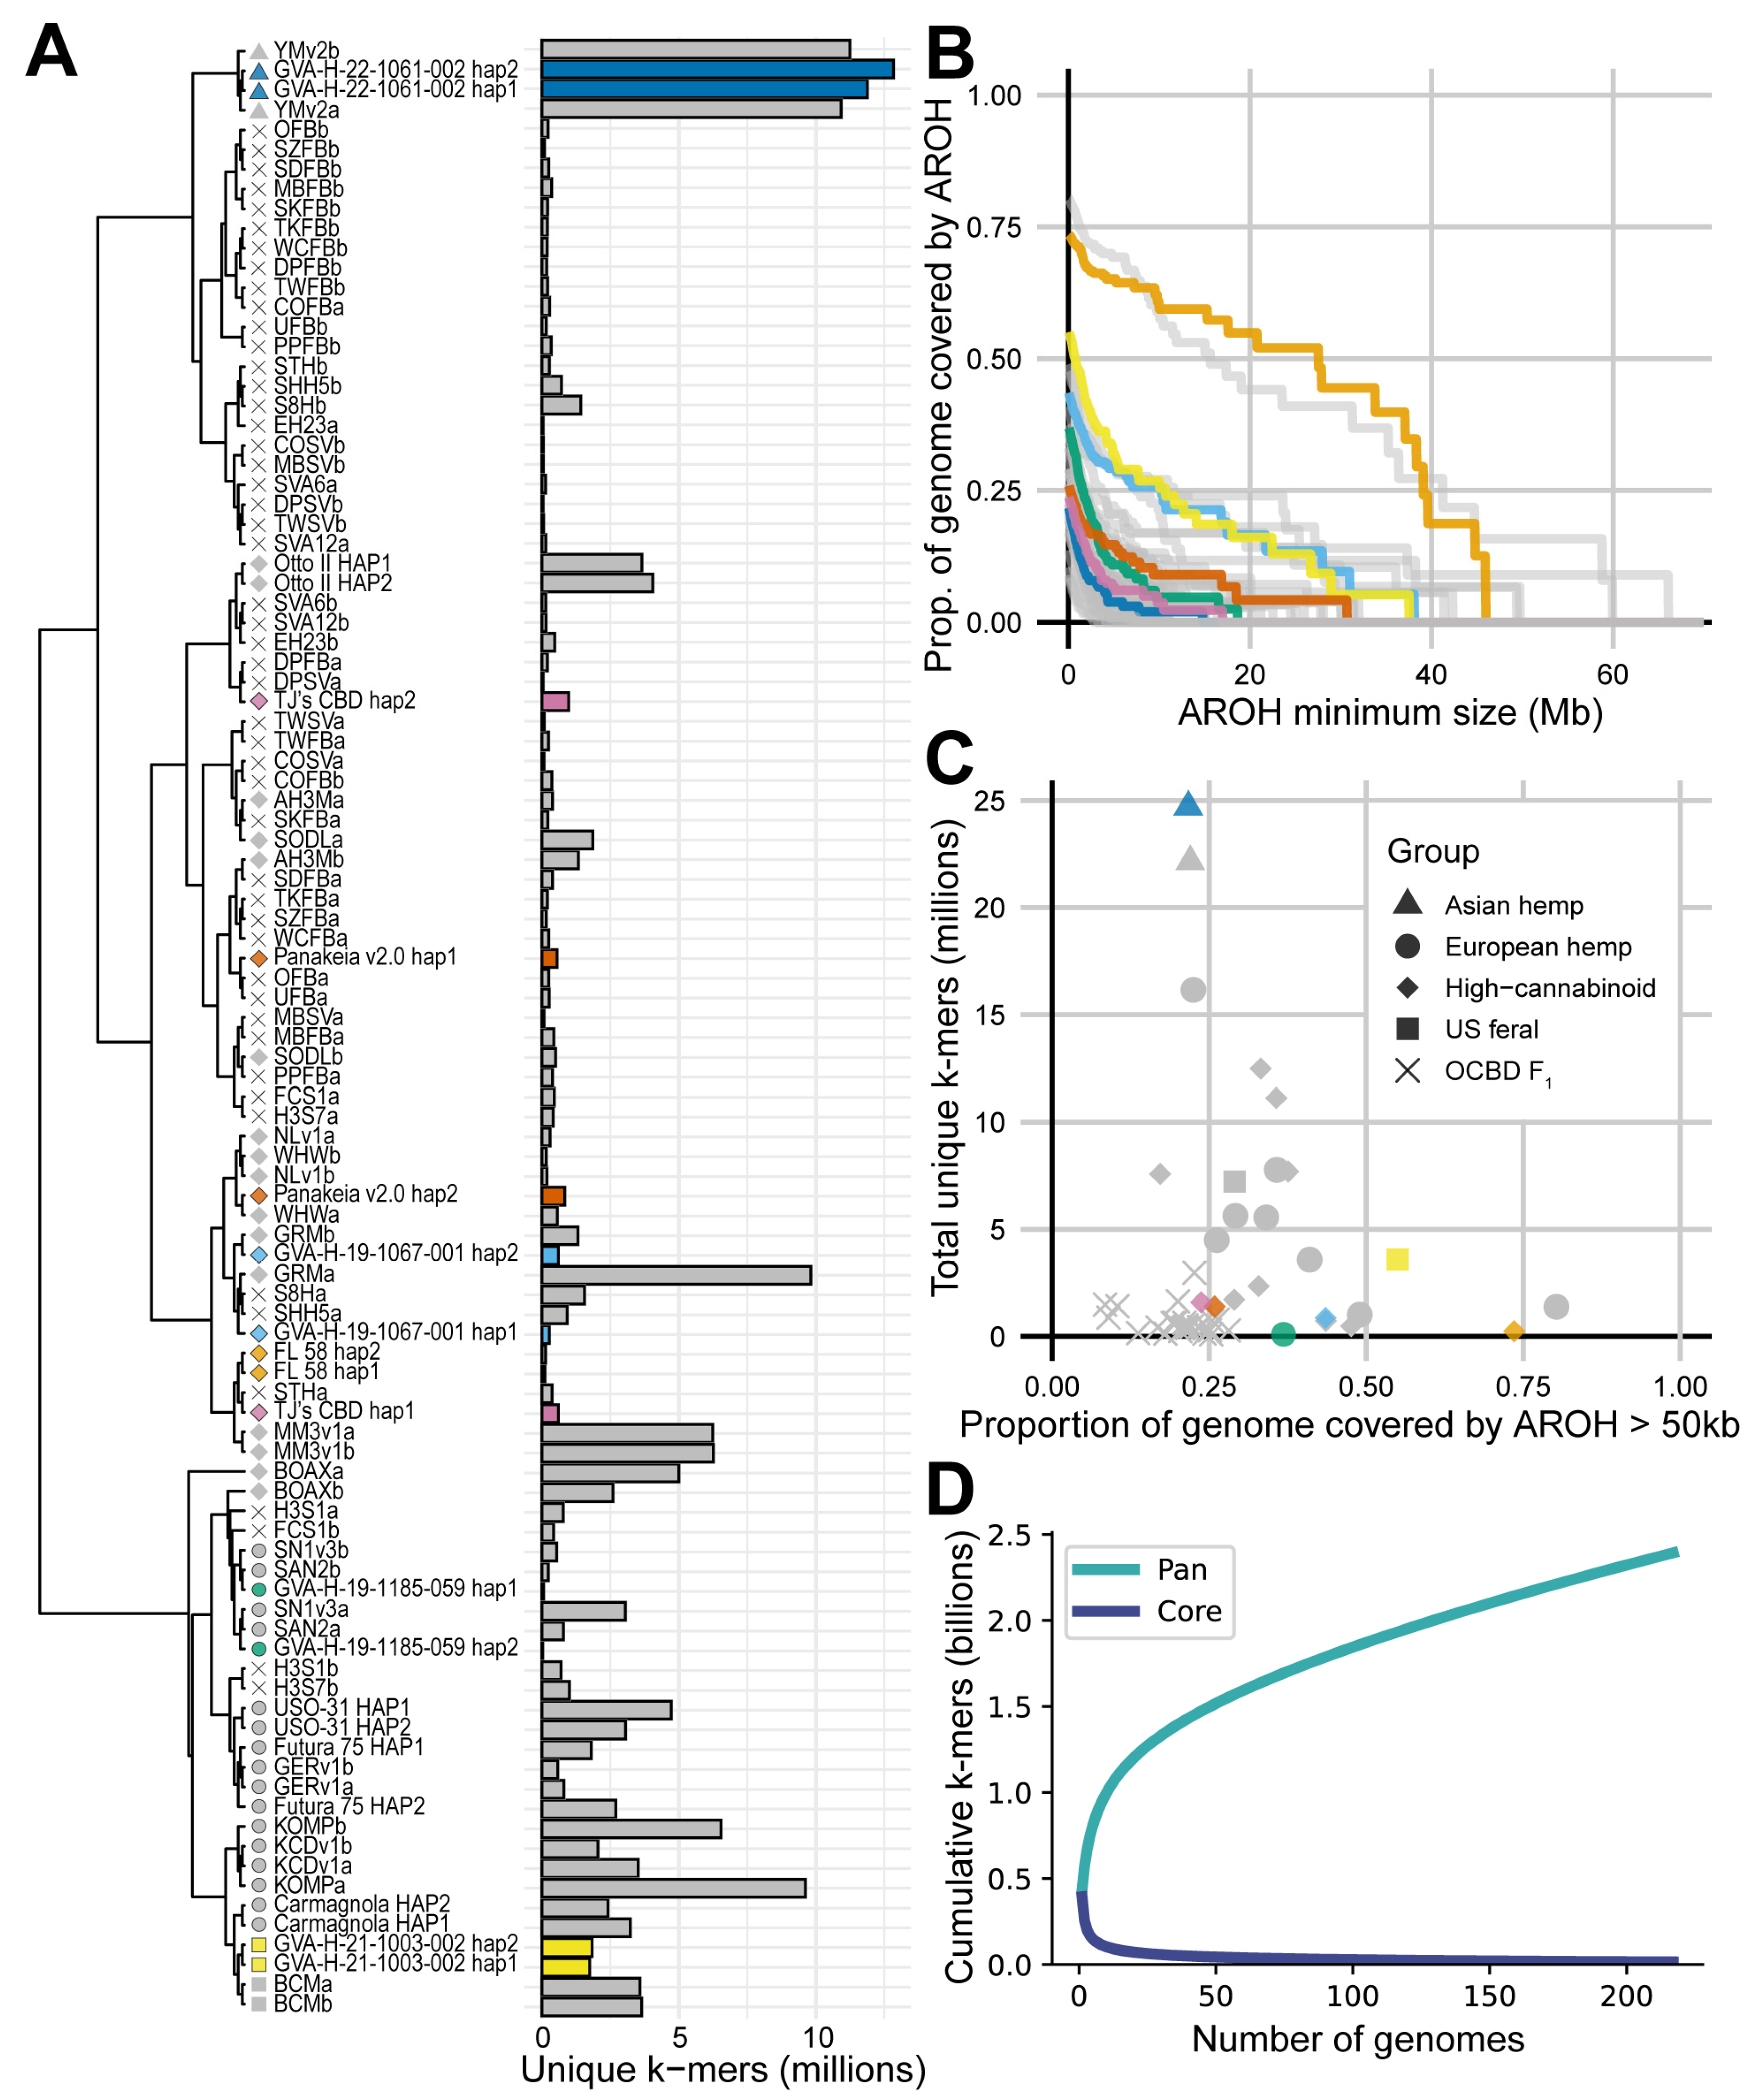
Figure 2.
Alignment of seven phased chromosome-level genome assemblies of C. sativa. Each sequenced genotype is represented by 20 chromosomes phased into two haploid assemblies. Shading within each rectangle indicates the count of unique 31-mers aligned in 1 Mb bins across each assembled chromosome. Grey polygons with black borders connecting homologous chromosomes show pairwise alignments greater than 400kb. For the two XY assemblies, GVA-H-21-1003-002 and GVA-H-22-1061-002, the Y chromosome is included in haplotype 2.
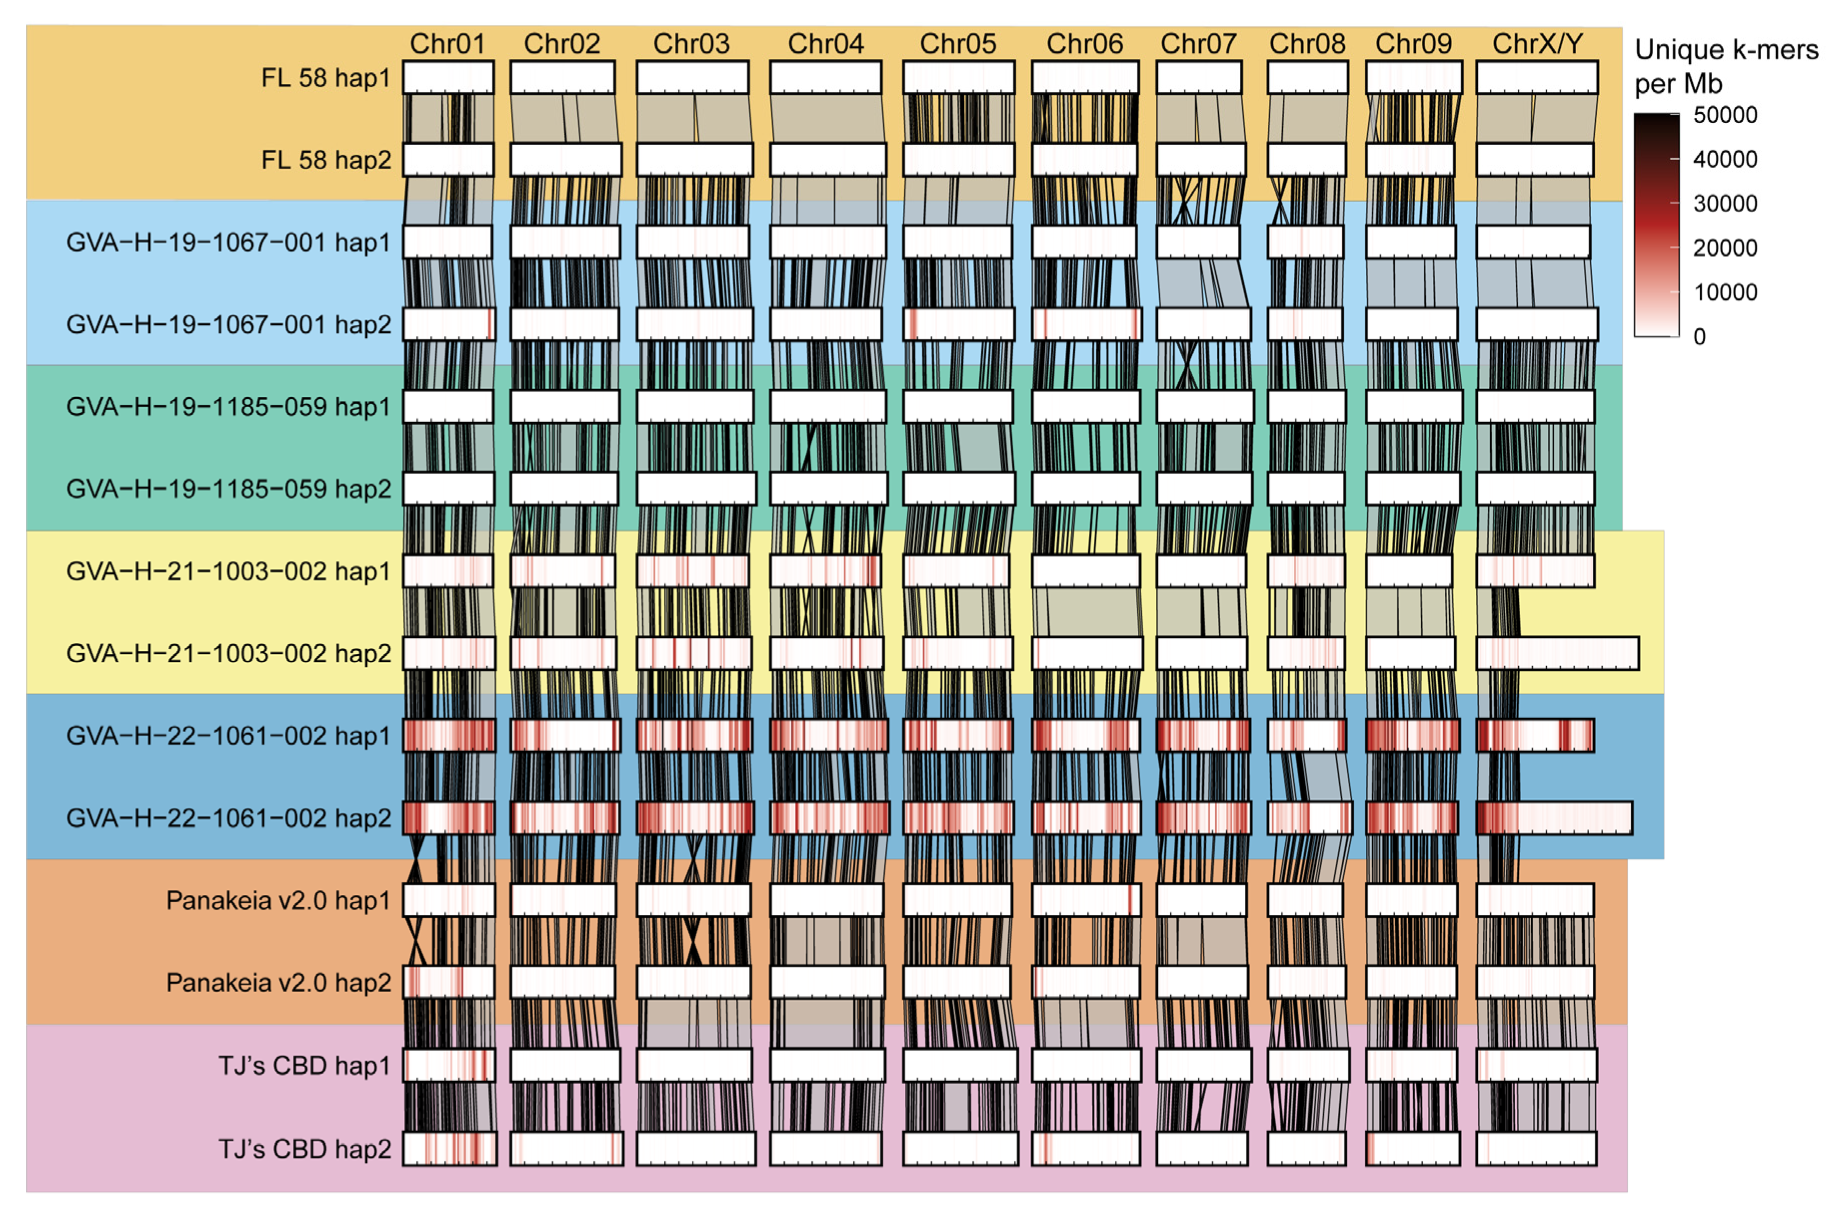
Figure 3.
Estimated recombination rate across the 10 chromosomes of C. sativa. A) Recombination rate plotted against position. Colors in both panels represent the linkage maps for each of the ‘FL 58’ ✕ ‘TJ’s CBD’ F2 families as well as the map from the combined data of both families. B) Minor allele frequency (MAF) plotted against position on Chr03, Chr07, and Chr08 for the two F2 families.
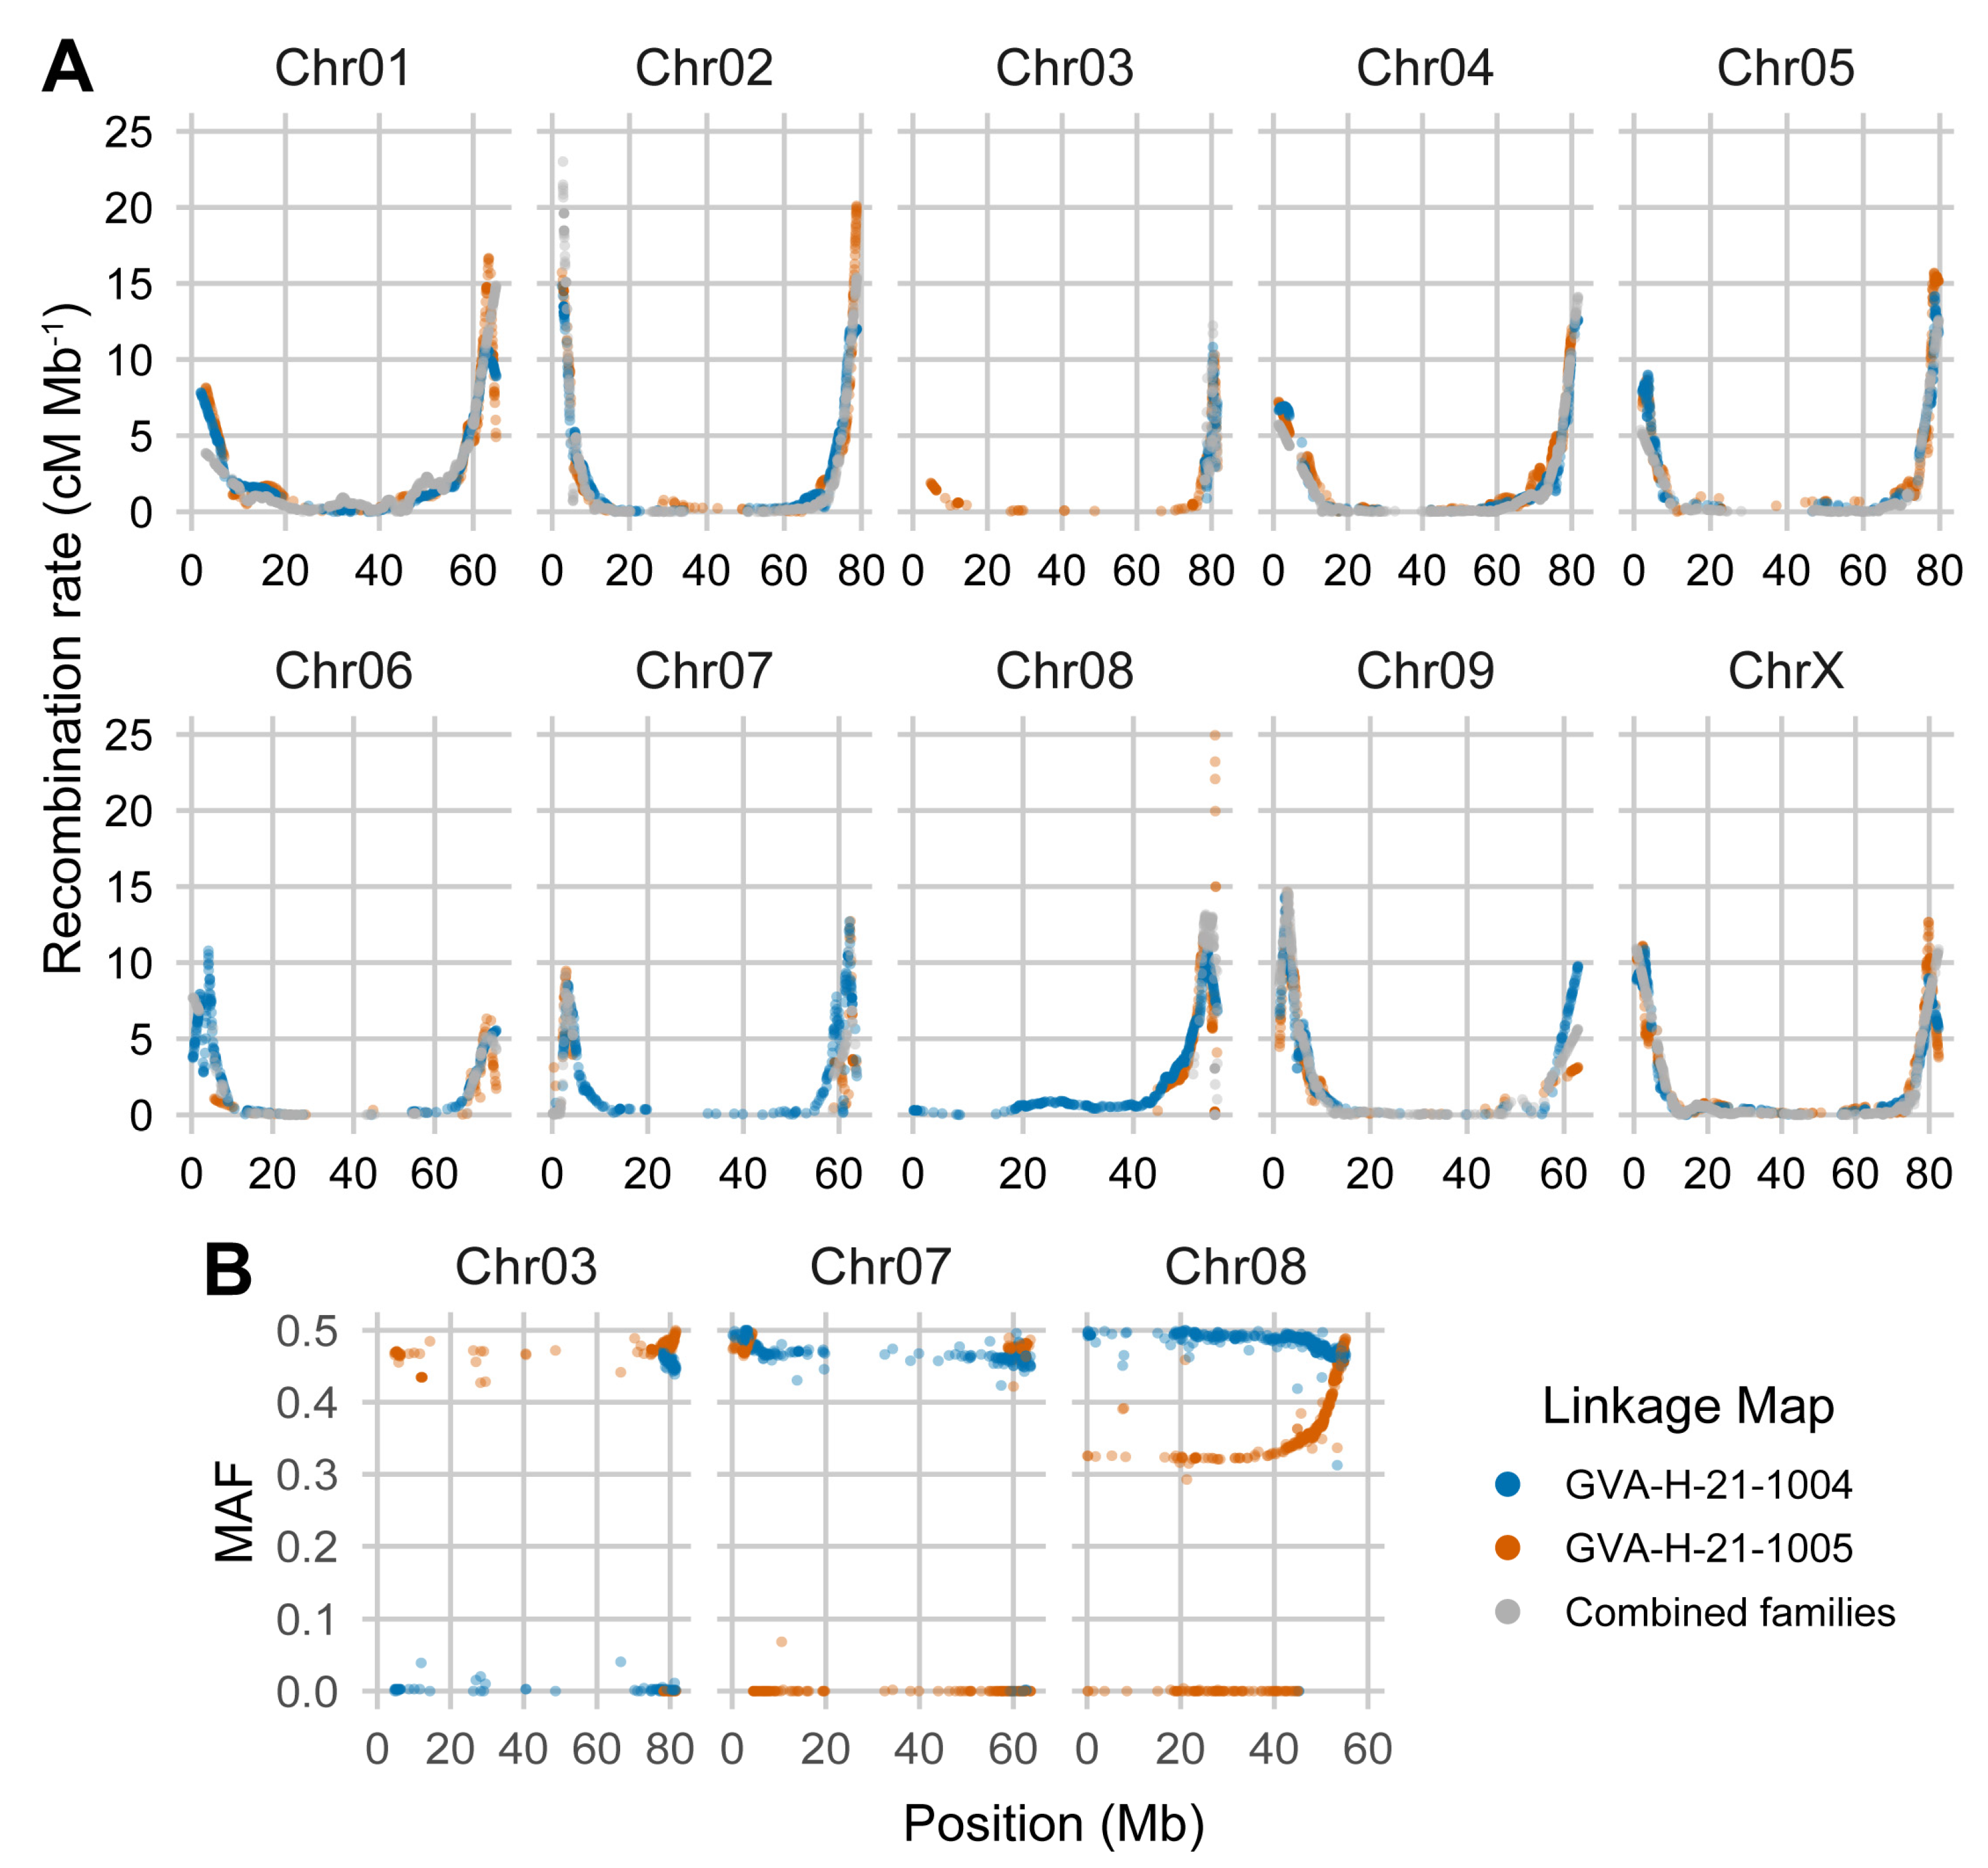
Figure 4.
Bulk segregant analysis (BSA) mapping of the major-effect flowering locus Early1 using six different genome assemblies as references for alignment. A) Moving average of G-statistic, dark blue line, in sliding windows every 10 kb plotted against position for Chr01. Dashed red horizontal lines are the significance threshold. Grey polygons with black borders connecting chromosomes show pairwise minimap2 alignments >250 kb. B) Syntenic ~3.5 Mb section of Chr01 surrounding the peak markers when using the ‘Panakeia v2.0’ and GVA-19-1185-059 assemblies. Dashed red vertical lines are the most significant sliding window when using each assembly. Grey polygons with black borders connecting homologous chromosomes show pairwise minimap2 alignments >5 kb.
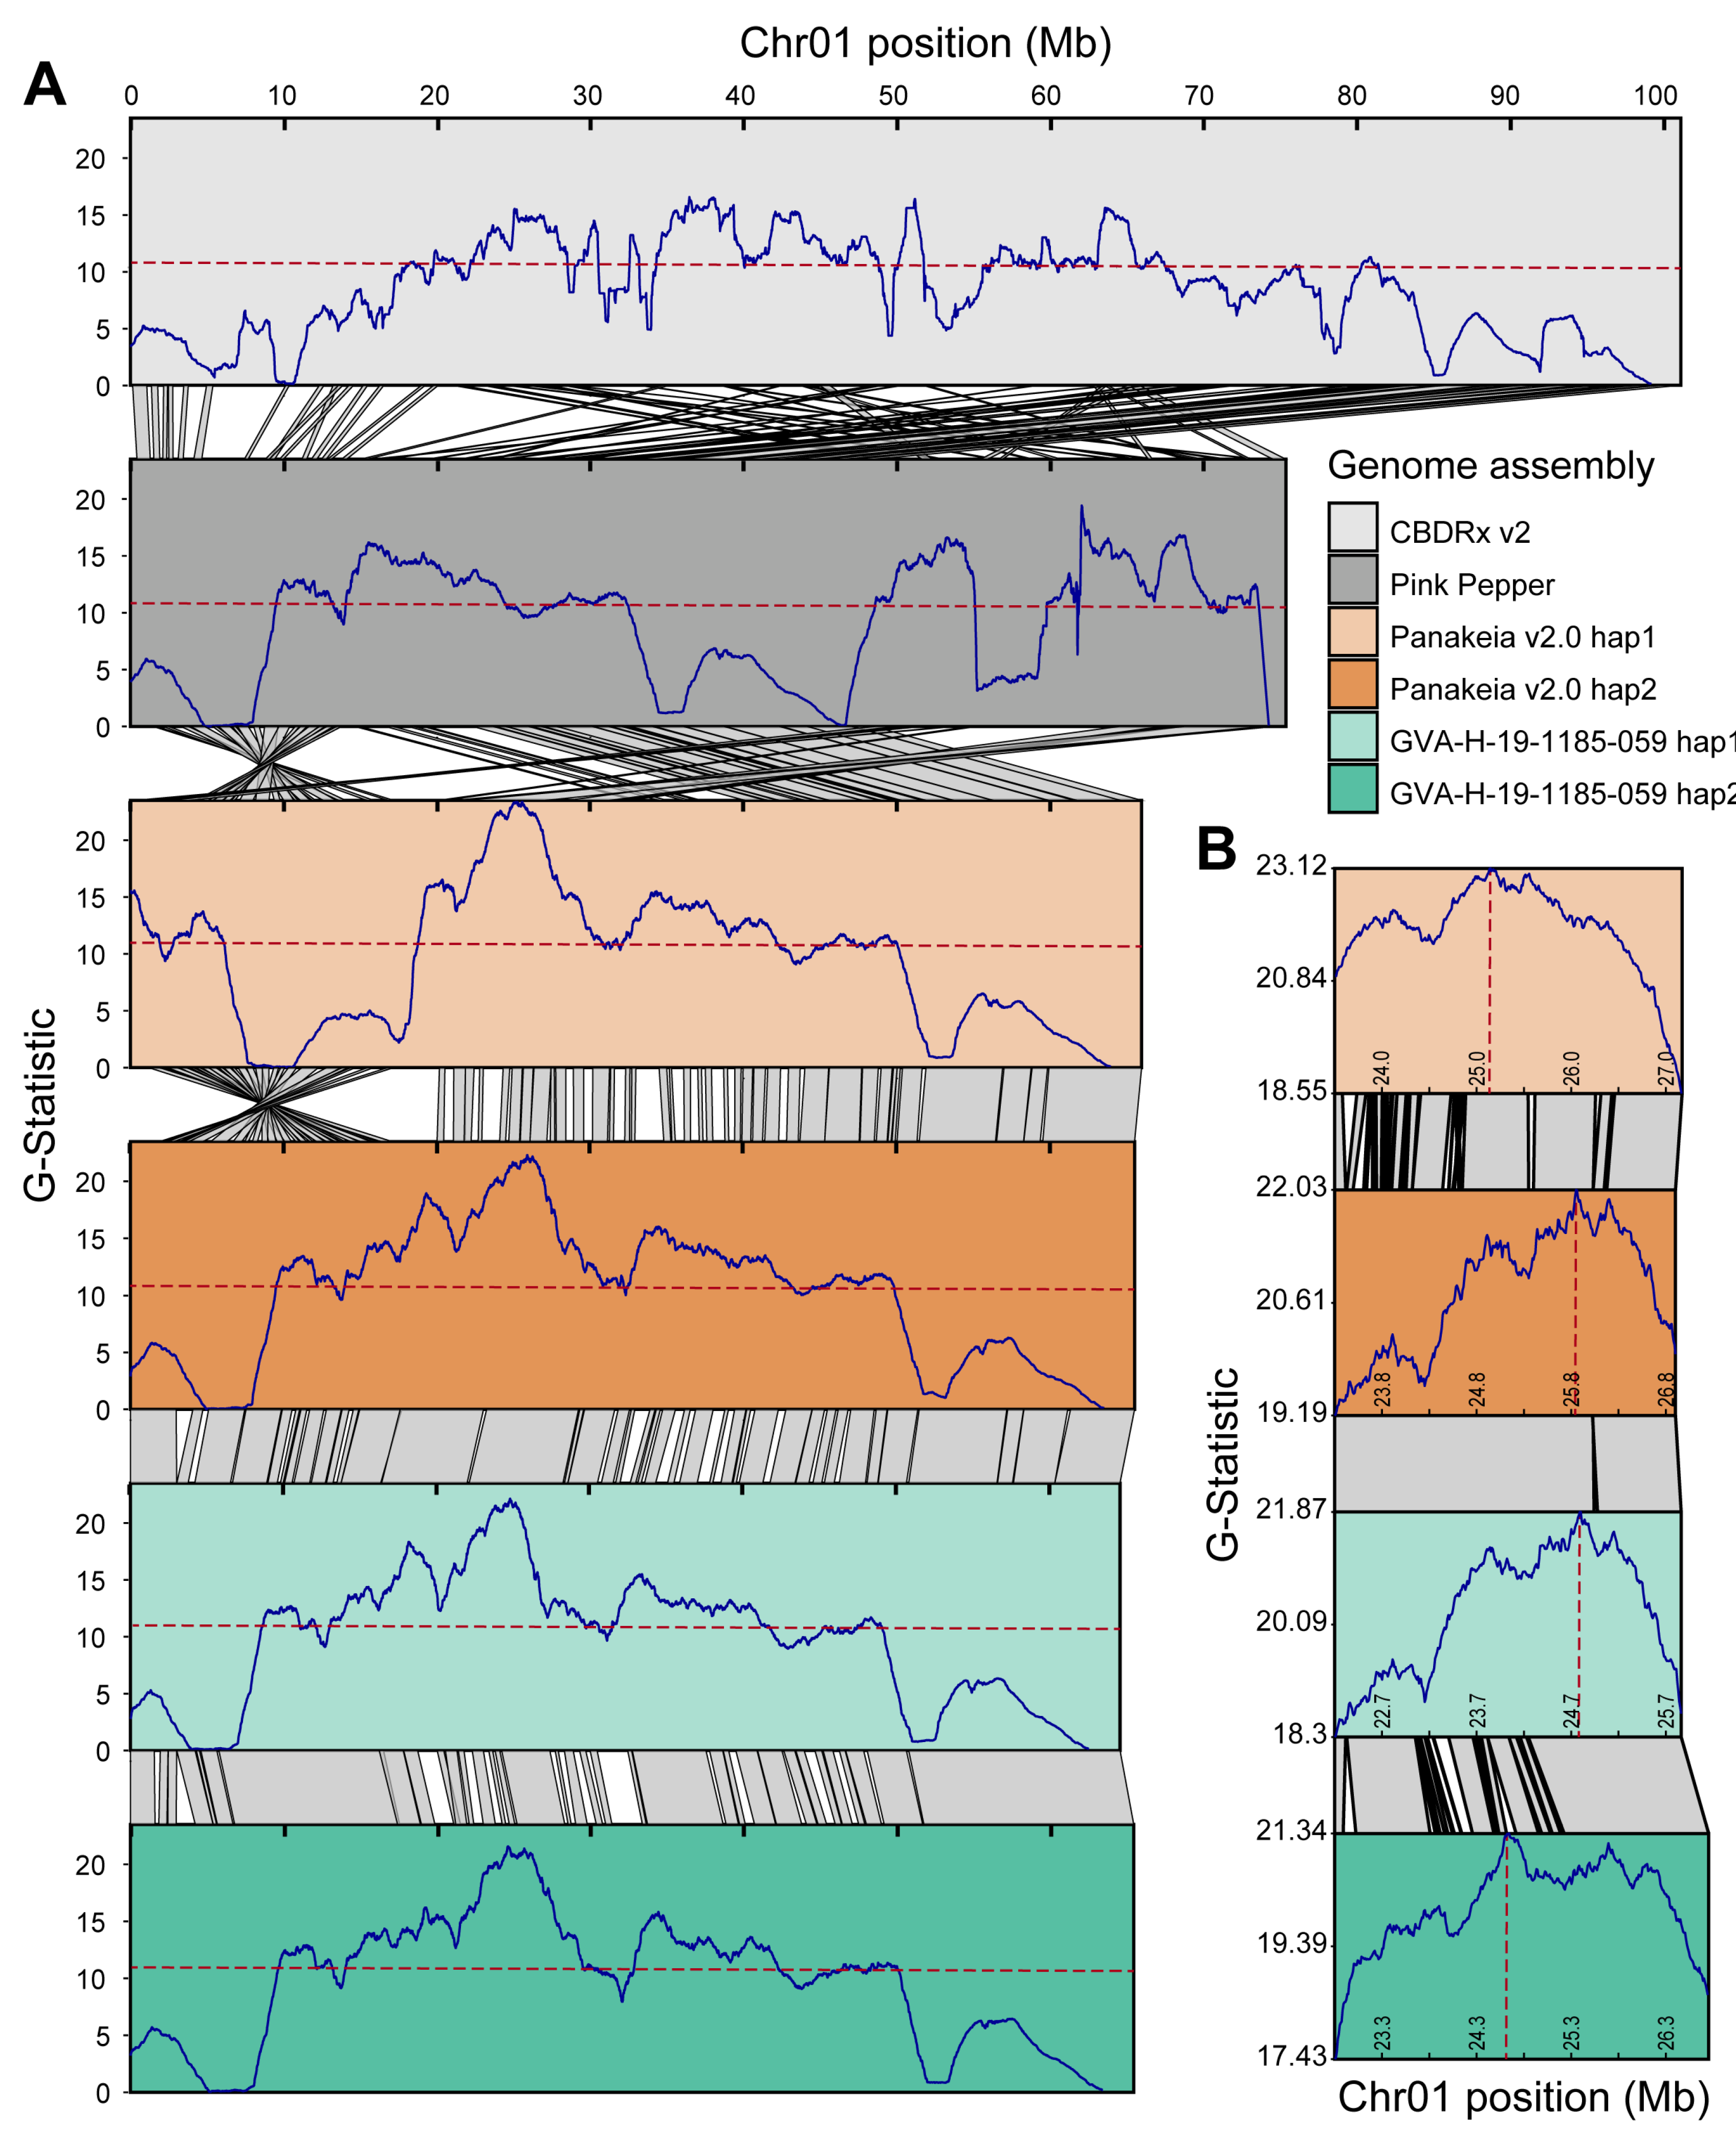
Table 1.
Summary of several population structure analyses conducted on C. sativa.
| Publication | N samples | N groups | High-cannabinoid group(s) | European hemp group(s) | Asian hemp group | Other group(s) |
|---|---|---|---|---|---|---|
| Sawler et al. [17] | 124 | 2 | Marijuana | Hemp | n/a | n/a |
| Soorni et al. [30] | 209 | 4 | Marijuana | Hemp CGN/IPK |
n/a | Iran |
| Lynch et al. [31] | 340 | 3 | BLDT NLDT |
Hemp | n/a | n/a |
| Grassa et al. [6] | 367 | 3 | Marijuana | Hemp | n/a | Naturalized |
| Carlson et al. [18] | 190 | 7 | T1/R4; Cherry West Coast BaOx/Otto II |
Grain/Dual Fiber/Feral |
Chinese | n/a |
| Ren et al. [2] | 110 | 4 | Drug-type Drug-type Feral |
Hemp-type | n/a | Basal Cannabis |
| Woods et al. [19] | 190 | 4 | Marijuana | European | Asian | U.S. Feral |
| Lynch et al. [25] | 193 | 5 | Drug-type ERB & EH23b Drug-type HO40 & EH23a |
European Hemp and Feral | Asian Hemp | Wild Tibet |
Disclaimer/Publisher’s Note: The statements, opinions and data contained in all publications are solely those of the individual author(s) and contributor(s) and not of MDPI and/or the editor(s). MDPI and/or the editor(s) disclaim responsibility for any injury to people or property resulting from any ideas, methods, instructions or products referred to in the content. |
© 2024 by the authors. Licensee MDPI, Basel, Switzerland. This article is an open access article distributed under the terms and conditions of the Creative Commons Attribution (CC BY) license (http://creativecommons.org/licenses/by/4.0/).
Copyright: This open access article is published under a Creative Commons CC BY 4.0 license, which permit the free download, distribution, and reuse, provided that the author and preprint are cited in any reuse.


