Submitted:
22 November 2024
Posted:
25 November 2024
You are already at the latest version
Abstract
The sulphur content of the atmosphere has fallen sharply in recent decades. Due to a reduction in plant nutrition with sulphur, this has also led to a drop in the S concentrations in certain plant species over time. As a result, a lot of experimental work was carried out to remedy the emerging yield and quality deficiencies on the farms. In this summarized study, data from 98 sites in Central Europe were recorded from 1998 to 2023 received from sulphur fertiliser trials carried out on farms and experimental stations under organic farming conditions. This second part of meta-analysis focuses on establishing relationships between the status of plant nutrient supply with sulphur and DM yield responses, the nitrogen uptake of crop species and the extent of N2 fixation in legumes. Results of regression analyses based on the effect of the S concentrations and the N:S ratios of the crop species on the relative yield differences between 851 standard variants (=100%) and 1177 sulphur treatment variants. In principle, declining yield increases were determined as a result of increasing S concentrations and decreasing N:S ratios. Except in the case of grain legume young plants, both characteristics were suitable for determining corresponding limit values for yield formation. Different values were determined depending on the plant species and harvest material. In extensive comparative analyses and discussion with literature data, minimum sulphur concentrations and maximum values for N:S ratios for young plants, vegetative harvest material (straw) and grain materials are proposed to ensure optimum yields of permanent grassland, lucerne-clover-grass, grain legumes and cereals for use in practice of agricultural systems of different intensities.
Keywords:
Central European countries
; organic farming
; sulphur fertilizer trial evaluation
; determination of minimum S concentrations and maximum N:S ratios
; young plants
; straw and grains
; receiving optimum yields of crop species
1. Introduction and Objectives
Sulphur is an essential nutrient that fulfils various important functions in plants. A good supply of S increases the quantity and biological value of protein e.g., in feeding trials, improves the baking quality of wheat, reduces nitrate accumulation in leafy vegetable plants, increases flavour-forming substances and secondary constituents such as mustard and leek oils, especially in cabbage, mustard and onions [1,2,3]. Sulphur also plays an important role in the nitrogen binding of legumes through its direct involvement in the N2 fixation process [4,5]. There are special plant-physiological relationships between S and N concentrations of different plant parts, which resulting also in similar deficiency symptoms: Lightening of younger leaves, leaf veins often remain green. It is almost impossible for S to be translocated in the plant, therefore older leaves remain dark green, with N deficiency the older leaves also lighten in colour. Fuentes-Lara et al. [6] have described the conversion processes from soil sulphur to plant sulphur compounds in detail. Bloem et al. [7] listed important research on the influence of sulphur in metabolic processes and on the susceptibility and resistance of plants to disease.
Plant analyses are an important way of determining the degree of nutrient supply [8,9]. This involves the comparison of test results of the nutrient concentrations of certain plant parts, usually in early vegetation stages, with tabular values that originate from experimental work from pot and field trials and are described as being sufficient for the individual plant species for optimum plant growth. For the main nutrients, and usually also for micronutrients, extensive research results are available from conventional agriculture [10,11,12].
However, for a long time there was no need for the nutrient sulphur because there was an oversupply of plants rather than a deficiency, mostly caused by S emissions from industrialisation. But in recent decades the sulphur content of the atmosphere has fallen sharply. This has led to a decrease in sulphur supply and also to a sulphur deficiency in certain plant species, even in the organic farming systems [13,14,15,16]. As a result of this development, there has been a lot of experimental activity to overcome yield and quality reductions caused by S deficiency on farms.
In addition, the supply level in conventional agriculture, e.g., with the main growth factor nitrogen, is often twice as high as in organic farming [17]. This makes it necessary to check and, if necessary, adjust all other growth factors according to the nutrient level of the cultivation system on the basis of the long-known minimum and optimum laws of plant growth [18,19]. However, hardly any research has yet been carried out into the required optimum levels of sulphur in the plant materials used in organic farming [20,21,22].
In this study, therefore, a comparative cross-regional evaluation of many field trials is carried out in the form of a meta-study to obtain and determine optimal S concentrations and N:S ratios of plant species for use in organic farming cultivation systems [23,24]. The analyses focused on the following objectives:
- -
- Establishment of quantitative relationships between the sulphur concentrations or N:S ratios of the plant species and the DM yield responses, N removals of the crops and the extent of N2 fixation in legumes;
- -
- Identification of S concentrations and N:S ratios of the plant species that can be considered as sufficient for the cultivation conditions of organic farming to achieve optimum yields;
- -
- Comparison of these values from three growth stages (young plants, vegetative harvest and grain materials) of the plant species between different intensive cultivation systems (organic–conventional).
2. Materials and Methods
For the nutrient sulphur (S), fertilisation trials under organic cultivation conditions were collected from the period 1998–2023. From 98 sites with a focus on Central Europe, results from a total of 1169 treatment variants with S fertilisation and 598 standard variants without fertilisation were recorded in EXCEL files. See Part 1 of this study by Kolbe [25] for a description of the sites, trial facilities and data analyses. The cultivated crop species were generally summarised into species groups or evaluated individually: Permanent grassland with grass and clover species (white clover), forage legumes e.g., from lucerne-clover-grass, grain legume and cereal species, other species (including maize, winter oilseed rape).
Certain principles had to be observed in the trials. In addition to long-term compliance with the cultivation conditions of organic farming [24], only fertilisers that were approved or undergoing scientific testing were allowed to be used. For reasons of the ceteris paribus rule, no organic fertilisers could be used, only ordinary mineral S fertilisers. The fertilisers were applied directly to the crop (direct effect) or to a legume preceding crop, whereby a test of non-legume following crops was also included (succseding effect). Each individual trial had to include at least one standard variant in which no S fertiliser was applied.
At least annual DM yield data on main products (or on total yields from individual harvests or on main and by-products) of the cultivated crop species had to be available for all variants. The N removals and N2 fixation values of the legumes were also recorded. The result values used, e.g., from the DM yields, were determined at least from a standard value (=100%) with no or low fertilisation and a treatment value from variants with fertilisation or with higher fertilisation and shown as a relative yield difference. This approach made it possible to analyse the nutrient-related differences between the recorded sites, crop years and crop species together in one evaluation.
Furthermore, the determined S concentrations (n = 1087), N concentrations (elementary analyser, VDLUFA-Methodenbuch 3.4.1.54b, N also with Kjeldahl method, e.g., VDLUFA-Methodenbuch vol. 1, part A, Section 2.2.1.; https://www.vdlufa.de) or the N:S ratios (S = 1, n = 784) of the standard variants in the plant materials were recorded in up to three vegetation stages (% DM): Young plants until before the flowering stage, vegetative harvest material: mostly by-product (BP) straw, main product (MP) grain. Typical harvest times and analysis methods can be found in Schmidtke & Lux [21] and Becker et al. [20].
Regression analyses were used to compare the S concentrations and N:S ratios found with the yield results and other characteristics of the investigated crop species. Those nutrient concentrations or coefficients were determined from which an optimum yield level could be manifested, or through which, in the sense of the minimum law according to [18], on average no yield losses would occur. For this purpose, the S concentrations from the scatterplots were recorded visually or determined by calculation where the regression curves reach and exceed the 100% mark (b–100), which gives the indication of no yield effects. In addition, the standard errors of the regression were determined, whereby in this case the error values for the S concentrations or N:S ratios (S–x) are of greater importance. Finally, the minimum S concentrations or the maximum N:S rations (y) can be roughly calculated using the values at 100% yield difference and additional deduction of the error values or addition for the N:S ratios (y = b–100 ± S–x). Other evaluation methods were also discussed [26]. With the help of comparative boxplot analyses, a more precise fixation of the optimum values for sulphur was achieved between the results determined here and literature data from conventional agriculture.
The statistical analysis of the test data was carried out using the EXCEL programme. Regression analyses, correlations (r), scatterplots, boxplots, median, mean (MV), quartiles, number (n), standard deviation (s), standard error of the mean, standard error of the regression (S), the coefficient of determination (R2) and the equation slope (b) were calculated. Significance levels (one-sided tests): p < 0.10 (*), p < 0.05 *, p < 0.01 **, p < 0.001 ***, n.s. = not significant.
3. Results
3.1. Estimating the Influence of Site Factors
In the investigations, some important accompanying characteristics of the sites were recorded, which could potentially have an influence on the main characteristics investigated (not shown). For example, increasing Smin values (=soluble mineral SO4-S) to characterise the plant-available sulphur in the soil usually also resulted in increasing S concentrations in the standard variants of the plants. At the same time, the N concentrations of the legumes analysed also increased somewhat due to improved conditions for N2 fixation, while the N concentrations in the non-legumes hardly changed.
The pH values of the soils obviously also influenced some characteristics to a lesser extent, as evidenced, for example, by a slight increase in the N:S ratios of the plants. The influences of clay content and current precipitation were somewhat more pronounced. In soils with increasing values, both slightly higher S concentrations were found in the plant materials, while the N concentrations and the N:S ratios tended to decrease somewhat. In detail, only certain positive influences of the better soils and relatively high precipitation on the yield differences in the lucerne-clover-grass and some cereal variants occurred. Overall, however, only very small effects of the site factors on the analysed yields were observed, which made it easier to conduct the main investigations.
3.2. Effects of Plant Sulphur Concentrations and N:S Ratios
The total sulphur concentration and the N:S ratios (S = 1) of the standard variants without S fertilisation were determined during the vegetation periods of the plant growths and harvests. In total, analyses of the S concentrations of 1177 variants and of the N:S ratios of 851 standard variants were available. The mean values and the standard deviation of the S (and N) concentrations and the N:S ratios of the analysed plant species groups are shown in Table 1. The S concentrations (0.06–0.38% DM) and N:S ratios (4.2–39.9) were determined from 7 data series. Due to the relatively small number of values, the first series consists of a summary of all data determined for grassland. In the case of lucerne-clover-grass, rows 2–4 represent separate S analyses in the growth of grass, legumes and legume-grass mixtures, which were determined among others by the following experimenters: Refs. [16,20,27,28]. In addition, 3 further data series could be compiled, in which growth at different times of the growing season and regional differences were recorded, which include the following studies: Refs. [20,22,29,30,31,32,33]. For the grain legumes and non-legume crop species only three data rows (0.05–0.45% S; 2.0–41.0 N:S rations) were collected. In this chapter, the minimum S concentrations and maximum N:S ratios of the standard variants are first determined using scatterplots and regression analyses. Taking into account the data variability, the values are determined for which, on average, additional S fertilisation does not lead to any further increase in yield (yield mark 100%).
3.2.1. Permanent Grassland and Lucerne-Clover-Grass
After screening and removing outliers, these data for grassland and Lucerne-clover-grasses were compared with the relative difference values determined by the various treatments between standard (=100%) and fertilisation variants for the following characteristics: DM yield, N concentration, N removal, legume proportions of legume-nonlegume mixtures, N2 fixation of legume crops. The following Figure 1 and Figure 2 summarise the results for the S concentration variants in graphical form. In almost all data series, the individual values varied more strongly in the low S concentration area than in the high S concentration range. In addition, two groupings can be recognised in all representations, each consisting of rows 2–4 and 5–7, with the data for grassland growth (row 1) belonging to the latter group. The data numbers for fixing a clear curve of the regressions can generally be described as sufficient. However, only a small amount of data was available for the N removal and N2 fixation differences of permanent grassland.
The regression curves for the arable forage rows (LCG 2–7) are relatively clear and often highly significant (Figure 1). Despite widely varying trends at low S levels, all regressions converge to a concentration range around 100% yield difference with increasing S levels. At these S concentrations, on average no further changes in yield can be observed as a result of additional S fertilisation. This range is approximately at concentrations between 0.30–0.33% S in the dry matter of the plant materials. The curves for rows 2–4 make it easier to localise these transitions than the much flatter curves for rows 5–7 (including grassland row no. 1).
Values from the first growth (row 5) are characterised by a very flat curve and are in some cases much less statistically reliable, while an adjustment is already somewhat more successful for the LCG growths 2 + 3 and for grassland (rows 6, 7, 1). Differences between pure legume and grass crops, which were pre-sorted from the mixtures, should also be noted. The values of pure grass stands in the mixtures show slightly higher S concentrations and the regression curve also reaches the 100% mark at slightly higher S concentrations than in the legume rows (Figure 1). In principle, these specific curves are also found in the evaluation of the N removal and the N2 fixation differences of these plant species (Figure 2). Arable grass always has slightly higher S concentrations and reaches the 100% mark with 0.34–0.35% S at higher values, while the LCG rows 5 and 6 (1st and 2 + 3rd growths) fall below the 100% mark even at S concentrations of 0.20% DM.
After subtracting the standard errors (S–x) from the determined 100% transition values of the regressions (b–100), the individual minimum required S concentrations of the test series can be obtained (Table 2). Using the example of the DM yield differences, these S concentrations for grassland and lucerne-clover-grass are on average 0.26% S (0.24–0.28% S). Based on the N removal values, these required S concentrations are 0.23% S (0.17–0.29% S) and around 0.24% S (0.16–0.28% S) for achieving optimum N2 fixation quantities. According to these results, pre-sorted arable grasses in the legume-grass mixture or grassland, with the usually low legume proportion, have the highest minimum values with 0.28% and 0.26% S respectively. The various LCG crops follow, from pure legumes to the legume-grass mixtures with minimum values between 0.21–0.25% S in the DM growths.
In Figure 3 and Figure 4, the N:S ratios of the standard variants were evaluated in the same way in relation to additional S fertilisation of permanent grassland and the LCG variants. In principle, a visual division of the data series into two groups was again determined. The results for DM yield, N removal and N2 fixation differences were also very similar. Almost all data series reached the 100% mark at a certain level of N:S ratios in the plant materials between 5.0–11.0.
After precise determination of the N:S transition values of the regression curves of the test series in the area of the 100% line and the addition of the standard errors, the following maximum values of N:S ratios for achieving optimum plant growth could be calculated (Table 3):
- -
- DM yields: 12.4 (7.6–16.6);
- -
- N removal: 11.8 (7.5–15.7);
- -
- N2 fixation 12.2 (7.5–16.2).
According to the relatively low results to date, permanent grassland should not exceed a maximum N:S ratio of around 10.0. The lowest ratio was found in the arable grass portion of the LCG mixtures with N:S values of around 7.5, while the LCG mixtures should have maximum N:S ratios of around 13.0–14.0 in order to enable optimum plant growth. According to these results, the LCG trial series of the 1st growth was relatively unsuitable to allow a reliable classification (Table 3).
3.2.2. Grain Legumes
For the grain legumes (lupine, pea, field bean, soya bean), three rows of data with S concentrations and N:S ratios of the standard variants were available. After comparing these data with the DM grain yield differences between standard and treatment variants, in accordance with the relatively large data variability, only moderately significant regression curves were determined (Figure 5 and Figure 6).
A slight but highly significant increase in yield differences was observed in the range of increasing S concentrations of the young plants (up to the beginning of flowering). At S concentrations of 0.20% DM upwards, a slightly increasing yield difference in the harvest material can apparently be expected with additional S fertilisation. The results from the young plant material therefore do not appear to be suitable for determining minimum levels. In the vegetative harvest material (usually straw) and the DM grains, on the other hand, increasing S concentrations led to decreasing yield differences. The 100% mark was undercut in both data series between 0.25–0.28% S (Figure 5).
In principle, similar results were found for the N:S ratios in the plant material of the grain legumes (Figure 6). In the vegetative and generative harvest material, decreasing yield differences were also determined as a result of decreasing N:S ratios. Corresponding to the different N concentrations in these two data series, the 100% yield mark was reached at very different N:S ratios. From the material of the young plants, it was also not possible to draw any conclusions about the N:S ratios.
Table 4 summarises the supplementary statistical data for determining the minimum necessary S concentrations and maximum tolerable N:S ratios to ensure optimum DM yields on average for the grain legume species. Using the mean values determined to reach the 100% mark (b–100) minus the simple standard errors of the S concentrations of the regressions (S–x), the following minimum values of S concentrations could be calculated (values for N removal and N2 fixation not shown):
- -
- Young plants: approx. 0.24% S DM;
- -
- Vegetative harvest material (straw): 0.19–0.22 (0.19–0.24)% S DM;
- -
- MP grain: 0.22 (0.18–0.26)% S DM.
The following average values were determined for the maximum tolerable N:S ratios (S = 1) in the plant materials (Table 4: b–100 + S–x; values for N removal and N2 fixation not shown):
- -
- Young plants: approx. 24.4;
- -
- Vegetative harvest material (straw): 11.7 (10.9–12.6);
- -
- MP grain: 22.0 (19.2–24.7).
3.2.3. Non-Legume Crops
For non-legume crops, reliable data is available from the tested cereals, especially winter wheat. There are some large differences between the data series examined, which include the results of both the direct effect and the succseding-effect of S fertilisation. Only the regression results of the three data series on the direct fertiliser effects are analysed here (Figure 7). Depending on the data series, a decrease in yield differences can be seen with increasing S concentrations. However, as this S fertiliser effects were only very limited in the cereals, the regression curves already fall below the 100% mark at relatively low S levels.
The data on the N concentration and N removal differences to the S concentrations and the N:S ratios were also analysed in a similar way (not shown graphically). Using the supplementary statistical data compiled in Table 5 (b–100; S–x), the following minimum values for the S concentrations in the cereals (especially winter wheat) were summarised to produce optimum yields (% S DM):
- -
- Young plants: 0.11 (0.09–0.12);
- -
- Vegetative harvest material (straw): 0.11 (0.08–0.13);
- -
- MP grain: 0.11.
The maximum N:S ratios (S = 1) obtained for the three data series analysed for the cereals:
- -
- Young plants: 15.3 (14.5–16.0);
- -
- Vegetative harvest material (straw): 7.5 (6.8–7.8);
- -
- MP grain: 13.9 (13.4–14.4).
For other non-leguminous crops, only indicative values for optimum yield performance are available for winter rape and maize (Table 6). The following values can be suggested on the basis of the supporting statistical data:
- -
- Young plants winter rape: 0.56% S; 5.1 N:S ratio;
- -
- MP grain winter rape: 0.48% S; 10.3 N:S ratio;
- -
- MP grain maize: 0.14% S DM.
4. Discussion and Conclusions
4.1. Effect of S Fertilisation on Yield, Ingredients and Other Characteristics of the Plant Species
In the lucerne-clover-grass trials, the S fertilisation treatments in many regions in Germany increased both the S concentrations and the yields of the forage crops [20,22,34,35]. The S concentration and thus also the S removal increased in both parts of the legume-grass mixtures [28]. According to the previous evaluations of the individual grain legume trials, including the pea-cereal mixtures, hardly any significant yield effects were observed as a result of the S fertilisation measures. Minor increases were only achieved in the S concentrations of the harvested materials [36,37,38,39].
Field bean and pea accumulated S mainly in the grain, lupine in the straw. The S concentration in young plants depended on the demand. The calculated S efficiency of the fertilisation was between 3–9% for field beans. In the lupine trials, S efficiencies of 4–7% and for peas between 5–8% were determined. According to the compiled fertilisation trials by Gruber et al. [22], only minor to no yield effects on grain and straw of grain legumes were recorded, although the S concentrations also increased. Winter forms of grain legumes could be characterised by a higher S demand, as isolated trials with peas, for example, have shown. The cereals tested, especially winter wheat, also showed only minor yield effects as a result of S fertilisation. Direct fertilisation of cereals can then often be omitted [20,22,40]. In durum wheat, S soil fertilisation increased the DM yield particularly when coupled with organic fertilisation. In contrast, the quality of the grains was not changed [41].
According to the results summarised in this study, which is generally much more extensive, the following course of increased yields after additional S fertilisation could be recognised for all trials examined, depending of the crop species and the S concentration of the plants:
- -
- With very low S concentrations or wide N:S ratios, there were generally marked increases in yields with a wide range of variation, the additional yields generally increase exponentially as the S supply continues to decrease (extent strongly dependent on the crop species);
- -
- In a transition range of S concentrations, there were hardly any yield effects (nutrient supply range for achieving optimum yields);
- -
- From certain S concentrations upwards and N:S maximum ratios downwards, no more additional yields were recorded with relatively low variability (maximum yield levels).
In the extensive S fertilisation trials on arable forage crops in organic farming, in addition to the S concentrations, a rise in the N concentrations of perennial legume grasses and an increase in the proportion of legumes in the mixtures were also determined [22,28,42]. In the mixtures, it was primarily the DM yields and the N concentration of the legume fraction that were increased and only slightly that of the non-legume fraction. The fertilised crops appeared more voluminous with larger leaf blades and had a darker green colour, probably due to increased chlorophyll levels, which was often still visible in the following year.
In the trials with grain legumes, however, S fertilisation treatments apparently hardly led to an increase in the N concentrations [36]. This also appeared in the cereal trials. However, S foliar fertilisation increased the quality of durum wheat (N concentration, sedimentation test), but not the yield [41]. According to the extensive evaluations presented here, the great importance of S fertilisation of arable forage for increasing the N concentrations in the growing crops and for shifting the legume-grass ratio in favour of the legume proportion could also be emphasised. This also occurred to a lesser extent in the mixtures between pea and oat cultivation. For further results, see Part 1 [25].
4.2. Mean Nutrient Concentrations of Sulphur, Nitrogen and N:S Ratios of the Plant Species
First of all, evaluations showed that with r = 0.26 (p < 0.001, n = 502) there are highly significant relationships between the Smin content (SO4-S) of the soil at the start of vegetation (0–60 cm depth) and the S concentrations in various organs of the tested plant species of the standard variants (variants without S fertilisation). The results showed lower statistical significance in young plant material than in older plant material, as Link [43] also found in the leaves of winter oilseed rape. At the same time, he was able to demonstrate that the relationships improved when the available sulphur was taken into account not only in the topsoil (0–30 cm depth) but also in deeper soil layers. Overall, however, it should be noted that these relationships are present, but not particularly close.
After the implementation of air pollution control measures, it was shown that not only the Smin content of the soil but also the S concentration in the plant species had decreased, in some cases quite markedly (see examples from Heyn, 2011, cited in [44]). As a result, initial proposals for representative S concentrations of plant species in organic farming were made by combining data from the recent past without taking older work into account [44,45]. As the comparison of this data with the mean S and N concentrations of the crop species presented here shows, there is quite a good agreement in most cases (Table 7). However, there are clearly large differences to the listed results from conventional literature sources. Some of these values are at a much higher level and have probably not yet been updated.
The S concentration of permanent grassland and arable forage in conventional farming was described in more detail by Elsäßer et al. [46]: Grassland 0.14–0.29% S, pasture 0.20–0.29% S, mown pasture 0.20–0.28% S, field forage arable grass 3–4 cuts 0.26% S, LCG with 30% legumes 0.28% S, with 50% legumes 0.29% S, with 70% legumes 0.31% S, lucerne, red clover 0.33% S in DM. In this study, some data, such as on the permanent grassland or the lucerne-rich LCG stands, show slightly higher mean S concentrations in the trial data than previously assumed in the table values presented for organic farming (Table 7). In contrast, the S concentrations in the red clover-favoured growths are at a lower level and there is a better agreement with the table values. Ref. [22] also state an average S content of approx. 0.15% and a range of 0.08–0.30% S in DM in clover-grass growths. The crop data compiled here can therefore be used for the further revision of representative nutrient contents in organic farming.
4.3. Determination of Optimal Value Ranges for the S Concentrations and N:S Ratios of Plant Species for Organic and Conventional Cultivation Methods and Suggestions for Practical Use
There are quantitative correlations between the nutrient concentration in certain parts of the plant and times of development during the vegetation period and the yield formation of the crops. As a rule, young, just-formed plant organs such as leaves or stems up to the beginning of flowering are particularly suitable. In the case of young cereals, the entire above-ground plant is often used. In order to determine and fix sufficient nutrient levels that lead to undisturbed yield formation, extensive experimental studies have been carried out for each nutrient in the past. Their results have been described in detail and summarised in tables for practical use in various countries (Germany: Bergmann [10], Australia: Reuter et al. [11], USA: Mills & Jones [49], Campbell [50], Plucknett [12]).
Due to a lack of own values, it was previously assumed that the nutrient concentrations determined under conventional conditions were also considered to be reliable in organic farming and were applied without critical examination. However, as the nutrient supply level in organic farming is usually clearly lower, these indicator values should also be at a correspondingly differentiated level [19]. It is known that especially the N concentrations of non-legumes are up to 20% lower in organic farming [44]. Furthermore, it is already clear that lower optimal content classes should be aimed for in the basic nutrients of the soil [51]. As a result of this study, it also includes the Smin content of the soil (see Part I: [25]). With regard to the nutrient sulphur, Haneklaus et al. [52], for example, point out that higher S concentrations should be aimed for to achieve maximum yields than to ensure an optimum yield level.
In principle, pot and field trials are suitable for plant analyses of the nutrient sulphur in order to determine sufficient S concentrations of the various plant species for undisturbed plant growth [53]. In the field trials presented here, plant samples from three fractions were analysed as young plant material, by-products such as straw and main products such as grains for the nutrients sulphur and nitrogen. The extensive results were then initially used to define nutrient ranges for sulphur and for the N:S ratios using special forms of statistical analysis, which appear to be particularly suitable for the conditions in organic farming in order to guarantee optimum DM yields for the analysed plant species.
First of all, these studies have shown that it was obviously easier to determine optimal ranges for the Smin content of the soil and the expected yield. The effort required to crystallise optimal nutrient concentrations and N:S ratios, on the other hand, was much more complicated, partly because the plant data material originated from different vegetation stages and plant species. Initial comparisons of these determined values with published tables by Mills & Jones [49] and Dick et al. [54] in USA as well as Koch et al. [55] and Olfs et al. [56] in Germany for use in conventional practice have also produced unsatisfactory results (not shown). Subsequently, a more extensive collection of corresponding literature data from conventional agriculture was compiled for each plant species. For a more precise definition of value ranges for the Sulphur supply, an extended evaluation was then carried out with the use of boxplot analyses in order to finally achieve a better differentiation of the results obtained between the cultivation systems.
In the case of lucerne-clover-grasses (LCG), with over 10 individual values in most cases, a sufficiently high number of values were generally available for these analyses (Table 8). The S concentrations in organic farming are on average at a somewhat lower level, which is particularly true for the A variants (mean 0.24%, median 0.25% S). Neither the maximum values nor the span range and standard deviation of the values in conventional farming were achieved. Nevertheless, including all calculation variants (A, B), only slightly different S concentrations for optimal yield formation were determined for both farming systems (mean and median between 0.24–0.28% S). This also applies in particular to the pure legume crops (LCG-legumes) listed separately in organic farming, which were selected from LCG-mixtures.
In contrast, the N:S ratios in the organic LCG, particularly in the A variant with 13.1–13.2 are at a slightly higher level than the values from conventional cultivation with values between 11.0–11.6. Compared to the N concentrations, only slightly lower S concentrations are therefore found in organic farming. The minimum values are in some cases clearly exceeded, while the range and the standard deviation are characterised by lower N:S values compared to conventional farming. Overall, however, the average values (mean, median) are again at a comparably high level in both systems with N:S ratios between 11.0–13.0. In the pre-sorted LCG-legume stands, slightly lower N:S ratios were even calculated with values around 10.6. The proportion of legumes in the organically grown LCG crops was approx. 62% (±20%).
Only a few surveys are available for the analyses of pure arable grass cultivation (Table 9). In addition, the limited values for organic farming come from correspondingly selected LCG-mixture growths, as no trials with pure arable grass cultivation have been carried out to date. The S concentrations with values around 0.28–0.31% are approx. 0.10% S higher than those of conventional farming, while the average N:S ratios with values around 7.0 are only half as high. The analyses show that arable grasses in LCG mixtures have both relatively high S concentrations and relatively low N concentrations. In principle, these findings also apply to the growth from permanent grassland. There are therefore clear differences in the minimum sulphur concentration and the maximum N:S ratios in the growths of both types of grass (see Table 9, Table 10).
There are also only a few nutrient values from permanent grassland grown organically, which are characterised by a much smaller range and standard deviation (Table 10). The mean minimum required S concentrations of 0.28 (0.26–0.29)% S are approx. 0.03–0.05% S higher than those from conventional production, while the maximum required N:S ratios of 9.1 (8.4–9.9) are at least 2.9–4.1 units lower than in conventional cultivation (mean, median). Permanent grassland stands from organic production were generally characterised by legume proportions of around 16% (±14%). No literature was available on the legume components from conventional cultivation. However, the values are generally at a very low level.
Even for the analyses of the grain legumes on average, the number of evaluable results was relatively low (Table 11). In some cases, results from organic cultivation were even taken into account on the conventional side. In addition, particular evaluation difficulties were encountered with the data series of the young plants. The evaluations of the boxplot analyses of the young plants of grain legumes have shown that the minimum values of the S concentrations are higher, but the maximum values, the range and the standard deviation are at a much lower level than in the conventional comparative analyses. Using the calculated mean and median values, minimum values of between 0.23–0.27% S were determined in the young plants in organic crops, while values of between 0.29–0.39% S are considered necessary for optimum yield formation in conventional farming.
The reported maximum values of the N:S ratios showed significantly higher values with an average of over 4.0–5.0 units, but the range and the standard deviation were in some cases at a considerably lower level than in conventional farming. While maximum values in the N:S ratios between 19.0–20.0 can be considered sufficient in conventional farming (mean, median), according to these analyses N:S ratios between 23.0–25.0 can be sufficient to achieve an optimum yield level under organic farming conditions (Table 11).
No reliable data from the conventional literature was found for the boxplot analyses of the straw and grain variants of grain legumes. From the few own data series, minimum required S concentrations for grain legume straw between 0.21–0.25% S and 0.22–0.24% S in grain materials of this plant group were determined. The widest N:S ratios of 9.3–12.1 in straw and 20.8–23.4 in the grains should not be exceeded, as otherwise a latent S deficiency and reduced yields are to be expected (Table 12, Table 13).
The number of S concentrations and N:S ratios found in the literature for assessing the parameters required to achieve optimum yields can be described as sufficient for the young plants of the cereal species (Table 14). The ranges and the standard deviations achieved in the organic trials were again relatively low. For the S concentrations, the values in the lower supply range were still relatively consistent between the cultivation systems. However, the 75% quartiles or the maximum values were at a much higher level in conventional cultivation. For these reasons, the minimum required S concentrations in organic farming with values between 0.11–0.15% S in the young plants are more than 50% lower than the values in conventional farming (around 0.25% S, mean value, median).
The range and standard deviation of the conventional values of the N:S ratios were also at a clearly higher level than for the organically grown young plants. The organic N:S ratios are more concentrated in the middle range. Therefore, the calculated mean and median values with N:S ratios between 14.5–15.2 show a relatively high agreement between the two systems. This result is even remarkable as the N concentrations in the plant materials are usually higher in conventional cultivation due to the higher N fertilisation.
To characterise the required S supply of cereal straw, only a small number of values for the S concentrations were found in the literature (Table 15). The mean and median values obtained correspond quite well with 0.11–0.15% S between the cultivation systems. For the N:S ratios, some data are only available from this study. N:S ratios around 7.0 seem to be sufficient as maximum values. Only a few values could also be determined for the assessment of the S supply of cereal grains (Table 16). According to these results, the minimum concentrations of 0.11–0.13% S in organic farming are at a slightly lower level than those in conventional farming. In contrast, somewhat higher maximum values were found with N:S ratios of 13.0–14.0.
A sufficient number of values from conventional cultivation are available for evaluating the young plants of winter rape. Minimum values of 0.52–0.53% S and maximum values of between 8.4–8.5 in the N:S ratios can be considered to indicate optimum yield formation. In contrast, the S values from organic farming presented here are far from sufficient for a reliable assessment (Table 17). The available data for both cropping systems is obviously not yet sufficient for an adequate assessment of the S supply of winter rape straw and grains and for maize in general. Therefore, no assessments are made in this regard.
At the end of the long evaluation process and discussion, the reliable values obtained were summarised in Table 18 for use in agricultural practice. For the analysed crop groups lucerne-clover-grass, grain legumes and cereals (especially winter wheat), S and N:S values were determined with sufficient certainty due to the relatively high individual values. On the basis of the specified variation ranges, the following qualitative statements can be made about the necessary S concentrations of the individual grain legume species:
- -
- Young plants: high: pea, field bean; medium to high: soya bean, field bean, lupine;
- -
- Vegetative crop material (straw): high: lupine; medium: pea; low to medium: field bean;
- -
- MP grain: high: lupine; medium: field bean; low to medium: pea.
The species of grain legumes also differ in their N:S ratios. The following levels can be documented on the basis of the specified value ranges (no data is available for soya bean):
- -
- Young plants: low: pea; low to medium: field bean;
- -
- Vegetative crop material (straw): low: lupine; low to medium: pea; medium: field bean;
- -
- MP grain: low: pea, lupine; medium: field bean.
Only in the case of permanent grassland are the values determined not yet sufficient for a reliable assessment. The minimum required S concentrations of these crops to produce an optimum yield level are generally lower than in conventional farming. The difference between the cultivation systems is approx. 22%. In contrast, somewhat higher values can be tolerated for the maximum N:S ratios for lucerne-clover-grass, grain legumes and cereals (especially winter wheat). The difference between the two cultivation systems here is approx. 13% (Table 18). For other crops such as oilseed rape, maize and permanent grassland, no exact values can yet be given. There is still a need for research, in some cases for both cultivation systems.
References
- Haneklaus, S.; Paulsen, H.-M.; Schnug, E. Einfluss der Schwefelversorgung auf Ertrag und Qualität landwirtschaftlicher Kulturpflanzen und Einsatz von SAV-Produkten als Düngemittel; VGB Workshop: Essen, Germany, 1998. Available online: file:///d:/Downloads/pb1341.pdf (accessed on 12 November 2024).
- Hagel., I.; Haneklaus, S.; Schnug, E. Schwefelgehalte, Proteinfraktionen und Kleberzugfestigkeit von Weizen–Ergebnisse eines Ringversuches biologisch-dynamischer Züchter. Landbauforschung Völkenrode 2005, Special Issue 286, 11–23.
- Kulczycki, G. The effect of elemental sulfur fertilization on plant yields and soil properties. Advances Agronomy 2021, 167, 105–181. [CrossRef]
- Scherer, H.W.; Pacyna, S.; Manthey, N.; Schulz, M. Sulphur supply to peas (Pisum sativum L.) influences symbiotic N2 fixation. Plant Soil Environ. 2006, 52, 72–77. [CrossRef]
- Dawar, D.; Karan, S.; Bhardwaj, S.; Meena, D.K.; Padhan, S.R.; Reddy, K.S.; Bana, R.S. Role of sulphur fertilization in legume crops: A comprehensive review. Internat. J. Plant & Soil Sci. 2023, 35, 718–727. [CrossRef]
- Fuentes-Lara, L.O.; Medrano-Macías, J.; Pérez-Labrada, F.; Rivas-Martínez, E.N.; García-Enciso, E.L.; González-Morales, S.; Juárez-Maldonado, A.; Rincón-Sánchez, F.; Benavides-Mendoza, A. From elemental sulfur to hydrogen sulfide in agricultural soils and plants. Molecules 2019, 24, 2282, 1–17. [CrossRef]
- Bloem, E.; Haneklaus, S.; Schnug, E. Milestones in plant sulfur research on sulfur-induced-resistance (SIR) in Europe. Frontiers Plant Sci., January 2015, 5, Article 779, 1–12. [CrossRef]
- Bergmann, W. Ernährungsstörungen bei Kulturpflanzen. Entstehung und Diagnose; Gustav Fischer: Stuttgart, Germany, 1983.
- Zorn, W.; Marks, G.; Heß, H.; Bergmann, W. Handbuch zur visuellen Diagnose von Ernährungsstörungen bei Kulturpflanzen; Springer Fachmedien: Wiesbaden, Germany, 2016.
- Bergmann, W. Ernährungsstörungen bei Kulturpflanzen; Gustav Fischer Verlag: Jena, Germany, 1993.
- Reuter, D.J.; Robinson, J.B.; Dutkiwicz, C. Plant Analysis–an Interpretation Manual; CSIRO Publishing: Victoria, Australia, 1997.
- Plucknett, D.L. Detecting Mineral Nutrient Deficiencies in Tropical and Temperate Crop; CRL Press: Boca Raton, USA, 2019.
- Hagel, I. Schwefelgehalt und Klebereigenschaften von Weizen aus biologisch-dynamischem und konventionellem Anbau. Lebendige Erde 1999, Nr. 2, 40–41.
- Haglund, S.; Ebbesvik, M.; Hansen, S. Is ley production in organic farming limited by sub-optimal sulphur supply? IFOAM Scientific Conference Proceedings 2000, 13, 31.
- Hansen, S.; Bakken, A.K.; Strøm, T.; Govasmark, E.; Steinshamn, H. Sulphur supply: a challenge for organic farming? In Organic farming for a new millennium–status and future challenges; NJF-Seminar 2005, 369, 129–132.
- Leithold, G.; Becker, K.; Riffel, A.; Schulz, F.; Schmid-Eisert, A.; Brock, Chr. Stickstoff und Schwefel im ökologischen Landbau. Giessener Schriften z. Ökologischen Landbau 8; Verlag Dr. Köster: Berlin, Germany, 2015.
- Kolbe, H. Landnutzung und Wasserschutz. Der Einfluss von Stickstoff-Bilanzierung, Nmin-Untersuchung und Nitrat-Auswaschung sowie Rückschlüsse für die Bewirtschaftung von Wasserschutzgebieten in Deutschland. Land Use and Water Protection. Effects on nitrogen budget, Nmin-values, nitrate content and leaching in Germany; WLV Wissenschaftliches Lektorat & Verlag: Leipzig, Germany, 2000.
- Sprengel, C. Von den Substanzen der Ackerkrume und des Untergrundes. Journal f. technische u. ökonomische Chemie 1828, 3, 42–99.
- Liebscher, G. Untersuchungen über die Bestimmung des Düngebedürfnisses der Ackerböden und Kulturpflanzen. J. Landwirtschaft 1895, 43, 49–216.
- Becker, K.; Riffel, A.; Leithold, G. Sicherung des Ertragspotentials von Luzerne-Kleegrasbeständen durch Verbesserung des aktuellen Schwefelversorgungszustandes ökologisch bewirtschafteter Flächen–Situation und Bedeutung unter Praxisbedingungen; Endbericht zum Forschungsprojekt 2810OE104; Institut für Pflanzenbau und Pflanzenzüchtung II der Universität: Gießen, Germany, 2015. Available online: www.orgprints.org/29689/ (accessed on 12 November 2024).
- Schmidtke, K.; Lux, G. Wirkung verschiedener Verfahren der Schwefeldüngung auf Ertragsleistung und Vorfruchtwert von Körnerleguminosen im Ökologischen Landbau. Abschlussbericht zum Verbundvorhaben BOELN 2811OE110 u. BOELN2811OE111; Hochschule f. Technik u. Wirtschaft (HTW): Dresden, Germany, 2015. Available online: www.orgprints.org/29783/ (accessed on 12 November 2024).
- Gruber, H.; Urbatzka, P.; Mücke, M.; Rohlfing, F. Schwefeldüngung im ökologischen Landbau, Beiträge aus den Bundesländern und Landwirtschaftskammern, Ergebnisse aus mehrjährigen Parzellenversuchen an verschiedenen Standorten in Deutschland mit Empfehlungen für die Praxis; Verband d. Landwirtschaftskammern; Arbeitskreis Ökologischer Landbau. Landesforschung f. Landwirtschaft u. Fischerei Mecklenburg-Vorpommern: Gülzow-Prüzen, Germany, 2019.
- Luttikholt, L.W.M. Principles of organic agriculture as formulated by the International Federation of Organic Agriculture Movements. NJAS 2007, 54, 347–360. [CrossRef]
- Anonymous. Regulation (EU) 2018/848 of the European Parliament and of the Council of 30 May 2018 on organic production and labelling of organic products and repealing Council Regulation (EC) No 834/2007. Off. J. Eur. Union 2018, L150, 1–92.
- Kolbe, H. Meta-Study on Sulphur Supply and Fertilisation of Crop Species in Organic Farming of Central Europe – Part 1: Effects of Soil Supply on DM Yields, Legume N2 Fixation, and Methods for Determining S Fertiliser Requirements. Agronomy 202x,….
- Klages, S.; Schnug, E. Methodenvergleich: Ermittlung von Richtwerte für die Pflanzenanalyse zur Beurteilung des Ernährungszustandes von Kulturpflanzen. VDLUFA-Schriftenreihe, Kongressband 2014, 70, 140–148.
- Bakken, A.K.; Hansen, S. Red clover yields and nitrogen content as related to sulphur supply. Land Use Systems in Grassland Dominated Regions, Grassland Science in Europe 2004, 9, 440–444.
- Heilmann, S. Auswirkungen eines erhöhten Schwefelversorgungszustandes auf Futterleguminosenbestände unter langjähriger ökologischer Bewirtschaftung am Beispiel des Lehr- und Versuchsbetriebs Gladbacherhof. Master Thesis, University Gießen, Gießen, Germany, 2012.
- Böhm, H.; Witten, S.; Aulrich, K. Influence of variety and sulfur fertilization on the contents of crude protein, and selected amino acids in blue lupins (Lupinus augustifolius L.). Proceedings of the Internat. Lupin Conference, Milan 2015, 14, 134.
- Beeckman, A. Zwavelbemesting in grasklaver; Inagro: Belgium, 2015. Available online: https://www.ccbt.be/nl/nieuws/zwavelbemesting-grasklaver (accessed on 12 November 2024).
- Vockinger, F. Effect of sulphur fertilisation on yield, nodulation and N2 fixation of lucerne and yield of winter wheat on organically managed fields in the Pannonian region of North-East Austria. Master Thesis, Division o. Organic Farming, Universität f. Bodenkultur Wien, Wien, Austria, 2016.
- Titze, A.; Wegner, C.; Gruber, H. Einfluss der S-Düngung auf Ertrag und Qualität von Leguminosen. Abschlussbericht; Landesforschungsanstalt f. Landwirtschaft u. Fischerei Mecklenburg-Vorpommern (LFA), Institut f. Pflanzenproduktion u. Betriebswirtschaft Sachgebiet Acker- u. Pflanzenbau: Gülzow-Prüzen, Germany, 2020.
- Lehner, D.; Starz, W.; Pfister, R.; Rohrer, H. Wirkung einer Schwefeldüngung auf Klee- und Luzernegrasbestände im Biolandbau des oberösterreichischen Alpenvorlandes. Abschlussbericht, Dafne Projekt 101145; Institut f. Biologische Landwirtschaft u. Biodiversität f. Nutztiere: Irdning-Donnersbachtal, Austria, 2022.
- Böhm, H. Auswirkungen einer Schwefeldüngung auf den Ertrag und die Nährstoffzusammensetzung eines Kleegrasbestandes. Beitr. Wiss.-Tag. Ökol. Landbau, Bonn 2013, 12, 216–219. Available online: https://orgprints.org/id/eprint/21493/ (accessed on 12 November 2024).
- Böhm, H. Die Wirkung einer Schwefeldüngung auf Ertrag und Qualitätsparameter von Kleegrasbeständen im ersten und zweiten Hauptnutzungsjahr. Beitr. Wiss.-Tag. Ökol. Landbau, Freising-Weihenstephan 2017, 14, 32–35. Available online: https://orgprints.org/id/eprint/31871/ (accessed on 12 November 2024).
- Pötzsch, F.F. Schwefelbedarf, -akkumulation und -düngung von Ackerbohne (Vicia faba L.), Schmalblättriger Lupine (Lupinus angustifolius L.) und Erbse (Pisum sativum L.) in Reinsaat sowie Erbse und Gerste (Hordeum vulgare L.) im Gemenge. Ph.D. Thesis. Humboldt-University Berlin, Berlin, Germany, 2019.
- Pötzsch, F.; Lux, G.; Schmidtke, K. Sulphur demand, uptake and fertilization of Vicia faba L. under field conditions. Field Crops Research 2018, 228, 76–83. [CrossRef]
- Pötzsch, F.; Lux, G.; Lewandowska, S.; Schmidtke, K. Does Lupinus angustifolius L. need sulfur fertilization under central European conditions? J. Plant Nutr. Soil Sci. 2019, 182, 31–39.
- Pötzsch, F.; Lux, G.; Lewandowska, S.; Schmidtke, K. Sulphur demand, accumulation and fertilization of Pisum sativum L. in pure and mixed stands with Hordeum vulgare L. under field conditions. Field Crops Research 2019, 239, 47–55. [CrossRef]
- Becker, K.; Riffel, A.; Leithold, G. Ertragswirksamkeit einer Gülledüngung zu Winterweizen im Vergleich zur Vorfruchtwirkung eines mit Schwefel versorgten Kleegrases nach einheitlicher Vorfrucht Kleegras. Beitr. Wiss.-Tag. Ökol. Landbau, Eberswalde 2015, 13. Available online: https://orgprints.org/id/eprint/27261/ (accessed on 12 November 2024).
- Rossini, F.; Provenzano, M.E.; Sestili, F.; Ruggeri, R. Synergistic effect of sulfur and nitrogen in the organic and mineral fertilization of durum wheat: grain yield and quality traits in the mediterranean environment. Agronomy 2018, 8, 189, 1–16. [CrossRef]
- Pekarskas, J.; Spruogis, V. Influence of potassium, magnesium, and sulfur fertilizers on ecologically cultivated perennial grasses. Latvian J. Agronomy 2008, No.10, LLU, 151–155.
- Link, A. Bodenuntersuchung (Smin) und Pflanzenanalyse zur Vorhersage des Schwefeldüngebedarfs von Winterraps (Brassica napus L.). Ph.D. Thesis, Institut f. Pflanzenernährung, University Hannover, Hannover, Germany, 1997.
- Kolbe, H.; Schliephake, W.; Müller, P. Ernte- und Wurzelrückstände und Nährstoffgehalte der Fruchtarten, Nährstoffgehalte organischer Düngemittel sowie Abbauverhalten und Nährstofffreisetzung von organischen Materialien im Boden. Berichte aus dem Ökolandbau 2022–Parameterdatensätze von organischen Materialien; Dr. H. Kolbe: Schkeuditz, Germany, 2022.
- Kolbe, H.; Schmidt, E.; Klages, S. Bodenfruchtbarkeit und Düngung. In Faustzahlen für den Ökologischen Landbau; Kuratorium f. Technik u. Bauwesen i. d. Landwirtschaft (KTBL): Darmstadt, Germany, 2015, pp. 103–151.
- Elsäßer, M.; Benke, M.; Berendonk, C.; Greiner, B.; Jaenicke, H.; Kivelitz, H.; Komeinda, M.; Neff, R.; Pickert, J.; Riehl, G.; Taube, F.; Messner, J. Düngung von Wiesen, Weiden und Feldfutter; DLG-Merkblatt 433; Deutsche Landwirtschaftsgesellschaft (DLG): Frankfurt a. Main, Germany, 2018.
- TLL. Merkblatt Schwefelgehalte in landwirtschaftlichen Kulturpflanzen und organischen Düngestoffen. Merkblatt; Thüringer Landesanstalt f. Landwirtschaft (TLL): Jena, Germany, 1999.
- Schweder, P.; Kape, H.-E.; Boelcke, B. Düngung. Hinweise und Richtwerte für die landwirtschaftliche Praxis. Leitfaden zur Umsetzung der Düngeverordnung; Ministerium f. Ernährung, Landwirtschaft, Forsten u. Fischerei Mecklenburg-Vorpommern: Schwerin, Germany, 2004.
- Mills, H.A.; Jones, J.B. Jr. Plant Analysis Handbook II. Micro-Macro Publishing: Georgia, USA, 1996.
- Campbell, C.R. Reference Sufficiency Ranges for Plant Analysis in the Southern Regions of the United States; Southern Cooperative Secies Bulletin: Raleigh, North Carolina, USA, 2000.
- Kolbe, H. Einfluss mineralischer P- und K-Düngung auf die Ertragsreaktion der Fruchtarten in Abhängigkeit von der Nährstoffversorgung des Bodens unter den Anbaubedingungen des ökologischen Landbaus in Deutschland. J. f. Kulturpflanzen 2019, 71, 6, 161–181.
- Haneklaus, S.; Bloem, E.; Schnug, E. Sulfur interactions in crop ecosystems. In Sulfur in Plants. An Ecological Perspective; Hafkesford, M.J., Kok, L.J. de, Eds.; Plant Ecophysiology 6; Springer: Dordrecht, The Netherlands, 2007, pp. 17–58.
- Kerschberger, M. Eignung der Pflanzenanalyse zur Ermittlung des S-Düngebedarfs. VDLUFA-Schriftenreihe 2000, 53, 29–39.
- Dick, W.A.; Kost, D.; Chen, L. Availability of sulfur to crops from soil and other sources. In Sulfur: A missing link between soils, crops, and nutrition; Jez, J., Ed.; Agron. Monogr., Madison 2008, 50, 59–82.
- Koch, H.-J.; Baumgärtel, G.; Claassen, N.; Hege, U.; Heyn, J.; Link, A.; Orlovius, K.; Pasda, G.; Suntheim, L. Schwefelversorgung von Kulturpflanzen–Bedarfsprognose und Düngung. Standpunkt; Verband Deutscher Landwirtschaftlicher Untersuchungs- u. Forschungsanstalten (VDLUFA): Darmstadt, Germany, 2000.
- Olfs, H.-W.; Fuchs, M.; Ortseifen, U.; Schintling-Horny, L. von; Chappuis, A. von; Zerulla, W.; Erdle, K. Schwefel-Düngung effizient gestalten; DLG-Merkblatt 373; Deutsche Landwirtschaftsgesellschaft (DLG): Frankfurt a. Main, Germany, 2012.
- Saalbach, E. Über die Bestimmung des Schwefelversorgungsgrades von Hafer. Pflanzenern. Bodenkunde 1970, 127, 92–100. [CrossRef]
- Bosold, M.J. Die Bestimmung der Schwefelbedürftigkeit von Böden mit Hilfe von Gefäßversuchen und Pflanzenanalysen. Master Thesis, University Gießen, Gießen, Germany, 2014.
- Becker, K.; Riffel, A.; Schmidtke, K.; Fischinger, S. Schwefeldüngung zu Futter- und Körnerleguminosen. Empfehlungen für den ökologischen Landbau; Broschüre; Bundesanstalt f. Landwirtschaft u. Ernährung: Bonn, Germany, without year.
- Saalbach, E.; Würtele, K.; Kürten, P.W.; Aigner, H. Schwefel, Natrium, Magnesium. Landw. Schriftenreihe Boden u. Pflanze 1970, Nr. 14; Ruhr-Stickstoff: Bochum, Germany, pp. 11–44.
- Saalbach, E. Über den Schwefelbedarf landwirtschaftlicher Nutzpflanzen. Landwirtsch. Forsch. 1972, SH 27, 224–228.
- Saalbach, E. The effect of Sulphur, magnesium and sodium on yield and quality of agricultural crops. Pontificiae Acad. Sci. Srcipta Varia 1973, 28, 541–589.
- Aulakh, M.S. Crop responses to sulphur nutrition. In Sulphur in Plants; Abrol, Y.P., Ahmad, A., Eds.; Kluwer Academic Publishers: Dordrecht, The Netherlands, 2003, pp. 341–358.
- Schnug, E.; Haneklaus, S. Pflanzenanalyse und Düngerbedarfsermittlung. Vortrag; Institut f. Pflanzenernährung u. Bodenkunde, Bundesforschungsanstalt f. Landwirtschaft (FAL): Braunschweig, Germany, 2004. Available online: http://boden-fruchtbarkeit.de/wp-content/uploads/N%C3%A4hrstoffanalytik04_Pflanzenanalyse-und-D%C3%BCngerbedarfsermittlung_Ewald-SchnugSilvia-Haneklaus.pdf (accessed on 12 November 2024).
- Crooks, B.; Sinclair, A.; Edwards, T. Sulphur Recommendations for Crops; Technical Note TN685 November 2017; Farm Advisory Service: UK, 2017.
- Lorenz, F. Schwefel-Beratungsempfehlungen für die Praxis in Futterbau und Grünland. VDLUFA-Schriftenreihe 2000, 53, 89–97.
- Diepolder, M.; Raschbacher, S. Schwefeldüngung zu Dauergrünland. Neue Versuchsergebnisse. SuB 2009, Heft 4–5, III-14–III-19.
- Knöferl, R.; Diepolder, M.; Offenberger, K.; Raschbacher, S.; Brandl, M.; Kavka, A.; Hippich, L.; Schmücker, R.; Sperger, C.; Kalmbach, S. Leitfaden für die Düngung von Acker- und Grünland; Gelbes Heft; Bayerische Landesanstalt f. Landwirtschaft (LfL): Freising-Weihenstephan, Germany, 2022.
- Taube, F.; Wulfes, R.; Südekum, K.-H. Einfluß der Schwefelversorgung auf Ertrag und Inhaltsstoffe von Deutschem Weidelgras (Lolium perenne L.). Pflanzenbauwiss. 2000, 4, 42–51.
- Seehuber, C. Nährstoffversorgung zur Optimierung der N2-Fixierung und Produktivität von Körnerleguminosen. Ph.D. Thesis, University Bonn, Bonn, Germany, 2015.
- Sinaj, S.; Charles, R.; Baux, A.; Dupuis, B.; Hiltbrunner, J.; Levy, L.; Pellet, D.; Blanchet, G.; Jeangros, J. Düngung von Ackerkulturen. Grundlagen für die Düngung landwirtschaftlicher Kulturen in der Schweiz (GRUD). Agrarforschung Schweiz 8, 6; Spezialpublikation 2017; Agroscope: Nyon, Zürich, Switzerland, 2017, pp. 1–46.
- Hagel, I.; Schnug, E. Schwefelgehalt in biologisch-dynamischem Weizen. Getreide, Mehl Brot 1997, 51, 201–202.
- Link, A. Schwefeldüngung. 10. Thüringer Düngungstagung 2001; Schriftenreihe d. Thüringer Landesanstalt f. Landwirtschaft (TLL) 2002, Heft 11, 33–40.
- Zorn, W.; Schröter, H.; Heß, H. Schwefeldüngung im Ackerbau nicht vernachlässigen. Thüringer Düngungs- und Pflanzenschutztagung 31; Thüringer Landesamt f. Landwirtschaft u. Ländlichen Raum: Jena, Germany, 2022, pp. 15–22.
- Pissarek, H.P.; Schnug, E. Kalium und Schwefel-Minimumfaktoren des schleswig-holsteinischen Rapsanbau. Kali-Briefe 1982, 16, 77–84.
- Schröder, G.; Makowski, N. Damit der Raps nicht weiß wird. Bauernzeitung 1997, Nr. 11, 24.
- Matthey, J.; Sauermann, W.; Finck, M. Schwefeldüngung zu Winterraps–heute Standard in Schleswig-Holstein. VDLUFA-Schriftenreihe 2000, 53, 72–79.
- Sagoo, E.; Berry, P.; Munro, D.; Williams, J.R.; McGrath, S.P.; Dunham S.J. Optimising sulphur management to maximise oilseed rape yields and farm profitability (OPTI-S). Project Report No. 2160007; Agriculture a. Horticulture Development Board (AHDB): UK, 2018.
Figure 1.
Effects of S fertilisation as a function of the S concentration of the standard variants in the growths of grassland and lucerne-clover-grass on the calculated relative DM yield values (standard = 100%; LCG = lucerne-clover-grass; MP = main product).
Figure 1.
Effects of S fertilisation as a function of the S concentration of the standard variants in the growths of grassland and lucerne-clover-grass on the calculated relative DM yield values (standard = 100%; LCG = lucerne-clover-grass; MP = main product).
Figure 2.
Effects of S fertilisation as a function of the S concentrations of the standard variants in the growths of grassland and lucerne-clover-grass on the determined relative N removal (top) and calculated N2 fixation differences (bottom) (standard = 100%; LCG = lucerne-clover-grass; MP = main product).
Figure 3.
Effects of S fertilisation as a function of the N:S ratios of the standard variants in the growths of grassland and lucerne-clover-grass on the determined relative values of DM yield differences (standard = 100%; LCG = lucerne-clover-grass; MP = main product).
Figure 3.
Effects of S fertilisation as a function of the N:S ratios of the standard variants in the growths of grassland and lucerne-clover-grass on the determined relative values of DM yield differences (standard = 100%; LCG = lucerne-clover-grass; MP = main product).
Figure 4.
Effects of S fertilisation depending on the N:S ratios of the standard variants in the growths of grassland and lucerne-clover-grass on the determined relative values of N removal (top) and calculated N2 fixation differences (bottom) (standard = 100%; LCG = lucerne-clover-grass; MP = main product).
Figure 5.
Effects of S fertilisation depending on the S content of the standard variants in the grain legume growths on the calculated relative DM yield differences (standard = 100%; MP = main product).
Figure 5.
Effects of S fertilisation depending on the S content of the standard variants in the grain legume growths on the calculated relative DM yield differences (standard = 100%; MP = main product).
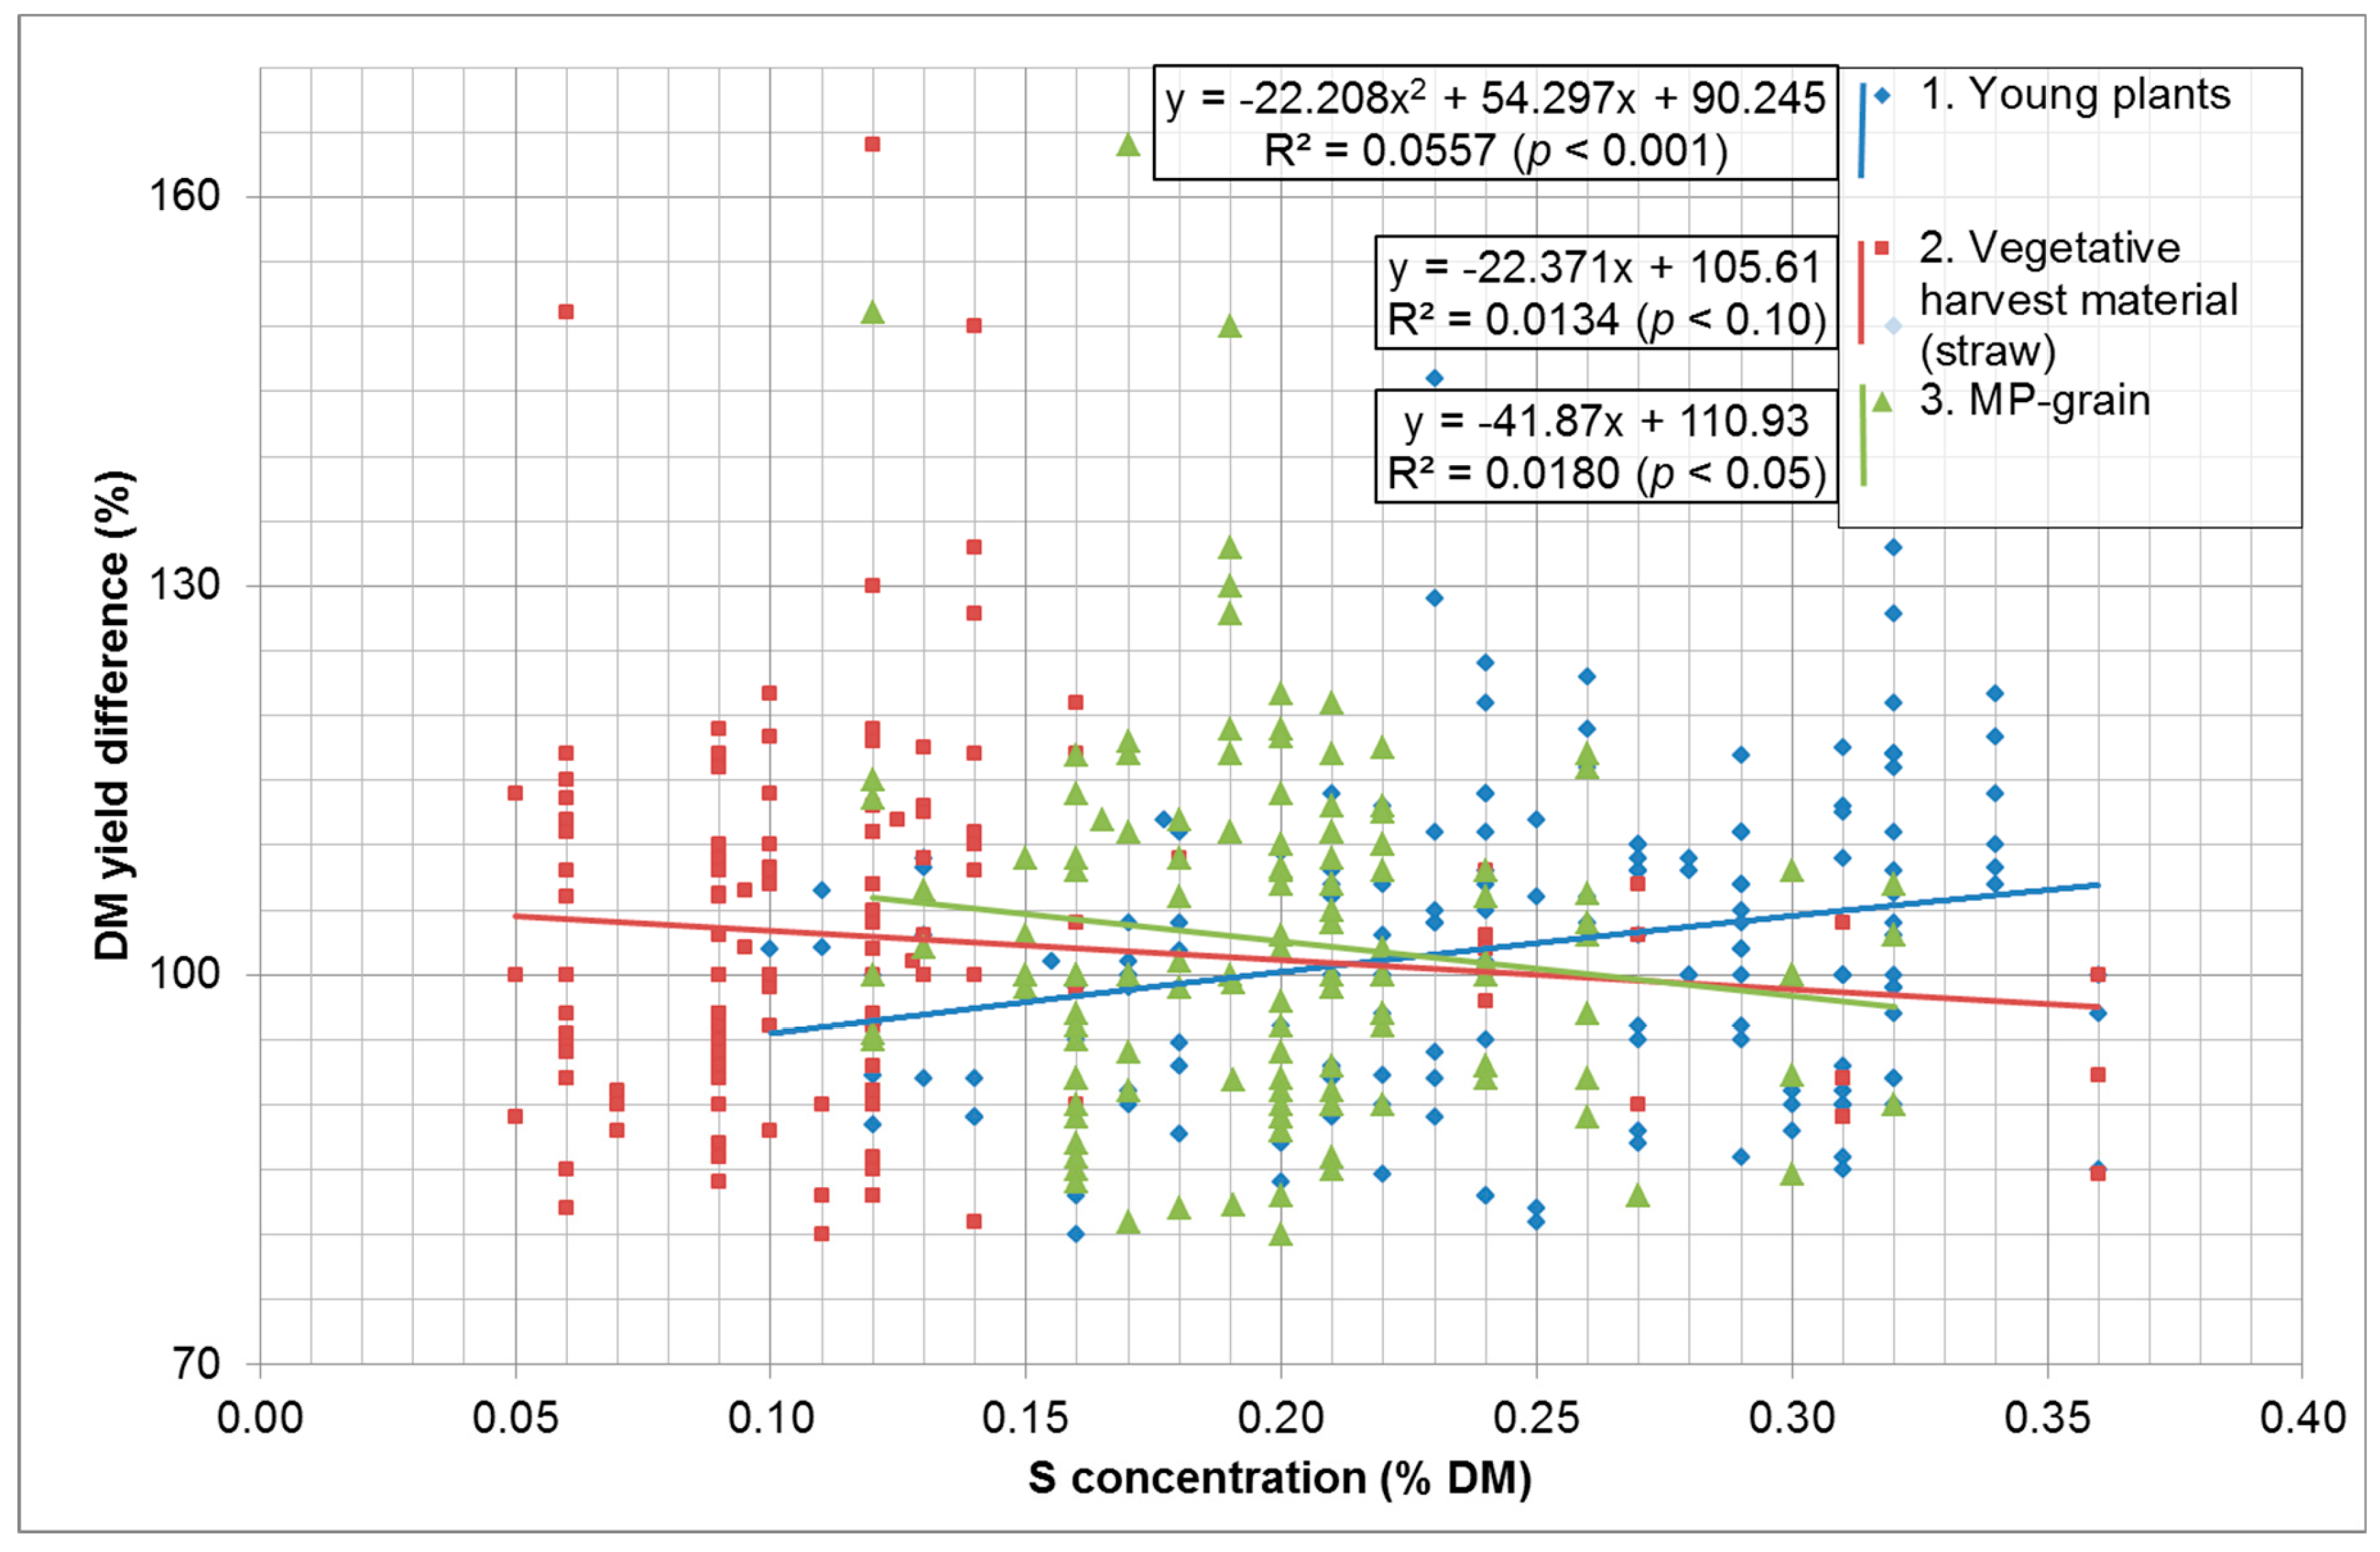
Figure 6.
Effects of S fertilisation as a function of the N:S ratios of the standard variants in the grain legume growths and harvested materials on the calculated relative DM yield differences (standard = 100%; MP = main product).
Figure 6.
Effects of S fertilisation as a function of the N:S ratios of the standard variants in the grain legume growths and harvested materials on the calculated relative DM yield differences (standard = 100%; MP = main product).
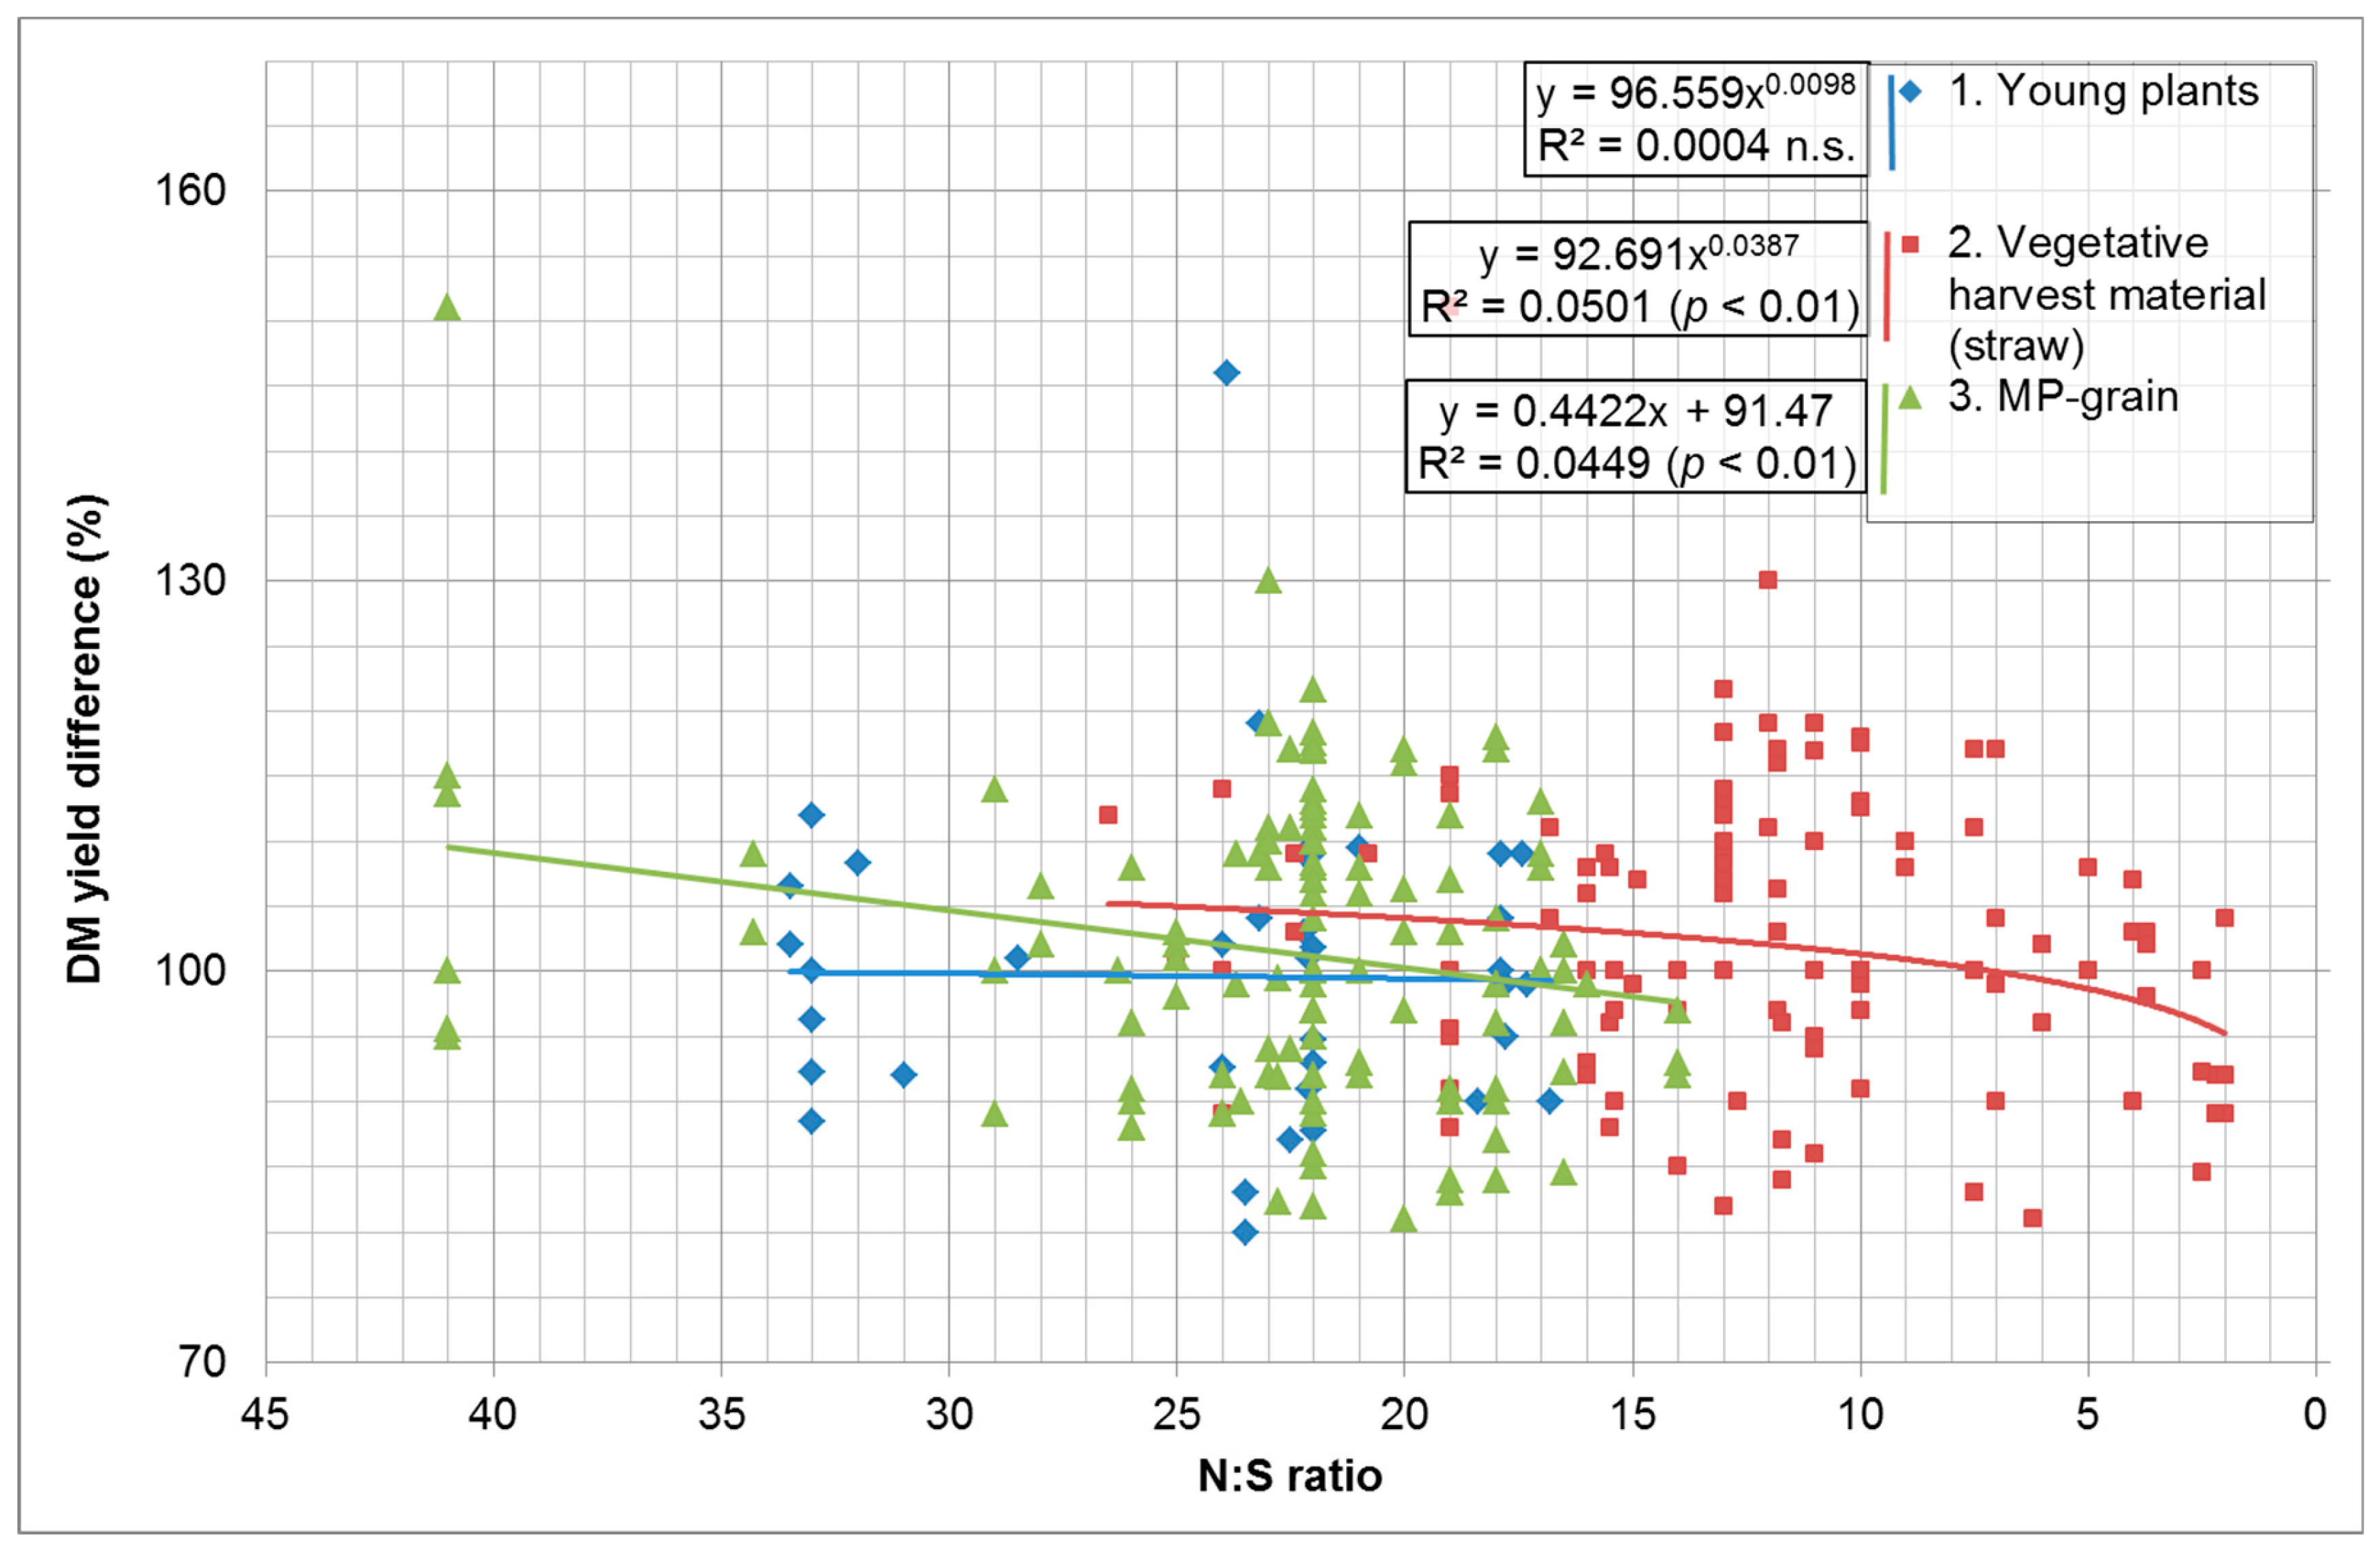
Figure 7.
Effects of S fertilisation as a function of the S concentrations of the standard variants in the growths and harvest materials of the cereals on the calculated relative DM yield differences (standard = 100%; MP = main product).
Figure 7.
Effects of S fertilisation as a function of the S concentrations of the standard variants in the growths and harvest materials of the cereals on the calculated relative DM yield differences (standard = 100%; MP = main product).

Table 1.
Mean values and standard deviation of the S and N concentrations (% DM) and the N:S ratios (S = 1) in the main products of the standard variants for the analysed plant species groups.
Table 1.
Mean values and standard deviation of the S and N concentrations (% DM) and the N:S ratios (S = 1) in the main products of the standard variants for the analysed plant species groups.
| Plant group/Data series | S concentration | N:S ratios | N concentration | |||
|---|---|---|---|---|---|---|
| (No.) | (Name) | (MV) | (s) | (MV) | (s) | (MV) |
| Permanent grassland and lucerne-clover-grasses | ||||||
| 1 | Grassland | 0.251 | 0.062 | 11.25 | 2.88 | 2.82 |
| 2 | LCG-grass | 0.245 | 0.080 | 8.24 | 2.85 | 2.02 |
| 3 | LCG-legumes | 0.227 | 0.068 | 13.87 | 2.82 | 3.15 |
| 4 | LCG-legume-grass mixture | 0.227 | 0.072 | 12.18 | 2.95 | 2.77 |
| 5 | LCG-1. growth | 0.145 | 0.060 | 24.31 | 9.62 | 3.53 |
| 6 | LCG-2 + 3. growth | 0.166 | 0.075 | 15.52 | 4.96 | 2.58 |
| 7 | LCG-MP-growth | 0.179 | 0.076 | 20.18 | 8.42 | 3.61 |
| Grain legumes | ||||||
| 1 | Young plants | 0.247 | 0.064 | 23.94 | 5.49 | 5.91 |
| 2 | Vegetative harvest material (BP-straw) | 0.128 | 0.068 | 11.77 | 5.60 | 1.51 |
| 3 | MP-grain | 0.202 | 0.043 | 22.30 | 5.25 | 4.51 |
| Cereals | ||||||
| 1 | Young plants | 0.272 | 0.080 | 10.99 | 1.32 | 2.99 |
| 2 | Vegetative harvest material (BP-straw) | 0.109 | 0.043 | 5.25 | 1.76 | 0.57 |
| 3 | MP-grain | 0.175 | 0.043 | 12.50 | 1.94 | 2.19 |
| Winter rape | ||||||
| 1 | Young plants | 0.670 | 0.122 | 5.14 | 0.65 | 3.44 |
| 2 | MP-grain | 0.420 | 0.071 | 11.65 | 1.80 | 4.89 |
| Maize | ||||||
| 1 | MP-grain | 0.290 | 0.113 | 8.82 | 2.35 | 2.56 |
LCG = lucerne-clover-grass; MP = main product; BP = by-product; MV = mean value; s = standard deviation.
Table 2.
Statistical supplementary data for determining minimum sulphur concentrations (% DM) to ensure optimum growth conditions and yield performance in permanent grassland and lucerne-clover-grass stands (basis: Figure 1 and Figure 2).
| Data series | DM yield | N removal | N2 fixation | |||||||
|---|---|---|---|---|---|---|---|---|---|---|
| (No.) | (Name) | (b–100) | (S–x) | (S–y) | (b–100) | (S–x) | (S–y) | (b–100) | (S–x) | (S–y) |
| 1 | Grassland | 0.30–0.33 | 0.055 | 4.6 | n.d. | 0.063 | 6.7 | n.d. | 0.070 | 16.8 |
| 2 | LCG-grass | 0.32–0.34 | 0.055 | 17.7 | 0.33–0.35 | 0.053 | 28.8 | 0.33–0.35 | 0.056 | 45.5 |
| 3 | LCG-legumes | 0.31–0.33 | 0.056 | 19.7 | 0.29–0.31 | 0.041 | 26.1 | 0.29–0.31 | 0.041 | 40.1 |
| 4 | LCG-legume-grass mixture | 0.29–0.30 | 0.054 | 19.6 | 0.29–0.31 | 0.042 | 26.6 | 0.29–0.31 | 0.044 | 42.4 |
| 5 | LCG-1. growth | 0.29–0.34 | 0.060 | 23.3 | 0.20–0.22 | 0.040 | 34.7 | 0.22–0.24 | 0.039 | 56.9 |
| 6 | LCG-2 + 3. growth | 0.29–0.34 | 0.073 | 30.5 | 0.18–0.20 | 0.035 | 39.9 | 0.19–0.21 | 0.038 | 66.7 |
| 7 | LCG-MP-growth | 0.32–0.35 | 0.070 | 10.5 | n.d. | 0.074 | 21.7 | >0.35 | 0.081 | 33.8 |
LCG = lucerne-clover-grass; MP = main product; n.d. = not determinable; b–100 = S concentrations at which the regression curve reaches and falls below the 100% mark; S–x, S–y = standard errors of the regression (total).
Table 3.
Supplementary statistical data for determining maximum values in the N:S ratios (S = 1) to ensure optimum growth conditions and yield performance in permanent grassland and lucerne-clover-grass (basis: Figure 3 and Figure 4).
| Data series | DM yield | N removal | N2 fixation | |||||||
|---|---|---|---|---|---|---|---|---|---|---|
| (No.) | Name | (b–100) | (S–x) | (S–y) | (b–100) | (S–x) | (S–y) | (b–100) | (S–x) | (S–y) |
| 1 | Grassland | <7.0 | 2.85 | 5.0 | n.d. | 2.83 | 5.8 | n.d. | 3.67 | 17.2 |
| 2 | LCG-grass | 5.0–6.0 | 2.09 | 16.0 | 5.0–6.0 | 1.95 | 24.1 | 5.0–6.0 | 1.95 | 37.3 |
| 3 | LCG-legumes | 7.0–9.0 | 2.61 | 20.3 | 8.0–10.0 | 2.53 | 32.0 | 10.0–12.0 | 2.17 | 46.9 |
| 4 | LCG-legume-grass mixture | 8.0–9.0 | 2.36 | 18.3 | 8.0–9.0 | 2.34 | 29.1 | 8.0–9.0 | 2.34 | 44.3 |
| 5 | LCG-1. growth | <7.0 | 9.59 | 26.8 | n.d. | 11.24 | 37.3 | n.d. | 11.34 | 59.6 |
| 6 | LCG-2 + 3. growth | 11.0–12.0 | 3.38 | 26.0 | 9.0–10.0 | 3.78 | 38.6 | 8.0–10.0 | 4.11 | 62.6 |
| 7 | LCG-MP-growth | 7.0–11.0 | 7.48 | 5.0 | 7.0–9.0 | 7.74 | 10.9 | 7.0–9.0 | 8.24 | 11.9 |
LCG = lucerne-clover-grass; MP = main product; n.d. = not determinable; b–100 = S concentrations at which the regression curve reaches and falls below the 100% mark; S–x, S–y = standard errors of the regression (total).
Table 4.
Supplementary statistical data for determining minimum values of S concentration (% DM) and maximum values in the N:S ratios (S = 1) to ensure optimum growth conditions and yield performance in grain legumes (basis: Figure 5 and Figure 6).
| Data series | DM yield | N removal | N2 fixation | |||||||
|---|---|---|---|---|---|---|---|---|---|---|
| (No.) | (Name) | (b–100) | (S–x) | (S–y) | (b–100) | (S–x) | (S–y) | (b–100) | (S–x) | (S–y) |
| S concentrations | ||||||||||
| 1 | Young plants | n.d. | 0.063 | 11.6 | n.d. | 0.063 | 12.1 | 0.29–0.30 | 0.059 | 16.9 |
| 2 | Vegetative harvest material (straw) | 0.25–0.27 | 0.069 | 13.4 | 0.30–0.33 | 0.077 | 13.0 | 0.31–0.32 | 0.074 | 16.8 |
| 3 | MP grain | 0.26–0.27 | 0.043 | 13.3 | 0.30–0.31 | 0.045 | 13.1 | 0.21–0.23 | 0.044 | 16.4 |
| N:S ratios | ||||||||||
| 1 | Young plants | n.d. | 5.67 | 11.9 | n.d. | 5.75 | 11.9 | approx. 20.0–21.0 | 3.85 | 22.0 |
| 2 | Vegetative harvest material (straw) | 6.0–8.0 | 5.57 | 11.0 | 4.0–7.0 | 5.97 | 10.2 | 3.0–7.0 | 5.89 | 10.8 |
| 3 | MP grain | 18.0–21.0 | 5.23 | 10.9 | n.d. | 4.78 | 10.7 | 13.0–16.0 | 4.68 | 17.6 |
MP = main product; n.d. = not determinable; b–100 = S concentrations at which the regression curve reaches and falls below the 100% mark; S–x, S–y = standard errors of the regression (total).
Table 5.
Supplementary statistical data for determining minimum values of S concentration (% DM) and maximum values in the N:S ratios (S = 1) to ensure optimum growth conditions and yield performance in cereal crops (basis Figure 7: DM yields, other data not shown).
Table 5.
Supplementary statistical data for determining minimum values of S concentration (% DM) and maximum values in the N:S ratios (S = 1) to ensure optimum growth conditions and yield performance in cereal crops (basis Figure 7: DM yields, other data not shown).
| Data series | DM yield | N concentration | N removal | |||||||
|---|---|---|---|---|---|---|---|---|---|---|
| (No.) | (Name) | (b–100) | (S–x) | (S–y) | (b–100) | (S–x) | (S–y) | (b–100) | (S–x) | (S–y) |
| S concentrations | ||||||||||
| 1 | Young plants | 0.16–0.18 | 0.078 | 7.0 | n.d. | 0.076 | 13.8 | approx. 0.20 | 0.077 | 9.2 |
| 2 | Vegetative harvestmaterial (straw) | approx. 0.16–0.20 | 0.049 | 4.0 | n.d. | 0.043 | 15.5 | 0.11–0.14 | 0.047 | 19.0 |
| 3 | MP grain | 0.14–0.16 | 0.043 | 7.8 | n.d. | 0.041 | 11.5 | n.d. | 0.043 | 11.1 |
| N:S ratios | ||||||||||
| 1 | Young plants | n.d. | 1.19 | 3.2 | approx. 14.0–15.0 | 1.49 | 5.7 | approx. 12.0–14.0 | 1.47 | 5.4 |
| 2 | Vegetative harvest material (straw) | approx. 5.0–7.0 | 1.78 | 4.0 | approx. 5.0–7.0 | 1.84 | 15.9 | approx. 4.0–6.0 | 1.80 | 19.7 |
| 3 | MP grain | approx. 11.0–13.0 | 1.93 | 6.9 | approx. 11.0–14.0 | 1.93 | 7.0 | approx. 10.0–13.0 | 1.90 | 10.1 |
MP = main product; n.d. = not determinable; b–100 = S concentrations at which the regression curve reaches and falls below the 100% mark; S–x, S–y = standard errors of the regression (total).
Table 6.
Supplementary statistical data for determining minimum values of S concentrations (% DM) and maximum values in the N:S ratios (S = 1) to ensure optimum growth conditions for winter rape and maize (regressions not shown).
Table 6.
Supplementary statistical data for determining minimum values of S concentrations (% DM) and maximum values in the N:S ratios (S = 1) to ensure optimum growth conditions for winter rape and maize (regressions not shown).
| Data series | Winter rape: DM yield | Maize: DM yield | |||
|---|---|---|---|---|---|
| (No.) | (Name) | (b–100) | (S–x) | (b–100) | (S–x) |
| S concentrations | |||||
| 1 | Young plants | >0.70 | 0.136 | - | - |
| 2 | MP grain | approx. 0.50–0.54 | 0.043 | approx. 0.24–0.30 | 0.126 |
| N:S ratios | |||||
| 1 | Young plants | approx. 4.0–4.8 | 0.71 | - | - |
| 2 | MP grain | approx. 8.5–9.5 | 1.26 | n.d. | 1.626 |
MP = main product; n.d. = not determinable; b–100 = S concentrations at which the regression curve reaches and falls below the 100% mark; S–x = standard error of the regression (total).
Table 7.
Mean concentrations of S, N (% DM) and N:S ratios of young plants, harvested growth (straw) and grain of the plant species analysed in this study compared to table values in the literature.
Table 7.
Mean concentrations of S, N (% DM) and N:S ratios of young plants, harvested growth (straw) and grain of the plant species analysed in this study compared to table values in the literature.
| Plant species | Plant parts | Nutrient | Organic farming | Conventional farming | ||||
|---|---|---|---|---|---|---|---|---|
| This study | Refs. [44,45] | Ref. [47] | Ref. [48] | |||||
| (n) | (% DM) | (s) | (% DM) | (% DM) | (% DM) | |||
| Permanent grassland | Harvested growth | S | 52 | 0.251 | 0.064 | 0.16–0.20 | 0.24–0.39 | 0.24 |
| N | 52 | 2.58 | 0.44 | 1.30–2.70 | - | 1.30–2.80 | ||
| N:S | - | 10.3 | - | 11.0 | - | 9.0 | ||
| Lucerne-clover-grass (mainly lucerne-grass) | Grass growth | S | 58 | 0.263 | 0.100 | 0.18 | 0.50–0.60 | 0.50 |
| Legume growth | S | 82 | 0.202 | 0.101 | 0.18 | 0.50–0.60 | 0.50 | |
| Mixture growth | S | 45 | 0.227 | 0.072 | 0.18 | 0.50–0.60 | 0.50 | |
| Grass growth | N | 54 | 2.00 | 0.56 | 1.90 | - | 2.40 | |
| Legume growth | N | 54 | 3.28 | 0.73 | 3.17–3.45 | - | 3.00 | |
| Mixture growth | N | 33 | 2.95 | 0.77 | 2.82 | - | 2.70–2.75 | |
| Mixture growth | N:S | - | 13.0 | - | 15.7 | - | 5.5 | |
| Lucerne-clover-grass (mainly red clover-grass) | 1. growth | S | 33 | 0.145 | 0.060 | - | - | - |
| 2. + 3. growth | S | 35 | 0.166 | 0.075 | 0.18 | 0.50–0.60 | 0.50 | |
| Harvested growth | S | 107 | 0.186 | 0.079 | 0.18 | 0.50–0.60 | 0.50 | |
| 1. growth | N | 47 | 3.10 | 0.53 | - | - | - | |
| 2. + 3. growth | N | 15 | 2.54 | 0.48 | 2.15–3.10 | - | 2.60–2.65 | |
| Harvested growth | N | 63 | 3.11 | 0.43 | 2.75 | - | 2.60–2.65 | |
| Harvested growth | N:S | - | 16.7 | - | 15.3 | - | 5.3 | |
| Grain legumes (MV) | Young plants | S | 225 | 0.241 | 0.067 | - | - | - |
| Straw | S | 196 | 0.139 | 0.069 | 0.15 | 0.46–0.52 | 0.46 | |
| Grain | S | 215 | 0.211 | 0.061 | 0.18 | 0.23–0.30 | 0.23 | |
| Young plants | N | 62 | 3.83 | 1.06 | - | - | - | |
| Straw | N | 182 | 1.39 | 0.07 | 1.40 | - | - | |
| Grain | N | 199 | 4.54 | 0.83 | 5.10 | - | - | |
| Young plants | N:S | - | 15.9 | - | - | - | - | |
| Straw | N:S | - | 10.0 | - | 10.2 | - | - | |
| Grain | N:S | - | 21.5 | - | 26.1 | - | - | |
| Lupine | Young plants | S | 37 | 0.233 | 0.053 | - | - | - |
| Straw | S | 35 | 0.235 | 0.087 | 0.18 | 0.46–0.52 | - | |
| Grain | S | 39 | 0.259 | 0.047 | 0.24 | 0.23–0.34 | - | |
| Young plants | N | 3 | 3.06 | 0.06 | - | - | - | |
| Straw | N | 28 | 0.90 | 0.19 | 1.28 | - | 1.16 | |
| Grain | N | 32 | 5.20 | 0.43 | 5.58 | 6.26 | ||
| Field bean | Young plants | S | 64 | 0.209 | 0.066 | - | - | - |
| Straw | S | 62 | 0.093 | 0.029 | 0.16 | 0.46–0.52 | 0.46 | |
| Grain | S | 66 | 0.193 | 0.045 | 0.20 | 0.23–0.26 | 0.23 | |
| Young plants | N | 37 | 4.34 | 1.01 | - | - | - | |
| Straw | N | 62 | 1.76 | 0.88 | 1.40 | - | 1.74 | |
| Grain | N | 64 | 4.91 | 0.51 | 4.88 | - | 4.76 | |
| Soya bean | Young plants | S | 25 | 0.242 | 0.016 | - | - | - |
| Straw | S | 3 | 0.227 | 0.015 | 0.15 | 0.46–0.52 | - | |
| Grain | S | 7 | 0.404 | 0.141 | 0.23 | 0.23–0.35 | - | |
| Young plants | N | 5 | 3.39 | 0.88 | - | - | - | |
| Straw | N | 3 | 2.68 | 1.11 | 1.05 | - | - | |
| Grain | N | 30 | 6.28 | 0.57 | 6.40 | - | - | |
| Pea | Young plants | S | 94 | 0.274 | 0.061 | - | - | - |
| Straw | S | 90 | 0.112 | 0.031 | 0.12 | 0.46–0.52 | 0.46 | |
| Grain | S | 94 | 0.193 | 0.026 | 0.16 | 0.23–0.28 | 0.23 | |
| Young plants | N | 12 | 3.24 | 0.42 | - | - | - | |
| Straw | N | 83 | 1.18 | 0.43 | 1.63 | - | 1.74 | |
| Grain | N | 87 | 3.91 | 0.57 | 4.07 | - | 4.18 | |
| Pea-cereal mixture | Grain | N | 19 | 1.76 | 0.83 | 3.52 | - | - |
| Cereal species (MV) | Young plants | S | 97 | 0.261 | 0.072 | - | - | - |
| Straw | S | 15 | 0.109 | 0.042 | 0.10 | 0.18–0.22 | 0.17 | |
| Grain | S | 95 | 0.175 | 0.055 | 0.12 | 0.23–0.25 | 0.23 | |
| Young plants | N | 33 | 2.17 | 0.55 | - | - | - | |
| Straw | N | 15 | 0.52 | 0.16 | 0.51 | - | - | |
| Grain | N | 100 | 1.89 | 0.37 | 1.80 | - | - | |
| Young plants | N:S | - | 8.3 | - | - | - | - | |
| Straw | N:S | - | 4.8 | - | 5.1 | - | - | |
| Grain | N:S | - | 10.8 | - | 14.6 | - | - | |
| Winter wheat | Young plants | S | 72 | 0.236 | 0.062 | - | - | - |
| Straw | S | 14 | 0.111 | 0.042 | 0.10 | 0.17–0.21 | 0.17 | |
| Grain | S | 78 | 0.169 | 0.050 | 0.13 | 0.23–0.26 | 0.23 | |
| Young plants | N | 32 | 2.11 | 0.43 | - | - | - | |
| Straw | N | 14 | 0.52 | 0.16 | 0.51 | - | 0.58 | |
| Grain | N | 89 | 1.90 | 0.24 | 1.95 | - | 2.10 | |
| Spelt | Young plants | S | 12 | 0.325 | 0.057 | - | - | - |
| Straw | S | - | - | - | 0.10 | 0.22–0.26 | - | |
| Grain | S | 6 | 0.245 | 0.005 | 0.12 | 0.23–0.26 | - | |
| Young plants | N | - | - | - | - | - | - | |
| Straw | N | - | - | - | - | - | - | |
| Grain | N | 4 | 1.97 | 0.17 | 2.48 | - | - | |
| Triticale | Young plants | S | 12 | 0.345 | 0.026 | - | - | - |
| Straw | S | - | - | - | 0.10 | 0.17–0.21 | 0.17 | |
| Grain | S | 6 | 0.240 | 0.033 | 0.11 | 0.22–0.23 | 0.23 | |
| Young plants | N | - | - | - | - | - | - | |
| Straw | N | - | - | - | 0.51 | - | 0.58 | |
| Grain | N | 4 | 1.67 | 0.08 | 1.58 | - | 1.91 | |
| Spring wheat, spring barley | Young plants | S | 1 | 0.280 | - | - | - | - |
| Straw | S | 1 | 0.070 | - | 0.10 | 0.17–0.21 | 0.17 | |
| Grain | S | 5 | 0.104 | 0.009 | 0.12 | 0.23–0.26 | 0.23 | |
| Maize | Young plants | S | 12 | 0.410 | 0.042 | - | - | - |
| Straw | S | - | - | - | 0.15 | 0.17–0.21 | 0.17 | |
| Grain | S | 9 | 0.210 | 0.009 | 0.19 | 0.23–0.26 | 0.23 | |
| Young plants | N | 12 | 4.53 | 0.03 | - | - | - | |
| Straw | N | - | - | - | 0.91 | - | 1.04 | |
| Grain | N | 9 | 1.52 | 0.09 | 1.49 | - | 1.75 | |
| Winter rape | Young plants | S | 5 | 0.669 | 0.122 | - | - | - |
| Straw | S | - | - | - | 0.26 | 0.14–0.46 | 0.23 | |
| Grain | S | 4 | 0.387 | 0.029 | 0.37 | 0.46–0.55 | 0.55 | |
| Young plants | N | 5 | 3.38 | 0.160 | - | - | - | |
| Straw | N | - | - | - | 0.58 | - | 0.81 | |
| Grain | N | 4 | 4.80 | 0.01 | 3.08 | - | 3.68 | |
Table 8.
Boxplot evaluations of minimum S concentrations (% DM) and maximum N:S ratios (S = 1) to characterise sufficient S nutrition in this study compared to literature data: Lucerne-clover pure stand selected (LCG-legumes), lucerne-clover-grass (LCG-mixtures).
Table 8.
Boxplot evaluations of minimum S concentrations (% DM) and maximum N:S ratios (S = 1) to characterise sufficient S nutrition in this study compared to literature data: Lucerne-clover pure stand selected (LCG-legumes), lucerne-clover-grass (LCG-mixtures).
| Boxplot characteristics | S concentrations | N:S ratios | |||||||||
|---|---|---|---|---|---|---|---|---|---|---|---|
| This study on organic farming | Convention-al farming | This study on organic farming | Convent-ional farming | ||||||||
| Variants | A + B | A | B | MV (A, B) | Refer-ences(1) | A + B | A | B | MV (A, B) | Refer-ences(2) | |
| Field forage types | LCG-legumes | LCG-mixtures | LCG-mixtures | LCG-mixtures | LCG-mixtures | LCG-legumes | LCG-mixtures | LCG-mixtures | LCG-mixtures | LCG-mixtures | |
| Number | 6 | 21 | 21 | 42 | 13 | 12 | 19 | 19 | 38 | 13 | |
| Mean value | 0.270 | 0.239 | 0.266 | 0.252 | 0.268 | 10.6 | 13.2 | 11.2 | 12.2 | 11.6 | |
| Median value | 0.270 | 0.250 | 0.280 | 0.260 | 0.260 | 10.6 | 13.1 | 11.2 | 11.8 | 11.0 | |
| Standard deviation | 0.014 | 0.032 | 0.035 | 0.036 | 0.084 | 1.25 | 2.35 | 1.59 | 2.23 | 3.01 | |
| Minimum value | 0.25 | 0.17 | 0.20 | 0.17 | 0.18 | 8.31 | 9.60 | 8.31 | 8.31 | 5.00 | |
| Quartiles 25 | 0.26 | 0.22 | 0.24 | 0.23 | 0.20 | 9.60 | 11.1 | 9.92 | 10.6 | 11.0 | |
| 75 | 0.28 | 0.26 | 0.29 | 0.28 | 0.30 | 11.6 | 14.9 | 12.4 | 13.7 | 14.0 | |
| Maximum value | 0.29 | 0.28 | 0.32 | 0.32 | 0.50 | 12.8 | 17.5 | 13.7 | 17.5 | 16.0 | |
| Span range | 0.04 | 0.11 | 0.12 | 0.15 | 0.32 | 4.46 | 7.90 | 5.40 | 9.18 | 11.0 | |
| Standard error of mean | 0.008 | 0.007 | 0.008 | 0.006 | 0.023 | 0.360 | 0.540 | 0.360 | 0.361 | 0.840 | |
| References | (1): [49,54,56,57,58,59] | (2): [8,56,58,59,60,61,62,63] | |||||||||
Table 9.
Boxplot evaluations of minimum S concentrations (% DM) and maximum N:S ratios (S = 1) to characterise sufficient S nutrition by this study in comparison with literature data: Arable grass (organic farming: selected from LCG-mixtures).
Table 9.
Boxplot evaluations of minimum S concentrations (% DM) and maximum N:S ratios (S = 1) to characterise sufficient S nutrition by this study in comparison with literature data: Arable grass (organic farming: selected from LCG-mixtures).
| Boxplot characteristics | S concentrations | N:S ratios | |||||||
|---|---|---|---|---|---|---|---|---|---|
| This study on organic farming | Conventional farming | This study on organic farming | Convention-al farming | ||||||
| Variants | A | B | MV (A, B) | References(1) | A | B | MV (A, B) | References(2) | |
| Number | 3 | 3 | 6 | 6 | 3 | 3 | 6 | 9 | |
| Mean value | 0.280 | 0.310 | 0.295 | 0.193 | 7.50 | 6.50 | 7.00 | 14.1 | |
| Median value | 0.280 | 0.310 | 0.295 | 0.210 | 7.50 | 6.50 | 7.00 | 14.0 | |
| Standard deviation | 0.010 | 0.010 | 0.019 | 0.066 | 0.500 | 0.500 | 0.707 | 2.570 | |
| Minimum value | 0.27 | 0.30 | 0.27 | 0.10 | 7.00 | 6.00 | 6.00 | 10.7 | |
| Quartiles | 25 | 0.28 | 0.31 | 0.28 | 0.15 | 7.25 | 6.25 | 6.63 | 12.0 |
| 75 | 0.29 | 0.32 | 0.31 | 0.25 | 7.75 | 6.75 | 7.38 | 16.0 | |
| Maximum value | 0.29 | 0.32 | 0.32 | 0.25 | 8.00 | 7.00 | 8.00 | 19.0 | |
| Span range | 0.02 | 0.02 | 0.04 | 0.15 | 1.00 | 1.00 | 2.00 | 8.30 | |
| Standard error of mean | 0.006 | 0.006 | 0.008 | 0.027 | 0.289 | 0.289 | 0.289 | 0.860 | |
| References | (1): [8,60,64,65] | (2): [8,61,64,65] | |||||||
Table 10.
Boxplot evaluations of minimum S concentrations (% DM) and maximum N:S ratios (S = 1) to characterise sufficient S nutrition by this study in comparison to literature data: Permanent grassland.
Table 10.
Boxplot evaluations of minimum S concentrations (% DM) and maximum N:S ratios (S = 1) to characterise sufficient S nutrition by this study in comparison to literature data: Permanent grassland.
| Boxplot characteristics | S concentrations | N:S ratios | |||||||
|---|---|---|---|---|---|---|---|---|---|
| This study on organic farming | Conventional farming | This study on organic farming | Convention-al farming | ||||||
| Variants | A | B | MV (A, B) | References(1) | A | B | MV (A, B) | References(2) | |
| Number | 3 | 3 | 6 | 12 | 1 | 1 | 2 | 14 | |
| Mean value | 0.263 | 0.287 | 0.275 | 0.229 | 9.85 | 8.43 | 9.14 | 13.2 | |
| Median value | 0.260 | 0.290 | 0.275 | 0.250 | 9.85 | 8.43 | 9.14 | 12.0 | |
| Standard deviation | 0.015 | 0.015 | 0.019 | 0.070 | 1.00 | 2.69 | |||
| Minimum value | 0.25 | 0.27 | 0.25 | 0.10 | 8.43 | 8.0 | |||
| Quartiles | 25 | 0.26 | 0.28 | 0.26 | 0.18 | 8.79 | 12.0 | ||
| 75 | 0.27 | 0.30 | 0.29 | 0.30 | 9.50 | 15.0 | |||
| Maximum value | 0.28 | 0.30 | 0.30 | 0.30 | 9.85 | 19.0 | |||
| Span range | 0.03 | 0.03 | 0.05 | 0.20 | 1.42 | 11.0 | |||
| Standard error of mean | 0.009 | 0.009 | 0.008 | 0.020 | 0.710 | 0.720 | |||
| References | (1): [8,49,54,55,56,64,66,67,68] | (2): [8,55,56,64,66,67,68,69] | |||||||
Table 11.
Boxplot evaluations of minimum S concentrations (% DM) and maximum N:S values (S = 1) to characterise sufficient S nutrition by this study in comparison with literature data: Grain legume young plants.
Table 11.
Boxplot evaluations of minimum S concentrations (% DM) and maximum N:S values (S = 1) to characterise sufficient S nutrition by this study in comparison with literature data: Grain legume young plants.
| Boxplot characteristics | S concentrations | N:S ratios | |||||||
|---|---|---|---|---|---|---|---|---|---|
| This study on organic farming | Conventional farming | This study on organic farming | Convention-al farming | ||||||
| Variants | A | B | MV (A, B) | References(1) | A | B | MV (A, B) | References(2) | |
| Number | 3 | 3 | 6 | 10 | 6 | 6 | 12 | 4 | |
| Mean value | 0.233 | 0.267 | 0.250 | 0.387 | 24.8 | 22.7 | 23.7 | 19.0 | |
| Median value | 0.230 | 0.270 | 0.250 | 0.290 | 24.8 | 22.7 | 23.6 | 20.0 | |
| Standard deviation | 0.006 | 0.006 | 0.019 | 0.206 | 0.680 | 0.520 | 1.261 | 2.300 | |
| Minimum value | 0.23 | 0.26 | 0.23 | 0.20 | 23.9 | 21.9 | 21.9 | 15.6 | |
| Quartiles | 25 | 0.23 | 0.27 | 0.23 | 0.25 | 24.5 | 22.4 | 22.8 | 18.9 |
| 75 | 0.24 | 0.27 | 0.27 | 0.44 | 25.2 | 22.9 | 24.8 | 20.1 | |
| Maximum value | 0.24 | 0.27 | 0.27 | 0.75 | 25.8 | 23.,,4 | 25.8 | 20.5 | |
| Span range | 0.01 | 0.01 | 0.04 | 0.55 | 1.93 | 1.47 | 3.85 | 4.90 | |
| Standard error of mean | 0.004 | 0.004 | 0.008 | 0.065 | 0.278 | 0.212 | 0.364 | 1.150 | |
| References | (1): [22,37,38,39,63,70,71] | (2): [37,38,39,56,70] | |||||||
Table 12.
Boxplot analyses of minimum S concentrations (% DM) and maximum N:S values (S = 1) to characterise sufficient S nutrition by this study in comparison with literature data: Grain legume straw.
Table 12.
Boxplot analyses of minimum S concentrations (% DM) and maximum N:S values (S = 1) to characterise sufficient S nutrition by this study in comparison with literature data: Grain legume straw.
| Boxplot characteristics | S concentrations | N:S ratios | |||||||
|---|---|---|---|---|---|---|---|---|---|
| This study on organic farming | Conventional farming | This study on organic farming | Convention-al farming | ||||||
| Variants | A | B | MV (A, B) | References(1) | A | B | MV (A, B) | References(2) | |
| Number | 6 | 6 | 12 | 6 | 6 | 12 | |||
| Mean value | 0.205 | 0.245 | 0.225 | 12.1 | 9.27 | 10.7 | |||
| Median value | 0.205 | 0.245 | 0.225 | 12.1 | 9.29 | 10.5 | |||
| Standard deviation | 0.019 | 0.019 | 0.027 | 1.25 | 1.28 | 1.91 | |||
| Minimum value | 0.18 | 0.22 | 0.18 | 10.1 | 7.24 | 7.24 | |||
| Quartiles | 25 | 0.19 | 0.23 | 0.21 | 11.6 | 8.75 | 9.54 | ||
| 75 | 0.22 | 0.26 | 0.24 | 13.0 | 10.1 | 11.9 | |||
| Maximum value | 0.23 | 0.27 | 0.27 | 13.6 | 10.8 | 13.6 | |||
| Span range | 0.05 | 0.05 | 0.09 | 3.43 | 3.55 | 6.33 | |||
| Standard error of mean | 0.008 | 0.008 | 0.008 | 0.510 | 0.523 | 0.551 | |||
| References | (1): - | (2): - | |||||||
Table 13.
Boxplot evaluations of minimum S concentrations (% DM) and maximum N:S ratios (S = 1) to characterise sufficient S nutrition by this study in comparison with literature data: Grain legume grains.
Table 13.
Boxplot evaluations of minimum S concentrations (% DM) and maximum N:S ratios (S = 1) to characterise sufficient S nutrition by this study in comparison with literature data: Grain legume grains.
| Boxplot characteristics | S concentrations | N:S ratios | |||||||
|---|---|---|---|---|---|---|---|---|---|
| This study on organic farming | Conventional farming | This study on organic farming | Convention-al farming | ||||||
| Variants | A | B | MV (A, B) | References(1) | A | B | MV (A, B) | References(2) | |
| Number | 3 | 3 | 6 | 6 | 6 | 12 | |||
| Mean value | 0.220 | 0.243 | 0.232 | 23.4 | 20.8 | 22.1 | |||
| Median value | 0.220 | 0.240 | 0.235 | 23.4 | 20.8 | 22.0 | |||
| Standard deviation | 0.010 | 0.006 | 0.015 | 2.03 | 1.97 | 2.32 | |||
| Minimum value | 0.21 | 0.24 | 0.21 | 20.5 | 18.0 | 18.0 | |||
| Quartiles | 25 | 0.22 | 0.24 | 0.22 | 22.3 | 19.8 | 20.6 | ||
| 75 | 0.23 | 0.25 | 0.24 | 24.4 | 21.8 | 23.5 | |||
| Maximum value | 0.23 | 0.25 | 0.25 | 26.2 | 23.6 | 26.2 | |||
| Span range | 0.02 | 0.01 | 0.04 | 5.77 | 5.64 | 8.25 | |||
| Standard error of mean | 0.006 | 0.004 | 0.006 | 0.829 | 0.804 | 0.671 | |||
| References | (1): - | (2): - | |||||||
Table 14.
Boxplot evaluations of minimum S concentrations (% DM) and maximum N:S ratios (S = 1) to characterise sufficient S nutrition by this study in comparison with literature data: Cereal young plants.
Table 14.
Boxplot evaluations of minimum S concentrations (% DM) and maximum N:S ratios (S = 1) to characterise sufficient S nutrition by this study in comparison with literature data: Cereal young plants.
| Boxplot characteristics | S concentrations | N:S ratios | |||||||
|---|---|---|---|---|---|---|---|---|---|
| This study on organic farming | Conventional farming | This study on organic farming | Convention-al farming | ||||||
| Variants | A | B | MV (A, B) | References(1) | A | B | MV (A, B) | References(2) | |
| Number | 3 | 3 | 6 | 24 | 3 | 3 | 6 | 14 | |
| Mean value | 0.107 | 0.147 | 0.127 | 0.248 | 15.2 | 14.5 | 14.9 | 14.2 | |
| Median value | 0.110 | 0.150 | 0.125 | 0.250 | 15.2 | 14.5 | 14.9 | 14.8 | |
| Standard deviation | 0.006 | 0.006 | 0.023 | 0.087 | 0.75 | 0.75 | 0.78 | 2.93 | |
| Minimum value | 0.10 | 0.14 | 0.10 | 0.12 | 14.5 | 13.8 | 13.8 | 10.0 | |
| Quartiles | 25 | 0.11 | 0.15 | 0.11 | 0.17 | 14.9 | 14.1 | 14.5 | 11.3 |
| 75 | 0.11 | 0.15 | 0.15 | 0.31 | 15.6 | 14.9 | 15.3 | 16.8 | |
| Maximum value | 0.11 | 0.15 | 0.15 | 0.40 | 16.0 | 15.3 | 16.0 | 19.0 | |
| Span range | 0.01 | 0.01 | 0.05 | 0.28 | 1.50 | 1.50 | 2.23 | 9.00 | |
| Standard error of mean | 0.004 | 0.004 | 0.009 | 0.018 | 0.433 | 0.433 | 0.319 | 0.780 | |
| References | (1): [3,49,52,54,55,56,57,58,63,64,65,68,71,72,73,74] | (2): [3,8,56,57,58,64,65,72,74] | |||||||
Table 15.
Boxplot evaluations of minimum S concentrations (% DM) and maximum N:S ratios (S = 1) to characterise sufficient S nutrition in this study compared to literature data: Cereal straw.
Table 15.
Boxplot evaluations of minimum S concentrations (% DM) and maximum N:S ratios (S = 1) to characterise sufficient S nutrition in this study compared to literature data: Cereal straw.
| Boxplot characteristics | S concentrations | N:S ratios | |||||||
|---|---|---|---|---|---|---|---|---|---|
| This study on organic farming | Conventional farming | This study on organic farming | Convention-al farming | ||||||
| Variants | A | B | MV (A, B) | References(1) | A | B | MV (A, B) | References(2) | |
| Number | 6 | 6 | 12 | 6 | 3 | 3 | 6 | ||
| Mean value | 0.118 | 0.145 | 0.132 | 0.133 | 7.47 | 6.55 | 7.01 | ||
| Median value | 0.115 | 0.140 | 0.130 | 0.105 | 7.47 | 6.57 | 7.02 | ||
| Standard deviation | 0.020 | 0.022 | 0.024 | 0.049 | 1.00 | 1.04 | 1.04 | ||
| Minimum value | 0.09 | 0.12 | 0.09 | 0.10 | 6.47 | 5.50 | 5.50 | ||
| Quartiles | 25 | 0.11 | 0.13 | 0.12 | 0.10 | 6.97 | 6.04 | 6.50 | |
| 75 | 0.13 | 0.16 | 0.14 | 0.16 | 7.97 | 7.07 | 7.55 | ||
| Maximum value | 0.15 | 0.18 | 0.18 | 0.21 | 8.47 | 7.57 | 8.47 | ||
| Span range | 0.06 | 0.06 | 0.09 | 0.11 | 2.00 | 2.07 | 2.97 | ||
| Standard error of mean | 0.008 | 0.009 | 0.007 | 0.020 | 0.577 | 0.600 | 0.425 | ||
| References | (1): [3,60,61] | (2): - | |||||||
Table 16.
Boxplot analyses of minimum S concentrations (% DM) and maximum N:S ratios (S = 1) to characterise adequate S nutrition in this study compared to literature data: Cereal grain.
Table 16.
Boxplot analyses of minimum S concentrations (% DM) and maximum N:S ratios (S = 1) to characterise adequate S nutrition in this study compared to literature data: Cereal grain.
| Boxplot characteristics | S concentrations | N:S ratios | |||||||
|---|---|---|---|---|---|---|---|---|---|
| This study on organic farming | Conventional farming | This study on organic farming | Convention-al farming | ||||||
| Variants | A | B | MV (A, B) | References(1) | A | B | MV (A, B) | References(2) | |
| Number | 3 | 3 | 6 | 7 | 3 | 3 | 6 | 6 | |
| Mean value | 0.110 | 0.130 | 0.120 | 0.170 | 13.9 | 13.0 | 13.4 | 11.8 | |
| Median value | 0.110 | 0.130 | 0.120 | 0.170 | 13.9 | 13.0 | 13.5 | 11.5 | |
| Standard deviation | 0.010 | 0.010 | 0.014 | 0.029 | 1.33 | 1.34 | 1.30 | 2.73 | |
| Minimum value | 0.10 | 0.12 | 0.10 | 0.13 | 12.6 | 11.6 | 11.6 | 9.10 | |
| Quartiles | 25 | 0.11 | 0.13 | 0.11 | 0.15 | 13.3 | 12.3 | 12.7 | 9.3 |
| 75 | 0.12 | 0.14 | 0.13 | 0.19 | 14.6 | 13.6 | 14.2 | 14.4 | |
| Maximum value | 0.12 | 0.14 | 0.14 | 0.21 | 15.3 | 14.3 | 15.3 | 14.8 | |
| Span range | 0.02 | 0.02 | 0.04 | 0.08 | 2.66 | 2.67 | 3.62 | 5.70 | |
| Standard error of mean | 0.006 | 0.006 | 0.006 | 0.011 | 0.768 | 0.774 | 0.531 | 1.115 | |
| References | (1): [3,57,60,61] | (2): [8,57,61] | |||||||
Table 17.
Boxplot evaluations of minimum S concentration (% DM) and maximum N:S values (S = 1) to characterise sufficient S nutrition by this study in comparison with literature data: Winter rape young plants.
Table 17.
Boxplot evaluations of minimum S concentration (% DM) and maximum N:S values (S = 1) to characterise sufficient S nutrition by this study in comparison with literature data: Winter rape young plants.
| Boxplot characteristics | S concentrations | N:S ratios | |||||||
|---|---|---|---|---|---|---|---|---|---|
| This study on organic farming | Conventional farming | This study on organic farming | Convention-al farming | ||||||
| Variants | A | B | MV (A, B) | References(1) | A | B | MV (A, B) | References(2) | |
| Number | 1 | 1 | 2 | 24 | 3 | 3 | 6 | 8 | |
| Mean value | 0.560 | 0.630 | 0.595 | 0.520 | 5.11 | 4.76 | 4.94 | 8.40 | |
| Median value | 0.560 | 0.630 | 0.595 | 0.525 | 5.11 | 4.76 | 4.94 | 8.50 | |
| Standard deviation | 0.049 | 0.089 | 0.400 | 0.400 | 0.406 | 1.74 | |||
| Minimum value | 0.56 | 0.35 | 4.71 | 4.36 | 4.36 | 5.00 | |||
| Quartiles | 25 | 0.58 | 0.45 | 4.91 | 4.56 | 4.72 | 7.80 | ||
| 75 | 0.61 | 0.55 | 5.31 | 4.96 | 5.15 | 10.0 | |||
| Maximum value | 0.63 | 0.65 | 5.51 | 5.16 | 5.51 | 10.0 | |||
| Span range | 0.07 | 0.30 | 0.80 | 0.80 | 1.15 | 5.00 | |||
| Standard error of mean | 0.035 | 0.018 | 0.231 | 0.231 | 0.166 | 0.620 | |||
| References | (1): [3,8,43,52,55,56,60,64,65,68,71,73,75,76,77,78] | (2): [3,43,56,61,65,78] | |||||||
Table 18.
Summary of minimum required S concentrations (% DM) and maximum N:S ratios (S = 1) and standard deviations of legume and non-legume plant species in organic and conventional farming (basis: boxplot mean and median values from Table 8, Table 9, Table 10, Table 11, Table 12, Table 13, Table 14, Table 15, Table 16 and Table 17).
| Crop species | S concentrations | N:S ratios | ||||||
|---|---|---|---|---|---|---|---|---|
| Organic farming | Conventional farming | Organic farming | Conventional farming | |||||
| Permanent grassland | ||||||||
| Young growths before flowering | (0.26–0.28) | ±0.019 | 0.23–0.25 | ±0.070 | (9.1–9.9) | ±1.00 | 12.0–13.2 | ±2.69 |
| Lucerne-clover-grass | ||||||||
| LCG-mixture young growthsbefore flowering | 0.24–0.27 | ±0.036 | 0.26–0.27 | ±0.084 | 11.2–13.2 | ±2.23 | 11.0–11.6 | ±3.01 |
| LCG-legumes young growthbefore flowering | 0.27 | 0.014 | - | - | 10.6 | ±1.25 | - | - |
| Grain legumes | ||||||||
| Young plants before flowering | 0.23–0.27 | ±0.019 | 0.29–0.39 | ±0.206 | 22.7–24.8 | ±1.26 | 19.0–20.0 | ±2.30 |
| Straw | 0.21–0.25 | ±0.027 | - | - | 9.3–12.1 | ±1.91 | - | - |
| Grain | 0.22–0.24 | ±0.015 | - | - | 20.8–23.4 | ±2.32 | - | - |
| Cereals | ||||||||
| Young plants before flowering | 0.11–0.15 | ±0.023 | 0.25 | ±0.087 | 14.5–15.2 | ±0.78 | 14.2–14.8 | ±2.93 |
| Straw | 0.12–0.14 | ±0.024 | 0.11–0.13 | ±0.049 | 6.6–7.5 | ±1.04 | - | - |
| Grain | 0.11–0.13 | ±0.014 | 0.17 | ±0.029 | 13.0–13.9 | ±1.30 | 11.5–11.8 | ±2.73 |
| Winter oilseed rape | ||||||||
| Young plants before flowering | - | - | 0.52–0.53 | ±0.089 | - | - | 8.4–8.5 | ±1.74 |
| Grain | 0.48–0.50 | ±0.021 | - | - | 9.6–10.3 | ±0.57 | (9.0) | - |
LCG-mixture: lucerne-clover-grass; LCG-legumes: lucerne-clover pure stand selected from LCG; values in brackets: provisional.
Disclaimer/Publisher’s Note: The statements, opinions and data contained in all publications are solely those of the individual author(s) and contributor(s) and not of MDPI and/or the editor(s). MDPI and/or the editor(s) disclaim responsibility for any injury to people or property resulting from any ideas, methods, instructions or products referred to in the content. |
© 2024 by the authors. Licensee MDPI, Basel, Switzerland. This article is an open access article distributed under the terms and conditions of the Creative Commons Attribution (CC BY) license (http://creativecommons.org/licenses/by/4.0/).
Copyright: This open access article is published under a Creative Commons CC BY 4.0 license, which permit the free download, distribution, and reuse, provided that the author and preprint are cited in any reuse.


