
Submitted:
21 November 2024
Posted:
26 November 2024
You are already at the latest version
Abstract
Two new cembrane-derived tricyclic diterpenes belonging to the sarcophytin family, namely 4a-hydroxy-chatancin (1) and sarcotoroid (2), together with two known related ones (3 and 4), were isolated from the soft coral Sarcophyton tortuosum collected off Ximao Island in the South China Sea. The structures of the new compounds were elucidated by extensive spectroscopic analysis, quantum mechanical nuclear magnetic resonance (QM-NMR) method, time-dependent density functional theory electronic circular dichroism (TDDFT-ECD) calculation, X-ray diffraction analysis and comparison with the reported data in the literature. A plausible biosynthetic pathway of compounds 1–4 was proposed by undergoing a transannular Diels-Alder cycloaddition. In bioassay, the new compound 1 displayed significantly inhibitory activities against fish pathogens Streptococcus parauberis KSP28, oxytetracycline-resistant Streptococcus parauberis SPOF3K, and Photobacterium damselae FP2244 with the MIC values of 9.1, 9.1, and 18.2 μg/mL, respectively. Besides, by a luciferase reporter assay on rat liver Ac2F cells, compounds 1, 3 and 4 were evaluated for peroxisome proliferator-activated receptors (PPAR) transcriptional activity, and compound 3 showed selective PPAR-β agonist activity at concentration of 10 μΜ.
Keywords:
soft coral
; Sarcophyton tortuosum
; polycyclic diterpenes
; transannular Diels-Alder cycloaddition
; antibacterial activity
; PPAR-β agonist activity
1. Introduction
Soft corals of the genus Sarcophyton (phylum, Cnidaria; class, Anthozoa; subclass, Octocorallia; order, Alcyonaceae; family, Alcyoniidae) dominated many coral reef areas, which are characterized by a smooth mushroom-shaped appearance. [1] Chemical investigation studies have shown that the soft corals of this genus furnished a wealth of secondary metabolites, which possess complex/intriguing structural characteristics and exhibit a range of biological activities.[2] Notable metabolites include sesquiterpenes, diterpenes, diterpene dimers, prostaglandins, and steroids. [3,4]
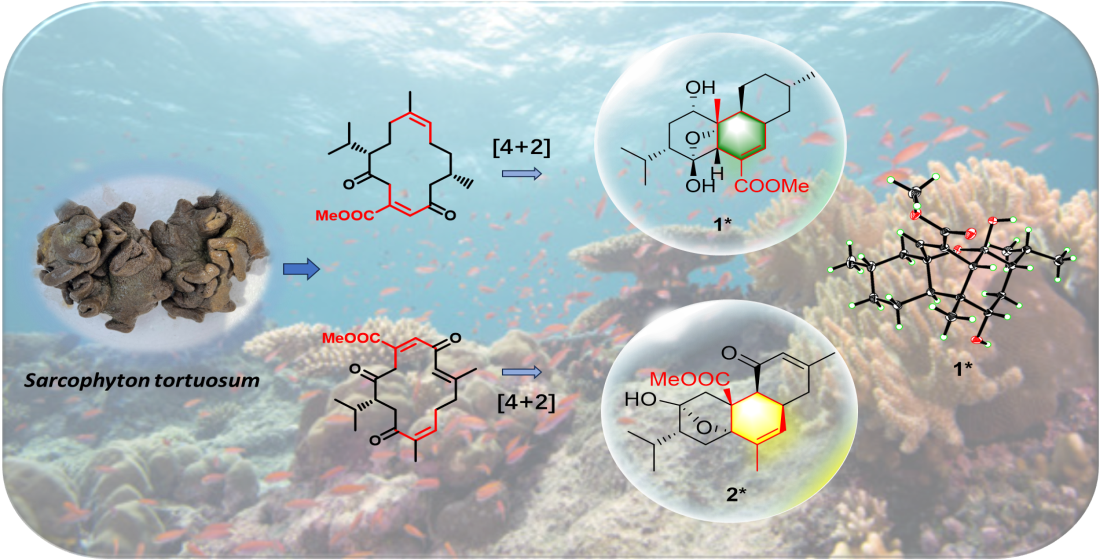
Sarcophyton tortuosum is widely distributed in the tropic oceans, especially the South China Sea, which have been continuously chemical investigated by our group for over a decade, leading to the isolation and characterization of a variety of structurally intriguing and biologically active diterpenes and diterpene dimers.[5,6,7,8,9] Among them, eunicellane-type diterpenoids, cembrane-type diterpenoids, and especially the biscembranoids (diterpene dimers) are characteristic secondary metabolites of this soft coral. Cembranoids, diterpenes with a 14-membered macrocycle, have been known to be common intermediates in the biogenesis of polycyclic diterpenes and biscembranoids by the intramolecular 2+2 cycloaddition and intermolecular 4+2 (Diels-Alder) cycloaddition,[10,11,12] respectively. However, no natural product example of polycyclic diterpenoid formed by intramolecular 4+2 (Diels-Alder) cycloaddition from cembranoids, and only a few biomimetic syntheses in natural products with Diels-Alder reaction,[13,14] which parked our great interest in searching for more evidences of natural products produced by intramolecular Diels-Alder cycloaddition from soft corals.
In this work, the chemical investigation on a new collection of soft coral S. tortuosum from Ximao Island, Hainan Province, China, has resulted in the isolation and full characterization of two previously undescribed compounds 1 and 2, along with two known compounds 3 and 4 (Figure 1). Herein, the isolation, structure elucidation, plausible biosynthetic pathway, and biological evaluation of these isolated compounds were described.
2. Results and Discussion
Freshly collected specimens of S. tortuosum were frozen to –20°C before exhaustively extracted with acetone. The Et2O-soluble portion of the acetone extract of the title animal was subjected to repeated chromatography, including silica gel, Sephadex LH-20, and RP-HPLC to yield four compounds (1–4). The known compounds 3 and 4 were readily identified as 4-oxochatancin (3),[15] and (+)-chatancin (4),[16] respectively, by direct comparison of their NMR spectroscopic data and specific rotation value with those reported in the literatures.
Compound 1 was isolated as a colorless crystal. Its molecular formula of C21H32O5 was established by the quasi-molecular ion peak at m/z 387.2129 ([M+Na]+, calc. 387.2147 for C21H32O5Na) in the HR-ESIMS spectrum, indicating six degrees of unsaturation. The IR spectrum displayed strong absorption at 3460 cm−1 and 1712 cm−1, suggested the presence of hydroxyl and carbonyl groups. The 1H NMR, 13C NMR, and DEPT spectra of 1 suggested the presence of one trisubstituted double bond [δH 7.27 (1H, s, H-9), δC 145.11 (CH, C-9) and δC 134.82 (qC, C-10)], one carbonyl carbon atom [δC 165.41 (qC, C-16)], and one oxymethine [δH 3.53 (1H, m, H-4), δC 77.0 (CH, C-4)]. Consequently, the remaining four degrees of unsaturation led to the fact that compound 1 was a tetracyclic structure.
Detailed comparison revealed that the NMR data (Table 1) of compound 1 were almost identical to those of co-occurred compounds 3 and 4, which had been previously isolated from the tropical marine slug Phyllodesmium longicirrum that prey on soft corals of the genus Sarcophyton. The only difference between 1 and 3 was that the carbonyl group at the C-4 position in 3 was replaced by a hydroxyl group in 1, which as evidenced by the 2 mass unit difference in their ESIMS data. Thus, the planar structure of 1 was determined as shown in Figure 1.
In the NOESY spectrum, there was a clear correlation between H-4 (δH 3.53, m), CH3-14 (δH 0.85, s), H-2 (δH 1.56) and H-10a (δH 2.79, d, J=1.73), indicating that H-2, H-4, CH3-14 and H-10a are on the same side of the molecule, and randomly assigned as b-orientation (Figure 2). Subsequently, the interactions of H-4b (δH 1.60)/CH3-15(δH 1.00, d, J=6.3), revealed that these protons and/or proton-bearing groups were positioned at the other side of the molecule, thus a-orientation. In the light of above observation, the relative configuration of C-2, C-4, C-4a, C-4b, C-7, and C-10a in 1 was assigned to be 2S*, 4S*, 4aR*, 4bR*, 7S, and 10aR*, respectively. In addition, the relative stereochemistry of C-1 and C-8a in 1 was tentatively determined to be the same 1R* and 8aR* as that of 3 on basis of their highly similar 13C NMR data.
The absolute configuration of 1 was determined by comparing its ECD spectra with that of 3. As shown in Figure 3, the cotton effects in the ECD spectra of the two compounds are consistent with each other. Therefore, the absolute configuration of 1 was ultimately determined as 1R, 2S, 4S, 4aR, 4bR, 7S, 8aR, 10aR.
In order to unambiguously confirm the structure and absolute configuration of 1, the suitable single crystals of 1 in MeOH were obtained. The X-ray crystallographic analysis using Cu Kα radiation (λ=1.54178 Å) firmly disclosed the planar structure of 1 and determined its absolute configuration as 1R, 2S, 4S, 4aR, 4bR, 7S, 8aR, 10aR with the Flack parameter of 0.08(7) (Figure 4, CCDC 2384793). Consequently, the structure of 1 was elucidated as depicted in Figure 1 and named as 4a-hydroxy-chatancin.
Sarcotoroid (2) was isolated as colorless oil, which possessed the molecular formula of C21H28O5 as assigned by HR-ESIMS protonated molecular ion peak at m/z 361.2004 ([M+H]+, calc. for C21H29O5, 361.2010), requiring eight degrees of unsaturation. The IR spectrum of 2 showed absorption bonds at 3300 cm–1 and 1727 cm–1 suggested the presence of hydroxy and easter carbonyl functionalities. The 1D and 2D NMR spectra of 2 revealed the presence of two trisubstituted double bonds [δH 5.86 (1H, s, H-6), δC 161.51 (qC, C-7), and δC 127.46 (CH, C-6); δH 5.89 (1H, s, H-9), δC 134.19 (qC, C-10), and δC 135.25 (CH, C-9)], one carbonyl group [δC 197.91 (qC, C-5)], one methyl ester group [δH 3.71 (3H, s, H-17) and δC 175.33 (qC, C-14)], and one hemiketal group [δC 106.36 (qC, C-3)]. The above functionalities accounted for four degrees of unsaturation, suggesting that compound 2 must possess a tetracyclic ring system accounting for the remaining four degrees of unsaturation.
Detailed analysis of 1H‒1H COSY spectrum of 2 revealed two sequential fragments (Figure 5) by the clear correlations of H-4b [δH 2.91 (d, J = 13.0)]/H-8a [δH 3.02, m]/H-8 [δH 2.25, m]/H-9 [δH 5.89, m], and CH3-12 [δH 0.88 (d, J = 6.7)]/CH3-13[δH 0.90 (d, J = 6.7)]/H-11 [δH 1.98, m]/H-2 [δH 2.18, m]/H2-1 [δH 1.82 (dd, J = 13.1, 6.5), δH 1.46 (dd, J = 13.1, 8.3)]. The key HMBC correlations from H-4 to C-3, C-4a, and C-10a, from H-1 to C-2, C-3, C-10a, and C-4a, indicated the present of ring (a) in the structure. The second ring (b) was confirmed by HMBC correlations from H-4b to C-4a, C-8a, and C-9; as well as from CH3-16 to C-9, C-10, and C-10a. The diagnostic HMBC correlation from H-4b to C-8a, C-8, and C-5 and from CH3 to C-6, C-7, and C-8 agreed with the presence of the third ring (c). Considering the downfield shift of the two quaternary carbons C-3 (δC 106.36) and C-10a (δC 81.47), the remaining one degree of unsaturation must be given by the formation of an oxygen bridge between C-3 and C-10a. Finally, the planar structure of 2 was determined as shown in Figure 5.
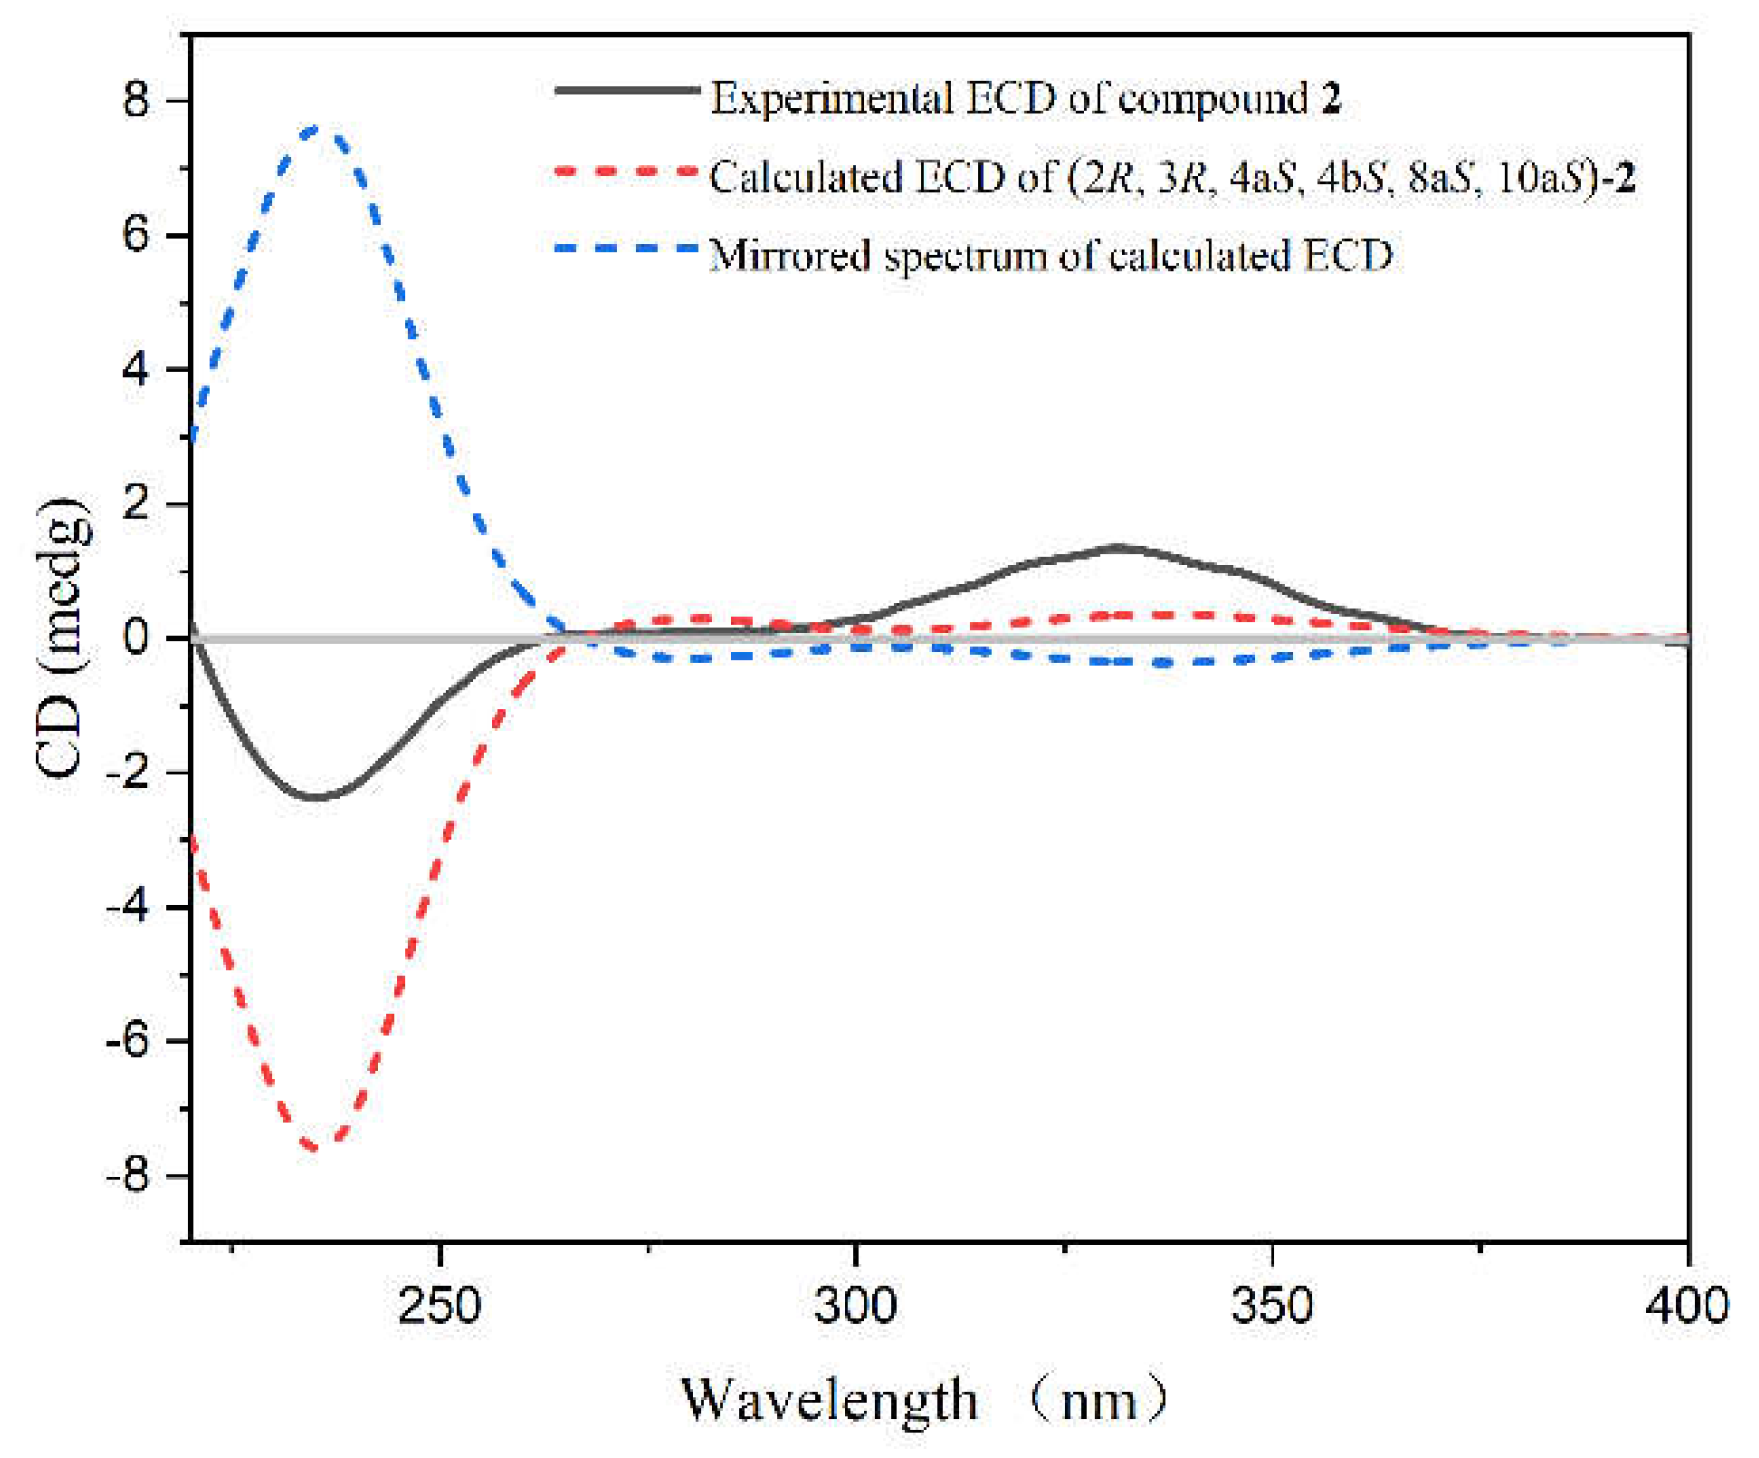
The observed NOESY correlations between H-6 (δH 5.86)/CH3-15 (δH 1.96) and H-9 (δH 5.89)/CH3-16 (δH 1.86) demonstrated the Z geometries of the double bonds at Δ6,7 and Δ9,10. The NOE correlations of H-4b/H-8a suggested that H-4b and H-8a were in same orientation. The NOE correlations of H-8a/Ha-4 and Hb-4/H-2 indicated that H-2 and H-8a were in opposite orientation. Thus, the relative configuration of C-4b, C-8a, and C-2 was assigned as 2R*, 4bS*, and 8aS*. Due to the advantageous conformation of the five membered ring in the envelope form, the relative configuration of C-3, C-10a was determined to be 3R* and 10aS*. However, the relative configuration of C-4a remains a challenge task due to the absence of related NOESY correlations. Therefore, the quantum mechanical-nuclear magnetic resonance (QM-NMR) method, which has been widely used to define the relative configuration of multi stereogenic centers of natural products,[17] was applied. Four possible candidate structures, namely 2a (2R*, 3R*, 4aS*, 4bS*, 8aS*, 10aS*), 2b (2R*, 3R*, 4aR*, 4bS*, 8aS*, 10aS*), 2c (2R*, 3S*, 4aR*, 4bS*, 8aS*, 10aR*), and 2d (2R*, 3S*, 4aS*, 4bS*, 8aS*, 10aR*) were calculated for their theoretical NMR data. Following the DP4+ protocol, geometrical optimization at the DFT level was undertaken by using the B3LYP functional with the 6–311G(d,p) basis set.[18] Afterward, the NMR calculation was conducted at the mPW1PW91/6-31G* level, and the experimental NMR data of 2 gave the best match to that of 2a with over 99% probability. (Figure 6). Moreover, the TDDFT-ECD method was also performed to determine the absolute configuration of 2.[19,20] As shown in Figure 7, the calculated ECD curve of (2R, 3R, 4aS, 4bS, 8aS, 10aS)-2 fits good agreement with the experimental ECD curve of 2. Finally, the absolute configuration of 2 was assigned as 2R, 3R, 4aS, 4bS, 8aS, 10aS as shown in Figure 1.
It is worth pointing out that the structural similarities between compounds 1–4, and their co-occurrence in the same sample suggested that they may originate from the same biogenetic pathway. A plausible biosynthetic pathway for structural correlations among the related diterpenoids 1–4 was proposed. As shown in Scheme 1, compounds 1, 3 and 4 herein probably have the same precursor macrocyclic diketone a. Firstly, the C-6 of a undergoes enol interconversion, resulting in the formation of conjugated double bonds at Δ3,4 and Δ5,6 in b. Subsequently, these conjugated double bonds participate in a transannular Diels-Alder cycloaddition with the double bond at Δ11,12, leading to the formation of the core structure featuring an uncommon 6/6/6-tricyclic ring system. Finally, the lone pair electrons of the oxygen atom in 6-OH attacked the C-2 carbon atom, resulting in the formation of 4 with an epoxy bridge between C-6 and C-2. Following by two steps of oxidation, compounds 1 and 3 are ultimately obtained. Similarity, the precursor methyl sarcoate (5)[21] undergoes enol interconversion yielded d, the conjugated double bonds at Δ10,11 and Δ12,13 of d undergo a transannular Diels-Alder cycloaddition with the double bonds at Δ4,5 to generate e, followed by the nucleophilic attack of hydroxyl group 13-OH on C-2 formed 2.
In bioassay, all the isolated compounds were tested for their antibacterial effects. Streptococcus parauberis is the primary pathogen responsible for fish-borne streptococcal disease, which is widely distributed and highly pathogenic, causing significant economic losses in fish aquaculture worldwide. S. parauberis can infect a diverse range of fish, including both freshwater and farmed or wild species, exhibiting clinical symptoms similar to septicemia. However, these strains have gradually developed drug resistance, including multidrug resistance. The S. parauberis SPOF3K strain is a drug-resistant isolate from aquaculture that exhibits significant resistance to tetracycline and oxytetracycline, with the MIC of over 24 μg/mL and 12.42 μg/mL, respectively. Notably, compound 1 exhibited good antibacterial activity against the S. parauberis KSP28 and oxytetracycline-resistant S. parauberis SPOF3K, with an MIC value of 9.10 μg/mL, which is superior to the antibacterial effect of oxytetracycline (MIC = 12.42 μg/mL).
Photobacterium damselae (formerly Vibrio damsela) is a halophilic bacterium associated with marine environments, known to cause skin ulcers in damselfish. It is a primary pathogen responsible for ulcers and hemorrhagic septicemia in various marine species, including dolphins, sharks, and shrimp, as well as both wild and cultivated fish. Additionally, this pathogen can lead to fatal infections in humans.[22] Compound 1 showed significant antibacterial activities against the P. damselae FP2244 with the MIC value of 18.21 μg/mL.
Besides, the isolated compounds were tested for antibacterial activity against Pseudomonas aeruginosa, Staphylococcus aureus, Escherichia coli, Enterobacter cloacae, Enterobacter hormaechei, Aeromonas sabnonicida, Photobacterium halotolerans, Lactococcus garvieae FP MP5245, and several strains of vancomycin-resistant Enterococcus faecium (G1, G4, G7, and G13), as well as Streptococcus agalactiae, Edwardsiella piscicida TH1, Vibrio parahaemolyticus, and Vibrio alginolyticus. However, these results were negative at the concentration of 100 μM.

Table 2.
Antibacterial activities of compound 1 and antibiotics.a.
| Compounds | MIC (μg/mL) | ||
|---|---|---|---|
| S. parauberis | S. parauberis SPOF3K | P. damselae FP2244 | |
| 1 | 9.10 | 9.10 | 18.21 |
| Tetracycline | 3.01 | >24.00 | 0.02 |
| Oxytetracycline | 1.55 | 12.42 | 0.02 |
| Levofloxacin | 1.24 | 1.24 | 0.02 |
| Ampicillin | 4.64 | 0.58 | 0.02 |
a Tetracycline, oxytetracycline, levofloxacin, and ampicillin were used as positive controls.
Peroxisome proliferator-activated receptors (PPAR) include PPAR-α, PPAR-β, and PPAR-γ isotypes, which are transcription factors that regulate gene expression upon ligand activation. PPAR-α enhances cellular fatty acid uptake, esterification, and trafficking, while also regulating genes involved in lipoprotein metabolism. PPAR-β stimulates lipid and glucose utilization by increasing mitochondrial function and fatty acid desaturation pathways. While PPAR-γ promotes fatty acid uptake, triglyceride formation, and storage in lipid droplets, which enhances insulin sensitivity and glucose metabolism.[23] The compounds 1, 3 and 4 were evaluated for PPAR transcriptional activity using luciferase assay (Figure 8). As shown in Figure 8A, these compounds were first evaluated for their cytotoxicity against Ac2F cells. Compounds 1, 3 and 4 demonstrated no cytotoxic effects on Ac2F cells at a concentration of 10 μM after 24 h treatment. Notably, compound 3 exhibited significant and selective PPAR-β agonist activity at the concentration of 10 μM, comparable to that of the positive control GW501516 at 5 μM.
3. Materials and Methods
3.1. General Experimental Procedures
Melting points were measured on an X-4 digital micro-melting point apparatus. The X-ray measurement was made on a Bruker D8 Venture X-ray diffractometer with Cu Kα radiation (Bruker Biospin AG, Fällanden, Germany). Optical rotations were measured on a Perkinelmer 241 MC polarimeter. IR spectrum was recorded on a Nicolet iS50 spectrometer (Thermo Fisher Scientific, Madison, WI, USA). 1H and 13C NMR spectra were acquired on a Bruker DRX-600 spectrometer (Bruker Biospin AG, Fällanden, Germany). Chemical shifts are reported with the residual CDCl3 (δH 7.26 ppm) as the internal standard for 1H-NMR spectrometry and CDCl3 (δC 77.26 ppm) for 13C-NMR spectrometry. The HR-ESI-MS spectra were recorded on a ZenoTOF7600 mass spectrometer (SCIEX). Commercial silica gel (Qingdao Haiyang Chemical Co., Ltd., Qingdao, China, 200–300, and 300–400 mesh) was used for column chromatography, and Sephadex LH-20 gel (Amersham Biosciences) were used for column chromatography (CC), and precoated-silica-gel-plates (G60 F-254, Yan Tai Zi Fu Chemical Group Co., Yantai, China) were used for analytical TLC. Spots were detected on TLC under UV light or by heating after spraying with anisaldehyde H2SO4 reagent. Reversed phase (RP) HPLC was performed on an Agilent 1260 series liquid chromatograph equipped with a DAD G1315D detector at 210 nm (Agilent, Santa Clara, CA, USA). An Agilent semi-preparative XDB-C18 column (5 μm, 250×9.4 mm) was employed for the purification. All solvents used for CC and HPLC were of analytical grade (Shanghai Chemical Reagents Co., Ltd., Shanghai, China) and chromatographic grade (Dikma Technologies Inc., Beijing, China), respectively.
3.2. Animal Materials
The soft coral S. tortuosum was collected from Ximao Island, Hainan Province, China, in 2023 at a depth of –20 meters, and identified by Professor Xiu-Bao Li from Hainan University. A voucher specimen (No. 23-YT-20) is available for inspection at the Shandong Laboratory of Yantai Drug Discovery.
3.3. Extraction and Isolation
The frozen animals (800.4 g, dry weight after extraction) were cut into pieces and extracted exhaustively with acetone at room temperature (4×2L). The organic extract was evaporated to give a brown residue, which was then partitioned between diethyl ether (Et2O) and H2O. The Et2O solution was concentrated under reduced pressure to obtain a dark brown residue (58.0 g), which was classified by silica gel column chromatography (200-300 mesh) and eluted with a step gradient [0–100% Et2O in petroleum ether (PE) solution to obtain six fractions (A–G). Fraction D (2.1 g) was subjected to chromatography on a Sephadex LH-20 column using a petroleum ether (PE)/CH2Cl2/MeOH (2:1:1) elution system, yielding subfractions DA to DC. Purification of the DB subfraction was performed using Sephadex LH-20 (CH2Cl2), followed by silica gel column chromatography with a PE/Et2O (20:1) elution, yielding four subfractions (DBAA–DBAD). Further purification of DBAB by RP-HPLC [CH3CN/H2O (85:25), 3.0 mL/min] led to the isolation of compound 4 (4 mg, tR = 29 min). Fraction F (2.3 g) was purified by chromatography on Sephadex LH-20, as described above, yielding subfractions FBA–FBE and FCA–FCH. Subfraction FBA was subjected to silica gel column chromatography, eluting with PE/Et2O (15:1), to give five subfractions (FBAA–FBAE). Further purification of subfraction FBAB by semi-preparative RP-HPLC (CH3CN/H2O, 70:30) yielded compound 3 (2 mg, tR = 23.5 min). Further purification of subfraction FCD by semi-preparative RP-HPLC (CH3CN/H2O, 52:48) yielded compound 1 (1.2 mg, tR =11 min), and purification of subfraction FCF by semi-preparative RP-HPLC (CH3CN/H2O, 45:55) yielded compound 2 (1.7 mg, tR = 16 min).
3.4. Spectroscopic Data of Compounds
4a-hydroxy-chatancin (1): Colorless crystal, (m. p. 122-124°C), –2 (c 0.10, MeOH); IR (KBr): νmax 3460, 2952, 2925, 2868, 1712, 1268 cm−1; For 1H and 13C NMR spectroscopic data, see Table 1; HR-ESI-MS m/z 387.2129 ([M+Na]+; calcd. for C21H32O5Na, 387.2147).
Sarcotoroid (2): Colorless oil, –16 (c 0.10, MeOH); IR (KBr): νmax 3300, 2952, 2918, 2850, 1727, 1627 cm−1; For 1H and 13C NMR spectroscopic data, see Table 1; HR-ESI-MS m/z 361.2004 ([M+H] +; calc. for C21H29O5, 361.2010).
3.5. Calculation Section
For the QM-NMR calculations of compounds, conformational search was performed by using the torsional sampling (MCMM) approach and the OPLS_2005 force field applying an energy window of 21 kJ/mol (5.02 kcal/mol). Reoptimize the conformers of populations exceeding 1% Boltzman populations at the B3LYP/6-311G (d, p) level. Subsequently, nuclear magnetic resonance calculations were performed at the PCM/mPW1PW91/6-31G (d) level. The shielding constant of NMR was calculated using the GIAO method. Finally, calculate the average shielding constant for each stereoisomer Boltzmann distribution and correlate it with experimental data.
Regarding the TDDFT-ECD calculations of compounds, conformational search was carried out according to the general protocols previously described for QM-NMR calculation. Reoptimized the conformers above 1% Boltzmann population and used the IEFPCM solvent model for TDDFT-ECD calculations, using Gaussian 09 at the theoretical B3LYP/6-311G (d, p) level. Finally, the SpecDis 171 software was used to obtain the calculated ECD spectrum and visualize the results.
3.6. X-ray crystallographic Analysis for Compound 1
The crystallographic data were collected on a Bruker D8 Venture diffractometer equipped with Cu Kα radiation (λ = 1.54178 Å). The structures were solved with the ShelXT structure solution program using Intrinsic Phasing and refined with the ShelXL refinement package using Least Squares minimisation.
Compound 1: colorless crystals (m.p. 122-124°C), monoclinic, C21H34O6, Mr = 382.48, (including a water molecule) crystal size 0.2 × 0.15 × 0.04 mm3, space group C2, a = 19.2786(5) Å, b=11.3201(3)Å, c = 10.4695(3) Å, V = 2061.47(10) Å3, Z = 4, ρcalc = 1.232 g/cm3, F (000) = 832.0, Independent reflections: 3908 [Rint = 0.0656, Rsigma = 0.0341]. R1 = 0.0331, wR2 = 0.0810 reflections with I ≥ 2σ (I), R1 = 0.0331, wR2 = 0.0810 for all unique data, Flack parameter: 0.08(7). The crystals of 1 were recrystallized from MeOH. These above crystal data were deposited in the Cambridge Crystallographic Data Centre (CCDC) and assigned the accession number (CCDC 2384793).
3.7. Antibacterial Activity Bioassays
The bacterial strains S. parauberis KSP28, S. parauberis SPOF3K, P. damselae FP2244, A. sabnonicida, P. halotolerans and L. garvieae FP MP5245, P. aeruginosa, E. coli, E. cloacae, E. hormaechei, A. salmonicida, S. agalactiae, V. parahaemolyticus, and V. alginolyticus were provided by National Fisheries Research & Development Institute, Korea. The vancomycin-resistant strains E. faecium bacteria G1, G4, G7 and G13, and S. aureus were provided by Ruijin Hospital, Shanghai Jiao Tong University School of Medicine. The E. piscicida TH1 was provided by Chinese Academy of Tropical Agricultural Sciences. were also used in antibacterial experiments.
Minimal inhibitory concentration (MIC) for compounds were determined using the 0.5 McFarland standard method. Mueller–Hinton II broth (cation-adjusted, BD 212322) was used for bacterial culture. Compounds were generally dissolved in DMSO to a concentration of 2 mM as stock solutions. All samples were diluted in culture broth to an initial concentration of 100 µM. Serial 1:1 dilutions were then performed using culture broth to achieve concentrations ranging from 100 µM to 0.24 µM. A total of 5 µL of each dilution was distributed into 96-well plates, along with sterile controls, growth controls (containing culture broth and DMSO without compounds), and positive controls (containing culture broth with antibiotics). All wells except sterile control well were inoculated with 95 µL of an exponential-phase bacterial suspension (approximately 105 CFU/well). The plates were incubated at 37°C for 12 h. MIC values were defined as the lowest concentration that completely inhibited bacterial growth. All MIC values were interpreted in accordance with the Clinical and Laboratory Standards Institute (CLSI) guidelines. The MIC in molar concentration was ultimately converted to mass concentration based on the molecular weight of each compound.
3.8. Cell Culture and Cell Viability
Rat liver Ac2F cells were obtained from the American Type Culture Collection (ATCC, Rockville, MD, USA). Cells were grown in Dulbecco's modified Eagle medium (DMEM) containing 2 mM L-glutamine, 100 mg/ml streptomycin, 2.5 mg/L amphotericin B, and 10% heat-inactivated fetal bovine serum (FBS) and were maintained in a humidified atmosphere containing 5% CO2 at 37°C. Cells were seeded in 96-well culture plates, cultured for 12 h, and then treated with various concentrations of samples for 24 h. Cell viabilities were evaluated using water-soluble tetrazolium (CCK-8) reagent, which was added to each well (10 mL) and incubated at 37°C for 1 h. Absorbances were read using an microplate absorbance reader at a wavelength of 450 nm.
3.9. Luciferase Transactivation Assays
For luciferase assays, the 3×AOX-TK-luciferase reporter plasmid, containing 3 copies of the PPRE in the acyl CoA oxidase promoter was a gift from Dr. Chistopher K. Glass (University of California at San Diego, La Jolla, CA, USA). The pcDNA3 expression vector and full-length human PPAR-α, PPAR-β, or PPAR-γ expression vector (pFlag-PPAR-α, pFlag-PPAR-β, or pFlag-PPAR-γ) were gifts from Dr. Chatterjee (the University of Cambridge, Addenbrooke's Hospital at Cambridge, UK). For the experiment, 1 μg of 3×AOX-TK-luciferase reporter plasmid were transfected into Ac2F cells in a 48-well plate (1×10⁵ cells/well) with 0.1 μg of effector plasmids, including pcDNA3, or pFlag-PPAR-α/β/γ by using Lipofectamine™ 2000 as the manufacturer's instructions. After transfection for 6 h, the conditioned media was removed and replaced with serum-free media, and the compounds were added. After an additional incubation for 7 h, cells were washed with PBS and assayed with the Luciferase Assay Systems (Promega, Madison, WI, USA). Luciferase activity was measured using a GloMax-Multi Microplate Multimode Reader (EnVision, PerkinElmer, Uk).
4. Conclusions
In summary, two previously unreported polycyclic diterpenoids (1 and 2) together with two structural analogues (3 and 4) were isolated and characterized from the soft coral S. tortuosum. Structurally, new compounds 1 and 2 represented the first example of cembrane-derived tricyclic diterpenes belonging to sarcophytin family that were isolated from S. tortuosum, which expanded the chemical diversity of diterpenes from soft coral of this species. To the best of our knowledge, only ten members have been reported from the soft corals of Sarcophyton genus and their predator sea slug Phyllodesmium longicirrum.[2,15] The stereochemistry of the new compounds was unambiguously determined using a combination of X-ray diffraction analysis, QM-NMR method, and TDDFT-ECD calculation. A plausible biosynthetic pathway for compounds 1–4 was proposed by undergoing an interesting transannular Diels-Alder cycloaddition. The intramolecular 4+2 cycloaddition reactions occurring in compounds 1 and 2 exhibit significant differences, manifested in different diene positions, which resulted in the carbomethoxy group being attached to the C-10 position of compound 1 and the C-4a position of compound 2, respectively. A study by Pierre and coworkers achieved an asymmertric total synthesis of (+)-chatancin via a transannular Diels-Alder reaction, demonstrated the rationality of above proposed biosynthetic pathway.[13] In bioassays, the new compound 1 exhibited antibacterial activities against fish pathogens S. parauberis KSP28, oxytetracycline-resistant S. parauberis, and P. damselae FP2244, while compound 3 showed selective PPAR-β agonist activity. These intriguing findings highlight the potential of sarcophytin-like tricyclic diterpenes as leader compounds for the treatment of microbial infections and metabolic diseases.
Statistical Analysis
Each experiment was repeated at least three times. The experimental data were analyzed using one-way analysis of variance (ANOVA) and are presented as the mean ± standard deviation after assessment.
Supplementary Materials
The following supporting information can be downloaded at the website of this paper posted on Preprints.org.
Author Contributions
Conceptualization, M.-Z. S. and Y.-W. G.; methodology, M. S.; validation, S.-W. L. and M.-Z. S.; investigation, M. S.; resources, Y.-W. G.; bioactivity detection, J.-A. Z.; data curation, M.-Z. S.; writing original draft preparation, M. S.; writing review and editing, M.-Z. S., C.-Y. W., and Y.-W. G.; supervision, Y.-W. G.; project administration, Y.-W. G.; funding acquisition, M.-Z. S and Y.-W. G. All authors have read and agreed to the published version of the manuscript.
Data Availability Statement
The data that support the findings of this study are available in the supplementary material of this article.
Acknowledgments
This research was financially supported by the National Key Research and Development Program of China (No. 2022YFC2804100), the National Natural Science Foundation of China (Nos. 82404502, 81991521, and 82304375), the Shandong Laboratory Program (SYS202205), and Key R&D Program of Shandong Province, China (2024CXPT029).
Conflicts of Interest
The authors declare no conflict of interest.
References
- Aratake, S.; Tomura, T.; Saitoh, S.; Yokokura, R.; Kawanishi, Y.; Shinjo, R.; Reimer, J.D.; Tanaka, J.; Maekawa, H. Soft coral Sarcophyton (Cnidaria: Anthozoa: Octocorallia) species diversity and chemotypes. Plos. One. 2012, 7, e30410. [Google Scholar] [CrossRef] [PubMed]
- Liang, L.F.; Guo, Y.-W. Terpenes from the soft corals of the genus Sarcophyton: Chemistry and biological activities. Chem. Biodivers. 2013, 10, 2161–2196. [Google Scholar] [CrossRef] [PubMed]
- Elkhawas, Y.A.; Elissawy, A.M.; Elnaggar, M.S.; Mostafa, N.M.; Kamal, E.M.; Bishr, M.M.; Singab, A.N.B.; Salama, O.M. Chemical Diversity in Species Belonging to Soft Coral Genus Sacrophyton and Its Impact on Biological Activity: A Review. Mar. Drugs. 2020, 18, 41. [Google Scholar] [CrossRef] [PubMed]
- Liu, J.; Gu, Y.C.; Su, M.Z.; Guo, Y.W. Chemistry and bioactivity of secondary metabolites from South China Sea marine fauna and flora: Recent research advances and perspective. Acta. Pharmacol. Sin. 2022, 43, 3062–3079. [Google Scholar] [CrossRef]
- Jia, R.; Guo, Y.-W.; Chen, P.; Yang, Y.M.; Mollo, E.; Gavagnin, M.; Cimino, G. Biscembranoids and their probable biogenetic precursor from the Hainan soft coral Sarcophyton tortuosum. J. Nat. Prod. 2007, 70, 1158–1166. [Google Scholar] [CrossRef]
- Li, Y.F.; He, L.L.; Liu, H.L.; Liang, L.F.; Zhang, H.B.; Guo, Y.-W. Structural revision of methyl tortuoate D, a bis-cembranoid from Hainan Sarcophyton tortuosum and its absolute stereochemistry. J. Asian. Nat. Prod. Res. 2013, 15, 566–573. [Google Scholar] [CrossRef]
- Chen, Z.H.; Yu, D.D.; Li, C.; Su, M.Z.; Wu, Q.; Zhang, Z.Y.; Wang, J.R.; Li, J.; Guo, Y.-W. Guided Isolation of An Uncommon Cembranoid Orthoester, Sarcotortin A, and Three Skeletal Diverse Terpenoids from the Hainan Soft Coral Sarcophyton tortuosum Based on Molecular Networking Strategy. Chem.Eur. J. 2023, 29, e202203487. [Google Scholar] [CrossRef]
- Li, Y.F.; Li, S.W.; Cuadrado, C.; Gao, C.L.; Wu, Q.H.; Li, X.L.; Pang, T.; Daranas, A.H.; Guo, Y.-W.; Li, X.W. Polyoxygenated anti-inflammatory biscembranoids from the soft coral Sarcophyton tortuosum and their stereochemistry. Chinese. Chem. Lett. 2021, 32, 271–276. [Google Scholar] [CrossRef]
- Jia, R.; Guo, Y.-W.; Mollo, E.; Gavagnin, M.; Cimino, G. Sarcophytonolides E-H, cembranolides from the Hainan soft coral Sarcophyton latum. J. Nat. Prod. 2006, 69, 819–822. [Google Scholar] [CrossRef]
- Liang, L.F.; Kurtán, T.; Mándi, A.; Yao, L.G.; Li, J.; Zhang, W.; Guo, Y.-W. Unprecedented diterpenoids as a PTP1B inhibitor from the Hainan soft coral Sarcophyton trocheliophorum Marenzeller. Org. Lett. 2013, 15, 274–277. [Google Scholar] [CrossRef]
- Du, Y.Q.; Yao, L.G.; Li, X.W.; Guo, Y.-W. Yonarolide A, an unprecedented furanobutenolide-containing norcembranoid derivative formed by photoinduced intramolecular [2+2] cycloaddition. Chinese. Chem. Lett. 2023, 34, 107512. [Google Scholar] [CrossRef]
- Wu, M.-J.; Yu, D.-D.; Su, M.-Z.; Wang, J.R.; Gong, L.; Zhang, Z.Y.; Wang, H.; Guo, Y.-W. Discovery and photosynthesis of sinuaustones A and B, diterpenoids with a novel carbon scaffold isolated from soft coral Sinularia australiensis from Hainan. ORG. CHEM. FRONT. 2022, 9, 5921–5928. [Google Scholar] [CrossRef]
- Soucy, P.; L'Heureux, A.; Toró, A.; Deslongchamps, P. Pyranophane transannular diels-alder approach to (+)-chatancin: A biomimetic asymmetric total synthesis. J. Org. Chem. 2003, 68, 9983–9987. [Google Scholar] [CrossRef] [PubMed]
- Li, Y.; Pattenden, G. Perspectives on the structural and biosynthetic interrelationships between oxygenated furanocembranoids and their polycyclic congeners found in corals. Nat. Prod. Rep. 2011, 28, 1269–1310. [Google Scholar] [CrossRef] [PubMed]
- Bogdanov, A.; Hertzer, C.; Kehraus, S.; Nietzer, S.; Rohde, S.; Schupp, P.J.; Wägele, H.; König, G.M. Defensive Diterpene from the Aeolidoidean Phyllodesmium longicirrum. J. Nat. Prod. 2016, 79, 611–615. [Google Scholar] [CrossRef] [PubMed]
- Sugano, M.; Shindo, T.; Sato, A.; Iijima, Y.; Oshima, T.; Kuwano, H.; Hata, T. Chatancin, a PAF antagonist from a soft coral, Sarcophyton sp. J. Org. Chem. 1990, 55, 5803–5805. [Google Scholar] [CrossRef]
- Li, S.W.; Cuadrado, C.; Yao, L.G.; Daranas, A.H.; Guo, Y.-W. Quantum Mechanical-NMR-Aided Configuration and Conformation of Two Unreported Macrocycles Isolated from the Soft Coral Lobophytum sp.: Energy Calculations versus Coupling Constants. Org. lett. 2020, 22, 4093–4096. [Google Scholar] [CrossRef]
- Grimblat, N.; Zanardi, M.M.; Sarotti, A.M. Beyond DP4: An Improved Probability for the Stereochemical Assignment of Isomeric Compounds using Quantum Chemical Calculations of NMR Shifts. J. Org. Chem. 2015, 80, 12526–12534. [Google Scholar] [CrossRef]
- Mándi, A.; Kurtán, T. Applications of OR/ECD/VCD to the structure elucidation of natural products. Nat. Prod. Rep. 2019, 36, 889–918. [Google Scholar] [CrossRef]
- Shen, S.M.; Li, S.W.; Su, M.Z.; Yao, L.G.; Appendino, G.; Guo, Y.W. Structurally Diverse Diterpenoids from the Sanya Bay Nudibranch Hexabranchus sanguineus and Its Sponge-Prey Chelonaplysilla sp. Chem.Eur. J. 2023, 29, e202203858. [Google Scholar] [CrossRef]
- Leone, P.A.; Bowden, B.F.; Carroll, A.R.; Coll, J.C.; Meehan, G.V. Studies of Australian Soft Corals, XLIX. A New Biscembranoid and Its Probable Biosynthetic Precursors from the Soft Coral Sarcophyton tortuosum. J. Nat. Prod. 1993, 56, 521–526. [Google Scholar] [CrossRef]
- Rivas, A.J.; Balado, M.; Lemos, M.L.; Osorio, C.R. The Photobacterium damselae subsp. damselae hemolysins damselysin and HlyA are encoded within a new virulence plasmid. Infect.Immun. 2011, 79, 4617–4627. [Google Scholar] [PubMed]
- Montaigne, D.; Butruille, L.; Staels, B. PPAR control of metabolism and cardiovascular functions. Nat. Rev. Cardiol. 2021, 18, 809–823. [Google Scholar] [CrossRef] [PubMed]
Figure 1.
Chemical structures of compounds 1–4.
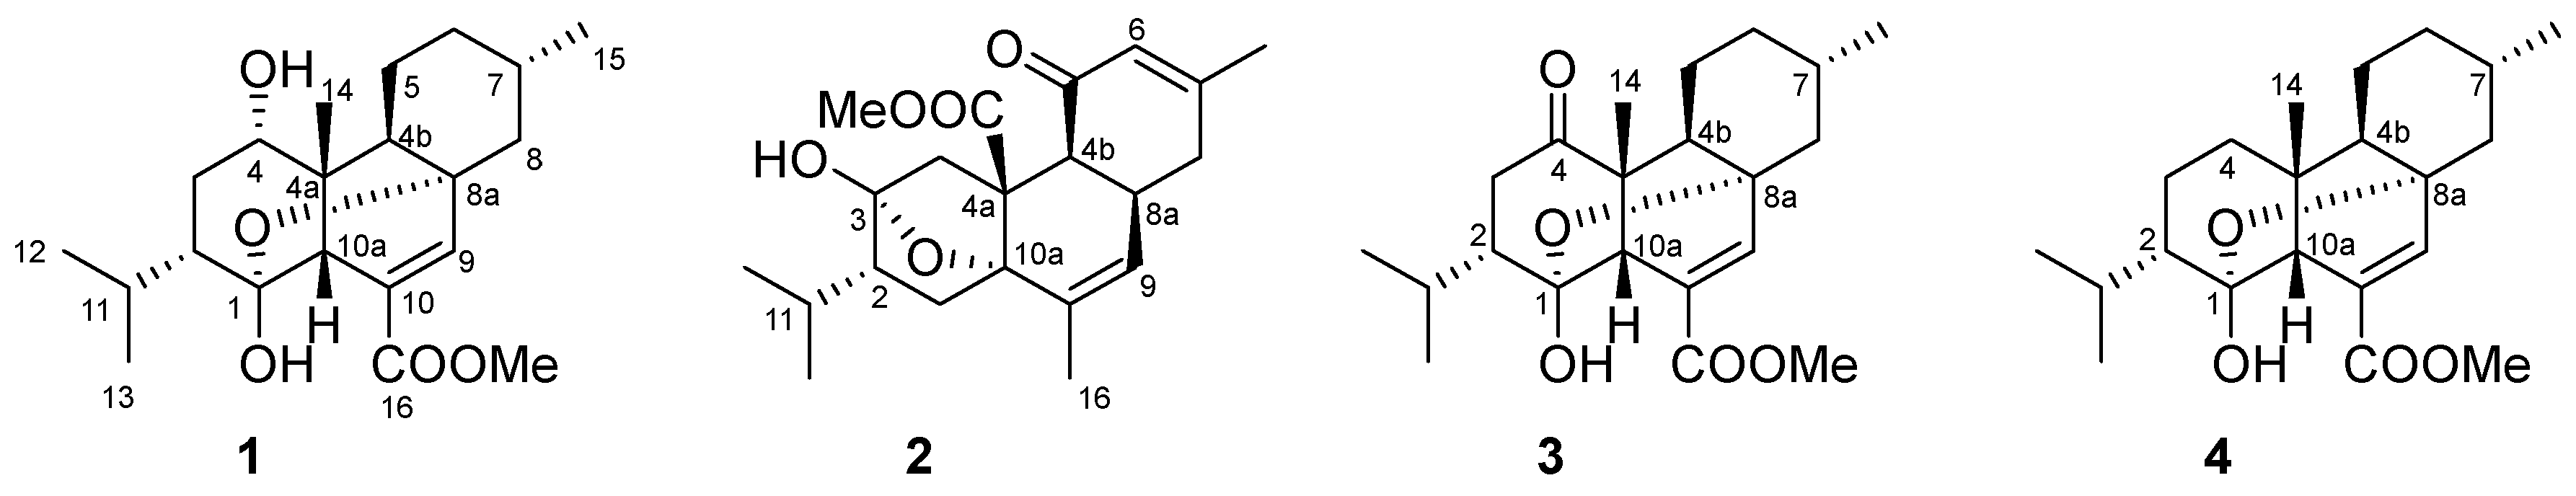
Figure 2.
1H–1H COSY, selected key HMBC, and NOESY correlations of 1.
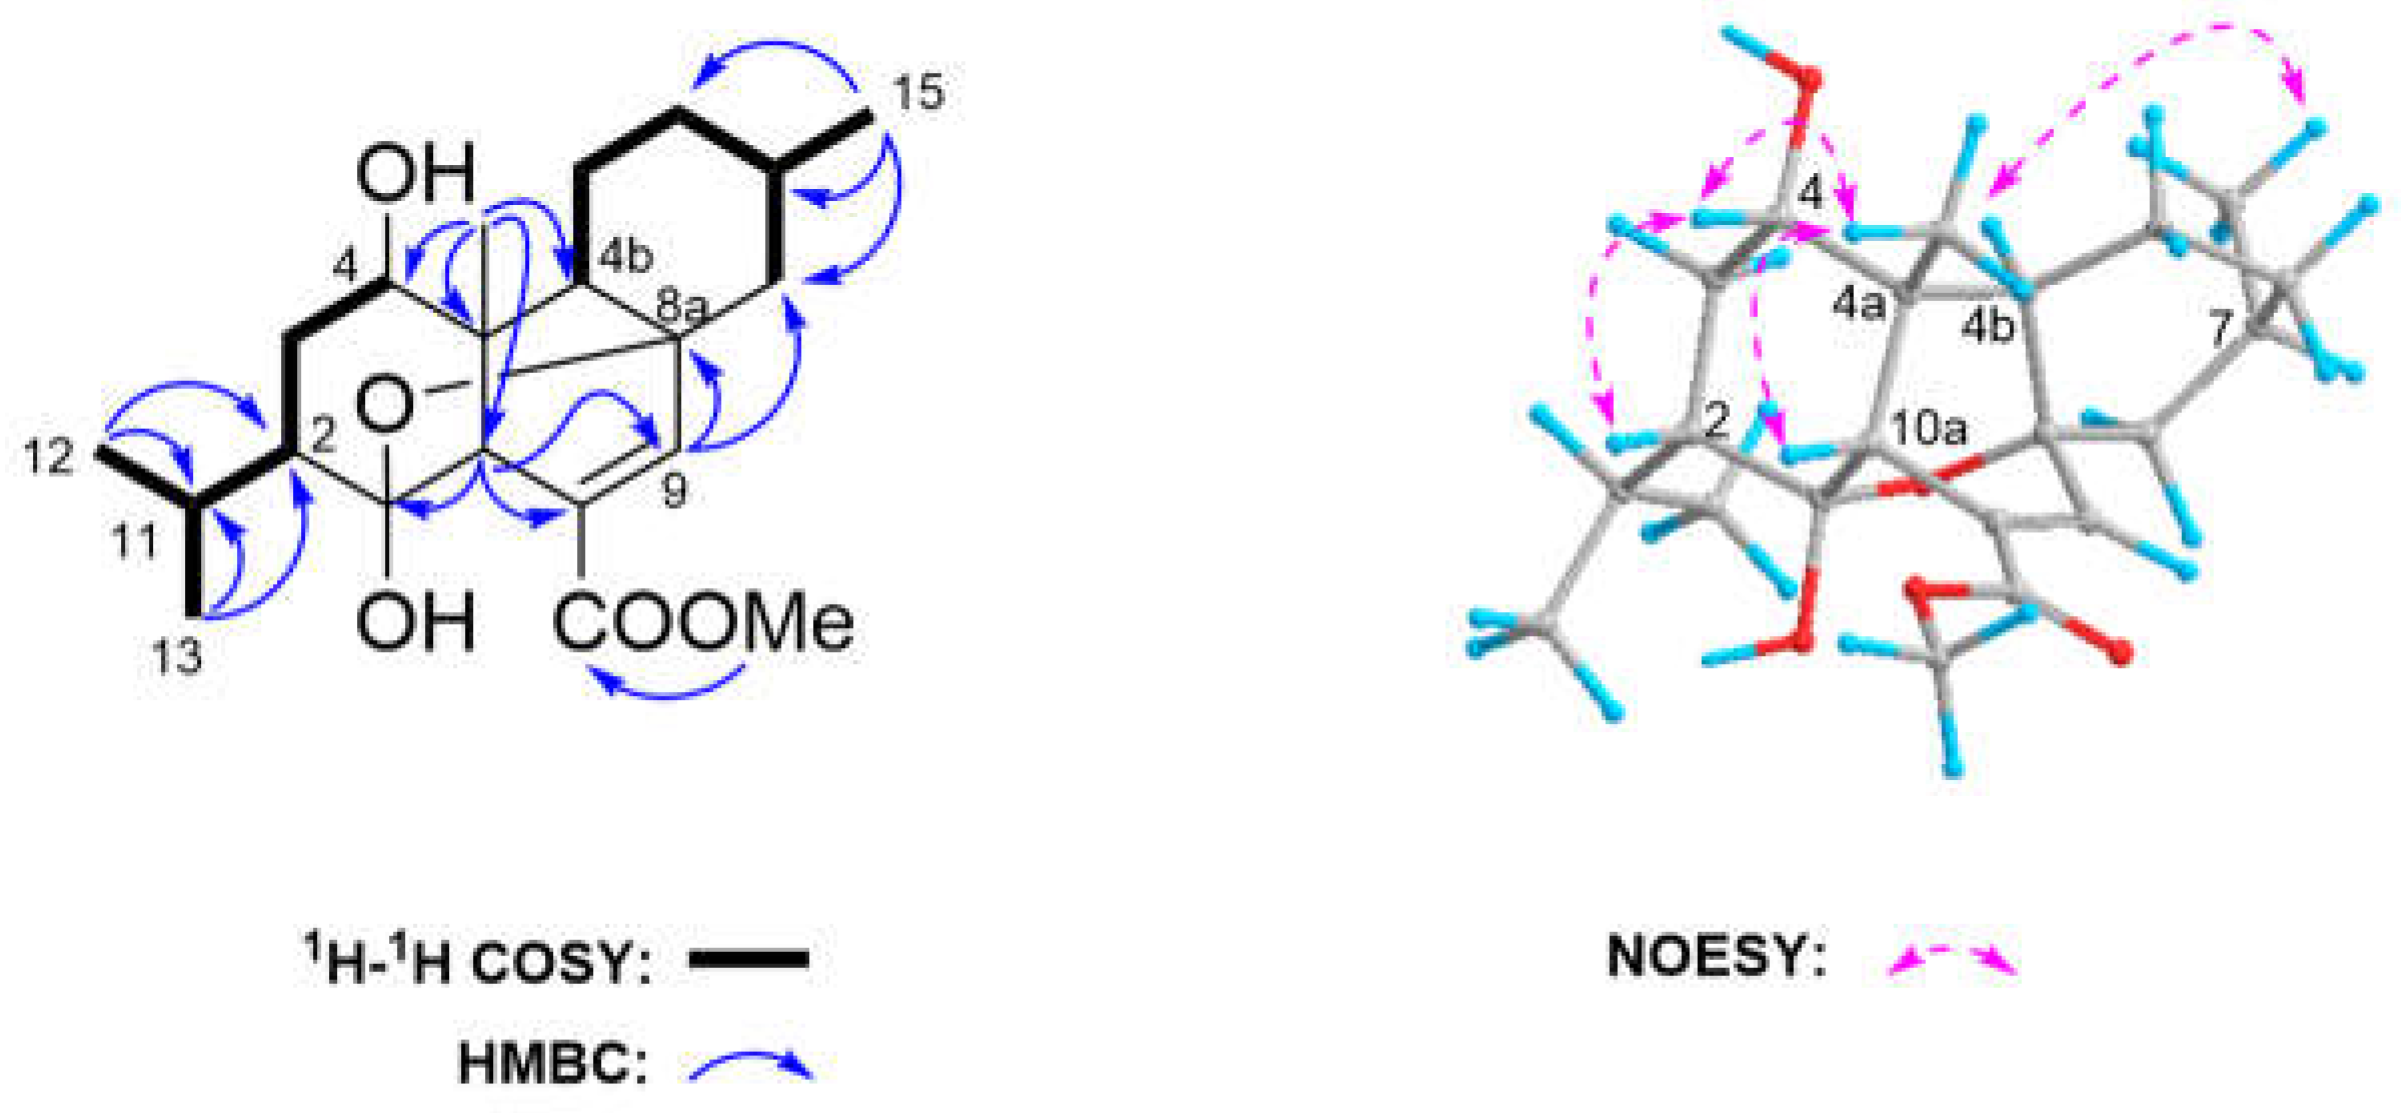
Figure 3.
Experimental ECD spectra of 1 (red) and 3 (black).
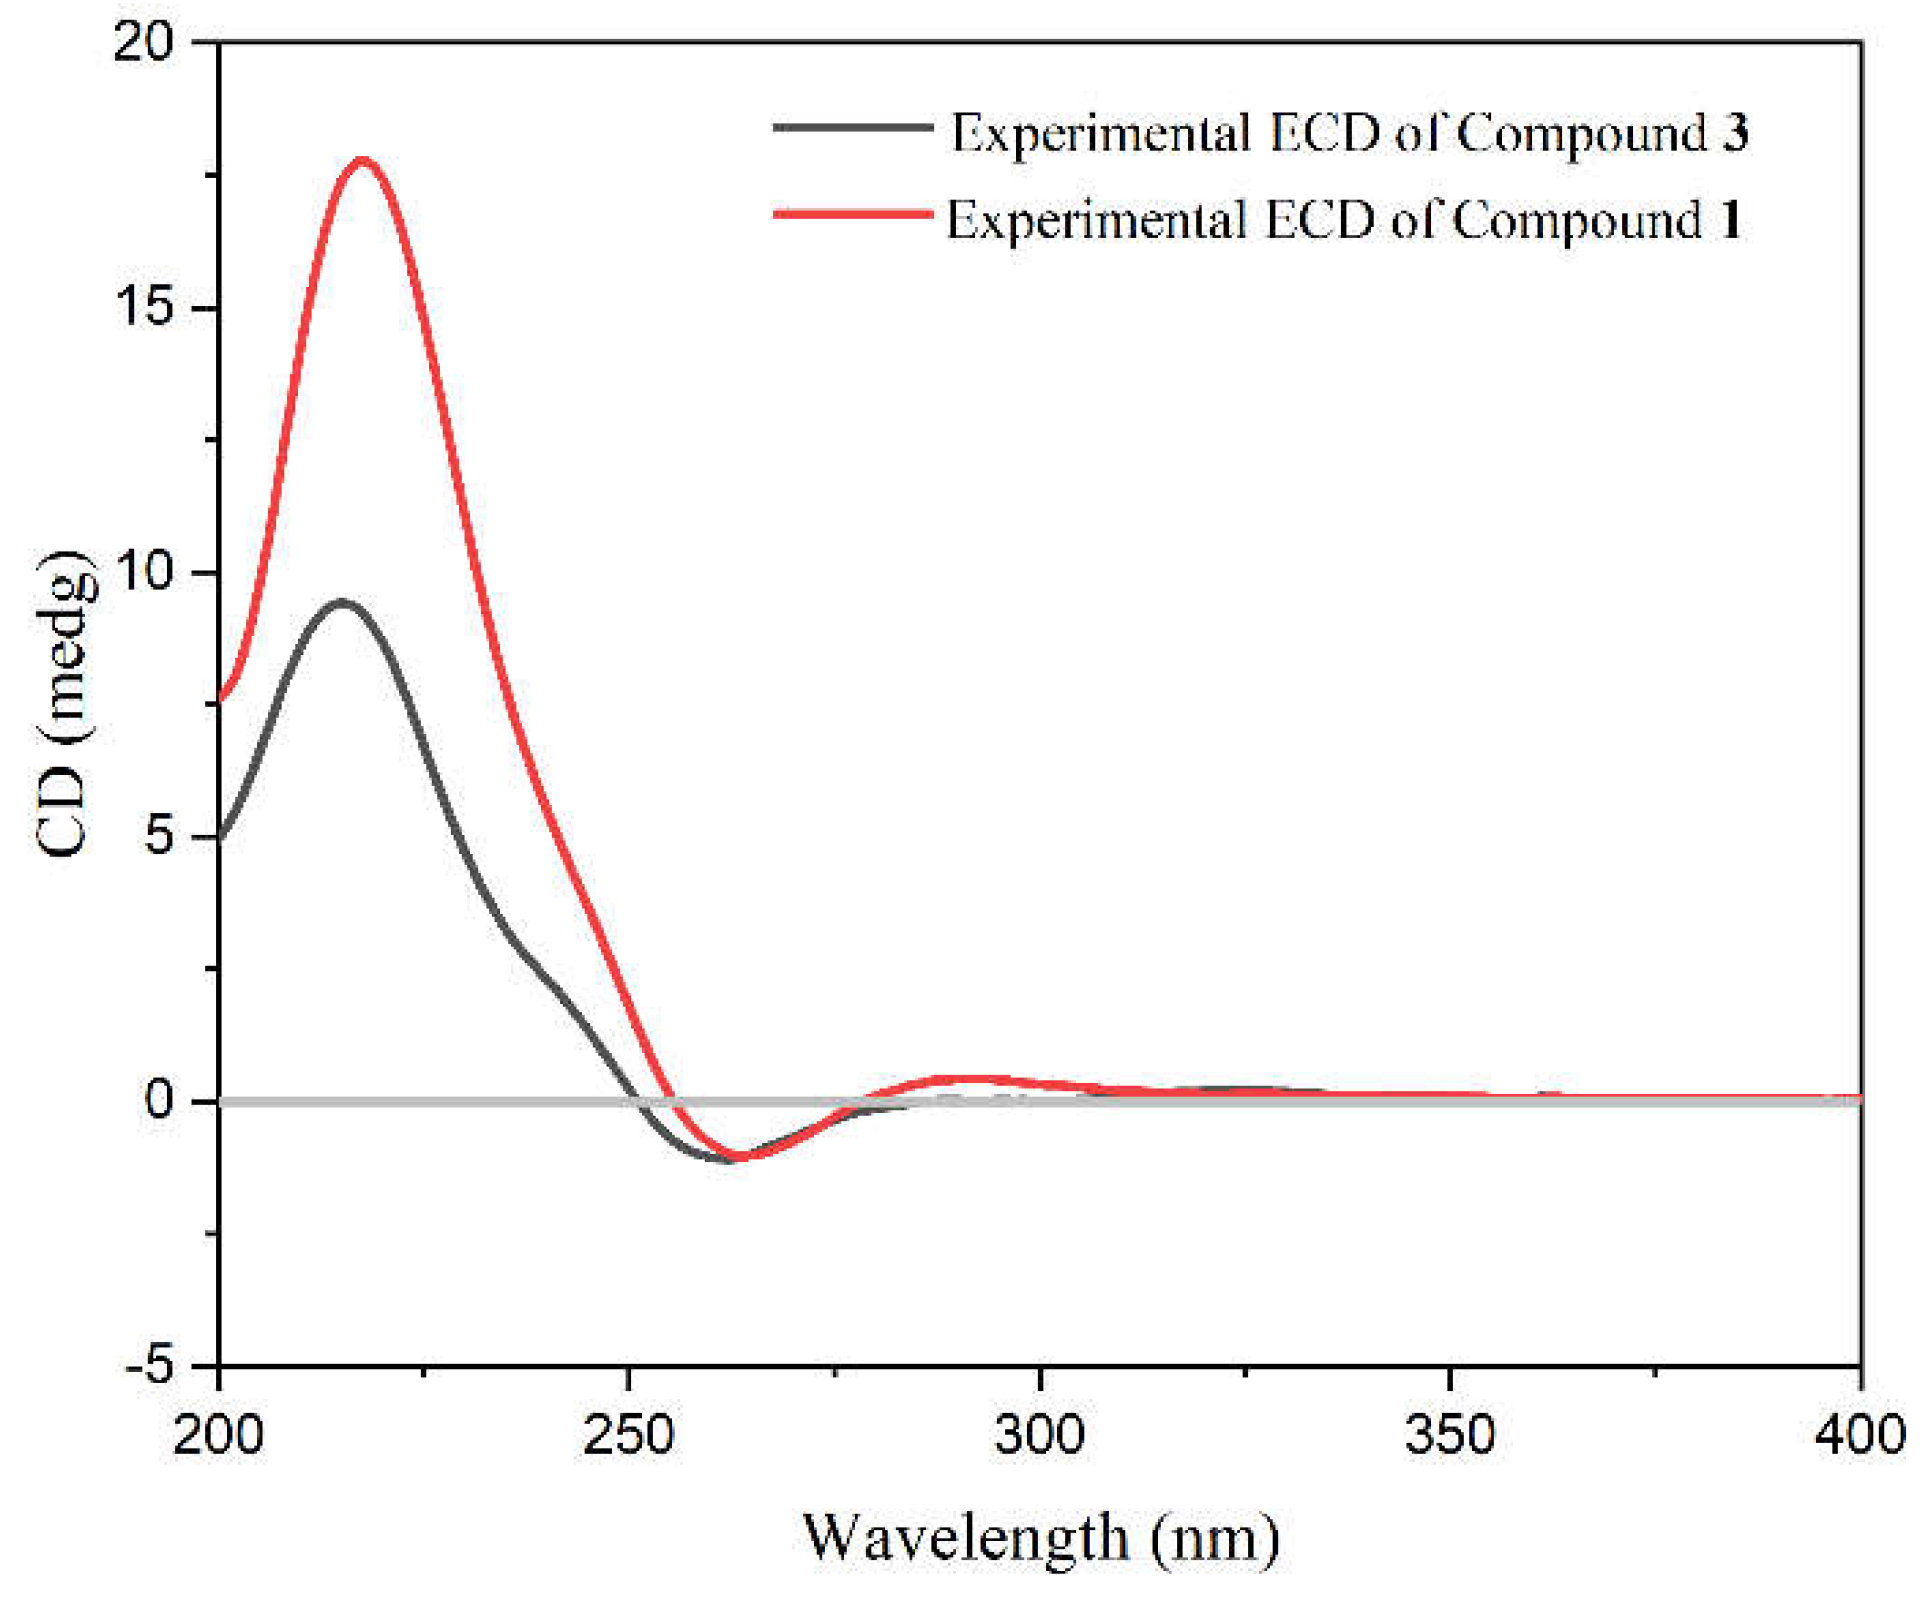
Figure 4.
ORTEP drawing of 1 (the displacement ellipsoids are drawn at the 50% probability level).
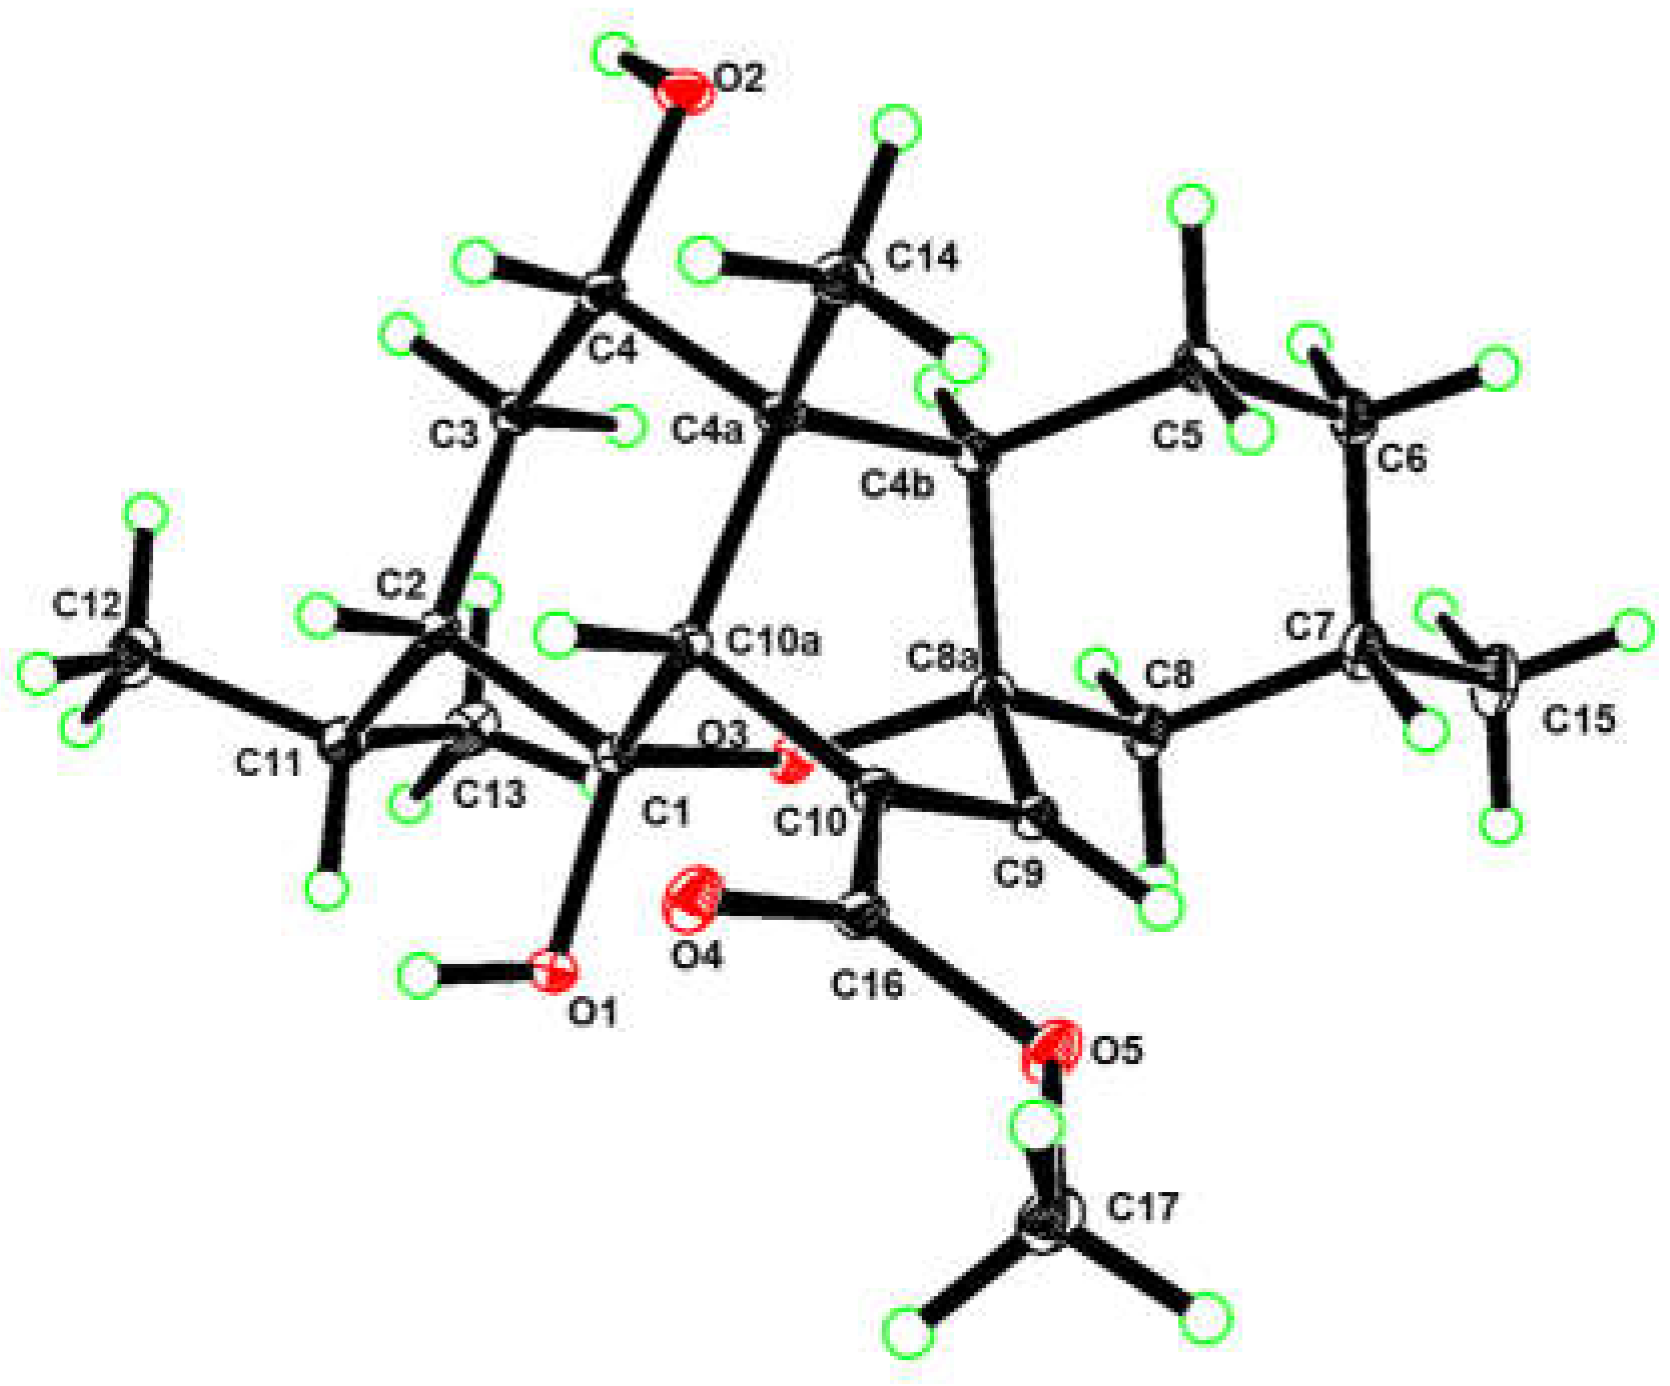
Figure 5.
1H–1H COSY, selected key HMBC and NOESY correlations of 2.
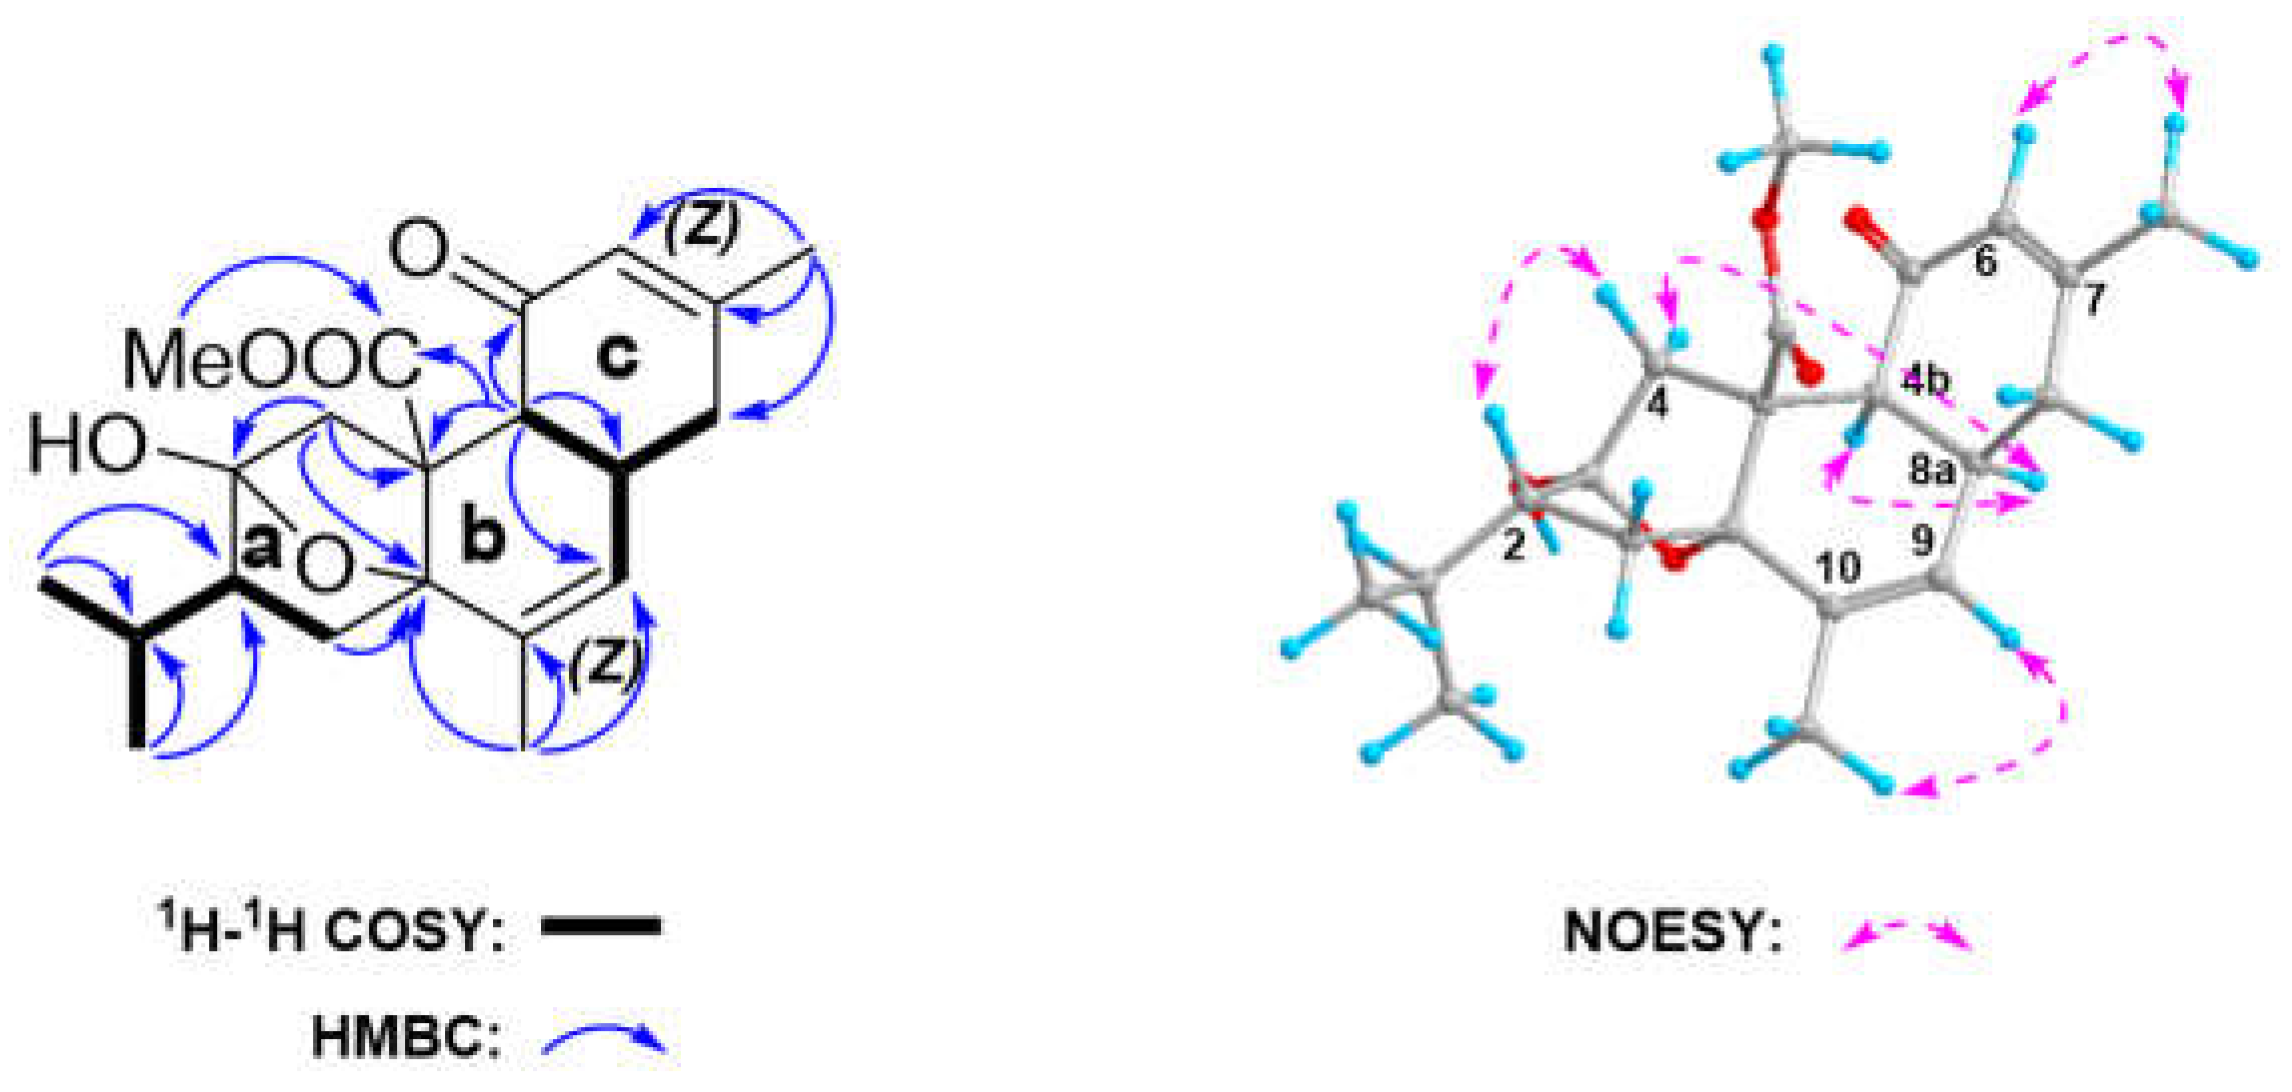
Figure 6.
Regression analysis of experimental vs. calculated 13C NMR chemical shifts of 2a–2d using DP4+ method.
Figure 6.
Regression analysis of experimental vs. calculated 13C NMR chemical shifts of 2a–2d using DP4+ method.
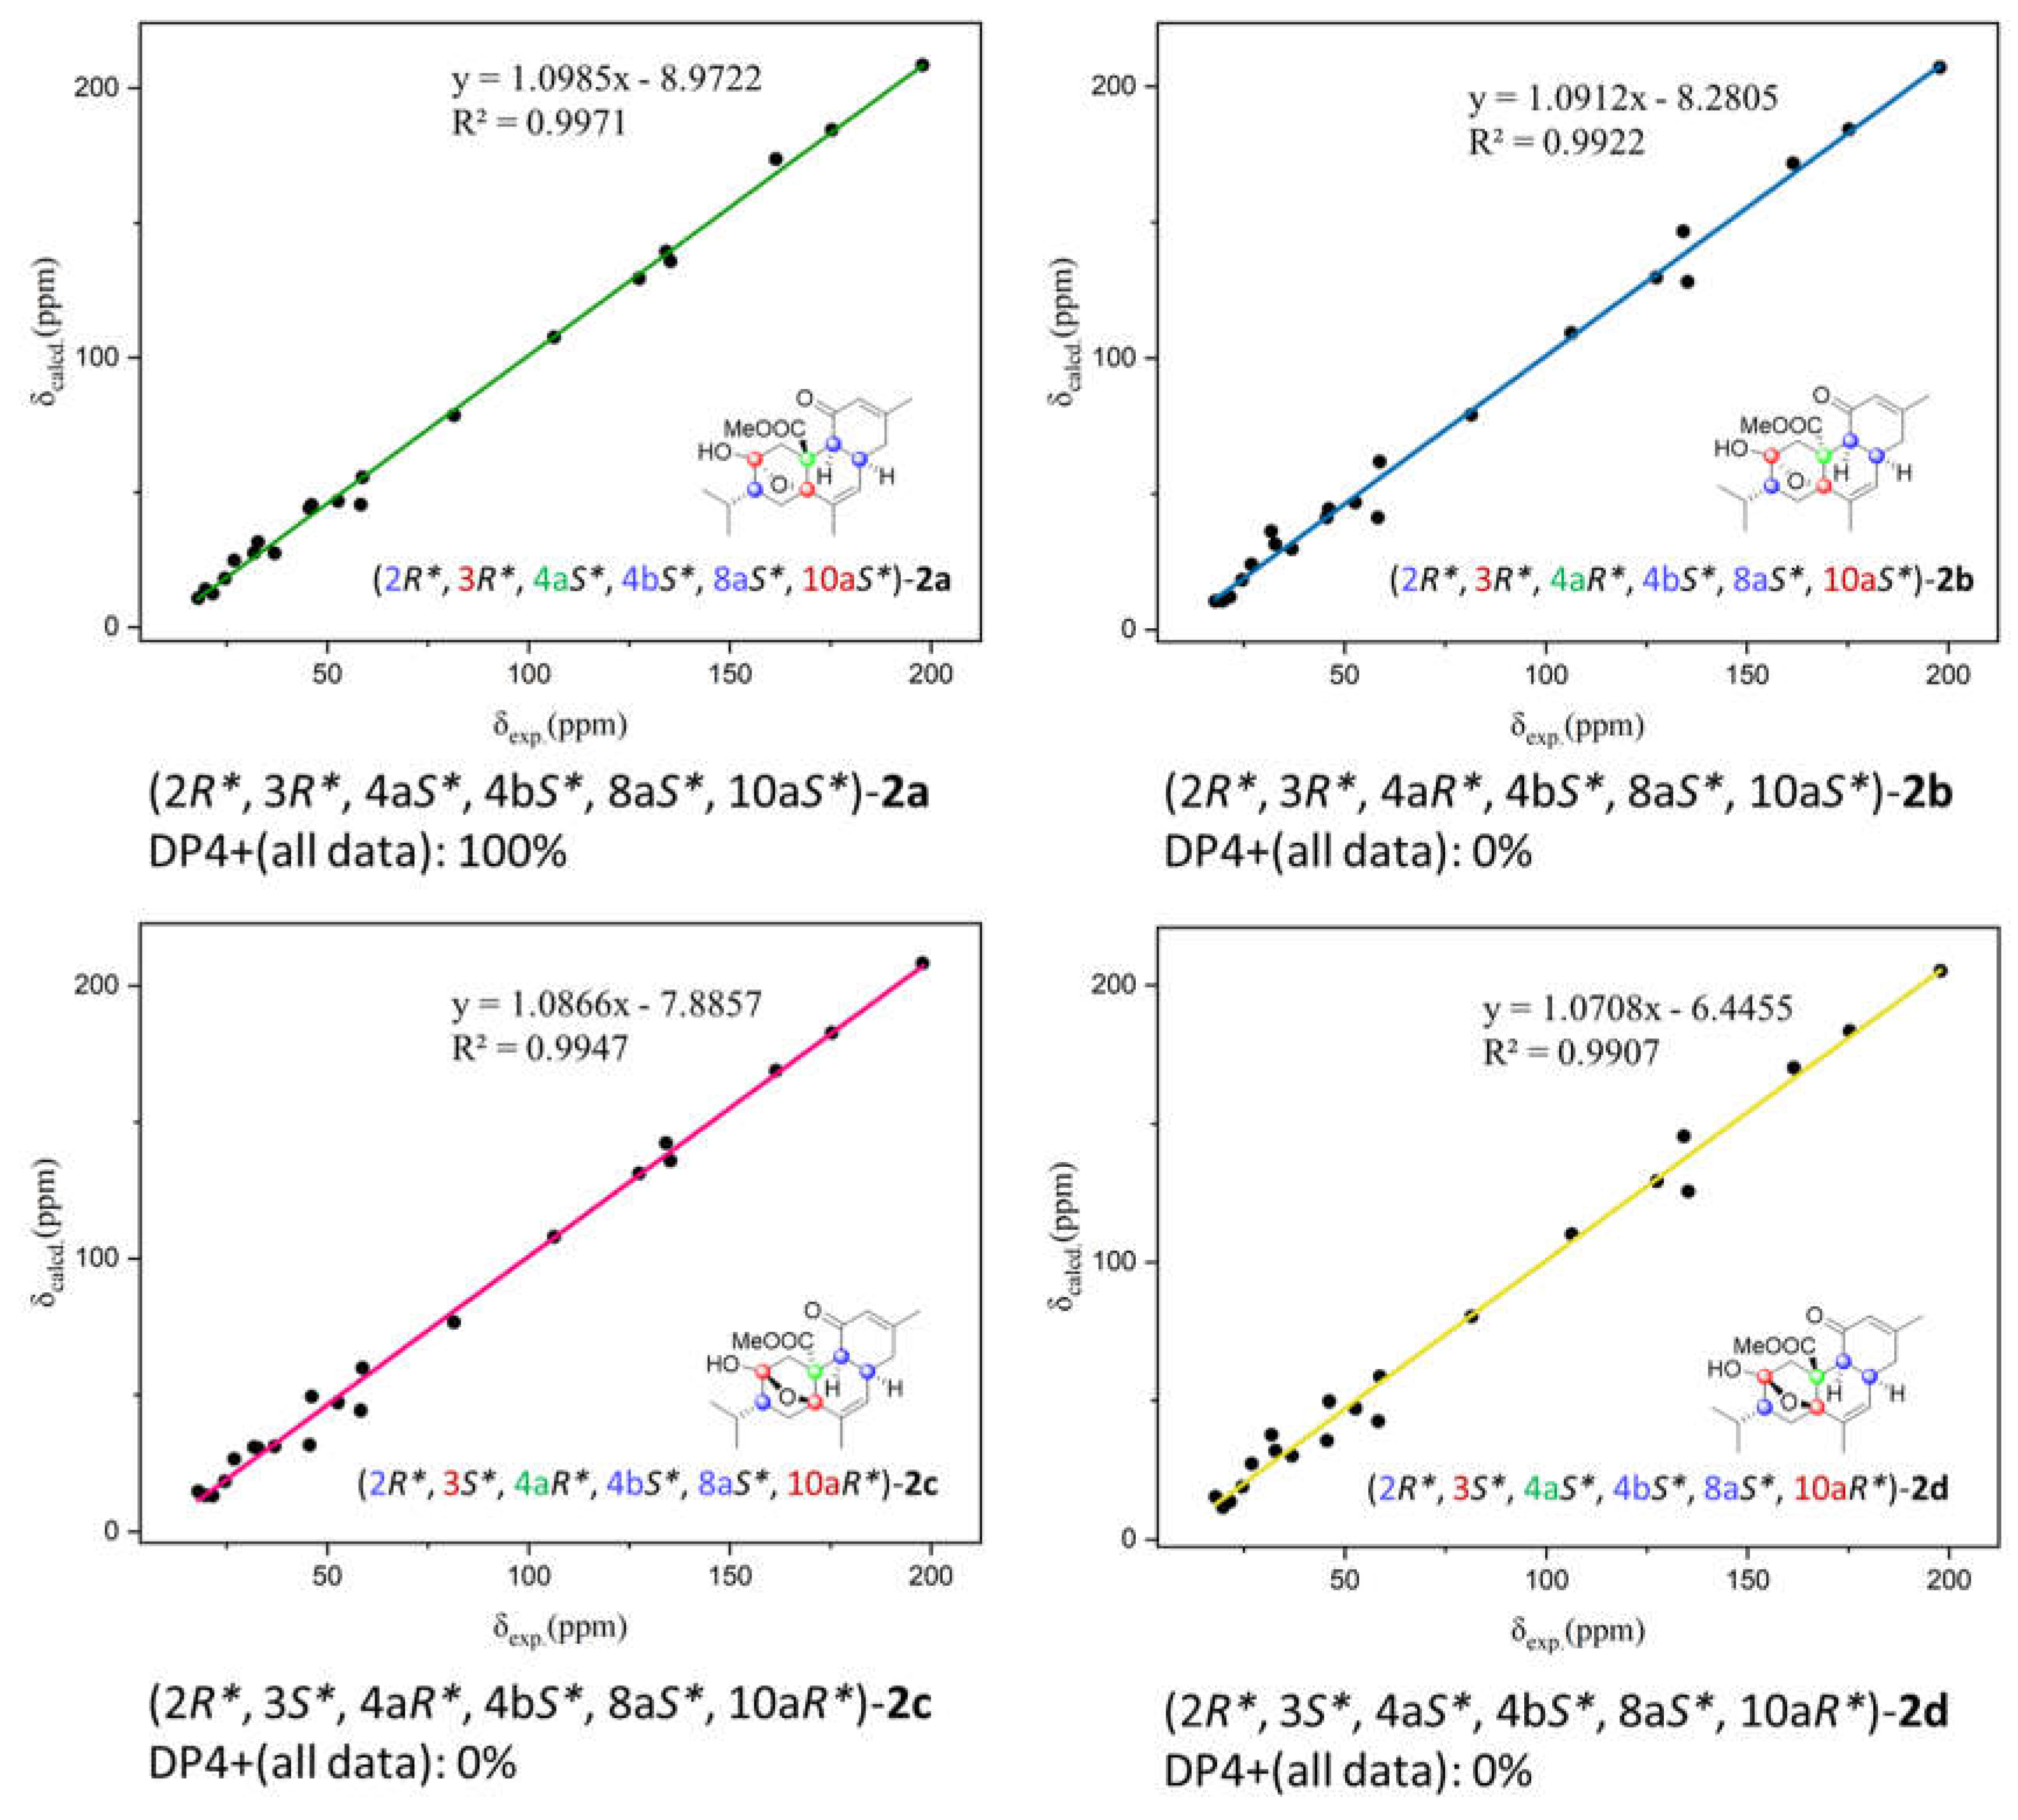
Figure 7.
Experimental spectrum of 2 (black solid line), calculated ECD spectra of (2R, 3R, 4aS, 4bS, 8aS, 10aS)-2 (red dashed line), and (2S, 3S, 4aR, 4bR, 8aR, 10aR)-2 (blue dashed line).
Figure 7.
Experimental spectrum of 2 (black solid line), calculated ECD spectra of (2R, 3R, 4aS, 4bS, 8aS, 10aS)-2 (red dashed line), and (2S, 3S, 4aR, 4bR, 8aR, 10aR)-2 (blue dashed line).
Scheme 1.
Plausible biosynthetic pathways of 1–4 (cembranoid numbering throughout in pathway).
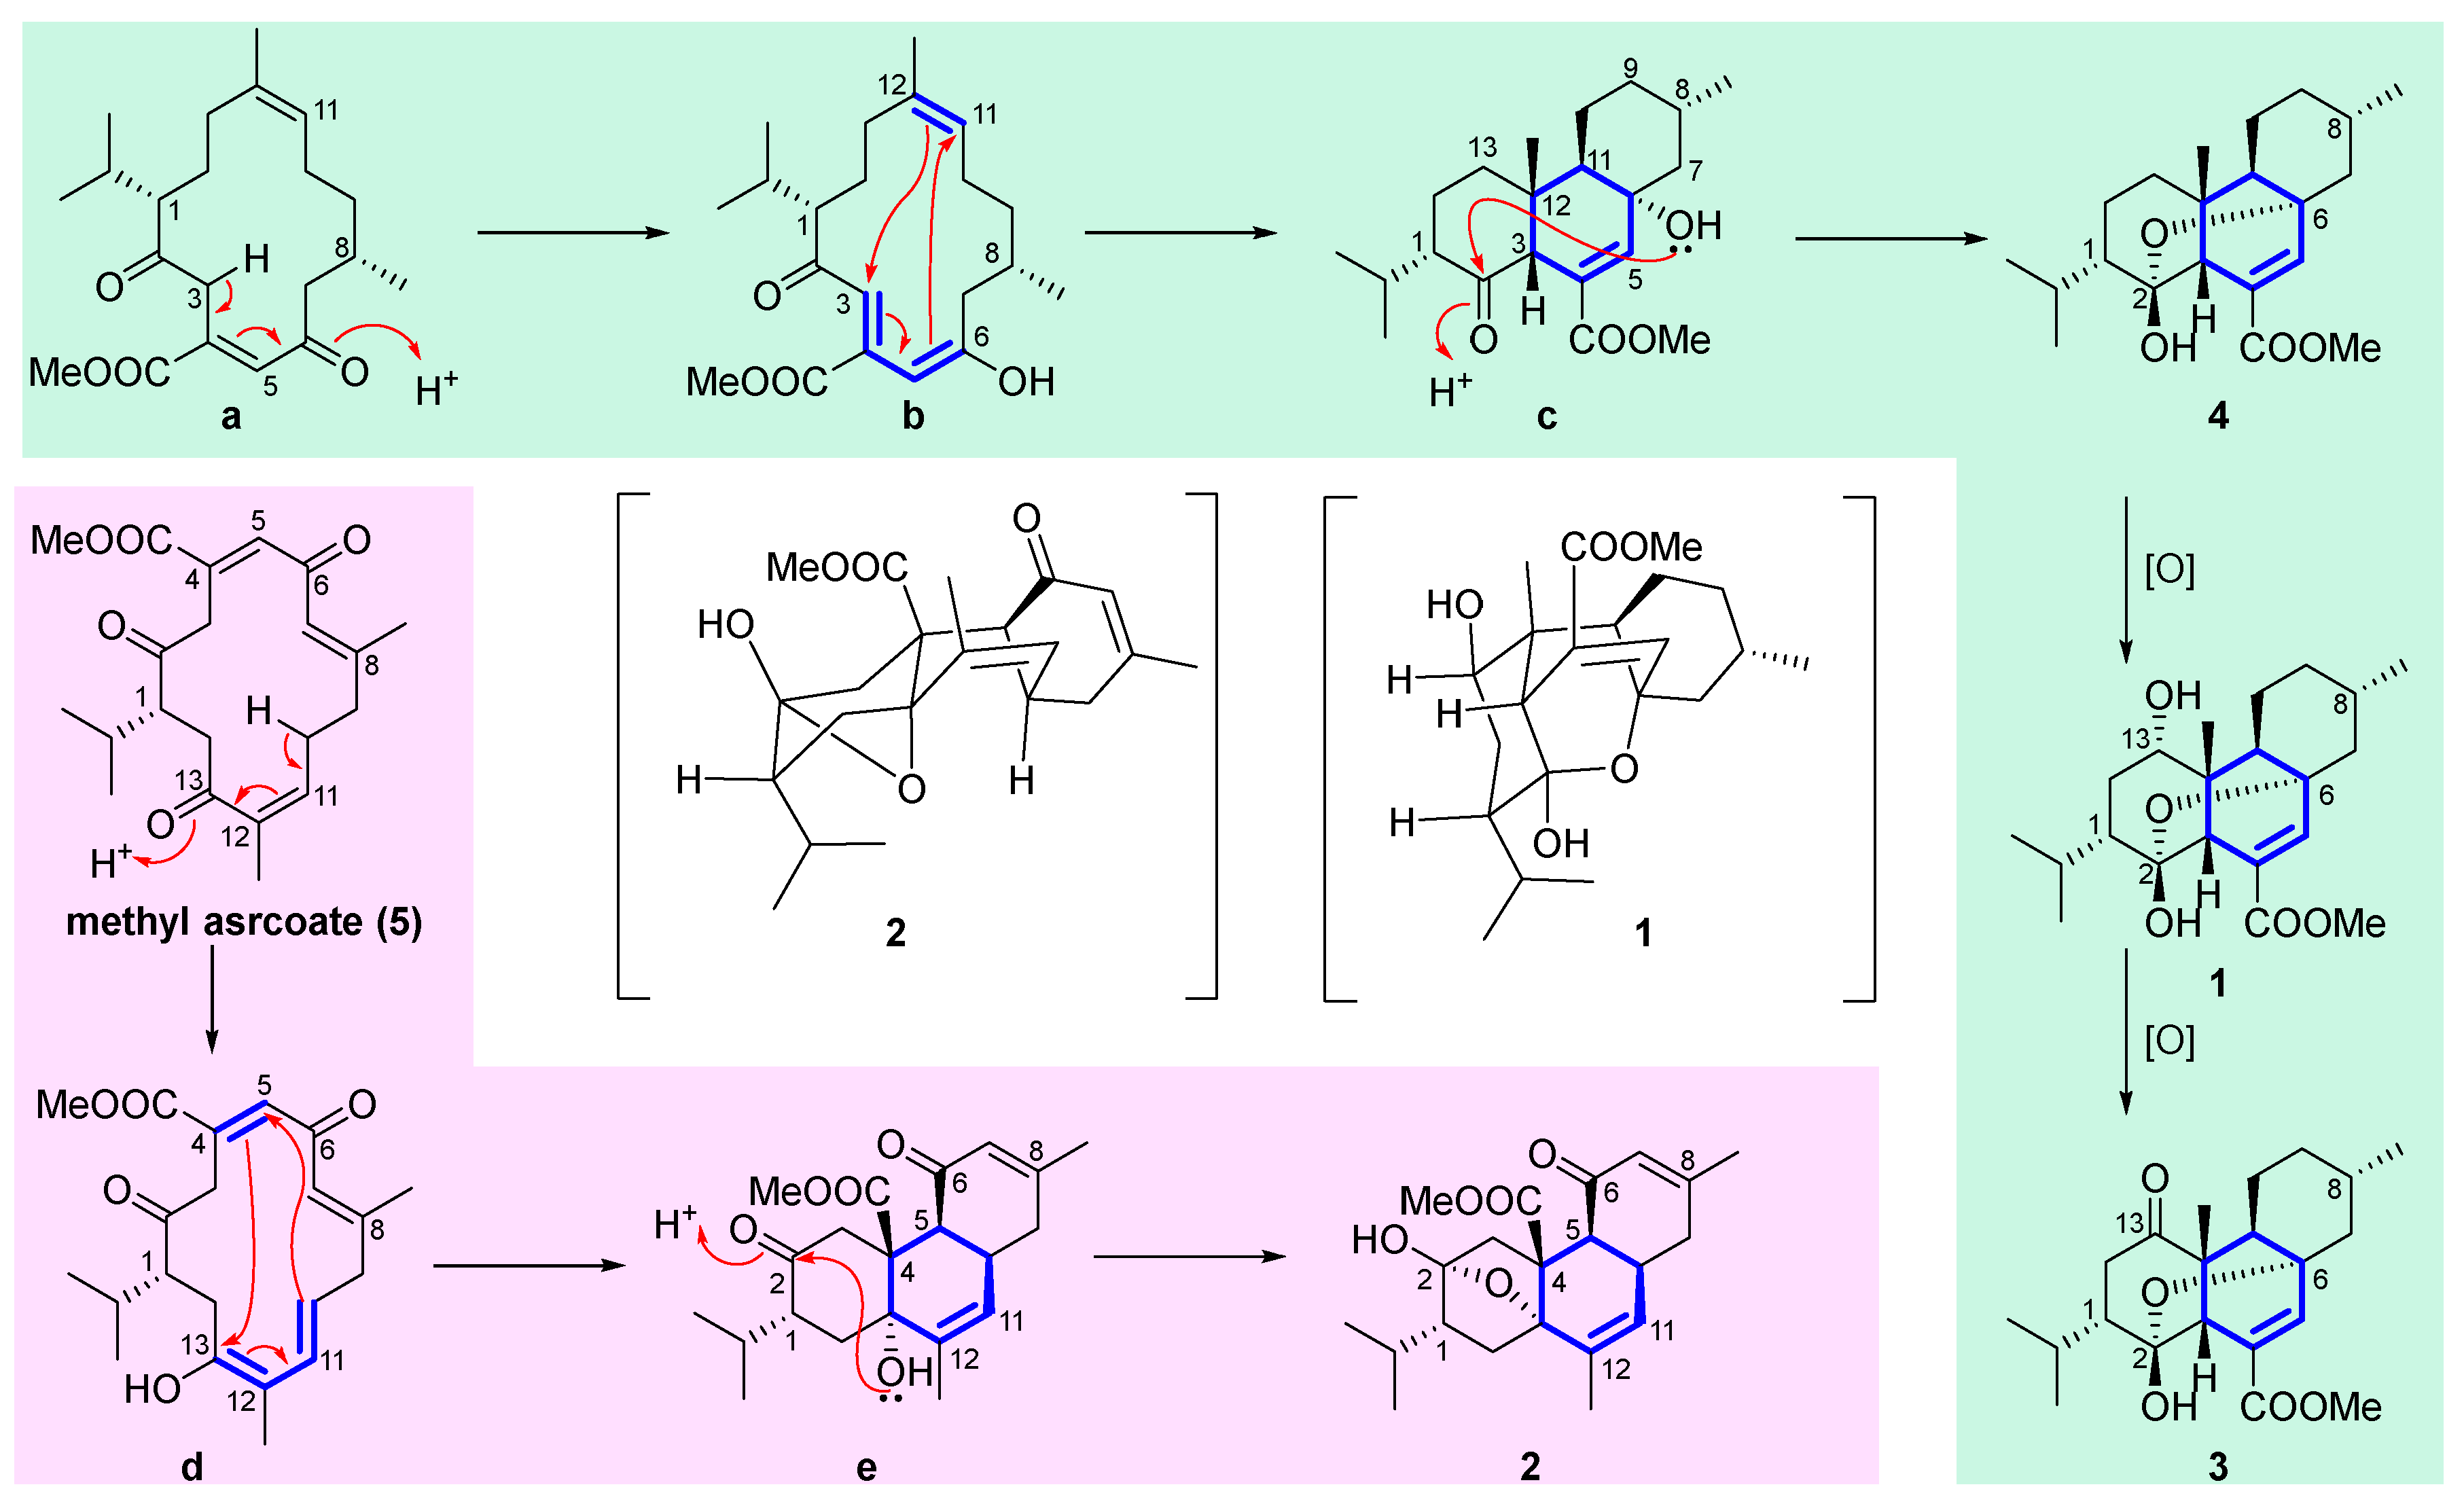
Figure 8.
In vitro PPAR activation by the isolated compounds 1, 3 and 4 in rat liver Ac2F cell line. NC: blank control, transfected with a plasmid containing PPRE and pcDNA; PPARα/β/γ: negative control, transfected with a plasmid containing PPRE and pFlag-PPAR-α, β, or γ, respectively. WY14643, GW501516, and Rosi (rosiglitazone) were used as positive control for PPAR-α, PPAR-β, and PPAR-γ, respectively, to monitor the activation of the luciferase reporter. Luciferase expressions (folds of the control) are presented as mean ± SD (n ¼ 3). *p < 0.05, **p < 0.01, ***p< 0.005, and ****p< 0.001.
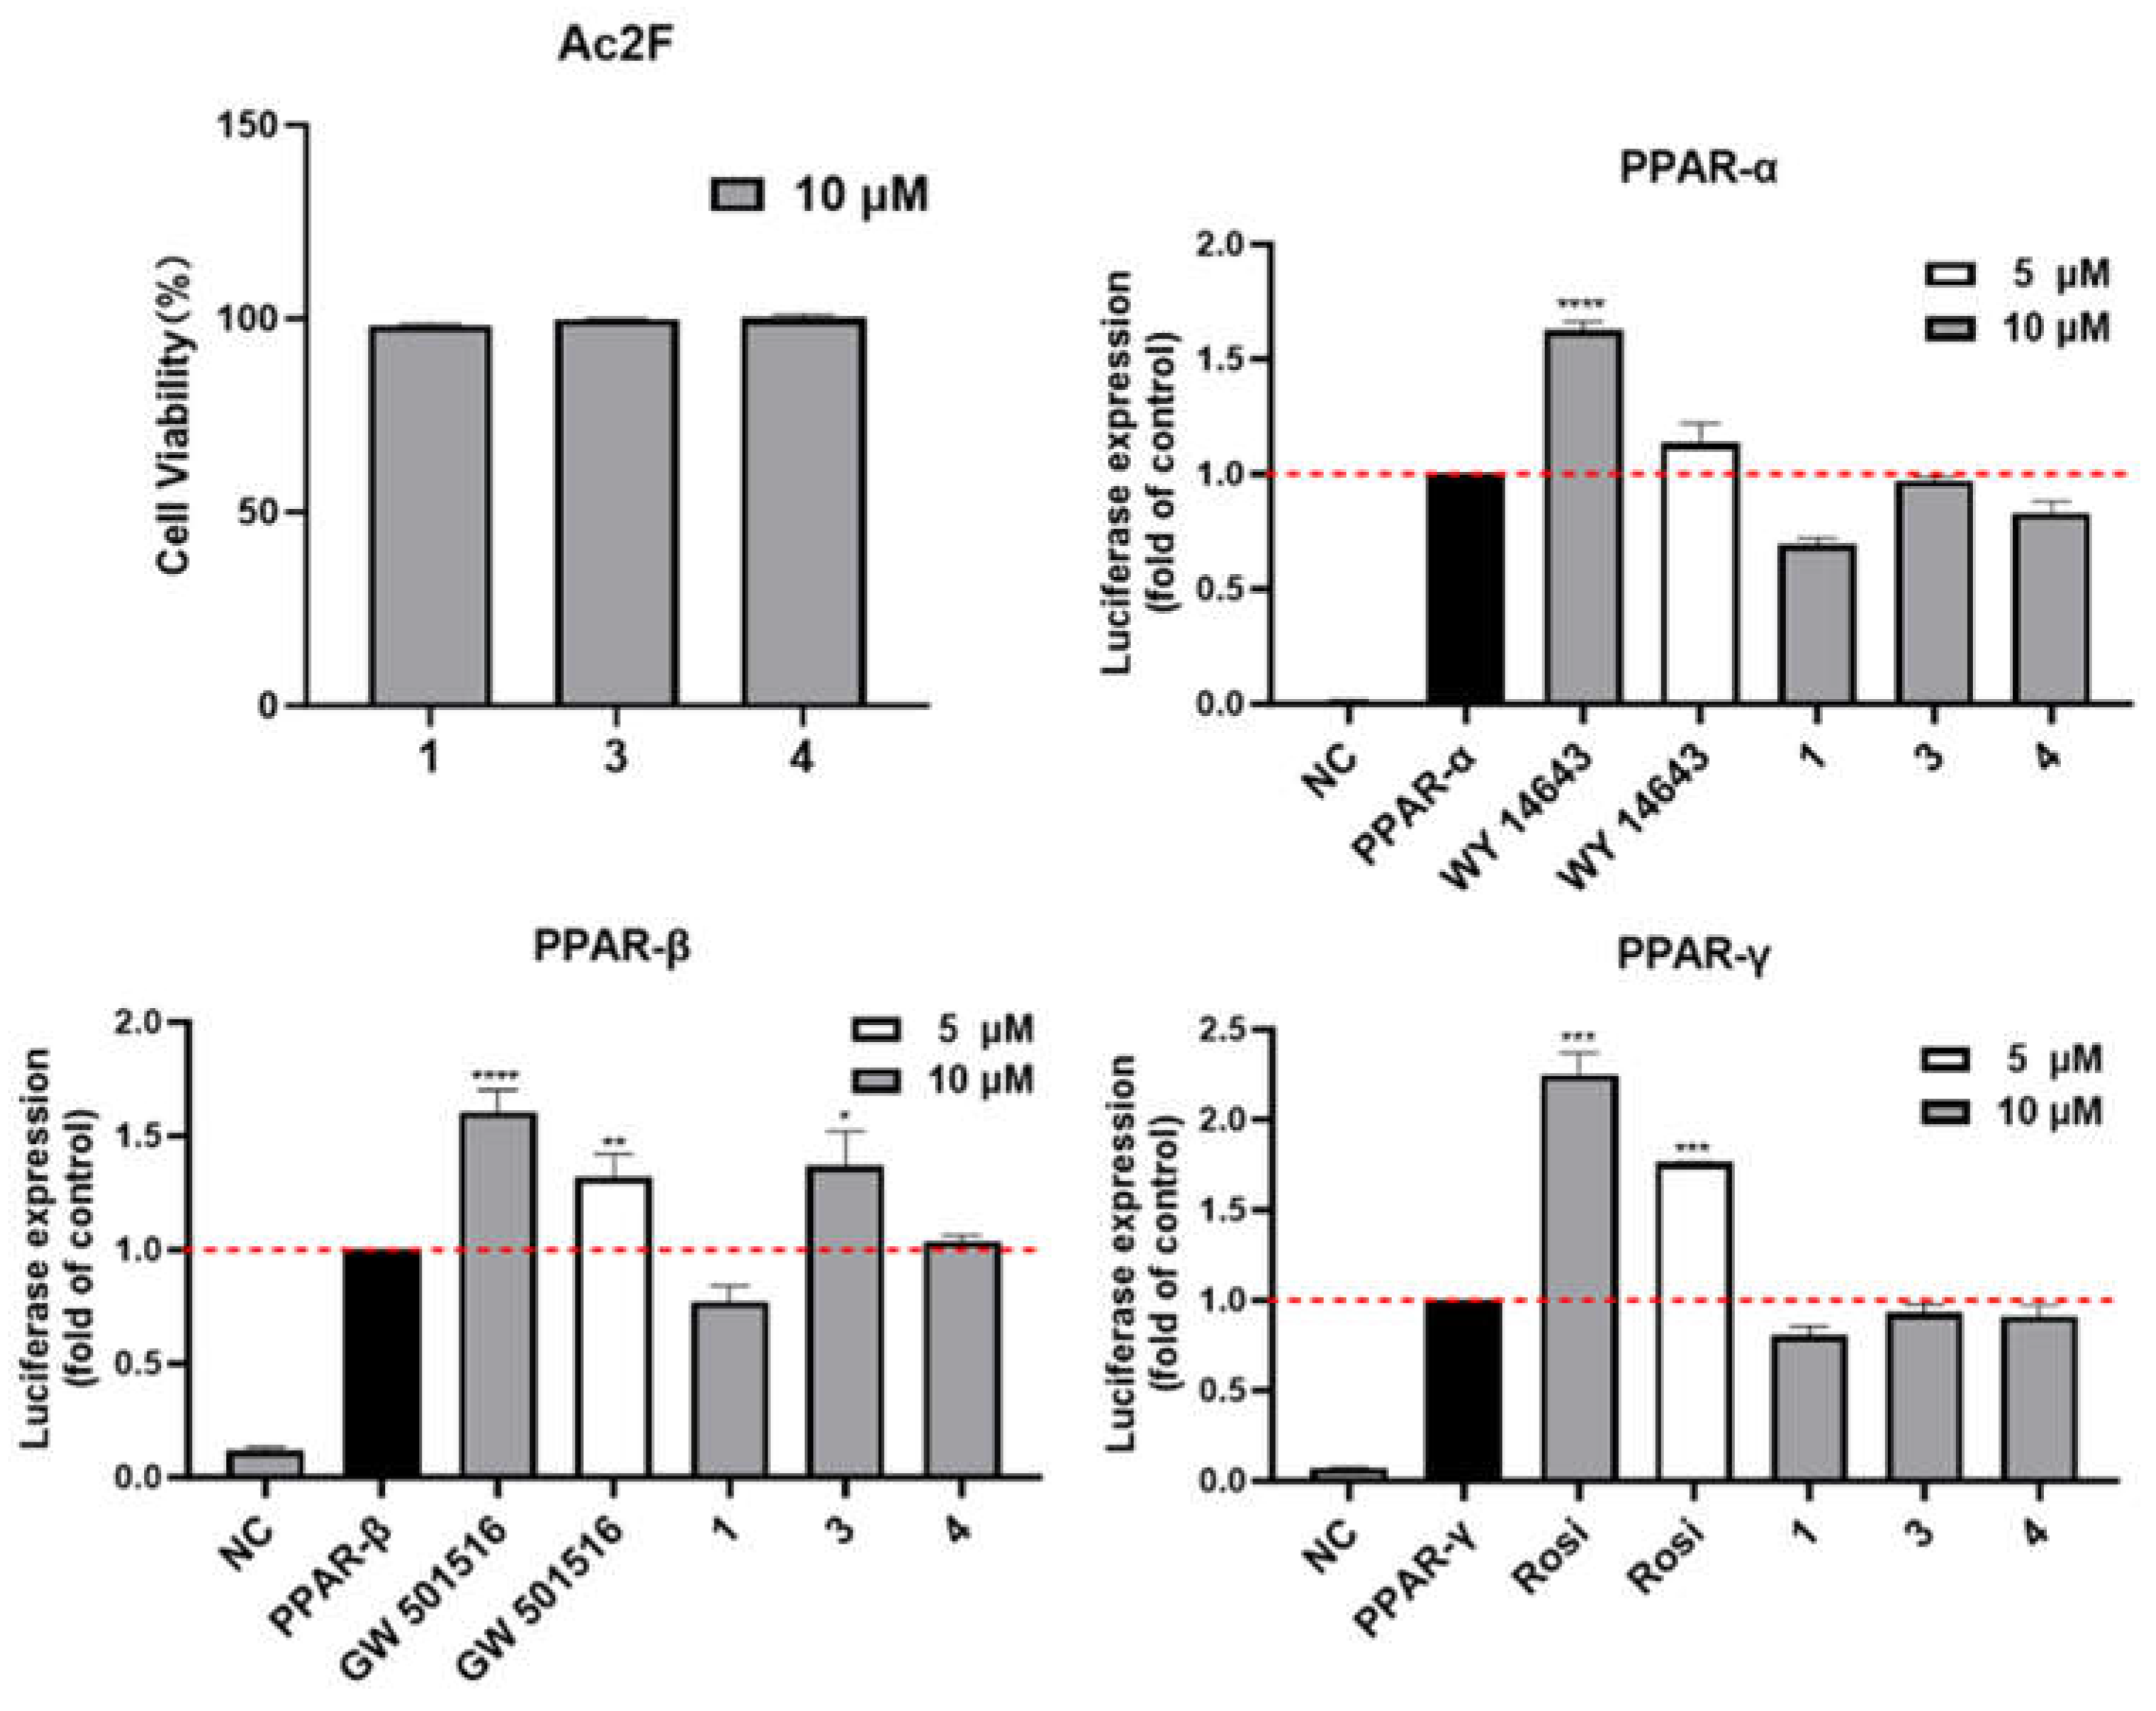
Table 1.
1H (600 MHz) and 13C NMR (150 MHz) data of compounds 1 and 2 in CDCl3.
| No. | 1 | 2 | ||
| δH, mult (J in Hz) | δC, type | δH, mult (J in Hz) | δC, type | |
| 1 | 98.4 qC | 1.82 dd (13.1, 6.5) | 31.8 CH2 | |
| 1.46 dd (13.1, 8.3) | ||||
| 2 | 1.56 ovl | 47.0 CH | 2.18 m | 46.1 CH |
| 3 | 1.59 ovl | 27.6 CH2 | 106.4 qC | |
| 1.73 m | ||||
| 4 | 3.53 m | 77.0 CH | 1.44 d (12.8) | 45.6 CH2 |
| 3.11 d (12.8) | ||||
| 4a | 41.6 qC | 58.7 qC | ||
| 4b | 1.60 ovl | 43.8 CH | 2.91 d (13.0) | 58.3 CH |
| 5 | 1.52 m, 0.70 m | 28.6 CH2 | 197.9 qC | |
| 6 | 0.98 m, 1.66 ovl | 34.6 CH2 | 5.86 s | 127.5 CH |
| 7 | 1.64 ovl | 29.8 CH | 161.5 qC | |
| 8 | 1.25 m | 42.3 CH2 | 2.25 m | 36.9 CH2 |
| 2.05 d (12.7) | 2.51 dd (17.7, 5.0) | |||
| 8a | 76.2 qC | 3.02 m | 32.8 CH | |
| 9 | 7.27 s | 145.1 CH | 5.89 s | 135.3 CH |
| 10 | 134.8 qC | 134.2 qC | ||
| 10a | 2.79 s | 51.0 CH | 81.5 qC | |
| 11 | 2.30 m | 25.4 CH | 1.98 m | 26.9 CH |
| 12 | 0.93 d (7.0) | 18.3 CH3 | 0.88 d (6.7) | 17.9 CH3 |
| 13 | 0.93 d (7.0) | 23.1 CH3 | 0.9 d (6.7) | 21.5 CH3 |
| 14 | 0.85 s | 20.9 CH3 | 175.3 qC | |
| 15 | 1.00 d (6.3) | 22.4 CH3 | 1.96 s | 24.5 CH3 |
| 16 | 165.4 qC | 1.86 s | 19.8 CH3 | |
| 17 | 3.80 s | 52.2 CH3 | 3.71 s | 52.7 CH3 |
Disclaimer/Publisher’s Note: The statements, opinions and data contained in all publications are solely those of the individual author(s) and contributor(s) and not of MDPI and/or the editor(s). MDPI and/or the editor(s) disclaim responsibility for any injury to people or property resulting from any ideas, methods, instructions or products referred to in the content. |
© 2024 by the authors. Licensee MDPI, Basel, Switzerland. This article is an open access article distributed under the terms and conditions of the Creative Commons Attribution (CC BY) license (http://creativecommons.org/licenses/by/4.0/).
Copyright: This open access article is published under a Creative Commons CC BY 4.0 license, which permit the free download, distribution, and reuse, provided that the author and preprint are cited in any reuse.


