
Submitted:
20 November 2024
Posted:
21 November 2024
You are already at the latest version
Abstract
Introduction: In preeclampsia (PE), impaired trophoblast proliferation and differentiation are thought to cause abnormal placentation and subsequent clinical manifestations of the disease—i.e., hypertension, proteinuria, and end-organ damage. Insulin-like growth factor 1 (IGF-1) influences trophoblast cell function, however the mechanisms of IGF-1’s action on trophoblasts is not well understood. Inhibitor of DNA binding protein 2 (ID2) is involved in trophoblast differentiation and implicated in many processes disrupted in PE including placental development, vascular differentiation, and angiogenesis. We hypothesized that IGF-1 regulates trophoblast proliferation and differentiation via ID2.
Methods: Immortalized human first trimester trophoblast cells (HTR-8/SVneo) were treated with IGF-1 for 24 hours after serum starvation. ID2 mRNA and protein were measured, as well as trophoblast cell viability, proliferation, tube formation and migration.
Results: IGF-1 decreased ID2 expression in a dose-dependent manner. IGF-1 decreased trophoblast proliferation but increased cell viability, differentiation, and migration. ID2 overexpression mitigated the effects of IGF-1 on trophoblast cells.
Discussion: These data suggest IGF-1 could regulate trophoblast proliferation and differentiation through ID2. Dysregulation of ID2-mediated IGF-1 signaling in trophoblast cells could be involved in the pathogenesis of pregnancy disorders like uterine growth restriction and PE.
Keywords:
ID2
; preeclampsia
; IGF-1
; HTR8/SVneo cell
; placenta
Introduction
Appropriate proliferation and differentiation of trophoblast cells is pivotal for implantation and subsequent placentation in healthy pregnancy [1]. Impaired trophoblast functions are involved in many common complications of pregnancy including preeclampsia (PE) and uterine growth restriction [2]. Various molecules have been shown to influence trophoblast biology, and accumulating evidence suggests that inhibitor of DNA binding protein 2 (ID2)—a marker of stemness—is involved in trophoblast stem cell proliferation and differentiation [3]. ID2 is a member of the inhibitor of differentiation (ID) protein family which is characterized by its similar structure to the basic helix-loop-helix (bHLH) family of transcription factors [4]. Unlike the bHLH family, ID proteins like ID2 lack a basic DNA-binding domain, but they can still heterodimerize with bHLH transcription factors [4]. ID2 heterodimerization with bHLH inhibits differentiation as bHLH can no longer bind DNA to drive transcription of gene targets [5]. Sustained high expression of ID2 inhibits trophoblast cell differentiation. Gultice et al. reported that the rat trophoblast cell line Rcho-1, which represents an isolated trophoblast population committed to the giant cell lineage (equivalent to human extravillous trophoblast cells), had impaired differentiation under hypoxic conditions [6]. This impaired differentiation was attributed to hypoxia inhibiting the downregulation of ID2 [6]. In addition, Selesniemi et al. reported that ID2 overexpression prevents differentiation while ID2 knockdown promotes differentiation in the mouse labyrinthine placental progenitor cell line SM10 [3].
Insulin-like growth factor 1 (IGF-1)—a single-chain basic polypeptide growth factor containing 70 amino acid residues—plays an important role in regulating cell proliferation, differentiation and survival [7,8]. IGF-1 is also involved in pregnancy complications including uterine growth restriction, gestational diabetes mellitus and PE, but the precise role of IGF-1 in pregnancy is not clear [9,10,11]. Recently, Lai et al. showed that IGF-1 enhanced proliferation and invasion of trophoblast cells [12]. Furthermore, placental-specific knockdown of IGF-1 by lentivirus caused PE-like phenotypes in mice [12]. Their results suggest IGF-1 is essential for trophoblast function and its deficiency could result in PE or other pregnancy complications. The effect of IGF-1 on ID2 in trophoblast cells is not clear, though it has been tested before in other cell types: in 32D murine hemopoietic cells, IGF-1 signaling increased ID2, which correlated with inhibited cell differentiation [13]. HTR8/SVneo (HTR8) is a well-established human first trimester extravillous trophoblast cell line that displays progenitor cell characteristics, i.e., self-renewal and ID2 expression [14,15,16]. In this study, we tested whether IGF-1 executes its function on trophoblast cells through ID2.
Methods
Cell culture: The HTR8 trophoblast cell line was kindly provided by Dr. C.H. Graham, Queen’s University, Kingston, Ontario, Canada [14], and maintained in RPMI-1640 medium supplemented with 5% fetal bovine serum (FBS) [17]. Cells were starved for 24 hours in 0% FBS media, then treated with IGF-1 (GF306, EMD Millipore Corp., Burlington, MA) in 0% FBS media at doses of 0, 10, 100, and 1000 ng/mL for 24 hours. At the end of the treatment, cells were collected for western blot and quantitative RT-PCR (qRT-PCR) analysis.
Cell viability assay: 104 HTR8 cells were seeded in each well of a 96-well plate (35307, Falcon, Corning, NY) in 100 µL of 5% FBS media and allowed to attach overnight. Once cells had reached greater than 90% confluence, they were starved with 0% FBS for 24 hours. Media in each well was discarded then replaced with 100 µL of 0% FBS media with the different concentrations of IGF-1. After 24 hours treatment, CCK-8 solution (96992, Sigma-Aldrich, St. Louis, MO) was added to each well (final 1/10 dilution) and incubated for 1h as described previously [18,19]. The absorbance was measured at 450 nm using a BioTek Synergy HT microplate reader. [20,21].
Cell proliferation assay: Endogenous ID2 expression: 104 HTR8 cells were seeded in each well of a 96-well plate (35307, Falcon, Corning, NY) with 100 µL of 5% FBS media and allowed to attach overnight. Once cells had reached greater than 90% confluence, they were starved with 0% FBS for 24 hours. Media in each well was discarded then replaced with 100 µL of 0% FBS media with the different concentrations of IGF-1. After 24 hours treatment, the Click-iT 5-ethynyl-2’deoxyuridine (EdU) proliferation assay for microplates (C10499, ThermoFisher Scientific, Waltham, MA) was conducted following manufacturer’s instruction and fluorescence was measured using a BioTek Synergy HT microplate reader. Transfection: 2x10⁴ HTR8 cells were seeded in 24-well plates (353047, Falcon, Corning, NY) with 0.5 mL of 5% FBS media and allowed to attach overnight. Each well was transfected with 0.125 µg of either control (PS100092, OriGene Technologies, Inc., Rockville, MD) or ID2 (SC118791, OriGene Technologies, Inc., Rockville, MD) plasmid and lipofectamine LTX with Plus reagents (A12621, ThermoFisher Scientific, Waltham, MA) following manufacturer’s instruction. 24 hours after transfection, media was changed back to growing media (5% FBS) for 24 hours. 48 hours after transfection, cells from each plasmid group were trypsinized and replated on a 96-well plate with 5µM EdU (C10499, ThermoFisher Scientific, Waltham, MA) and the three doses of IGF-1 in 0% FBS media. 72 hours after transfection, the Click-iT EdU proliferation assay for microplates (C10499, ThermoFisher Scientific, Waltham, MA) was conducted following manufacturer’s instruction and fluorescence was measured using a BioTek Synergy HT microplate reader.
Tube formation assay: Endogenous ID2 expression: HTR8 cells were grown in a 24-well plate (353047, Falcon, Corning, NY) with 5% FBS media until they were greater than 90% confluent. Then they were serum starved in 0% FBS media for 24 hours. Afterwards cells were treated with the three different concentrations of IGF-1 for 24 hours. Tube formation was visualized with a Nikon TMS inverted microscope and images were captured using Nikon Digital Sight 1000 camera. ImageJ was used to measure tube diameter. Transfection: 2x10⁴ HTR8 cells were seeded in 24-well plates (353047, Falcon, Corning, NY) in 0.5 mL of 5% FBS media and allowed to attach overnight. Each well was transfected with 0.125 µg of either control (C) or ID2 plasmid as described above. 24 hours after transfection, media was changed back to growing media (5% FBS) for 24 hours. 48 hours after transfection, cells from each plasmid group were treated with the different concentrations of IGF-1 in 0% FBS media. 72 hours after transfection, tube formation was visualized with a Nikon TMS inverted microscope and images were captured using Nikon Digital Sight 1000 camera. ImageJ was used to measure tube diameter.
Wound healing assay: Endogenous ID2 expression: HTR8 cells were grown in a 24-well plate (353047, Falcon, Corning, NY) with 5% FBS media until they were greater than 90% confluent. Then they were serum starved in 0% FBS media for 24 hours. Afterwards cells were scratched along the midline of the well with a 200 µL yellow pipette tip (4845, Universal Fit Pipet Tips, Corning, NY) and rinsed with PBS [19]. Scratched wells were treated with the three different concentrations of IGF-1 in 0% FBS media for 24 hours. Cell migration into the wound was visualized with a Nikon TMS inverted microscope and images were captured using Nikon Digital Sight 1000 camera. Transfection: 2x10⁴ HTR8 cells were seeded in 24-well plates (353047, Falcon, Corning, NY) in 0.5 mL of 5% FBS media and allowed to attach overnight. Each well was transfected with 0.5 µg of either C or ID2 plasmid as described above. 24 hours after transfection, media was changed back to growing media (5% FBS) for 24 hours. 48 hours after transfection, cells were scratched along the midline of the well with a 200 µL yellow pipette tip and rinsed with PBS [19]. Scratched wells were treated with the three different concentrations of IGF-1 in 0% FBS media. 72 hours after transfection, cell migration into the wound was visualized with a Nikon TMS inverted microscope and images were captured using Nikon Digital Sight 1000 camera.
Mice: Female/male wild type (WT) C57BL/6J mice were housed in standard cages on a 12h light/dark cycle, and were allowed free access to food and water. All experiments were carried out in accordance with the National Institutes of Health guideline for use and care of experimental animals, as approved by the IACUC of the University of North Carolina at Chapel Hill.
Two Females were housed with one male mouse together around 4-5:00pm, and the virginal plug were checked at the next morning around 8:00 am. The day vaginal plug was detected was defined as 0.5 day post coitus (dpc), and females mice were randomly enrolled into either control (vehicle, PBS) or IGF1 treatment groups. IGF1-treated mice were administered IGF1 at dose of 20 µg/Kg/day intraperitoneal injection (the volume was injected was 100 µl).
50 µg of IGF1(R&D system, 791-MG-050) was dissolved in 1mL PBS (pH=7.4) as stock solution. Immediately before injection, the stock solution was diluted 10x to make the working solution.
At 12.5 dpc (when the placenta is fully formed), uterines were collected and placentas were carefully isolated and were snap frozen or fixed in 4% paraformaldehyde. SNAP- Frozen placentas were subjected for qRT-PCR assay while fixed tissues were for immunofluorescence.
Immunofluorescence: Placenta samples were paraffin-embedded, cut into 5-μm sections, and mounted on slides. After deparaffinization, placenta issue sections were treated with 10 mM citrate buffer (pH 6.0) for antigen retrieval. After blocking with 10% normal chicken serum and 0.1% BSA at room temperature for one hour, the sections were incubated with rabbit monoclonal anti-Keratin 17 (1:200; Cat#12509, Cell Signaling Technology Inc, USA) and mouse monoclonal anti-ID2 (A4-D4) (1:200; Invitrogen, Cat# MA5-32891, Rockford, IL, USA) at 4°C overnight. After 3 washes with PBS, the sections were then incubated with Alexa Fluor 488-conjugated goat anti-rabbit IgG (1:500; Invitrogen, Carlsbad, CA, United States) or Alexa Fluor 596-conjugated goat anti-mouse IgG (1:500; Invitrogen, Carlsbad, CA, United States) at RT for 2 hours. After washing with PBS, slides were prepared and mounted using DAPI Fluoromount G (Southern Biotech, Cat#. 0100-20) to detect nuclei. Images were captured on an Olympus fluorescent microscope (Japan) using a 10X/0.4 or 20x or 40xPH objective at 1.0-fold magnification.
Western Blot: Lysis buffer—0.1% Triton X-100 (X198-07, Avantor Performance Materials, Center Valley, PA) in PBS—was added to cells for 30 minutes. Cells were scraped from culture plates and centrifuged to separate debris. Protein concentration in cell lysate was determined by Pierce BCA Protein Assay kit (23225, ThermoFisher Scientific, Waltham, MA). Total protein of 20 to 60 µg/lane was subjected to 4%–20% SDS-PAGE, then electrotransferred onto PVDF membranes. The chemiluminescent intensities of the targeted protein bands were captured using the ODYSSEY® FC system and evaluated using Image Studio Software (LI-COR Biosciences, Lincoln, NE). Individual protein level was quantified by normalizing its intensity to the β-actin in the same sample and expressed relative to the levels of the respective C group, the mean of which was set as one. The antibodies used in the study include: ID2 (MA5-32891, Invitrogen, Waltham, MA) and β-actin (5125, Cell Signaling Technology, Danvers, MA).
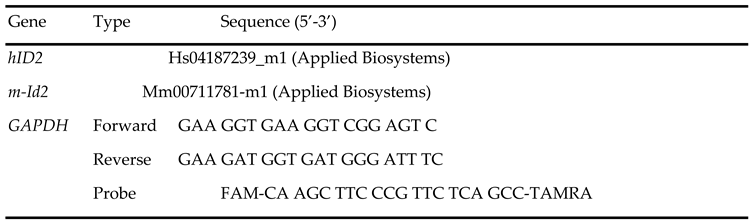
qRT-PCR: Total RNA from cells was extracted using TRIzol Reagent (15596018, Invitrogen, Waltham, MA) following the manufacturer's instruction. BioTek Synergy HT microplate reader was used to determine RNA concentration. mRNA was quantified with TaqMan real-time qRT-PCR (7500 real time PCR system, Applied Biosystems, Foster City, CA) by using one-step RT-PCR Kit (Bio Rad, Hercules, CA) with GAPDH as reference genes in each reaction. 2–ΔΔCt method was used for comparing the data [17,20,22]. Primer and probe sequences listed in Table 1.
Statistical analysis: Data are presented as mean ± standard error of the mean. Multifactorial analysis of variance test was used with the program JMP 17.0 (SAS Institute Inc. Cary, NC). Post hoc analyses were done using the Tukey–Kramer Honest Significant Difference test.
Results
IGF-1 decreases ID2 expression in trophoblasts in a dose-dependent manner
We investigated the effects of IGF-1 on ID2 using serial doses spanning from physiological (10 ng/mL) to supraphysiological (100 and 1000 ng/mL) levels [23,24]. After 24 hours, IGF-1 treatment at doses of 10, 100 and 1000 ng/mL decreased mRNA levels of ID2 approximately 13% 56% and 63% respectively, while there was no significant difference between the cells treated with IGF-1 at a dose of 100 ng/mL or 1000 ng/mL (Figure 1A). Consistent with mRNA data, increasing IGF-1 decreased protein levels of ID2 in a dose-dependent manner in HTR8 cells (Figure 1B, 1C).
IGF-1 inhibits the proliferation of trophoblasts which is rescued by ID2 overexpression
Because Lai et al. reported that silencing IGF-1 inhibits the proliferation of HTR8 cells using a cell viability assay [12], we first tested the effects of IGF-1 on cell viability. We found IGF-1 did not have a cytotoxic effect on HTR8 cells at any of the three doses: cell viability was not decreased but increased by IGF-1 treatment for 24 hours (Figure 2A). Afterwards we tested the direct effect of IGF-1 on the proliferation of HTR8 cells using a Click-iT EdU proliferation assay which detects newly synthesized DNA. We found that increasing IGF-1 inhibited the proliferation of HTR8 cells in a dose-dependent manner. After 24 hours, the proliferation of HTR8 cells treated with 10, 100 and 1000 ng/mL of IGF-1 was approximately 87%, 74%, and 70% of non-treated cells (Figure 2B).
Then, we investigated the role of ID2 in the anti-proliferative effects of IGF-1 on HTR8 cells. First, we transfected cells with C and ID2 plasmid, and ID2 plasmid increased ID2 protein levels more than 20x compared to C plasmid (Supplementary Figure 1). The proliferation of IGF-1-treated HTR8 cells transfected with ID2 plasmid significantly increased at 100 and 1000 ng/mL compared to IGF-1-treated HTR8 cells transfected with C plasmid (Figure 2C). The significant difference in proliferation between HTR8 cells transfected with C and ID2 plasmid in the absence of IGF-1 could be attributed to off-target effects of the plasmid (Figure 2C).
IGF-1 promotes tube formation in trophoblasts which is mitigated by ID2 overexpression
HTR8 cells have the ability to form endothelial-like tubes which reflects the endovascular differentiation of the cells [25]. We determined the effects of IGF-1 on the tube formation of HTR8 cells. The three doses of IGF-1 increased the size of the tubes (Figure 3A, 3B). However, the tube formation of IGF-1-treated HTR8 cells transfected with ID2 plasmid significantly decreased at 100 and 1000 ng/mL compared to IGF-1-treated HTR8 cells transfected with C plasmid (Figure 3C, 3D).
IGF-1 promotes trophoblast migration which is mitigated by ID2 overexpression
IGF-1 is reported to increase the migration of HTR8 cells [26]. We determined the effects of IGF-1 on the migration of HTR8 cells utilizing the wound healing method [27]. The three doses of IGF-1 markedly decreased the width of the wounded area approximately 20%, 50% and 70% of non-treated cells respectively (Figure 4A, 4B).
We investigated the role of ID2 in the IGF1-induced cell migration of HTR8 cells. In the absence of IGF-1, there was no significant difference in wound width in HTR8 cells transfected with ID2-overexpressing plasmid compared to HTR8 cells transfected with C plasmid (Figure 4C, 4D). However, the wound width of IGF-1-treated HTR8 cells transfected with ID2 plasmid was significantly larger at 100 and 1000 ng/mL compared to IGF-1-treated HTR8 cells transfected with C plasmid (Figure 4C, 4D).
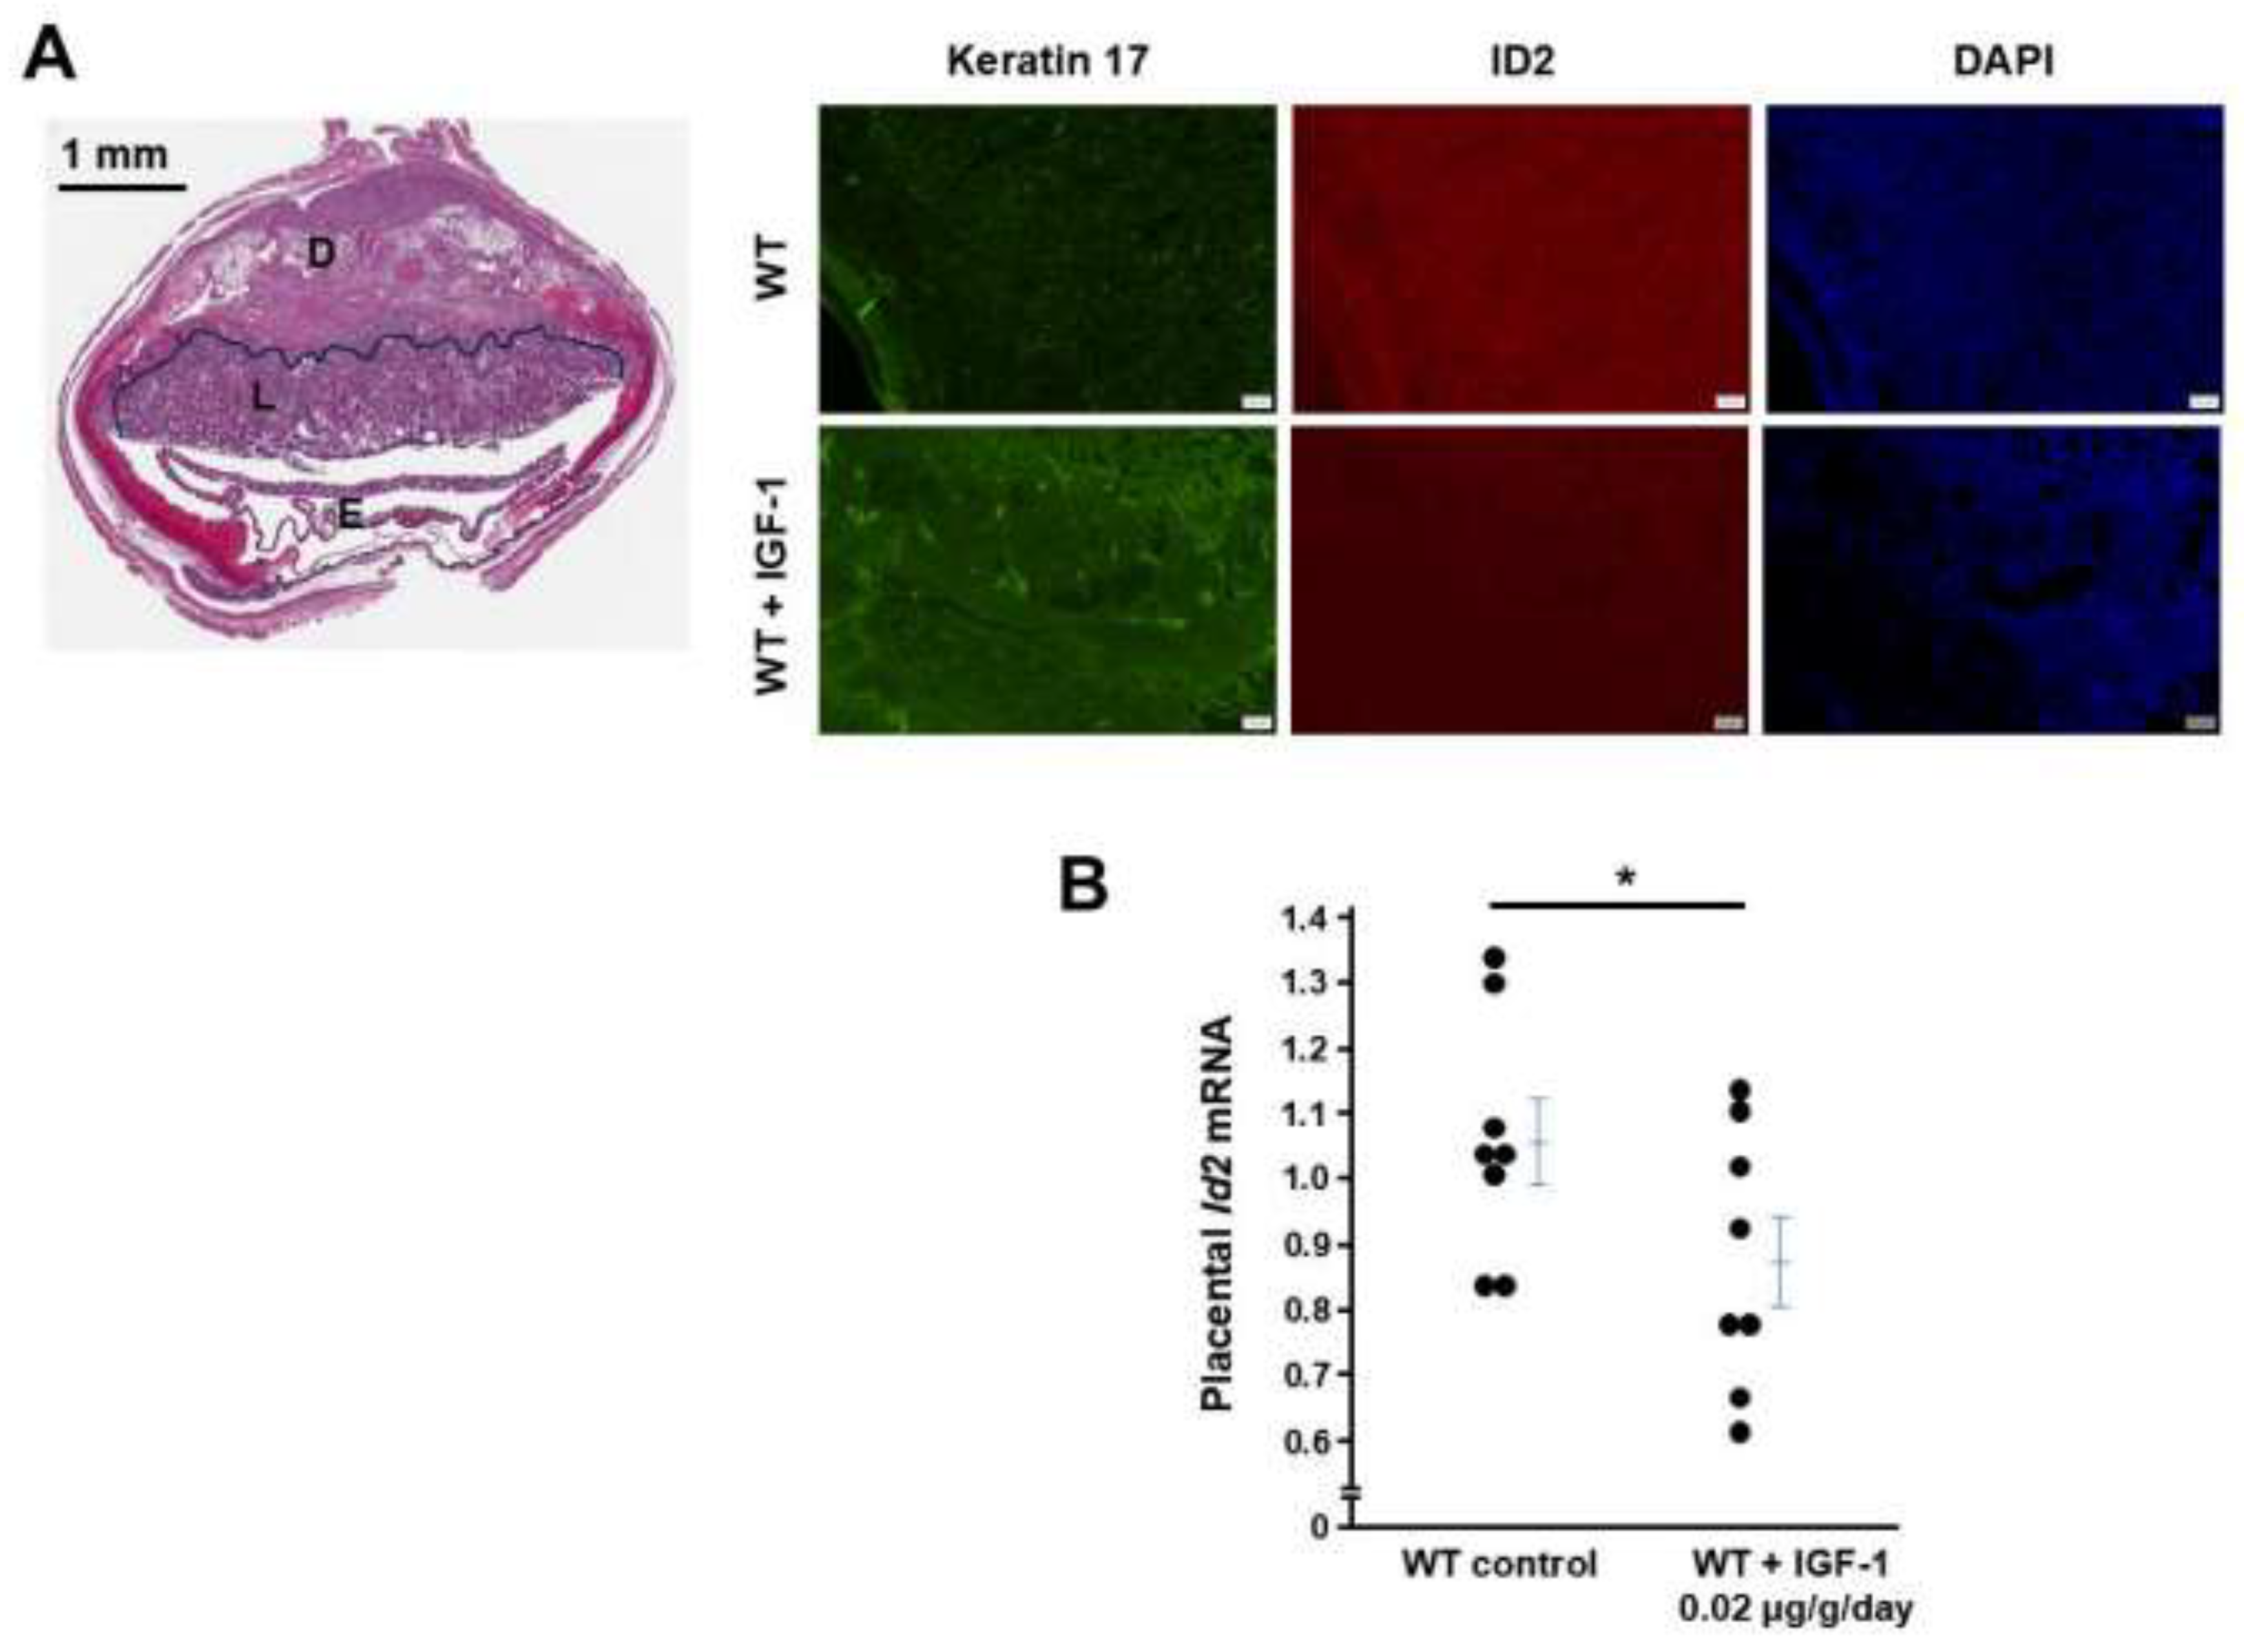
IGF1 administration to WT female mice decreases ID2 in placentas
IGF1 treatment starting at the beginning of the pregnancy for 12 days decreased mRNA levels of Id2 in placentas determined by qRT-PCR, and this treatment regimen decreased immunostaining of ID2 but increased the immunostaining of Keratin 17 (marker of trophoblast cell differentiation).
Figure 5.
IGF1 treatment increases ID2 in WT mouse placentas. (A) IGF1 treatment for 12 days decreased placental immunostaining of ID2 and increased immunostaing of Keratin 17. Left panel: Structure of the placenta at 12.5 dpc, D: decidua, L: labyrinthine where the pictures were taken, E: embryo. (B) mRNA levels of Id2 were in placentas from WT dams with or without IGF1 treatment. One point presents a placenta randomly collected from a pregnant mouse. * p < 0.05.
Discussion
While IGF-1 has previously been found to influence proliferation and differentiation in various cell types, including trophoblast cells, no study has investigated ID2 as a potential mediator of IGF-1 in these cellular processes [12,28,29,30,31,32,33]. In this study, we have demonstrated that IGF-1 downregulation of ID2—at both the mRNA and protein level—could mitigate the proliferation of HTR8 cells while promoting their differentiation. In addition, ID2 overexpression mitigates the antiproliferative, pro-differentiation effects of IGF-1 on HTR8 cells. Furthermore, our in vivo data demonstrates that IGF1 treatment decreased ID2 and increased Keratin 17. This data suggests that ID2 mediates the effects of IGF-1 on HTR8 cell proliferation and differentiation at least partially.
IGF-1 is expressed by almost all cells, and the main source of circulating IGF-1 is from hepatocytes which are regulated by growth hormone from the pituitary gland [34]. The bioactivity of IGF-1 is modulated by IGF-binding proteins (IGFBPs) and IGF-1 executes its cellular function through IGF-1 receptor (IGF1-R) [35]. IGF-1/IGF1-R signaling plays an important role in the female reproductive system. For example, IGF-1 deficiency leads to impaired granulosa cell proliferation [36]. Several lines of evidence suggest that IGF-1 is involved in pregnancy complications including PE. In normal human pregnancy, IGF-1 levels during the first two trimesters are not significantly different than the IGF-1 levels of healthy non-pregnant women [37]. Later, IGF-1 is significantly increased during the third trimester compared to the first and second trimesters [37]. One study reported that IGF-1 was lower and IGFBP-1 higher in PE patients compared to normotensive pregnant women, and these changes were correlated with the severity of PE [38]. However, the authors did not clarify during which stage of gestation IGF-1 and IGFBP-1 were measured [38]. Later, Ning et al. demonstrated that preeclamptic women had lower plasma IGF-1 and IGFBP-1 compared to normotensive women at 13 weeks of gestation [39]. This association between low maternal IGF-1 during the first trimester and PE is later reported by Nahar et al. [40]. Furthermore, in experimental animal studies, low IGF-1 causes pregnancy problems: Lorenzini et al. observed that IGF-1 deficient female mice had decreased litter size compared to wild-type females, however it is not clear if these dams had hypertension and proteinuria [41]. Lai et al. reported that female mice with reduced IGF-1 expression established by a lentiviral-mediated, placental-specific knockdown developed PE-like phenotypes during pregnancy including elevated blood pressure, proteinuria, and decreased fetal weight [12]. The authors also found that IGF-1 enhanced proliferation, invasion, and angiogenesis of trophoblast cells in vitro [12]. Taken together, lower-than-normal levels of IGF-1 could negatively affect trophoblast biology, which may contribute to PE pathogenesis. In contrast, Irani et al. reported that women undergoing euploid blastocyst transfer with elevated serum IGF-1 concentrations may be at increased risk of pregnancy loss [42]. Higher-than-normal IGF-1 is also reported to be associated with pre-term delivery in type I diabetic pregnancy [43]. During early placentation, trophoblast progenitors must sufficiently proliferate before they start to differentiate. If trophoblast progenitors are exposed to abnormally high levels of IGF-1, these cells could have impaired proliferation and immature differentiation, which could lead to defective placentation and adverse pregnancy outcomes. In contrast, low IGF-1 levels during the trophoblast cell differentiation stage could impair trophoblast cell differentiation, causing insufficient placentation and subsequent pregnancy complications. Overall, the precise mechanism by which IGF-1 affects pregnancy is not clear as both high and low IGF-1 levels could have detrimental effects.
Here, we tested the effects of physiological and supraphysiological doses of IGF-1 on ID2 because of the pivotal role of ID2 in trophoblast cell biology. First, we found that IGF-1 impedes HTR8 cell proliferation at all doses we applied, and overexpressing ID2 mitigated the inhibition effect of IGF-1. Lai et al. found HTR8 cell proliferation was decreased after silencing IGF-1 and concluded that IGF-1 promoted HTR8 cell proliferation [12]. The method they utilized to determine cell proliferation is the CCK-8 kit which detects the number of live cells, not newly synthesized DNA [12]. Our results showed that live cell numbers measured by the CCK-8 kit were increased by IGF-1 treatment. However, this method cannot differentiate whether the increase in live cells is due to new cell synthesis, reduced cell death, or both. ID2 has the opposite effects of IGF-1 on trophoblast cell proliferation and differentiation, which confirms the fact that IGF-1 promotes HTR8 cell tube formation and migration through ID2 downregulation. This all supports the notion that ID2 is at least a partial mediator of IGF-1 in trophoblast cells.
Besides ID2, there are many other factors that are involved in trophoblast cell proliferation and differentiation. In our study, ID2 overexpression only partially mitigated IGF-1’s effects, suggesting there could be an ID2-indpendent pathway which mediates the effects of IGF-1 on HTR8 cells. The complex cellular signaling pathways of IGF-1/IGF1-R include RAS/MEK/ERK, and IRS-1/IRS-2/PI3K. We treated HTR8 cells with IGF-1 plus U0126 (an inhibitor of ERK1/2 phosphorylation [44]) or IGF-1 plus LY294002 (an inhibitor of PI3K [45]). However, blocking ERK or PI3K did not impact the effects of IGF-1 on ID2 expression, suggesting other pathways could be involved in IGF-1’s effect on ID2 in trophoblast cells (Supplementary Figure 2). In summary, our study demonstrated that ID2 is likely a downstream mediator of IGF-1 in HTR8 cell proliferation and differentiation. Interventions in the IGF-1/ID2 signaling pathway may improve trophoblast cell biology and later pregnancy outcomes.
Author Contributions
F.L. designed the study; F.L., R.S, and Y.W., J.Z., Y.K., W.H.D.T-T, M.Q. carried out experiments; R.S., F.L., Y.W., W.H.D.T-T., B.R., and N.M-S analyzed and interpreted the data; F.L., R.S., N.M-S. drafted and F.L. N.M-S, W.H.D.T-T., B.R., revised the paper.
Acknowledgments
This work was supported by grants from the National Institutes of Health (R01HL049277 to N.M-S., and R01HD101485 to F.L.)
References
- Knöfler M, Haider S, Saleh L, Pollheimer J, Gamage TKJB, James J. Human placenta and trophoblast development: key molecular mechanisms and model systems. Cellular and Molecular Life Sciences. 2019;76(18):3479-96. [CrossRef]
- Laganà AS, Surico D, Bordino V, Cantaluppi V, Mary D, Gentilli S, et al. Preeclampsia and intrauterine growth restriction: Role of human umbilical cord mesenchymal stem cells-trophoblast cross-talk. Plos One. 2019;14(6). [CrossRef]
- Selesniemi K, Albers RE, Brown TL. Id2 Mediates Differentiation of Labyrinthine Placental Progenitor Cell Line, SM10. Stem Cells and Development. 2016;25(13):959-74. [CrossRef]
- Ling F, Kang B, Sun X-H. Id Proteins. bHLH Transcription Factors in Development and Disease. Current Topics in Developmental Biology2014. p. 189-216.
- Florio M, Hernandez M-C, Yang H, Shu H-K, Cleveland JL, Israel MA. Id2 Promotes Apoptosis by a Novel Mechanism Independent of Dimerization to Basic Helix-Loop-Helix Factors. Molecular and Cellular Biology. 2023;18(9):5435-44. [CrossRef]
- Gultice AD, Selesniemi KL, Brown TL. Hypoxia Inhibits Differentiation of Lineage-Specific Rcho-1 Trophoblast Giant Cells1. Biology of Reproduction. 2006;74(6):1041-50. [CrossRef]
- Qi Z, Guo W, Zheng S, Fu C, Ma Y, Pan S, et al. Enhancement of neural stem cell survival, proliferation and differentiation by IGF-1 delivery in graphene oxide-incorporated PLGA electrospun nanofibrous mats. RSC Advances. 2019;9(15):8315-25. [CrossRef]
- Feng J, Meng Z. Insulin growth factor-1 promotes the proliferation and osteogenic differentiation of bone marrow mesenchymal stem cells through the Wnt/β-catenin pathway. Experimental and Therapeutic Medicine. 2021;22(2). [CrossRef]
- Liao S, Vickers MH, Taylor RS, Jones B, Fraser M, McCowan LME, et al. Maternal serum IGF-1, IGFBP-1 and 3, and placental growth hormone at 20 weeks’ gestation in pregnancies complicated by preeclampsia. Pregnancy Hypertension. 2017;10:149-54. [CrossRef]
- Balachandiran M, Bobby Z, Dorairajan G, Gladwin V, Vinayagam V, Packirisamy RM. Decreased maternal serum adiponectin and increased insulin-like growth factor-1 levels along with increased placental glucose transporter-1 expression in gestational diabetes mellitus: Possible role in fetal overgrowth. Placenta. 2021;104:71-80. [CrossRef]
- Wilson RL, Troja W, Sumser EK, Maupin A, Lampe K, Jones HN. Insulin-like growth factor 1 signaling in the placenta requires endothelial nitric oxide synthase to support trophoblast function and normal fetal growth. American Journal of Physiology-Regulatory, Integrative and Comparative Physiology. 2021;320(5):R653-R62. [CrossRef]
- Lai W, Yu L. Insulin-like growth factor 1 ameliorates pre-eclampsia by inhibiting zinc finger E-box binding homeobox 1 by up-regulation of microRNA-183. Journal of Cellular and Molecular Medicine. 2023;27(9):1179-91. [CrossRef]
- Navarro M, Valentinis B, Belletti B, Romano G, Reiss K, Baserga R. Regulation of Id2 Gene Expression by the Type 1 IGF Receptor and the Insulin Receptor Substrate-1. Endocrinology. 2001;142(12):5149-57. [CrossRef]
- Graham CH, Hawley TS, Hawley RC, MacDougall JR, Kerbel RS, Khoo N, et al. Establishment and Characterization of First Trimester Human Trophoblast Cells with Extended Lifespan. Experimental Cell Research. 1993;206(2):204-11. [CrossRef]
- Cooney AJ, Takao T, Asanoma K, Kato K, Fukushima K, Tsunematsu R, et al. Isolation and Characterization of Human Trophoblast Side-Population (SP) Cells in Primary Villous Cytotrophoblasts and HTR-8/SVneo Cell Line. PLoS ONE. 2011;6(7). [CrossRef]
- Nandi P, Lim H, Torres-Garcia EJ, Lala PK. Human trophoblast stem cell self-renewal and differentiation: Role of decorin. Scientific Reports. 2018;8(1). [CrossRef]
- Li F, Kakoki M, Smid M, Boggess K, Wilder J, Hiller S, et al. Causative Effects of Genetically Determined High Maternal/Fetal Endothelin-1 on Preeclampsia-Like Conditions in Mice. Hypertension. 2018;71(5):894-903. [CrossRef]
- Ayesha A, Bahnson EM, Kayashima Y, Wilder J, Huynh PK, Hiller S, et al. Vitamin B12 does not increase cell viability after hydrogen peroxide induced damage in mouse kidney proximal tubular cells and brain endothelial cells. Adv Redox Res. 2022;4. Epub 2022/05/07. [CrossRef] [PubMed]
- Yang X, Ren L, Chen X, Pang Y, Jia B, Sun J, et al. BMP9 maintains the phenotype of HTR-8/Svneo trophoblast cells by activating the SDF1/CXCR4 pathway. BMC Molecular and Cell Biology. 2023;24(1). [CrossRef]
- Li F, Bahnson EM, Wilder J, Siletzky R, Hagaman J, Nickekeit V, et al. Oral high dose vitamin B12 decreases renal superoxide and post-ischemia/reperfusion injury in mice. Redox Biology. 2020;32. [CrossRef]
- Ayesha A, Bahnson EM, Kayashima Y, Wilder J, Huynh PK, Hiller S, et al. Vitamin B12 does not increase cell viability after hydrogen peroxide induced damage in mouse kidney proximal tubular cells and brain endothelial cells. Advances in Redox Research. 2022;4. [CrossRef]
- Schmittgen TD, Livak KJ. Analyzing real-time PCR data by the comparative CT method. Nature Protocols. 2008;3(6):1101-8. [CrossRef]
- Vatten LJ, Nilsen TIL, Juul A, Jeansson S, Jenum PA, Eskild A. Changes in circulating level of IGF-I and IGF-binding protein-1 from the first to second trimester as predictors of preeclampsia. European Journal of Endocrinology. 2008;158(1):101-5. [CrossRef]
- Sun K, Visser A, Beijer M, Oudejans CBM, van Dijk M. The effect of maternal NODAL on STOX1 expression in extravillous trophoblasts is mediated by IGF1. Plos One. 2018;13(8). [CrossRef]
- Highet AR, Buckberry S, Mayne BT, Khoda SM, Bianco-Miotto T, Roberts CT. First trimester trophoblasts forming endothelial-like tubes in vitro emulate a ‘blood vessel development’ gene expression profile. Gene Expression Patterns. 2016;21(2):103-10. [CrossRef]
- Crosley EJ, Dunk CE, Beristain AG, Christians JK. IGFBP-4 and −5 are expressed in first-trimester villi and differentially regulate the migration of HTR-8/SVneo cells. Reproductive Biology and Endocrinology. 2014;12(1). [CrossRef]
- Taga S, Hayashi M, Nunode M, Nakamura N, Ohmichi M. miR-486-5p inhibits invasion and migration of HTR8/SVneo trophoblast cells by down-regulating ARHGAP5. Placenta. 2022;123:5-11. [CrossRef]
- Hwang S-M, Sharma G, Verma R, Byun S, Rudra D, Im S-H. Inflammation-induced Id2 promotes plasticity in regulatory T cells. Nature Communications. 2018;9(1). [CrossRef]
- Woods DC, Haugen MJ, Johnson AL. Role for Inhibitor of Differentiation/Deoxyribonucleic Acid-Binding (Id) Proteins in Granulosa Cell Differentiation. Endocrinology. 2008;149(6):3187-95. [CrossRef]
- Jakubison BL, Sarkar T, Gudmundsson KO, Singh S, Sun L, Morris HM, et al. ID2 and HIF-1α collaborate to protect quiescent hematopoietic stem cells from activation, differentiation, and exhaustion. Journal of Clinical Investigation. 2022;132(13). [CrossRef]
- Liu F, Chen S, Yu Y, Huang C, Chen H, Wang L, et al. Inhibitor of DNA binding 2 knockdown inhibits the growth and liver metastasis of colorectal cancer. Gene. 2022;819. [CrossRef]
- Zinina VV, Ruehle F, Winkler P, Rebmann L, Lukas H, Möckel S, et al. ID2 controls differentiation of enteroendocrine cells in mouse small intestine. Acta Physiologica. 2022;234(2). [CrossRef]
- Forbes K, Westwood M, Baker PN, Aplin JD. Insulin-like growth factor I and II regulate the life cycle of trophoblast in the developing human placenta. American Journal of Physiology-Cell Physiology. 2008;294(6):C1313-C22. [CrossRef]
- Frystyk J, Skjærbæk C, Dinesen B, Ørskov H. Free insulin-like growth factors (IGF-I and IGF-II) in human serum. FEBS Letters. 2001;348(2):185-91. [CrossRef]
- Werner H, Bruchim I. The insulin-like growth factor-I receptor as an oncogene. Archives of Physiology and Biochemistry. 2009;115(2):58-71. [CrossRef]
- Kadakia R, Arraztoa JA, Bondy C, Zhou J. Granulosa cell proliferation is impaired in the Igf1 null ovary. Growth Hormone & IGF Research. 2001;11(4):220-4. [CrossRef]
- Oneto A, Guitelman M, Aranda C, Rosmino J, Tkatch J, Fabbro D, et al. IGF-1 Levels During Normal Pregnancy. Journal of the Endocrine Society. 2020;4(Supplement_1). [CrossRef]
- Ingec M, Gursoy HG, Yildiz L, Kumtepe Y, Kadanali S. Serum levels of insulin, IGF-1, and IGFBP-1 in pre-eclampsia and eclampsia. International Journal of Gynecology & Obstetrics. 2017;84(3):214-9. [CrossRef]
- Ning Y, Williams MA, Vadachkoria S, Muy-Rivera M, Frederick IO, Luthy DA. Maternal plasma concentrations of insulinlike growth factor-1 and insulinlike growth factor-binding protein-1 in early pregnancy and subsequent risk of preeclampsia. Clinical Biochemistry. 2004;37(11):968-73. [CrossRef]
- Nahar DS, Islam DMS. Evaluation of Insulin-Like Growth Factor-I (IGF-I) as a Predictor of Preeclampsia. East African Scholars Journal of Medical Sciences. 2022;5(12):301-6. [CrossRef]
- Lorenzini A, Salmon AB, Lerner C, Torres C, Ikeno Y, Motch S, et al. Mice Producing Reduced Levels of Insulin-Like Growth Factor Type 1 Display an Increase in Maximum, but not Mean, Life Span. The Journals of Gerontology Series A: Biological Sciences and Medical Sciences. 2013;69(4):410-9. [CrossRef]
- Irani M, Nasioudis D, Witkin SS, Gunnala V, Spandorfer SD. High serum IGF-1 levels are associated with pregnancy loss following frozen-thawed euploid embryo transfer cycles. Journal of Reproductive Immunology. 2018;127:7-10. [CrossRef]
- F Lauszus F, H Tjessem I, O Svarrer R, Mf Al-Far H. Consecutive measurements show association of IGF-1 with preterm delivery in type 1 diabetic pregnancy. Integrative Obesity and Diabetes. 2017;3(3). [CrossRef]
- Malik A, Pal R, Gupta SK. Interdependence of JAK-STAT and MAPK signaling pathways during EGF-mediated HTR-8/SVneo cell invasion. PLoS One. 2017;12(5):e0178269. Epub 20170525. [CrossRef] [PubMed]
- Liu D, Luo D, Ge H, Zhang C, Wei S, Liang D, et al. Exposure to higher concentrations of exogenous ELABELA causes HTR-8/SVneo trophoblast cell dysfunction: A possible pathogenesis of pre-eclampsia. Pregnancy Hypertens. 2022;30:181-8. Epub 20221013. [CrossRef] [PubMed]
Figure 1.
IGF-1 decreases ID2 expression in trophoblasts in a dose-dependent manner. ID2 mRNA in HTR8 cells after 24 hours of IGF-1 treatment (A). Western blot (B) and densitometric quantitation (C) of ID2 protein in HTR8 cells after 24 hours of IGF-1 treatment. Asterisks indicate groups that are significantly different from 0 ng/mL IGF-1 or significantly different from each other (compared with red line): * p < 0.05, ** p < 0.01, *** p < 0.0001. A (n = 6), B (n = 3) and C show representative experiments which were repeated twice.
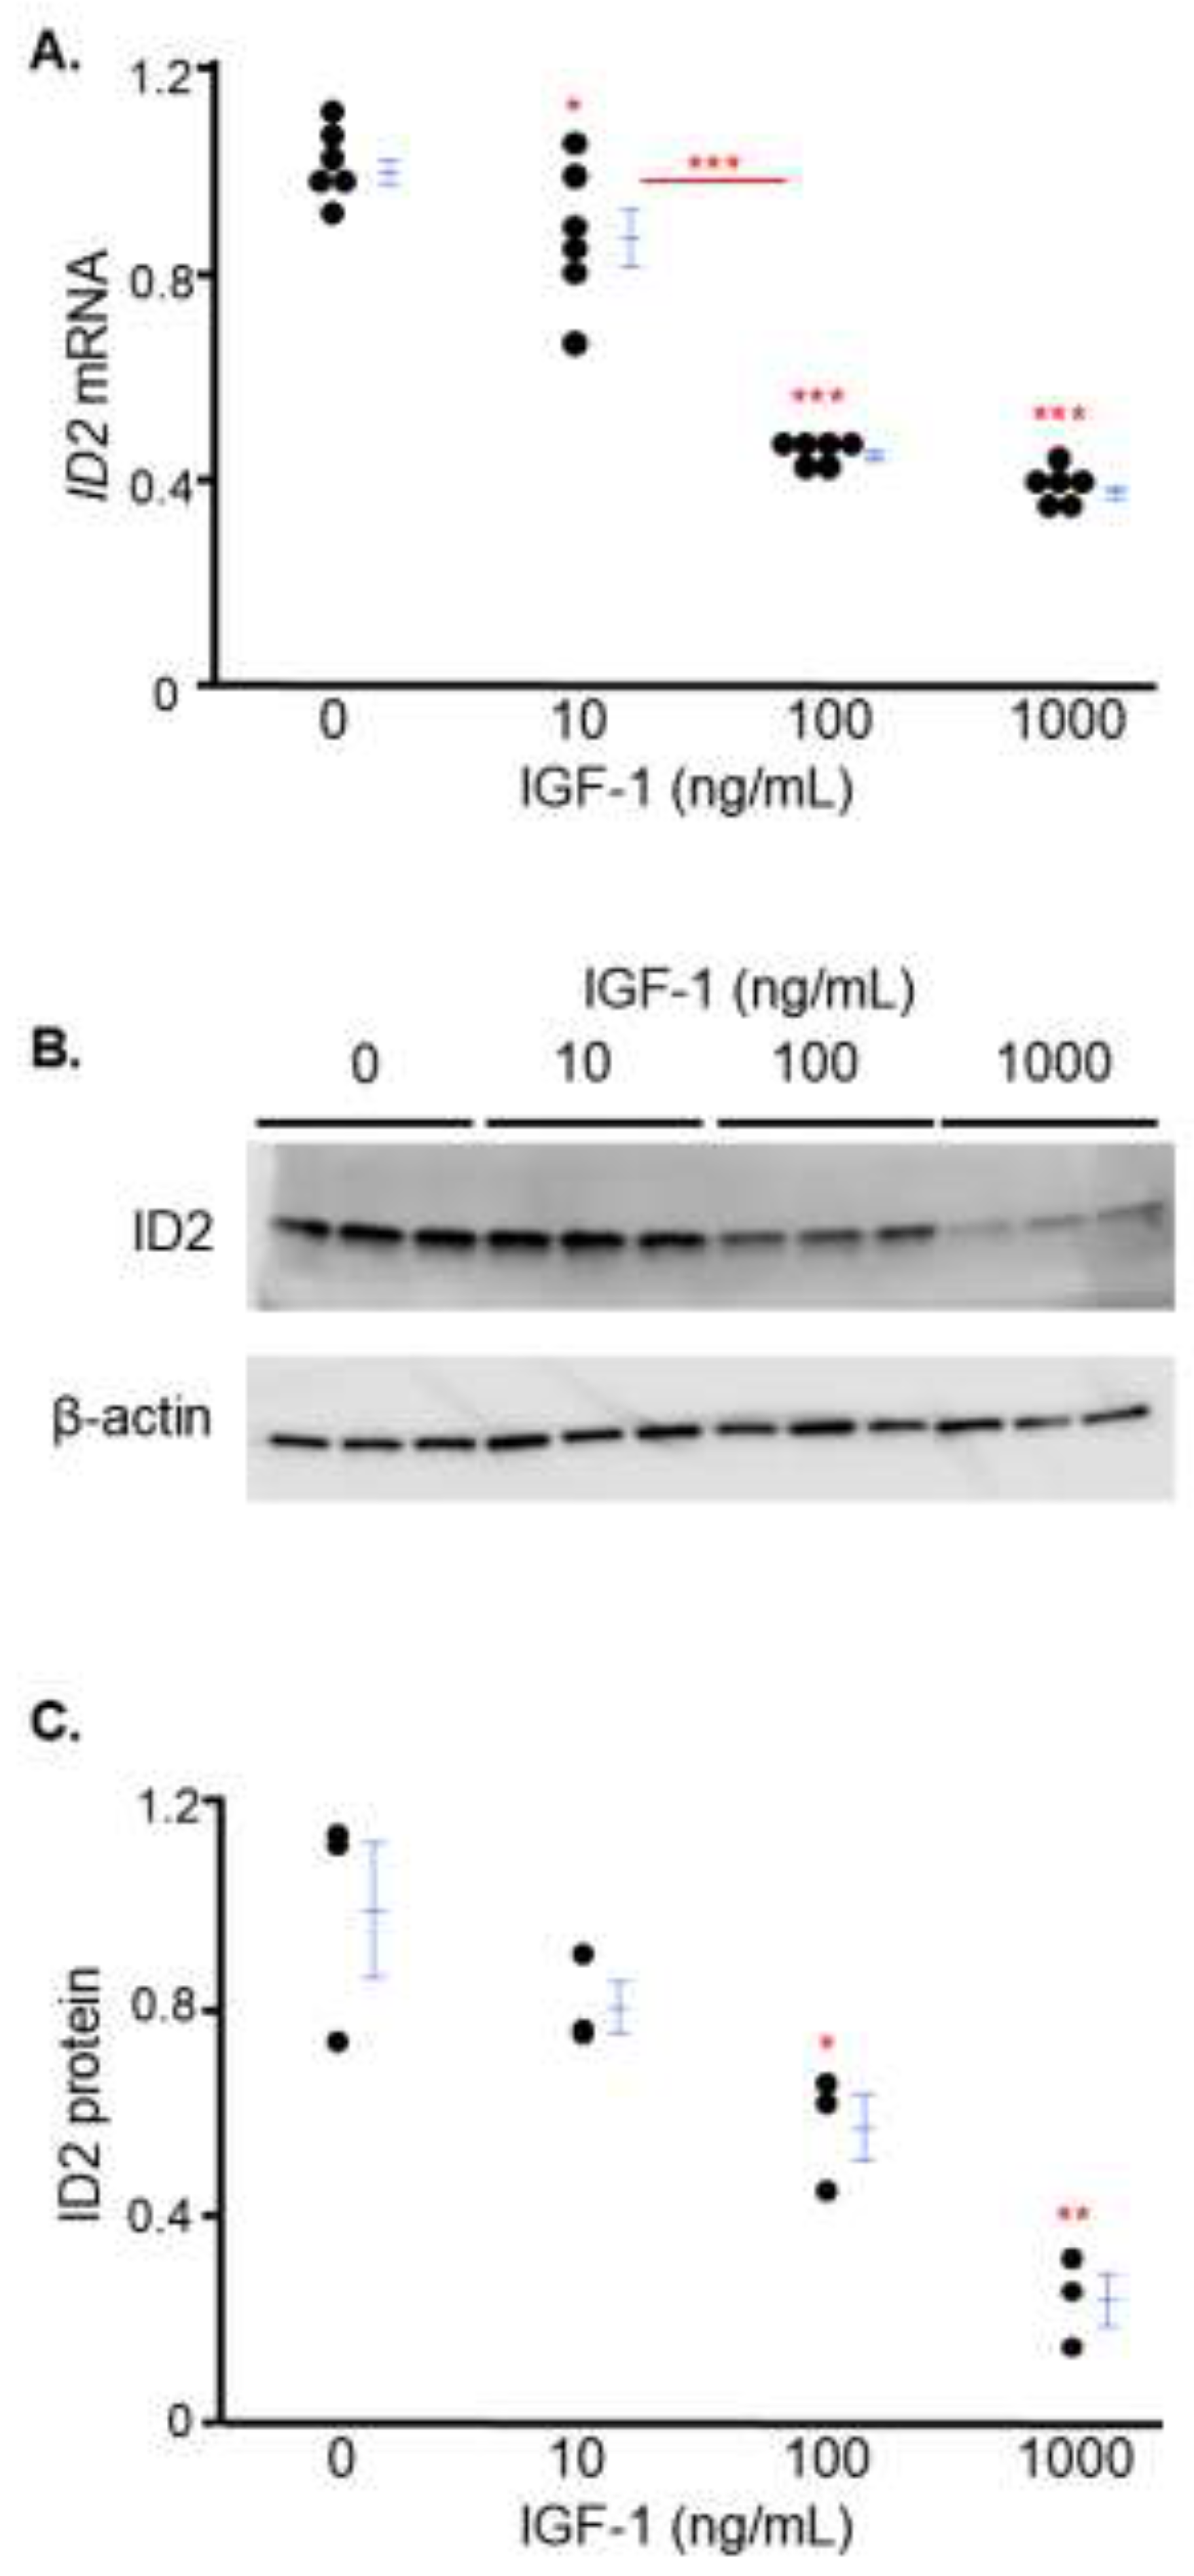
Figure 2.
IGF-1 inhibits the proliferation of trophoblasts which is rescued by ID2 overexpression. HTR8 cell viability (A) and proliferation (B) after 24 hours of IGF-1 treatment. Cell viability was measured by absorbance (450 nm) and cell proliferation was measured by fluorescence (530/25, 590/35). Proliferation of transfected (C or ID2 plasmid) HTR8 cells after 24 hours of IGF-1 treatment (C). Asterisks indicate groups that are significantly different from 0 ng/mL IGF-1 or groups significantly different from each other (compared with red line): * p < 0.05, ** p < 0.01, *** p < 0.0001, n.s. is not significant. A (n = 24), B (n = 24) and C (n = 12) show representative experiments which were repeated twice.
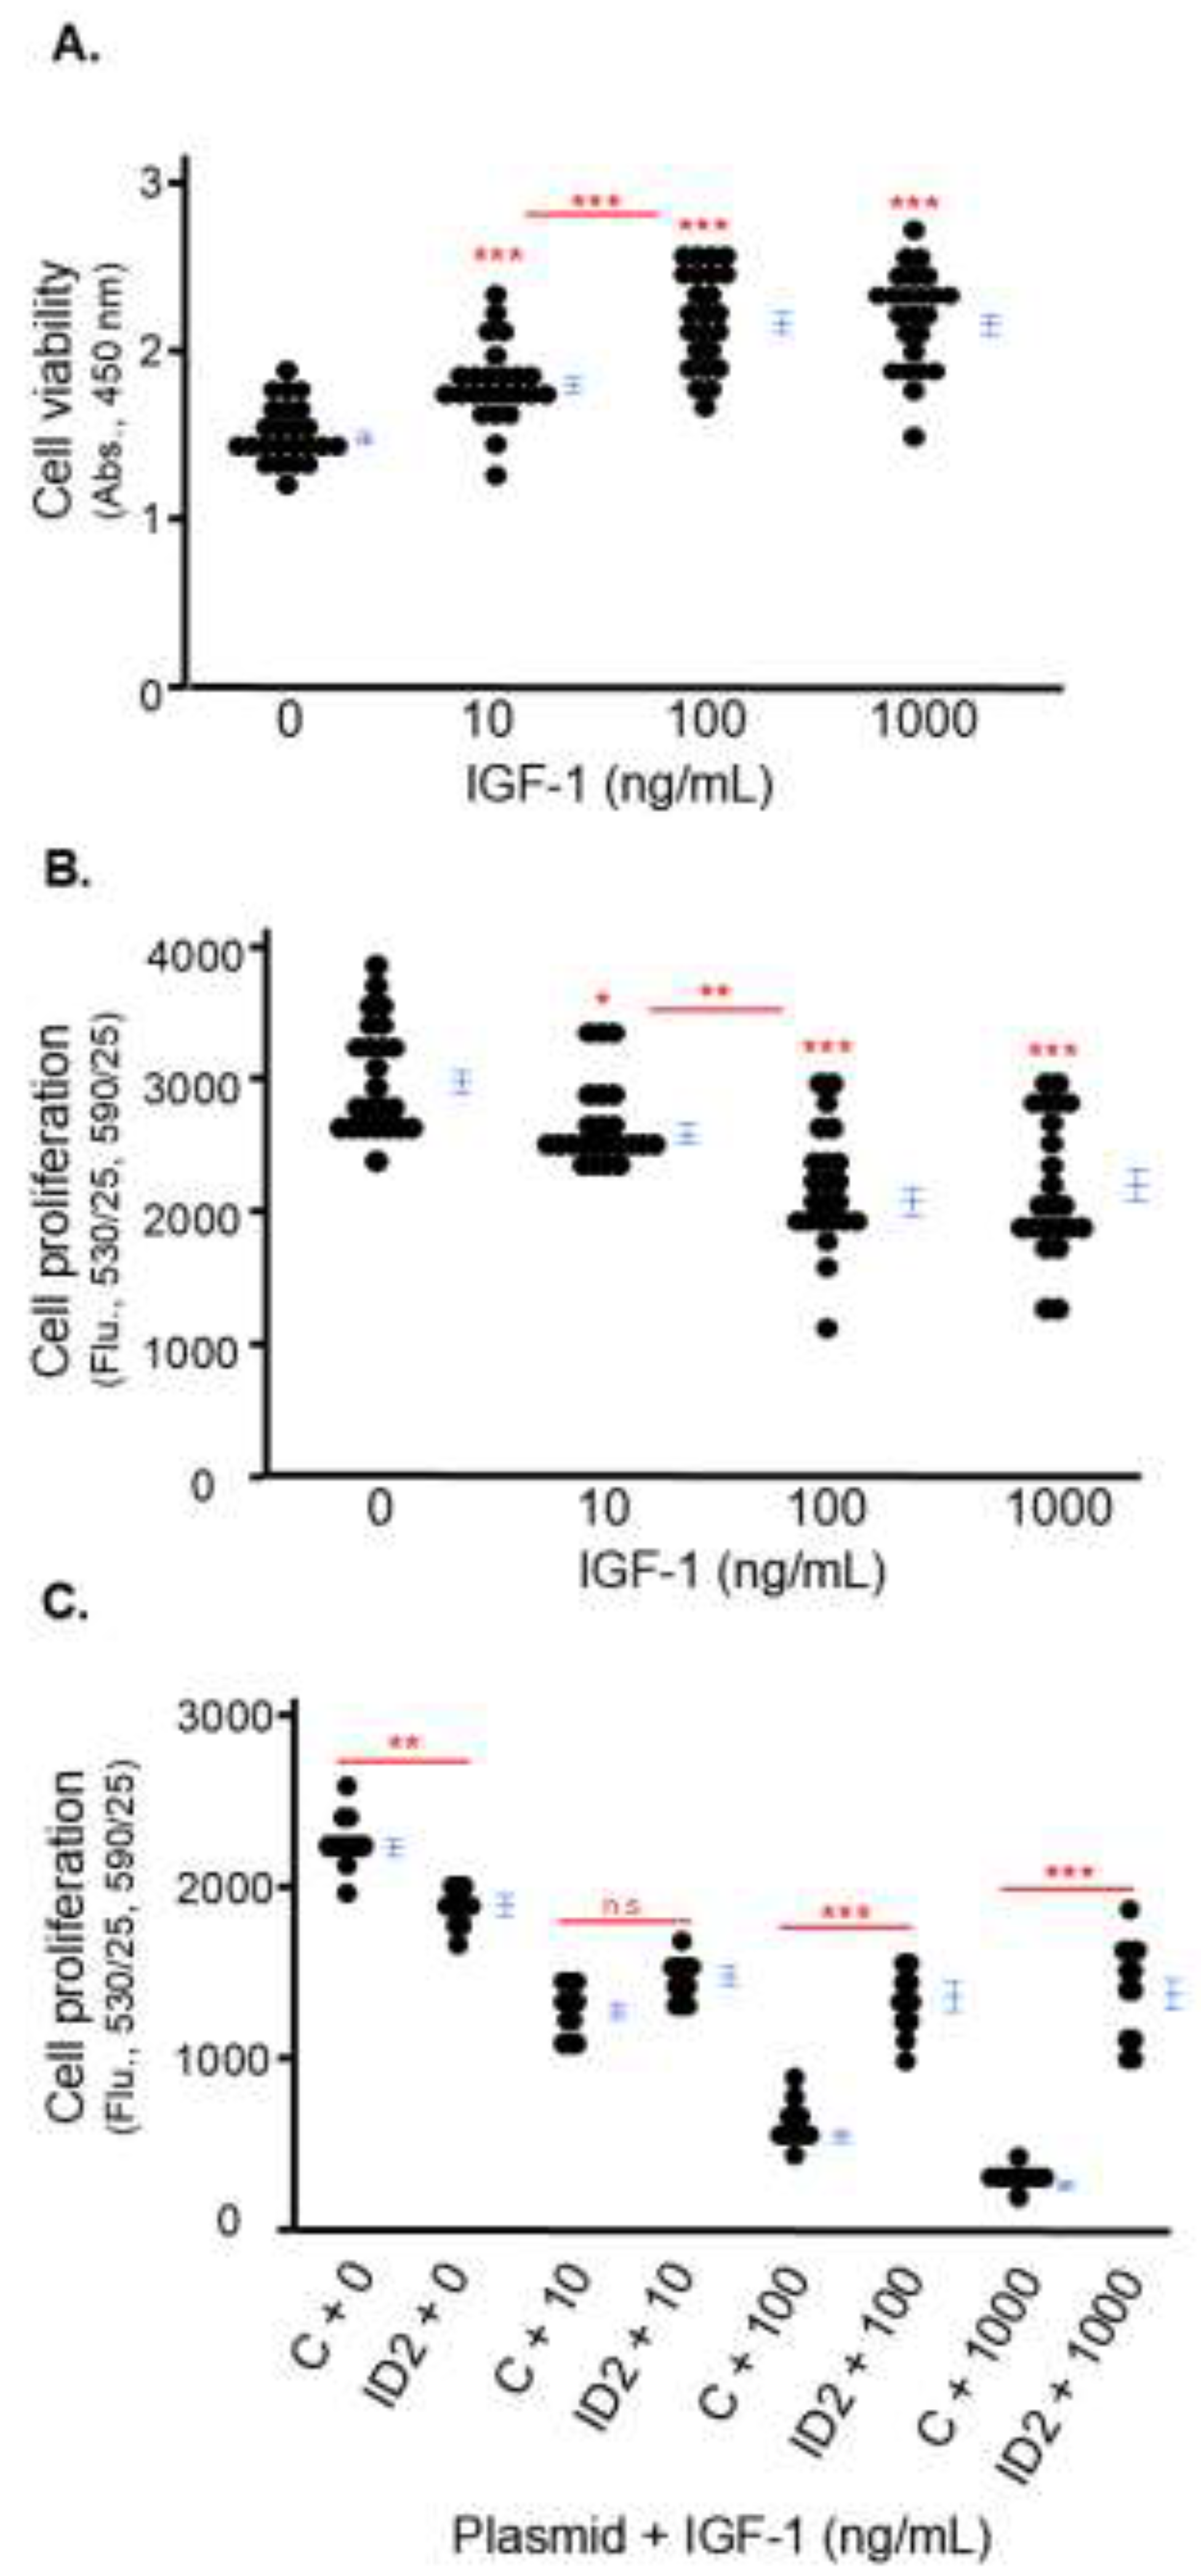
Figure 3.
IGF-1 promotes tube formation in trophoblasts which is mitigated by ID2 overexpression. Light microscopy images showing tube formation in HTR8 cells after 24 hours of IGF-1 treatment (A). B is the quantification of tube diameter in A. Red dots outline representative tubes, i.e., the way the cells assume a fibroblast-like morphology and form capillary-like structures with neighboring cells. Light microscopy images showing tube formation in transfected (C or ID2 plasmid) HTR8 cells after 24 hours of IGF-1 treatment (C). D is the quantification of tube diameter in C. Asterisks indicate groups that are significantly different from 0 ng/mL IGF-1 or groups significantly different from each other (compared with red line): * p < 0.05, ** p < 0.01, *** p < 0.0001, n.s. is not significant. A shows one representative image for each treatment group. 3 tube diameters were quantified per image (n = 5) (B). C shows one representative image for each treatment group. 3 tube diameters were quantified per image (n = 3) (D). All experiments were repeated twice.
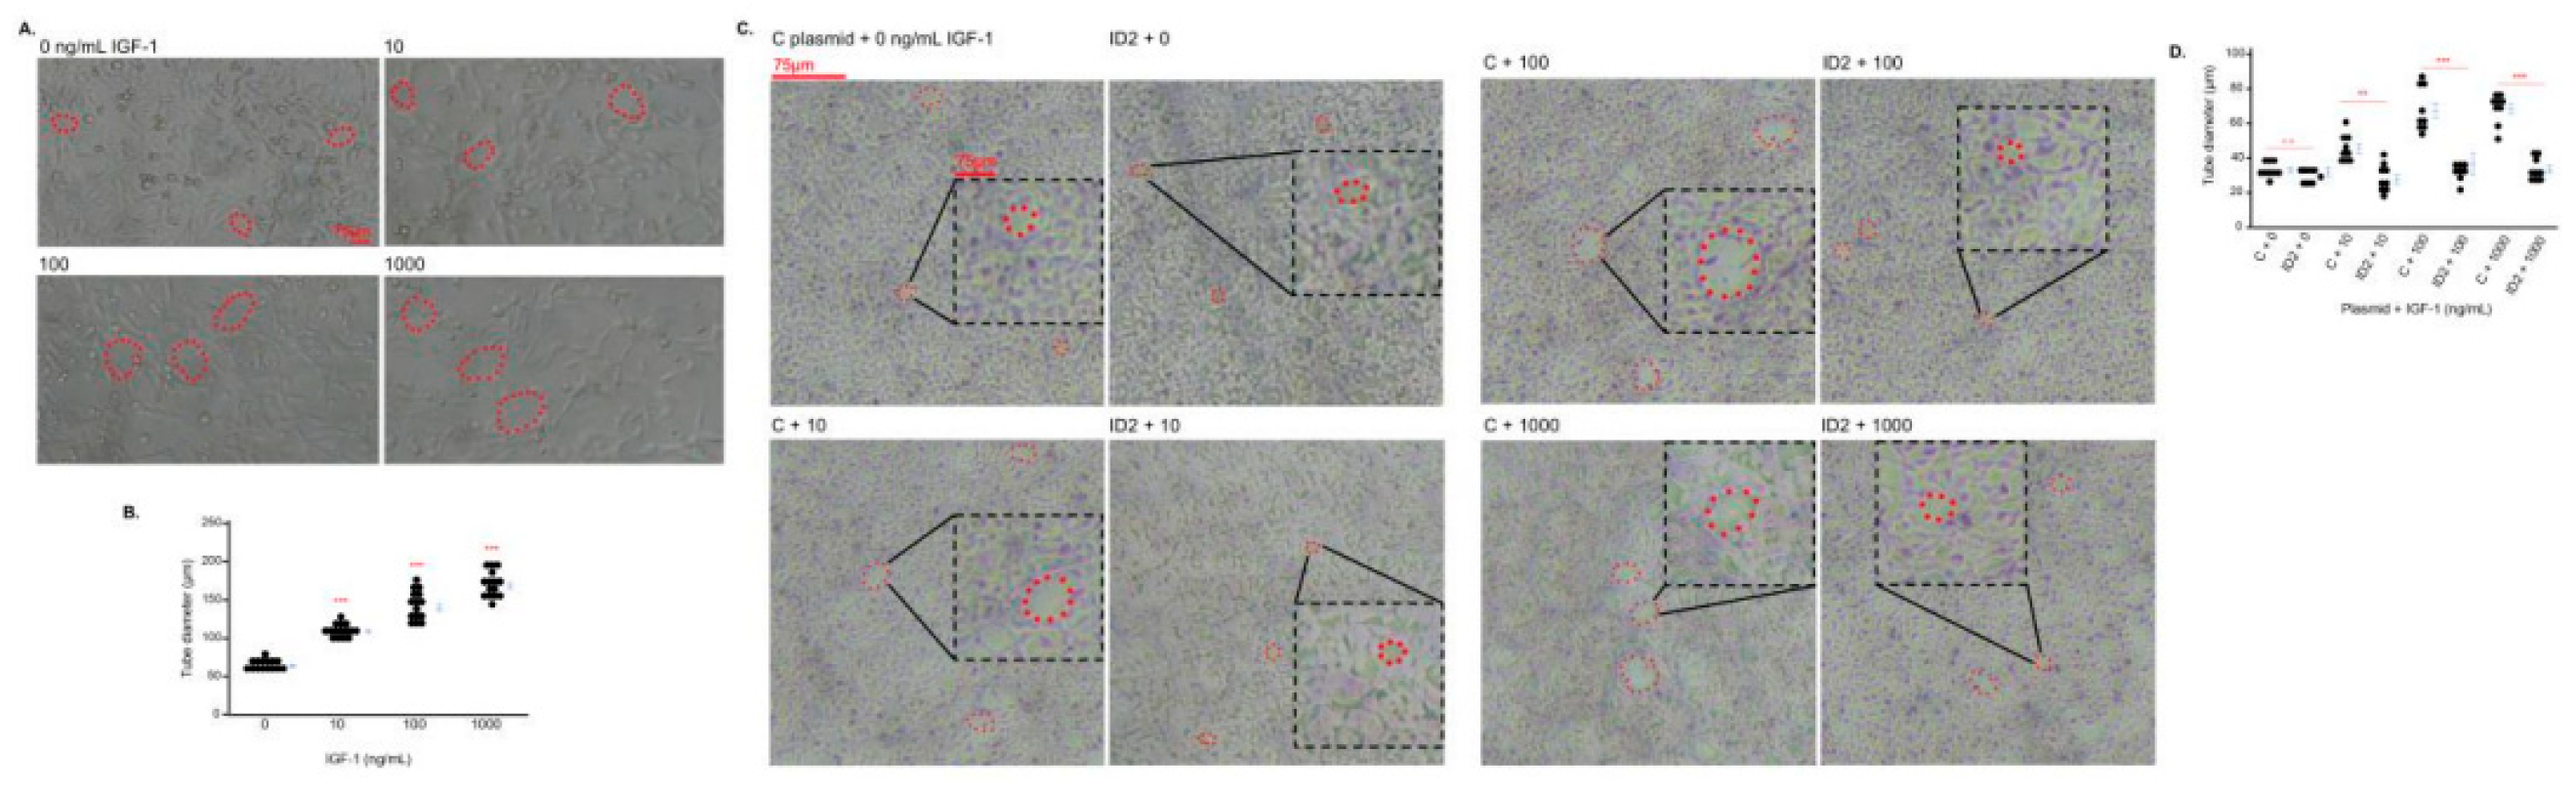
Figure 4.
IGF-1 promotes trophoblast migration which is mitigated by ID2 overexpression. Light microscopy images showing cell migration after 24 hours of IGF-1 treatment (A). The yellow lines approximate where the original injury was (based on dense cell growth as cells were > 90% confluent before scratching). B is the quantification of wound width in A. Light microscopy showing cell migration in transfected (C or ID2 plasmid) HTR8 cells after 24 hours of IGF-1 treatment (C). D is the quantification of wound width in C. Asterisks indicate groups that are significantly different from 0 ng/mL IGF-1 or groups significantly different from each other (compared with red line): * p < 0.05, ** p < 0.01, *** p < 0.0001, n.s. is not significant. A and B show one representative image (n = 3) for each treatment group. All experiments were repeated twice.
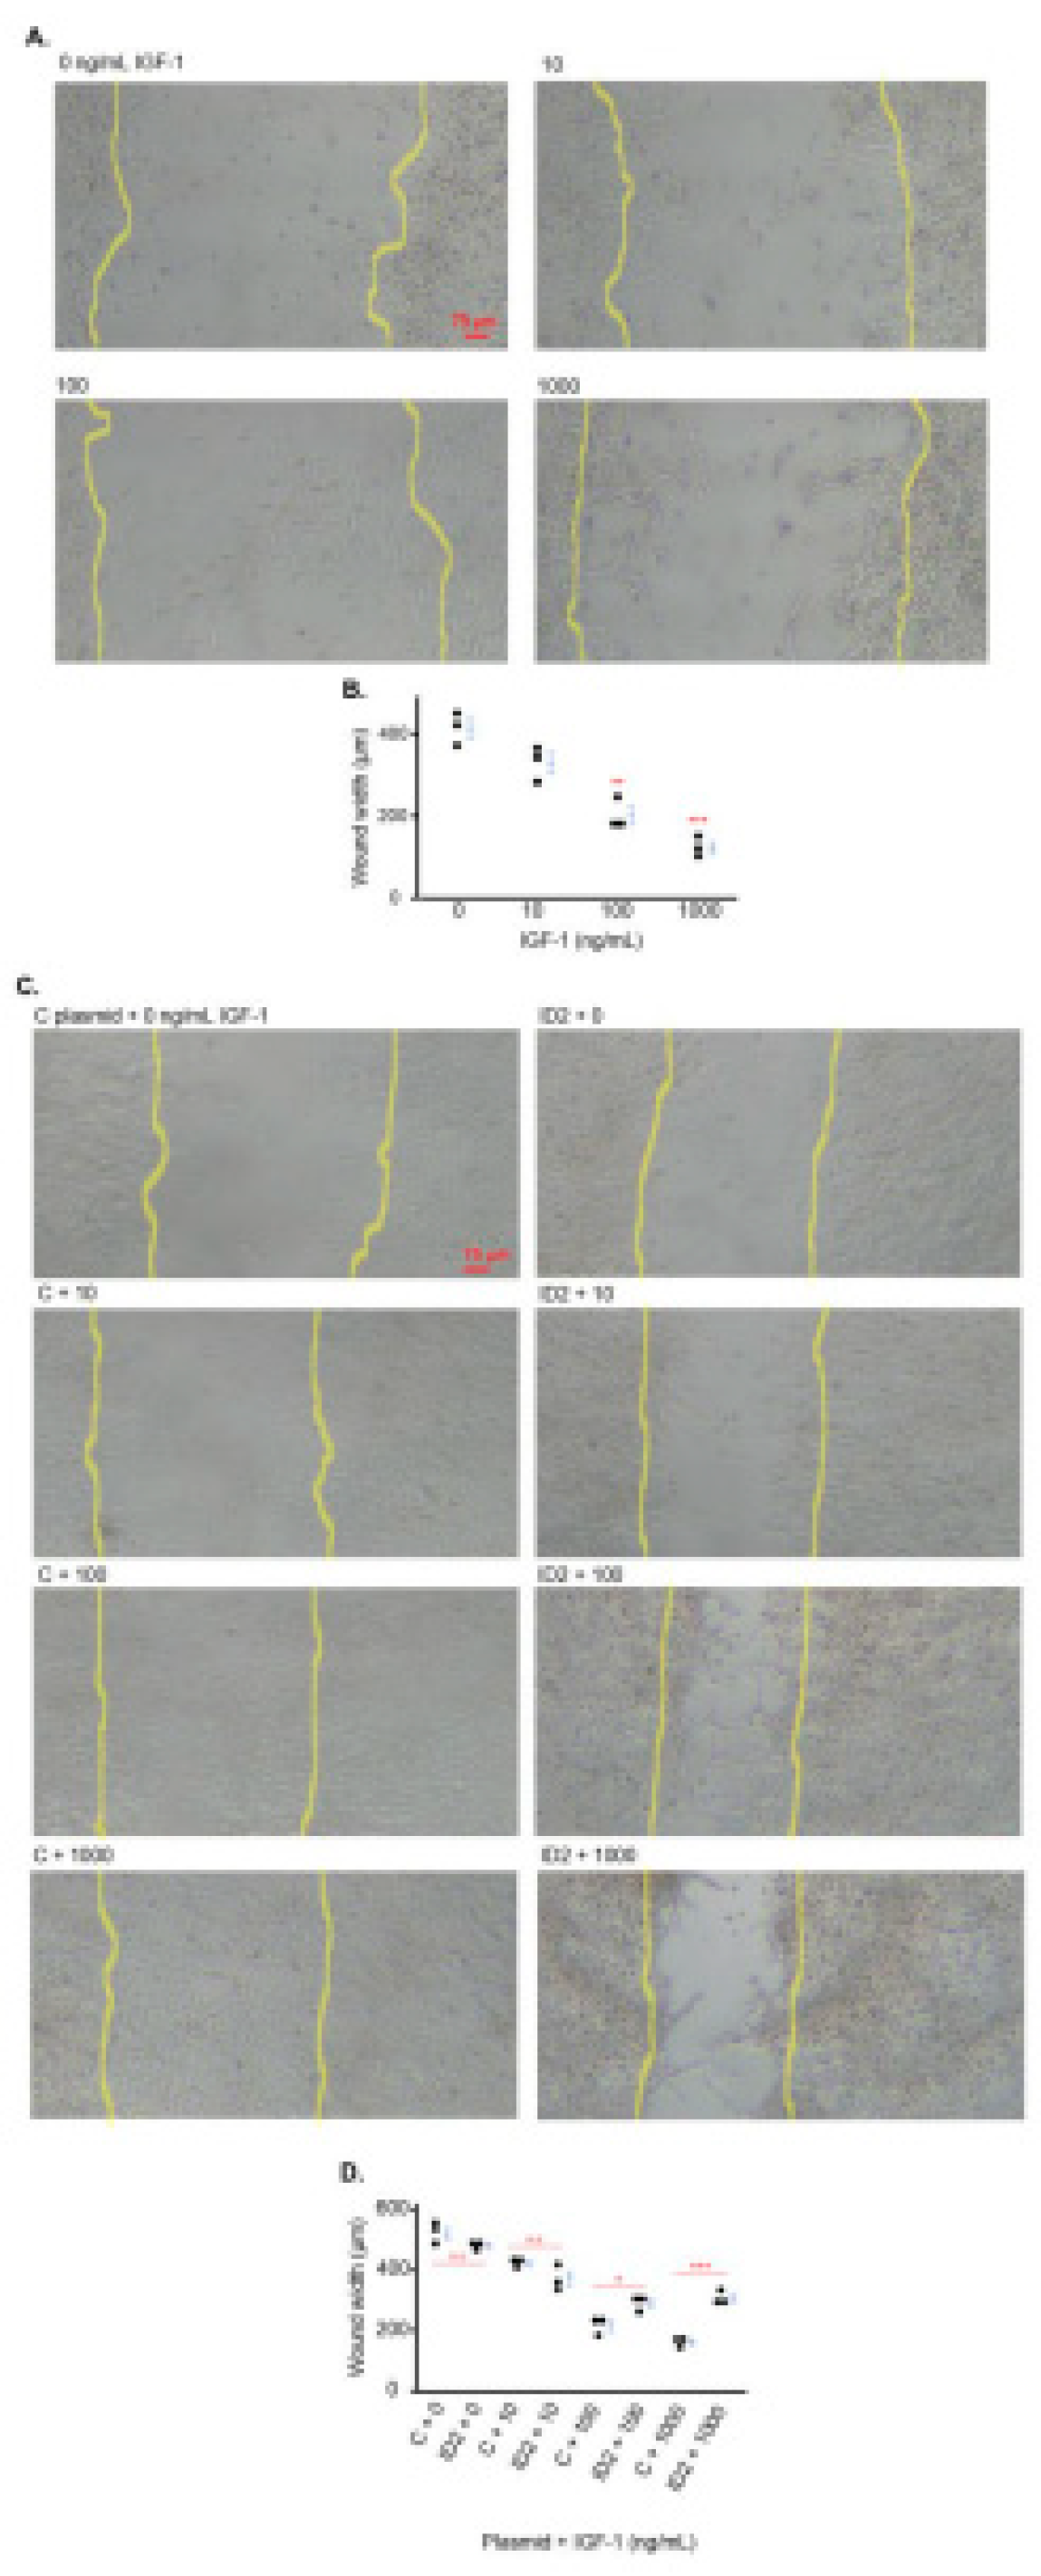

Table 1.
Primers and probes for qRT-PCR.
 |
Disclaimer/Publisher’s Note: The statements, opinions and data contained in all publications are solely those of the individual author(s) and contributor(s) and not of MDPI and/or the editor(s). MDPI and/or the editor(s) disclaim responsibility for any injury to people or property resulting from any ideas, methods, instructions or products referred to in the content. |
© 2024 by the authors. Licensee MDPI, Basel, Switzerland. This article is an open access article distributed under the terms and conditions of the Creative Commons Attribution (CC BY) license (http://creativecommons.org/licenses/by/4.0/).
Copyright: This open access article is published under a Creative Commons CC BY 4.0 license, which permit the free download, distribution, and reuse, provided that the author and preprint are cited in any reuse.


