
Submitted:
21 November 2024
Posted:
22 November 2024
You are already at the latest version
Abstract
The Eastern barn owl (Tyto javanica), a sub-group of Tyto alba, the most common species of owl in the world, is classified as “of least concern” under local legislation but appears to be affected by urban development. Between 3/8/ 2010 and 31/12/2021, 412 wild Eastern barn owls were presented for treatment to the Currumbin Wildlife Hospital. A retrospective study of their medical records shows a strong association between season and the number of admissions, with a combined total of 80% of admissions occurring in winter and spring (the breeding season for this species) in southeast Queensland. There were no significant association between age and admissions. The most common diagnosis was traumatic injuries, especially in winter and spring. Of all admissions, 46.61% died or were euthanased, 36.17% were transferred to wildlife carers, and 13.83% were released. We postulate that the breeding season results in an increase in the owls’ activity, in turn resulting in greater risk exposure, and an increased admissions to veterinary clinics. These findings appear to confirm that and thus provide information about the vulnerability of this species to anthropogenic activities, and the implications for outcomes of injured owls.
Keywords:
Eastern barn owl
; Tyto javanica
; Tyto alba
; wildlife
; veterinary
; anthropogenic
1. Introduction
The Eastern barn owl (Tyto javanica), found in southeastern Asia and Australasia, is a sub-group of Tyto alba, the most widely distributed species of owl in the world [1,2,3]. Although widespread and numerous globally, severe local declines have affected some populations, particularly in Europe and North America. While barn owls are prolific opportunistic breeders and able to recover from short-term population decreases, they are not as common in some areas as they were formerly [4].
Barn owls are common in southeast Queensland but, as they prefer secluded roosting sites, they may not be as commonly seen as other owls [4]. Despite being classified as “of least concern” under the Queensland Nature Conservation Act (1992), barn owls in southeast Queensland may have been affected by continuing urban development [5].
Veterinary wildlife hospitals play an important role in wildlife conservation by not only providing care for wild animals, but also in recording information about the factors potentially contributing toward a decline in their populations [6].
This paper reviews barn owl admissions to the Currumbin Wildlife Hospital in southeast Queensland, Australia over a 10-year period (2010-2011). The findings provide information about human-wildlife interactions, and their implications for conservation. They also shed light on the effectiveness of veterinary intervention to successfully treat and subsequently release wild birds (using barn owls as a model) back into the wild.
2. Materials and Methods
Aims
The primary aim of this study was to determine (by retrospectively examining medical records of barn owls admitted to a large wildlife hospital in southeast Queensland) if there were any seasonal, age-related, or sex-related trends in the number of admissions, the diagnosis, and the patient outcomes. A secondary aim was to examine if and how the diagnosis, treatment, and length of stay in hospital affected the outcomes for admitted birds.
Methods
The individuals in this data set were 412 wild Eastern barn owls presented for treatment to the Currumbin Wildlife Hospital (CWH) by members of the public, wildlife carers, and other veterinarians in southeast Queensland between 3rd August 2010 and 31st December 2021. Patient information (patient number; admission date; sex; age; known medical history; weight; diagnosis; hospital stay length; and outcome - died, released, or in hospital) and treatment notes were collected from the recorded histories of the veterinarians at CWH during treatment and any follow up.
For the purposes of analysis, many of the responses recorded in two columns of the raw tabulated data were sorted and re-classified into set categories in order to be able to complete valid data analysis (Table 1).
Study Limitations
There were several limitations identified during the curation and analysis of the data.
- The data may have been incomplete due to a lack of standardized recording, exacerbated by time constraints and different staff completing the records. Incomplete records meant that outcome data was unknown in some cases (resulting in some data being excluded and analyses losing power) or in the records of some birds been mis-classified.
- The small sample sizes of some categories required further collapse of categories in order to obtain meaningful interpretation.
- The data had low specificity for the cause of injuries and separates diagnoses in a way that may spread injuries from the same source into different categories. For example, some motor vehicle injuries result in soft tissue trauma and some environmental interactions such as window impact can result in bone fractures. This introduces bias into the data collection since uncertainty in classification can lead to errors in analysis and interpretation of data.
- The practical difficulties of identifying age and sex in this species, combined with incomplete records, meant that the age and sex of many birds could not be accurately determined at the time of examination. Records of sex identification were incomplete to the extent this was excluded from the study.
- The data may not be a true measure of population dynamics as it was derived from a single wildlife hospital, and so it is not inclusive of any birds that were treated elsewhere or not presented for care.
3. Results
Seasonality
Our study showed that, in Southeast Queensland, season is strongly associated with the number of admissions, with 48.6% of barn owl admissions occurring during spring and a combined total of 80% of admissions occurring in winter and spring in southeast Queensland. (Figure 1).
Age
Although adults made up the vast majority of admitted patients (Fig 2) both overall and in any season, there did not appear to be a seasonality association with age (p = 0.1655, odds ratio = 2.63). Age did not appear to be related to any other category (Table 2). This could represent a recording bias, as it can be difficult to differentiate age groups in this species. (Table 3, Figure 2 and Figure 3)
Reason for Admission
The most common reason for admission was ‘ground find’ (45.87%), followed by ‘animal attack’ (26.21%) and ‘human activity’ (21.35%), (Figure 4).
There was a statistically significant component of seasonality to the reason for admission (χ2 = 31.16df = 9, p = 0.0003) (Table 2). As shown in Table 4 and Figure 5, ‘ground finds’ were most common in winter and spring, but relatively uncommon in summer and autumn. Animal attacks were most common in spring, followed by winter, but uncommon in summer and winter. Human activities were a common cause of admission in summer, but less so in the rest of the year.
Diagnosis
Although approaching significance (χ2 = 11.85, df = 6, p = 0.0654), the reason for admission did not share a statistically significant relationship with diagnosis. As seen in the frequency distribution graphed in Table 5 and Figure 6, each reason for admission had similar rates of diagnosis with ‘other’ which contains diagnoses such as neurological and weakness having the highest rates of admission, except for animal attack where soft tissue had the highest admission frequency.
Outcome
The overall frequency of outcomes after presentation (Figure 8) showed that 46.61% of all admissions died or were euthanased, 36.17% were released to wildlife carers (final outcome unknown), and 13.83% were released into the environment by CWH staff.
There was a moderately strong relationship identified between admission history and outcome (χ2 = 9.427, df = 3, p = 0.0241). (Table 7, Figure 10)
Diagnosis was also a very strong predictor of outcome regardless if compared only by whether they died or were released (Table 8a, Figure 10a) (χ2 = 60.39, df = 2, p < 0.0001) or if compared by manner of death or release (Table 8b, Figure 10b) (χ2 = 60.39, df = 2, p < 0.0001).
There was a close, but not significant, association between season and outcome. Despite this, approximately 50% of deaths occur in spring as opposed to the rest of the year, when there is a higher frequency of release. (Table 9, Figure 11)
The difference between death and release within each diagnosis was examined and demonstrated significant differences which are reflected in Table 8b. Not surprisingly, owls that survive triage and initial stabilisation spend significantly more time in care compared to those who were euthanased or died shortly after admission.
Once admitted and diagnosed, stay length varied significantly according to both outcome (p < 0.0001, t = 11.61, r2 = 0.2598) and diagnosis. The median stay lengths for the different diagnoses were compared and revealed that fractures have shorter stay lengths when compared to both soft tissue injuries (p < 0.0001, U = 3457, n = 232) and other injuries (p < 0.0001, U = 5453, n = 273) (Figure 12), however there was no significant difference (p = 0.2097, U = 7919, n = 267) between stay lengths of soft tissue and other injuries.
Statistically, outcome did not have a significant association with season (χ2 = 20.67, df = 12, p = 0.0554) however this was only marginally removed, with approximately 50% of deaths occurring in spring as opposed to the rest of the year.
4. Discussion
Barn owls, while globally common, can be subject to localized depletion, but how much of this population decline is a naturally occurring event, or a result of anthropogenic activities, is unknown. This study suggests that anthropogenic activities may cause an unnatural, localized depletion of barn owls.
This study demonstrated that there is strong evidence for a seasonality trend in the number of admissions of barn owls to veterinary hospitals, with most cases presented over winter and spring. We postulate that the seasonality displayed in the number and type of admissions reflects the reproductive biology of barn owls. While they can be opportunistic breeders, in subtropical regions (such as Australia) low rainfall is a significant determinant of foraging and nesting, with most breeding occurring in the dry season [1,3,7,8]. In southeast Queensland, the dry season is winter and spring (May to November), so it would be reasonable to expect that adult barn owls in southeast Queensland are likely to be more active at this time as they court, nest, mate, and raise offspring (requiring extended hunting time) and that juvenile owls lack the level of flying skills needed to avoid environmental obstacles such as cars and fences. This in turn would potentially result in greater risk exposure, leading to increased admissions to veterinary clinics. This result corresponds to previous findings [9,10,11,12]. As the CWH sees a combined total of 80% of barn owl admissions occurring in winter and spring, it would appear this hypothesis is correct.
Surprisingly, there was little association between season and age as a predictor for admission history, diagnosis, and outcome. Since adults tend to range further into urbanized regions [13,14], placing them more at risk of catastrophic injury, it would be expected that they would be more likely to be presented for care at wildlife hospitals [15]. While adult birds were admitted at a higher frequency than subadults, this could be a recording bias (confusing adults and subadults) or an admission bias, as fledglings and juvenile birds do not travel as far from the nest [16,17]. As nesting sites are typically away from overt human activity, it is unlikely that dead or injured juveniles would be presented for veterinary care. It is possible that by adding data from other facilities where barn owls are treated, we may be able to increase the power of the analyses in terms of morbidity and mortality. Given that barn owls occupy a niche that will potentially be increasingly developed over time, access to this data will be invaluable for ecological analysis [18].
The hunting behavior of barn owls requires a low-lying, flat, open habitat such as grasslands, farmland, and peri-urban habitats [1,3,9,18]. With increasing urbanization in southeast Queensland, it appears that barn owls are being increasingly concentrated into peri-urban areas as farms and re-zoned residential areas, where such habitats become less common and smaller [4,18]. Although (at first) they appear to have adapted well to urbanization [19], this habitat preference places them at risk from many human activities such as vehicles, rodent control, predation by domestic pets, and land clearing (which often results in the loss of roosting trees) [9,10,11], [14]. Other threats include competition for resources from other animals (such as parrots and marsupials) displaced by anthropogenic activity [20], and intermittent localized declines in food availability e.g., the collapse of a rodent population following a mouse plague [10].
We hypothesize that these habitat changes should increase the number of traumatic injuries as barn owls come into contact with fences, powerlines, household pets, and motor vehicles, especially as they are less reliant on vision while flying. Our study supports this hypothesis, with traumatic musculoskeletal injures more common in the active breeding season.
The diagnosis and outcome cannot be predicted by the reason for admission, but the diagnosis can be expected to predict the outcome. Although the association between season and outcome was close, it was not significant. Despite this, approximately 50% of deaths occur in spring as opposed to the rest of the year seeing higher frequencies of release than death.
The CWH triages all patients on admission, euthanasing those with a hopeless prognosis for rehabilitation and release. Those animals with a fair to good prognosis are admitted for ongoing care, including surgery. Outcomes after admission are death (euthanasia or as a result of injuries / disease), transfer to wildlife carers (who may or may not provide feedback on outcomes) for long term rehabilitation and release, or hard release by hospital staff.
Barn owls that survive triage and initial stabilization spend significantly more time in care compared to those who were euthanased or died shortly after admission. Although the median stay length is only 4 days, of the 119 barn owls that were admitted for hospital care, the median stay in care was 269 days. Road traumas do not always present as fractures, and soft tissue injuries such as ocular lesions may hinder the bird’s ability to hunt [21]. The median stay length of birds with soft tissue injuries were similar to those with fractures.
Within the scope of this study, we cannot make inferences beyond identifying that diagnosis is likely to be a predictor of death in barn owls admitted to veterinary care. When one considers that previous studies, like our own, have found the majority of injuries are fractures and that those fractures are mostly from road accidents [15], it makes sense that catastrophic injury has a positive relationship with predicting death. This is an important finding for the purposes of our study, as it further cements the need to try to mitigate injuries from interactions between barn owls and human activities and as dwellers of peri-urban and grassland habitats, in the context of ever-expanding urbanization, planning is the best prevention.
An unexpected finding in our study was that age was not a predictor of admission history, diagnosis, and outcome since adults tend to range further into urbanized regions, placing them more at risk of catastrophic injury [13,14]. The frequencies of diagnosis showed an even spread between diagnoses around 30% of each for adults and 3% of each for subadults and we know that there were approximately ten times2 more adults admitted than subadults, so the lack of association is probably real. When compared by age, and the frequencies of outcome follow a similar pattern. Of course, as previously mentioned when discussing admission, death rates by age are difficult to quantify since many will not be found let alone reported, even if searching.
Whether comparing diagnosis to a condensed outcome of either death or recovery, we see a very significant relationship between the two variables, and we again see evidence for a relationship when utilizing all of the categorical labels in outcome (spontaneous death, euthanasia, unclassified death, released to environment, released to care). Delving deeper into this, we found that while diagnosis did not have a relationship with whether barn owls are released straight from the clinic back to the environment or whether they were released to care (either with a carer or in the raptor aviary at CWS) there was a significant relationship with whether death was while in care, via humane euthanasia, or an unidentified cause (a reporting issue).
Future directions
Predator density in any geographical region tends to be low; when the animal in question is also nocturnal and cryptic, gathering information about population wellbeing is especially difficult [23]. Retrospective studies may be the only practical means for obtaining such information relating to population morbidity and mortality. This study correlates well with previously published necropsy investigations into deaths in barn owls from Australia and the United Kingdom [10,11,12], which found that many deaths are associated with motor vehicle impacts, and that there was a component of seasonality attached, likely aligned with the breeding season.
Retrospective necropsy studies, which are both objective and quantitative, may offer a better measure of causes of mortality than retrospective clinical studies due to incomplete or incorrect data can lead to errors in analysis and interpretation. Defining categories and outlining classification methods for recording staff would contribute to uniformity of recording and better data for analysis. However, necropsy studies, by definition, do not include live animals, and so may be incomplete in the depth and breadth of the data collected.
We speculate that the way our data was categorized may not allow us to make proper inferences about how often human activities were actually involved in the injuries sustained. If we could more accurately link road-related injuries with a certain time of year or pressure, then perhaps recommendations could be made to councils about how to help negate this occurrence. Certainly, we were encouraged to see that there was a component of seasonality to both admission and diagnosis as expected, although we cannot say whether this followed foraging pressure or some other variable within the scope of this study, perhaps in the future this can be ascertained.
Unfortunately, sex as a determinant of outcomes after admission to CWH was expected to give a lot of insight into the life of eastern barn owls of southeast Queensland , we wanted to determine the shape of the relationship for both males and females, how they compared to each-other and how it compared to overall distribution of wild barn owls in the region. Without a significant portion of the data, we were unable to explore this and if this data can be properly recorded in future this is likely to be a valuable investigation.
A more targeted study of ecological changes over time would also be interesting and potentially useful for town planning as urban areas begin to encroach on grassland and farmland habitat, the animals are known to be increasingly restricted in viable hunting land. Sampling from more veterinary facilities to gain a perspective on whether new roads and incursion of suburban sprawl increases motor vehicle accidents, for instance, which may help with council planning of ecological corridors designed to provide hunting areas away from roads so we can attempt to mitigate traumas.
Ecological surveys of feeding behavior in southeast Queensland would also potentially yield important insights into conservation of sufficient DNA variability from breeding pairs. While barn owls are currently rated as least concern, they are important apex predators of small mammals and lizards, and continuing a sustainable population is in the best interest of everyone.
5. Conclusions
The information collected by CWH over the last decade shows that there is a seasonal association for barn owl admissions, and an association between the diagnosis and outcome. This seasonal association reflects the barn owl breeding season, suggesting that the increased activity by both adults and juveniles may result in more injuries and disease.
There may be a seasonal association with the age and sex of patient admissions, but the practical difficulties in identifying this in the individual bird makes it difficult to be confident in stating this association.
Treatment of injured barn owls is possible even (when they have sustained fractures) and they can and do return to the wild with a median time in care of under one year.
The information collected and collated by CWH is an important source of data that might aid town and road planning, so that even as urbanization encroaches into their territory councils might have a chance to create mitigation strategies to hopefully reduce the rate of injuries in the population. To aid future analyses, a formal standard operating procedure for examining the owls should be considered to collect all relevant information, making the data more robust and ensuring it can be utilized to full effect to help reduce morbidity and mortality of the species and maintain their position as important apex predators.
Author Contributions
Conceptualization, Doneley, Hicks, Hill; methodology, Hicks.; software, Hicks; validation, Doneley, Hicks, Hill; formal analysis, Hicks; investigation, Hicks and Hill.; resources, Hill; data curation, Hicks; writing—original draft preparation, Hicks; writing—review and editing, Doneley and Hill; supervision, Doneley; project administration, Doneley. All authors have read and agreed to the published version of the manuscript.
Funding
This research received no external funding
Conflicts of Interest
The authors declare no conflicts of interest.
References
- Shawyer, C. (1994). The Barn Owl. (Hamlyn Species Guides), Hamlyn, London UK.
- Taylor, I. Predator-prey relationships and conservation. Cambridge University Press, Cambridge, UK, 1994.
- Bunn D, Warburton, AB, Wilson, RDS. The Barn Owl. Ornithological Advances. 1982.; 100:4.
- Fulton G, Fulton G, Cheung YW. A comparison of urban and peri-urban/hinterland nocturnal birds at Brisbane, Australia. Pacific Conservation Biology, 2020; 239–238.
- Taylor, I. (2004). Barn Owls: Predator-prey Relationships and Conservation. Cambridge University Press.
- Kadlecova, G.; Voslarova, E.; Vecerek, V. Diurnal raptors at rescue centres in the Czech Republic: Reasons for admission, outcomes, and length of stay. PLOS ONE 2022, 17, e0279501. [Google Scholar] [CrossRef] [PubMed]
- Boyle, M.; Hone, J. Contrasting effects of climate on grey heron, malleefowl and barn owl populations. Wildl. Res. 2011, 17, 7. [Google Scholar] [CrossRef]
- Wilson, R.T.; Wilson, M.P.; Durkin, J.W. Breeding biology of the Barn Owl Tyto alba in central Mali. Ibis 1986, 128, 81–90. [Google Scholar] [CrossRef]
- Hindmarch, S.; Elliott, J.E.; Mccann, S.; Levesque, P. Habitat use by barn owls across a rural to urban gradient and an assessment of stressors including, habitat loss, rodenticide exposure and road mortality. Landsc. Urban Plan. 2017, 164, 132–143. [Google Scholar] [CrossRef]
- McOrist, S. Deaths in free-living Barn owls (Tyto alba). 1989. Avian Pathology, 18(4), 745–750.
- Newton, I.; Wyllie, I.; Asher, A. Mortality causes in British Barn Owls Tyto alba, with a discussion of aldrin-dieldrin poisoning. Ibis 1991, 133, 162–169. [Google Scholar] [CrossRef]
- Newton A,Wyllie N, Dale L. In: Duncan JR, Johnson DH, Nicholls TH. (editors). Biology and conservation of owls of the Northern Hemisphere: 2nd International symposium. Gen. Tech. Rep. NC-190. St. Paul, MN: U.S. Dept. of Agriculture, Forest Service, North Central Forest Experiment Station. 299-307.
- Westaway D, Burnett, S, Shimizu-Kimura, Y, and Srivastava, S. The distribution of forest dwelling Tyto owls in south-east Queensland: environmental drivers and conservation status. In: School of Science and Engineering University of Southern Queensland, Maroochydore, Queensland, Australia. www.environlegacy.org.au/wp-content/uploads/2020/01/Dylan-Westaway-Final-MS.pdf accessed 19/11/2024.
- Hindmarch, S.; Elliott, J.E.; Mccann, S.; Levesque, P. Habitat use by barn owls across a rural to urban gradient and an assessment of stressors including, habitat loss, rodenticide exposure and road mortality. Landsc. Urban Plan. 2017, 164, 132–143. [Google Scholar] [CrossRef]
- Couper, D.; Bexton, S. Veterinary care of wild owl casualties. Practice 2012, 34, 270–281. [Google Scholar] [CrossRef]
- Courtney J, Deebus, SJS. Observations on the Post-fledging Period of the Barn Owl Tyto alba. Australian Field Ornithology, 2006; 23, 159–162.
- Roulin A, Ducrest, A, Dijkstra, C. Effect of brood size manipulations on parents and offspring in the Barn Owl Tyro alba. Ardea -Wageningen-. 87. 91-100.
- Cooke, R.; Grant, H.; Ebsworth, I.; Rendall, A.R.; Isaac, B.; White, J.G. Can owls be used to monitor the impacts of urbanisation? A cautionary tale of variable detection. Wildl. Res. 2017, 44, 573–581. [Google Scholar] [CrossRef]
- Mo, M. Occurrence of the Eastern Barn Owl Tyto alba delicatula in the Centennial Parklands, Sydney. 2019, 36, 56–59. [CrossRef]
- Rees, J.D.; Rees, G.L.; Kingsford, R.T.; Letnic, M. Indirect commensalism between an introduced apex predator and a native avian predator. Biodivers. Conserv. 2019, 28, 2687–2700. [Google Scholar] [CrossRef]
- Williams, D.L.; Villavincencio, C.M.G.; Wilson, S. Chronic ocular lesions in tawny owls (Strix aluco) injured by road traffic. Veter- Rec. 2006, 159, 148–153. [Google Scholar] [CrossRef] [PubMed]
Figure 1.
Total admissions of barn owls to the CWH, by season.
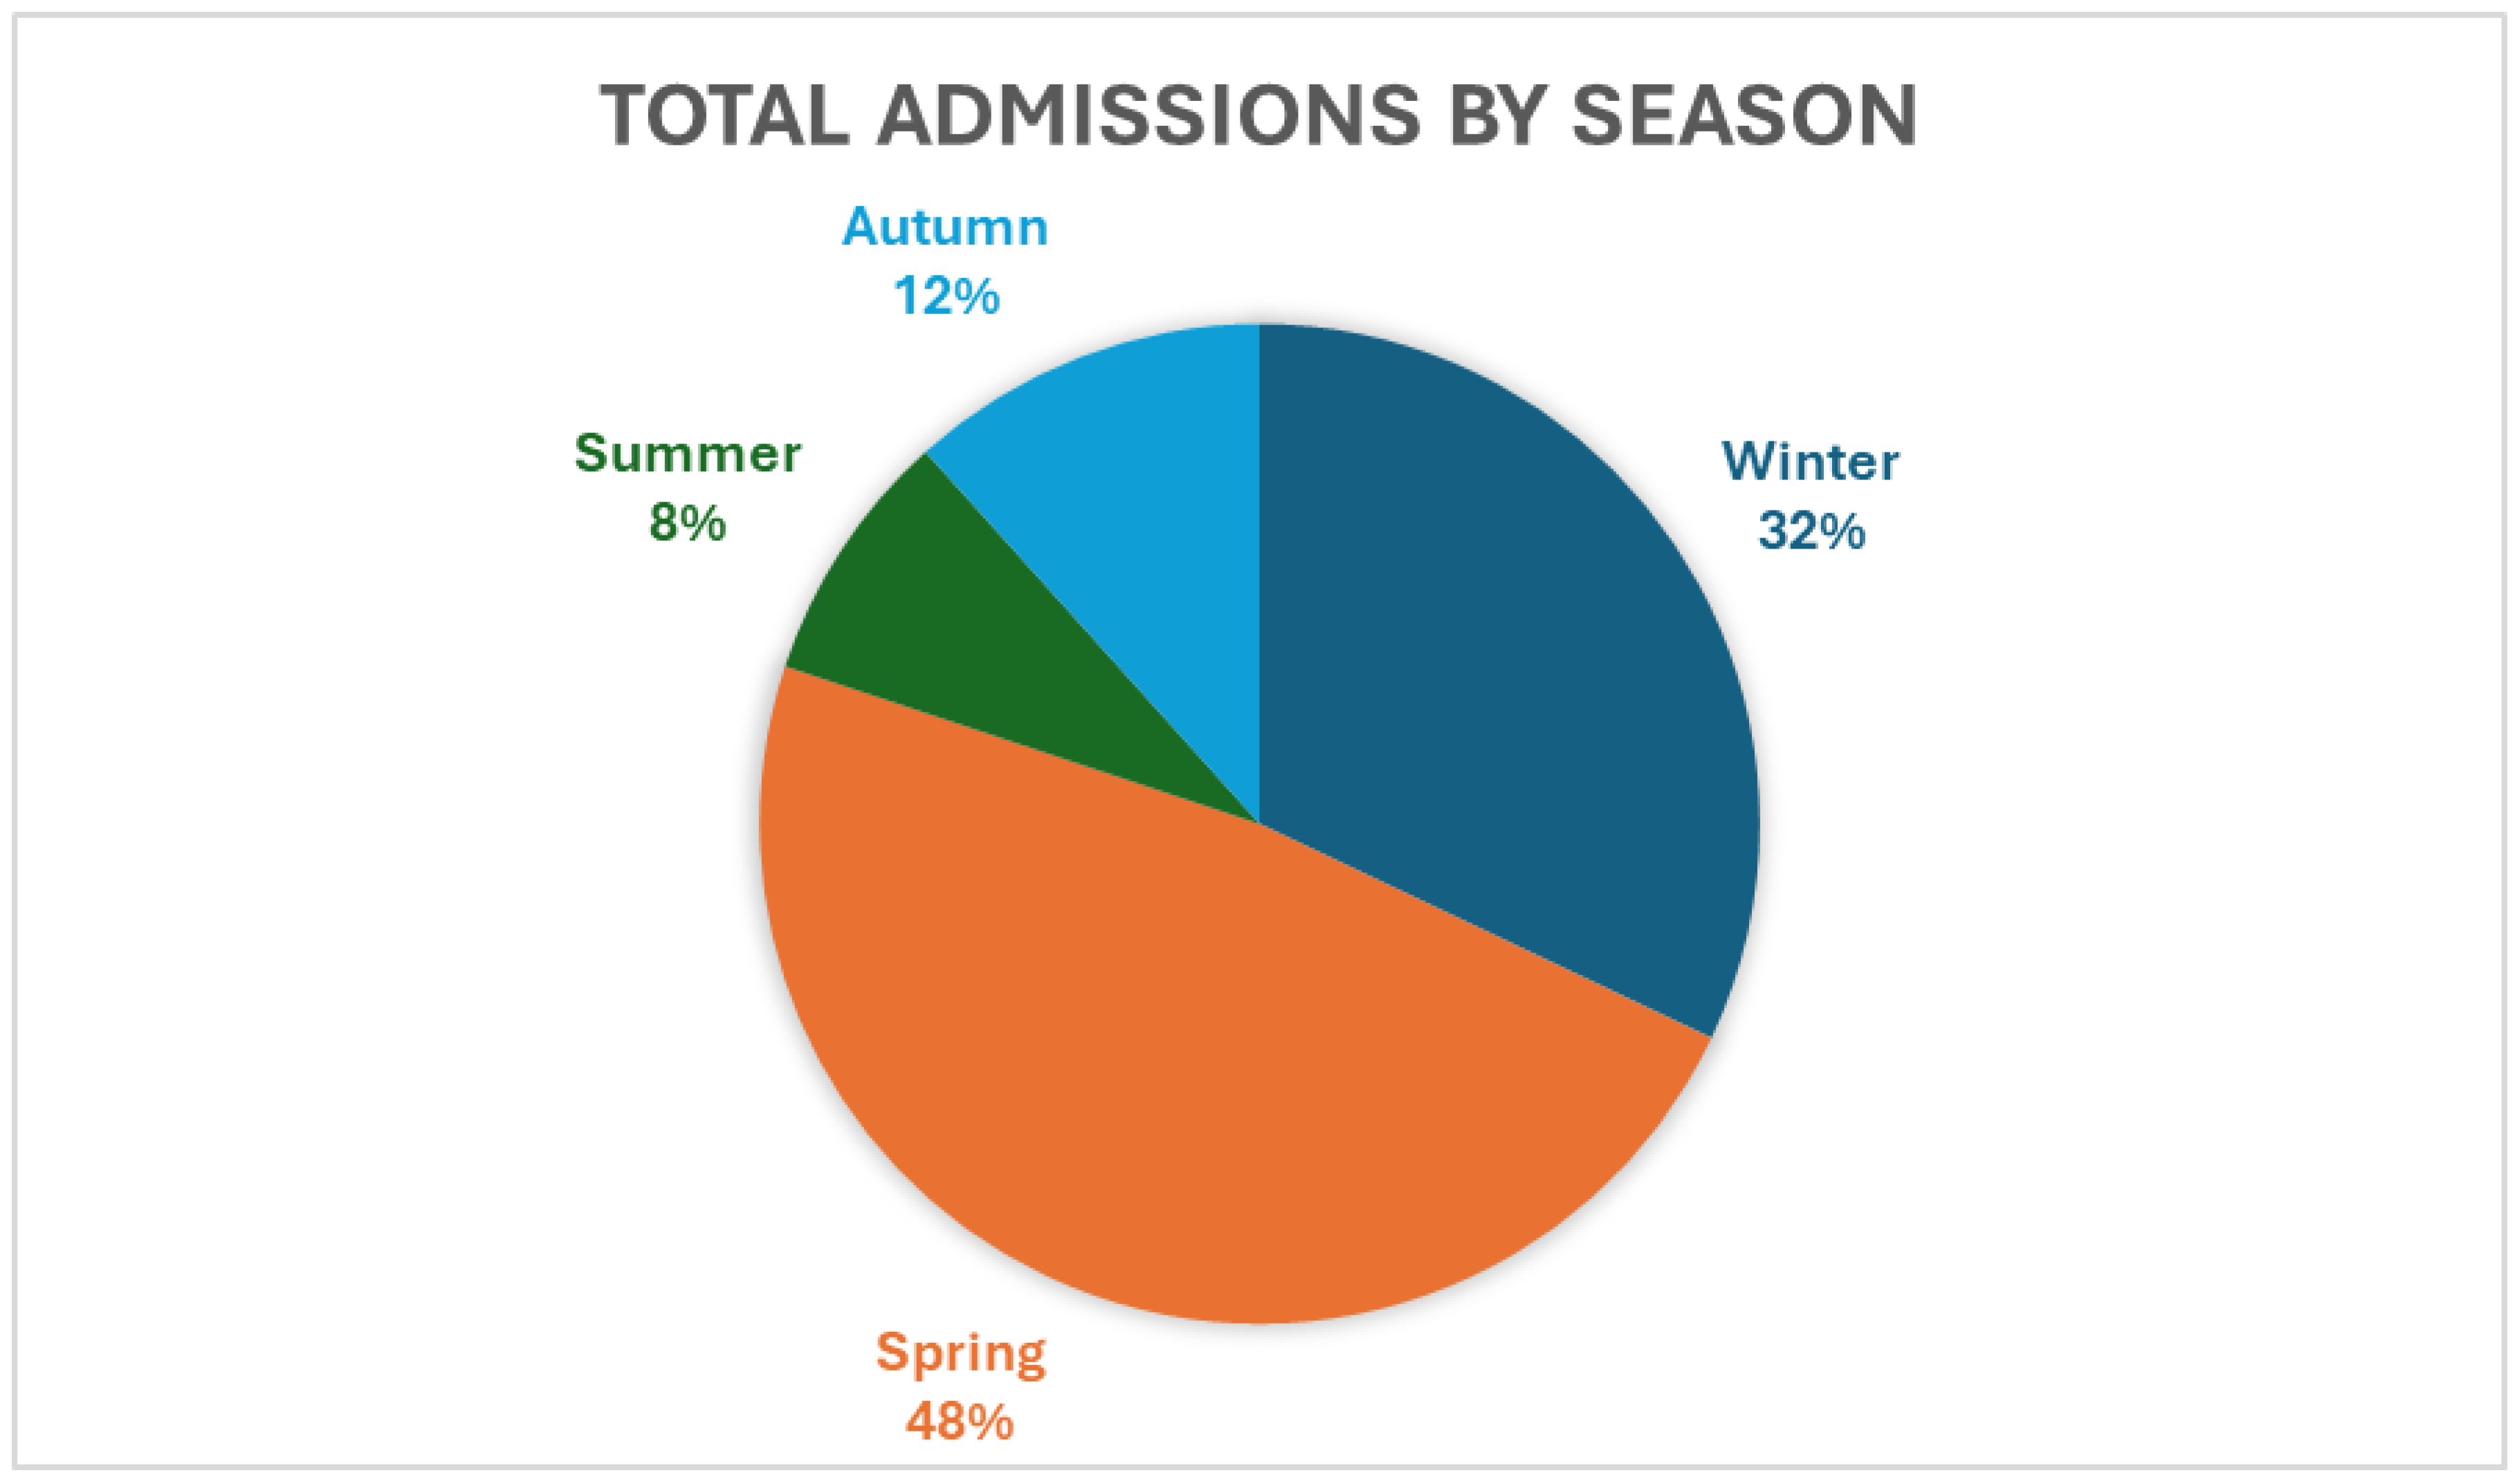
Figure 2.
Total admissions by age.
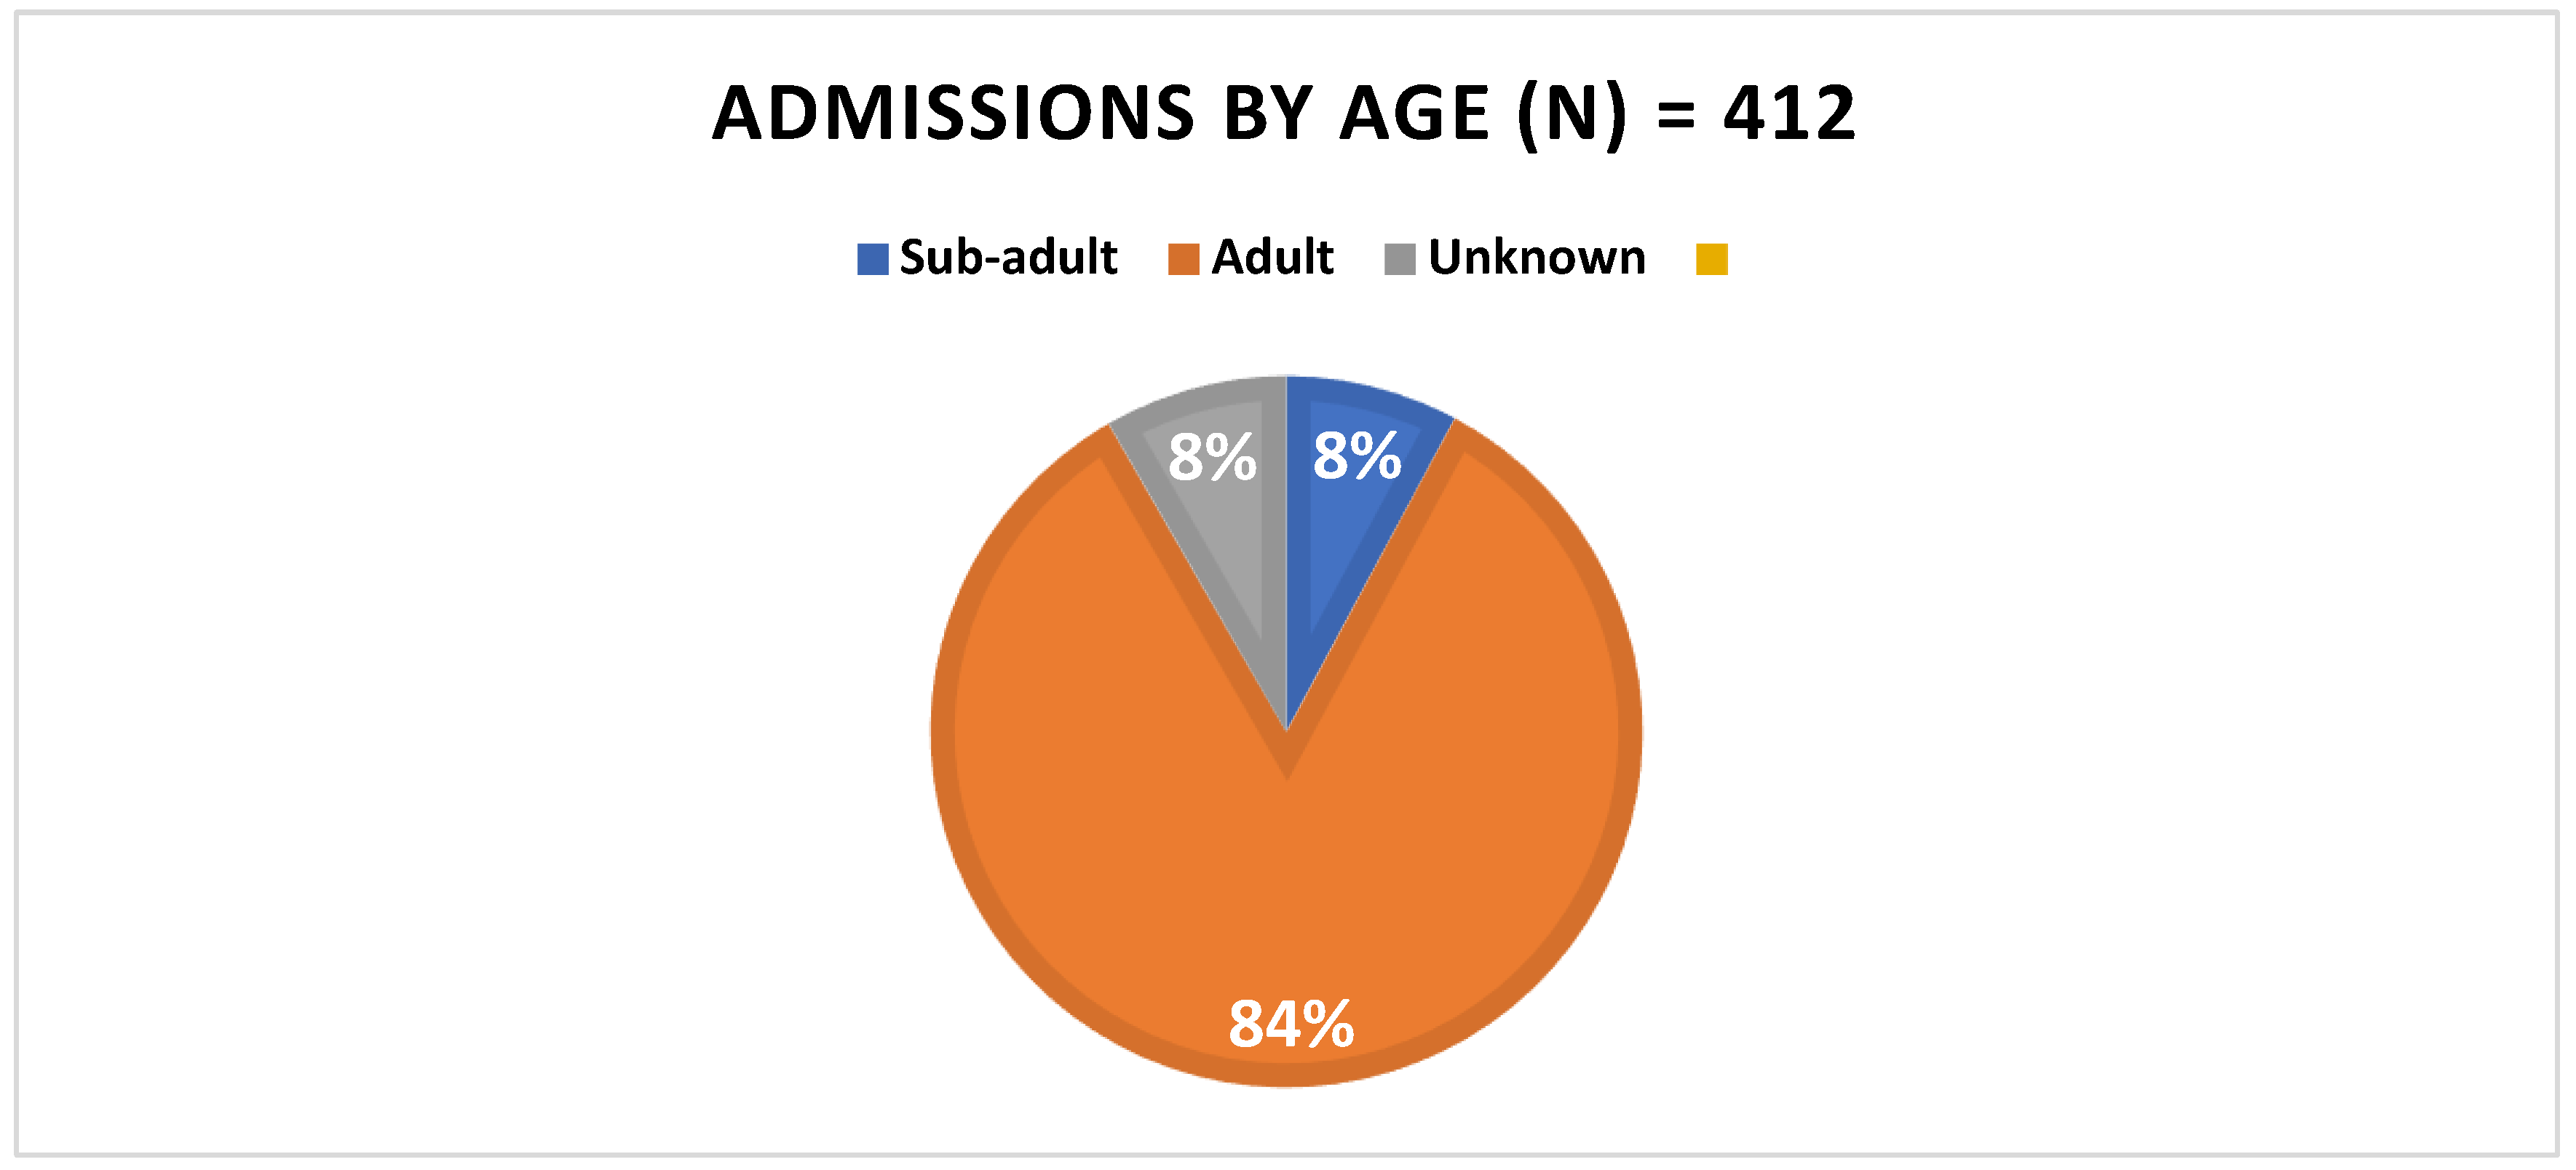
Figure 3.
Frequency of age of barn owls admitted to CWH sorted by time of year represented by season.
Figure 3.
Frequency of age of barn owls admitted to CWH sorted by time of year represented by season.
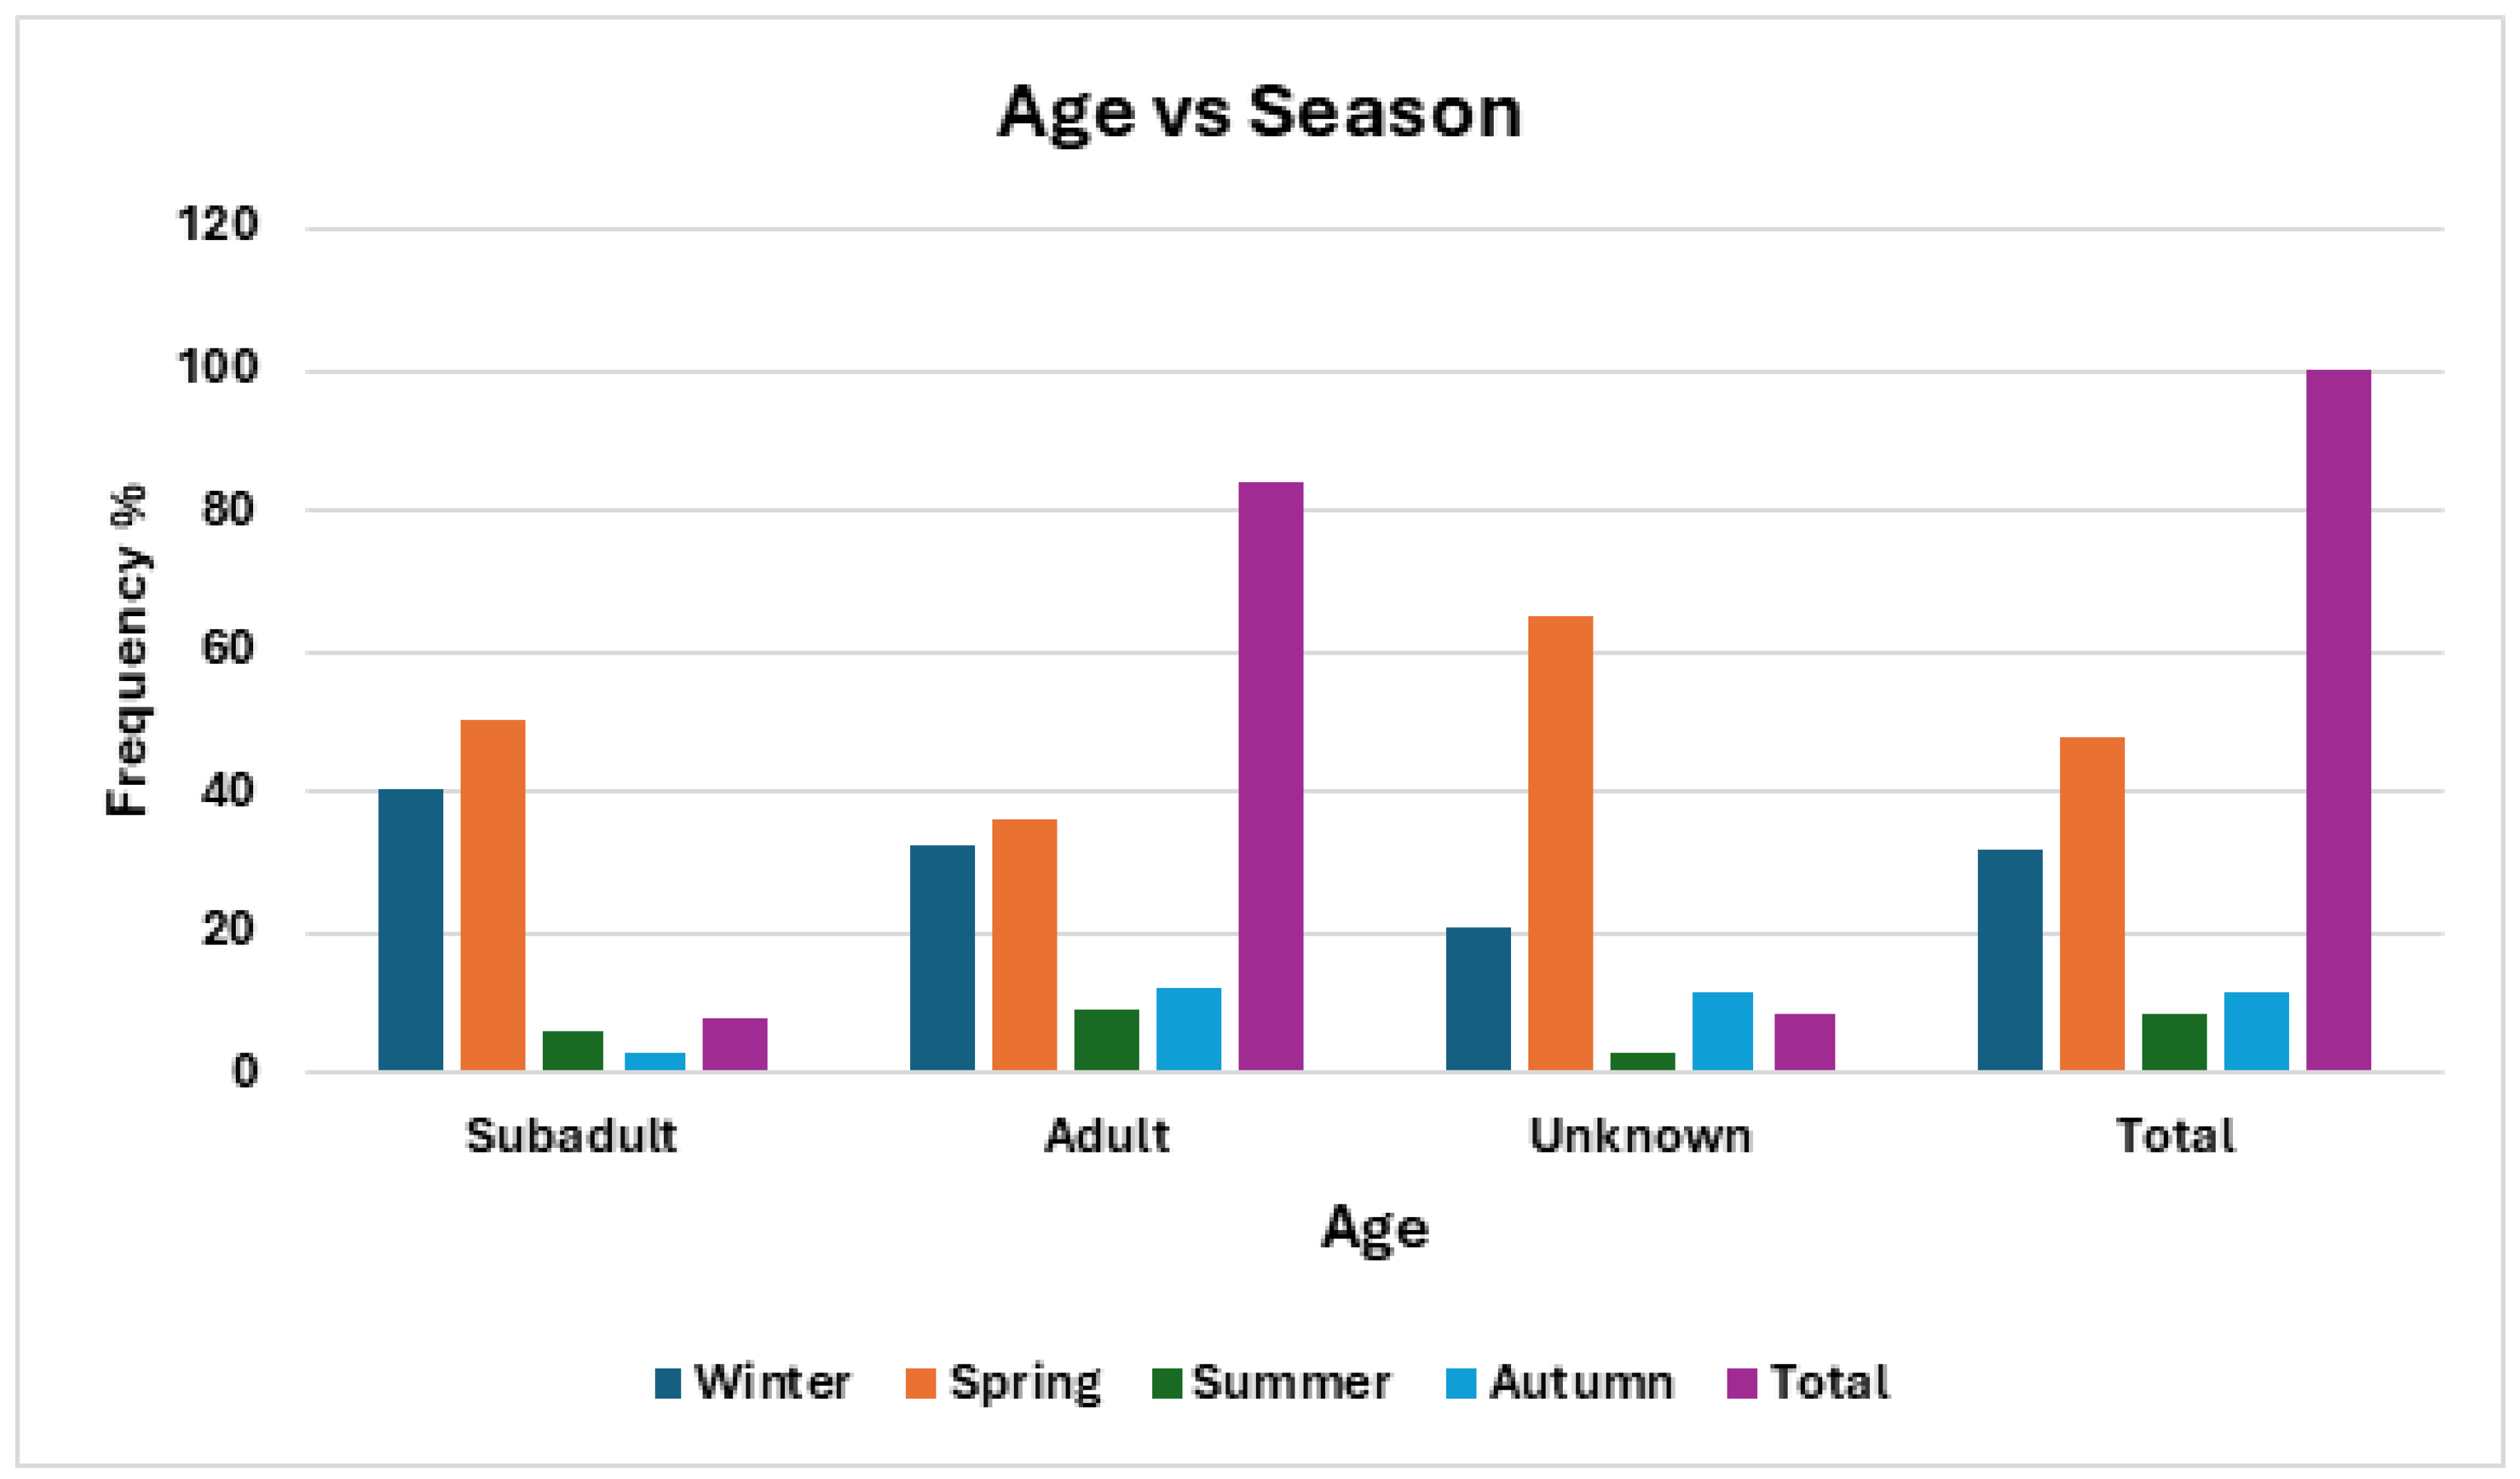
Figure 4.
Reasons for admission (total).
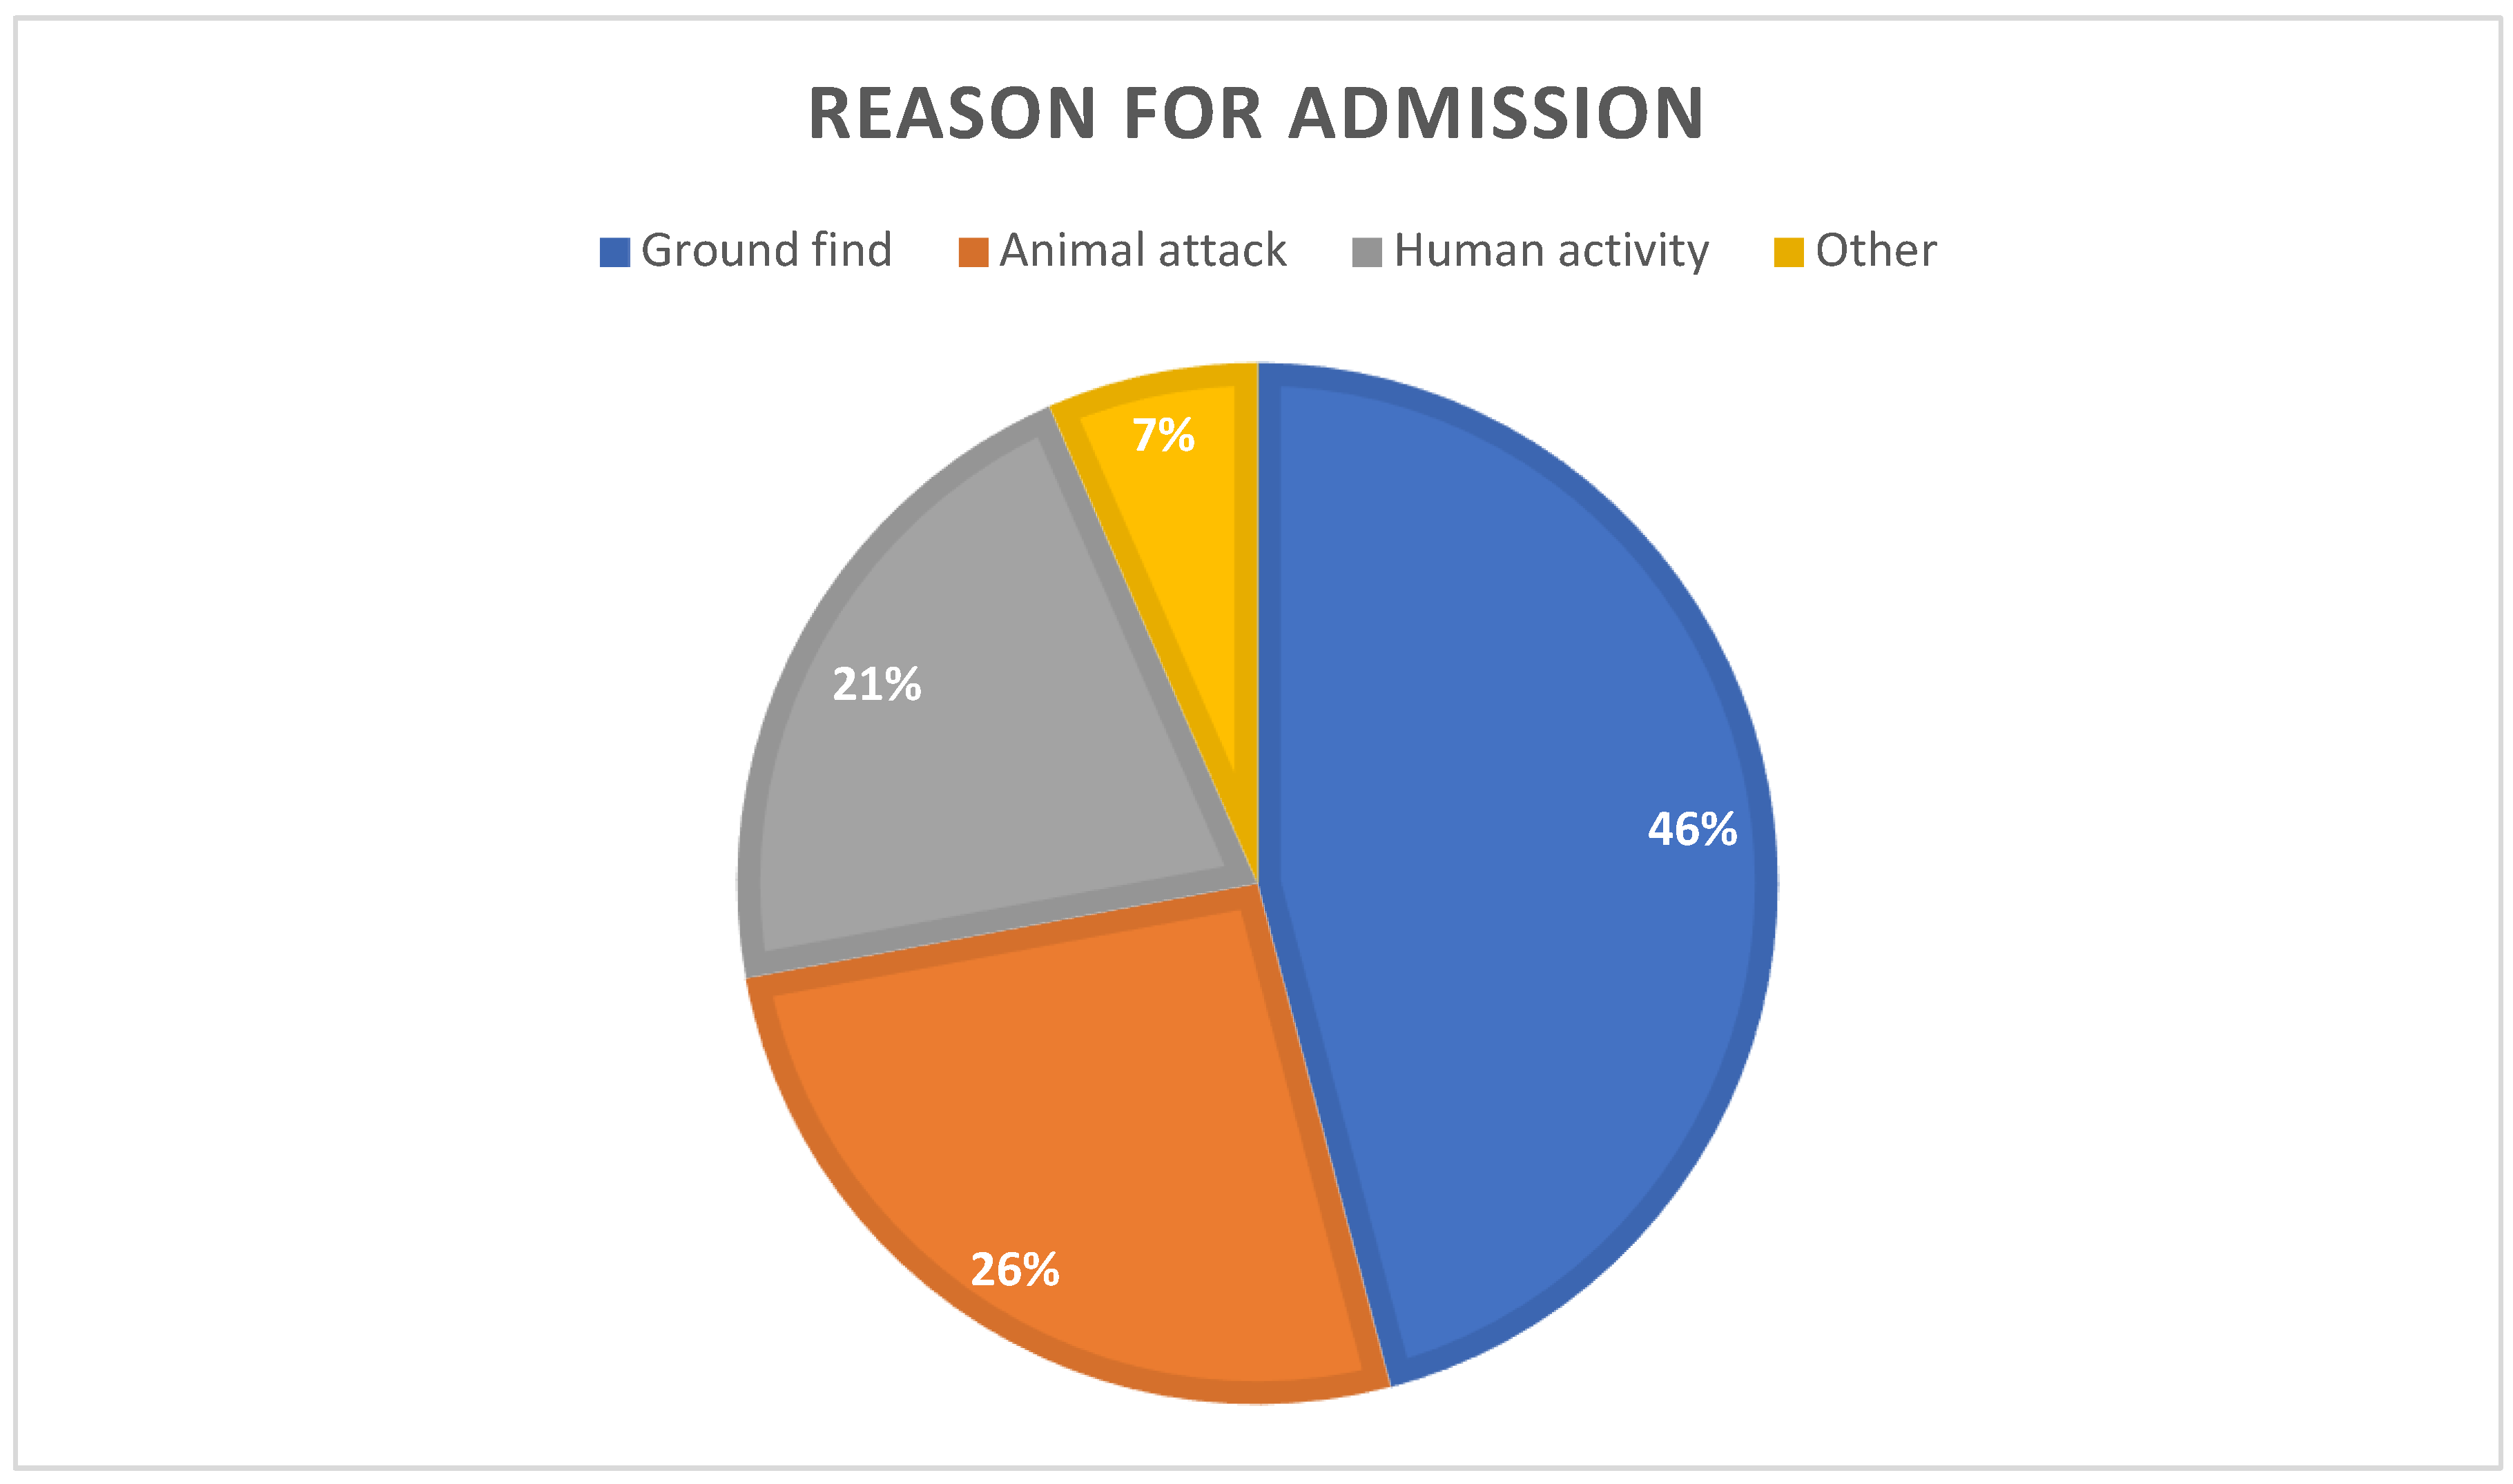
Figure 5.
Frequency percentage of barn owls admitted to CWH sorted by season and admission history categories.
Figure 5.
Frequency percentage of barn owls admitted to CWH sorted by season and admission history categories.
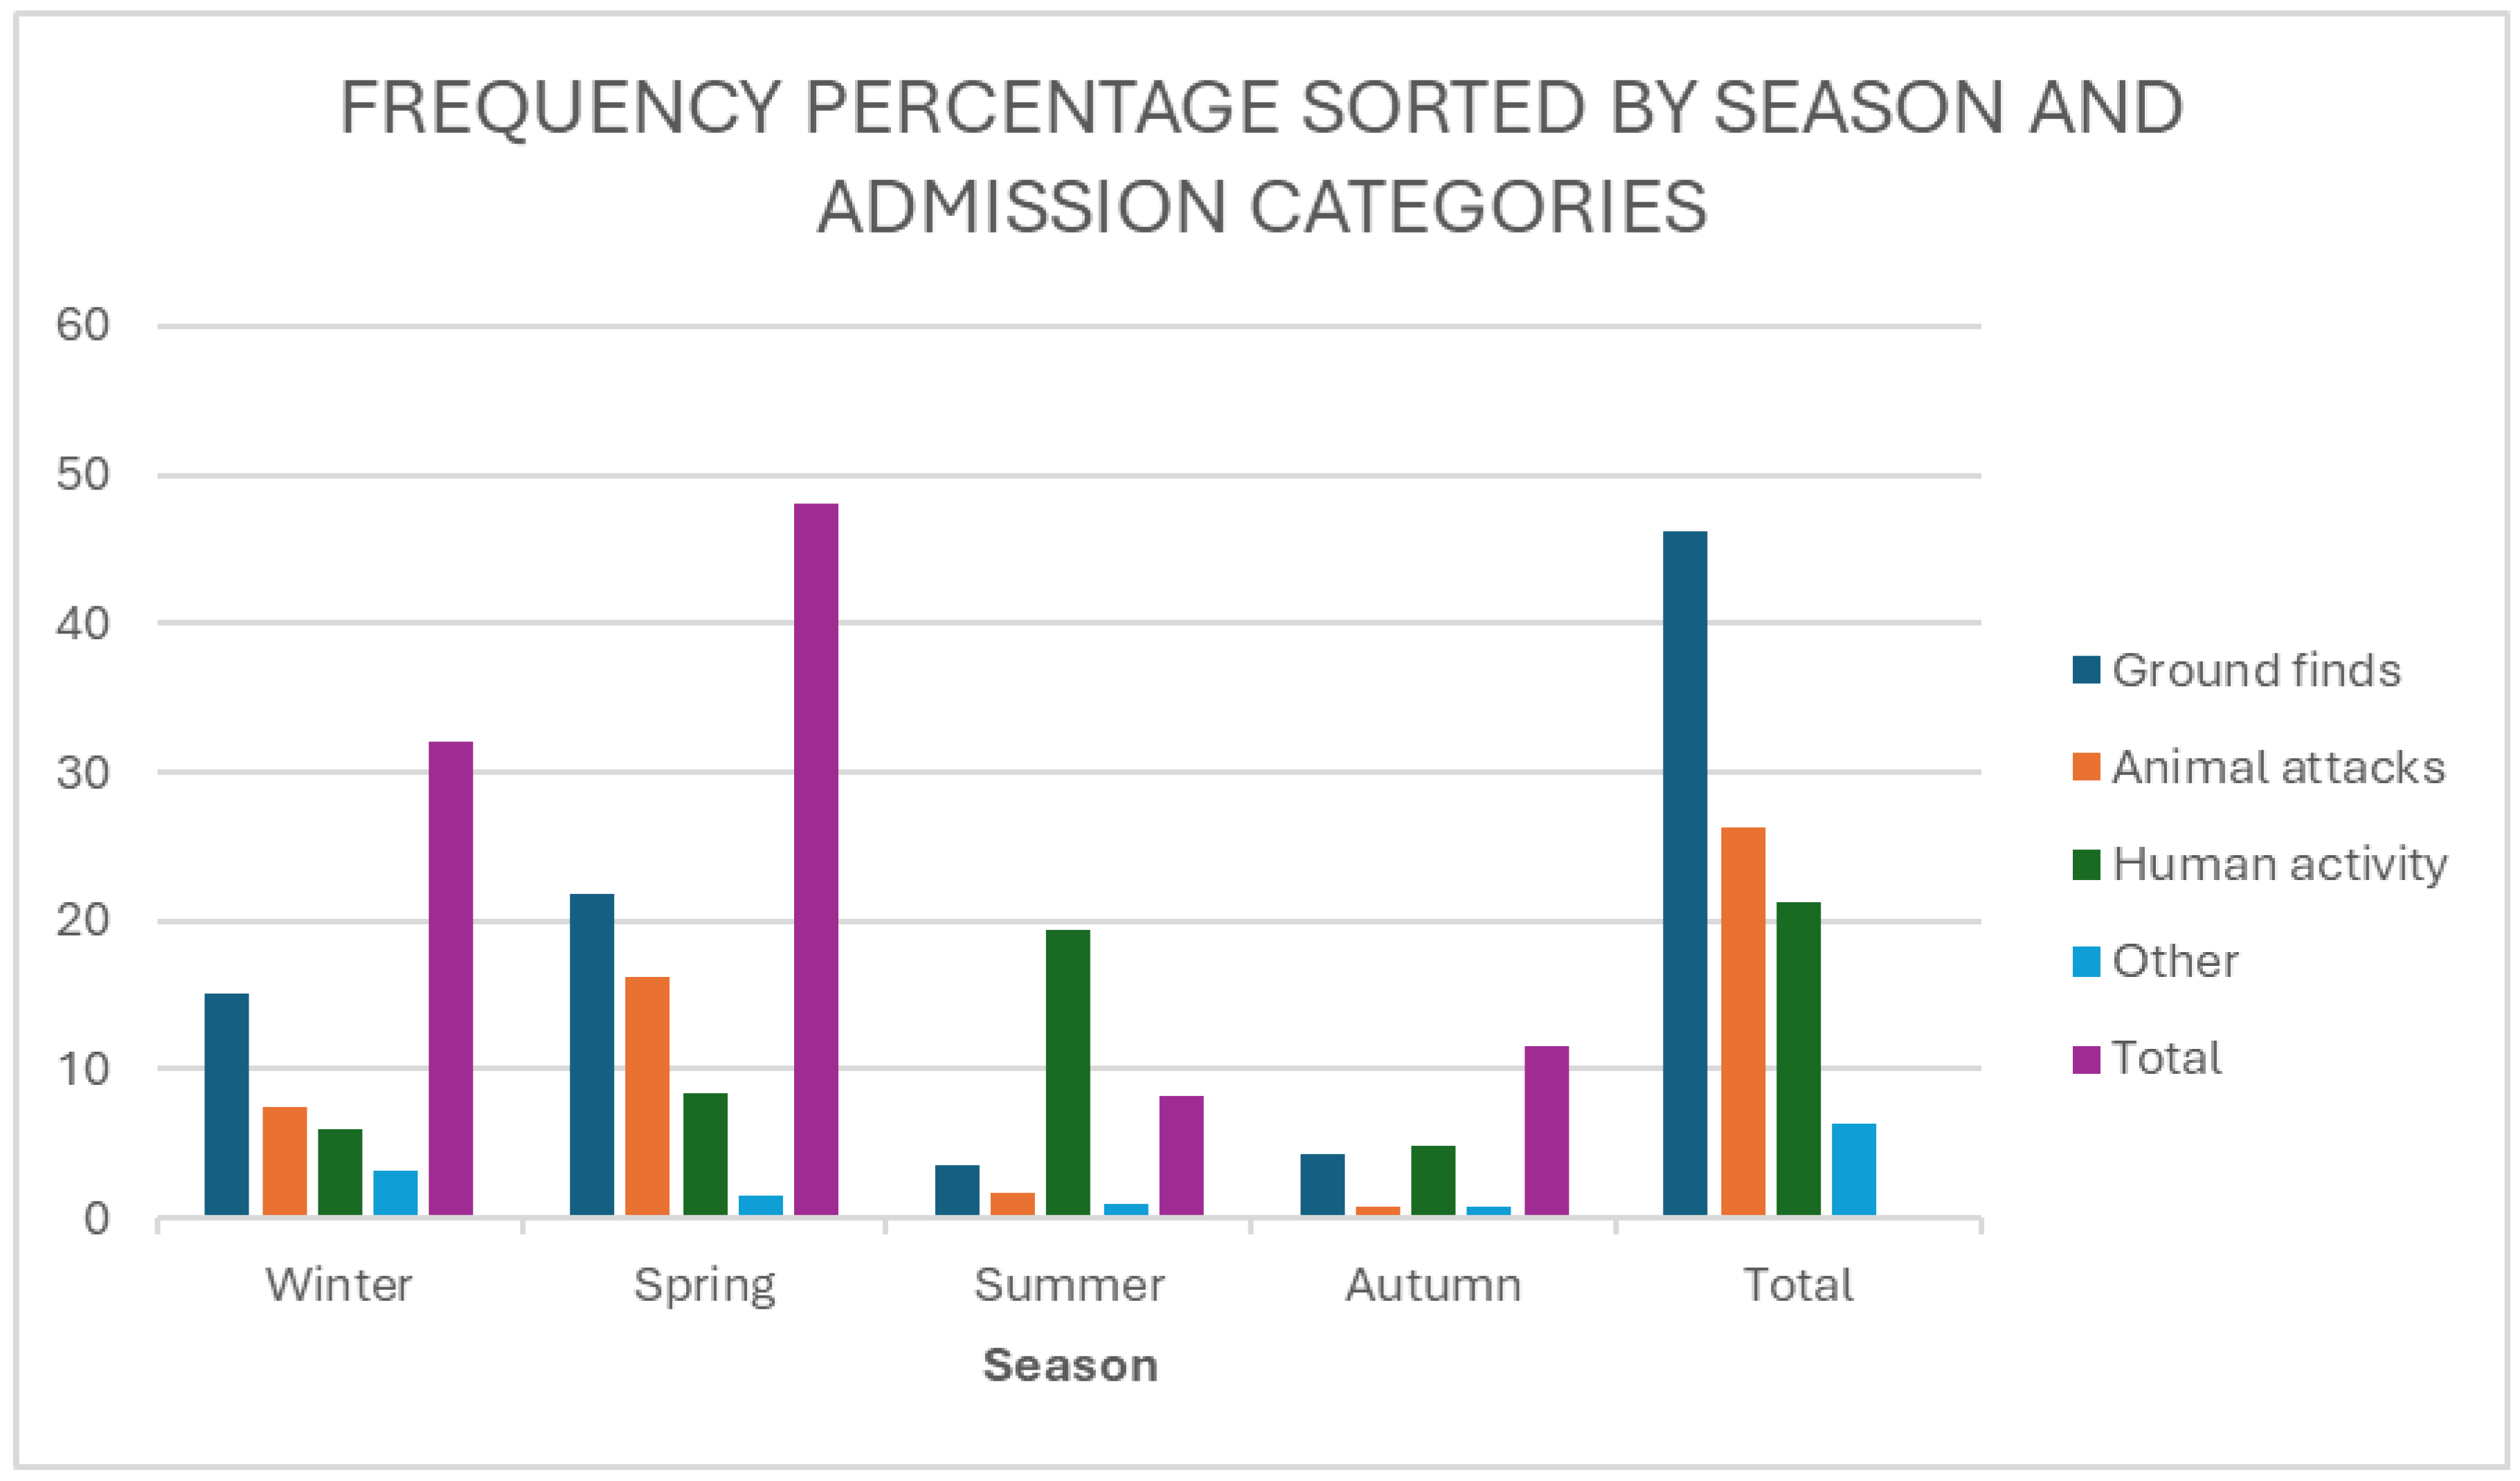
Figure 6.
Frequency of barn owls admitted to CWH sorted by admission history and Diagnosis categories.
Figure 6.
Frequency of barn owls admitted to CWH sorted by admission history and Diagnosis categories.
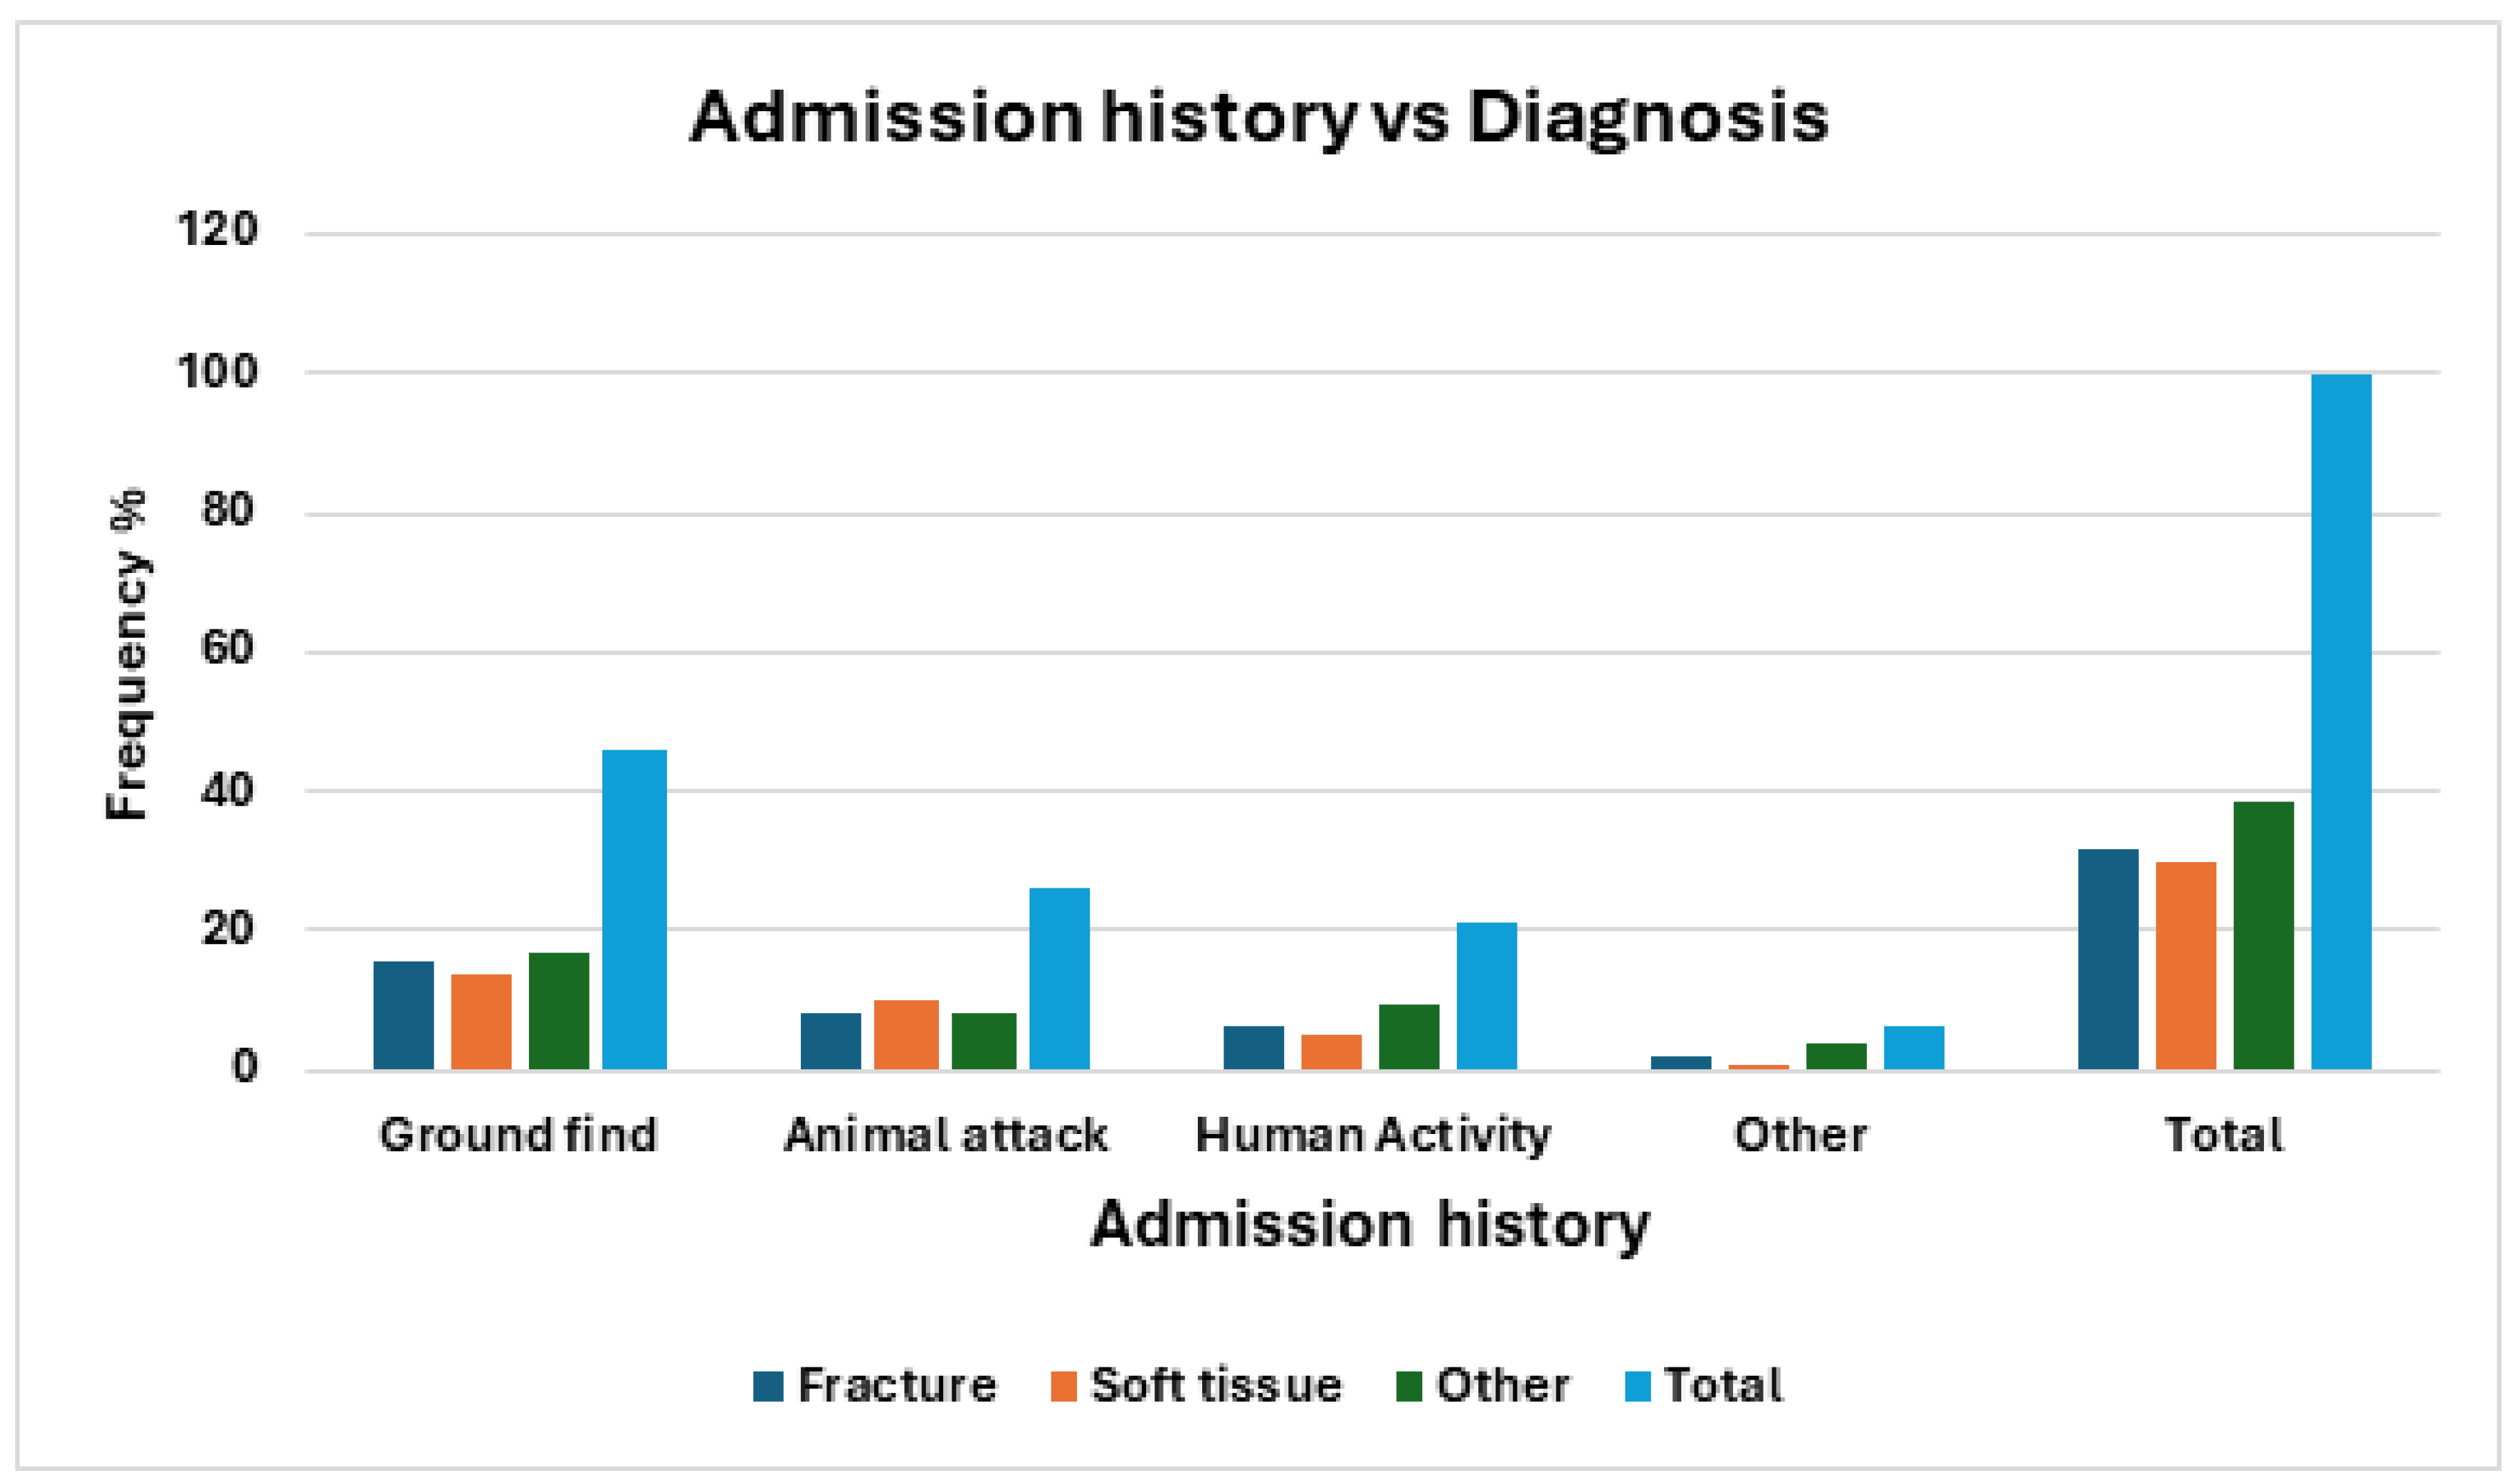
Figure 7.
Frequency of barn owls admitted to CWH sorted by season and diagnosis categories.
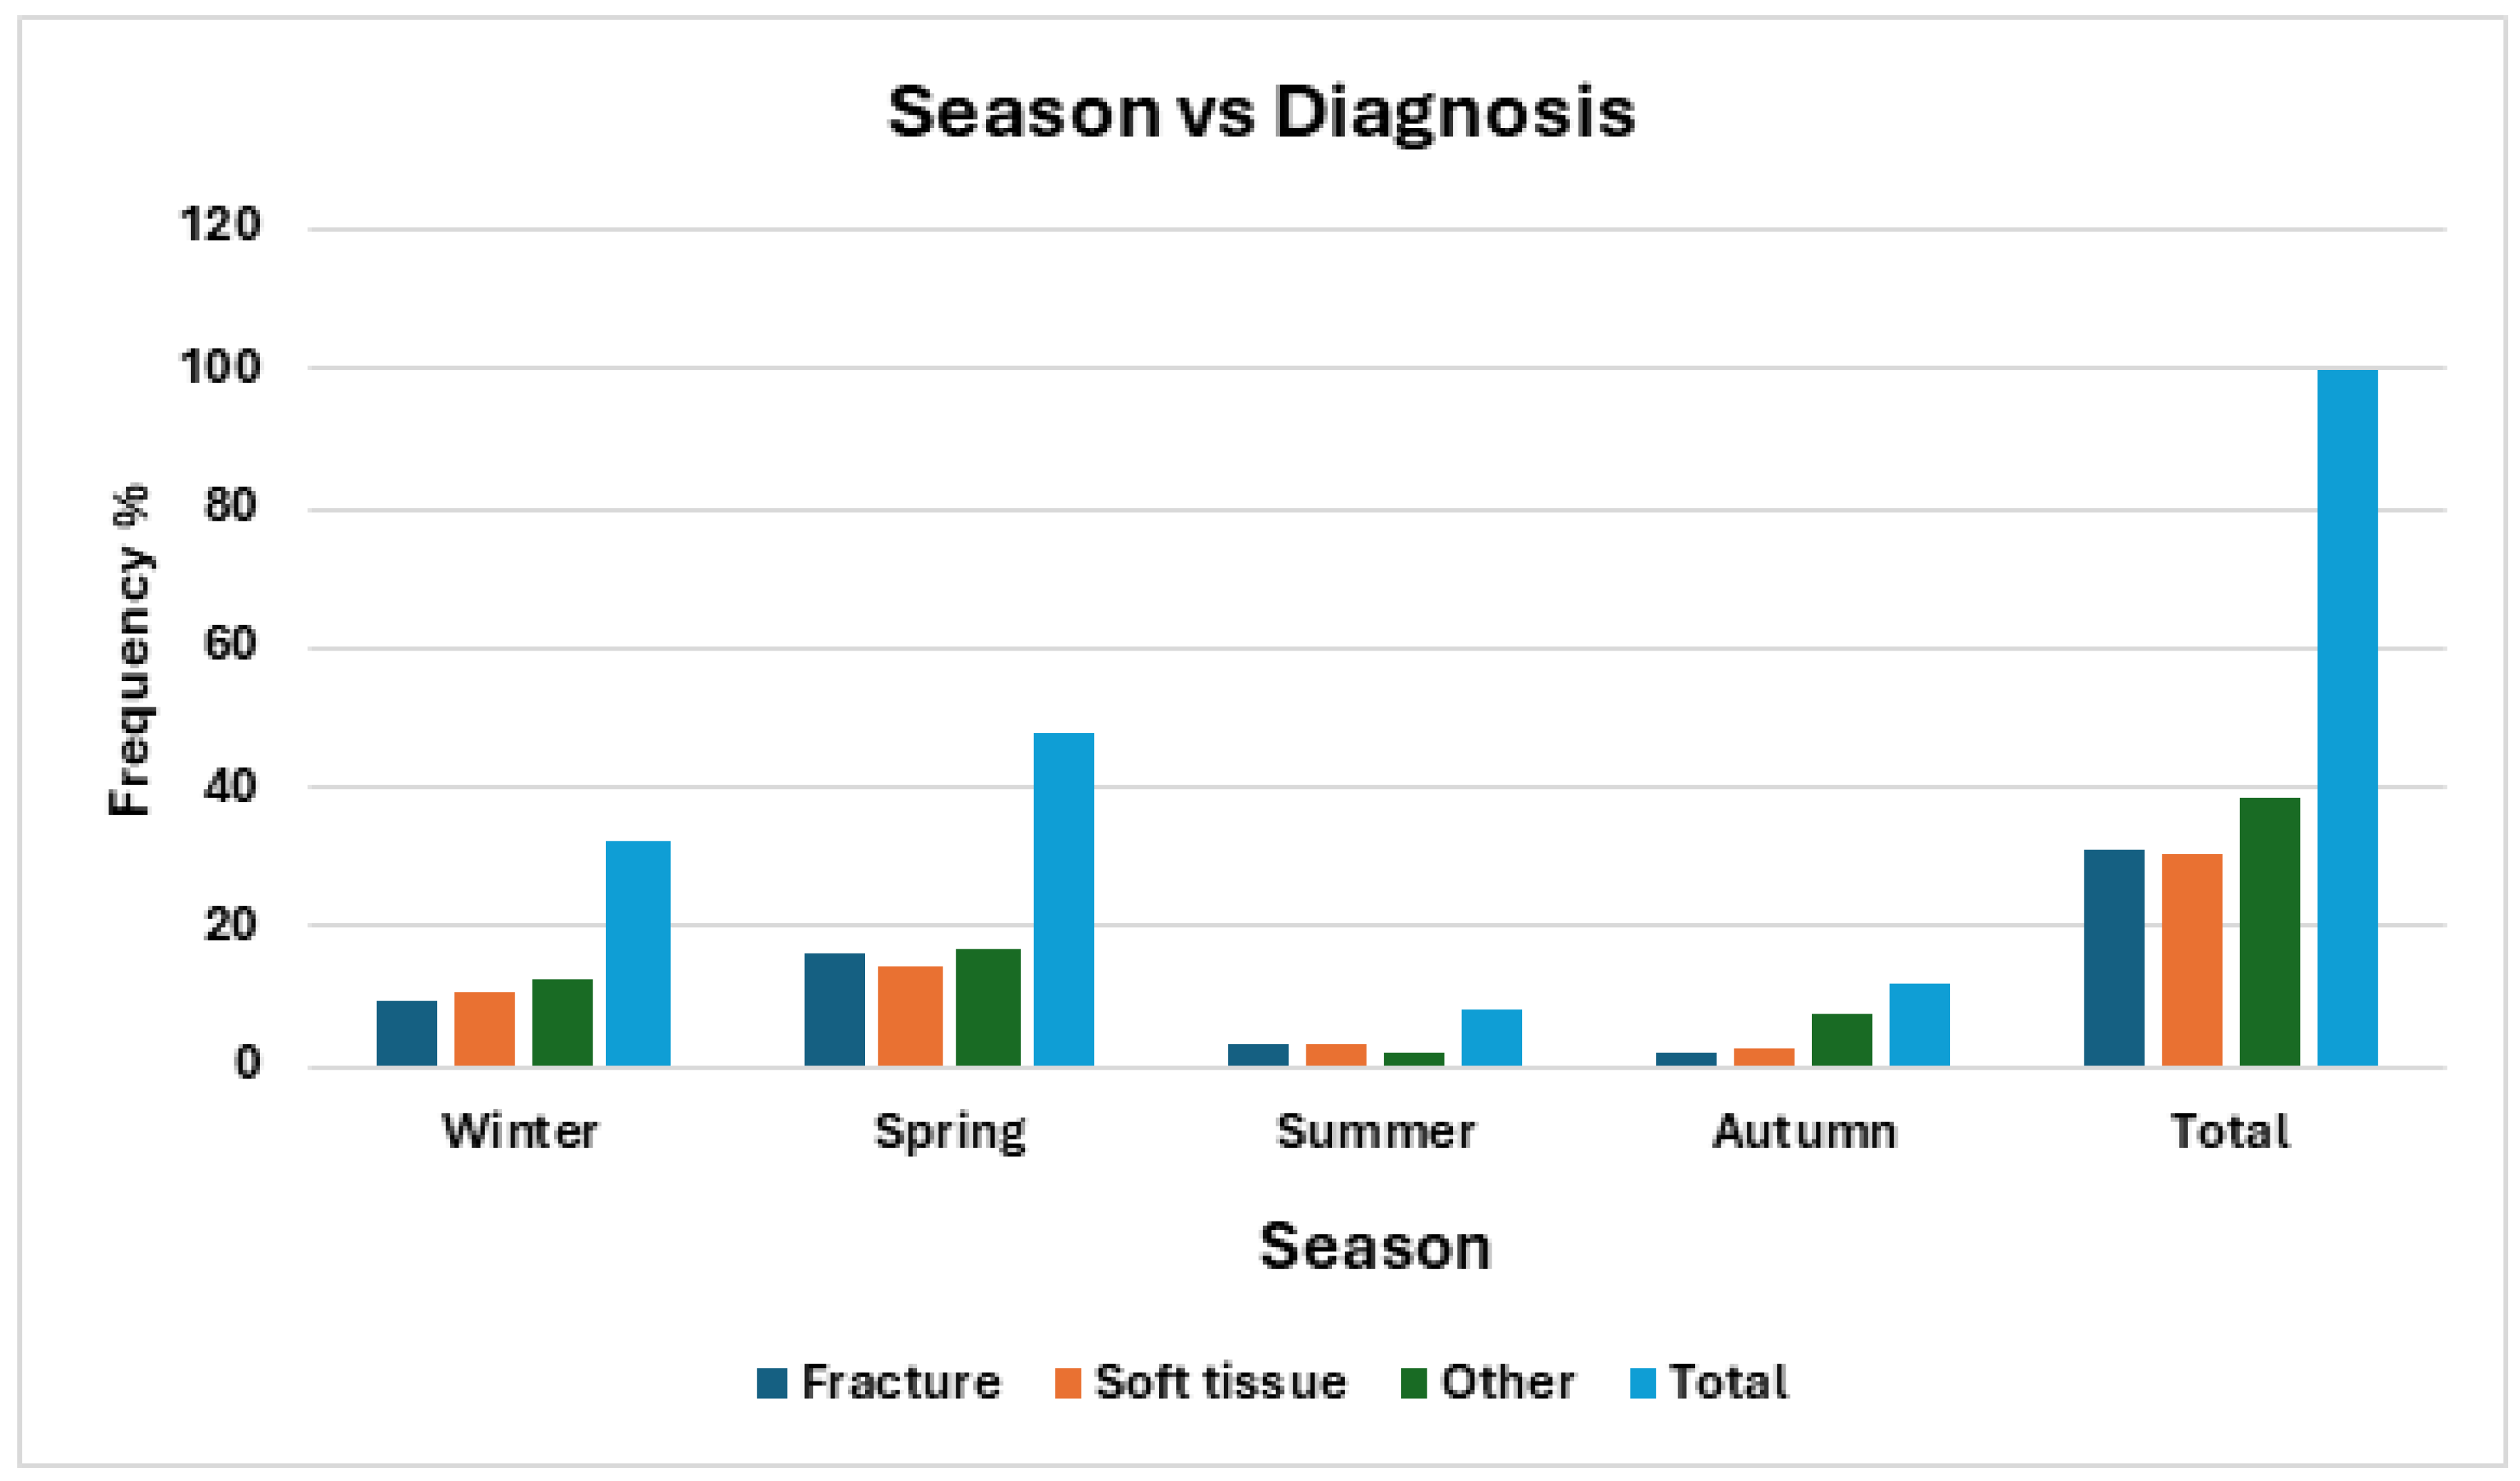
Figure 8.
Frequency distribution of outcomes after presentation.
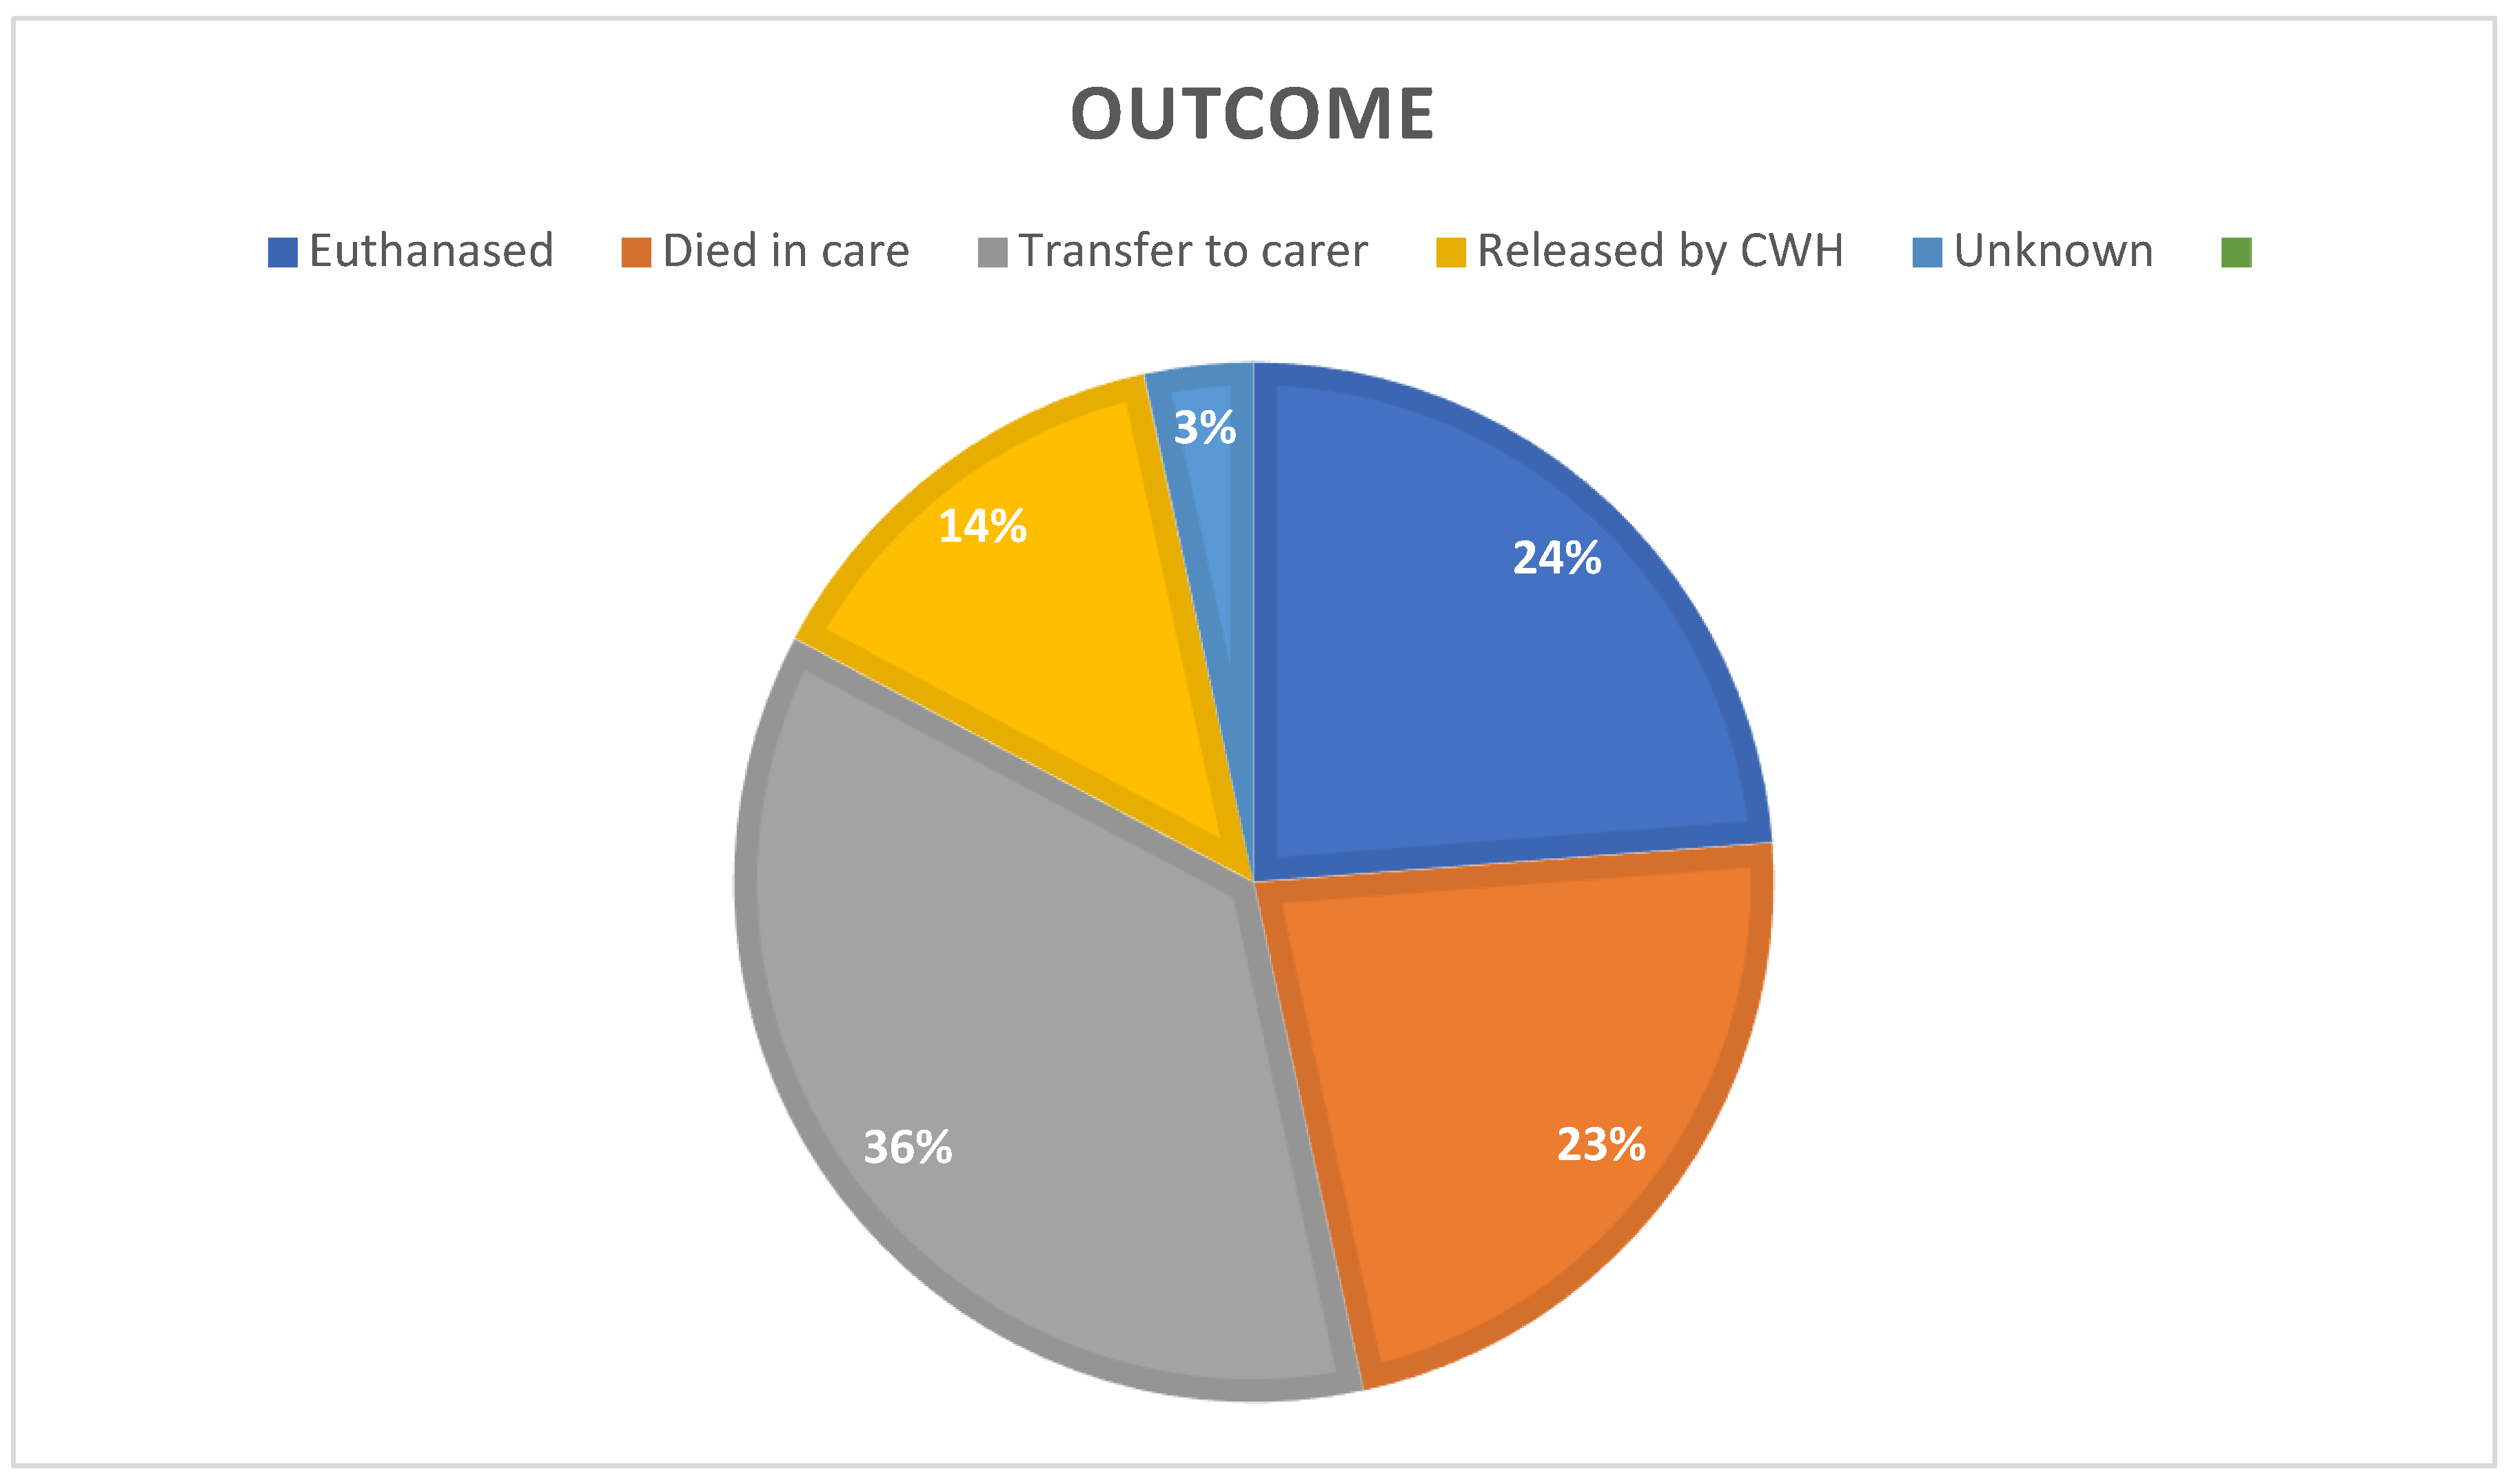
Figure 9.
Frequency of barn owls admitted to CWH sorted by admission history and outcome categories. Totals and percentage frequency included. Statistical analysis included on Table 2.
Figure 9.
Frequency of barn owls admitted to CWH sorted by admission history and outcome categories. Totals and percentage frequency included. Statistical analysis included on Table 2.
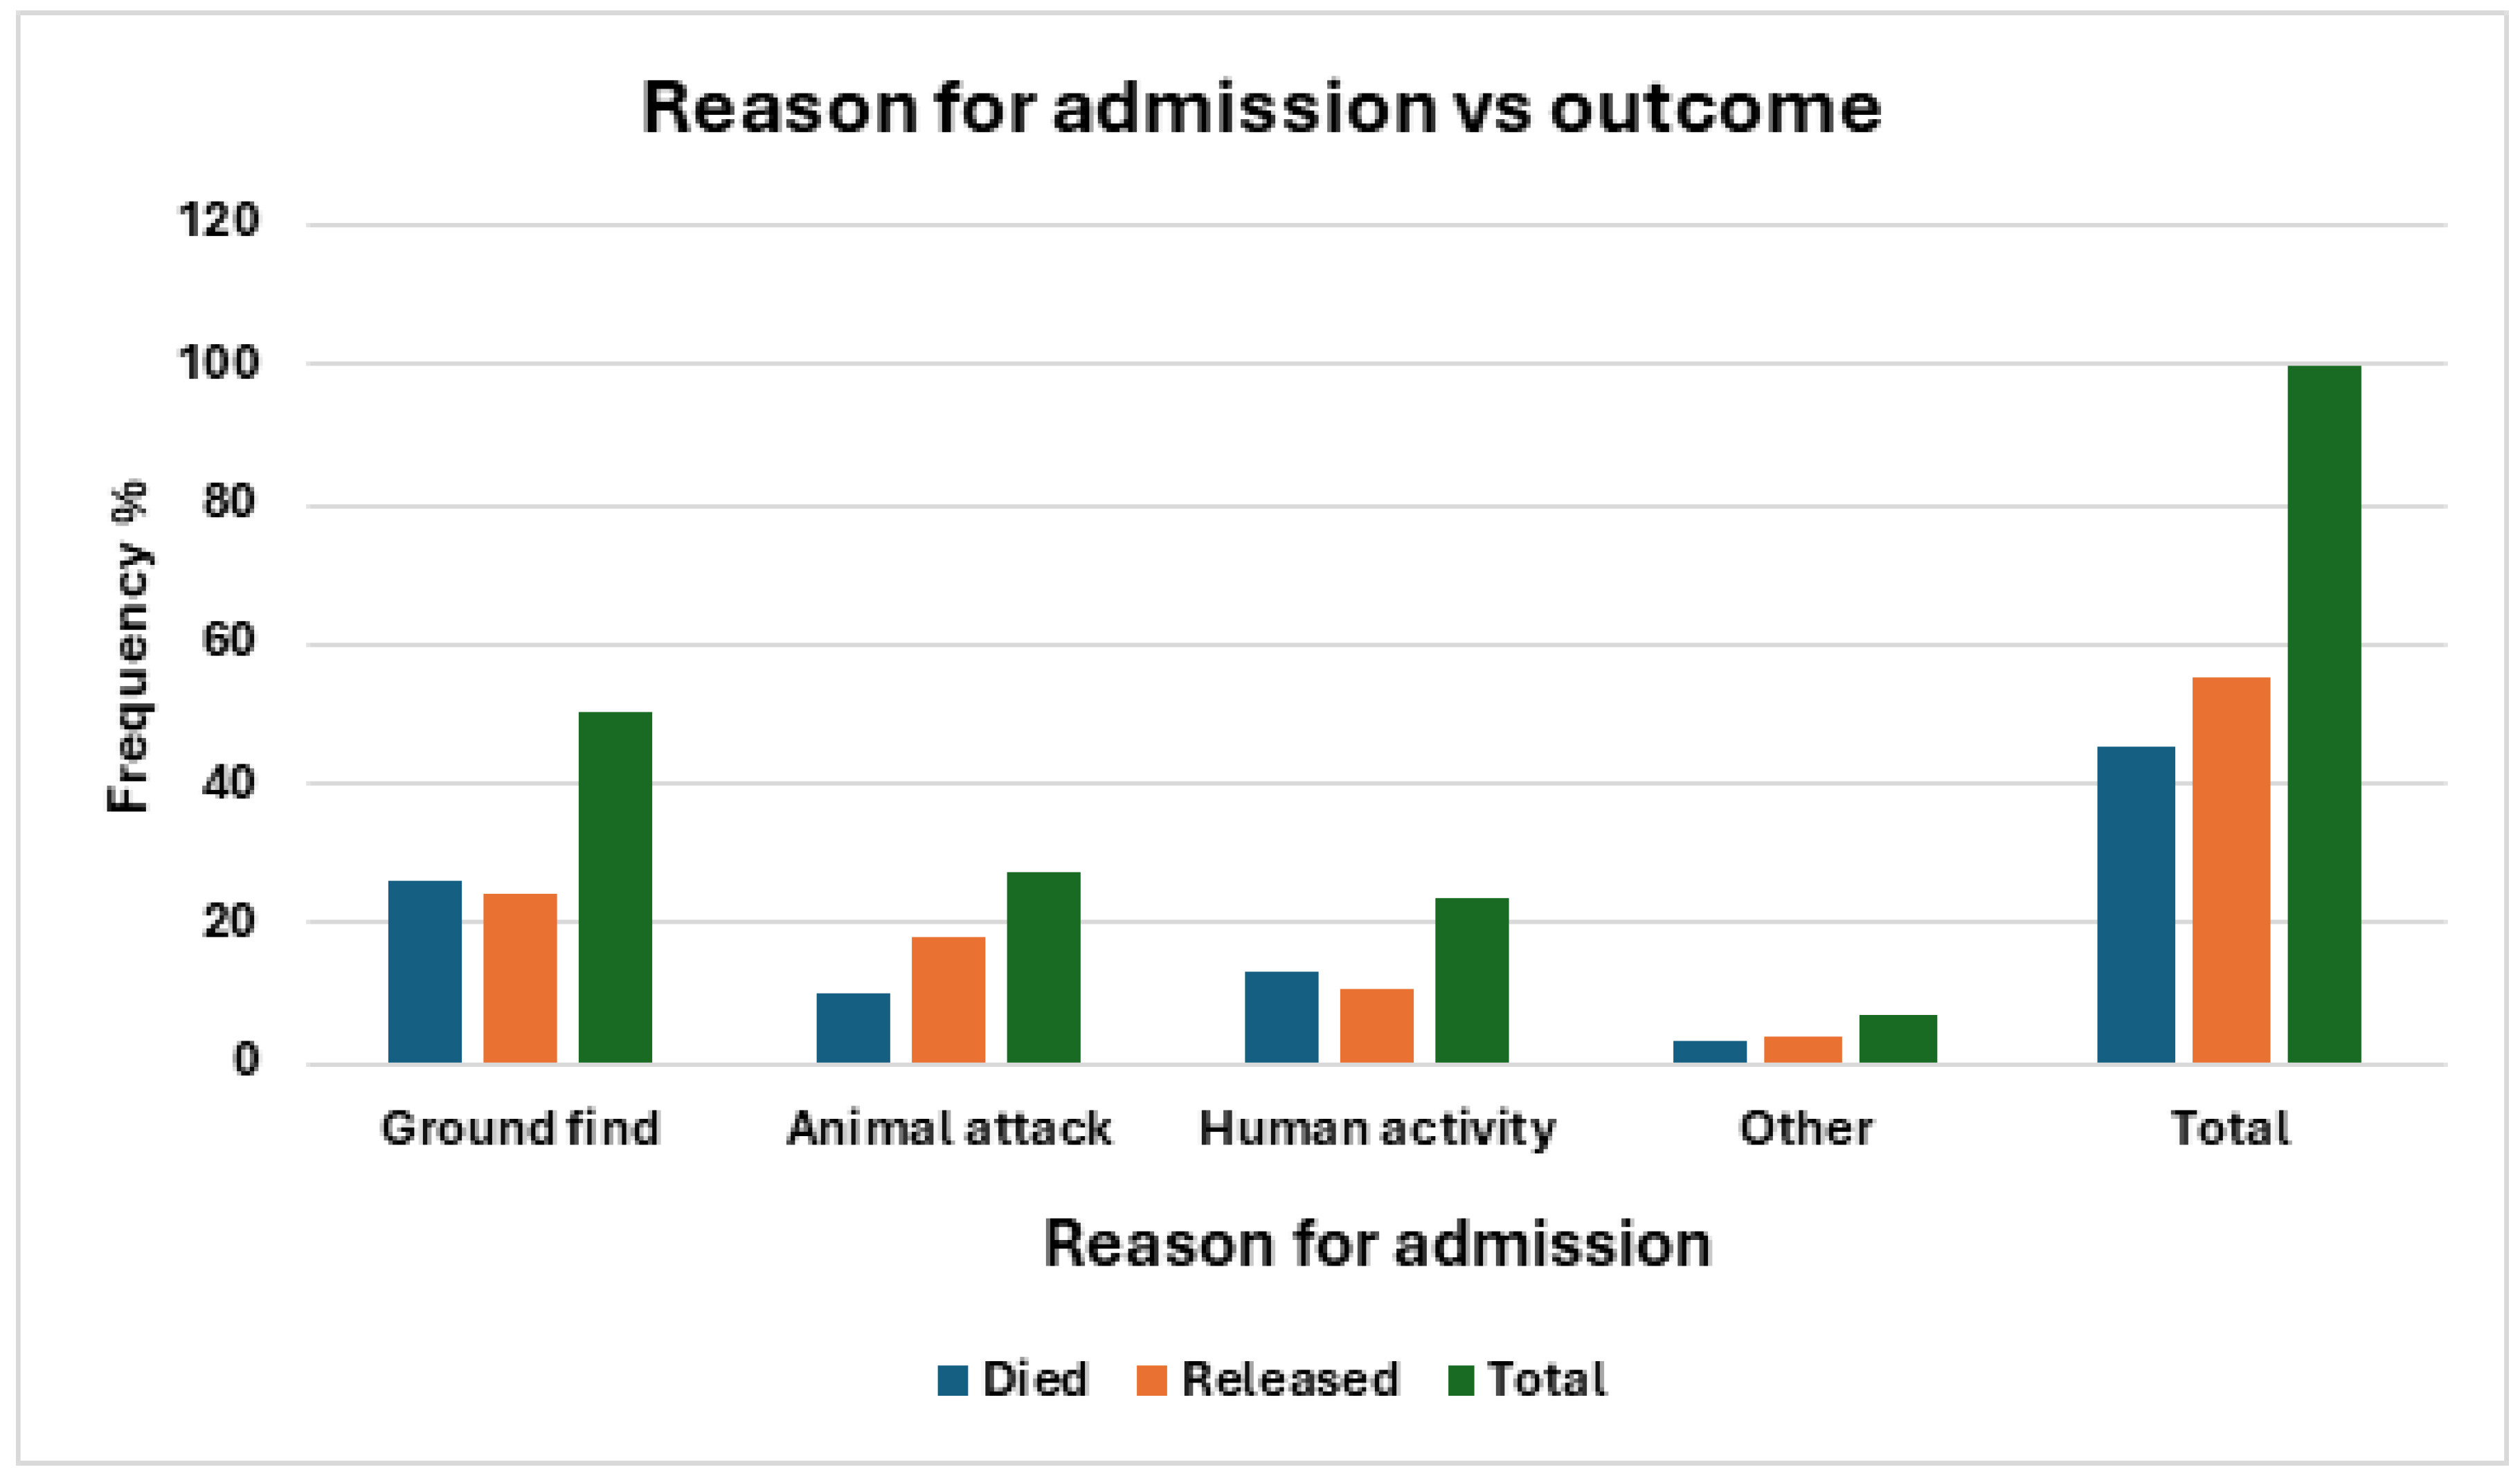
Figure 10.
a. Frequency of barn owls admitted to CWH, sorted by diagnosis and outcome (condensed) categories.
Figure 10.
a. Frequency of barn owls admitted to CWH, sorted by diagnosis and outcome (condensed) categories.
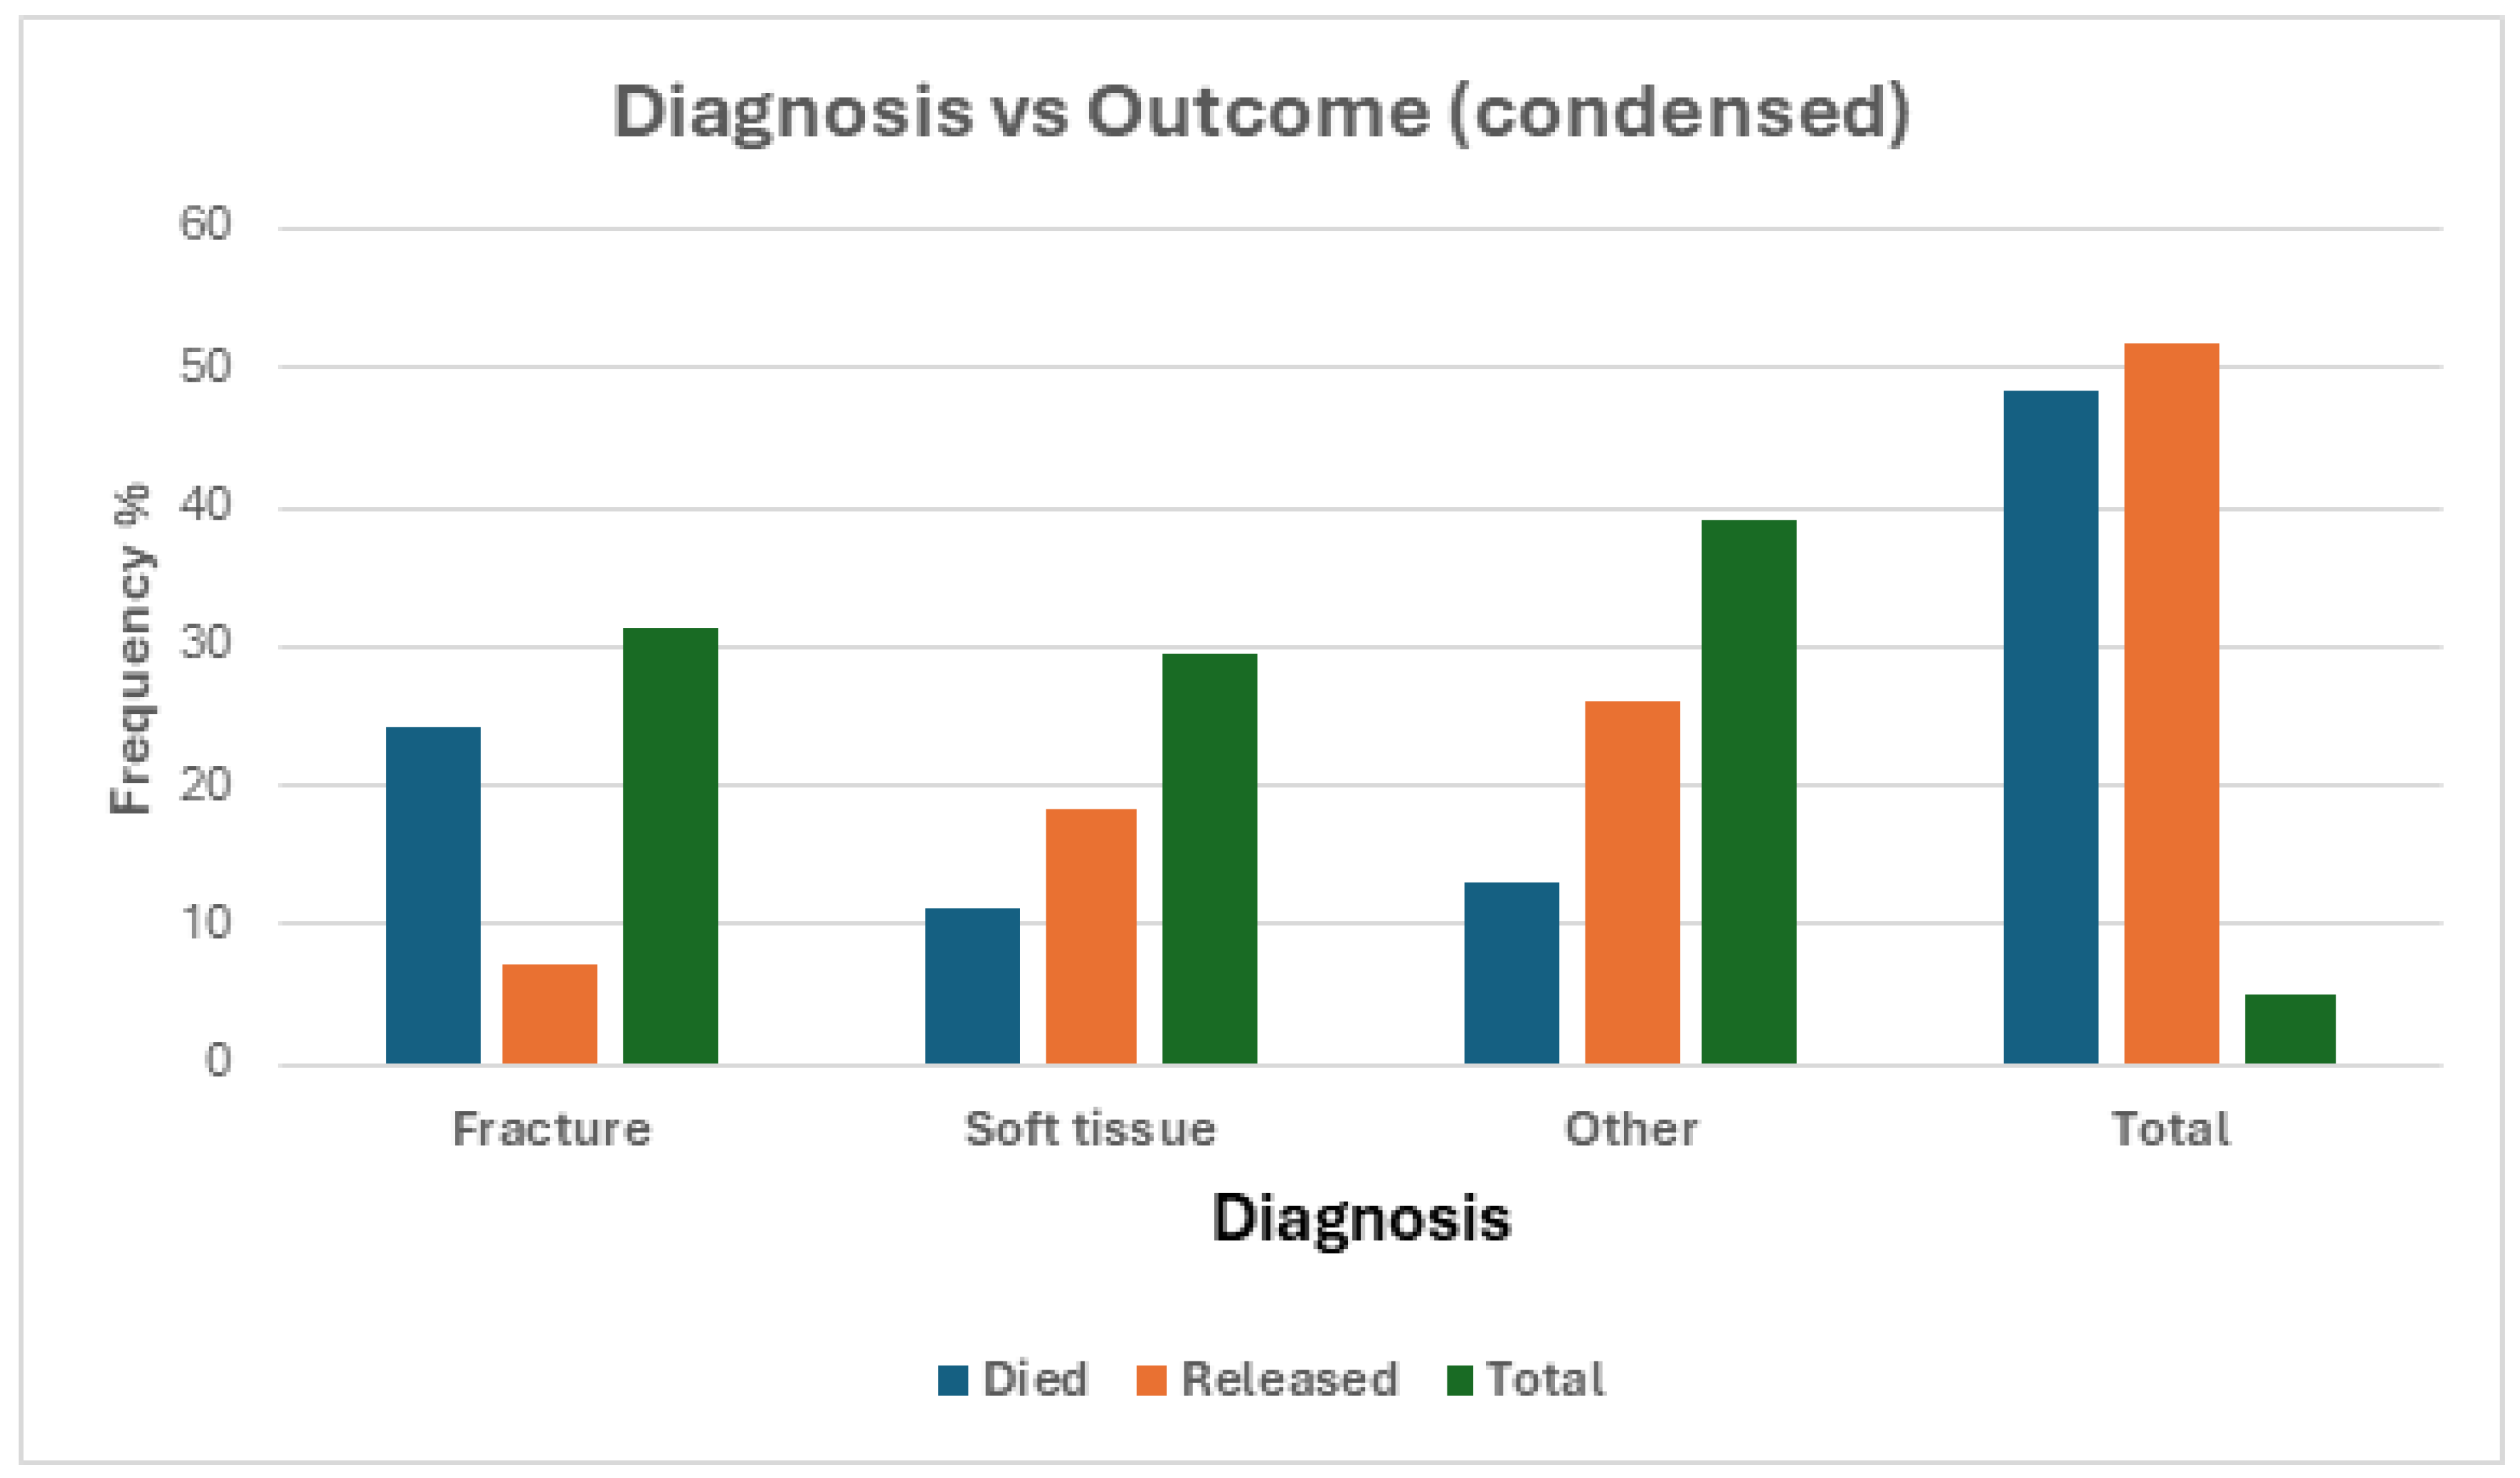
Figure 10.
b. Frequency of barn owls admitted to CWH sorted by Diagnosis and outcome (expanded) categories.
Figure 10.
b. Frequency of barn owls admitted to CWH sorted by Diagnosis and outcome (expanded) categories.
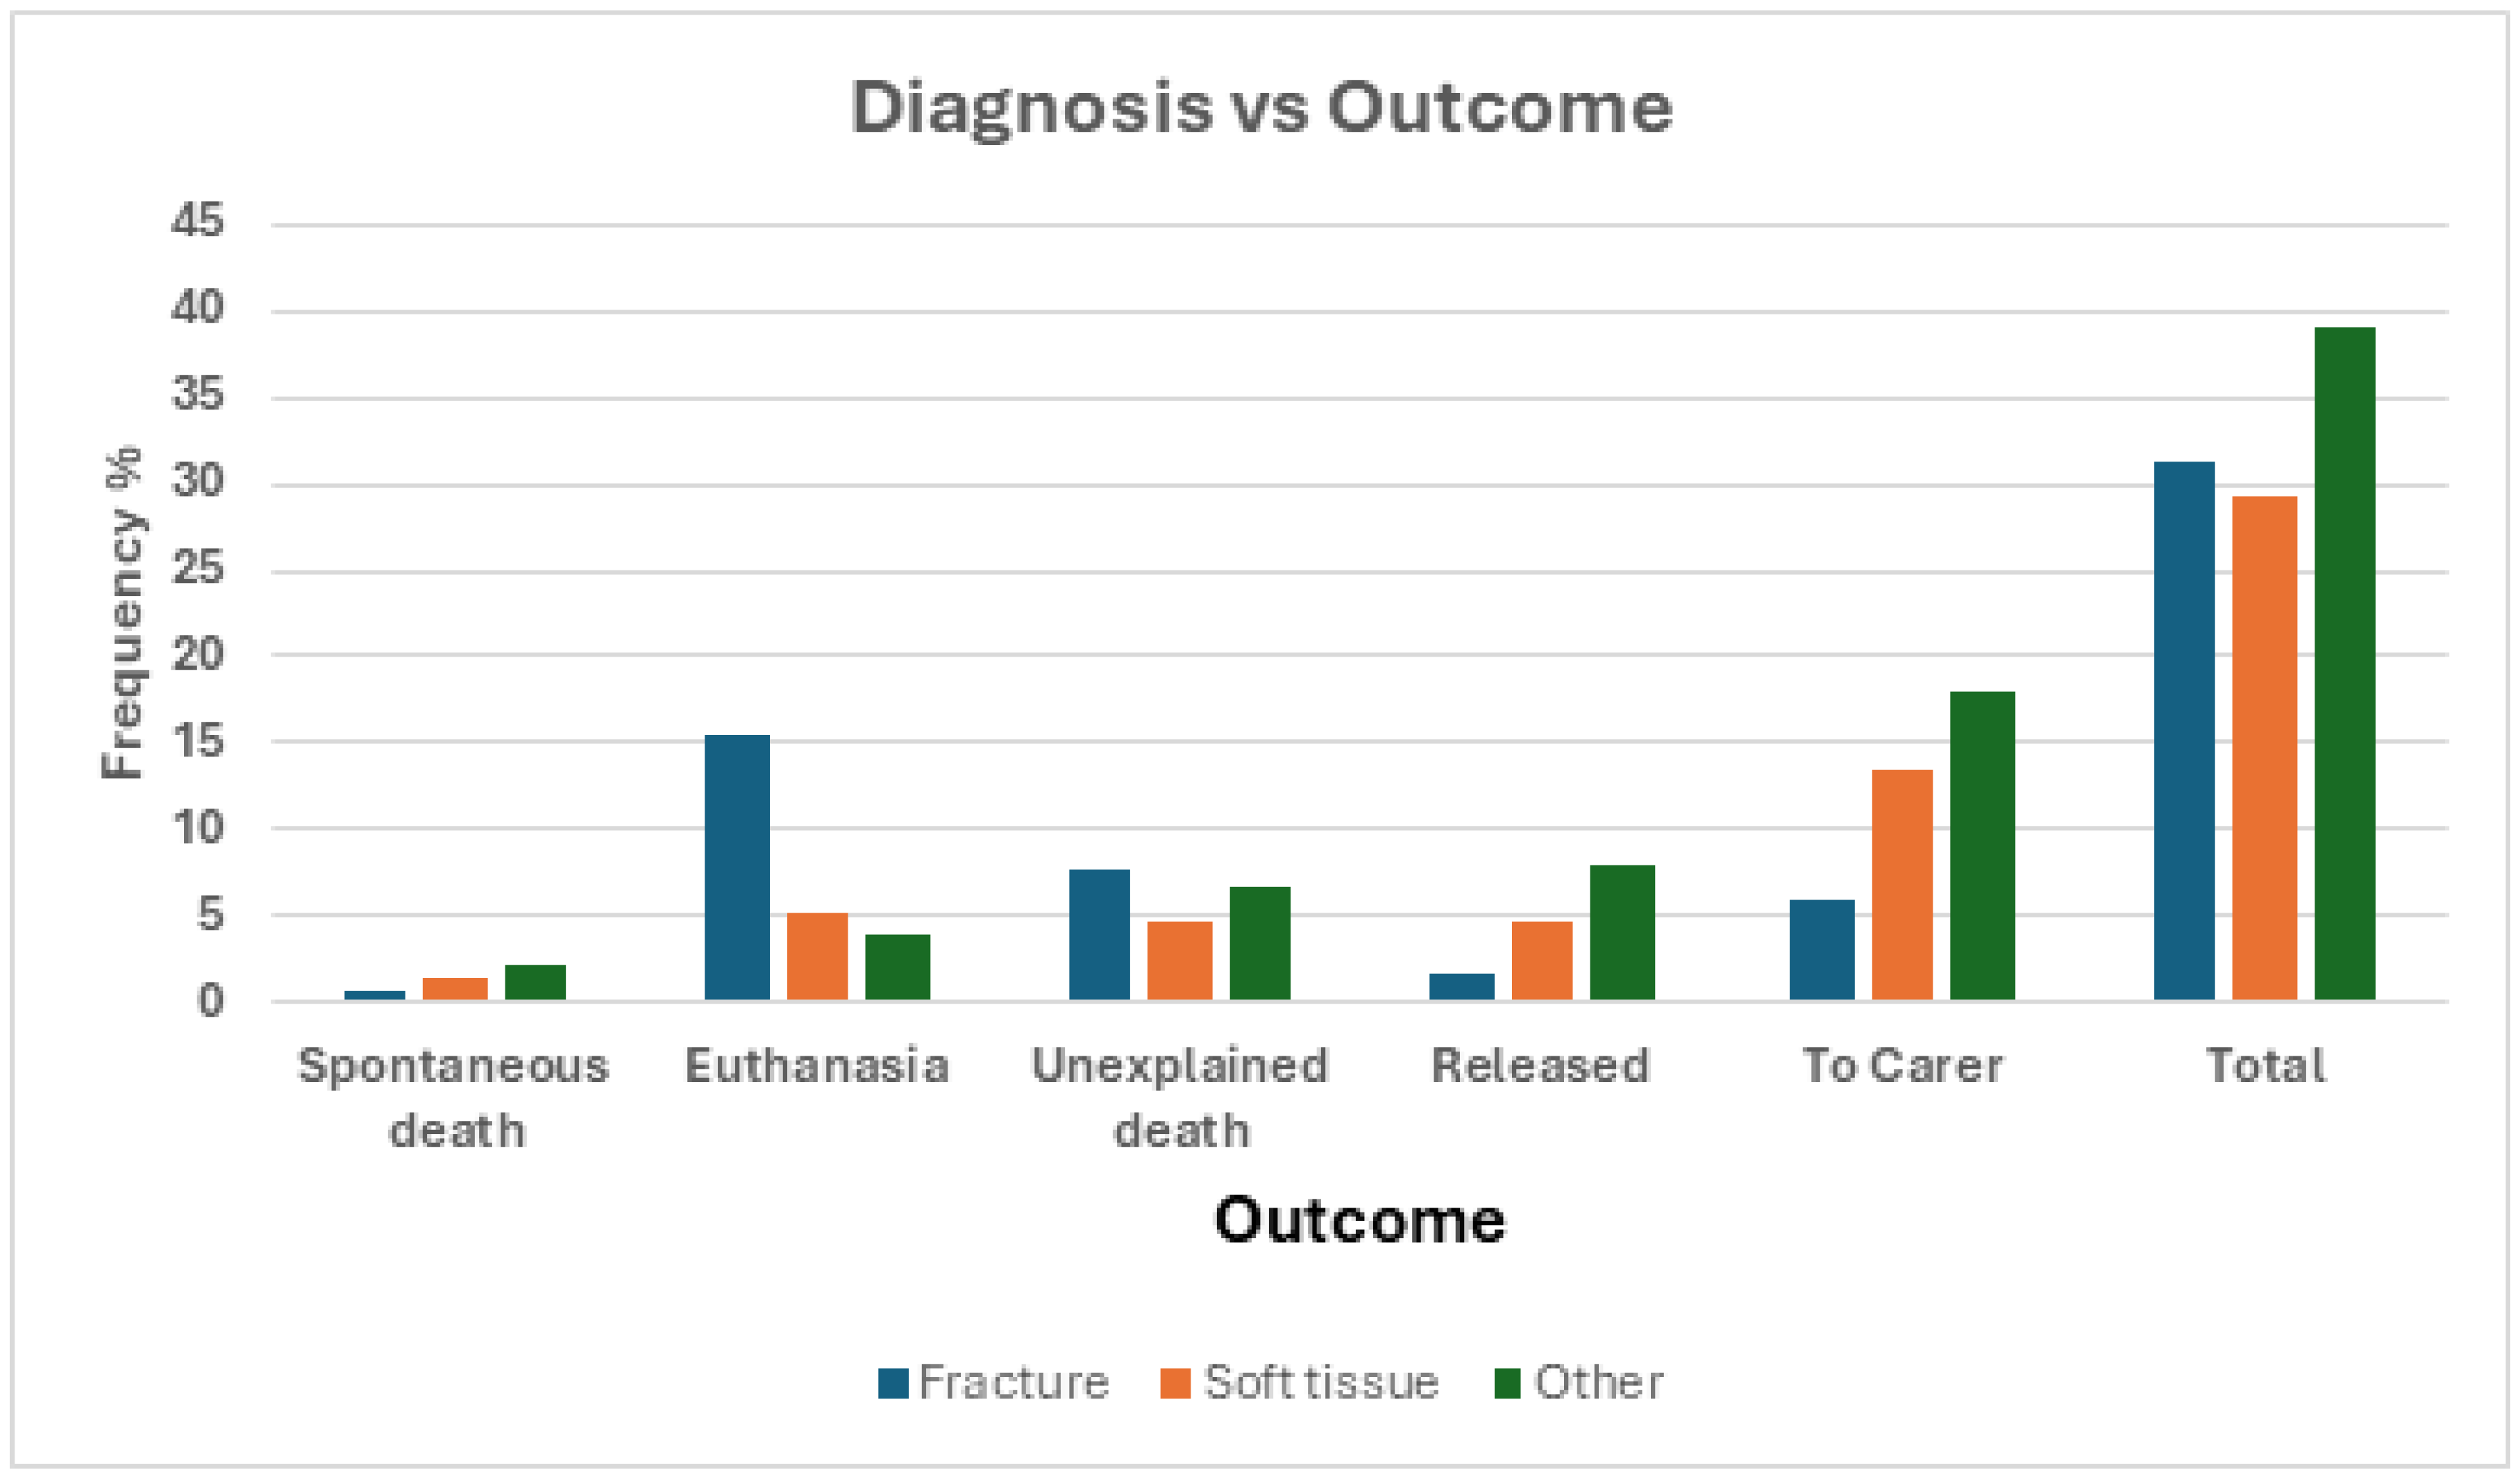
Figure 11.
Frequency of barn owls admitt1ed to CWH sorted by season and outcome categories, unknown outcome excluded.
Figure 11.
Frequency of barn owls admitt1ed to CWH sorted by season and outcome categories, unknown outcome excluded.
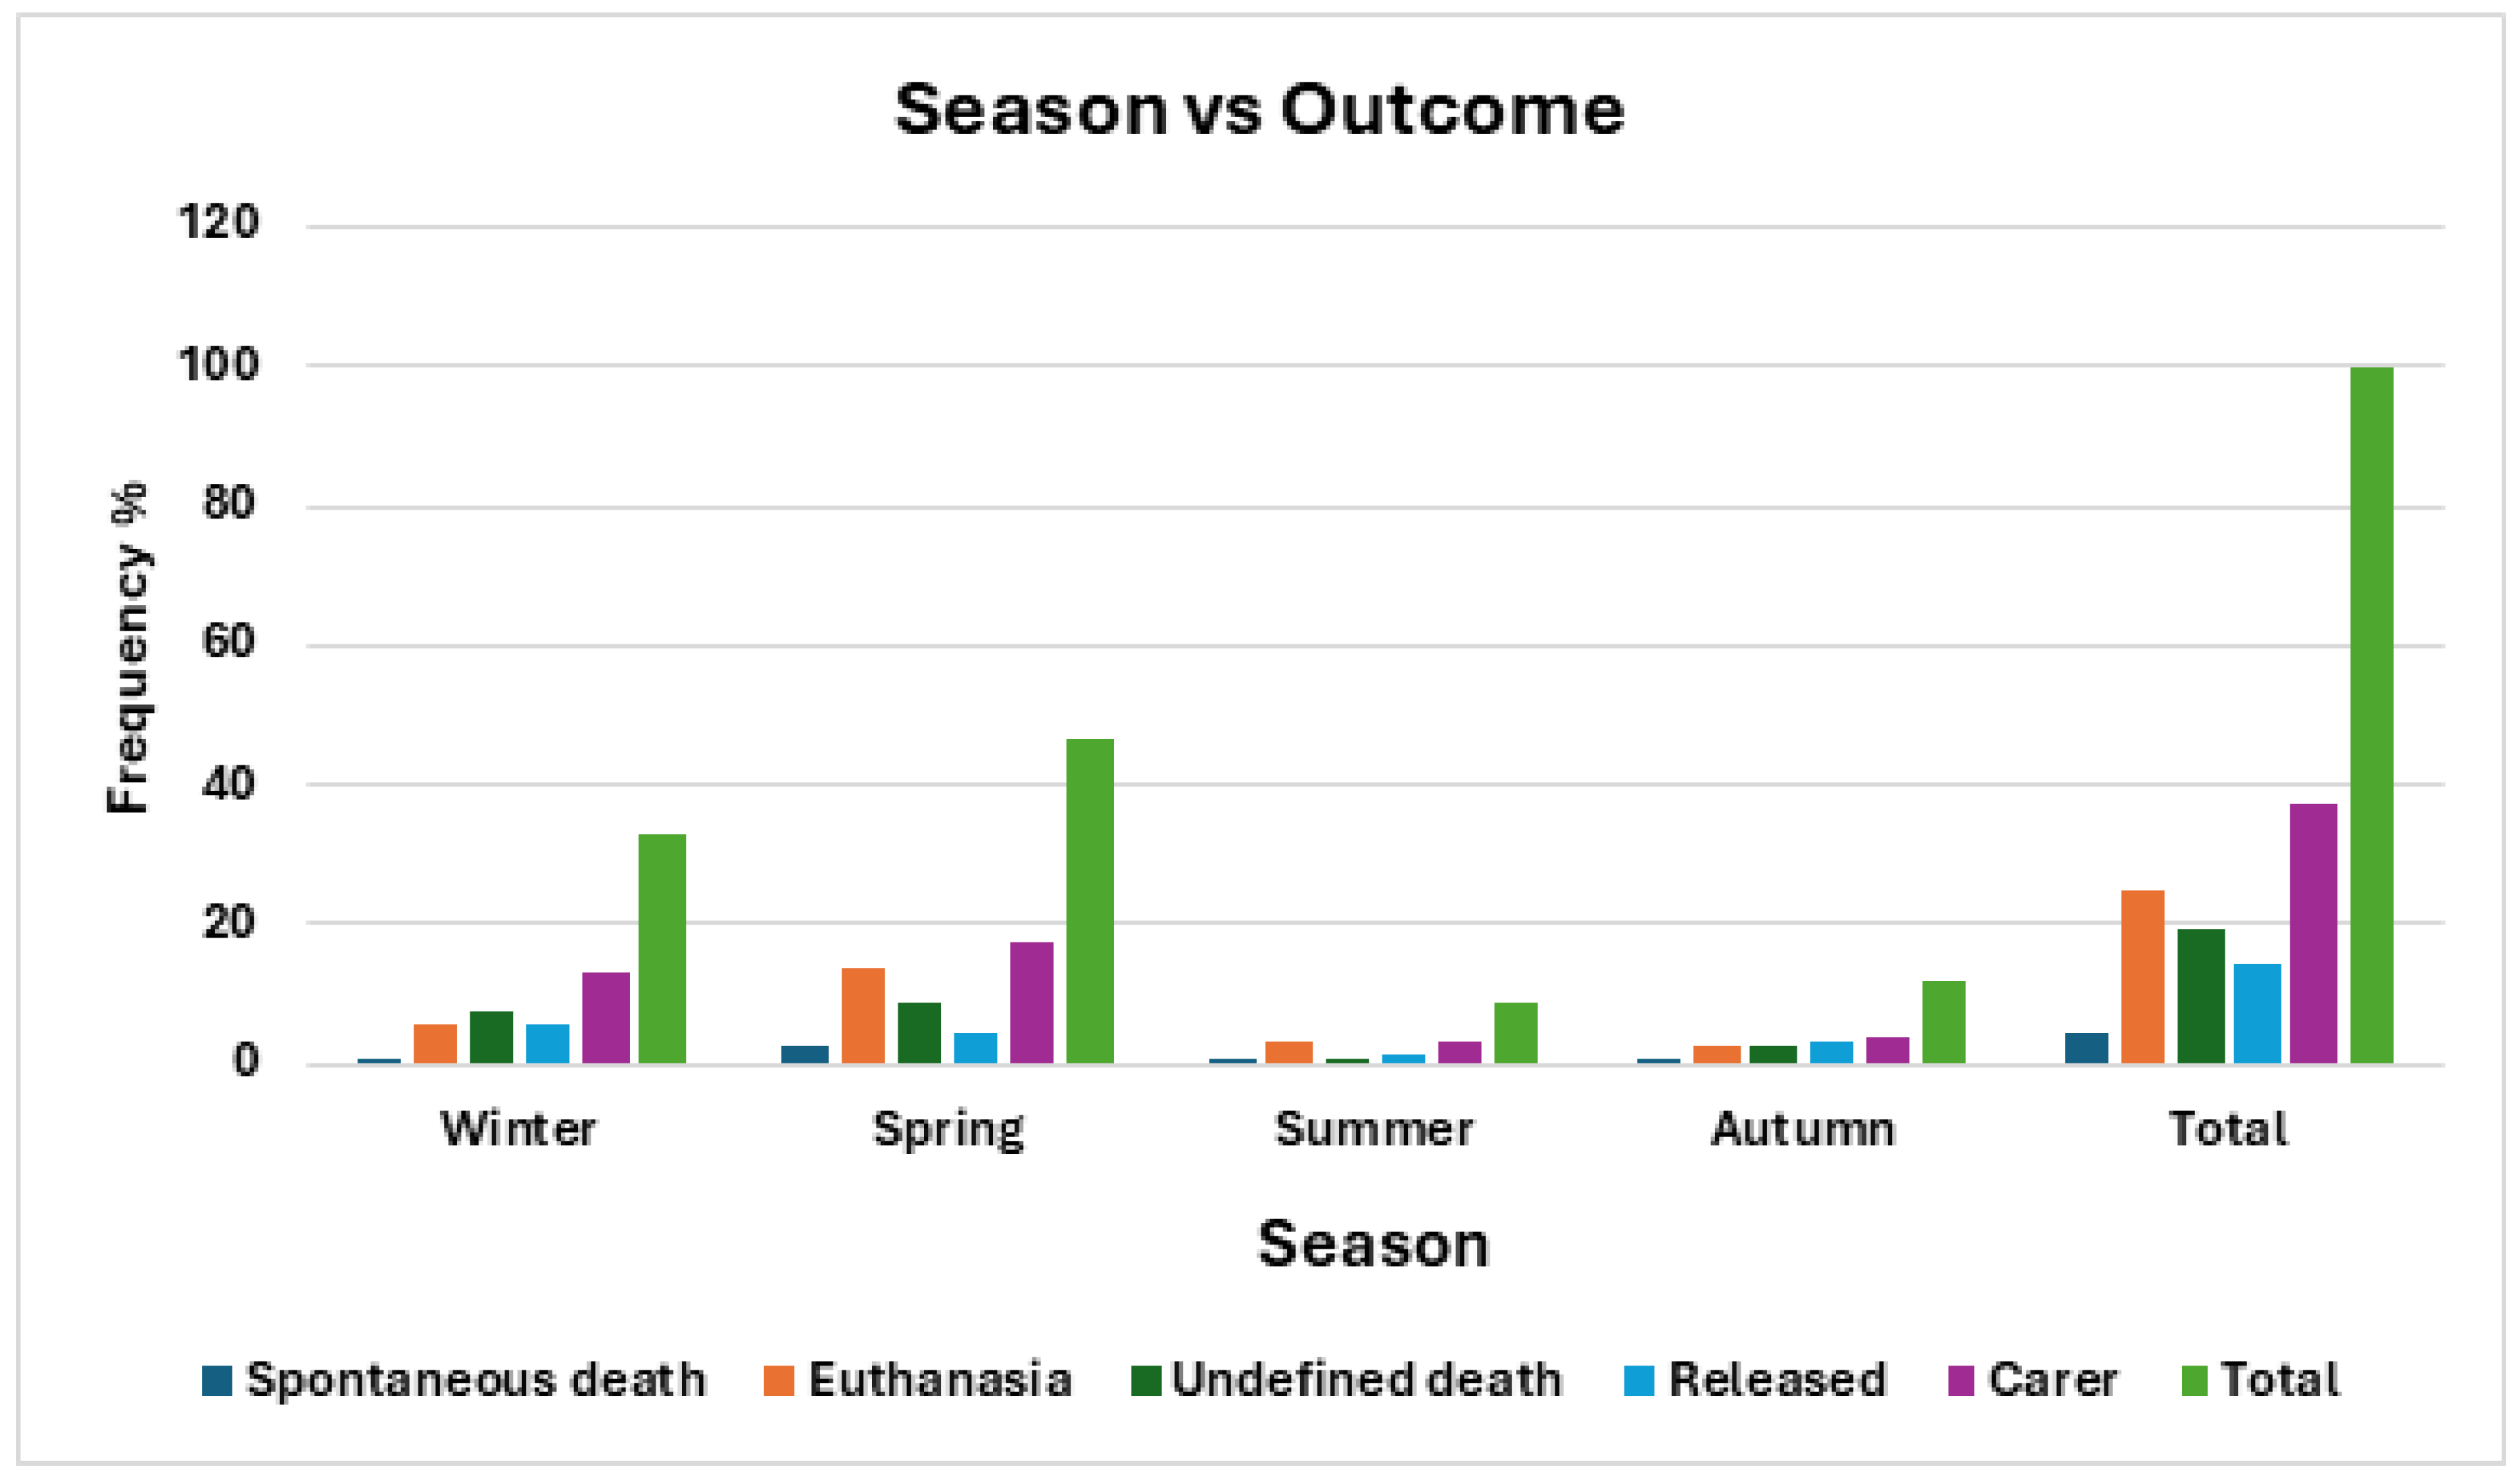
Figure 12.
Mean stay lengths of barn owls admitted to CWH sorted into diagnoses of (A) fracture (B) soft tissue and (C) other injuries. Within diagnoses, lengths of stay are sorted by outcomes.
Figure 12.
Mean stay lengths of barn owls admitted to CWH sorted into diagnoses of (A) fracture (B) soft tissue and (C) other injuries. Within diagnoses, lengths of stay are sorted by outcomes.
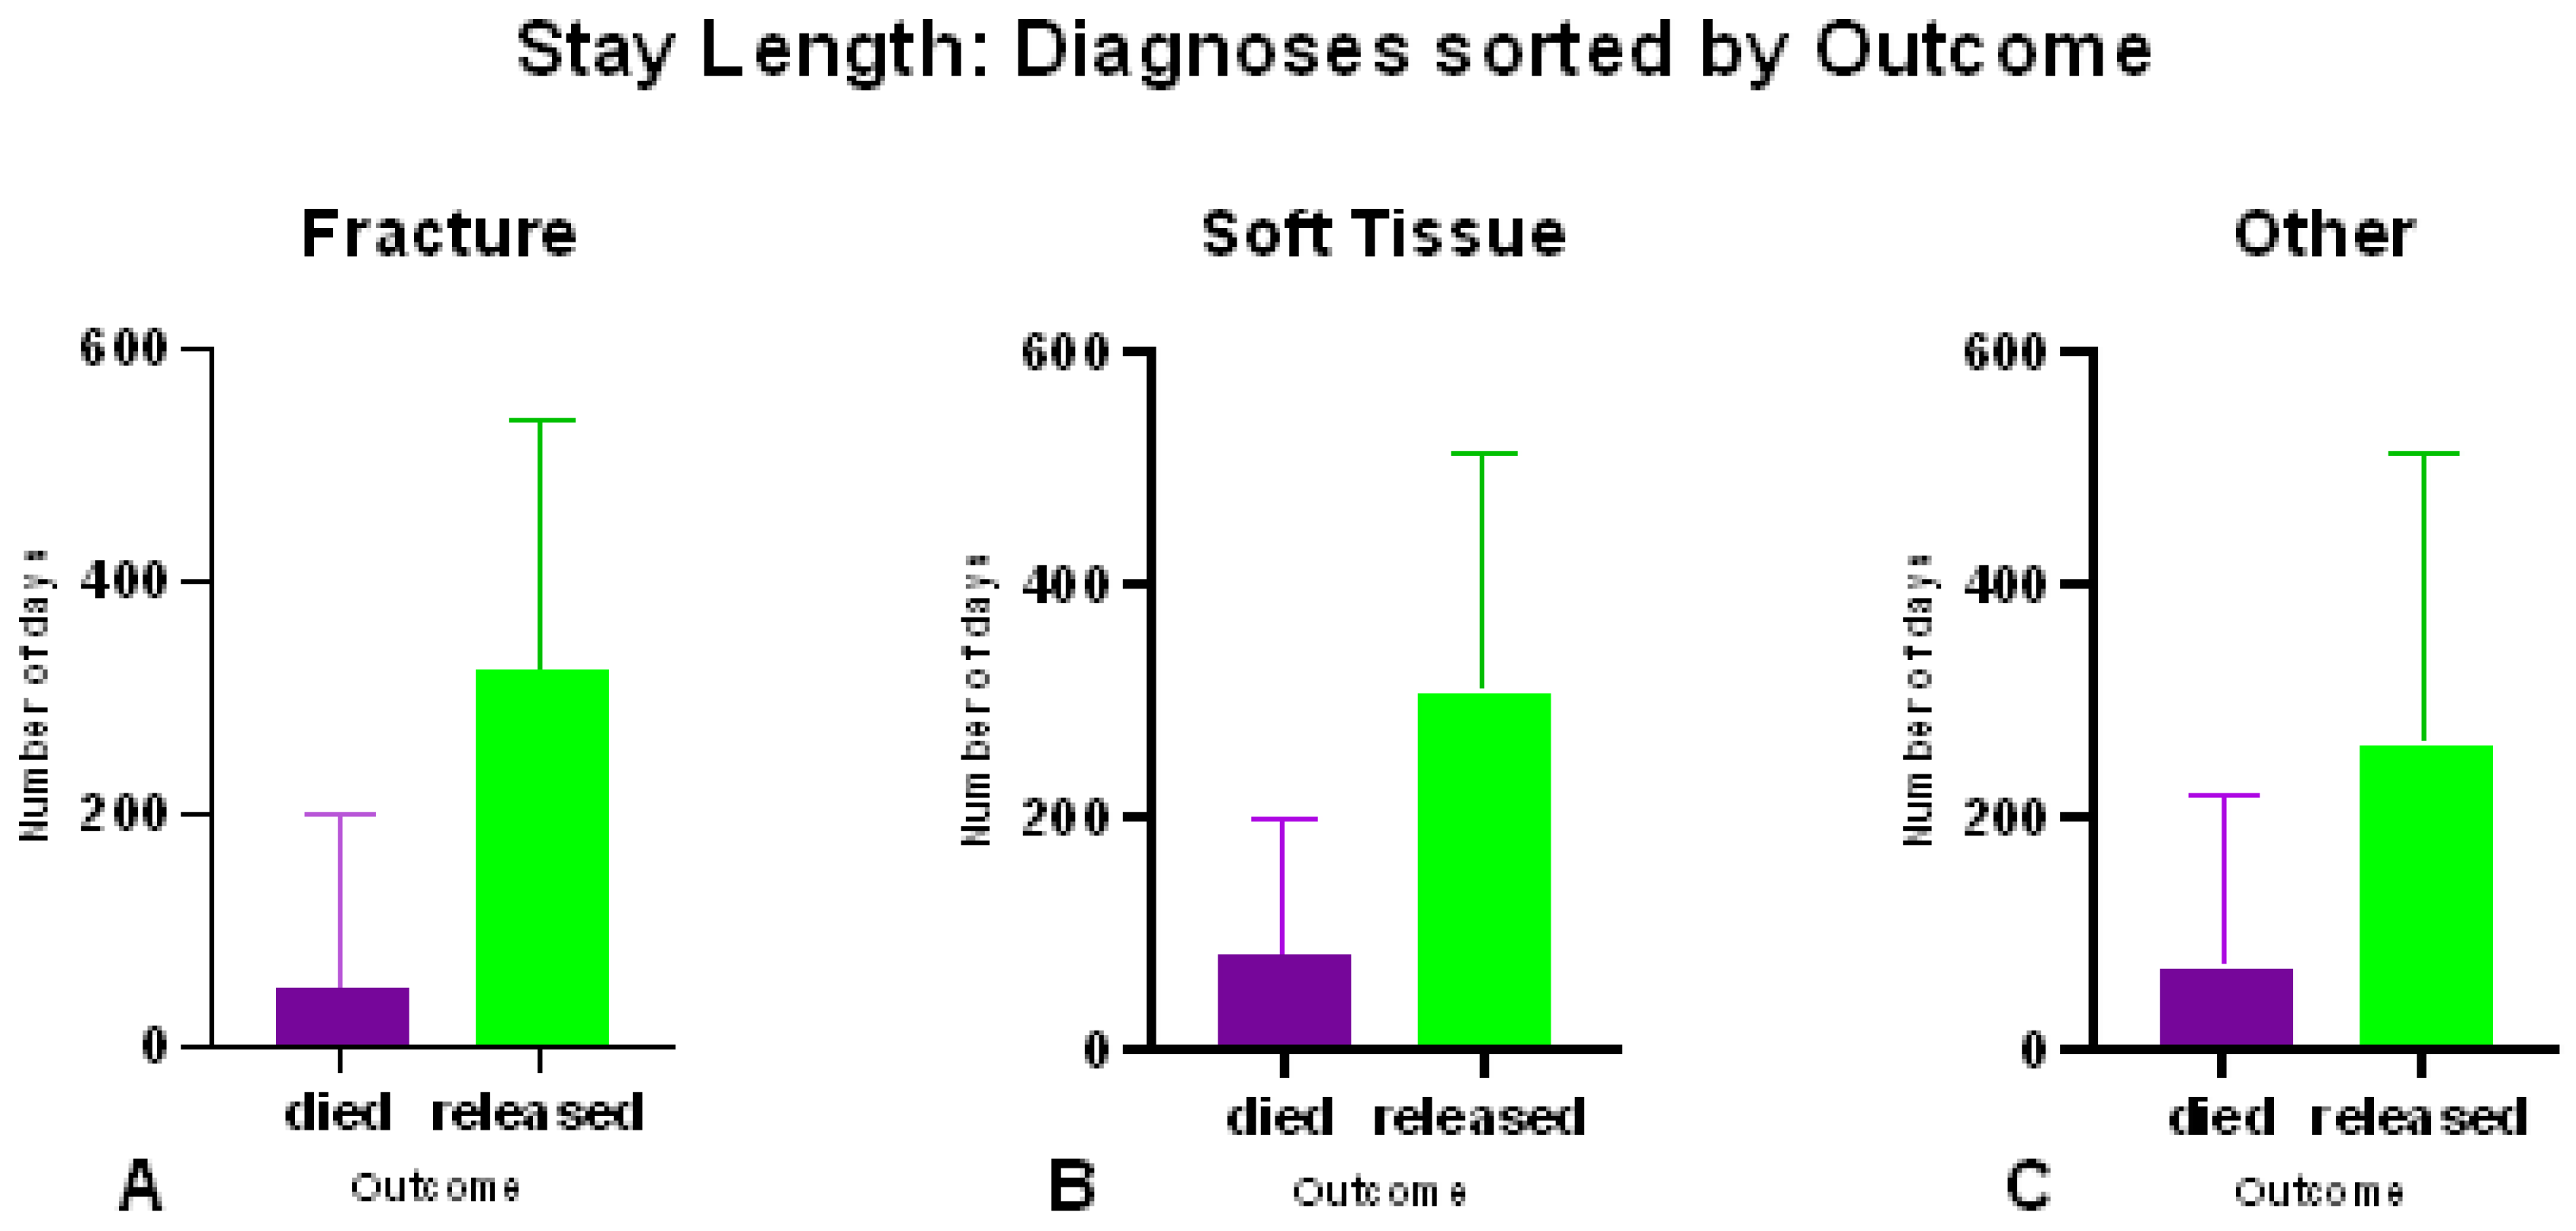

Table 1.
Reclassification of data into set categories for data analysis.
| Column label | Initial Response | Converted Response | Condensed Response |
| Known medical history | Apparently stunned, apparently weak, dead-on-arrival, fallen from tree, found beside road, found on ground away from road, found on road, ground find, limb or limbs dragging, orphaned or (n) adults nearby, reported ill, road find, unable to fly, unable to stand up, unable to walk, water soaked, wing drooping or dragging | Ground find | NA |
| Listed as attacked by any animal | Animal Attack | NA | |
| Hit by vehicle (presumed), vehicle hit | Motor Vehicle | Human activity | |
| Barbed wire entanglement, entanglement (barbed wire), entrapped, floating in water, snagged on object, suspected poisoning, window hit | Environment | ||
| Brought in by a carer, veterinarian referral, reported ill | Referral | Other | |
| Not known, other | Unknown | ||
| Admission Date | Any date listed from the beginning of December to end of February in any year | Summer | Off Season |
| Any date listed from the beginning of March to end of May in any year | Autumn | ||
| Any date listed from the beginning of June to end of August in any year | Winter | Breeding Season | |
| Any date listed from the beginning of September to end of November in any year | Spring | ||
| Age | Hatchling, fledgling, post fledgling, juvenile, subadult | Subadult | NA |
The tabulated information was comprised of both categorical and continuous data. Microsoft 365 Excel v.2209 was used for sorting and counting frequencies, and GraphPad Prism v9.4.1 was utilized for data analysis. The categorical data was paired up to determine effects, if any, of the variables present on other variables and these were analyzed using the Chi-square test. The continuous data in the ‘stay length’ column was analyzed with regards to outcome (died, released); diagnosis (trauma (fracture), trauma (soft tissue), and other) and admission history (ground find, animal attack, human activity, other) using an unpaired Mann-Whitney U-Test. Continuous data in the weight column was not analyzed. (Table 2).
Table 2.
Compilation of reportable comparative statistics analyzing frequency tables of barn owls admitted to CWH, to determine strength of associations, if any. Significance denoted by stars *low, **moderate, ***high, ****very high.
Table 2.
Compilation of reportable comparative statistics analyzing frequency tables of barn owls admitted to CWH, to determine strength of associations, if any. Significance denoted by stars *low, **moderate, ***high, ****very high.
| Test Statistics Summary | ||||
| Test Used | Comparison | Relevant reporting | Significance | |
| Chi-square | Season vs Admission History | χ2 = 31.16, df = 9 , p = 0.0003 | *** | |
| Season vs Diagnosis | χ2 = 17.94, df = 6, p = 0.0064 | ** | ||
| Season vs Outcome | χ2 = 20.67, df = 12, p = 0.0554 | (n) | ||
| Age vs Admission History | χ2 = 4.855, df = 3, p = 0.1828 | (n) | ||
| Age vs Diagnosis | χ2 = 0.2979, df = 2, p = 0.8616 | (n) | ||
| Age vs Outcome | χ2 = 0.2813, df = 1, p = 0.5958 | (n) | ||
| Admission History vs Diagnosis | χ2 = 11.85, df = 6, p = 0.0654 | (n) | ||
| Admission History vs Outcome | χ2 = 9.427, df = 3, p =0.0241 | * | ||
| Diagnosis vs Outcome (simple) | χ2 = 60.39, df = 2, p < 0.0001 | **** | ||
| Diagnosis vs Outcome | χ2 = 82.15, df = 2, p < 0.0001 | **** | ||
| Diagnosis vs Release | χ2 = 1.304, df = 2, p = 0.5211 | (n) | ||
| Diagnosis vs Death | χ2 = 19.35, df = 4, p = 0.0007 | *** | ||
| Fisher's exact | Age vs Discharge | p = 0.7107, O.ratio = 0.8193 | (n) | |
| Age vs Breeding Season | p = 0.1655, O.ratio = 2.63 | (n) | ||
| Mann-Whitney U | Stay length by outcome (died v released) | p < 0.0001, U = 4492, n = 386 | **** | |
| Stay length: Diagnosis by outcome (died v released) | fracture by outcome | p < 0.0001, U = 146, n = 119 | **** | |
| soft tissue by outcome | p < 0.0001, U = 418, n = 113 | **** | ||
| other by outcome | p < 0.0001, U = 592, n = 118 | **** | ||
| Stay length by Diagnosis | fracture vs soft tissue | p < 0.0001, U = 3457, n = 232 | **** | |
| fracture vs other | p < 0.0001, U = 5453, n = 273 | **** | ||
| soft tissue vs other | p = 0.2097, U = 7919, n = 267 | (n) | ||
Table 3.
Frequency of age of barn owls admitted to CWH sorted by time of year represented by season. Statistical analysis included in Table 2. AF = absolute frequency; RF = relative frequency.
Table 3.
Frequency of age of barn owls admitted to CWH sorted by time of year represented by season. Statistical analysis included in Table 2. AF = absolute frequency; RF = relative frequency.
| Age vs Season | ||||||||||
| Winter | Spring | Summer | Autumn | Total | ||||||
| AF | RF | AF | RF | AF | RF | AF | RF | AF | RF | |
| (n) | % | (n) | % | (n) | % | (n) | % | (n) | % | |
| Subadult | 13 | 40.62 | 16 | 50 | 2 | 6.25 | 1 | 3.12 | 32 | 7.77 |
| Adult | 112 | 32.37 | 160 | 36.24 | 31 | 8.96 | 43 | 12.43 | 346 | 84 |
| Unknown | 7 | 20.6 | 22 | 64.71 | 1 | 2.94 | 4 | 11.77 | 34 | 8.25 |
| Total | 132 | 32.04 | 198 | 48.06 | 34 | 8.25 | 48 | 11.65 | 412 | 100 |
Table 4.
Frequency of barn owls admitted to CWH sorted by season and admission history categories. Totals and percentage frequency included. Statistical analysis included in Table 2. AF = absolute frequency; RF = relative frequency.
Table 4.
Frequency of barn owls admitted to CWH sorted by season and admission history categories. Totals and percentage frequency included. Statistical analysis included in Table 2. AF = absolute frequency; RF = relative frequency.
| Season vs Admission History | ||||||||||
| Ground finds | Animal attack | Human Activity | Other | Total | ||||||
| AF | RF | AF | RF | AF | RF | AF | RF | AF | RF | |
| (n) | % | (n) | % | (n) | % | (n) | % | (n) | % | |
| Winter | 63 | 15.2 | 31 | 7.52 | 25 | 6.07 | 13 | 3.16 | 132 | 32.04 |
| Spring | 90 | 21.84 | 67 | 16.26 | 35 | 8.49 | 6 | 1.46 | 198 | 48.06 |
| Summer | 15 | 3.64 | 7 | 1.69 | 8 | 19.42 | 4 | 0.97 | 34 | 8.25 |
| Autumn | 22 | 5.34 | 3 | 0.73 | 20 | 4.85 | 3 | 0.73 | 48 | 11.65 |
| Total | 190 | 46.11 | 108 | 26.21 | 88 | 21.35 | 26 | 6.31 | 412 | 100 |
Table 5.
Frequency of barn owls admitted to CWH sorted by admission history and Diagnosis categories. Totals and percentage frequency included. Statistical analysis included in Table 2. AF = absolute frequency; RF = relative frequency.
Table 5.
Frequency of barn owls admitted to CWH sorted by admission history and Diagnosis categories. Totals and percentage frequency included. Statistical analysis included in Table 2. AF = absolute frequency; RF = relative frequency.
| Admission History vs Diagnosis | ||||||||
| Trauma | Other | Total | ||||||
| Fracture | Soft tissue | |||||||
| AF | RF | AF | RF | AF | RF | AF | RF | |
| (n) | % | (n) | % | (n) | % | (n) | % | |
| Ground find | 63 | 15.29 | 56 | 13.59 | 70 | 16.99 | 189 | 45.87 |
| Animal attack | 33 | 8.01 | 42 | 10.19 | 33 | 8.01 | 108 | 26.21 |
| Human Activity | 27 | 6.55 | 22 | 5.34 | 39 | 9.47 | 88 | 21.36 |
| Other | 7 | 1.70 | 4 | 0.97 | 16 | 3.88 | 27 | 6.55 |
| Total | 130 | 31.55 | 124 | 30.10 | 158 | 38.35 | 412 | 100 |
Table 6.
Frequency of barn owls admitted to CWH sorted by season and Diagnosis categories. Totals and percentage frequency included. Statistical analysis included in Table 2. AF = absolute frequency; RF = relative frequency.
Table 6.
Frequency of barn owls admitted to CWH sorted by season and Diagnosis categories. Totals and percentage frequency included. Statistical analysis included in Table 2. AF = absolute frequency; RF = relative frequency.
| Season vs Diagnosis | ||||||||
| Trauma | Other | Total | ||||||
| Fracture | Soft tissue | |||||||
| AF | RF | AF | RF | AF | RF | AF | RF | |
| (n) | % | (n) | % | (n) | % | (n) | % | |
| Winter | 38 | 9.22 | 44 | 10.68 | 51 | 12.38 | 133 | 32.28 |
| Spring | 68 | 16.5 | 60 | 14.56 | 70 | 16.99 | 198 | 48.06 |
| Summer | 14 | 3.39 | 12 | 2.91 | 7 | 1.69 | 33 | 8.01 |
| Autumn | 8 | 1.94 | 10 | 2.43 | 30 | 7.28 | 48 | 11.65 |
| Total | 128 | 31.07 | 126 | 30.58 | 158 | 38.35 | 412 | 100.0 |
Table 7.
Frequency of barn owls admitted to CWH sorted by admission history and outcome categories. Totals and percentage frequency included. Statistical analysis included on Table 2.
Table 7.
Frequency of barn owls admitted to CWH sorted by admission history and outcome categories. Totals and percentage frequency included. Statistical analysis included on Table 2.
| Admission History vs Outcome (condensed) | ||||||
|---|---|---|---|---|---|---|
| Died | Released | Total | ||||
| AF | RF | AF | RF | AF | RF | |
| (n) | % | (n) | % | (n) | % | |
| Ground find | 96 | 26.23 | 89 | 24.32 | 185 | 50.55 |
| Animal attack | 36 | 9.84 | 65 | 17.76 | 101 | 27.6 |
| Human Activity | 48 | 13.11 | 38 | 10.38 | 86 | 23.5 |
| Other | 12 | 3.28 | 14 | 3.83 | 26 | 7.1 |
| Total | 165 | 45.08 | 201 | 54.92 | 366 | 100 |
Table 8a.
Frequency of barn owls admitted to CWH, sorted by diagnosis and outcome (condensed) categories. Totals and percentage frequency included. Statistical analysis included in Table 2.
Table 8a.
Frequency of barn owls admitted to CWH, sorted by diagnosis and outcome (condensed) categories. Totals and percentage frequency included. Statistical analysis included in Table 2.
| Diagnosis vs Outcome (condensed) | |||||||
| Died | Released | Total | |||||
| AF | RF | AF | RF | AF | RF | ||
| (n) | % | (n) | % | (n) | % | ||
| Trauma | Fracture | 96 | 24.12 | 29 | 7.29 | 125 | 31.41 |
| Soft tissue | 44 | 11.06 | 73 | 18.34 | 117 | 29.4 | |
| Other | 52 | 13.07 | 104 | 26.13 | 156 | 39.2 | |
| Total | 192 | 48.24 | 206 | 51.76 | 398 | 100 | |
Table 8b.
Frequency of barn owls admitted to CWH sorted by diagnosis and outcome (expanded) categories. Totals and percentage frequency included. Statistical analysis included in Table 2.
Table 8b.
Frequency of barn owls admitted to CWH sorted by diagnosis and outcome (expanded) categories. Totals and percentage frequency included. Statistical analysis included in Table 2.
| Diagnosis vs Outcome (expanded) | |||||||||||||
| Spontaneous Death | Euthanased | Unexplained Death | Released | Passed to carer | Total | ||||||||
| AF | RF | AF | RF | AF | RF | AF | RF | AF | RF | AF | RF | ||
| (n) | % | (n) | % | (n) | % | (n) | % | (n) | % | (n) | % | ||
| Trauma | Fracture | 3 | 0.75 | 62 | 15.58 | 31 | 7.79 | 6 | 1.51 | 23 | 5.78 | 125 | 31.41 |
| Soft tissue | 5 | 1.26 | 20 | 5.03 | 19 | 4.77 | 19 | 4.77 | 54 | 13.57 | 117 | 29.40 | |
| Other | 9 | 2.26 | 16 | 4.02 | 27 | 6.78 | 32 | 8.04 | 72 | 18.09 | 156 | 39.20 | |
| Total | 17 | 4.27 | 98 | 24.62 | 77 | 19.35 | 57 | 14.32 | 149 | 37.44 | 398 | 100 | |
Table 9.
Frequency of barn owls admitted to CWH sorted by season and outcome categories, unknown outcome excluded. Totals and percentage frequency included. Statistical analysis included on Table 2.
Table 9.
Frequency of barn owls admitted to CWH sorted by season and outcome categories, unknown outcome excluded. Totals and percentage frequency included. Statistical analysis included on Table 2.
| Season vs Outcome | ||||||||||||
| Spontaneous Death | Euthanased | Undefined Death | Released to environment | Released to care | Total | |||||||
| AF | RF | AF | RF | AF | RF | AF | RF | AF | RF | AF | RF | |
| (n) | % | (n) | % | (n) | % | (n) | % | (n) | % | (n) | % | |
| Winter | 4 | 1.01 | 23 | 5.78 | 29 | 7.29 | 22 | 5.53 | 53 | 13.32 | 131 | 32.91 |
| Spring | 9 | 2.26 | 54 | 13.57 | 36 | 9.05 | 17 | 4.27 | 69 | 17.34 | 185 | 46.48 |
| Summer | 1 | 0.25 | 12 | 3.02 | 2 | 0.50 | 6 | 1.51 | 13 | 3.27 | 34 | 8.54 |
| Autumn | 3 | 0.75 | 9 | 2.26 | 10 | 2.51 | 12 | 3.02 | 14 | 3.52 | 48 | 12.06 |
| Total | 17 | 4.27 | 98 | 24.62 | 77 | 19.35 | 57 | 14.32 | 149 | 37.44 | 398 | 100 |
Disclaimer/Publisher’s Note: The statements, opinions and data contained in all publications are solely those of the individual author(s) and contributor(s) and not of MDPI and/or the editor(s). MDPI and/or the editor(s) disclaim responsibility for any injury to people or property resulting from any ideas, methods, instructions or products referred to in the content. |
© 2024 by the authors. Licensee MDPI, Basel, Switzerland. This article is an open access article distributed under the terms and conditions of the Creative Commons Attribution (CC BY) license (http://creativecommons.org/licenses/by/4.0/).
Copyright: This open access article is published under a Creative Commons CC BY 4.0 license, which permit the free download, distribution, and reuse, provided that the author and preprint are cited in any reuse.


