Submitted:
20 November 2024
Posted:
21 November 2024
You are already at the latest version
Abstract
Coughing is a symptom of many respiratory diseases. An increased amount of coughs may signal an (upcoming) health issue, a decreasing amount of coughs may indicate an improved health status. The presence of a cough can be identified by a cough classifier. The cough density fluctuates considerably over the course of a day with a pattern that is highly subject dependent. This paper provides a case study of cough patterns from COPD patients as determined by a stationary semi-automated
cough monitor. It clearly demonstrates the variability of cough density over the observation time, its patient specificity and dependence on health status. Furthermore, an earlier established empirical finding of a linear relation between mean and standard deviation of a session's cough count is validated. An alert mechanism incorporating these findings is described.
Keywords:
COPD
; monitoring
; cough
; exacerbation
1. Introduction
Cough is an important symptom occurring in many respiratory diseases and associated with exacerbations, lung function decline and risk of death [1,2,3]. Increased cough is common during AE-COPD and a prodrome of increasing symptoms including cough can be seen for up to 2 weeks before AE-COPD. Thus questionnaires for monitoring the status of asthma (ACT: asthma control test) and COPD (CAT: COPD assessment test) include an assessment on cough. Calverley et al. [4] considered questionnaire reported symptoms like cough, breathlessness, chest tightness and night-time wakening and found a mean increase in symptom score of around 1 unit (scale: 0–4) at the time of exacerbation. This change of magnitude was found at a population level; in an individual patient it is unlikely to prove clinically useful.
Reasons why questionnaire symptoms do not perform as hoped may be various. There is the coarse quantisation of the response; increasing the level of detail (like a visual analogue scale: VAS) is uncommon as the required introspection will likely become an issue: posing questions that are hard to answer will typically come at the cost of decreased adherence. The interpretation of the labels associated with the questions are usually left to the user and this results in subjectivity. Furthermore, the moment that a patient tends to report a significant increase in the burden of a symptom (1 step on the questionnaire scale), is likely also the moment to seek advice meaning that no additional lead time would exist even if the questionnaire scale would be apt.
Out of the questions from the CAT (cough, sputum, chest tightness, night-time awakening), cough is the symptom with the highest concordance with AE-COPD, independent of COPD severity [4]. Cough is also a symptom that can be detected in an automated way as shown in many technical studies on prototype cough detection systems, for reviews see [5,6]. An automated system would mitigate issues associated with subjectivity, introspection and reporting. Sensors that are used are sound pressure sensors and/or accelerometers attached to the chest. Various systems are currently around such as wearable recorders [7], and wearable sensors, e.g., [8,9,10].
For patient comfort and adherence, an unobtrusive and hassle-free system is preferred. Since day- and night-time coughing is correlated, it would suffice to measure either. Measuring night-time has several advantages. It can be done truly hassle-free by a stationary system in the home of a patient. Also, the nighttime is a period with identical behaviour (sleeping) while the day-time is agenda driven and may involve all kind of activities inducing unexplained day-to-day variability or requiring extra channels to collect relevant contextual information. Finally, using a microphone as sensor in the sleeping quarters of a patient yields an off-body system and the night-time is usually also the most quiet period of a day making sensing and detection more robust.
For these reasons, the development of an unobtrusive stationary off-body microphone-based monitoring system was pioneered and has been reported in [11,12,13]. It holds the promise of constituting an element in a exacerbation prediction tool 1. A further validation of this system was undertaken in a double-blind clinical study. This paper addresses part of the outcomes of this study. It focuses on aspects of the cough monitor and cough behaviour (patient specific patterns) such as the variability of the cough density over the course of a monitoring session and the validation of an earlier reported empirical relation between mean and standard deviation in case of a stable chronic coughing patient.
2. Methods and Materials
2.1. Data Collection
We conducted a prospective longitudinal double-blind study of continual cough monitoring in COPD patients experienced in telemonitoring. To provide a reasonable chance of detecting AE-COPD, participants were studied for 12 weeks using domiciliary cough monitoring and asked to complete daily questionnaires each morning. If no exacerbation occurred in the first 12 weeks, the participants were asked to continue for at most another 3 months.
The study is double blind in the sense that i) cough data was analysed without any knowledge of the patient status or condition and ii) moderate and severe COPD exacerbations were identified retrospectively without access to the cough monitor data. The primary aim of the trial was to validate a (causal) alert mechanism for exacerbations based on cough trend data [12].
The current paper addresses secondary aims of the study: better understanding of cough behaviour and associated potential improvements of the alert mechanism. The main contributions of this paper are twofold. In the first place, we demonstrate patient variability in nighttime coughs patterns in the form of a case study and show its dependence on health status. Secondly, we validate the empirical relation between mean cough count and cough count variation [12]. Both have been done using only the data of the cough monitor, i.e., without access to the medical data, questionnaire data and identified COPD exacerbations.
The study was reviewed and approved by the North East-York Research Ethics Committee (REC Ref.: 21/YH/0203), the United Kingdom Health Research Authority and the Internal Committee Biomedical Experiments of Philips Research. Informed consent was obtained from all participants involved in the study. The patient target was set at and 2 patients failed to finish the trial. One withdrew almost immediately and the other one changed home leaving equipment behind. The data collection process ran from August 2022 to June 2024. Several issues delayed a speedy progress, including COVID, political changes affecting equipment, and organizational changes at Philips.
2.2. Cough Monitor
The used cough monitor is a stationary system placed in the sleeping quarters of the participant. It is a successor to systems used in earlier studies [11,13,15] targeting unobtrusive and hassle-free monitoring of cough. The prototype consisted of a single board computer (ASUS tinkerboard 2G) with a USB measurement microphone (Dayton IMM6) and a cellular dongle (Huawei E5330), see Figure 1. Feature extraction and type of cough classifier were as in earlier trials [11,13,16].
To prevent issues with power outage, the system was created such that it would start up automatically. At the installation, it is provided with a start and stop time that were set to 9PM and 9AM, respectively. It was assumed this covers the time in bed of all patients and such a monitoring period is called a session. To generate time stamps and to start and stop monitoring at the correct moments, timing information is required. This information is drawn from the cloud. In view of the long period over which the monitor is intended to operate in a stand-alone mode, the system is shut down and booted every day which is an effective means to prevent memory leakage. A consequence is that if the connection to the cloud is not established, the timing information is not available and the monitor will not start a session.
For the first 8 participants, the dongle contained an IoT SIM card (TruPhone) operating over the 2G network. Later participants used a 5G SIM card (Vodafone, UK). Data were transferred to the cloud (AWS) from where data were downloaded to a proprietary system for analysis. To ensure privacy, only time stamps and audio features are transmitted at moments where the sound scape changes. We refer to this as acoustic events or transients. For a limited number of these events, also a one second audio snippet is recorded and transmitted. The limited use of short snippets prevents listening in to any conversation while enabling checking for audio issues with the devices or its set-up (e.g., a ticking clock next to the monitor can be detrimental) and creating a personalised classifier.
At the server side, the data is collected and a classifier is trained based on the first monitoring days as described in [12,16]. In these previous trials, solid personalized classifiers were attained when trained with around 200 coughs. With such target in mind, the number of days that requires annotation (based on the snippet-feature combination) is variable because the number of acoustic events is highly dependent on the patient [17].
A high-level schematic overview of the processing is given in Figure 2. On the left-hand side there is the processing in the patient’s home. It consists of the audio processing based on an audio processing library A. The audio processing captures the audio and extracts features and snippets. This part is a mature software component and has been deployed successfully in several trials. The audio processor is embedded in a scheduler with interface and the communication part including encryption. This has been developed for experimental purposes only. On the right-hand side, there is a data receiving and development unit D where data is received, decrypted and stored. Furthermore, there is an annotation and classifier training system to develop the personalized classifier based on the snippets and the associated subset of audio features. The central cough monitor processing is in unit C containing the trained (personalized) classifier that classifies each received audio feature and creates cough counts based on classifier outputs and associated timestamps. The counts form a time series and are input to the alert mechanism.
2.3. Cough Classifier
The cough monitor is closely tied to the operation of the human hearing system as this defines the groundtruth of what a cough is [18]. This starts with the features that are extraction from the audio in the home of the patients. These incorporate a variant of Mel frequency cepstral coefficients (MFCC). Next to these, energy levels before and at the acoustic event and the (local) density of events are extracted. The deployed classifier is a personalised classifier. A generic cough classifier would essentially require a one-class classifier, i.e., only using information on the sound of a cough without considering the environment in which the cough is being uttered. The neglect of using environmental information presumably leads to worse detection performance and is certainly not in line with our knowledge on human perceptual processing which actively uses contextual information [19].
For annotation, an audio-visual interface was used. The audio is essential to annotate if the features belong to a cough, and not to an environmental sound or a vocal sound of the patient which is not a cough (like: throat clearance, sigh, moan, sneeze, burp, speech, laughter). The signal waveform is provided where a typical cough consists of three phases: an explosive part, an intermediate stage and a voiced phase. Not only is the visualization helpful because of this specific pattern, it is also instrumental to obtain a single identification of the cough over time and not multiple. The explosive phase of the cough is defined as the target as this is the acoustic response to the opening of the vocal chords after pressure build-up: a requirement for a cough by definition. It is also the most easily identified part of the cough: the intermediate and voiced phase are not always clearly present in sound and visuals. To obtain a unique signature for a cough, the position of the feature extraction is shown in the graph and the annotator checks if this corresponds to the explosive phase in case the sound resembles a cough.
For each patient, a classifier was trained using an extreme gradient boosted decision tree classifier (XGBoost) where default settings were used in the training. After training the classifier, it is executed on the entire feature set using a relatively high threshold . The outcome is a list of time stamps of detected coughs. To create a profile of the cough density over the monitoring periods, the following procedure was used. One hour periods were selected and shifted over the monitoring period with a 15 minute update. The detected coughs in that period were counted. Data from the same time interval in all sessions were collected and treated as a random variable: mean, standard deviation, median and quartiles were calculated. Also the -trimmed mean was calculated with .
Note that we prefer to speak about cough densities rather than cough frequencies. Frequency is term connected to regularly occurring events, periodicity and quasi-stationarity. Since the number of coughs within a given timespan is far from periodic or equally spaced over time, the term cough density is preferred.
2.4. Alert Mechanism
The alert mechanism defined in [12] uses a threshold that is based on a period of low cough counts not covering any exacerbation days. This method is not useable in the present situation due to the double-blind character of the study. To solve this, an adaptive threshold was developed which is also more appealing for long-term use in real-life to allow for, e.g., aging and seasonal effects. The method works as follows. The time series is mapped to the B-scale to be able to work with an identical outlier setting for all patients [12]. Data of the latest L sessions is input to determine a baseline. The oldest sessions are used to define the current threshold, D is the delay or dead zone. The median is taken over the observations and this median is input to a first-order IIR filter with pole . An offset O is added to define the dynamic threshold level T.
An alert is raised based on the smoothed cough counts on the B-scale using a first-order IIR filter with pole p. If this smoothed cough count exceeds the threshold at least twice in the latest three sessions, an alert is raised. The settings for the mechanism are given in Table 1. We note that the parameter , , , p correspond exactly to those in [12]. The parameters associated with the adaptive mechanism (D, and O) were set based on the cough data only, i.e., without knowledge of diagnosed exacerbations. To illustrate the behaviour, Figure 3 shows three examples of cough count (B-scale), smoothed cough count and constructed dynamic threshold T. All three examples show alert days as indicated by the red circles. The red circles are on the black smoothed line, as this is the input to the alert mechanism. Clinical aspects of the study and validation of this particular alert mechanism will be covered elsewhere. In the remainder, we will concentrate on the more general aspects of cough counting: cough density profiles and validation of the earlier proposed cough scale (B-scale used in Figure 3).
3. Results
3.1. Patient Characteristics
From the 40 enrolled patients, one withdrew and another one didn’t finish the trial. The characteristics of the remaining 38 patients are given in Table 2. Compared to our earlier studies [11,13], less severe patients were involved in this trial.
Not all patients provided useable cough data. This is a consequence of the set up of the study (retrospective without interventional mechanism), behaviour of patients (absence (e.g., holidays), moving) and system issues (disconnected power, interrupted data connection). From the 38 patients, 4 were immediately excluded from further analysis. There were 3 patients (P035, P038, P039) with severe connectivity issues and patient P012 had connectivity and RF interference issues. It made the data too scarce to run the alert mechanism and, in most cases, there was even too few data to train a classifier.
In Figure 4 the distribution of duration of the monitoring (number of days from first and last received data), the number of days within that period that data was received, and the number of missing days (i.e., the difference between duration and monitoring sessions) is shown in a boxplot. The median of missing days is about 10, on a median of 84 days. Though the patient can turn off the power, it is presumed that the main cause for missing days is that the system was unable to schedule its daily monitoring session due to a not guaranteed mobile connection.
3.2. Annotation and Classifier Performance
For each patient, a trained classifier was created by annotating the snippets that were transmitted. During annotation it was found that the monitor had issues with RF interference which appeared in the audio as spike trains. Next to patient P012 (already ruled out because of connectivity issues), this interference made the audio snippets (and audio features) for P020 questionable. With other patients, RF interference occurred much more rarely and is expected to have no or little impact on the results.
It was also observed that for one patient (P018) the dominant respiratory acoustic event was not a cough but what sounded as a combination of a cough with a throat clearance. The sound and waveform patterns observed in annotation thus did not match to this case as the annotator was instructed to identify the explosive part in a normal three-stage acoustic event [20] exhibiting intermediate and voiced phases after the explosive phase. No attempt was made to define an annotation process suited to this singular case. The data of this patient were excluded from further analysis. For more details on the annotation, see Appendix A.
Settting P018 and P020 aside, the number of patients with cough data becomes 32. From these patients, 12 had a partner and 20 not. From the 12 partners, four were reported as coughers, four were not, and for the other four cases this is unknown.
The experience from earlier experiments indicated that solid classifiers were obtained when around 200 coughs where used in the training. The number of snippets that were annotated as coughs ranged from 178 to 278 over the patients. The number of annotated non-coughs ranged from 256 to 8779, clearly marking the huge range of cough prevalence in the annotated snippet set.
Another observation that was made during data screening and annotation was that it is questionable whether patient P027 was actually occupying the sleeping quiarters after an initial period of about 8 weeks: both acoustic events and coughs dropped dramatically for almost all days. With other patients, there are also questions around presence having days with abnormal low number of acoustic events and coughs. No mechanism was constructed to rule out these days.
Figure 5 gives the boxplots representing the sensitivity, specificity, accuracy and positive predictive value as determined in the training with a threshold setting of 0.9 for cough classification. The fraction of acoustic events classified as coughs (positive rate: PR) on the entire data set is also included. These statistics highlight our basic notions in the design of an alert mechanism: a high PPV is essential if the cough counts are to act as its substrate. In view of the low cough prevalence [17] and robustness for exposure to untrained acoustic events [20], a high threshold (0.9) was set for the cough classifier. This ensures a high PPV by favouring specificity over sensitivity. The sensitivity ranges from 0.26 to 0.85, the sensitivity is high (all except 2 above 0.975), the full PPV range stretches from 0.8 to 0.98 and the accuracy is in the range 0.86 to 0.98 (except for 2 patients).
In Figure 6, the prevalence of coughs as determined during annotation is compared to the positive rate. We note that the positive rate (detected coughs) is low: for 75% of the patients below 10% of the acoustic events. There is one clear outlier where a quiet acoustic environment is combined with a large amount of coughs resulting in a positive rate of nearly 0.4. The positive rate is smaller than the annotation prevalence: the median is 6% while the median cough annotation prevalence is 13%. This is mostly due to a low sensitivity induced by the preferred high threshold setting (median: 0.54). Other factors that contribute to the difference are that prevalence determined from annotation covers only a small part of full data while the positive rate is determined over all acoustic events and that the snippet selection is biased slightly towards the louder events in order to facilitate annotation.
3.3. Cough Counts
Each detected cough carries a time stamp. This enables statistics of these cough counts where we consider mean and variance of the counts over a monitor session, and cough density profiles over the monitoring period (9PM to 9AM). The amount of coughing depends heavily on the participant.
For each patient, it was checked if an alert was raised by our prototype alert mechanism: in that case the cough count is not stable over the days. As the start of the alert track is delayed because the system needs time to collect baseline characteristics, the trend plots may reveal considerable variation in the beginning without an alert being generated. Therefore, a visual inspection of the data was undertaken (by the first author) to verify if the first part of the cough data did not have an upward or downward trend. In case of absence of alert and absence of trend, the patient cough data is labelled as stable. An exception to this rule was P021 showing an enormous spread in cough counts in the middle of the observation period and this was labelled as unstable as well. Only 6 out of the 32 cough trends were labelled as stable, about half (17 out of 32) had at least one alert. An overview of this data is in Appendix B.
In case of stable cough counts over the days, the averaging over the day creates a cough density profile presumed to be characteristic for that particular patient during normal respiratory condition. Figure 7 shows the profiles of participants with a stable cough count. In the cough density plots, the median density profiles are provided (expressed in coughs per hour) together with the quartile ranges and the -trimmed mean with . We observe that these curves are not uniform but exhibit peaks at different time instances. Some graphs have peaks in the morning hours, some in the evening, the latter presumably corresponding to the time the patient goes to sleep. Some patients hardly cough at all in the sleeping hours, yet some have a steady floor in the cough density. The diversity of patterns agrees well with the observations in [12]. For completeness, the set of all cough density patterns is provided in Appendix B.
In [12] a linear relation was found between mean and standard deviation of cough counts of patients that had no medical issues during the monitoring period. To validate this empirical relation for the present cough data, the current data and the earlier found model are jointly plotted in Figure 8. The data of the assumed stable patients follow the earlier reported linear trend while the data of the other patients are located dominantly above this line.
The linear relationship suggested a scale transformation to create a cough count scale (called the B-scale) where a unit step has the same meaning anywhere on the scale [12]. To show the effect of the scale, we provide the cough count quartile ranges as a function of the median in Figure 9. The dashed line representing the median plus a fixed offset runs nicely congruent with the third quartile, especially for the patients with a stable cough count. For the non-stable patients, the bars sometimes extend above the line, and sometimes agree with it. This is assumed to be caused by the use of robust statistics implying that if the data is mostly stable, the used metrics will follow that of the stable patients. Note that there are two patients (P017, P027) with low median cough count and bars below the blue line. This may be caused by prolonged absence of the patient.
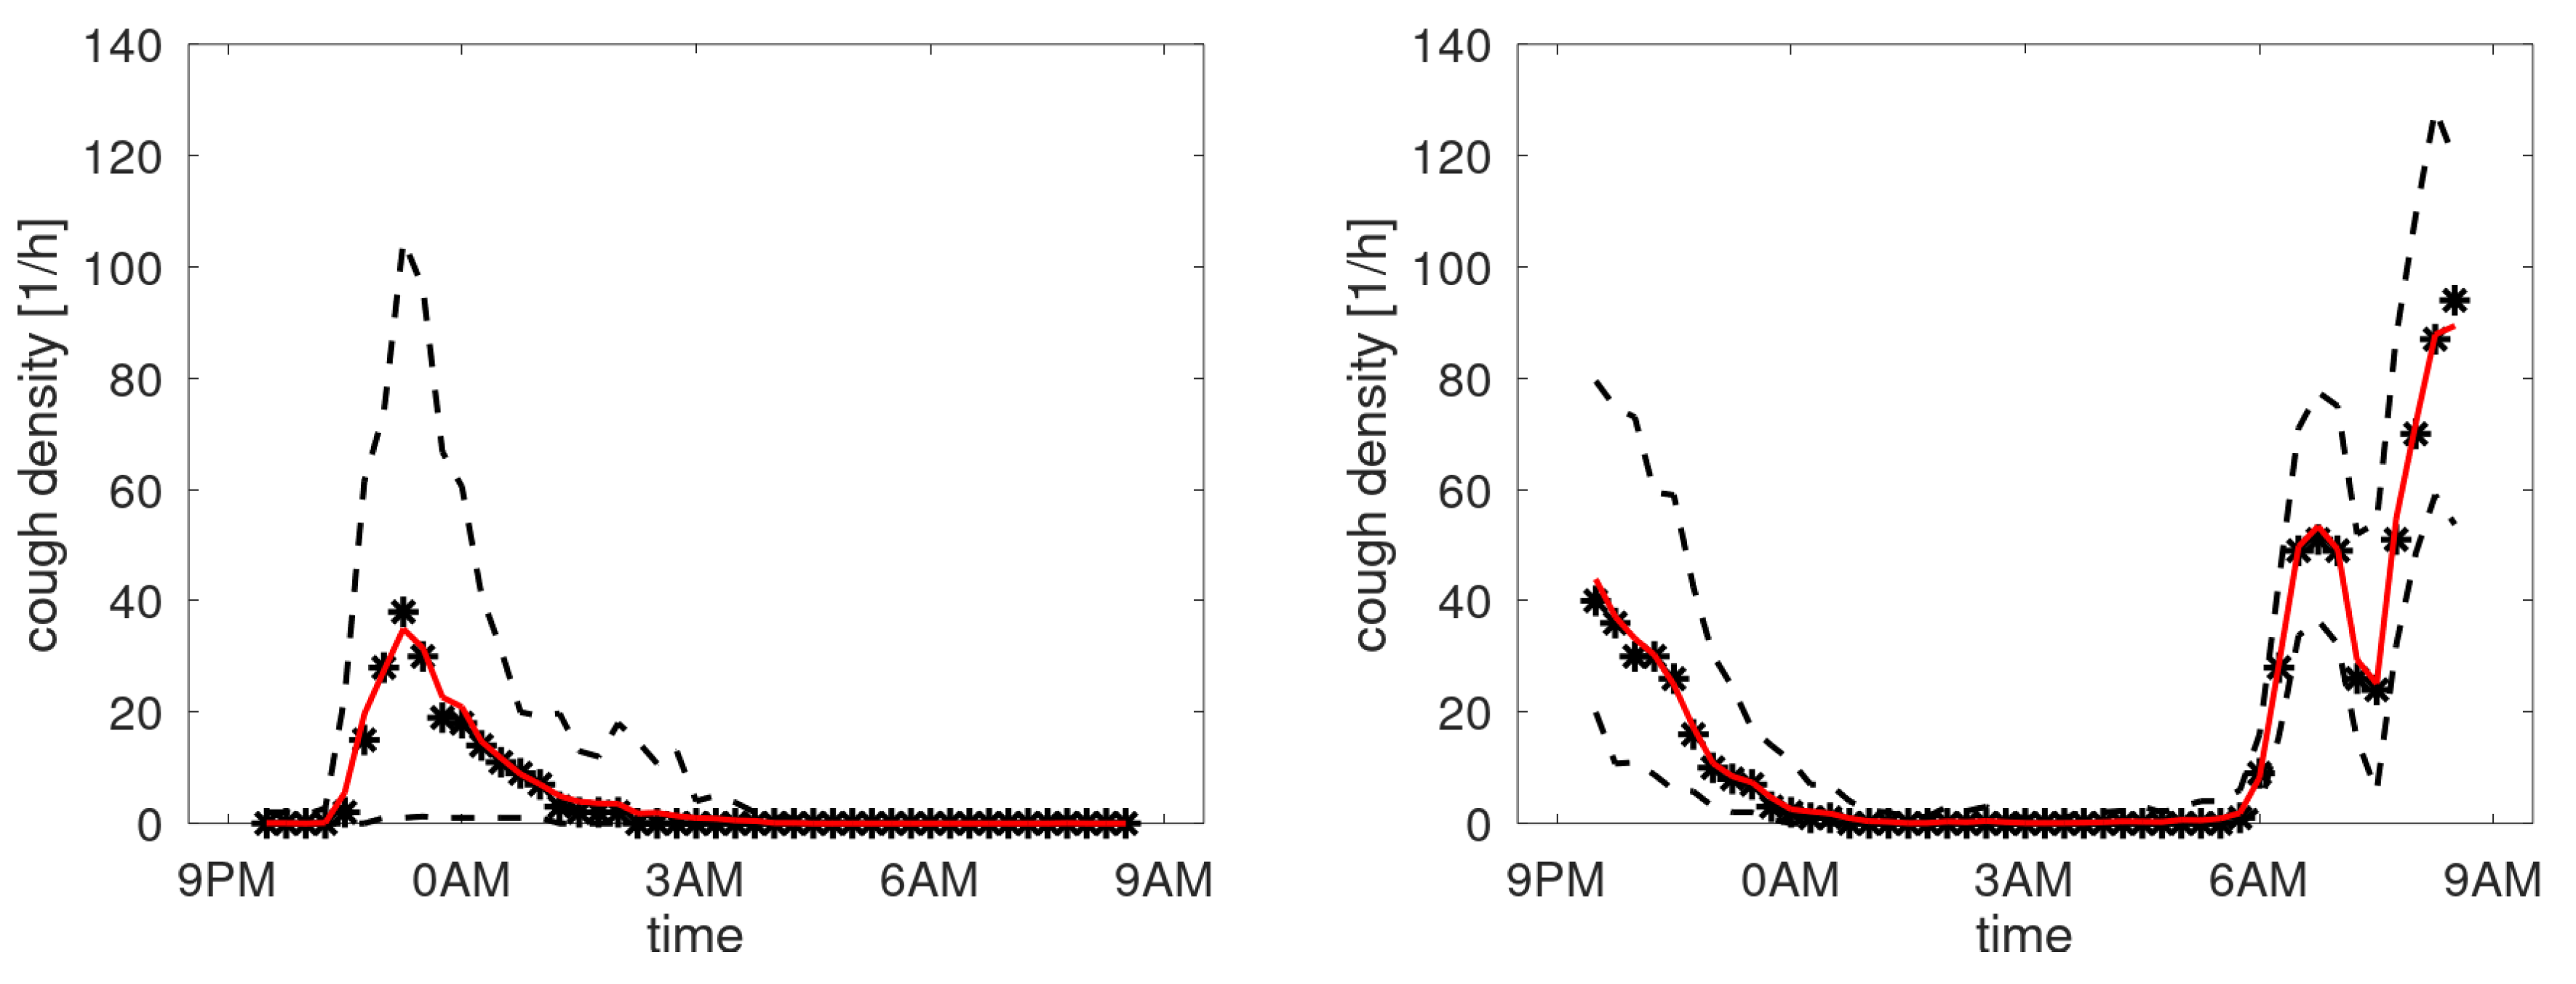
Like said, creating profiles by averaging over days for patients having respiratory issues during the observation period may not provide a meaningful density profile. To test this hypothesis, the data of each patient was split into two equal parts: sessions with highest and lowest counts. A profile was created for these two data sets. To compare these profiles visually, they were normed such that the mean density equals 1 cough/h. In Figure 10, the profiles are shown for patients having stable cough counts. Our interpretation of the density profiles are qualitatively rather similar. In contrast, four selected profiles are shown from the patients with an unstable cough trend in Figure 11. Here we observe that clear shifts in the densities occur. The top-right graph reveals that for days with a high cough count an additional peak occurs around midnight. The bottom-right shows a heightened peak in the morning hours. The bottom-left completely changes its character from coughing dominantly in the evening (at around 10PM) to coughing all night long. The top-left graph has a change in timing: the evening peak occurs earlier and an even clearer shift in the two peaks in the morning. This would be compatible with a patient going to bed earlier and sleeping less long in case of increased cough count and thus presumed respiratory issue.
4. Discussion
For COPD patients with an appreciable nighttime cough count a cough density profile can be constructed. These density functions tend to be rather uniform (flat), have one peak (the morning or evening cough) or double-peaked (morning and evening cough). The results confirm patterns shown in an earlier study [12] and demonstrate a large variation over the population.
The deployed method of creating density profiles uses averaging over all days. To prevent bias, we considered only patients with data where the alert mechanism wasn’t triggered and visual inspection didn’t contradict the assumption of similar behaviour at different days. Results from all other patients are presented in Appendix B. Even though robust statistical measures were used, they may be biased and therefore should preferably not be used as a description of the patient’s normal cough density. Nevertheless, also these curves show pronounced patient-specific peaks.
Note that for some patients the density profile is relatively large or even maximum at/near start or stop of the monitoring period. This is an undesired monitoring setting as it means that the count can be largely influenced by slight changes in habits of the patient. It may be associated with acoustically open spaces or deviant sleeping hours.
For stable patients, an empirical relation has been proposed between mean and standard deviation of the nighttime cough count [12] (for unstable patients, this is not meaningful: mean and standard deviation estimates are rather sensitive to outliers). This relation was verified by considering data from cough counts where the cough count trends were identified as stable.
The earlier introduced B-scale for cough count was applied to the present data. It confirms that this scale enables defining a patient-independent offset which, when added to a robust statistic of the mean (baseline), defines a cut-off level identifying outliers.
Lastly we considered the dependence of the cough count per night on the density. This confimed that the shapes of the density profiles were only slightly dependent on the strength for stable patients. For unstable patients, the shape of the density profiles may vary considerably with the total amount of coughs per night, and thus presumably with the patient’s respiratory health.
5. Conclusions
We have analyzed data from COPD patients () obtained by a stationary nighttime cough monitor. Cough density profiles were created demonstrating a large degree of variation of cough behaviour across patients. The empirical relation between mean and standard deviation of the nightime cough count was confirmed. The effect of mapping the cough scale for uniform outlier detection was illustrated. These findings deepen our insights and may serve as guidelines in the design for clinical applications like alert mechanisms for chronic coughers. The data also suggest that not only the intensity (amount of coughs in a day or night) but also the shape of cough density profiles may vary substantially with the patient’s respiratory state. Validation of the alert mechanism incorporating these insights will be the next step.
Author Contributions
Conceptualization, A.C.d.B. and A.H.M.; methodology, A.C.d.B., M.G.C. and A.H.M.; software, A.C.d.B., O.O. and R.R.; validation, A.C.d.B. and A.H.M.; formal analysis, A.C.d.B. and R.R.; investigation, A.C.d.B., O.O., S.T.-N. and R.R.; data curation, S.T.-N.; supervision, M.G.C.; visualization, A.C.d.B.; writing—original draft preparation, A.C.d.B.; writing—review and editing, A.C.d.B., O.O., R.R., M.G.C. and A.H.M. All authors have read and agreed to the published version of the manuscript.
Funding
This research was funded Philips Innovation Hub Eindhoven.
Institutional Review Board Statement
The study was conducted in accordance with the Declaration of Helsinki, and approved by the North East-York Research Ethics Committee (REC Ref.: 21/YH/0203), the United Kingdom Health Research Authority and the Internal Committee Biomedical Experiments of Philips Research.
Informed Consent Statement
Informed consent was obtained from all subjects involved in the study.
Data Availability Statement
Data collected in the clinical trial reside at Hull York Medical School.
Acknowledgments
Thanks to Inge Geven for assistence with ICBE application, Carol Lane for support during Philips Research re-organisation, Gert-Jan de Vries for data transfers and device preparations and Chuck Cain for hosting the research at Philips in the project’s final phase. Thanks to Ralph van Dinther for the indispensable annotation software.
Conflicts of Interest
A. H. Morice, M.G. Crooks, and S. Thackray-Nocera report financial support was provided by Philips Innovation Hub Eindhoven. O. Ouweltjes and R. Rietman are employees of Philips.
Appendix A. Cough Waveforms
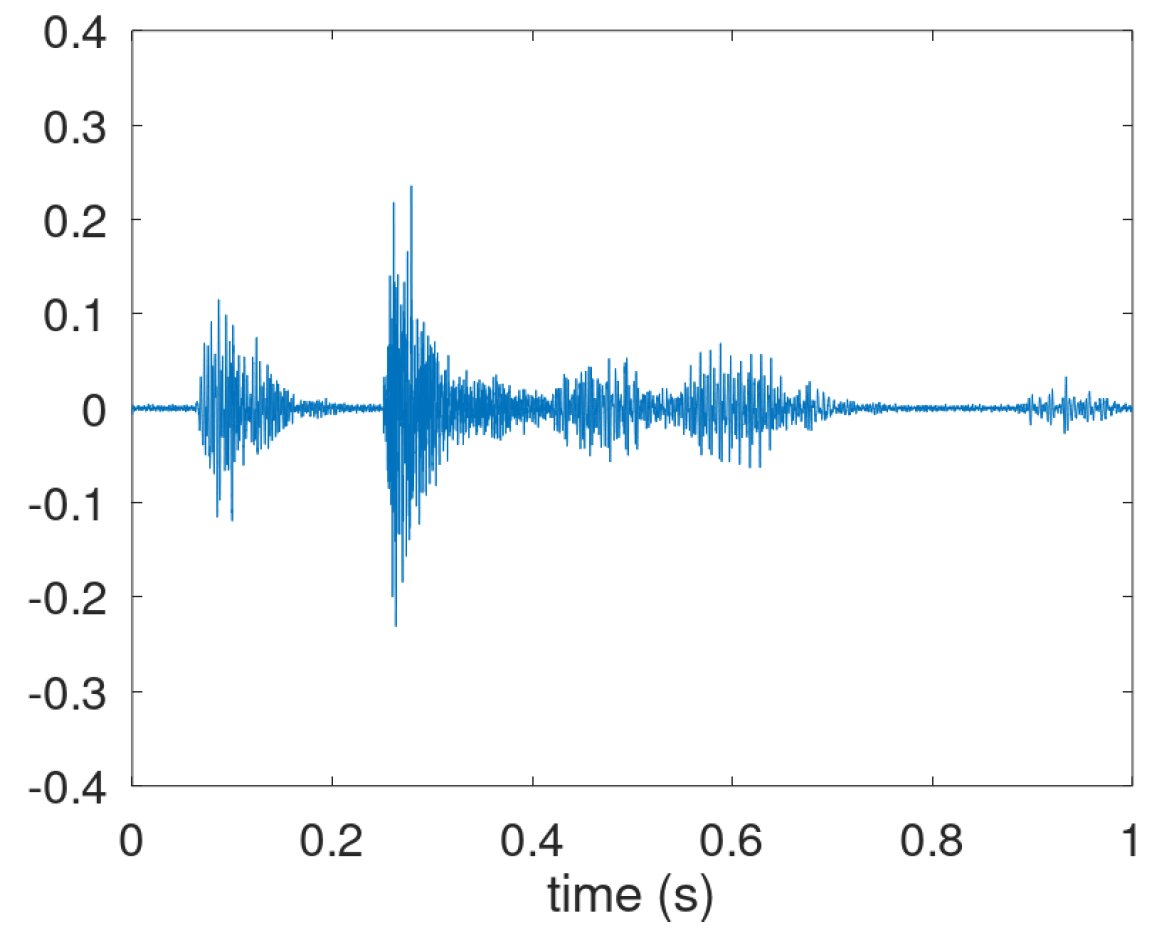
In this appendix we consider in more detail the annotation of cough and the usage of the cough waveform. According to [18], cough should basically be considered as a three-phase motor act featuring inhalation, pressure build-up and an expiratory airflow. An example of a sound waveform that illustrates this is given in Figure A1. It shows the inhalation effort (interval 0.05–0.15 s), the pressure build-up (0.15–0.25 s), and the expiratory airflow (0.25–0.75 s).
Figure A1.
Cough sound waveform with recognizable 3-phase motor act.
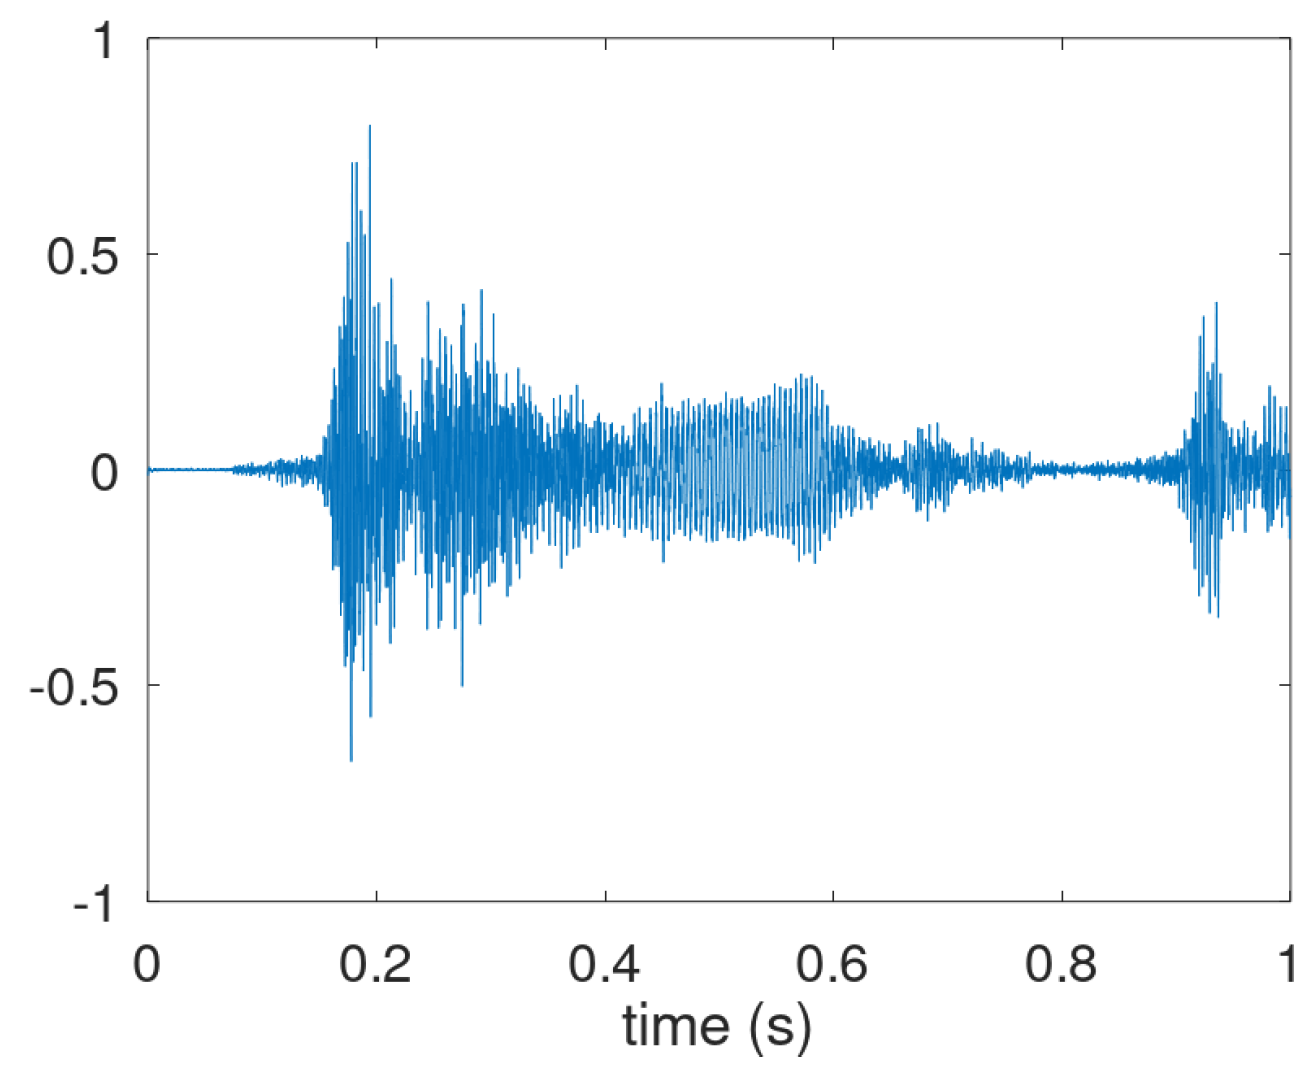
However, in many audio recordings the inhalation phase is not visible nor audible. In the waveform in the expiratory motor-phase three distinctive parts are often discernible and defined as the explosive part, the intermediate part and the voiced part. In Figure A2 these parts are shown in the intervals 0.15-0.25, 0.25–0.40 and 0.40–0.60 s, respectively. We note that these three parts are also recognizable in Figure A1, though the transition from intermediate to voiced is harder to pinpoint here. We also note that the cough shown in Figure A2 is actually the start of cough bout: a second explosive phase is visible around 0.95 s.
Figure A2.
Prototypical waveform of a cough consisting of three distinctive parts in the airflow expulsion.
Figure A2.
Prototypical waveform of a cough consisting of three distinctive parts in the airflow expulsion.
However, the third phase is not always present as shown in Figure A3. Here the explosive part is followed by a decaying intermediate phase, but the voiced phase not (clearly) visible in the waveform. Coughs having only an explosive part and a very short intermediate phase occur as well. Therefore, the annotation focused on audible coughs with a clear explosive part, i.e., associated with a release after the pressure build-up.
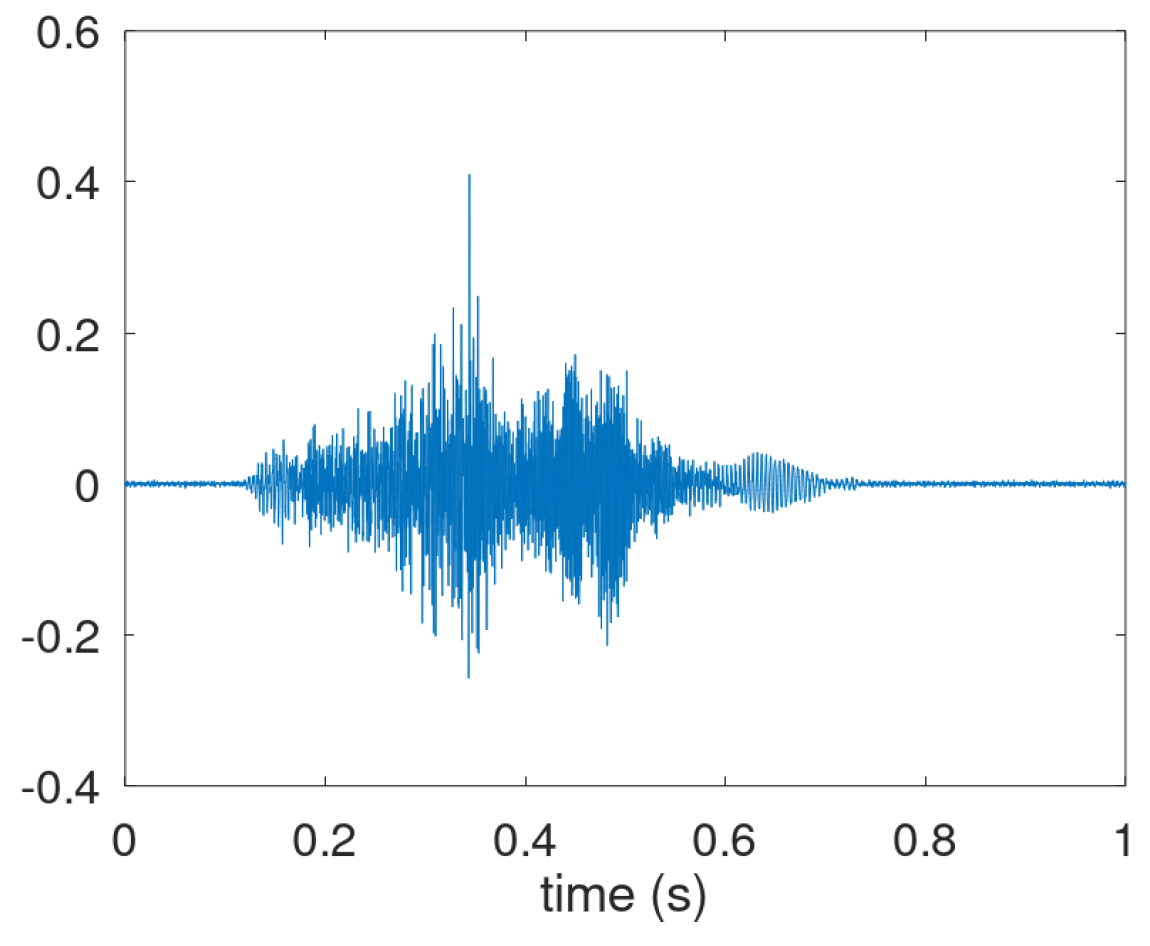
For Patient P018, cough waveforms like those illustrated in the figures so far were scarce. Instead, the dominant pattern of audible cough-like respiratory activity is shown in Figure A4. It combines an throat clearance starting at 0.15 s with a cough. Possibly, the explosive part at 0.35 s but it is integrated in the rising clearing sound. The intermediate and voiced parts are visible at 0.4 to 0.6 s and 0.6 to 0.7 s.
Figure A3.
Prototypical waveform of a cough sound where the voiced phase in the airflow expulsion appears absent.
Figure A3.
Prototypical waveform of a cough sound where the voiced phase in the airflow expulsion appears absent.
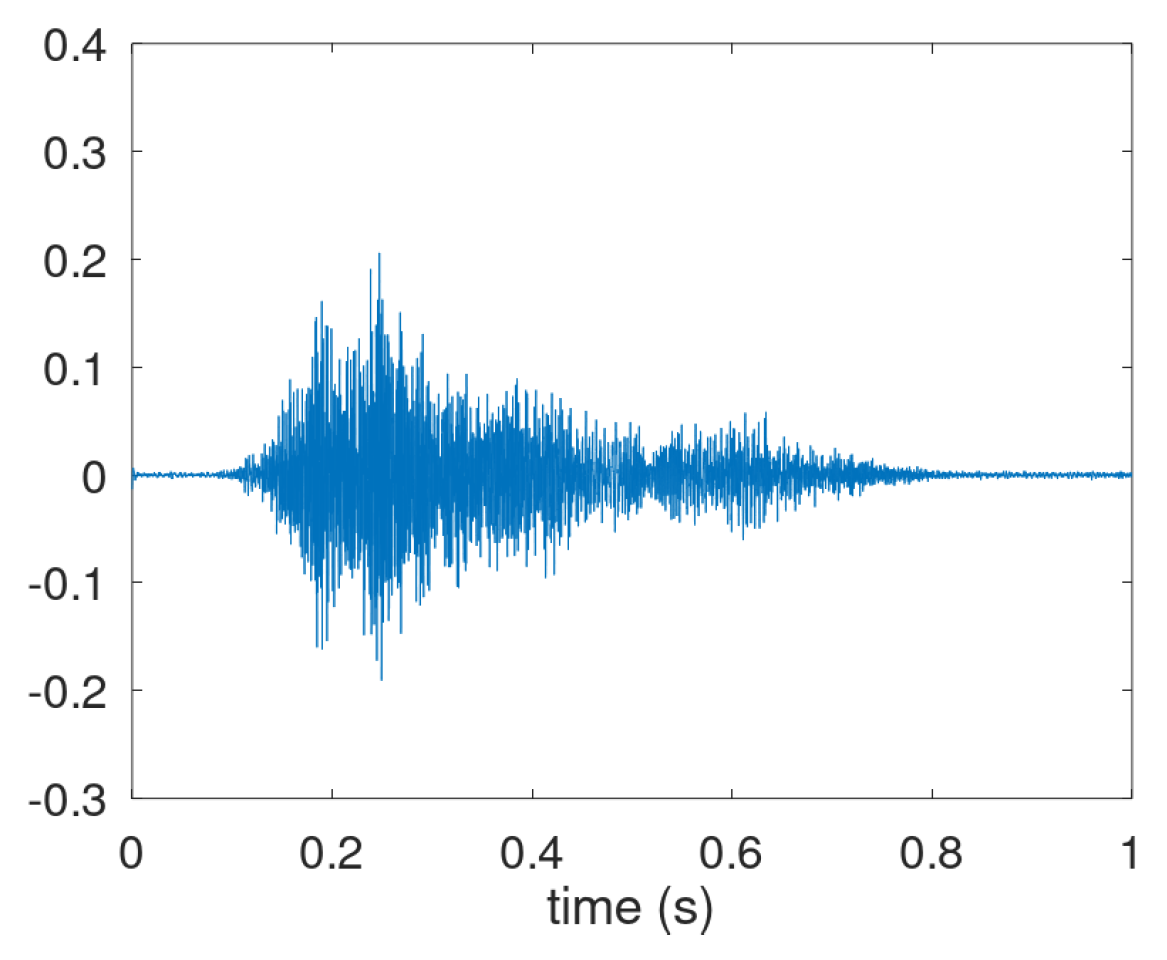
Figure A4.
Dominant waveform of acoustic adverse respiratory events for P018.
Appendix B. Cough Density Plots
In this appendix, data are provided underlying the validation of B-scale and cough density profiles of all patients are provided.
Table A1 gives for all 32 patients the basic data concerning B-scale validation and the figure number containing the profile. The first column gives the patient ID and the scond one the number of monitoring sessions. For the B-scale validation, mean and standard deviation were measured and are shown as the last two columns. Furthermore, there are two columns concerning stationarity. Column Alert identfies if the alert mechanism flagged an exacerbation. Column Stable identifies if the cough data is stationary: it is said to be stationary if no alert was raised and visual inspection of the cough graphs confirmed this. This visual inspection was undertaken since the alert mechanism is not functional in the initial period and downward trends may exist making the cough count instationary but without raising an alert. In case of absence of alert and absence of trend, the patient cough data is labelled as stable. An exception to this rule was P021 showing an enormous spread in cough counts in the middle of the observation period and this was labelled as unstable as well. Only 6 out of the 32 cough trends were labelled as stable, about half (17 out of 32) had at least one alert.

Table A1.
Specification of number of sessions, figure containing density plot, presence of alert, stability of cough trend, mean () and standard deviation () of the session cough count per patient. Processed data based on classifier threshold .
Table A1.
Specification of number of sessions, figure containing density plot, presence of alert, stability of cough trend, mean () and standard deviation () of the session cough count per patient. Processed data based on classifier threshold .
| Patient | Sessions | Figure | Alert | Stable | Mean | Spread |
|---|---|---|---|---|---|---|
| 001 | 83 | A8 | Y | N | 85.6 | 59.2 |
| 002 | 48 | A6 | N | N | 23.3 | 40.2 |
| 003 | 78 | A9 | Y | N | 99.0 | 47.8 |
| 004 | 86 | A7 | Y | N | 43.9 | 32.5 |
| 006 | 61 | A8 | N | N | 33.5 | 30.8 |
| 007 | 76 | A7 | N | N | 40.2 | 28.6 |
| 008 | 50 | A7 | N | N | 16.7 | 16.3 |
| 009 | 133 | A6 | Y | N | 13.7 | 19.1 |
| 010 | 134 | A7 | Y | N | 23.1 | 18.9 |
| 011 | 81 | A6 | Y | N | 12.0 | 8.8 |
| 014 | 79 | A8 | N | N | 50.7 | 17.9 |
| 015 | 43 | A9 | N | Y | 160.7 | 58.1 |
| 016 | 136 | A6 | Y | N | 11.8 | 9.7 |
| 017 | 120 | A5 | Y | N | 6.3 | 14.7 |
| 019 | 54 | A7 | Y | N | 26.4 | 16.7 |
| 021 | 71 | A10 | Y | N | 165.5 | 157.5 |
| 022 | 59 | A8 | N | Y | 49.6 | 29.0 |
| 023 | 93 | A10 | Y | N | 311.7 | 139.3 |
| 024 | 86 | A6 | N | N | 13.7 | 16.9 |
| 025 | 138 | A7 | N | Y | 22.5 | 17.8 |
| 026 | 81 | A6 | Y | N | 11.0 | 12.3 |
| 027 | 78 | A5 | Y | N | 4.0 | 12.0 |
| 028 | 73 | A8 | N | Y | 48.8 | 13.9 |
| 029 | 115 | A6 | N | N | 10.2 | 11.3 |
| 030 | 118 | A9 | N | N | 78.4 | 33.2 |
| 031 | 38 | A9 | Y | N | 111.8 | 96.0 |
| 032 | 76 | A7 | Y | N | 27.6 | 31.2 |
| 033 | 53 | A5 | Y | N | 18.7 | 31.9 |
| 034 | 82 | A7 | N | Y | 11.9 | 7.3 |
| 036 | 72 | A8 | Y | N | 85.4 | 74.8 |
| 037 | 81 | A8 | N | N | 21.0 | 13.1 |
| 040 | 81 | A7 | N | Y | 22.5 | 14.9 |
Figure A5–Figure A10 contain the cough density profile for all patients. These are organized in 6 plots with increasing cough severity. Table A1 provides the info on association btween patient and plot. In the cough density plots, the median density profiles (expressed in coughs per hour) are provided together with the quartile ranges and the -trimmed mean. Figure A5 shows the profiles of participants with a third quartile staying below the 1 cough/hour. Essentially these are not chronic coughers.
Figure A5.
Cough density profiles over the monitoring period (9PM to 9AM). Participants with lowest density.
Figure A5.
Cough density profiles over the monitoring period (9PM to 9AM). Participants with lowest density.
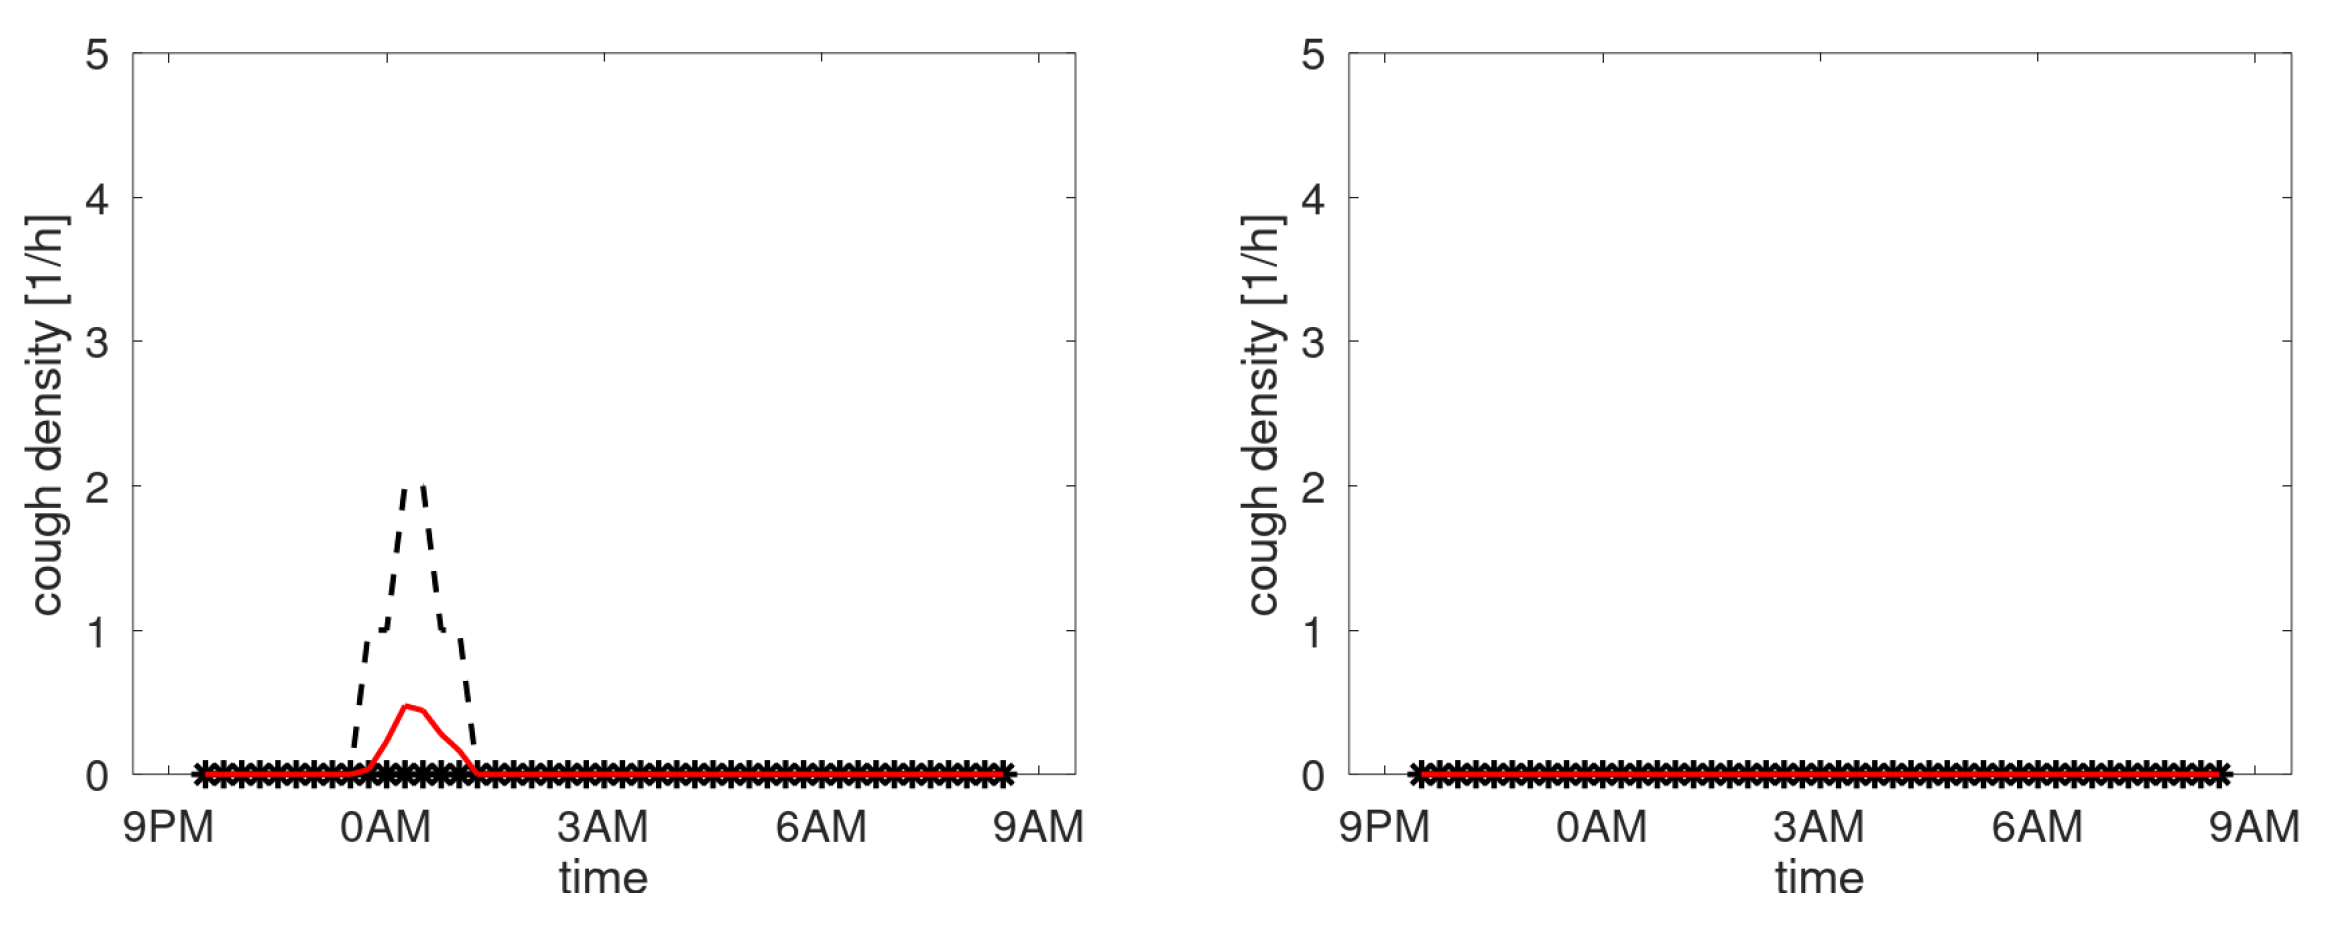
Figure A6.
Cough density profiles over the monitoring period (9PM to 9AM). Participants with low density.
Figure A6.
Cough density profiles over the monitoring period (9PM to 9AM). Participants with low density.
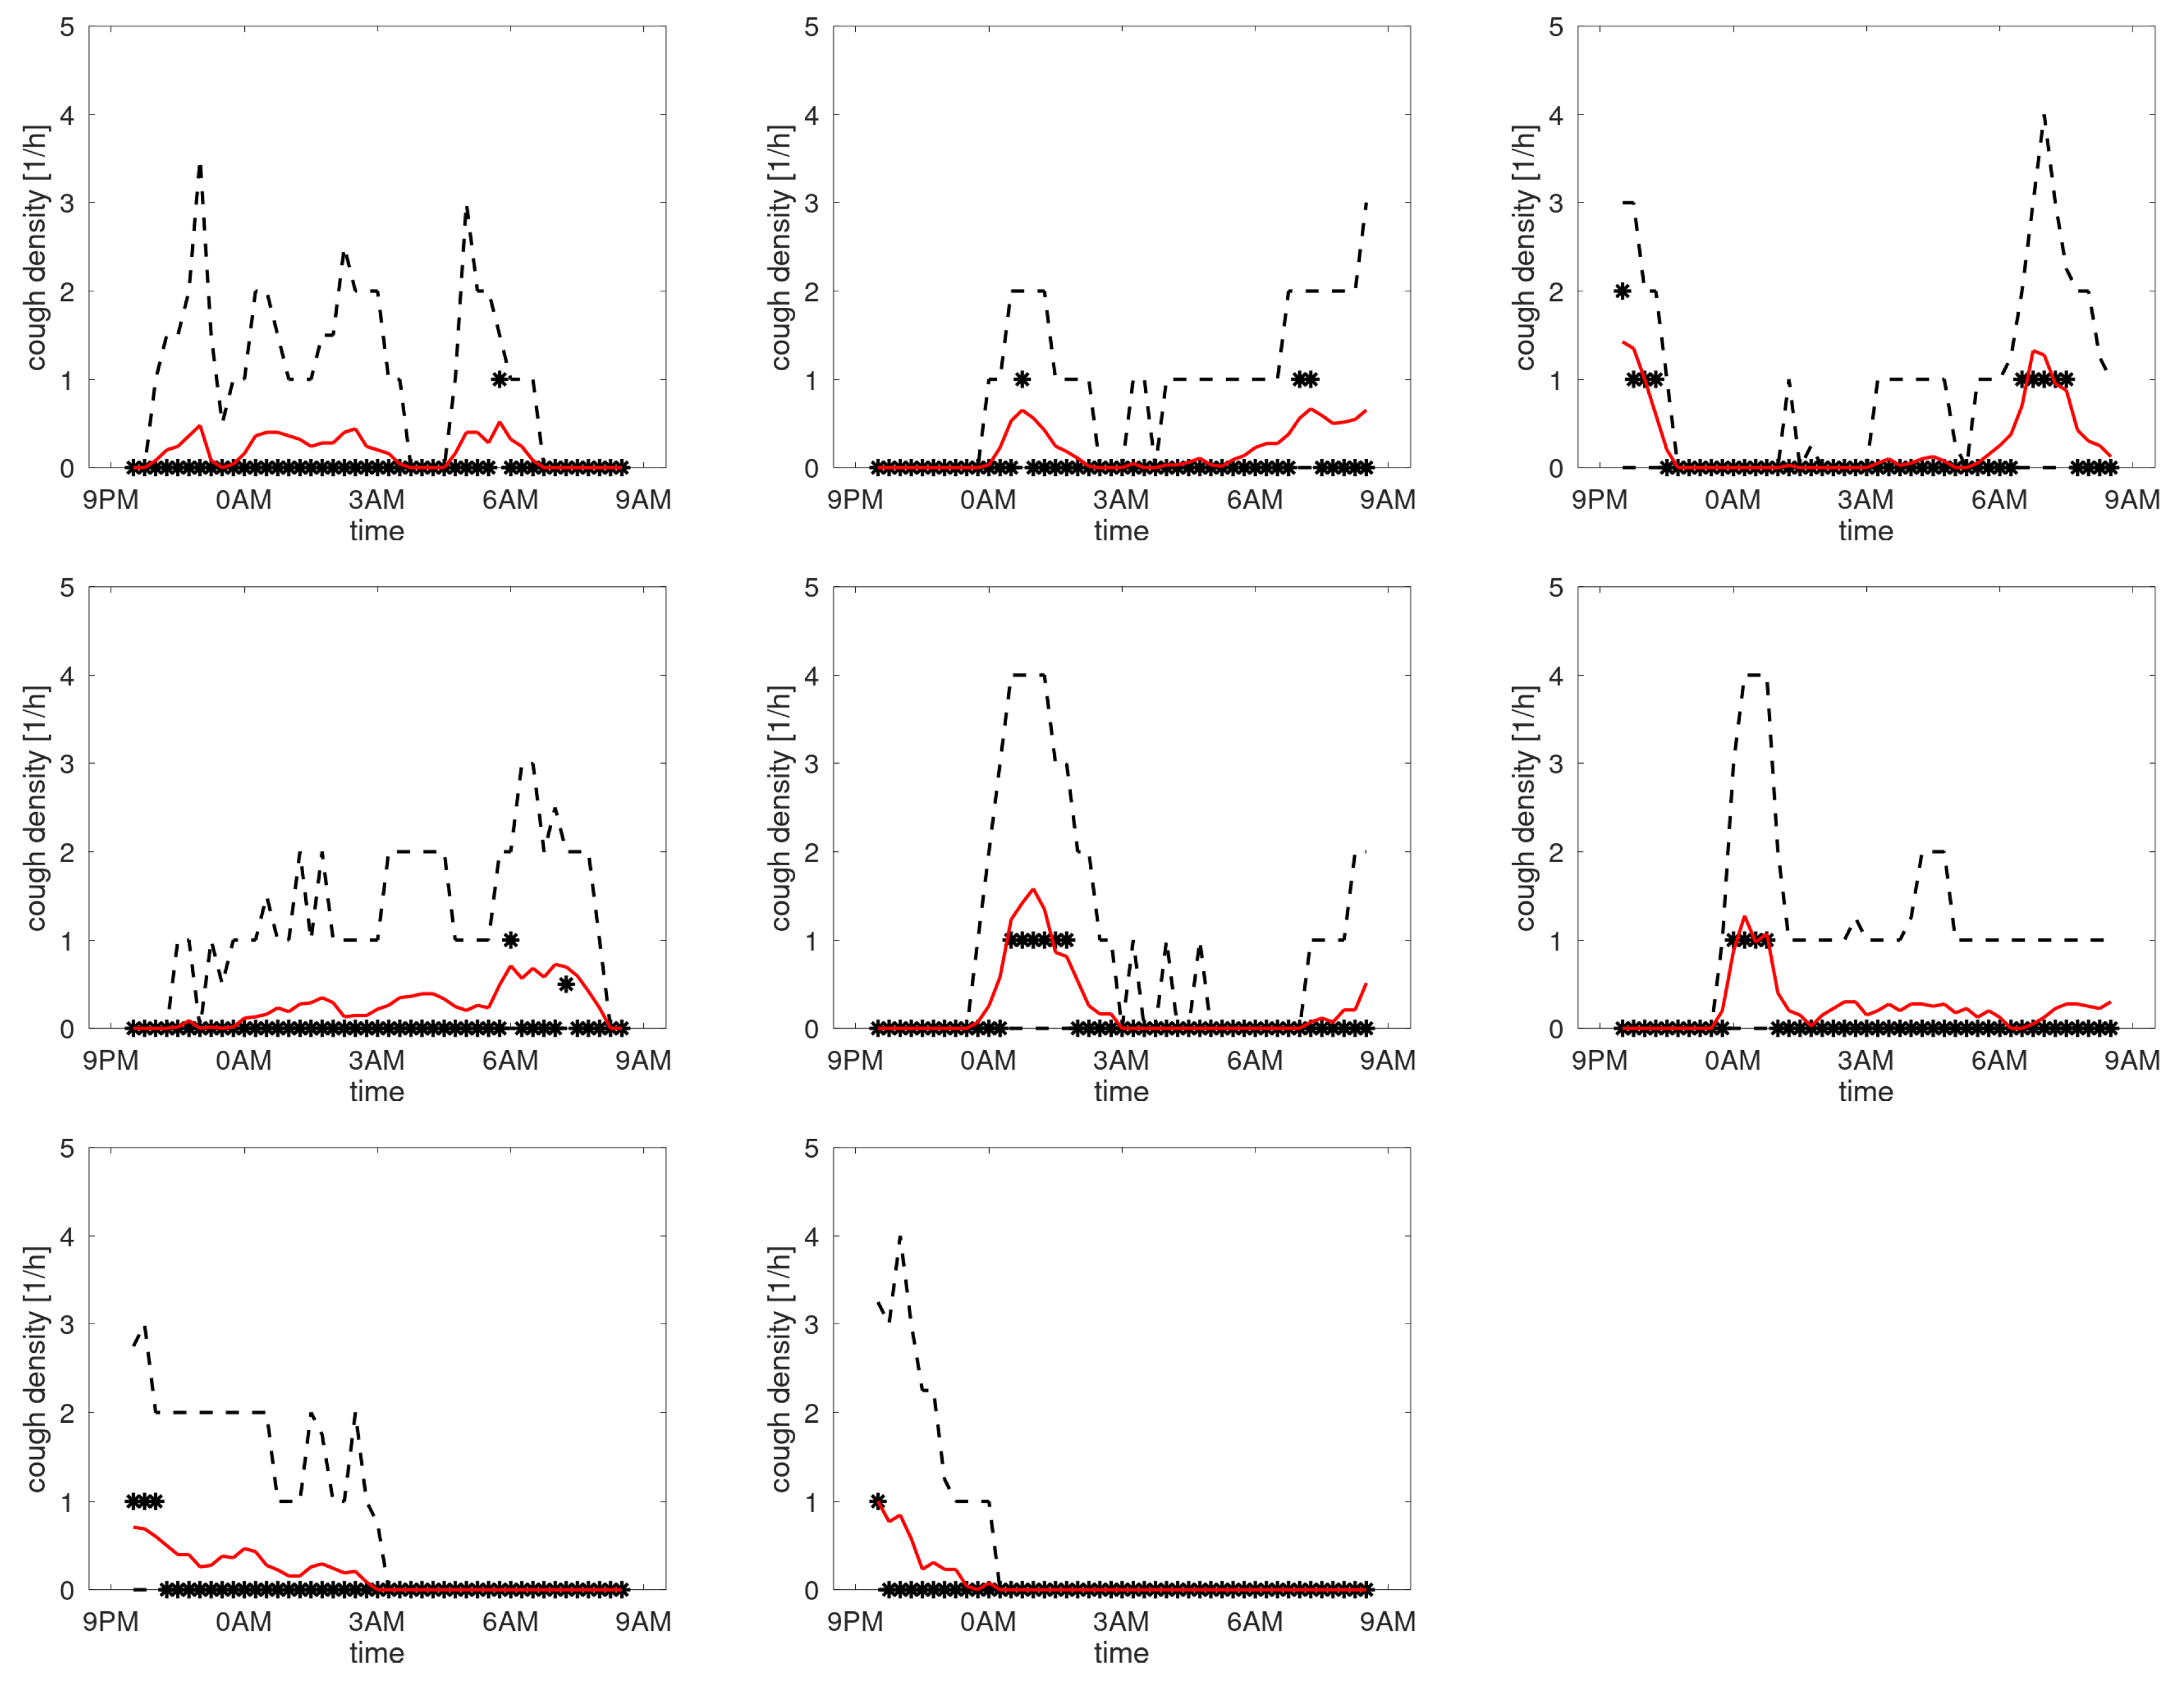
Figure A6 shows the profiles of participants with the maximum of the third quartile between 1 and 4 coughs/h. The median indicates that 3 participants tend to cough more around 0AM (when going to bed) with 1 of these 3 also having an increased count in the morning.
Figure A7 shows the profiles of participants with the maximum of the third quartile between 4 and 10 coughs/h. Here the picture is rather diverse, with participants having higher counts in the morning or evening, or a more uniform distribution over the sleep period.
Figure A7.
Cough density profiles over the monitoring period (9PM to 9AM). Participants with medium density.
Figure A7.
Cough density profiles over the monitoring period (9PM to 9AM). Participants with medium density.
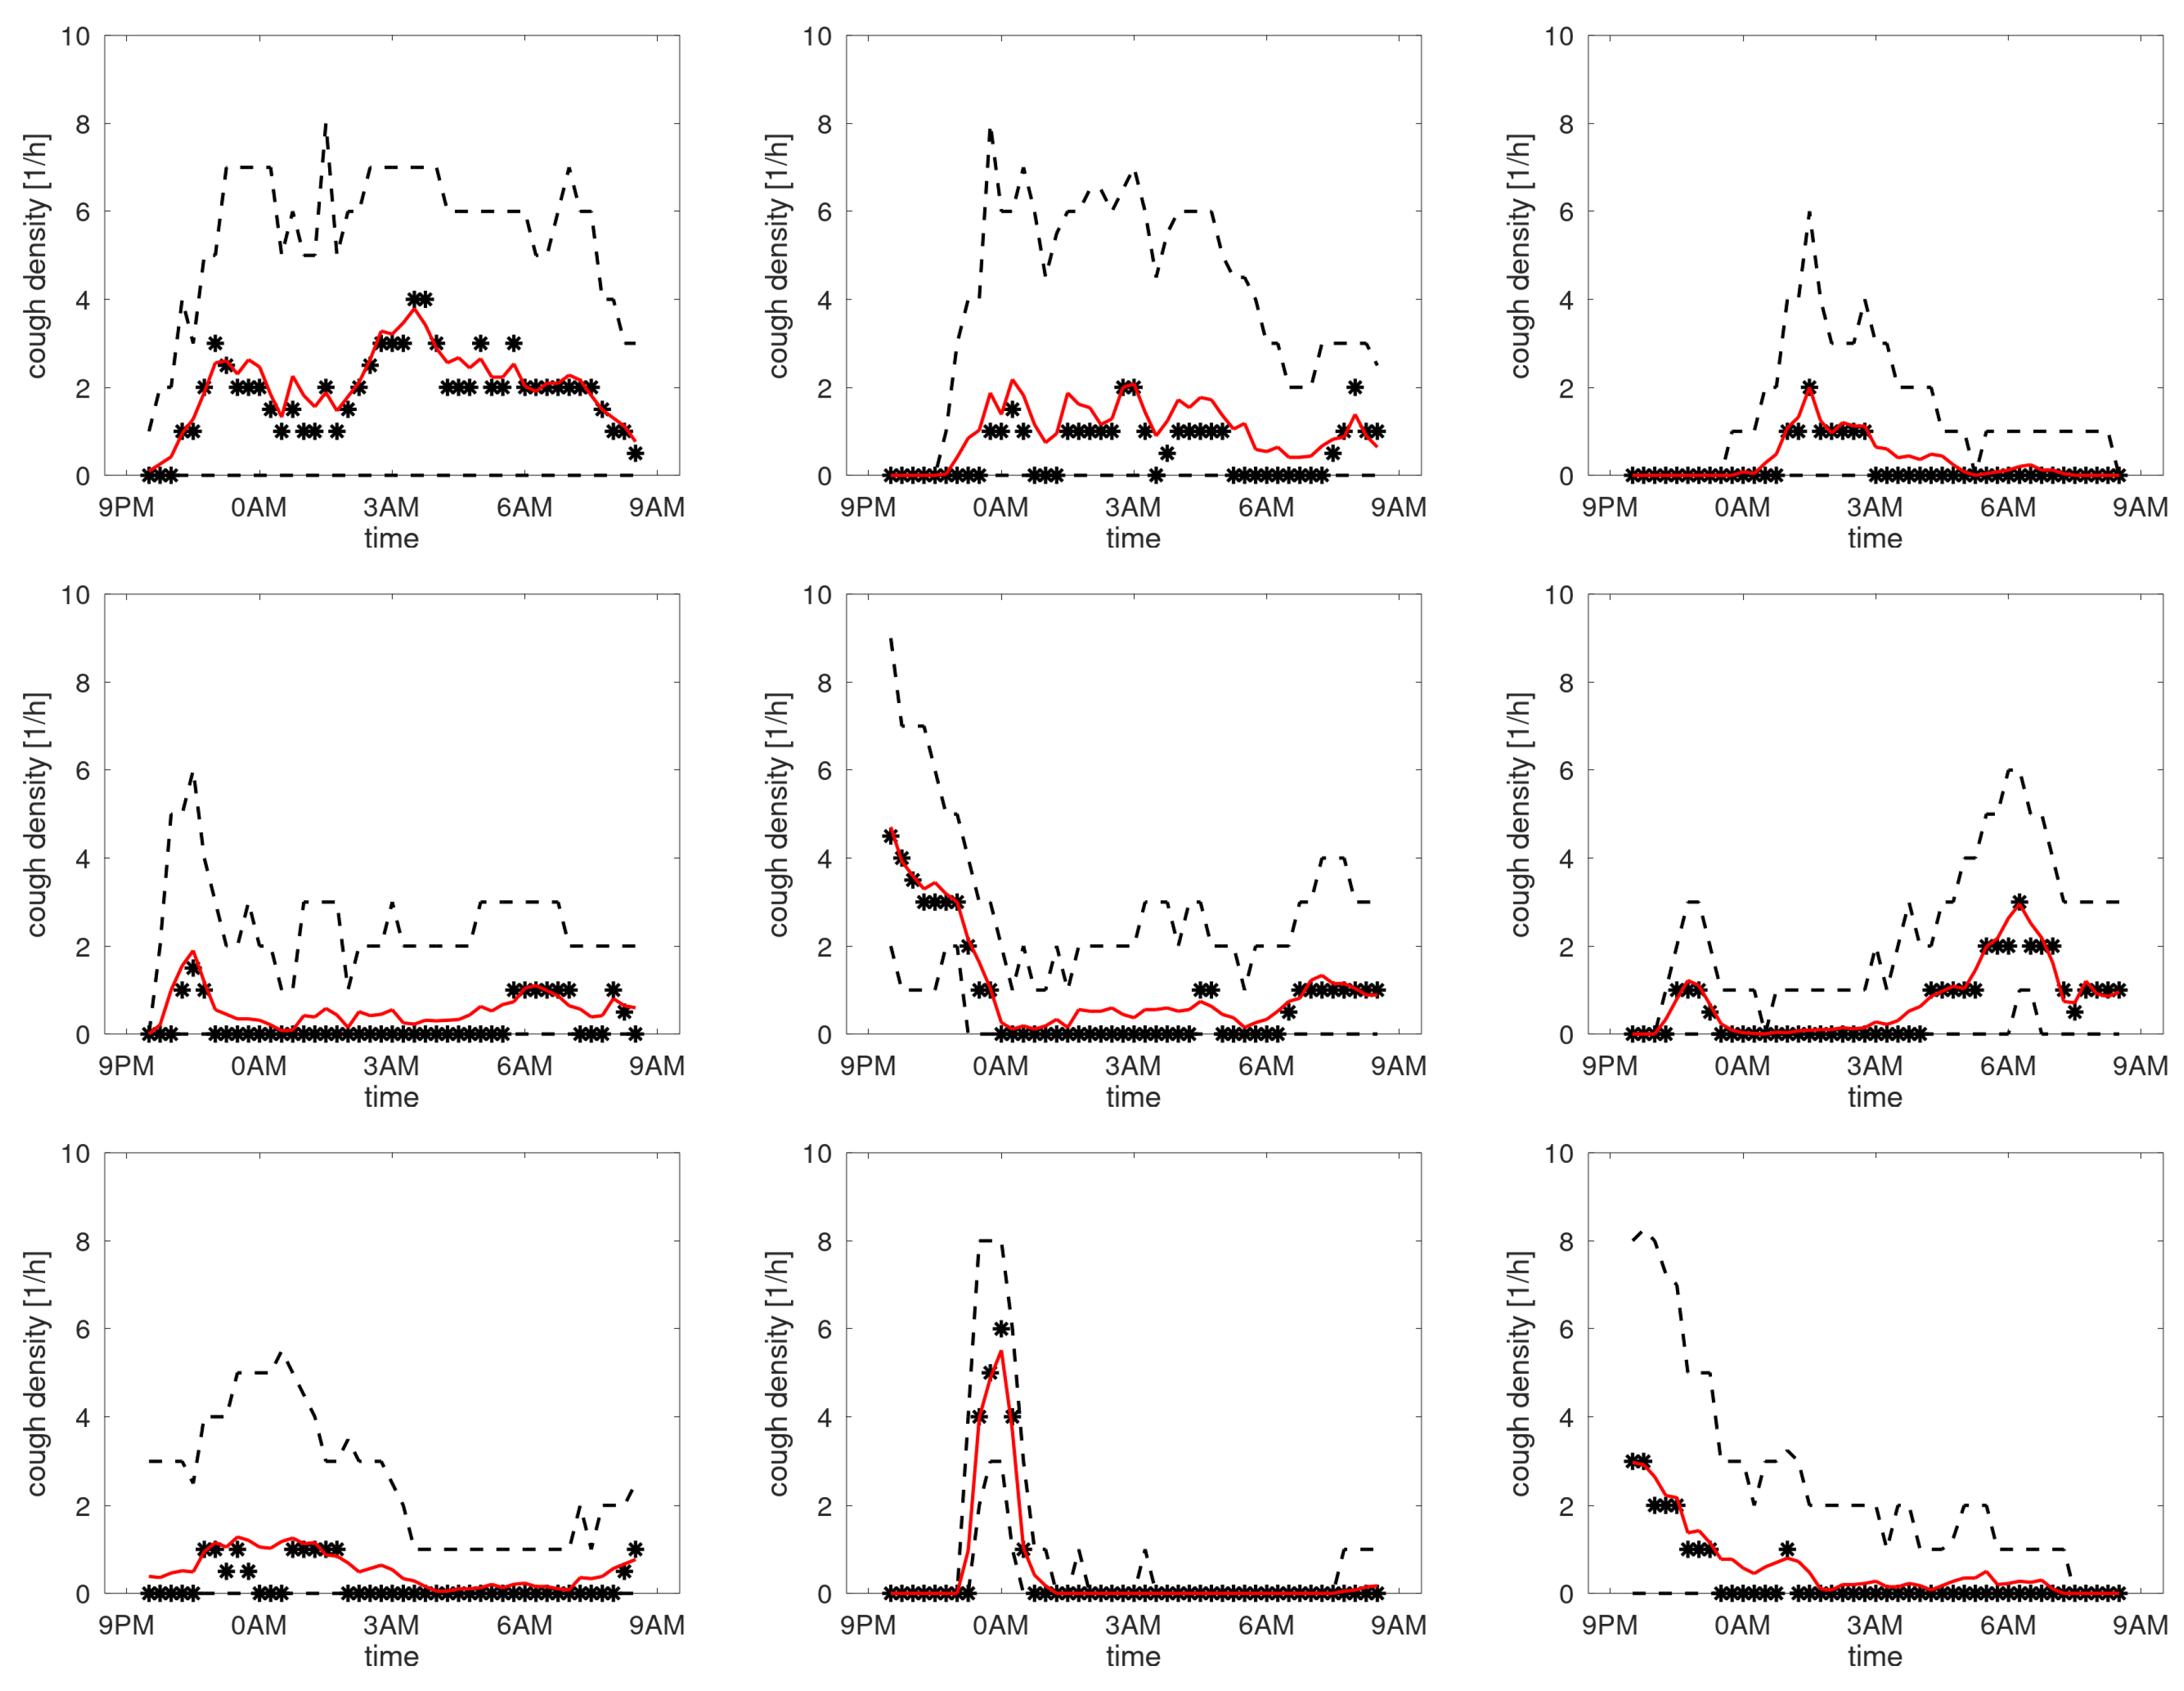
The graphs of the medians in Figure A5–Figure A7 are on the 0-line mainly. This is in part due to the method: median filtering obviously brings along a quantisation of the density axis. However, the -trimmed mean, intended to mitigate the quantisation issue, does not provide profiles clearly distinct from the zero line either. The figures with participants having higher cough densities (Figure A8–Figure A10) start to be become more distinct with clear peaks in the density in the morning or evening.
Figure A8.
Cough density profiles over the monitoring period (9PM to 9AM). Participants with high density.
Figure A8.
Cough density profiles over the monitoring period (9PM to 9AM). Participants with high density.
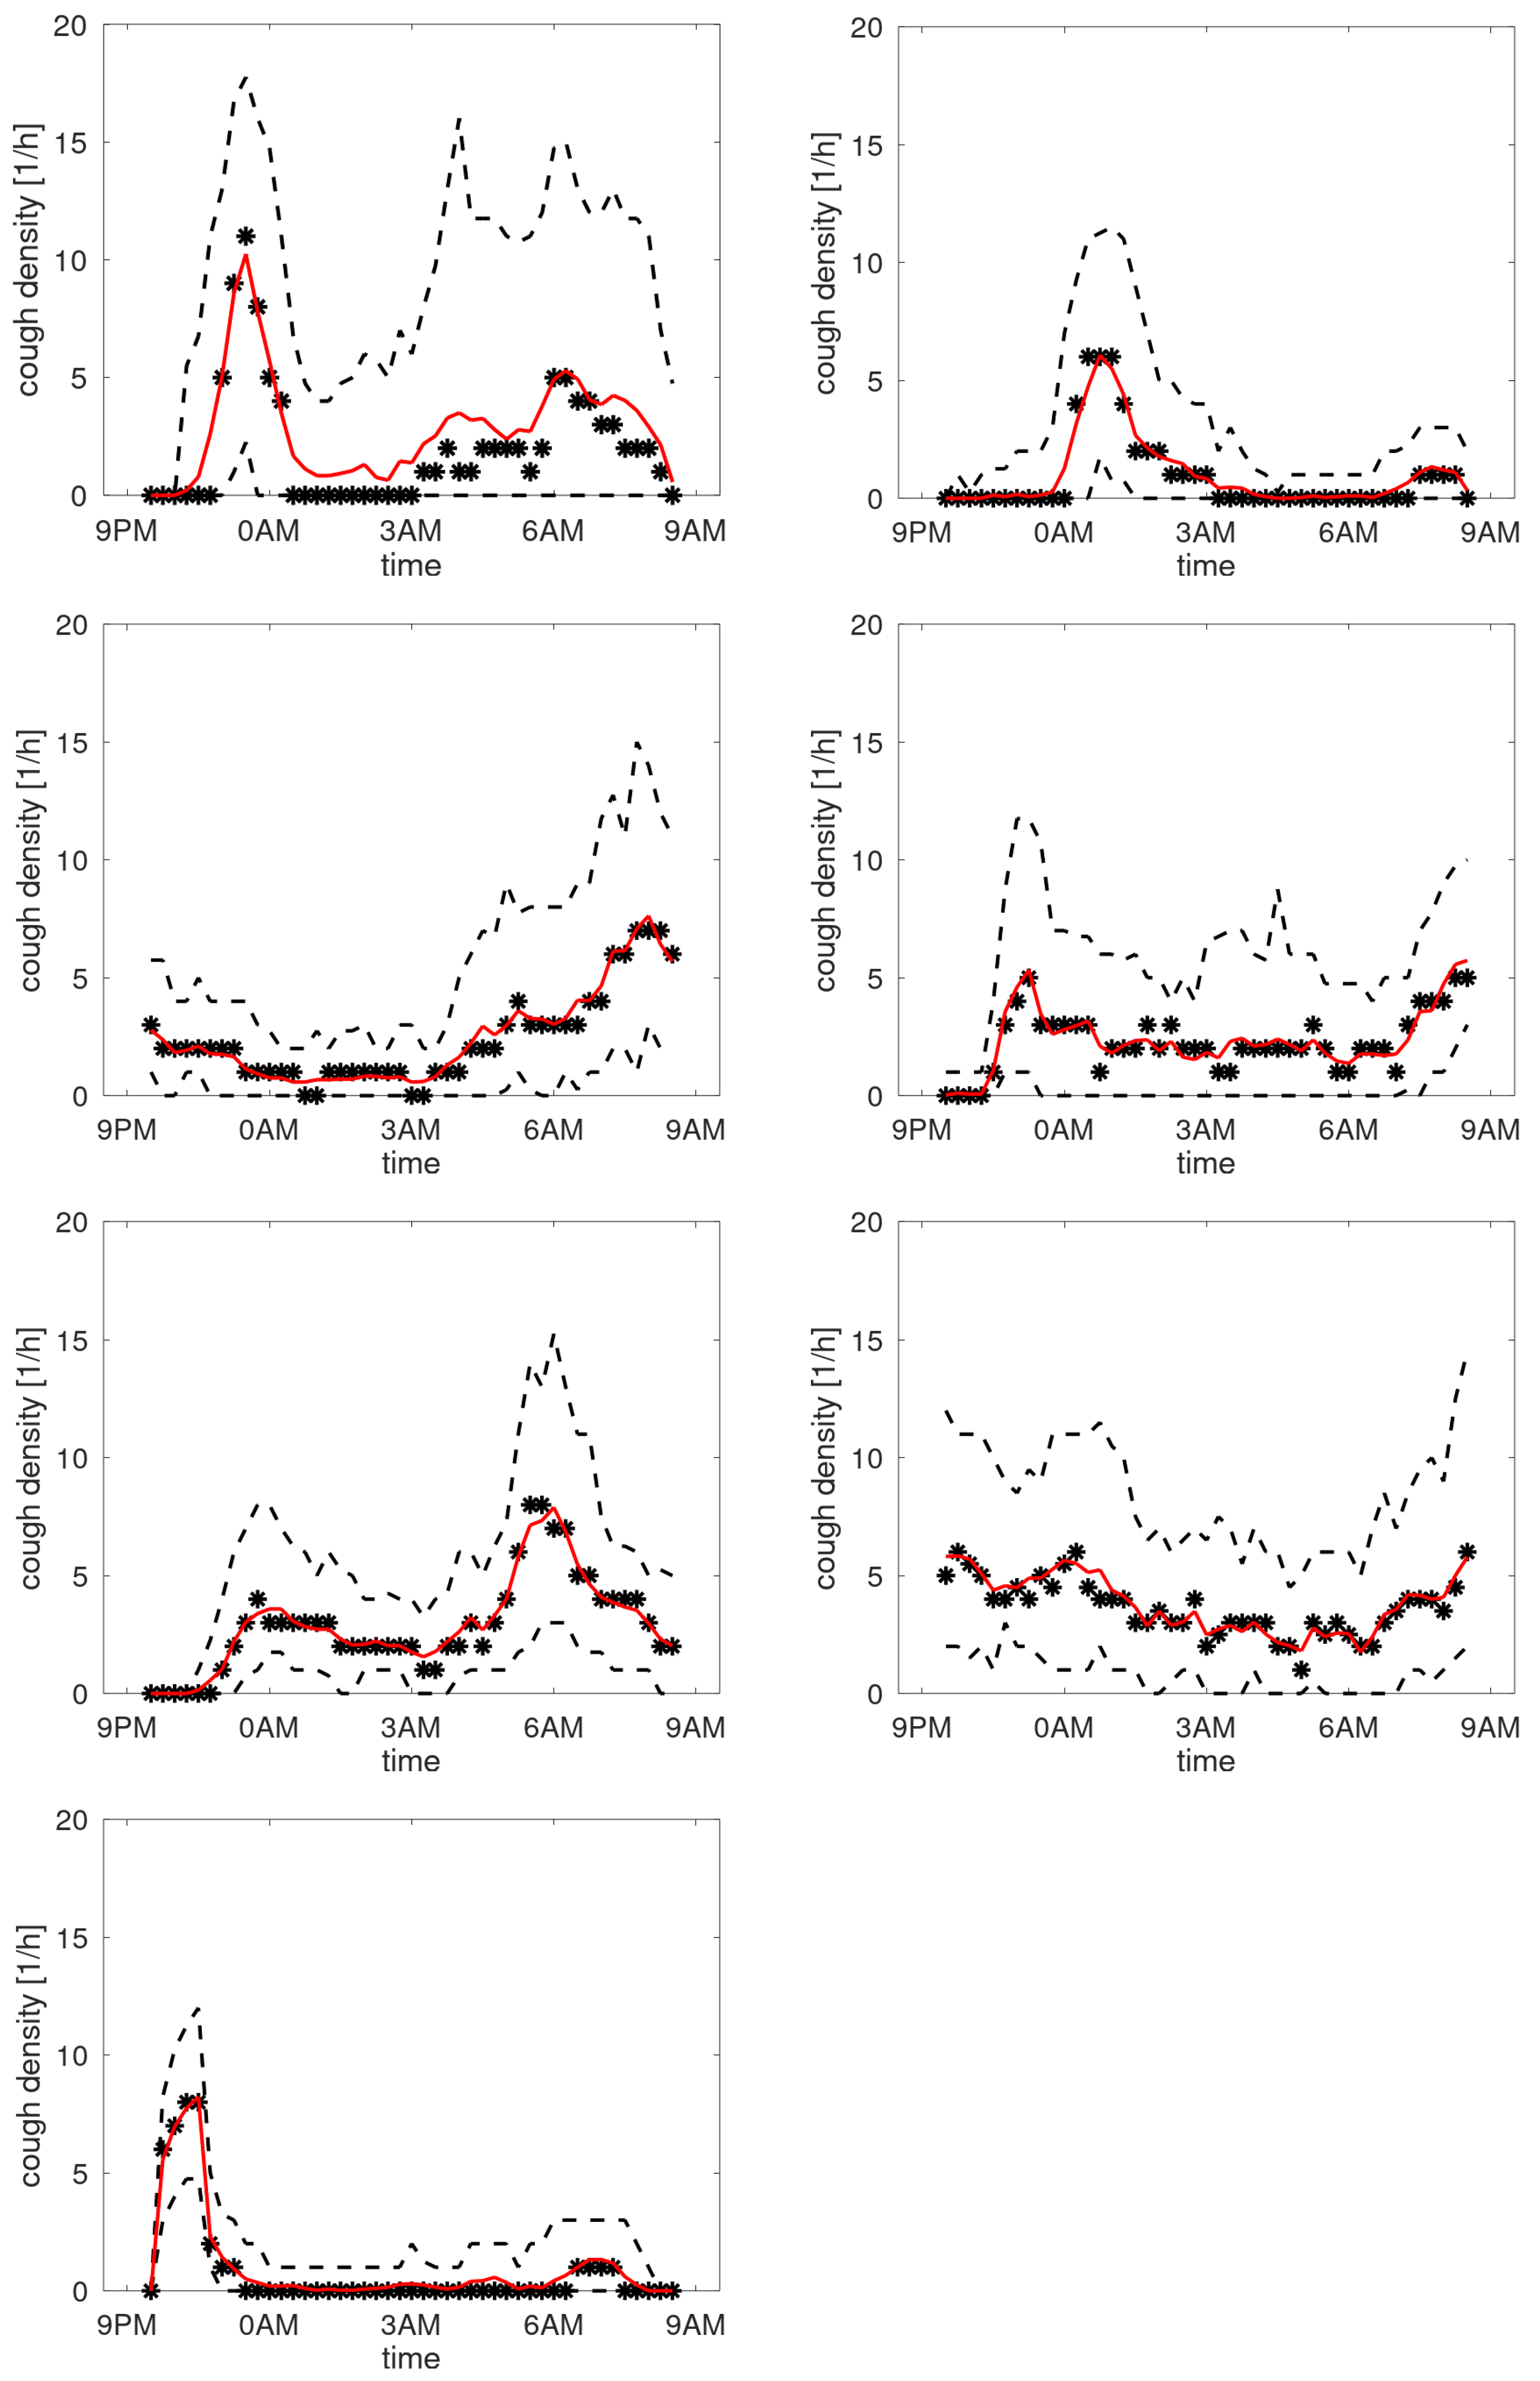
Figure A9.
Cough density profiles over the monitoring period (9PM to 9AM). Participants with very high density.
Figure A9.
Cough density profiles over the monitoring period (9PM to 9AM). Participants with very high density.
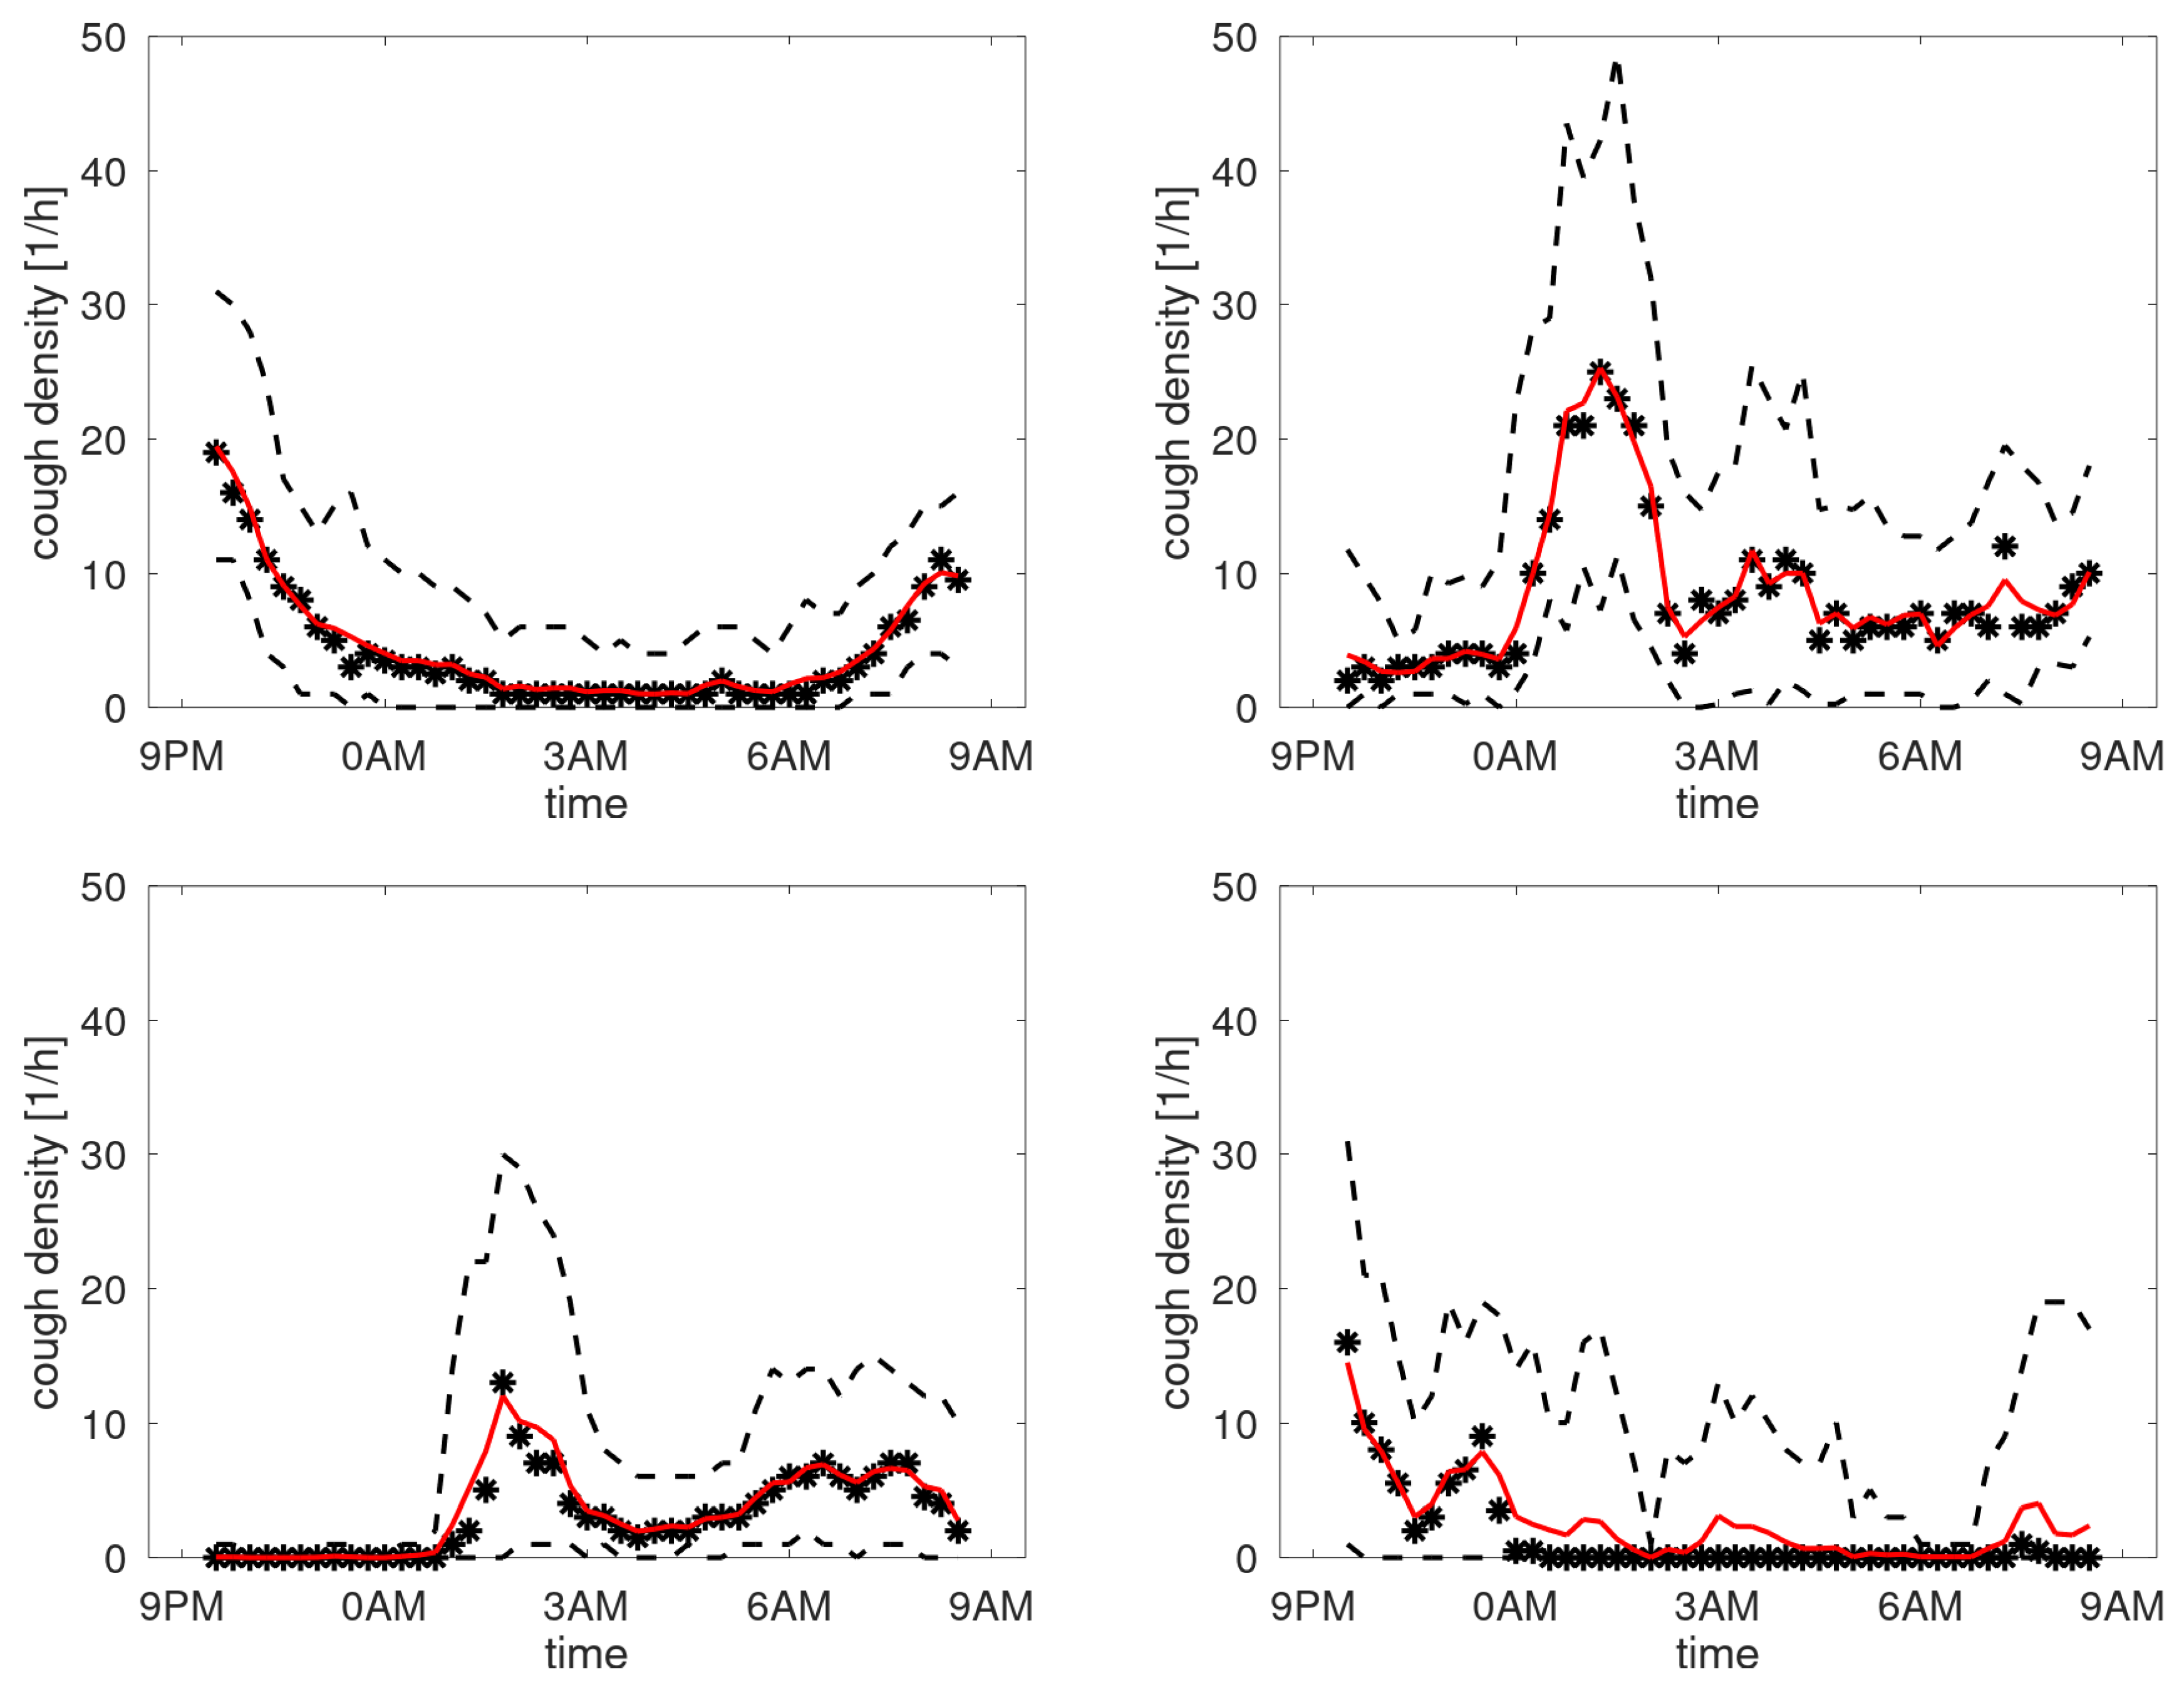
Figure A10.
Cough density profiles over the monitoring period (9PM to 9AM). Participants with highest density.
Figure A10.
Cough density profiles over the monitoring period (9PM to 9AM). Participants with highest density.
References
- Seemungal, T.A.; Donaldson, G.C.; Bhowmik, A.; Jeffries, D.J.; Wedzicha, J.A. Time Course and Recovery of Exacerbations in Patients with Chronic Obstructive Pulmonary Disease. Am. J. Respir. Crit. Care Med. 2000, 161, 1609–1613. [Google Scholar] [CrossRef] [PubMed]
- Burgel, P.R.; Nesme-Meyer, P.; Chanez, P.; Caillaud, D.; Carré, P.; Perez, T.; Roche, N. Cough and Sputum Production Are Associated With Frequent Exacerbations and Hospitalizations in COPD Subjects. Chest 2009, 135, 975–982. [Google Scholar] [CrossRef] [PubMed]
- Ekberg-Aronsson, M.; Pehrsson, K.; Nilsson, J.; Nilsson, P.M.; Löfdahl, C.G. Mortality in GOLD stages of COPD and its dependence on symptoms of chronic bronchitis. Respiratory Research 2005, 6, 98. [Google Scholar] [CrossRef] [PubMed]
- Calverley, P.; Pauwels, R.; Löfdahl, C.G.; Svensson, K.; Higenbottam, T.; Carlsson, L.G.; Ståhl, E. Relationship between respiratory symptoms and medical treatment in exacerbations of COPD. European Respiratory Journal 2005, 26, 406–413. [Google Scholar] [CrossRef] [PubMed]
- Hall, J.I.; Lozano, M.; Estrada-Petrocelli, L.; Birring, S.; Turner, R. The present and future of cough counting tools. Journal of Thoracic Disease 2020, 12. [Google Scholar] [CrossRef] [PubMed]
- Serrurier, A.; Neuschaefer-Rube, C.; Röhrig, R. Past and Trends in Cough Sound Acquisition, Automatic Detection and Automatic Classification: A Comparative Review. Sensors 2022, 22. [Google Scholar] [CrossRef] [PubMed]
- McGuinness, K.; Holt, K.; Dockry, R.; Smith, J. P159 Validation of the VitaloJAK™ 24 Hour Ambulatory Cough Monitor. Thorax 2012, 67, A131–A131. [Google Scholar] [CrossRef]
- Kuhn, M.; Nalbant, E.; Kohlbrenner, D.; Alge, M.; Kuett, L.; Arvaji, A.; Sievi, N.A.; Russi, E.W.; Clarenbach, C.F. Validation of a small cough detector. ERJ Open Research 2022. [Google Scholar] [CrossRef] [PubMed]
- Glass, M.; Kroh, J.; Nguyen, T.; Piao, D.; Cannon-Bailey, S. Stepwise Validation Program for Developing the Algorithm for Chronic Cough with Remote e-stethoscope Platform RESP. American Journal of Respiratory and Critical Care Medicine 2022, 205. [Google Scholar]
- Lee, S.E.; Rudd, M.; Kim, T.H.; Oh, J.Y.; Lee, J.H.; Jover, L.; Small, P.M.; Chung, K.F.; Song, W.J. Feasibility and Utility of a Smartphone Application-Based Longitudinal Cough Monitoring in Chronic Cough Patients in a Real-World Setting. Lung 2023, 201, 555–564. [Google Scholar] [CrossRef] [PubMed]
- Crooks, M.G.; den Brinker, A.; Hayman, Y.; Williamson, J.D.; Innes, A.; Wright, C.E.; Hill, P.; Morice, A.H. Continuous Cough Monitoring Using Ambient Sound Recording During Convalescence from a COPD Exacerbation. Lung 2017, 195, 289–294. [Google Scholar] [CrossRef] [PubMed]
- den Brinker, A.C.; van Dinther, R.; Crooks, M.G.; Thackray-Nocera, S.; Morice, A.H. Alert system design based on experimental findings from long-term unobtrusive monitoring in COPD. Biomedical Signal Processing and Control 2021, 63, 102205. [Google Scholar] [CrossRef]
- Crooks, M.G.; den Brinker, A.C.; Thackray-Nocera, S.; van Dinther, R.; Wright, C.E.; Morice, A.H. Domiciliary Cough Monitoring for the Prediction of COPD Exacerbations. Lung 2021, 199, 131–137. [Google Scholar] [CrossRef] [PubMed]
- Blouet, S.; Sutter, J.; Fresnel, E.; Kerfourn, A.; Cuvelier, A.; Patout, M. Prediction of severe acute exacerbation using changes in breathing pattern of COPD patients on home noninvasive ventilation. International Journal of Chronic Obstructive Pulmonary Disease 2018, 13, 2577–2586. [Google Scholar] [CrossRef] [PubMed]
- Crooks, M.G.; Hayman, Y.; Innes, A.; Williamson, J.; Wright, C.E.; Morice, A.H. Objective Measurement of Cough Frequency During COPD Exacerbation Convalescence. Lung 2016, 194, 117–120. [Google Scholar] [CrossRef] [PubMed]
- Di Perna, L.; Spina, G.; Thackray-Nocera, S.; Crooks, M.G.; Morice, A.H.; Soda, P.; den Brinker, A.C. An automated and unobtrusive system for cough detection. In Proceedings of the 2017 IEEE Life Sciences Conference (LSC), Dec. 2017; pp. 190–193. [Google Scholar] [CrossRef]
- den Brinker, A.C.; Coman, M.; Ouweltjes, O.; Crooks, M.G.; Thackray-Nocera, S.; Morice, A.H. Performance Requirements for Cough Classifiers in Real-World Applications. In Proceedings of the 2020 28th European Signal Processing Conference (EUSIPCO); 2021; p. 96. [Google Scholar] [CrossRef]
- Morice, A.H.; Fontana, G.A.; Belvisi, M.G.; Birring, S.S.; Chung, K.F.; Dicpinigaitis, P.V.; Kastelik, J.A.; McGarvey, L.P.; Smith, J.A.; Tatar, M.; et al. ERS guidelines on the assessment of cough. European Respiratory Journal 2007, 29, 1256–1276. [Google Scholar] [CrossRef] [PubMed]
- Angeloni, C.; Geffen, M.N. Contextual modulation of sound processing in the auditory cortex. Current Opinion in Neurobiology 2018, 49, 8–15. [Google Scholar] [CrossRef] [PubMed]
- den Brinker, A.C.; Rietman, R.; Ouweltjes, O.; Thackray-Nocera, S.; Crooks, M.G.; Morice, A.H. Classification for long-term monitoring of cough. In preparation, 2024.
| 1 | For severe patients using non-invasive ventilation, the ventilator itself may provide the relevant information for tracking a deteriorating health status [14]. |
Figure 1.
Bedside cough monitor. Left: adapter, mid: single-board computer and microphone, right: dongle.
Figure 1.
Bedside cough monitor. Left: adapter, mid: single-board computer and microphone, right: dongle.
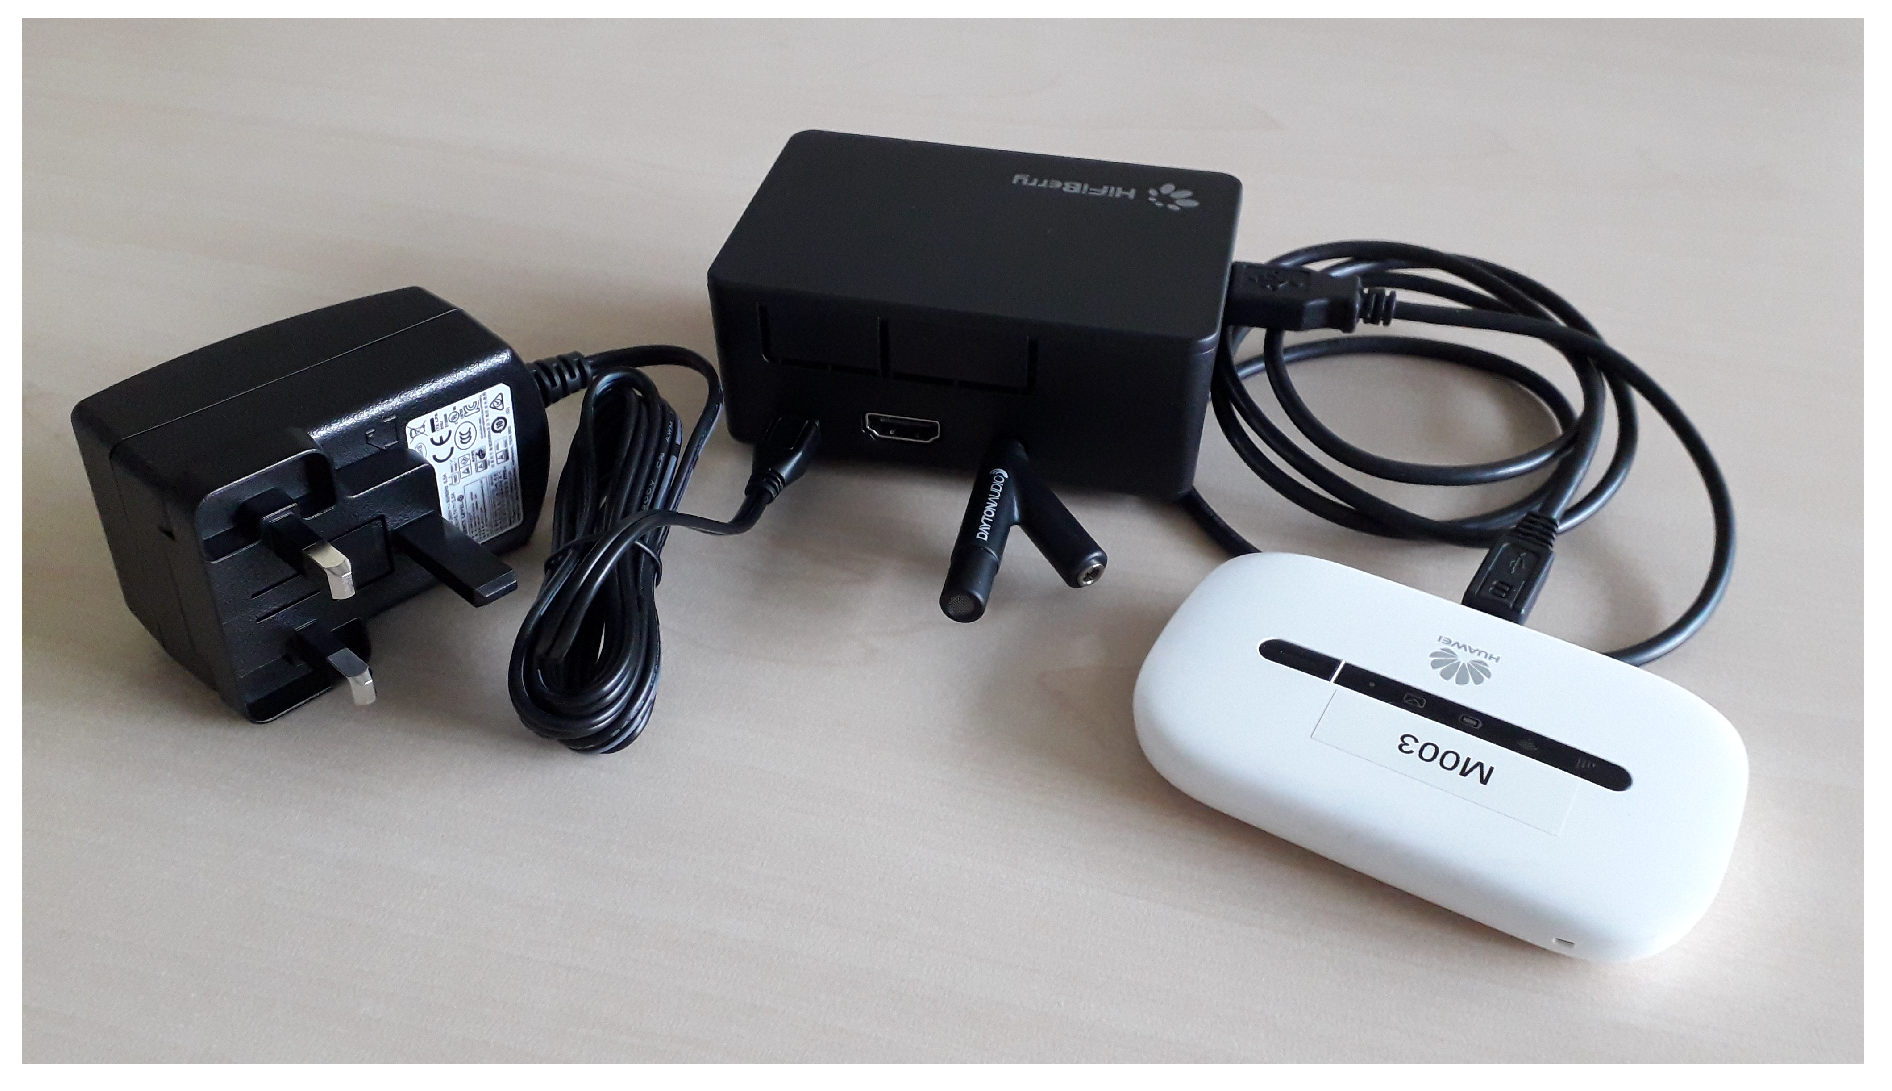
Figure 2.
System overview: software components. A: audio processing in the patient’s home. B: scheduler and data transmission unit. D: central data receiver and decryption unit. C: cough classifier and alert mechanism.
Figure 2.
System overview: software components. A: audio processing in the patient’s home. B: scheduler and data transmission unit. D: central data receiver and decryption unit. C: cough classifier and alert mechanism.
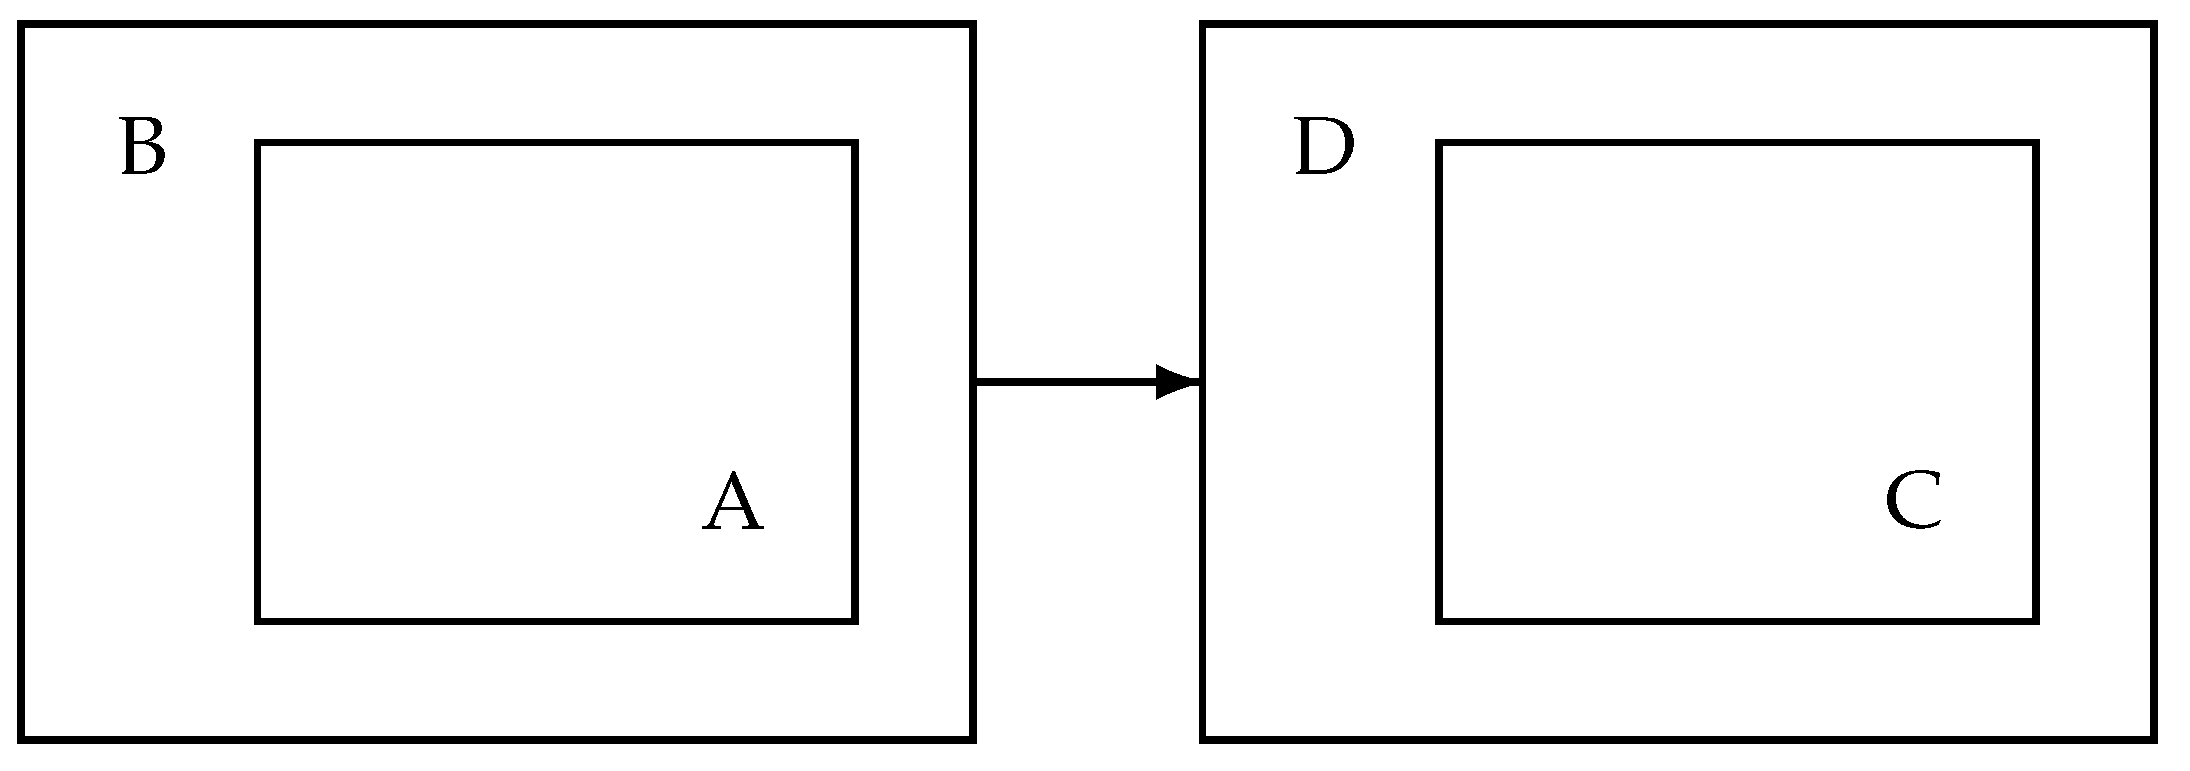
Figure 3.
Examples of the cough count (blue asterisks), smoothed data (black line), dynamic threshold level (green line) and alerts (red circles).
Figure 3.
Examples of the cough count (blue asterisks), smoothed data (black line), dynamic threshold level (green line) and alerts (red circles).
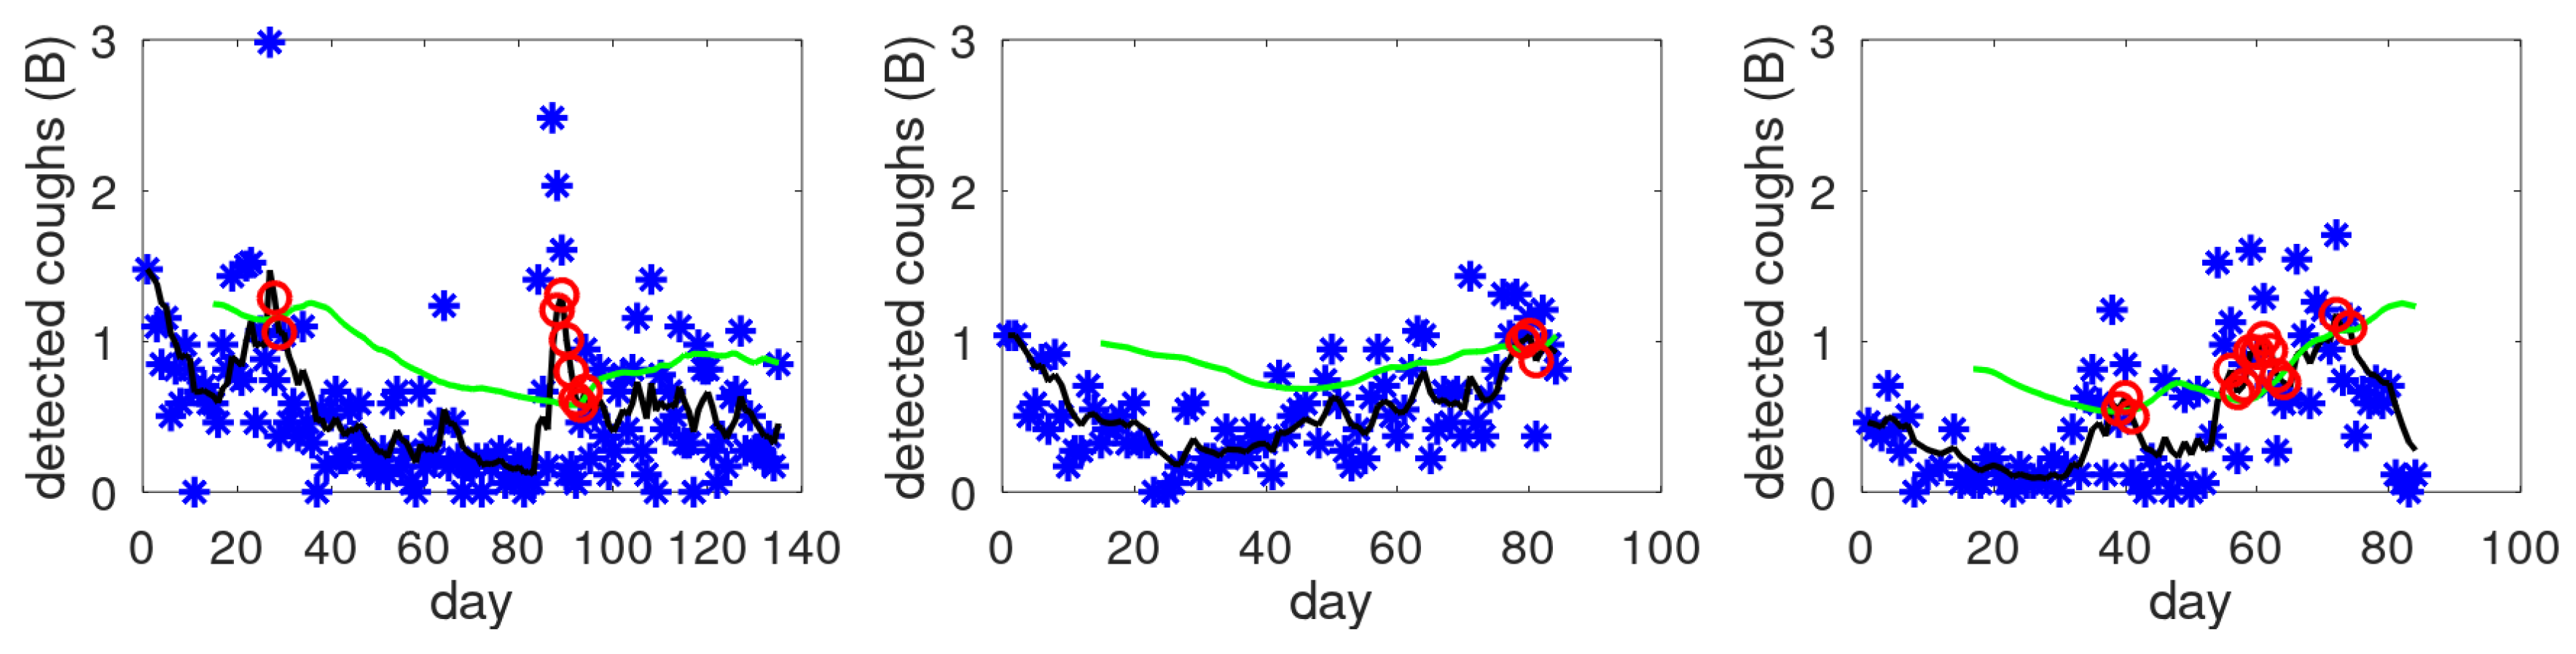
Figure 4.
Boxplot of duration.
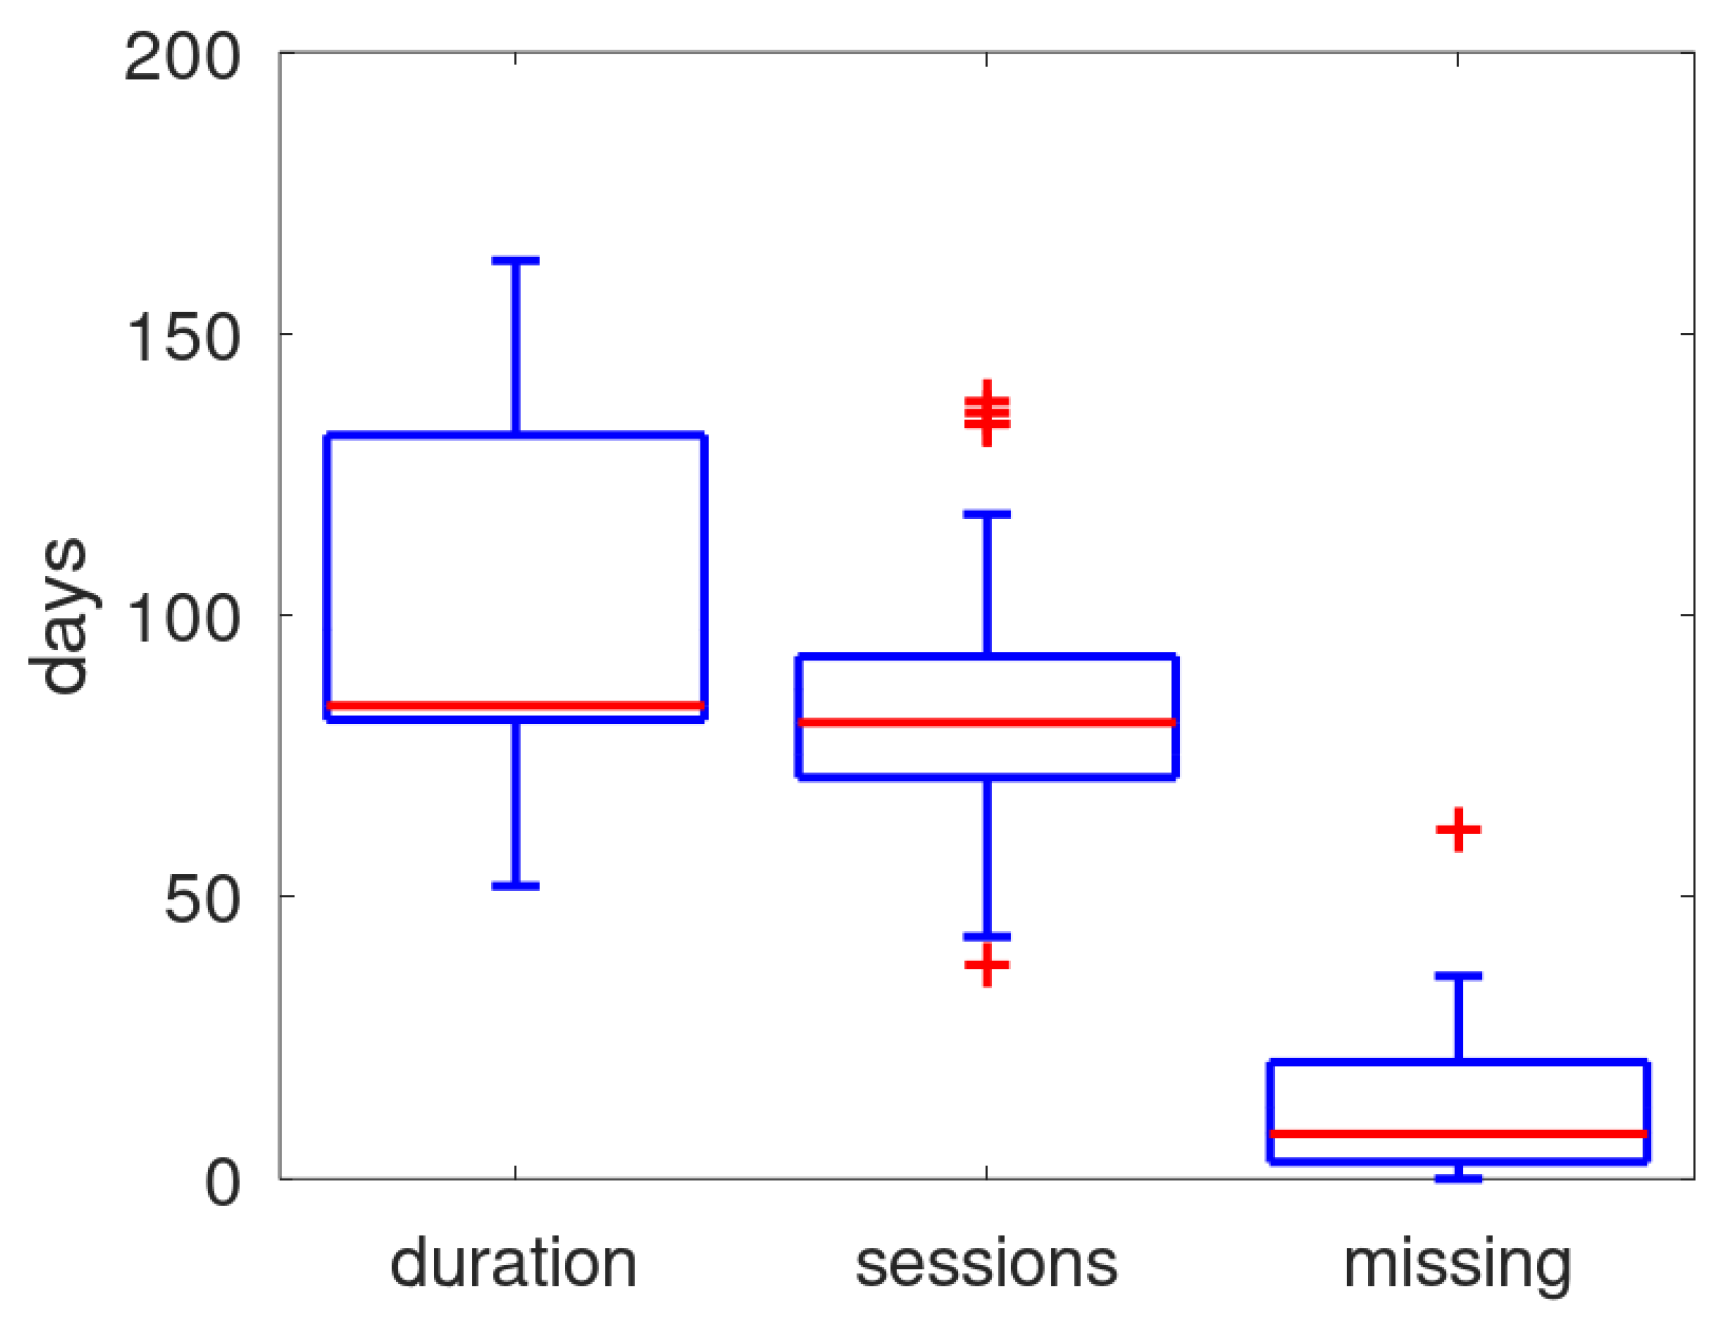
Figure 5.
Boxplot of performance metrics of the cough classifier (sens.: sensivity; spec.: specificity; PPV: positive predicted value; acc: accuracy) and rate of the detected coughs (PR: positive rate) for the 32 patients.
Figure 5.
Boxplot of performance metrics of the cough classifier (sens.: sensivity; spec.: specificity; PPV: positive predicted value; acc: accuracy) and rate of the detected coughs (PR: positive rate) for the 32 patients.
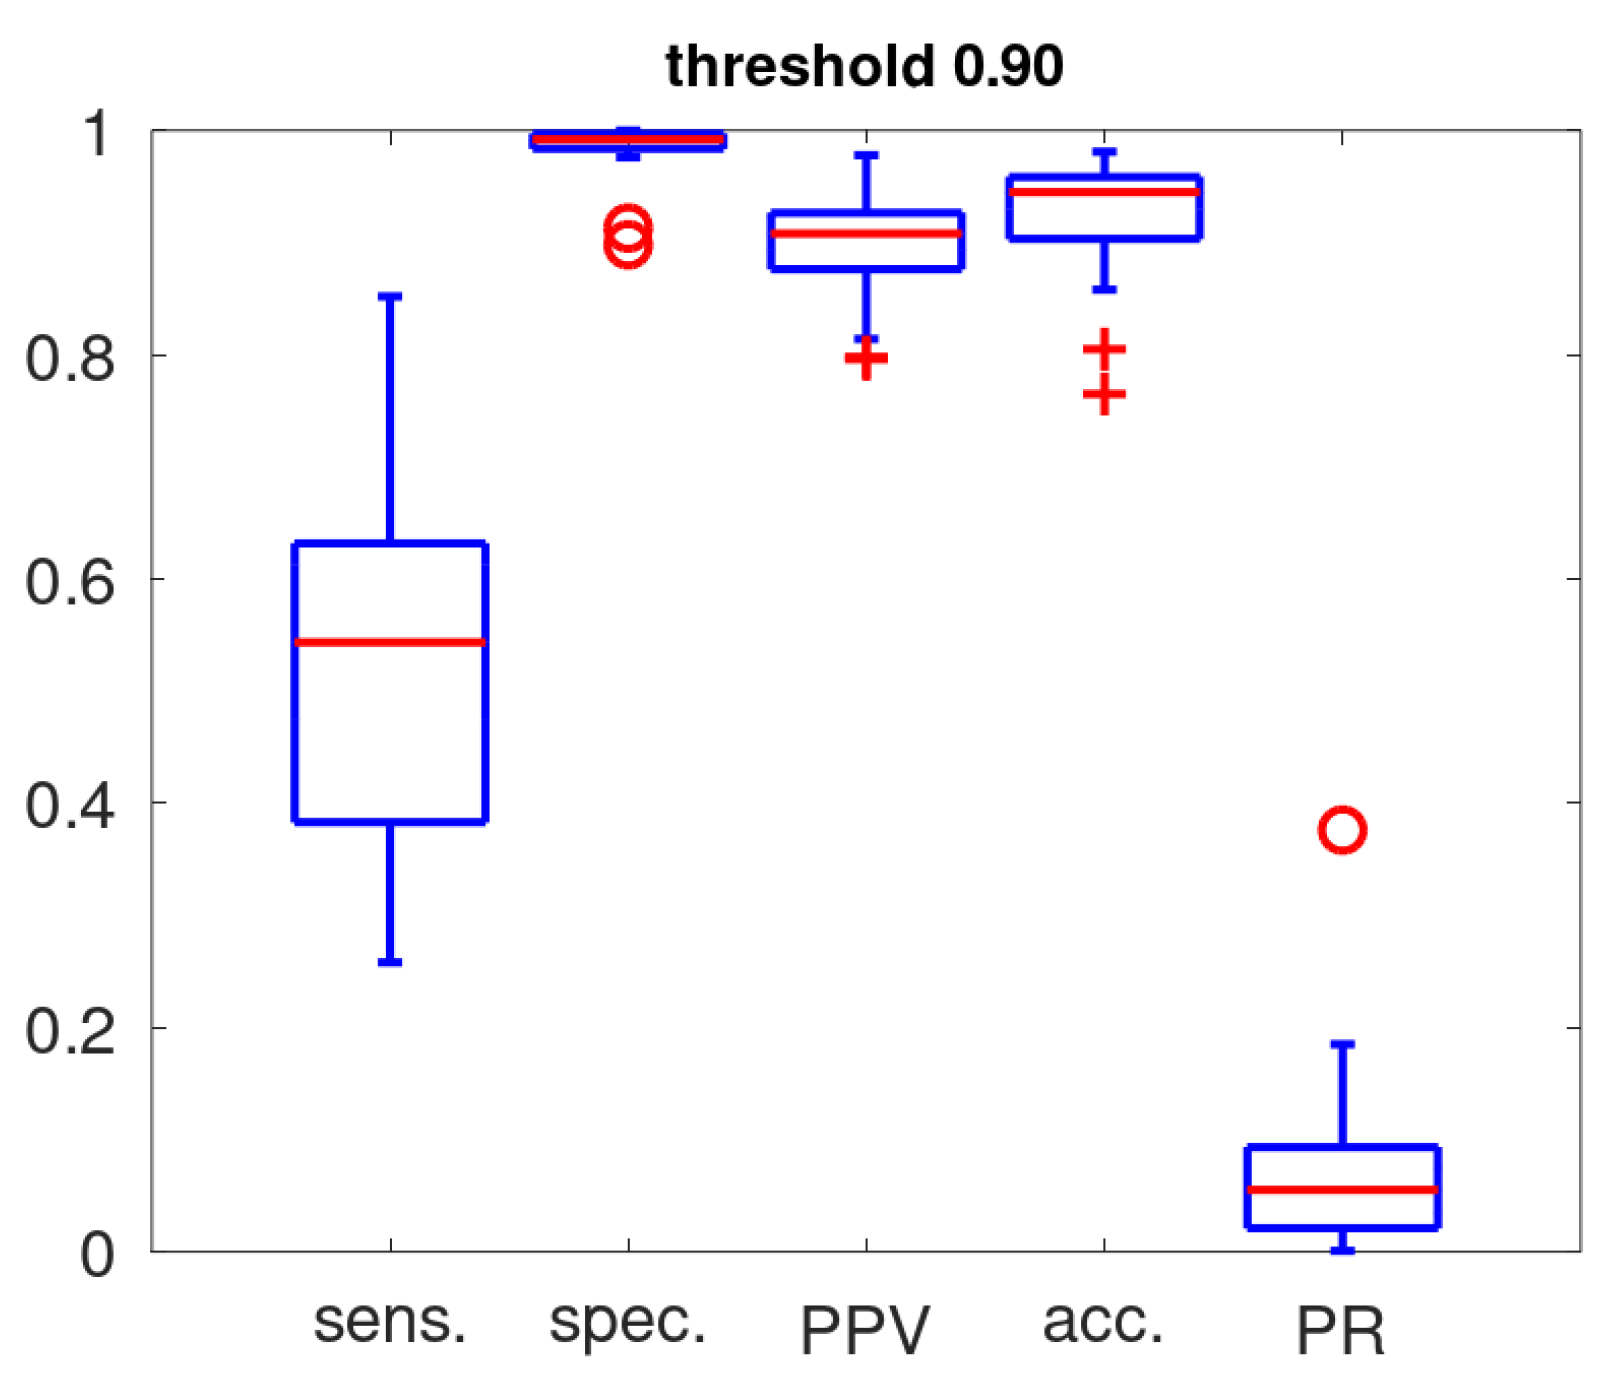
Figure 6.
Boxplot of the prevalence of coughs as determined during annotation and positive rate (fraction of acoustic events classified as coughs for a threshold setting of 0.9).
Figure 6.
Boxplot of the prevalence of coughs as determined during annotation and positive rate (fraction of acoustic events classified as coughs for a threshold setting of 0.9).
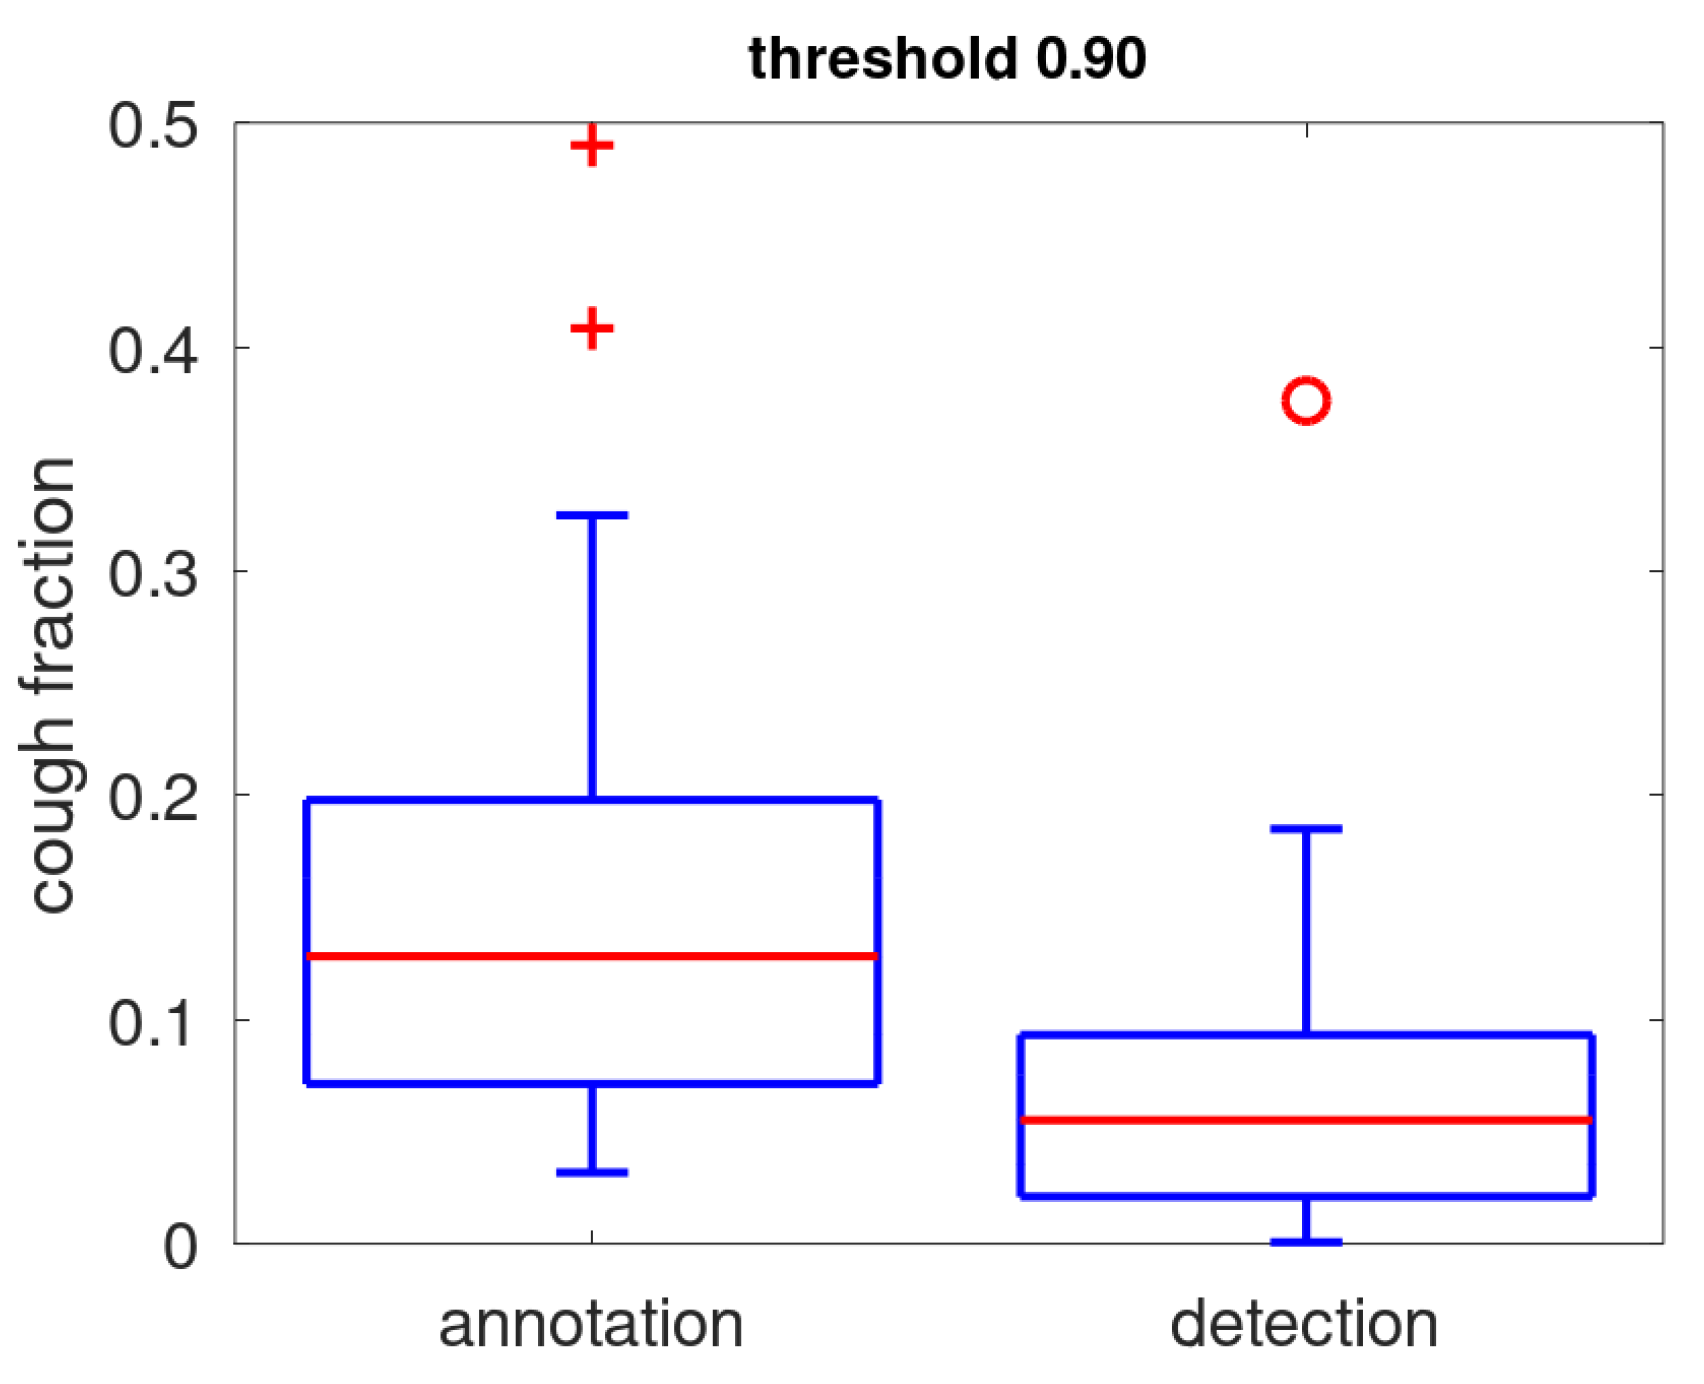
Figure 7.
Cough density profiles over the monitoring period (9PM to 9AM). Participants with stable cough count over the monitoring sessions.
Figure 7.
Cough density profiles over the monitoring period (9PM to 9AM). Participants with stable cough count over the monitoring sessions.
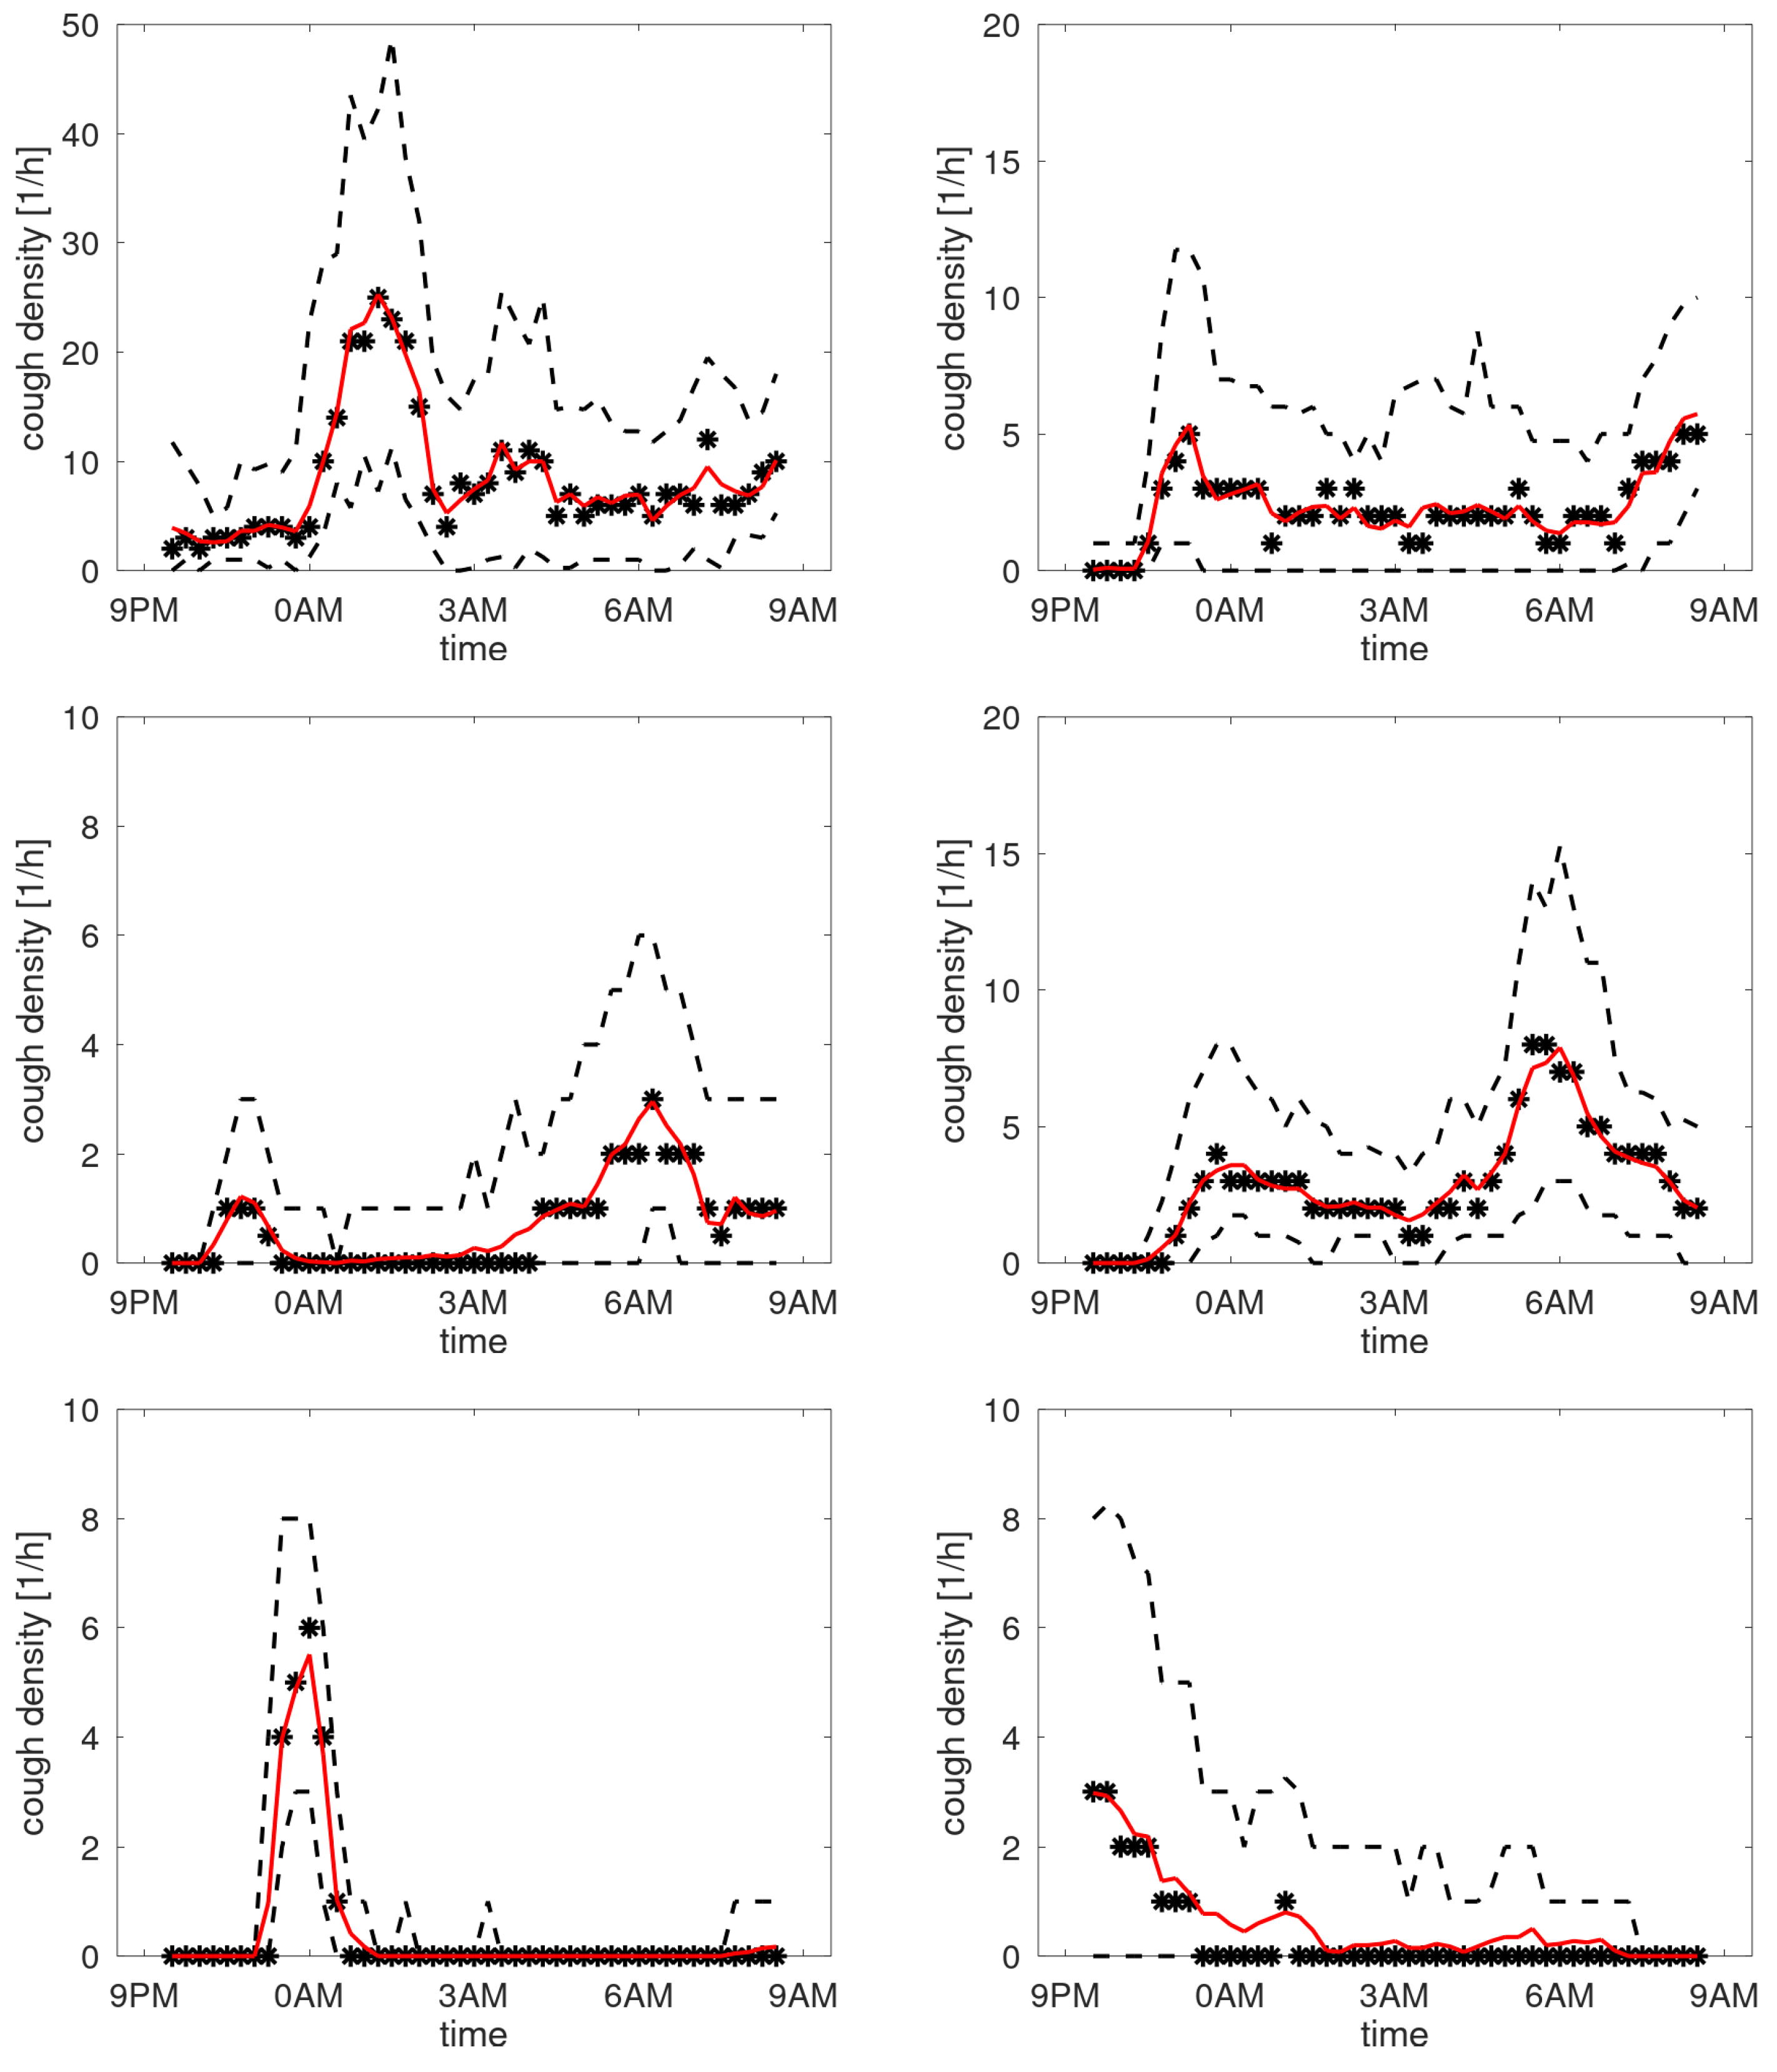
Figure 8.
Standard deviation versus mean of the cough count per patient. Each asterisk represents a trial participant. Data from patients with stable cough counts are indicated by a black circle surrounding the asterisk. The dotted line represents the empirical relation from [12].
Figure 8.
Standard deviation versus mean of the cough count per patient. Each asterisk represents a trial participant. Data from patients with stable cough counts are indicated by a black circle surrounding the asterisk. The dotted line represents the empirical relation from [12].
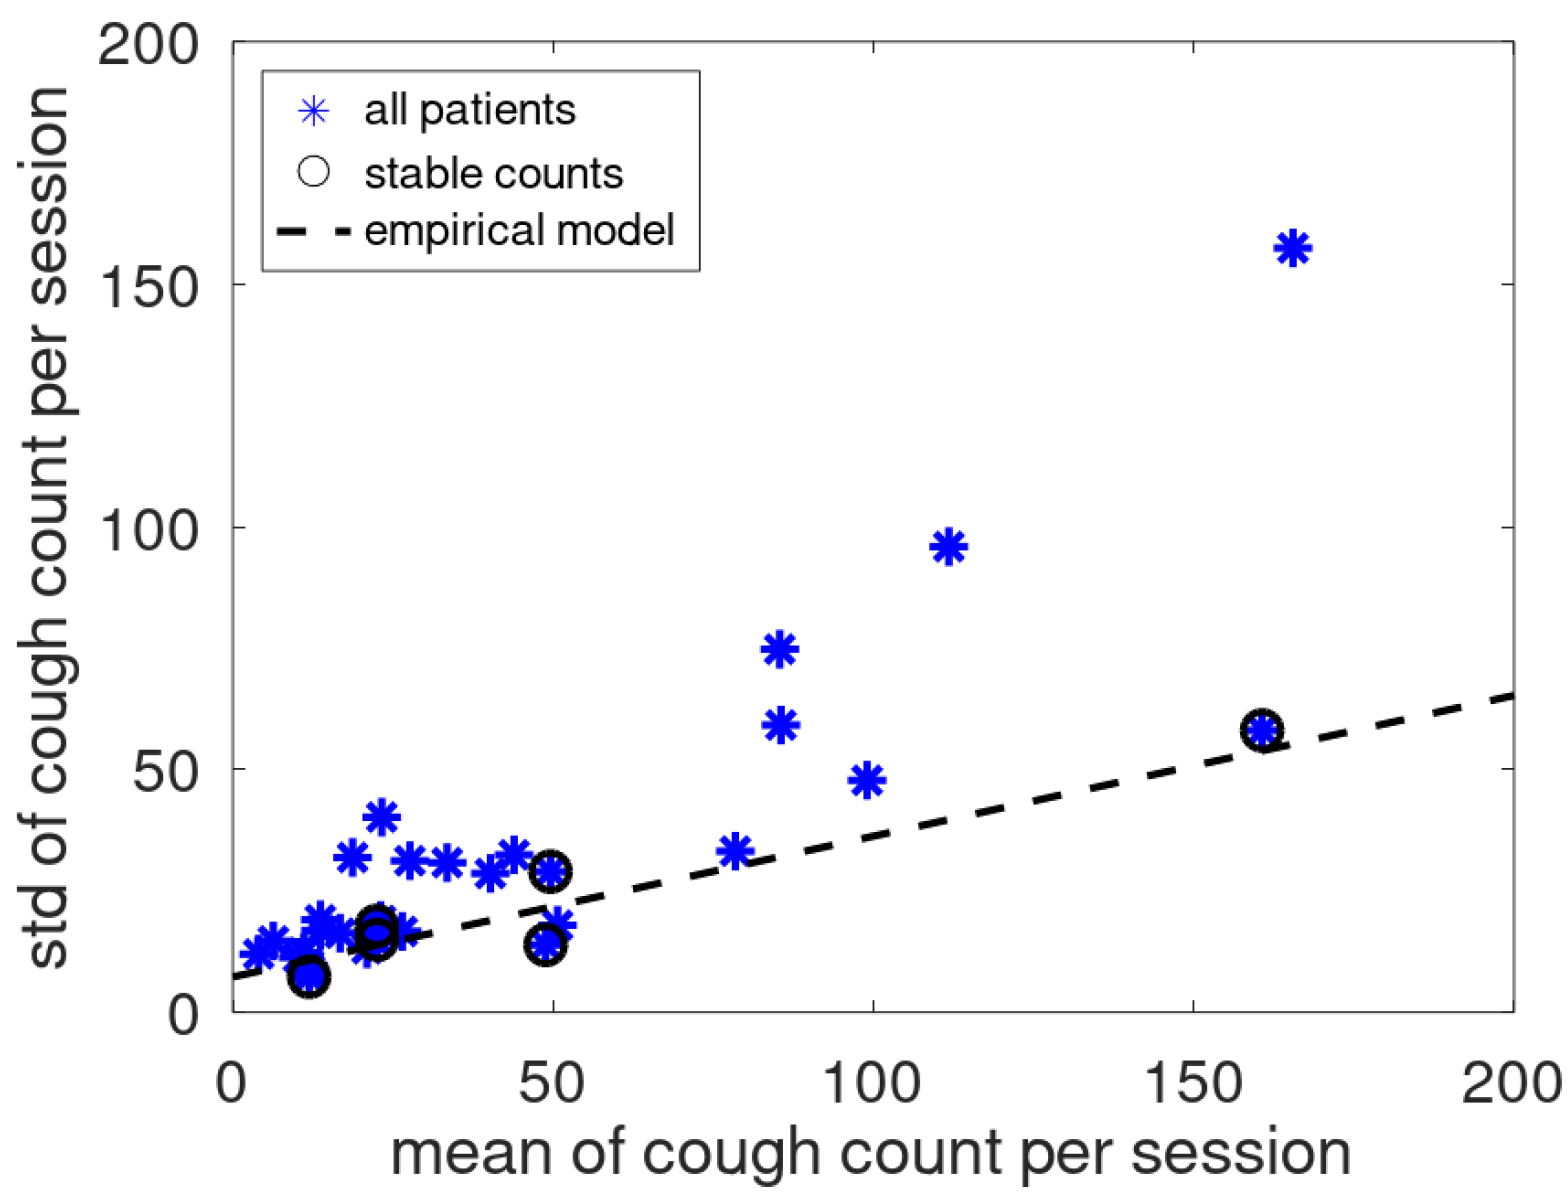
Figure 9.
Quartiles as function of median cough count on the B-scale. Each bar represents the Q1-Q3 range for a partient. The patients with a stable cough count are represented by blue bars. The dashed blue line indicates the median plus an offset of 0.33 B.
Figure 9.
Quartiles as function of median cough count on the B-scale. Each bar represents the Q1-Q3 range for a partient. The patients with a stable cough count are represented by blue bars. The dashed blue line indicates the median plus an offset of 0.33 B.
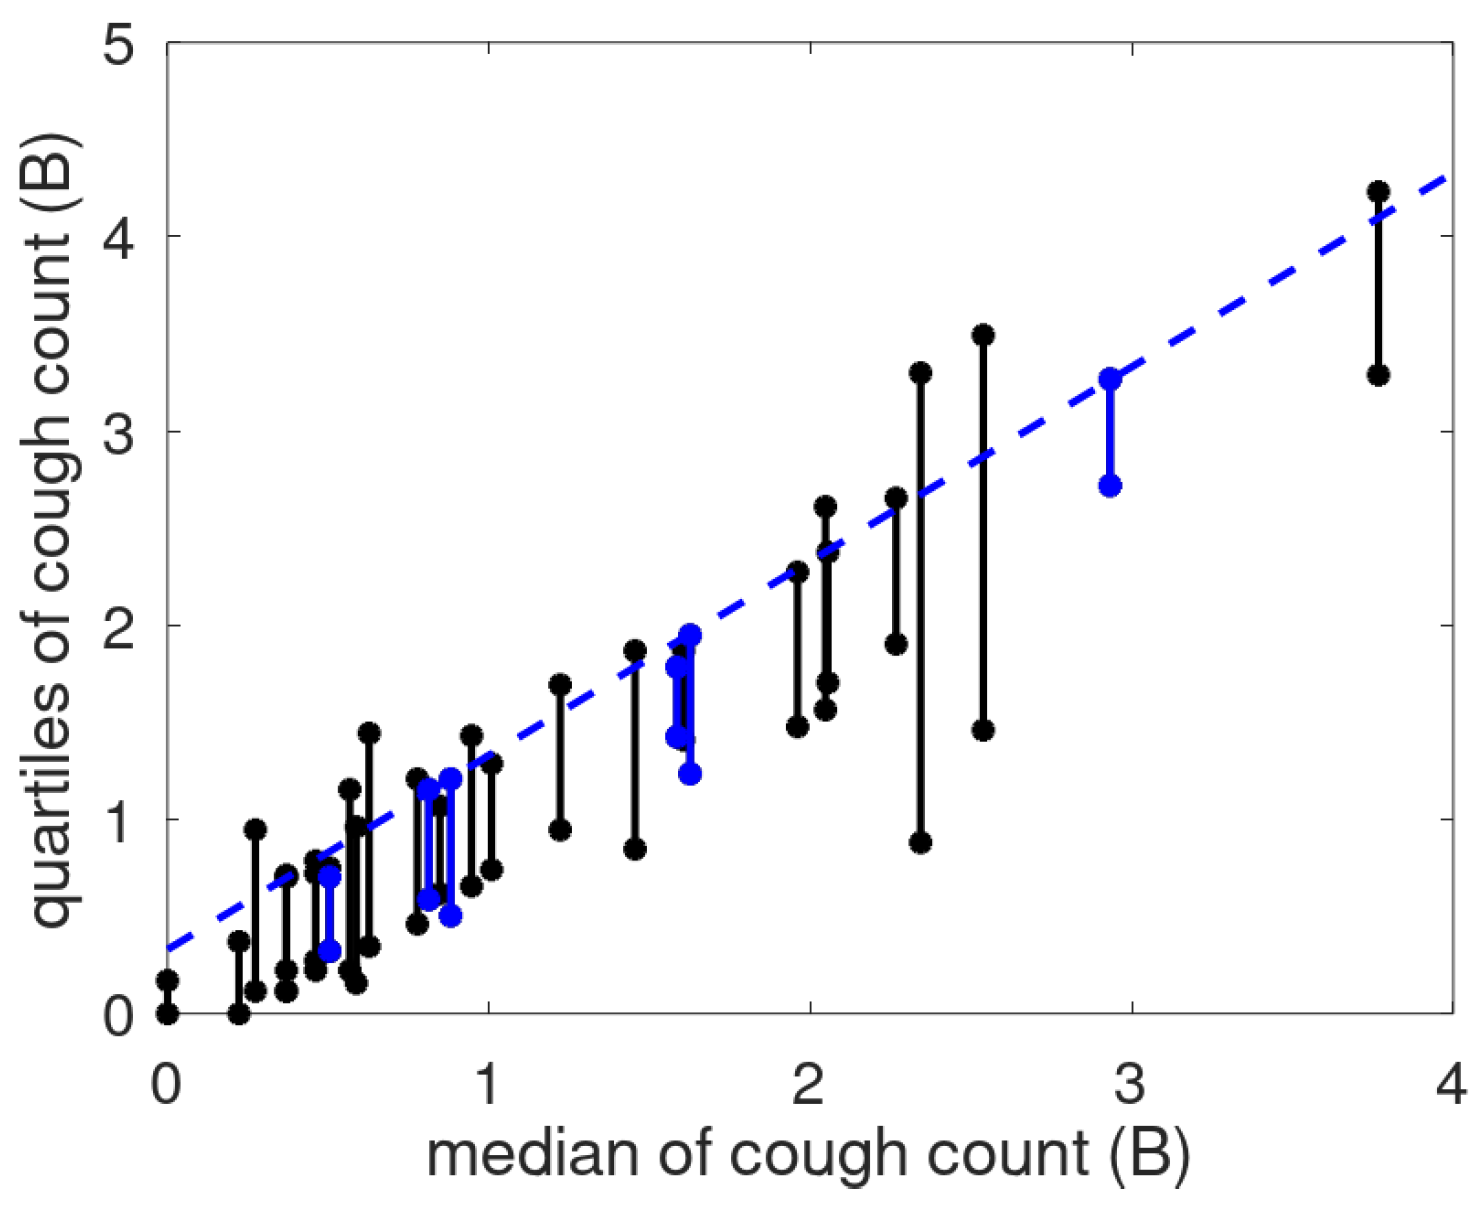
Figure 10.
Cough density profiles over the monitoring period (9PM to 9AM). Participants with stable cough count.
Figure 10.
Cough density profiles over the monitoring period (9PM to 9AM). Participants with stable cough count.
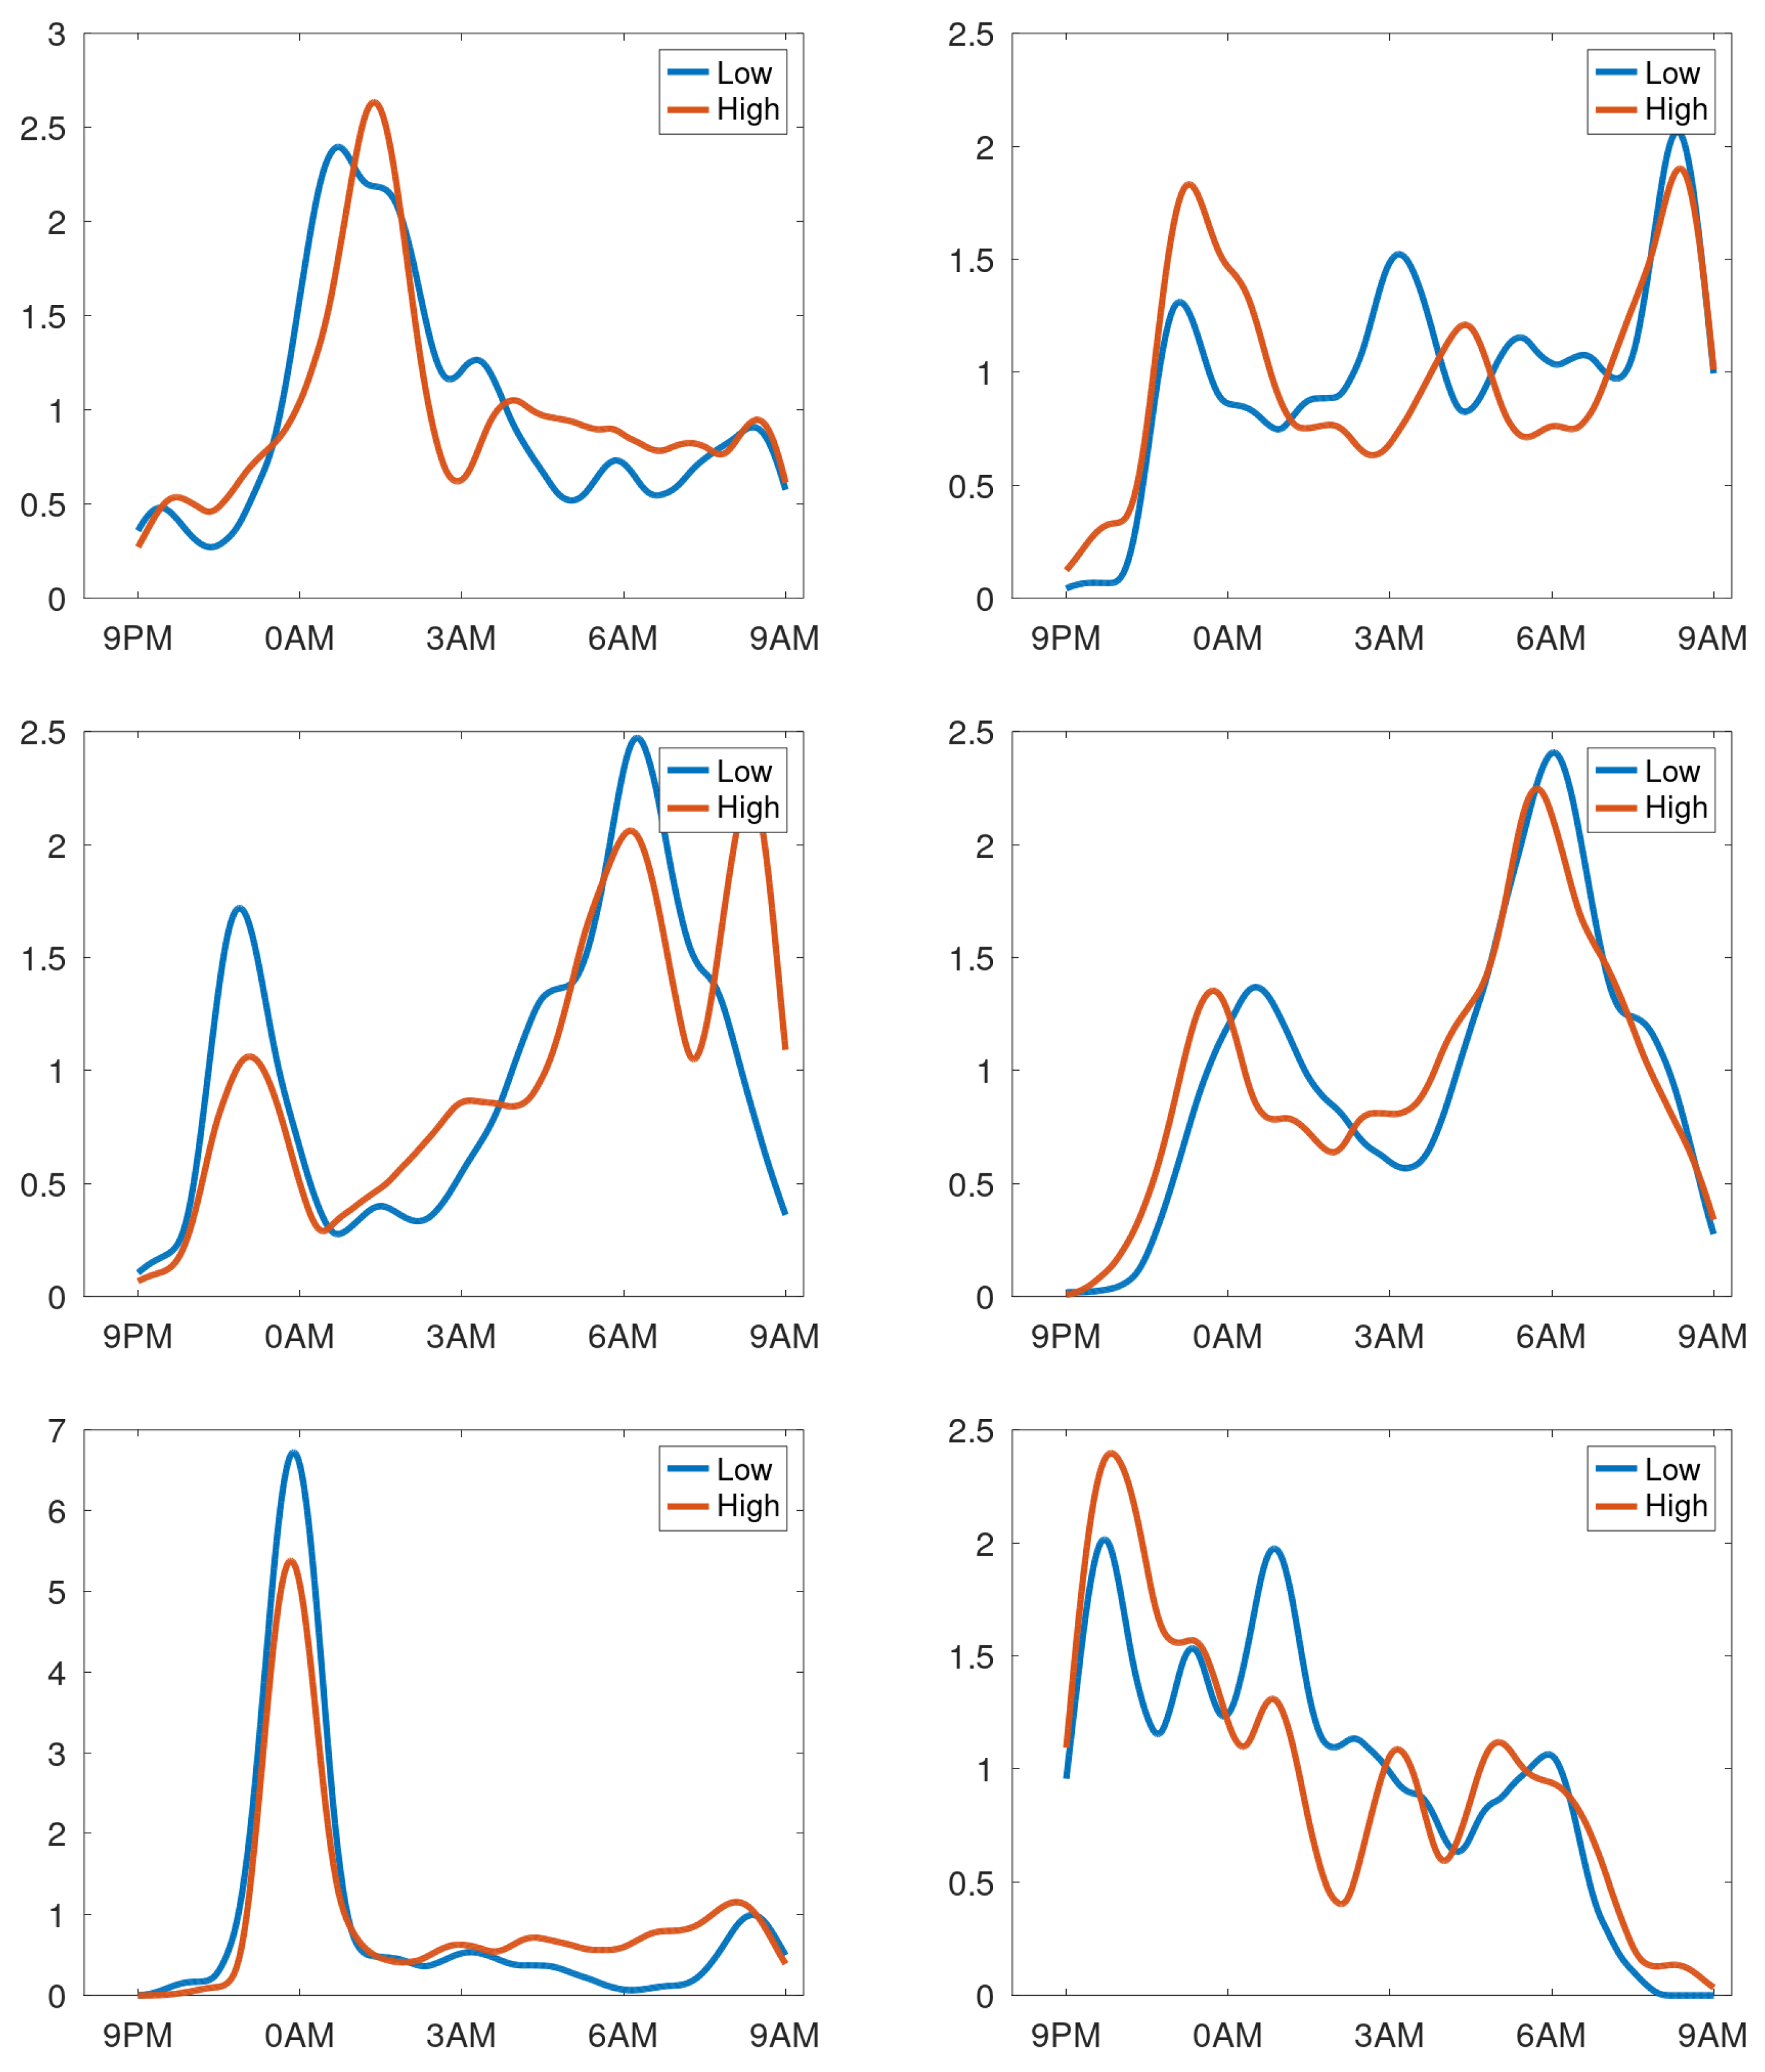
Figure 11.
Cough density profiles over the monitoring period (9PM to 9AM). Four examples from patients having an unstable cough count over the trial period.
Figure 11.
Cough density profiles over the monitoring period (9PM to 9AM). Four examples from patients having an unstable cough count over the trial period.
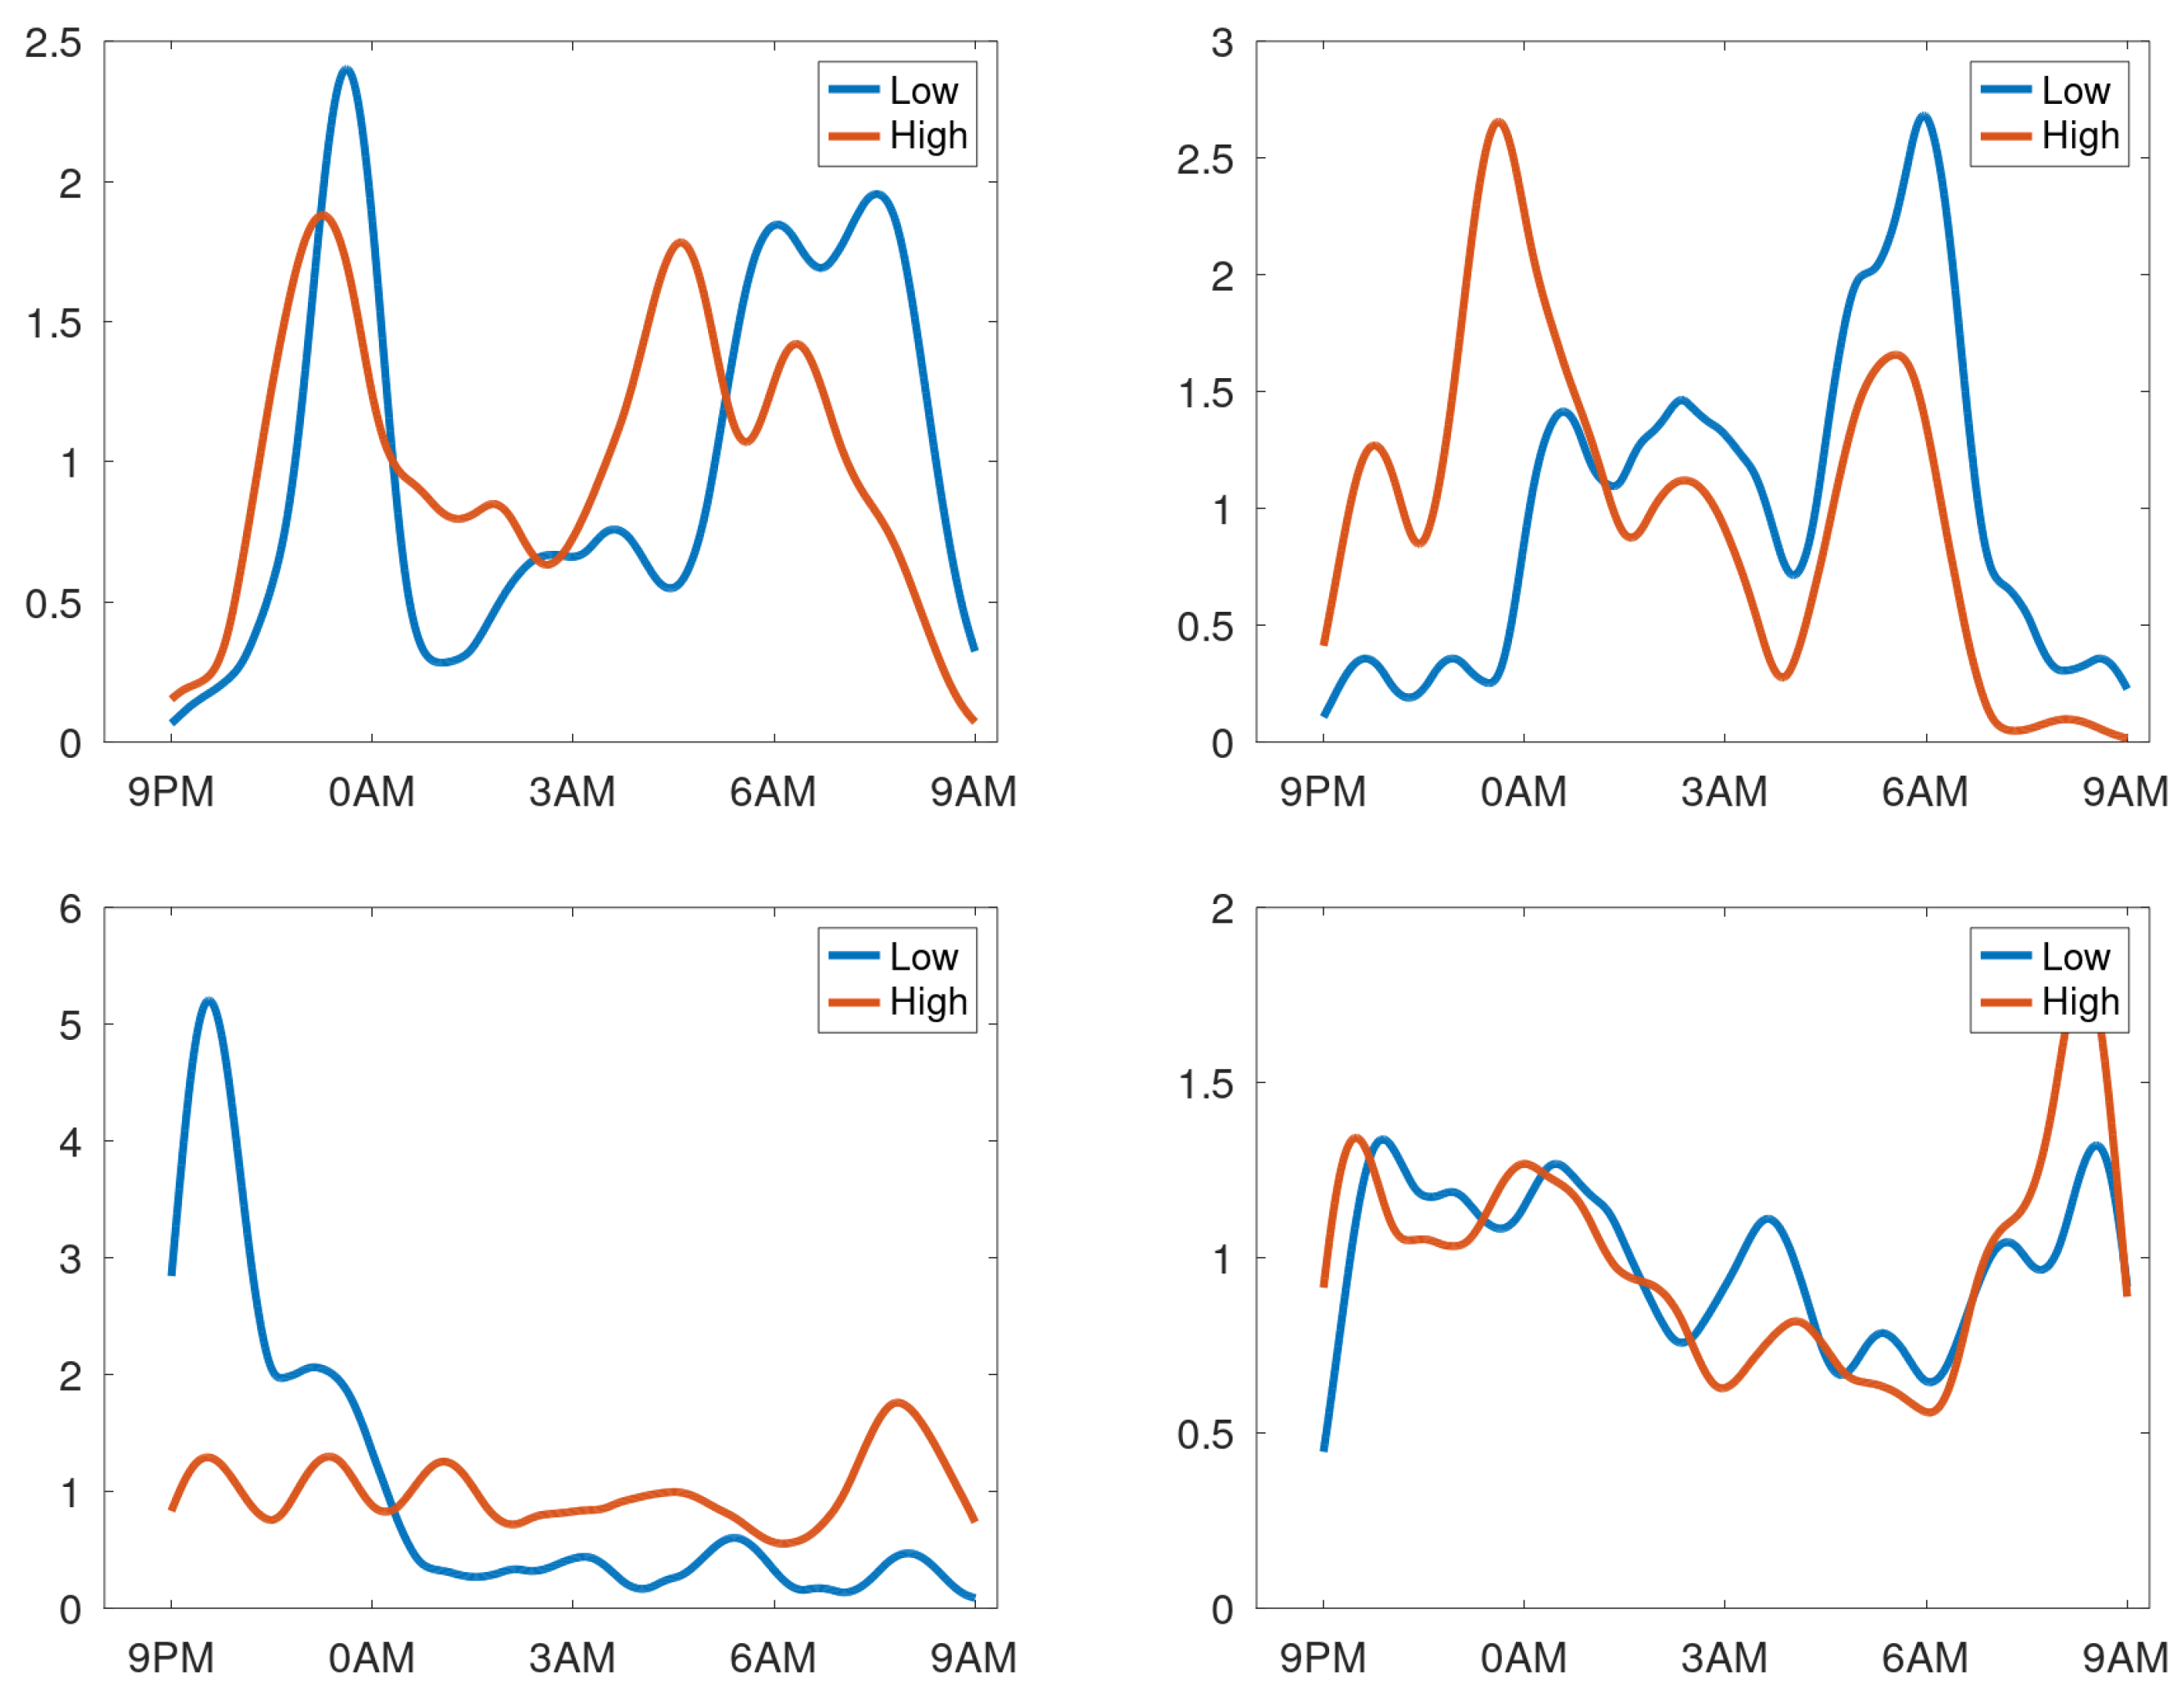
Table 1.
Alert mechanism settings. Parameters for mapping, smoothing and creating a dynamic threshold level.
Table 1.
Alert mechanism settings. Parameters for mapping, smoothing and creating a dynamic threshold level.
| Parameter | Setting | Units | |
|---|---|---|---|
| Mapping to B-scale | 3.45 | B | |
| 0.04 | |||
| Smoothing of data | p | 0.75 | |
| Alert mechanism | L | 14 | days |
| D | 5 | days | |
| 0.5 | |||
| O | 0.35 | B |
Table 2.
Baseline demographics for study participants. Values are expressed as median and range (in brackets). BMI: body mass index; FEV1: forced expiratory volume in 1 s; CAT: COPD assessment test, VAS: visual analogue scale for cough, HARQ: Hull airway reflux questionnaire. Not all data reflects the full cohort indicated by *: and o: .
| Characteristic | |||
|---|---|---|---|
| Gender: Male/Female | 24/14 | ||
| Age (years) | 72 -[57-84] | ||
| Weight (kg) | 79 [44-173] | ||
| Height (cm) | 168 [152-198] | ||
| BMI (kg/m2) | 27.7 [16.2-41.3] | ||
| Smoking status | |||
| • Current/ex | 7/31 | ||
| • Pack years | 46 [10.5-212] | ||
| FEV1 (L) | 1.13 [0.61 2.81] | ||
| % predicted FEV1 | 43 [20-106] | ||
| CAT score | |||
| • begin | 27 [5-37] | ||
| • end* | 25 [12-36] | ||
| VAS | 30 [0.5-85] | ||
| HARQ | 40 [8-70 ] | ||
| Exacerbationso (1/yr) | 3 [1-7] | ||
| Admissionso (1/yr) | 0 [0-2] |
Disclaimer/Publisher’s Note: The statements, opinions and data contained in all publications are solely those of the individual author(s) and contributor(s) and not of MDPI and/or the editor(s). MDPI and/or the editor(s) disclaim responsibility for any injury to people or property resulting from any ideas, methods, instructions or products referred to in the content. |
© 2024 by the authors. Licensee MDPI, Basel, Switzerland. This article is an open access article distributed under the terms and conditions of the Creative Commons Attribution (CC BY) license (http://creativecommons.org/licenses/by/4.0/).
Copyright: This open access article is published under a Creative Commons CC BY 4.0 license, which permit the free download, distribution, and reuse, provided that the author and preprint are cited in any reuse.


