Submitted:
20 November 2024
Posted:
21 November 2024
You are already at the latest version
Abstract
Electric connected automated vehicle (CAV) shuttles as a part of sustainable microtransit system have the potential to fill public transit service gaps. Following technology and traveler acceptance tests that are underway around the world, mass produced CAVs will be considered for shared mobility service, including “first/last mile” travel between public transit hub stations and medical campuses or other activity centers. There is a need for knowledge on treating risk in such applications. This paper covers planning and economic feasibility of advanced technology level 4 automated vehicle-based microtransit system considering uncertain service and economic feasibility factors. Methods are advanced for addressing uncertainties in travel demand, service factors, and economic feasibility of investments by public and private sector entities. Specifically, a probability-based macro simulation approach is used to treat demand and supply-side service factors as stochastic and is adapted for risk analysis in financial decision making. The effects of uncertain life cycle costs on fares and rate of return are described. Results are favorable regarding the technical and economic feasibility of advanced technology-based microtransit first/last mile service. The findings reported here are a contribution to knowledge on feasibility of implementing CAV-based first/last mile and other microtransit services under uncertainty.
Keywords:
microtransit
; shared mobility
; connected automated vehicle
; shuttle
; electrification
; first/last mile service
; risk analysis
; uncertainty
; economic feasibility
; sustainability
1. Introduction
Urban transportation systems are undergoing three transitions. The electrification transition is resulting in replacing internal combustion engine vehicles with battery electric or other technologies that do not produce greenhouse emissions. Information technology advances are enhancing efficiency of system operations and management. The third transition is artificial intelligence (AI)-supported automation in driving with expected safety and efficiency outcomes. The convergence of products of these three transitions have the potential to enhance microtransit services.
Microtransit, as a shared mobility system, is receiving policy and technology attention. It is defined as “Privately or publicly operated, technology-enabled transit services that typically use multi passenger/pooled shuttles or vans to provide on-demand or fixed schedule services with either dynamic or fixed routing” [1]. A service of special interest in this paper is the first/last mile connectivity that will enable travelers to complete the first and/or last mile of their journey.
Technical features and service types offered by microtransit are noted in the Institute for Research on Public Policy (IRPP) Insight [2]. The role of microtransit in various application contexts described in Table 1 reflects the need to fill gaps in conventional public transit system [3,4,5,6]. The on-demand nature of service combined with special fare policies for vulnerable population can improve equity of access and the use of accessible vehicles can improve service for persons with mobility challenges [7].
Among issues in providing on-demand microtransit services are the availability of right-sized low-cost non-polluting vehicles and the high cost of human operator. The driver cost for an accessible battery electric minibus with 19 seats accounts for 43% of vehicle cost [2]. The public transit industry is eagerly waiting for the availability of mass-produced electric automated shuttle vehicle for microtransit services. This will help in filling the well-known gaps in urban public transit network, which are generally referred to as the absence of on-demand and flexible route microtransit service. Examples are noted here. In the USA, a group largely made-up of public-sector transit organizations are interested in introducing and advancing automated vehicle (AV) technology in their jurisdictions [8]. In Germany, because of an agreement between the Federal Ministry of Transport and the Hanseatic City of Hamburg, by 2030, there could be up to 10,000 automated shuttles on Hamburg’s roads [9].
Given the new and novel nature of on-demand microtransit services provided by electric and automated vehicles, there is a need for information on the quantification of risk in service quality and economic feasibility. This paper presents methods to quantify risk in these factors for use in decision making under uncertainty. These can be applied to first/last mile travel as well as other types of microtransit services shown in Table 1. For better focus, a first/last mile service between a public transit hub station and a medical campus based on CAV shuttle is presented in this paper.
This introduction is followed by a description of the microtransit system and methods for treating uncertainties in service planning and economic feasibility assessment. Application of methods is illustrated in modelling first/last mile service requirements and economic feasibility evaluation of investments under uncertainty. The findings of this techno-economic research, both of methodological nature and results, can be applied to services noted in Table 1.
2. The Advanced Technology Microtransit System
The formation of transportation network companies (TNCs) and shared mobility services is evidence of the need for on-demand mobility that cannot be met by other available services [10]. The increasing development and user acceptance of on-demand public transit service based on conventional technology vehicles indicates the need for such services in many socio-economic environment contexts noted in Table 1.
However, for future use, a microtransit system should use electric and technologically advanced vehicles, supported by an operations, management and maintenance center (Figure 1). A high-level description of the system is that it would provide on-demand, frequent, right-sized vehicles to travelers who use an app or other method to request and pay for service. Digital technologies are already available to the system for offering options like route flexibility [3,4,11].
2.1. Traveler
Traveler acceptance of automated shuttle service (based on automation level 4) is a pre-requisite for the success of a future service. Riding in a shuttle vehicle monitored by a remote-control center may be viewed differently than riding in a slow speed demonstration shuttle with a technician on-board. Therefore, traveler acceptance cannot be assumed with certainty. Available knowledge on acceptance of automation in driving in general, and automated public transportation in particular, summarized here is intended to assist designers, manufacturers, policy analysts, and planners in implementations that would meet the needs of all potential users.
Literature sources noted below cover many facets of the subject of user and public acceptance of automated public transportation road vehicles (e.g., shuttles). Review articles suggest that more than sixty factors of expectation, experience, acceptance, and usage of automated public transportation vehicles were investigated. Frequently cited service factors include seat availability, comfort, on-time, schedules, fares, road safety, on-board security, and cyber security. User acceptance is also related to traveler personal factors, such as socio-demographics, travel habits, and personality.
Drawing upon information obtained from demonstrations and associated surveys, contributing authors have researched user and public acceptance of automation in public transportation. The reasons frequently noted for acceptance are social, economic, and environmental benefits obtainable from electric automated public transportation vehicles (e.g., accessibility for handicapped and elderly persons, reducing the use of private automobile, potential for lower cost of travel, reduction of emissions). Concerns expressed by users and deployment-related uncertainties are also noted. Several authors offered advice on correcting mistakes noted in demonstration of technology and service for future successful implementations.
Additional requirements of potential users include apps for interfacing with the system for the following purposes: dynamic reservations and route stops, announcements on expected time of arrival, real-time tracking information, contactless payment or other method, and future dynamic pricing.
The above information on traveler acceptance of automation in driving and the use of a shared mobility CAV is extracted from the following references:
- Survey interviews conducted before and after riding a shuttle reported by a number of researchers are in general positive in terms of favouring automation in public transportation. According to the following references, passengers did not express major concerns. Models developed suggest intention to use automated shuttles in the future. But technical issues and legal liabilities worried some responders, and they wanted a clearer explanation of legal responsibilities in case of an accident [43,44,45].
2.2. Electric Connected Automated Shuttle: Technology Capabilities
The battery electric automated shuttle (with automation level 4 capability) is intended to serve travelers for over 250 kms before recharge and it should have access to charging infrastructure within the public transit depot (garage). It should be right-sized for the intended service area and should be able to operate (following meeting automotive standards), in mixed traffic on urban local and arterial roads with maximum speed limits of 60 to 80 kms/hour [49].
Detailed research can identify a right-sized vehicle for a specific service area. The need for such investigations is supported by a survey of transit systems operating on-demand services in the USA that found conventional technology vehicles of 12 to 26 passenger capacity in use [50]. Reasons cited for using smaller vehicles (as opposed full-size buses) include lower operating costs, easier access to communities, acceptability in residential areas, easier navigation on narrower roads (especially for door-to-door service), suitable for serving low demand areas, and lower greenhouse gas emissions [50,51]. Other references on conventional technology vehicle size note 15 passenger capacity [5,6]. A study on autonomous shuttle demonstrations around the world found a range from 6 to 20-person capacity per vehicle [52]. Technology developers indicate that their accessible CAV shuttle will be able to accommodate 15 persons [49].
In theory, there is a relationship between vehicle size and total cost of vehicle deployment per veh-km or per seat-km. For a service area of known attributes, the optimal size can be found by searching for the minimum unit total cost, which is the sum of operational-fixed cost & social-waiting cost. The operational-fixed cost per seat-km decreases with increasing vehicle size. On the other hand, the social-waiting cost increases with vehicle size due to less frequent service offered with larger vehicles.
For illustration of methods advanced in this research, the accessible shuttle would have 15 seats plus space for one wheelchair. However, methods advanced can be applied to other vehicle sizes.
The automation features to be built into the CAV shuttle should include the latest fused sensor and mapping technologies as well as other capabilities for combining data from cameras, lidar, and radar. The AI-based advanced sensing and prediction system will be needed for sensing and predicting the dynamics of vehicle’s environment.
The CAV shuttle is expected to meet all traveler safety, security, and comfort requirements noted in Section 2.1. It should be connected with system operations for routing, stops and other instructions. Other desired capabilities include battery management, online platform for automated reporting, in-vehicle GPS, QR codes, Wi-Fi, information and advertisements [2,49]. The remote monitoring system should allow rapid response by supervisors if needed for passenger safety or roadway issue. The connectivity technology should interface with multimodal operation for traveler convenience [49].
2.3. Operations, Asset Maintenance, System Management
The operations, asset maintenance, and system management part of the microtransit system can be designed to have the necessary capabilities for ensuring that safety, efficiency and traveler service needs are met. These include connected vehicle capability, remote supervision of all shuttle vehicles in the loop, optimized dispatch and routes, service management, integration with other modes, automated vehicle location, automated passenger counting, advanced fleet management, digital platform for booking on-demand ride request, contactless fare payment, other methods for reservation and fare payment, providing options like route flexibility, AI-assisted routing decision, and data management system [2,3,4,11,49]. The advanced technology microtransit system is expected to be fully supported with digital technologies.
In accordance with the level 4 automation requirements, remote supervision capability will be a part of the system. The control center will be connected by a specifically designed communications network, for the purpose of supervising and managing CAV shuttles remotely. Using rapidly developing information technology, the remote monitor will be able to assist the self-driving software stack to make decisions regarding vehicle movement (e.g., path planning, conflict resolution) [2,49].
3. Methods for Treating Uncertain Planning and Economic Feasibility Factors
In planning services for potential travelers and assessing the economic feasibility of the future microtransit service, values of key variables cannot be predicted with certainty. The uncertain variables in service tactical planning are ridership during short time intervals within peak demand period, party size (i.e., number of travelers who prefer to travel together in a microtransit vehicle), and probability of seat availability with minimum delay. In the economic feasibility part of the research, life cycle costs and revenues cannot be predicted with certainty. Therefore, for realism in analyses, these variables should be analyzed with theoretically sound and well recognized methods.
Features of applicable methods include working with a range of values of uncertain variables (i.e., minimum and maximum values), application of probabilities to values of variables, and if applicable, treating peaking of values. To operationalize methodologies, there is a need for probability-based macrosimulation capability. In this method, it is valid to keep values for some variables as constant and for other variables probability distribution functions are applied. Another method is to analyze the effect of selected values of variables separately.
To meet requirements noted above, two categories of methods are applied in this research. The first is the probability-based Monte Carlo simulation method, recommended by major well-known organizations. Examples are the World Bank [53] and the U.S. Federal Highway Administration [54]. The second category of methods is macroscopic level sensitivity analysis that implies varying values of key variables and observing results. This method is in common use on its own merit, and it can be applied in association with the probability-based Monte Carlo simulation method.
As noted earlier, values of microtransit service variables that are considered stochastic are ridership during short intervals of time within the peak demand period, party size, and availability of a seat in a vehicle. In the economic feasibility part of this research, all costs are considered as stochastic, and their effect is studied on revenue needed for feasibility and implication for the fare to be charged. The probability of a value of a random service or cost variable can be represented by an applicable probability distribution function.
A rectangular (also called uniform) probability distribution function and a triangular probability distribution function are used in this research (Figure 2 and Figure 3). The choice of these functions is based on characteristics of stochastic variables. The cumulative distribution functions corresponding to these probability distributions are required by the Monte Carlo simulation method to randomly sample the probability distributions.
The continuous uniform probability distribution function is defined by two values: the minimum value a and the maximum value b. This distribution represents a higher uncertainty regarding the phenomenon under study. It represents a family of symmetric probability distributions with the property that all values of the random variable such as demand for service are equally probable. For example, when applied to microtransit service, the demand is defined by two parameters, a, and b, which represent the range set by the analyst. In scientific terms, this probability distribution is considered as the maximum entropy probability function for a stochastic variable denoted as X [55].
The continuous uniform probability distribution function has the following statistical characteristics.
Probability density function: P(X) = 1/(b-a) for X ϵ |a,b| and 0 otherwise
Mean: ½(a+b)
Median: ½(a+b)
Mode: any value in (a,b)
The continuous triangular probability distribution function is defined by three values: the minimum value a, the maximum value b, and the peak (i.e. the mode or most likely) value c. Due to the following characteristics, this probability distribution function has been widely applied. In real-life problem-solving conditions under uncertainty, the analyst is likely to estimate the maximum and minimum values, and the most frequent outcome. An analyst can specify these values without knowing the mean and the standard deviation of the values of the variable of interest. These statistics are difficult to obtain. Also, this function enables the analyst to bypass the assumed extreme values due to definite upper and lower limit. Further, another desirable feature of this function is that it enables the treatment of skewed probability distributions [55].
The main statistics of the triangular probability density function are noted below.
P(X) = 2(X-a)/[(b-a)(c-a)]
for a ≤ X ≤ c and
2(b-X)/[(b-a)(b-c)] for c ≤X≤ b
Also, P(X) = 0 for X<a and X>b
where c ϵ |a,b| is the mode
The mean is 1/3[(a+b+c)]
For applying the method, elements of the well-known Monte Carlo simulation are adapted. An introduction to simulation and Monte Carlo methods is provided by Rubinstein and Kroese [55]. Characteristics of probability distribution functions and their suitability for various applications are described by Evens et al. [56].
The process for the study of the interaction of stochastic demand and service supply factors is shown in Figure 4. This process is also applied to study economic feasibility under uncertainty. Simulation results enable inferences on service adequacy or deficiency. Likewise, the balance of stochastic costs and revenue are simulated using this method.
Following the completion of a specified number of runs, the probability of meeting the service demand or the economic feasibility requirement is computed. The methodology has the capability to treat uniform, triangular or other distribution functions. Other distributions are not applied in this research. Also, constant values of a variable can be included in simulations. While applying the method, different random number streams can be defined.
The probability-based macrosimulation approach was previously used by Khan [57] in shared mobility models that estimate vehicle and seat availability to a subscribing customer or group of customers. The balancing of demand and supply of fast chargers for electric vehicles under uncertainty was also studied with these models.
4. First /last Mile Service Planning under Uncertainty
4.1. Defining the Need for Microtransit
At the city/region level, demand can be estimated for travel to activity centres (e.g., medical and education campuses) using well developed models. At this macro level, trip generation rates for various trip purposes are estimated from origin-destination (OD) or other special surveys. From these data, trip desire lines are drawn. Following the calibration of a trip interchange model, it is used to forecast trips from various zones to an activity centre. These estimates reflect peak travel time and 24-hour (overall) travel demand. Next, modal split models are used to find how such trips are made (i.e., via private vehicle, public transit, etc.).
The public transit trips for desired purposes (e.g., visiting a medical facility) can be served with available modes, namely bus transit, rail transit, and paratransit. In the context of first/last mile service, following the estimation of demand for travel by public transit, (e.g., light rail or bus rapid transit), the closest and most convenient station can be identified for a specific activity centre. Following disembarking from the rapid transit service at a station, there is the need for a vehicle to transport travelers to their exact destination. After the completion of their visit to the activity centre, transportation is required to take travelers back to the public transit station.
The travel from the study area to the public transit station, commonly known as the “first mile” trip needs improved service. Likewise, travel from the public transit station to the activity centre, the “last mile” trip, is also poorly served due to well known gaps in public transit service. Taxis or TNC services (e.g., provided by UBER) can be costly and therefor out of reach for most or at least many travelers. Fixed route bus public transit with low frequently service is usually offered using high-capacity buses.
In many service contexts, there is a need for an affordable microtransit shuttle that can also accommodate on-demand flexible routing. Technology forecasts suggest that robo-shuttles are likely to be deployed soon in urban areas [58]. These forecasts are consistent with interest in many countries to implement electric CAVs for microtransit service [49].
The shuttle vehicles can be sized to best match the demand at short intervals of time (e.g., 5 to 15 minutes). Also, these vehicles can be designed to accommodate the physically challenged travelers who travel in a wheelchair. Another requirement for the “first/last mile” journey is to accommodate parties of various sizes. The rationale for this consideration is that some time, a person visiting a medical facility for health reason may be accompanied by family members or friends.
4.2. Service Features
A microtransit first /last mile service network, shown in Figure 5, that is to be served with 2030 technology is used for illustration of methods described above. It consists of six nodes, served by on-demand and flexible route shuttle vehicles. Node 1 is the public transit hub station which serves travelers from the overall urban area who require service to and from medical campuses. Node 2 is a medical building that generates relatively low demand as compared to nodes 3 to 6 and therefore it is a candidate for on-demand service. Service to all nodes is on-demand in the evening and at night. Residents of the low-density land use in the vicinity of nodes 2 to 6 can use the microtransit service. This example system has all realism features, but it is analyzed without geographic and institutional labels so to maintain flexibility of application in any urban area.
Based on the information presented in Section 2.2, the accessible CAV shuttle in this illustrative microtransit service has 15 seats plus space for one wheelchair. According to a City of Buffalo (USA) study that included service improvement for the Buffalo Niagara Medical Campus, 16% of Buffalo residents have disabilities [59]. In this research, 3% of microtransit users are in wheelchair and there is space for one wheelchair in each shuttle. Other persons with disabilities can use paratransit and other available services. The route length of 7-8 kms has links with posted speed of up to 60 kms/h used by mixed traffic. The end-to-end travel time is 16-19 minutes. The average occupancy of the 15-seat capacity vehicles is 60% and 20% of runs do not have occupants (i.e., 80% of runs are occupied). Therefore, for economic feasibility study, the year level occupancy is 48%.
At the rapid transit station designated as Node 1, during peak period, the demand for travel to nodes 2 to 6 can vary from 20 to 40 persons per 5 minutes and there can be a traveler in a wheelchair. At nodes 2 to 6, the demand per short time intervals can vary from zero to 15 persons. Persons who visit medical facilities are commonly accompanied by another person or persons and wish to travel together in the automated vehicle. Therefore, prediction of party size is of interest. Given the uncertain demand and service supply characteristics, it is necessary to study these variables as stochastic.
4.3. Treating Travel Demand, Seat Availability, and Party Size as Stochastic
The random nature of first/last mile travel demand per short time intervals, availability of seat, and party size are modelled using methodologies described in Section 3. After dropping off travelers to their destinations, they are served at these stops for return journey to the rapid transit station. Once again, the demand at each station and party size are stochastic. In some instances, some travelers may require service to go from one medical building to another.
It is intended to offer travelers seats with minimum waiting time. Therefore, the balance of seat demand and supply is studied under uncertainty. That is, for traveler convenience, the probability of seat availability at a station during short time intervals is intended to be favourable. The methodology enables the prediction of seat availability.
The arrivals at Node 1 during a 5-minute interval during peak travel period are simulated using the uniform probability distribution function. For the 20 to 40 traveler range, the probability of demand per 5-minute interval is shown in Figure 6. Although the uniform probability distribution is applied for simulating the arrivals, the random number-based sampling produces high probabilities for demand in the central part of the 20-40 arrivals per 5-minutes. Many simulations resulted in expected arrivals (mean) of 30.1 persons and the average St. deviation is 5.67. These are based on the following 3 runs of 100 simulations each (29.37 & 5.41, 29.98 & 5.39, 30.96&6.21).
At Node 1, the expected arrival of 30 travelers per 5-minute interval during the peak demand period calls for the availability of 2 shuttle vehicles to transport them to Nodes 2 to 6 and return to Node 1 for another cycle of service.
Using the availability of two shuttle vehicles to serve demand during a 5-minute peak load implies the availability of 30 seats. The travelers arriving in wheelchairs use available dedicated space in each vehicle. For the probability of seat availability calculations, 30 seat availability is applied in simulations. The mean value of expected arrivals obtained from the uniform probability distribution is 30 travelers (Figure 6). Although the demand for and supply of seats are both equal to 30, due to stochastic arrival phenomenon, the probability of seat availability is checked again. Simulations of seats needed versus availability produces the following results:
Expected mean value of extra seats (i.e., available seats – seats demanded) = 0.77 (approximately 1).
P(seat availability) = 0.55, which is satisfactory for peak period travel experience.
The availability of a seat at Nodes 2 to 6 was simulated using the uniform probability distribution function. In this case, both demand for and supply of seats in a vehicle with 15-seat capacity were treated as stochastic. The range for demand as well as supply of seats were set as 0 to 15. Zero seat supply implies that all seats are occupied. Results are presented in Figure 7. The x-axis represents the difference of available seats and demand for seats. The y axis shows the probability of seat availability. The regression equation represents probability of seat availability as a function of the difference of available seats and seats needed. A high value of R2 suggests a strong calibration of the equation. In scheduling service, the operations personnel can benefit from the use of the regression model so that travelers are offered a high probability of accessing seats in a vehicle at Nodes 2 to 6.
The party size was simulated using uniform probability distribution function. The results presented in Figure 8 suggest that a party size of 2 persons is more likely than other sizes. A single traveler is more likely to demand service than a 3- person party and the party size of 4 persons has almost zero probability. These results are useful for scheduling shuttle vehicles so that party sizes of two and three will be able to access seats without much delay.
4.4. Fleet Size
Fleet size is estimated using shuttle operation model applied to peak travel condition. The variables are vehicle departures per time interval to meet demand at the starting location (i.e., Node 1), vehicle capacity, and round-trip travel time.
where
F = q(Trt)
F is the fleet size (vehicles)
q is departures/ hour, based on demand and vehicle capacity
Trt is round trip time, obtained from simulation of operations or estimated from route length and average speed.
For the microtransit service based on shuttle vehicle with route flexibility for serving on-demand requests, the following are the inputs to the model. For route length of 7 to 8 kms, the one-way travel time is between 16 and 19 minutes -- 18 minutes is used.
Round trip time Trt based on 18 minutes/direction = (2)(18 minutes/direction) = 36 min
Demand /hour = (30 arrivals/5 minutes) (12) = 360 travelers/hour
Although on an urban area level, 16% of population can have disabilities [59], in this microtransit first/last mile service, 3% of travelers use wheelchairs and there is space for one wheelchair in every shuttle. The number of departures is estimated based on 15 seats per vehicle.
Departures q = 360/15= approx. 24 departures/hour
F = q(Trt) = (24)(36/60) = 14.4, rounded to 15 vehicles
Fleet size with spares = 15 + 2 spare vehicles = 17 vehicles.
In calculating operational costs, 15 vehicles are used, but capital cost of vehicle acquisition is based on 17 vehicles.
5. Economic Feasibility Factors
5.1. Information Requirements for Life Cycle Economic Analysis Under Uncertainty
The following information is required for a public sector microtransit project economic feasibility computation: capital cost of vehicles and salvage values; capital cost of infrastructure; cost of yearly vehicle operation, maintenance, and management; yearly asset maintenance cost; yearly cost of system management; number of years for life cycle analysis; interest/discount rate for capital recovery computations expressed as minimum acceptable rate of return (MARR) (free of inflation).
For private sector investment in microtransit system, the following additional information is required: depreciation allowance (also called capital cost allowance CCA); company tax rate; allowing interest on debt to lower taxable income; and after-tax MARR (free of inflation).
5.2. Capital Costs of Vehicles and Infrastructure
Electric level 4 automated shuttle vehicles for use in 2030 will not be in the market for a few more years. Most available literature sources show the high cost of demonstration vehicles which are not applicable to the 2030 market. Examples include [44,60]. Two detailed studies report cost information that is used in this research because their estimates are obtained from “building the CAV from ground up”. One is a study on economic assessment of autonomous electric microtransit vehicles for 2030 service in Singapore [61]. This reference describes life cycle costs of a 30-passenger capacity vehicle. Another source is a study on cost of an electric minibus with 20 seats using European costs for components [62]. The authors of this paper make frequent references to Swiss sources, but the detailed information is equally applicable to other locations.
Although these two future vehicles are larger than the 15-seat capacity shuttle vehicle (with additional space for a wheelchair) of interest in this research, there are many design features of the 2030 CAV shuttle that are common with the 20-seater and the 30-seater capacity vehicles investigated by other researchers (e.g., accessibility and comfort requirements, power needed for travel at maximum posted urban arterial speed, the structural design of vehicle to meet the standards in Noth America and elsewhere).
The cost of the vehicle reported in [61] is in 2017 Singapore dollars. Using exchange rates and CPI index, the cost was converted to 2023 Canadian dollar (CAD). The 2030 price/vehicle expressed in 2017 Singapore dollars is 140,000 and in 2023 CAD it amounts to $174,000/vehicle. The cost of the 20-seater vehicle reported by [62] in 2016 Swiss Francs (CHF) is 70,000. Using CPI index and exchange rates, the capital cost of this vehicle in 2023 CAD is 118,500. It is assumed that the accessible electric level 4 automated shuttle analyzed in this research with 15-seat capacity (plus space for one wheelchair) will cost about as much as the Swiss vehicle due to higher design standards and ample space needed for accessibility and passenger comfort.
In risk analyses described in Section 6, the base case uses $118,500/vehicle (2023 CAD). The cost multipliers of 1.25 and 1.5 are used to account for uncertainty in the cost of the shuttle vehicle even with fleet discount offered by the manufacturer. The multiplier of 1.5 results in the capital cost of a vehicle as $177,750 (2023 CAD). This high estimate exceeds the cost of the Singapore concept vehicle.
Based on system operation consideration, vehicles will be used for 57,000 kms/vehicle/year for 5 years and will be replaced with new vehicles for use during years 6 to 10. The base case cost of the 17-vehicle fleet is 2,014,500 (2023 CAD) (at fleet discount price) and the fleet renewal will cost the same in 2023 constant CAD. The salvage value of the fleet is set at one-tenth of the purchase price. The salvage values will materialize at the end of years 5 and 10 of service.
Capital cost for infrastructure items (in 2023 CAD) are as follows: kiosks and control system $113,000; five chargers including in-depot installation $511,000;, infrastructure construction and installations $1,800,000. Kiosks will be placed at each station (to be used for ticket purchase and information). The infrastructure construction tasks include building stations/stops, and the control system room. The estimated infrastructure cost includes installations of kiosks, and control system items.
5.3. Yearly Operation, Maintenance, Management Costs
Vehicle operation and maintenance (O&M) costs per veh-km shown in Figure 9 are based on information reported in references [2,61,62]. These include, in the decreasing order of magnitude, costs of vehicle maintenance, vehicle fleet management (an overhead item), power (electricity), cleaning, insurance, and tires. Using an estimated 57,000 kms/vehicle/year in association with the unit costs, the vehicle O&M costs/year for the electric CAV fleet are compiled. The yearly costs for asset maintenance and system management amount to $450,000/year (in 2023 CAD). Based on cost analysis for the 15-seat capacity (plus space for wheelchair) CAV electric shuttle, the $/vehicle-km is $1.21and $/seat-km is $0.08 (in 2023 CAD).
5.4. System Level Cost of Microtransit Service
Since elements of the life cycle costs occur throughout the 10-year life of the system, the time value of money is accounted for using the MARR of 5% (real) for cash flow analysis. As noted earlier, all dollars in this paper are represented in 2023 constant Canadian dollar (CAD). To compute system level life cycle cost of the microtransit service, all cost items are converted to equivalent annual costs (EAC) and are adjusted for salvage values (which are negative costs). The theoretical base for the process and equations can be viewed in an engineering economics book [63]. The computations described next are based on 10 years of service life and MARR of 5% (real). The MARR expressed in real dollars allows life cycle constant dollar computations (which do not include inflation).
The process for converting capital costs incurred at the outset of service initiation into EAC uses the capital recovery factor which applies the MARR of 5% (real) to account for the time value of money. Capital costs that incur at the beginning of year six (i.e., vehicle fleet replacement costs) are expressed first in their present worth and then converted to EAC. Likewise, the salvage dollars (negative costs) that occur at the end of year 5 are first converted to their present worth and then are converted to equivalent annual worth (EAW), which are negative costs. The salvage dollars that occur at the end of year 10 are converted to their EAW directly with the use of an available equation for this purpose [63]. The annual costs (in constant dollars) that are as expressed uniform series are already in their equivalent annual cost terms.
The system costs computed using 10 years of life and MARR of 5% (real) are presented in Table 2 and their percentage shares out of total are illustrated in Figure 10. Based on the cost information described above, the overall system level cost for first/last mile service is $2.10/veh-km and $0.14/seat-km (in 2023 CAD). These 2030 system costs are presented in 2023 constant Canadian dollar.
In comparison, for a non-automated 19-person capacity accessible electric minibus currently used for on-demand microtransit service in Canada, the vehicle cost alone is $2.99/vehicle-km and $0.16/seat-km (in 2018 CAD) [2]. The cost items included in compiling these unit costs for the minibus are capital cost of the vehicle, power (electricity) cost, maintenance, and driver cost [2]. As previously noted, for the electric non-automated minibus, 43% of cost is accounted for by the driver cost. Also, another reason for cost difference is that the minibus reflects early 2020 technology and general shortage of suppliers of electric minibuses in the market.
5.5. Revenue Estimation
Since the first/last mile service is a public microtransit service, the commonly applicable sources of revenue can be considered. These include fares paid by users, funds obtained from advertisements, and government subsidies. In this research, the first two sources are of interest. The advertisement revenue is estimated as $75,000/year. For computing revenue from travelers, quantification of travelers/year is required. Estimates developed show 851,290 passengers/year, who travel approximately 7 kms/trip. The rationale for this estimate is as follows. Although on a yearly basis, 3% of travelers are in wheelchairs, these do not reduce the 15-seat capacity of the shuttle. Based on vehicle-kms travelled by 15 vehicles, the average distance travelled per traveler, 80% occupied runs (i.e., at least one seat is occupied), and average 60% occupancy level, the number of passengers is estimated to be 851,290/year.
In the base case for the public microtransit project, the total revenue required is $1.8 million for obtaining the minimum rate-of-return (ROR) of 5.0% (real). Removing 75,000 advertisement revenue, $1.725 million revenue is to be obtained from fares. This results in $2.03 per passenger – rounded to $2.05 per passenger (2023 CAD). Using $2.05 per passenger, the revenue becomes $1,820,145. Further information on fare and revenue factors is presented in the following section.
6. Economic Feasibility of Public Sector Service Under Uncertainty
For economic feasibility, several criteria are applicable: the rate-of-return (ROR) higher than the MARR, positive net present worth (NPW), positive net equivalent annual worth (EAW) [63]. The rate of return (ROR) is the interest rate that will result in present worth of all costs equal to present worth of revenue. That is, the ROR can be calculated by equating the net present worth (NPW) of cash flow to zero and solving for the interest rate that allows the equality. For feasibility, the ROR should exceed the MARR. Using the other criteria noted above, a positive result is necessary for feasibility when cash flows are computed using the MARR as the interest rate. In this paper, the ROR results are highlighted, but NPW results are used as well in feasibility computations.
In describing the economic feasibility part of this research, a base case is the starting point for the public ownership system. That is, all costs are paid by the public transit agency. Next, six risk analysis cases are presented that show results of probability-based macroscopic simulation method and application of 1.25 & 1.5 multipliers to all cost items. The minimum revenue and fare per passenger are computed for a feasible service. Figure 11 shows required inputs, computations and outputs for the public sector service feasibility analysis and Table 3 presents the inputs and results.
In the base case, for probable feasibility (i.e., P(NPW>0) & P(ROR>MARR of 5%)), the fare per passenger is $2.05. This base case is followed by six risk analysis cases with the aim to account for uncertain costs and impact on fare per passenger. Risk case 1 applies the triangular probability distribution function to costs that represent: base case cost (as low estimate), high estimate (1.25x base case cost), and average of these is used as the mode. These cost escalations are applied to all costs and salvage values are adjusted accordingly. Simulation results are used to find minimum revenue and corresponding fare per passenger. As expected, the minimum revenue and fare must increase because of cost increases. Risk case 2 uses the minimum and maximum cost estimates for uniform probability distribution function-based simulations. Given that the uniform probability distribution represents a higher level of uncertainty, the minimum revenue and fare per passenger are higher than for Risk case 1 (the triangular probability distribution case).
Risk case 3 is based on costs that are 1.25xbase case costs. Here, this level of uncertainty is treated as highly likely with probability of 1.0. The results show further increases in minimum revenue and corresponding fare for a feasible service. Risk case 4 is like Risk Case 1 except the maximum cost is obtained with 1.5xbase case cost. The triangular probability distribution function simulation results show further increases in minimum revenue and fare per passenger for feasibility. Risk case 5 is like Risk case 2 (the uniform probability distribution case), except the maximum costs are 1.5 times the base case costs. Results show further increases in minimum revenue and fare. Risk case 6 is like Risk case 3, except the costs are 1.5 times the base case costs. This highest uncertainty case shows 49.0% increase in minimum revenue and 51.2% increase in fare/passenger as compared to the base case condition.
7. Shifting Risk to Private Sector
Given the uncertainty in capital and operation costs, and the commonly experienced lack of monetary resources available to a public transit agency, research on the role of private sector investment in the first/last mile service may be of interest to an urban government. Shifting risk from public to private sector is commonly practiced in transportation investment decisions. A private sector entity may be keen on exploring the ROR obtainable with the use of two favourable factors. The first is capital cost (depreciation) allowance (CCA) that reduces taxable income. The second is to allow the use of interest paid on repayment of a loan acquired by the private sector entity to reduce taxable income. Figure 12 presents the inputs, computations and outputs for private sector investment analysis. It is assumed that the public transit agency will allow the use of its depot for setting up the control centre, battery charging, and storing vehicles. Otherwise, all capital and operating costs will be paid by the private investor.
Table 4 shows the public sector base case for reference. In this case fare per passenger is $2.05 (CAD 2023) and the ROR is 5.8% which exceed the MARR of 5% (real). Two private sector investment analyses are presented which are based on capital and operating costs that are identical to the public sector case. Also, revenue and associated fare are kept at the same level as in the public sector base case.
In the first private sector investment study, no loan is assumed. Due to capital cost allowance, the taxable income is reduced and consequently, the ROR increases to 6.0% (real). In the second private sector analysis case, a loan of $3 million is assumed, to be repaid at 7% (real) interest. In this case, without increasing minimum revenue and fare/passenger, the after-tax ROR improves to 9.3% (real) due to reduction of taxable income caused by depreciation (i.e.,CCA) allowance and interest on loan. The allowable depreciation and corporate tax are based on Canada Revenue Agency guidelines, which are in general like those of U.S. Internal Revenue Service guidelines. Given the prospect of these favourable after-tax ROR outcomes which exceed the MRR of 5% (real), the private sector entity may be interested in investing in the first/last mile microtransit service under uncertainty.
8. Discussion
This techno-economic research on future advanced technology microtransit first /last mile service advances methods for treating uncertainty in planning and economic feasibility variables. The rationale for the necessity to address uncertainty is explained in applicable parts of the paper and is briefly summarized here.
Although technology and service demonstration of the automated shuttles around the world continue to suggest generally positive user experience, the acceptance of travelers to travel in a future remotely monitored CAV is uncertain. Technology advances are likely to result in safe and secure travel, but the service attributes such as availability of seat in a vehicle without delay is uncertain. In this research, the interaction of demand and service supply factors is studied by treating uncertainties in demand, party size, and availability of seat in the vehicle. Likewise, due to the absence of an in-service mass-produced CAV shuttle of desired specification, data on acquisition and operation costs are not available. Basing economic feasibility study on the high cost of present generation experimental shuttles can produce misleading results.
The approach to economic feasibility study is based on life cycle analysis while treating uncertainties in costs and revenue estimates. The capital and operating costs are sourced from investigations that used the approach to “building the CAV shuttle from ground up” and factored-in cost reduction obtainable from mass production. Also, fleet discount is applied while procuring technology. The results provide details on rate of return under uncertainty and user fare implications. The role of the private sector is studied in terms of shifting risk from public to private sector.
9. Conclusions
Technology forecasts suggest that level 4 CAV shuttles are likely to be mass produced within a few years for deployment in microtransit services. The availability of these advanced technology vehicles will offer opportunities to public transit agencies to fill gaps in public transit system. To avail opportunities, methodological advances and data will be needed to overcome uncertainties. This paper describes and illustrates methods for treating uncertain planning and economic feasibility factors that can potentially be used by public transit agencies for their studies on future CAV-based microtransit services such as the first/last mile service illustrated here. In addition to methodological contributions, the results can be used as a starting point for future studies.
Several stakeholders can potentially benefit from this research. For the information of public transit agencies and the traveling public, this research shows that gaps in transit services can be filled with economically feasible sustainable microtransit service (e.g., first/last mile travel needs can be met). Planners and operations personnel can use the techno-economic methods illustrated in this paper for treating uncertain factors in their studies. Government agencies can be guided regarding how much to invest under uncertainty for obtaining a socially responsible ROR while offering affordable fares to users of service. Technology developers and vendors can study shuttle sale and fleet discount tactics. Private sector entities may wish to know if their desirable ROR can be obtained while meeting fare guidelines of urban public transit agencies.
Data Availability Statement
Data are included in this paper.
Acknowledgments
This research was supported by the Natural Sciences and Engineering Research Council of Canada (NSERC).
Conflict of Interest
The author declares no conflict of interest.
References
- Shaheen, S.A.; Cohn, A.P. Navigating seismic shifts in transportation. Chapter 2 in Shared mobility and automated vehicles: Responding to social-technical changes and pandemics. Edited by Ata M. Khan and Susan A. Shaheen. The Institution of Engineering and Technology. UK, 2022.
- Khan, A.M.; Ren, T. The new mobility era: Leveraging digital technologies for more equitable, efficient and effective public transportation. IRPP Insight, April 2024, No. 52. Montreal.
- Canadian Urban Transit Association (CUTA) and Metrolinx. On-demand Transit Toolkit, A resource guide for service implementation. Toronto. MAY 2022.
- Canadian Urban Transit Association (CUTA) and Dillion Consulting. Integrated Mobility, Implementation Toolbox. Toronto. September 2017.
- Lewis, L. The delicate balance of microtransit: Service vs. Efficiency, or Transformational opportunity vs. just the latest fad. Passenger Transport 2019, 77. American Public Transportation Association. Available online: https://www.apta.com.
- AECOM & Urban Trans North America. Microtransit literature review & case studies. GOMAINE, Microtransit White Paper. May 2023.
- Allen, J.; Farber, S. Sizing up transport poverty: A national scale accounting of low-income households suffering from inaccessibility in Canada, and what to do about it. Transport Policy 2019, 74, 214–223. [Google Scholar] [CrossRef]
- Descant, S. Automated Connected Electric Shared (ACES) (USA). Interest in introducing and advancing AV technology. Government Technology 2023. [Google Scholar]
- Federal Ministry of Transport (Germany); Hanseatic City of Hamburg. By 2030, there could be up to 10,000 autonomous shuttles on Hamburg’s roads. Press Release, https://www.moia.io/en. Hamburg, October 23rd, 2023.
- Shaheen, S.A.; Khan, A.M. Introduction. Chapter 1 in Shared mobility and automated vehicles: Responding to socio-technical changes and pandemics. Edited by Ata M. Khan and Susan A. Shaheen. The Instutution of Engineering and Technology. UK, 2022.
- Park, K. The present and future of demand responsive transport in Korea. Session 6 – Demand- responsive transportation for inclusive mobility. Transforming transportation conference 2023, organized by the World Bank and WRI Ross Center for Sustainable Resources Institute, The World Bank Group, Washington, D.C., March 14-15, 2023.
- Nishihori, Y.; Kimura, K.; Taniguchi, A.; Morikawa, T. What Affects Social Acceptance and Use Intention for Autonomous Vehicles—Benefits, Risk Perception, or Experience? Meta-Analysis in Japan. Int. J. Intell. Transp. Syst. Res. 2018, 18, 22–34. [Google Scholar] [CrossRef]
- Moody, J.; Bailey, N.; Zhao, J. Public perceptions of autonomous vehicle safety: An international comparison. Saf. Sci. 2019, 121, 634–650. [Google Scholar] [CrossRef]
- Chikaraishi, M.; Khan, D.; Yasuda, B.; Fujiwara, A. Risk perception and social acceptability of autonomous vehicles: A case study in Hiroshima, Japan. Transp. Policy 2020, 98, 105–115. [Google Scholar] [CrossRef]
- Hussain, Q.; Alhajyaseen, W.K.; Adnan, M.; Almallah, M.; Almukdad, A.; Alqaradawi, M. Autonomous vehicles between anticipation and apprehension: Investigations through safety and security perceptions. Transp. Policy 2021, 110, 440–451. [Google Scholar] [CrossRef]
- Wicki, M. How do familiarity and fatal accidents affect acceptance of self-driving vehicles? Transp. Res. Part F Traffic Psychol. Behav. 2021, 83, 401–423. [Google Scholar] [CrossRef]
- Taniguchi, A.; Enoch, M.; Theofilatos, A.; Ieromonachou, P. Understanding acceptance of autonomous vehicles in Japan, UK, and Germany. Urban, Planning and Transport Research 2022, 10, 514–535. [Google Scholar] [CrossRef]
- 18 Khan, D.; Fujiwara, A.; Shiftan, Y.; Chikaraishi, M.; Tenenboim, E.; Nguyen, T.A.H. Risk Perceptions and Public Acceptance of Autonomous Vehicles: A Comparative Study in Japan and Israel. Sustainability 2022, 14, 10508. [Google Scholar] [CrossRef]
- Othman, K. Public acceptance and perception of autonomous vehicles: A comprehensive review. AI Ethic. 2021, 1, 355–387. [Google Scholar] [CrossRef] [PubMed]
- Souza, L.M.; Castañon, J.A.B. Public perception of autonomous vehicles: A brief review. Res. Soc. Dev. 2021, 10, e571101624236. [Google Scholar] [CrossRef]
- Sun, Y.; Olaru, D.; Smith, B.; Greaves, S.; Collins, A. Road to autonomous vehicles in Australia: An exploratory literature review. Road Transp. Res. A J. Aust. N. Z. Res. Pract. 2017, 26, 34–47. [Google Scholar]
- Alsalman, A.; Assi, L.N.; Ghotbi, S.; Ghahari, S.; Shubbar, A. Users, planners, and governments perspectives: A public survey on autonomous vehicles future advancements. Transp. Eng. 2021, 3, 100044. [Google Scholar] [CrossRef]
- Xing, Y.; Zhou, H.; Han, X.; Zhang, M.; Lu, J. What influences vulnerable road users’ perceptions of autonomous vehicles? A comparative analysis of the 2017 and 2019 Pittsburgh surveys. Technol. Forecast. Soc. Chang. 2022, 176, 121454. [Google Scholar] [CrossRef]
- Islam, R.; Abdel-Aty, M.; Lee, J.; Wu, Y.; Yue, L.; Cai, Q. Perception of people from educational institution regarding autonomous vehicles. Transp. Res. Interdiscip. Perspect. 2022, 14, 100620. [Google Scholar] [CrossRef]
- Alsalman, A.; Assi, L.N.; Ghotbi, S.; Ghahari, S.; Shubbar, A. Users, planners, and governments perspectives: A public survey on autonomous vehicles future advancements. Transp. Eng. 2021, 3, 100044. [Google Scholar] [CrossRef]
- Van Brummelen, J.; O’brien, M.; Gruyer, D.; Najjaran, H. Autonomous vehicle perception: The technology of today and tomorrow. Transp. Res. Part C Emerg. Technol. 2018, 89, 384–406. [Google Scholar] [CrossRef]
- Koh, L.Y.; Yuen, K.F. Public acceptance of autonomous vehicles: Examining the joint influence of perceived vehicle performance and intelligent in-vehicle interaction quality. Transportation Research Part A: Policy and Practice 2023, 178, 103864. [Google Scholar] [CrossRef]
- Yuen, K.F.; Chua, G.; Wang, X.; Ma, F.; Li, K.X. Understanding Public Acceptance of Autonomous Vehicles Using the Theory of Planned Behaviour. Int. J. Environ. Res. Public Health 2020, 17, 4419. [Google Scholar] [CrossRef]
- Yuen, K.F.; Wong, Y.D.; Ma, F.; Wang, X. The determinants of public acceptance of autonomous vehicles: An innovation diffusion perspective. J. Clean. Prod. 2020, 270, 121904. [Google Scholar] [CrossRef]
- Yuen, K.F.; Cai, L.; Qi, G.; Wang, X. Factors influencing autonomous vehicle adoption: An application of the technology acceptance model and innovation diffusion theory. Technol. Anal. Strateg. Manag. 2021, 33, 505–519. [Google Scholar] [CrossRef]
- Adnan, N.; Md Nordin, S.; Ariff bin Bahruddin’, M.; Ali, M. How trust can drive forward the user acceptance to the technology? In-vehicle technology for autonomous vehicle. Transportation Research Part A: Policy and Practice 2018, 118, 819–836. [Google Scholar] [CrossRef]
- Penmetsa, P.; Adanu, E.K.; Wood, D.; Wang, T.; Jones, S.L. Perceptions and expectations of autonomous vehicles—A snapshot of vulnerable road user opinion. Technol. Forecast. Soc. Chang. 2019, 143, 9–13. [Google Scholar] [CrossRef]
- Kassens-Noor, E.; Cai, M.; Kotval-Karamchandani, Z.; Decaminada, T. Autonomous vehicles and mobility for people with special needs. Transp. Res. Part A Policy Pract. 2021, 150, 385–397. [Google Scholar] [CrossRef]
- Ayoub, J.; Yang, X.J.; Zhou, F. Modeling dispositional and initial learned trust in automated vehicles with predictability and explainability. Transp. Res. Part F Traffic Psychol. Behav. 2021, 77, 102–116. [Google Scholar] [CrossRef]
- Xiao, J.; Goulias, K.G. Perceived usefulness and intentions to adopt autonomous vehicles. Transp. Res. Part A Policy Pract. 2022, 161, 170–185. [Google Scholar] [CrossRef]
- Ghoushchi, S.J.; Ab Rahman, M.N.; Soltanzadeh, M.; Rafique, M.Z.; Hernadewita, H.; Marangalo, F.Y.; Ismail, A.R. Assessing Sustainable Passenger Transportation Systems to Address Climate Change Based on MCDM Methods in an Uncertain Environment. Sustainability 2023, 15, 3558. [Google Scholar] [CrossRef]
- Krueger, R.; Rashidi, T.H.; Rose, J.M. Adoption of Shared Autonomous Vehicles—A Hybrid Choice Modeling Approach Based on a Stated-Choice Survey. In Proceedings of the 95th Annual Meeting of the Transportation Research Board, Washington, DC, USA, 10–14 January 2016. [Google Scholar]
- Cai, Y.; Wang, H.; Ong, G.P.; Meng, Q.;.; Lee, D.-H. Investigating user perception on autonomous vehicle (AV) based mobility-on-demand (MOD) services in Singapore using the logit kernel approach. Transportation 2019, 46, 2063–2080. [Google Scholar] [CrossRef]
- Paddeu, D.; Shergold, I.; Parkhurst, G. The social perspective on policy towards local shared autonomous vehicle services (LSAVS). Transp. Policy 2020, 98, 116–126. [Google Scholar] [CrossRef]
- Yuen, K.F.; Huyen, D.T.K.; Wang, X.; Qi, G. Factors Influencing the Adoption of Shared Autonomous Vehicles. Int. J. Environ. Res. Public Health 2020, 17, 4868. [Google Scholar] [CrossRef] [PubMed]
- Eden, G.; Nanchen, B.; Ramseyer, R.; Evéquoz, F. Expectation and Experience: Passenger Acceptance of Autonomous Public Transportation Vehicles. 16th IFIP Conference on Human-Computer Interaction (INTERACT), Sep 2017, Bombay, India. pp.360-363, ff10.1007/978- 3-319-68059-0_30ff. ffhal-01679835.
- Hilgarter, K.; Granig, P. Public perception of autonomous vehicles: A qualitative study based on interviews after riding an autonomous shuttle. Transp. Res. Part F Traffic Psychol. Behav. 2020, 72, 226–243. [Google Scholar] [CrossRef]
- Feys, M.; Rombaut, E.; Vanhaverbeke, L. Experience and Acceptance of Autonomous Shuttles in the Brussels Capital Region. Experience and Acceptance of Autonomous Shuttles in the Brussels Capital Region. Sustainability 2020, 12(20), 8403. [Google Scholar] [CrossRef]
- New York State Energy Research and Development Authority (NYSERDA) and New York State Department of Transportation (NYSDOT). Self-Driving Electric Vehicles for Smart and Sustainable Mobility: Evaluation and Feasibility Study for Educational and Medical Campuses. NYSERDA Report Number 21-16, 2021. Prepared by A.W. Sadek, C. Qiao, A. Bartlett, J. Sapphire, E.C. Colvin, M. Leydecker, and D.C. Duchscherer. nyserda.ny.gov/publications.
- Pigeon, C.; Alauzet, A.; Paire-Ficout, L. Factors of acceptability, acceptance and usage for non-rail autonomous public transport vehicles: A systematic literature review. Transportation Research Part F: Traffic Psychology and Behaviour. 2021, 81, 251–270. [Google Scholar] [CrossRef]
- Camps-Aragó, P.; Temmerman, L.; Vanobberghen, W.; Delaere, S. Encouraging the Sustainable Adoption of Autonomous Vehicles for Public Transport in Belgium: Citizen Acceptance, Business Models, and Policy Aspects. Sustainability 2022, 14, 921. [Google Scholar] [CrossRef]
- Berrada, J.; Mouhoubi, I.; Christoforou, Z. Factors of successful implementation and diffusion of services based on autonomous vehicles: Users’ acceptance and operators’ profitability. Res. Transp. Econ. 2020, 83, 100902. [Google Scholar] [CrossRef]
- Chng, S.; Kong, P.; Lim, P.Y.; Cornet, H.; Cheah, L. Engaging citizens in driverless mobility: Insights from a global dialogue for research, design and policy. Transp. Res. Interdiscip. Perspect. 2021, 11, 100443. [Google Scholar] [CrossRef]
- James, A. Interview: BEEP, Share Value. ADAS & Autonomous Vehicle International, pp. 43-7 September 2024. Also see HOCHBAHN. Autonomous on-demand shuttles. Hommburger Hochbahn AG 2021. info@hochbahn.de & Norman, H. Driverless shuttle set to hit the roads in Milton Keynes, UK, next month. Autonomous Vehicles & ADAS, tti, Nov. 6, 2024.
- Volinski, J. Microtransit or General Public Demand-Response Transit Services: State of the Practice. Transportation Research Board, 2019. Washington, D.C.
- Klumpenhauwer, W. The State of Demand-Responsive Transit in Canada. Transit Analytics Lab, University of Toronto. Final report. July 2020.
- Autonomous shuttle implementation and best practices. Report No. 23-33. Authors: Dil Samina Diba, Ninand Gore, Srinivas Pulugurtha. San Jose State University. December 2023. Transweb.sjcu.edu.
- World Bank Institute (WBI). Economic Analysis of Investment Operations, Analytical Tools and Practical Applications. WBI Development Studies, 2001. Authored by Belli, P., Anderson, J.R., Barhum, J.N.,Dixon, J.A., Tan, J-P.
- Federal Highway Administration (FHWA) Office of Asset Management, Life-Cycle Cost Analysis Primer, FHWA, Washington, D.C., 2002.
- Rubinstein, R.Y.; Kroese, D.P. Simulation and the Monte Carlo Method; Wiley, 2016. [Google Scholar]
- Evans, M.; Hastings, N.; Peacock, B. Triangular distribution, in: Statistical Distributions, 3rd ed, Chapter 40, 187-188.2000. New York: Wiley.
- Khan, A. Matching demand and supply under uncertainty, in: Shared mobility and automated vehicles: Responding to socio-technical changes and pandemics, Chapter 12, edited by Ata M. Khan and Susan A Shaheen. The Institution of Engineering and Technology. 2022.
- McKinsey & Company. Where does shared autonomous mobility go next. Automotive & Assembly Practice. McKinsey Global Publishing. Jan. 2023.
- U.S Department of Transportation. Niagra Frontier Transportation Authority (NFTA) Buffalo All Access. ITS4 US Deployment Program Phase 2, Intelligent Transportation Systems Joint Program Office, FHWA-JPO-22-964. 2022.
- Eno Center for Transportation. Cities now exploring autonomous buses – but is it worth it? Authored by Greg Rogers, April 17, 2017.
- Ongel, A.; Loewer, E.; Roemer, F.; Sethuraman, G.; Chang, F.; Lienkamp, M. Economic assessment of autonomous electric microtransit vehicles. Sustainability 2019, 11, 648. [Google Scholar] [CrossRef]
- Bosch, P.M.; Becker, F.; Becker, H.; Axhausen, K.W. Cost-based analysis of autonomous mobility services. Transport Policy 2018, 64, 76–91. [Google Scholar] [CrossRef]
- Fraser, N.M.; Jewkes, E.M.; Pirnia, M. Engineering Economics, Financial decision making for engineers, 6th ed.; Pearson Education Incorporated, 2017. [Google Scholar]
Figure 1.
Microtransit system.
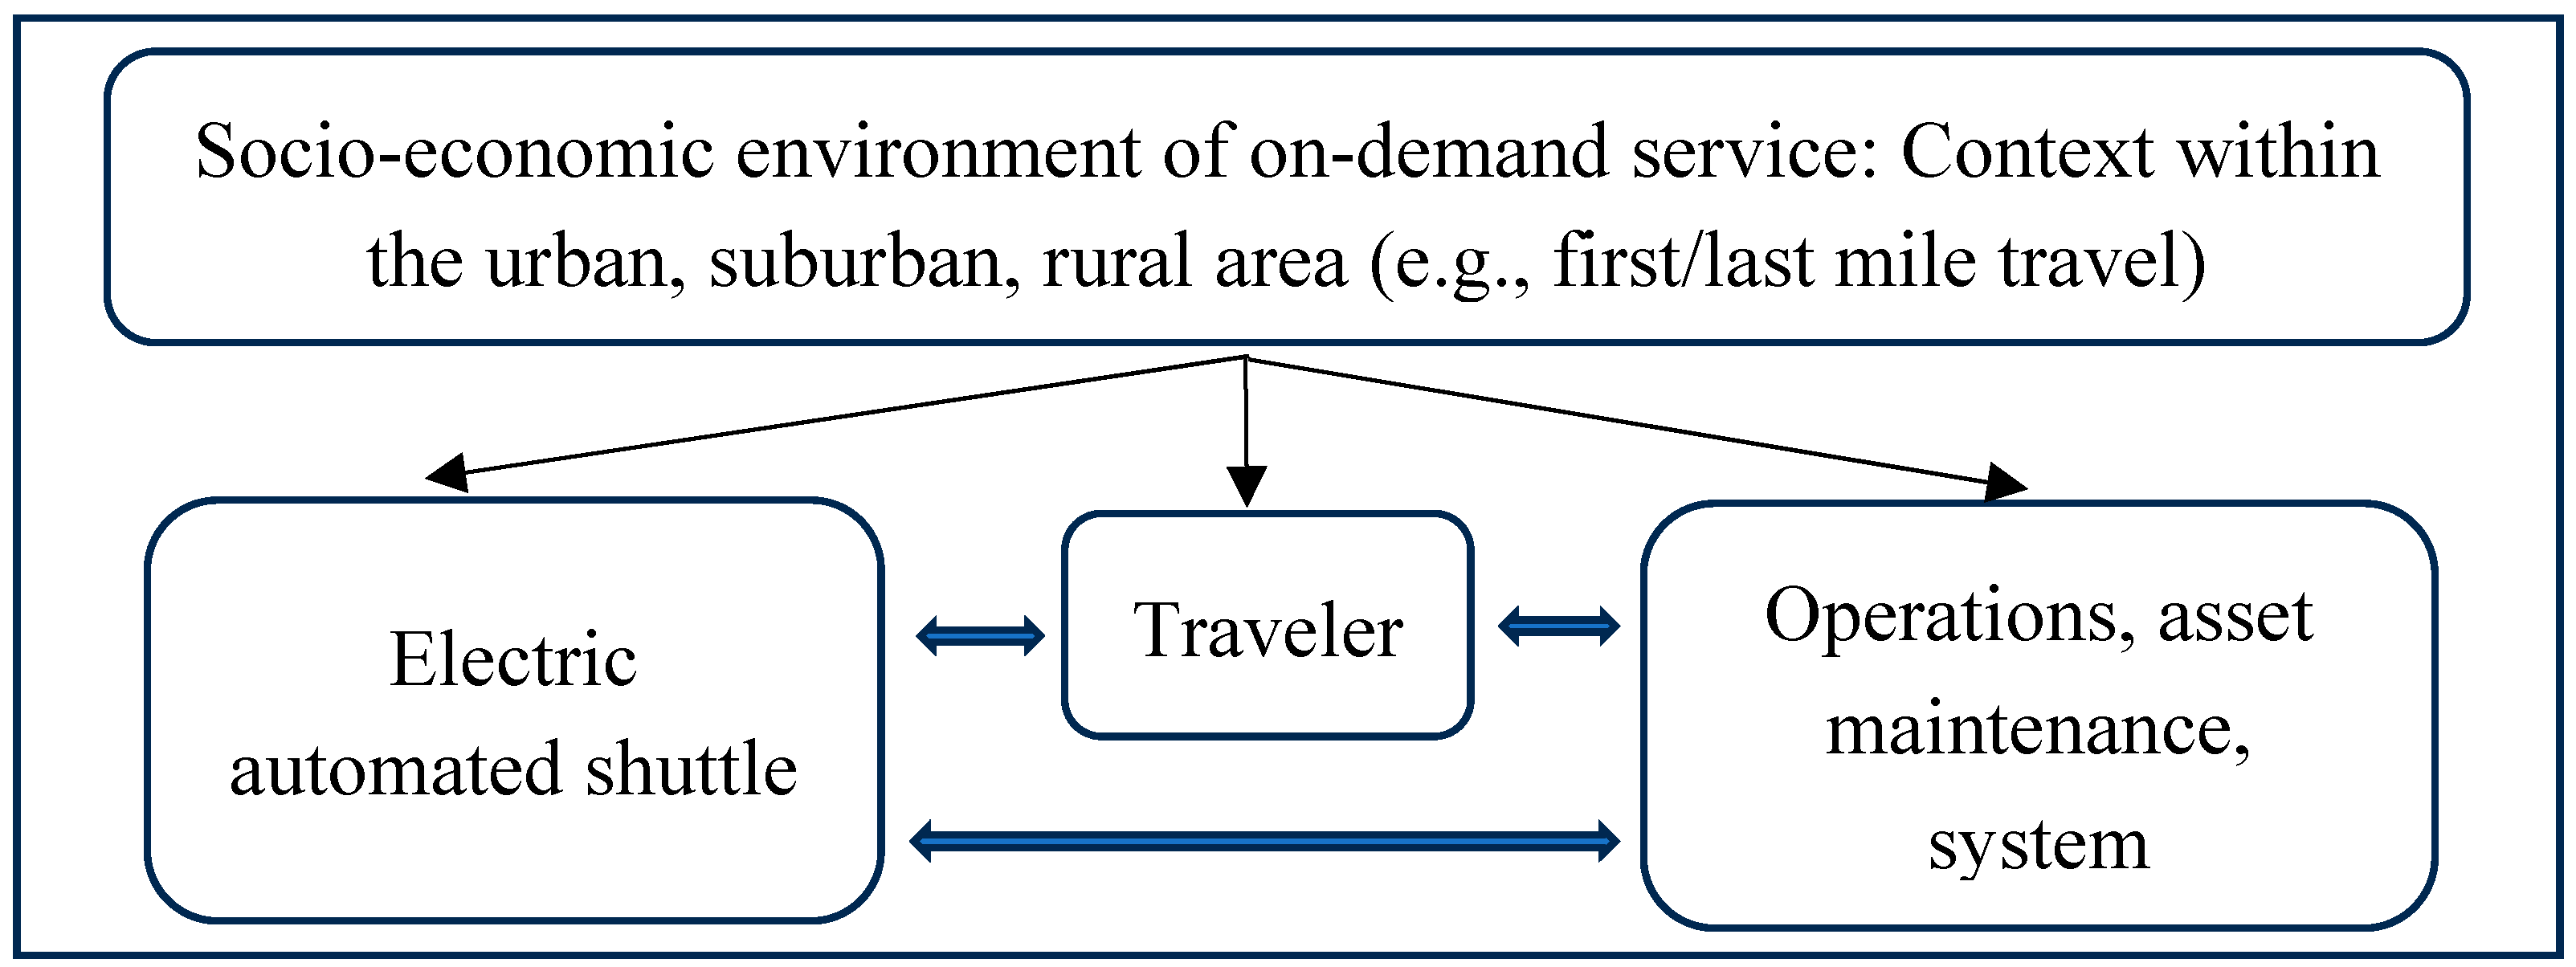
Figure 2.
Uniform probability distribution function.
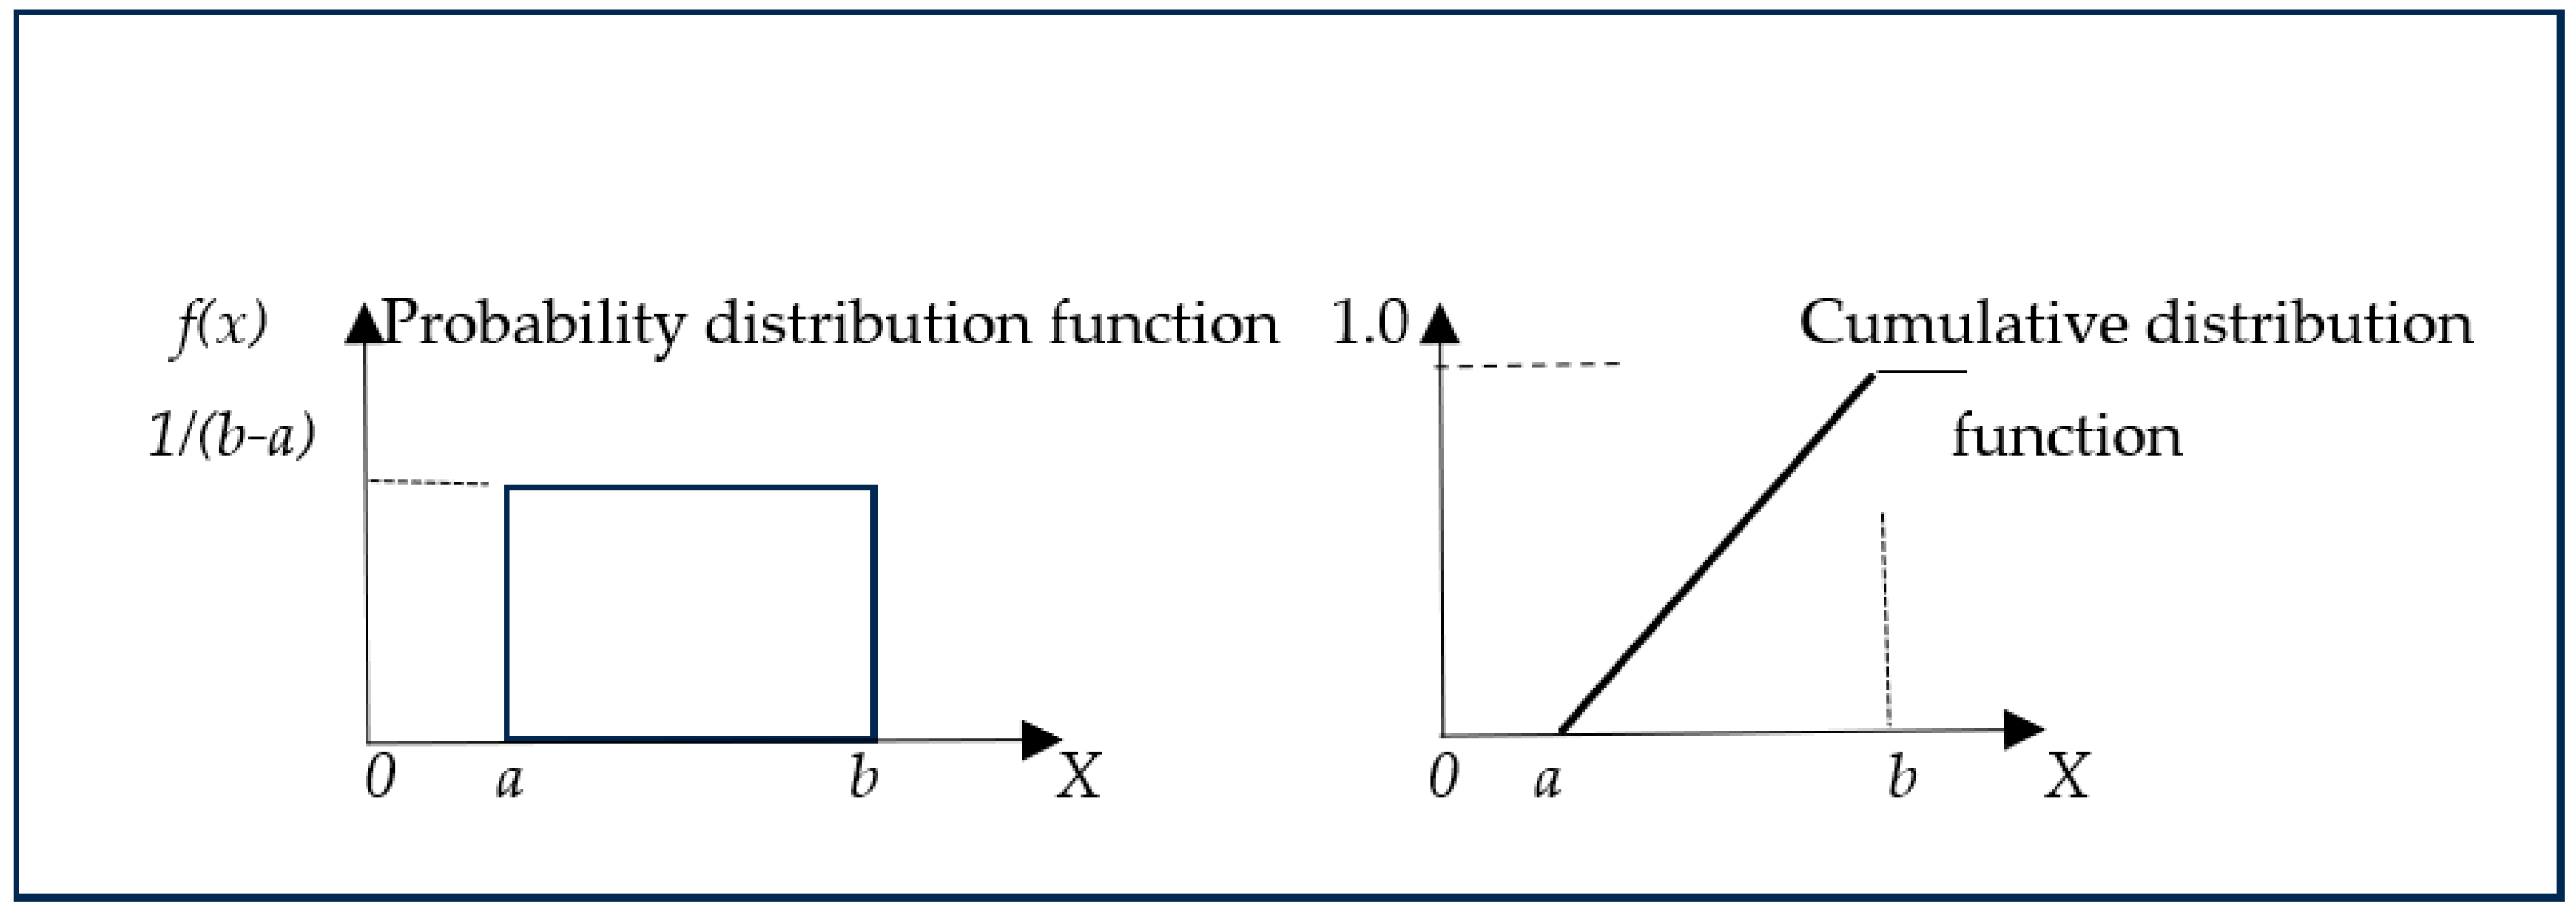
Figure 3.
Triangular probability distribution function.
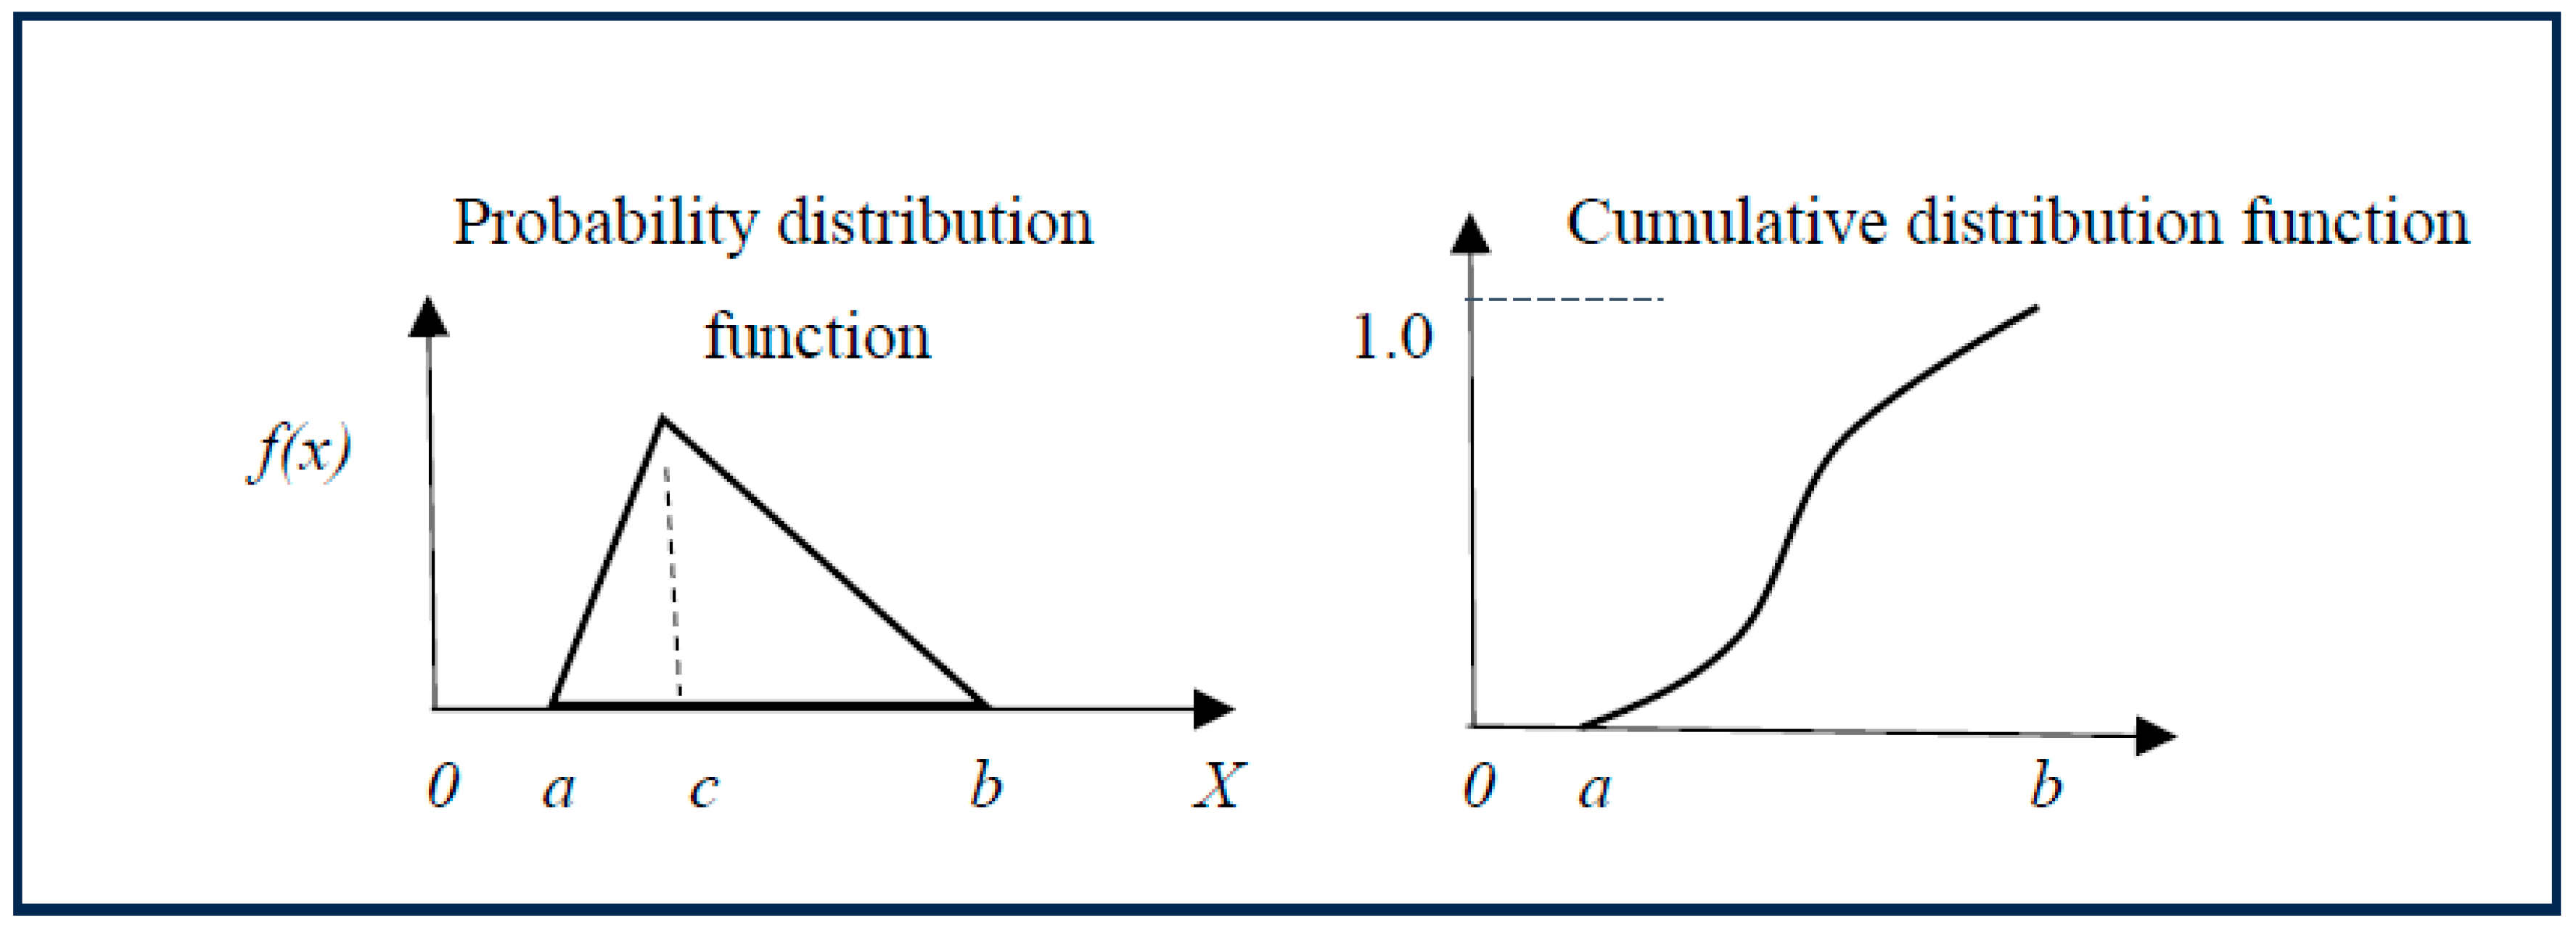
Figure 4.
Simulation of meeting demand with available supply of service or economic feasibility factors.
Figure 4.
Simulation of meeting demand with available supply of service or economic feasibility factors.
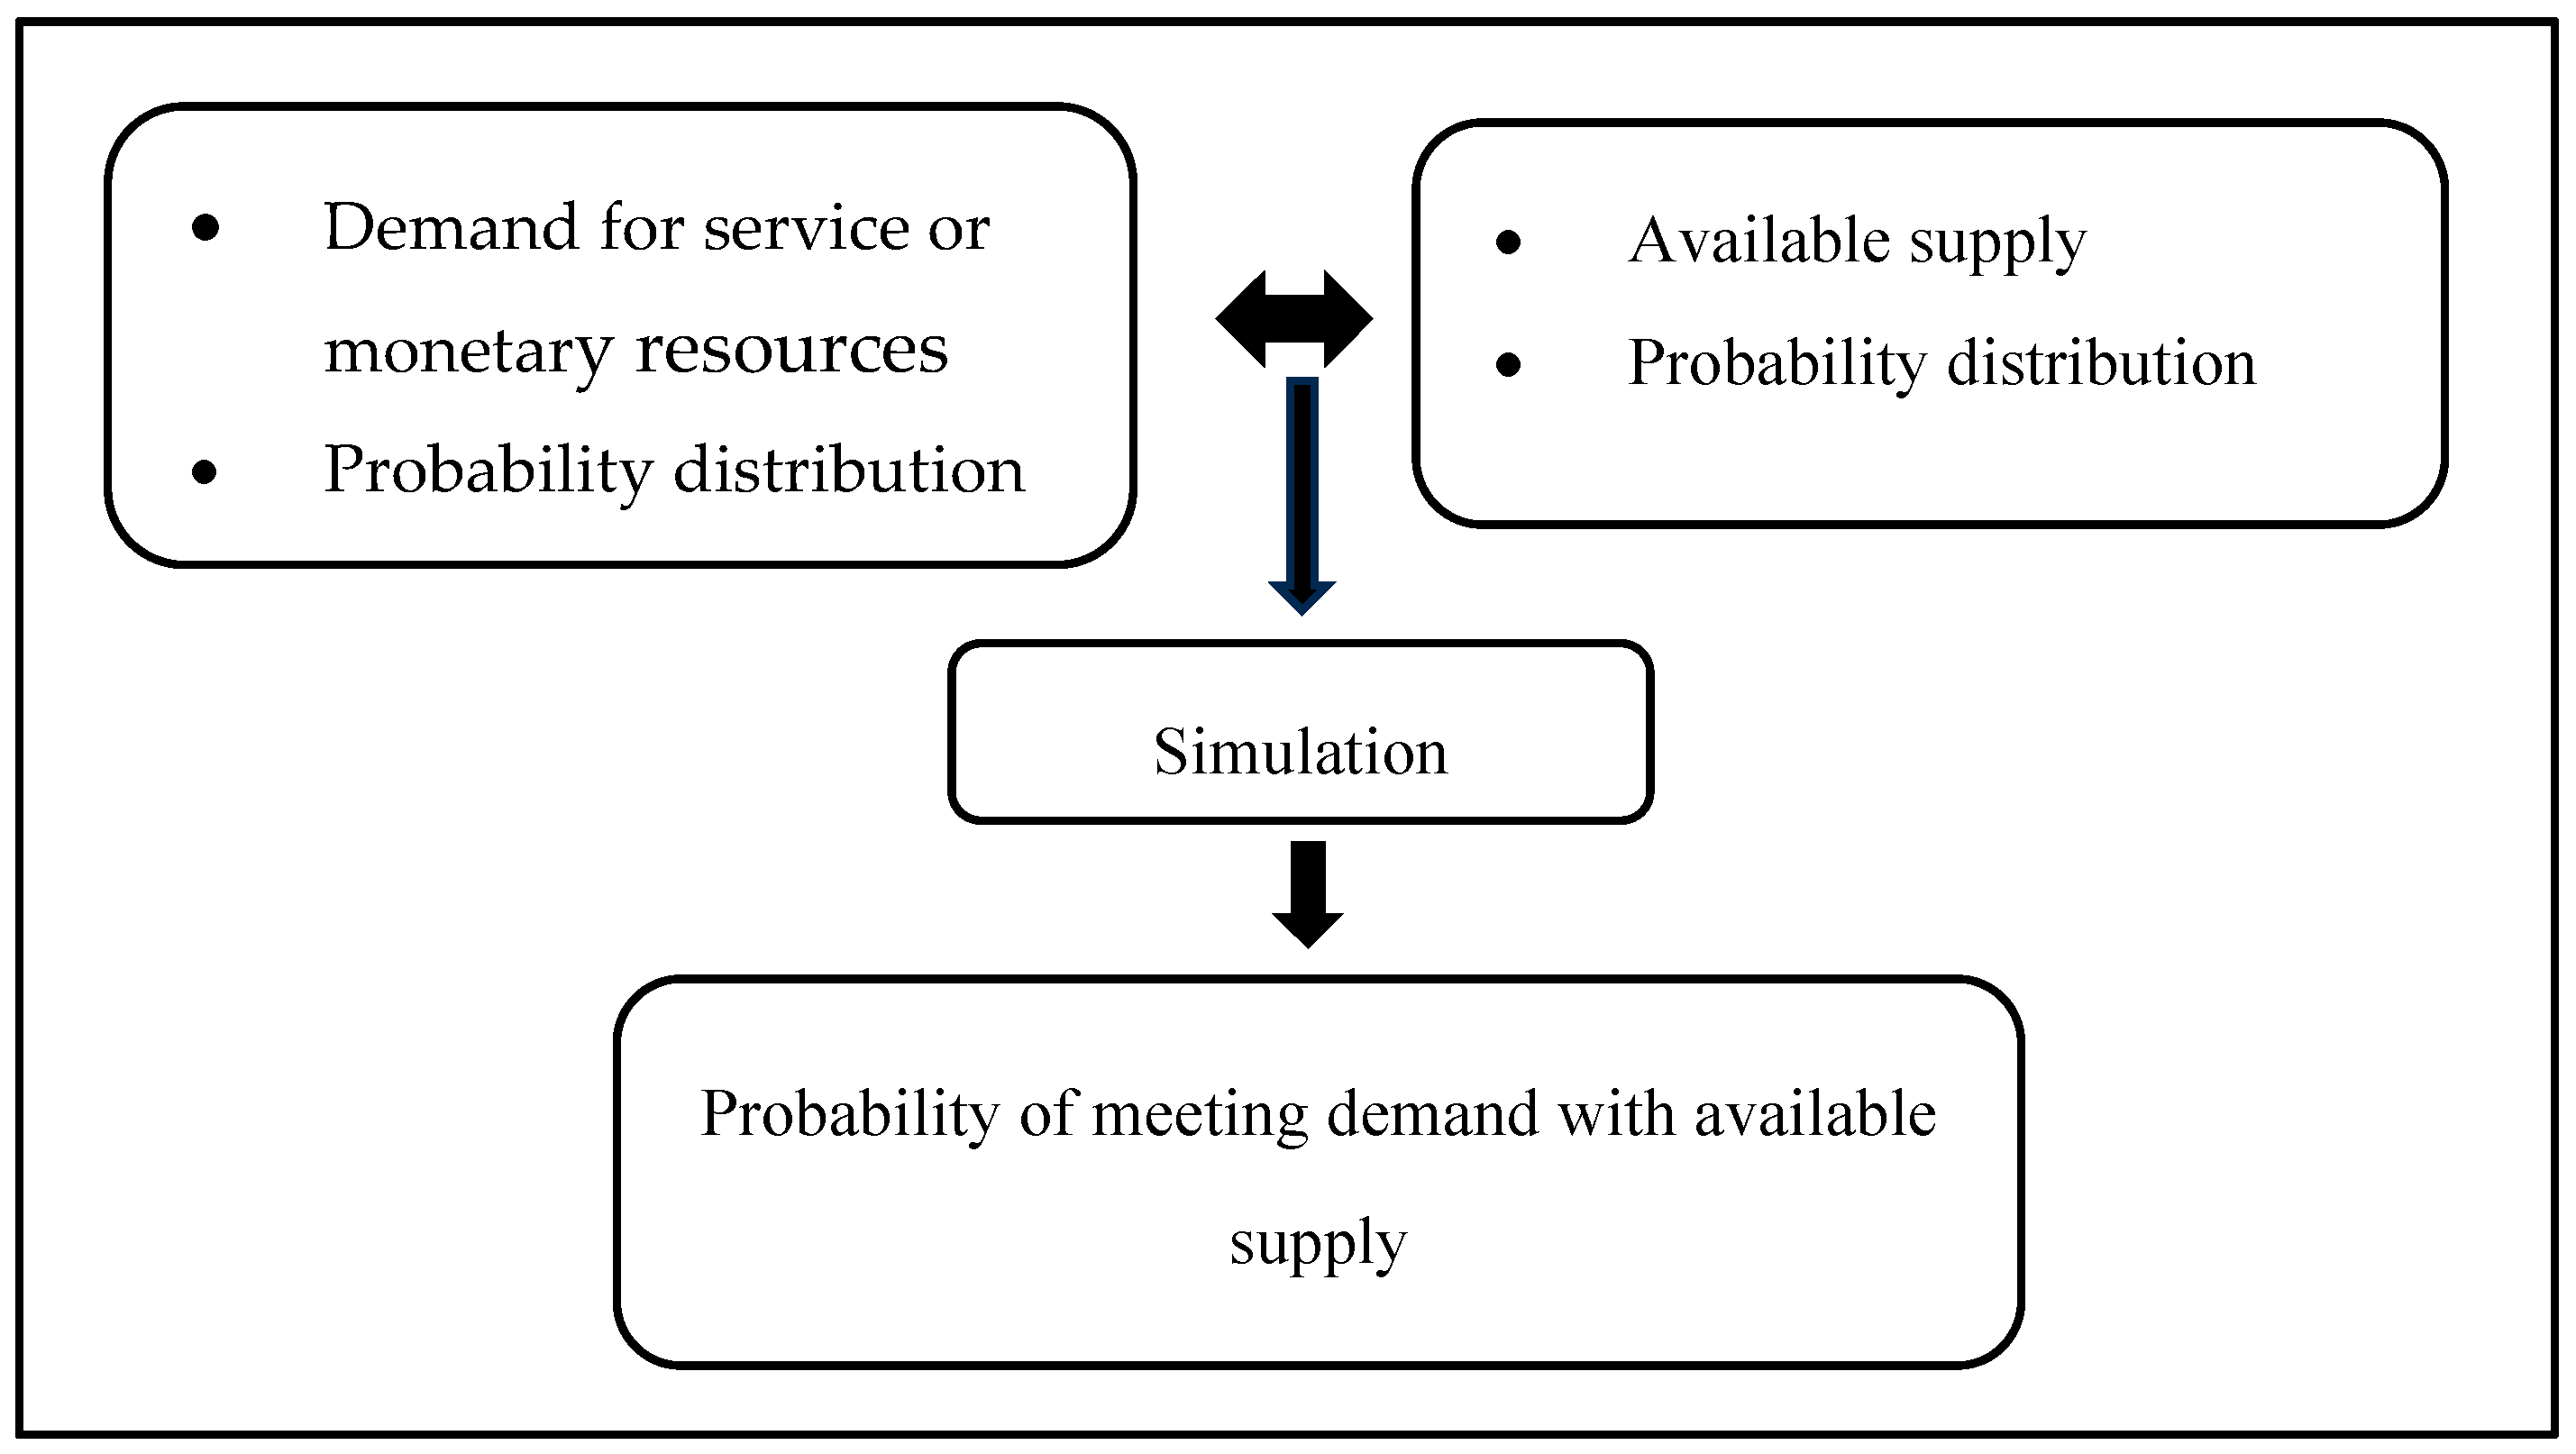
Figure 5.
First/last mile travel network.
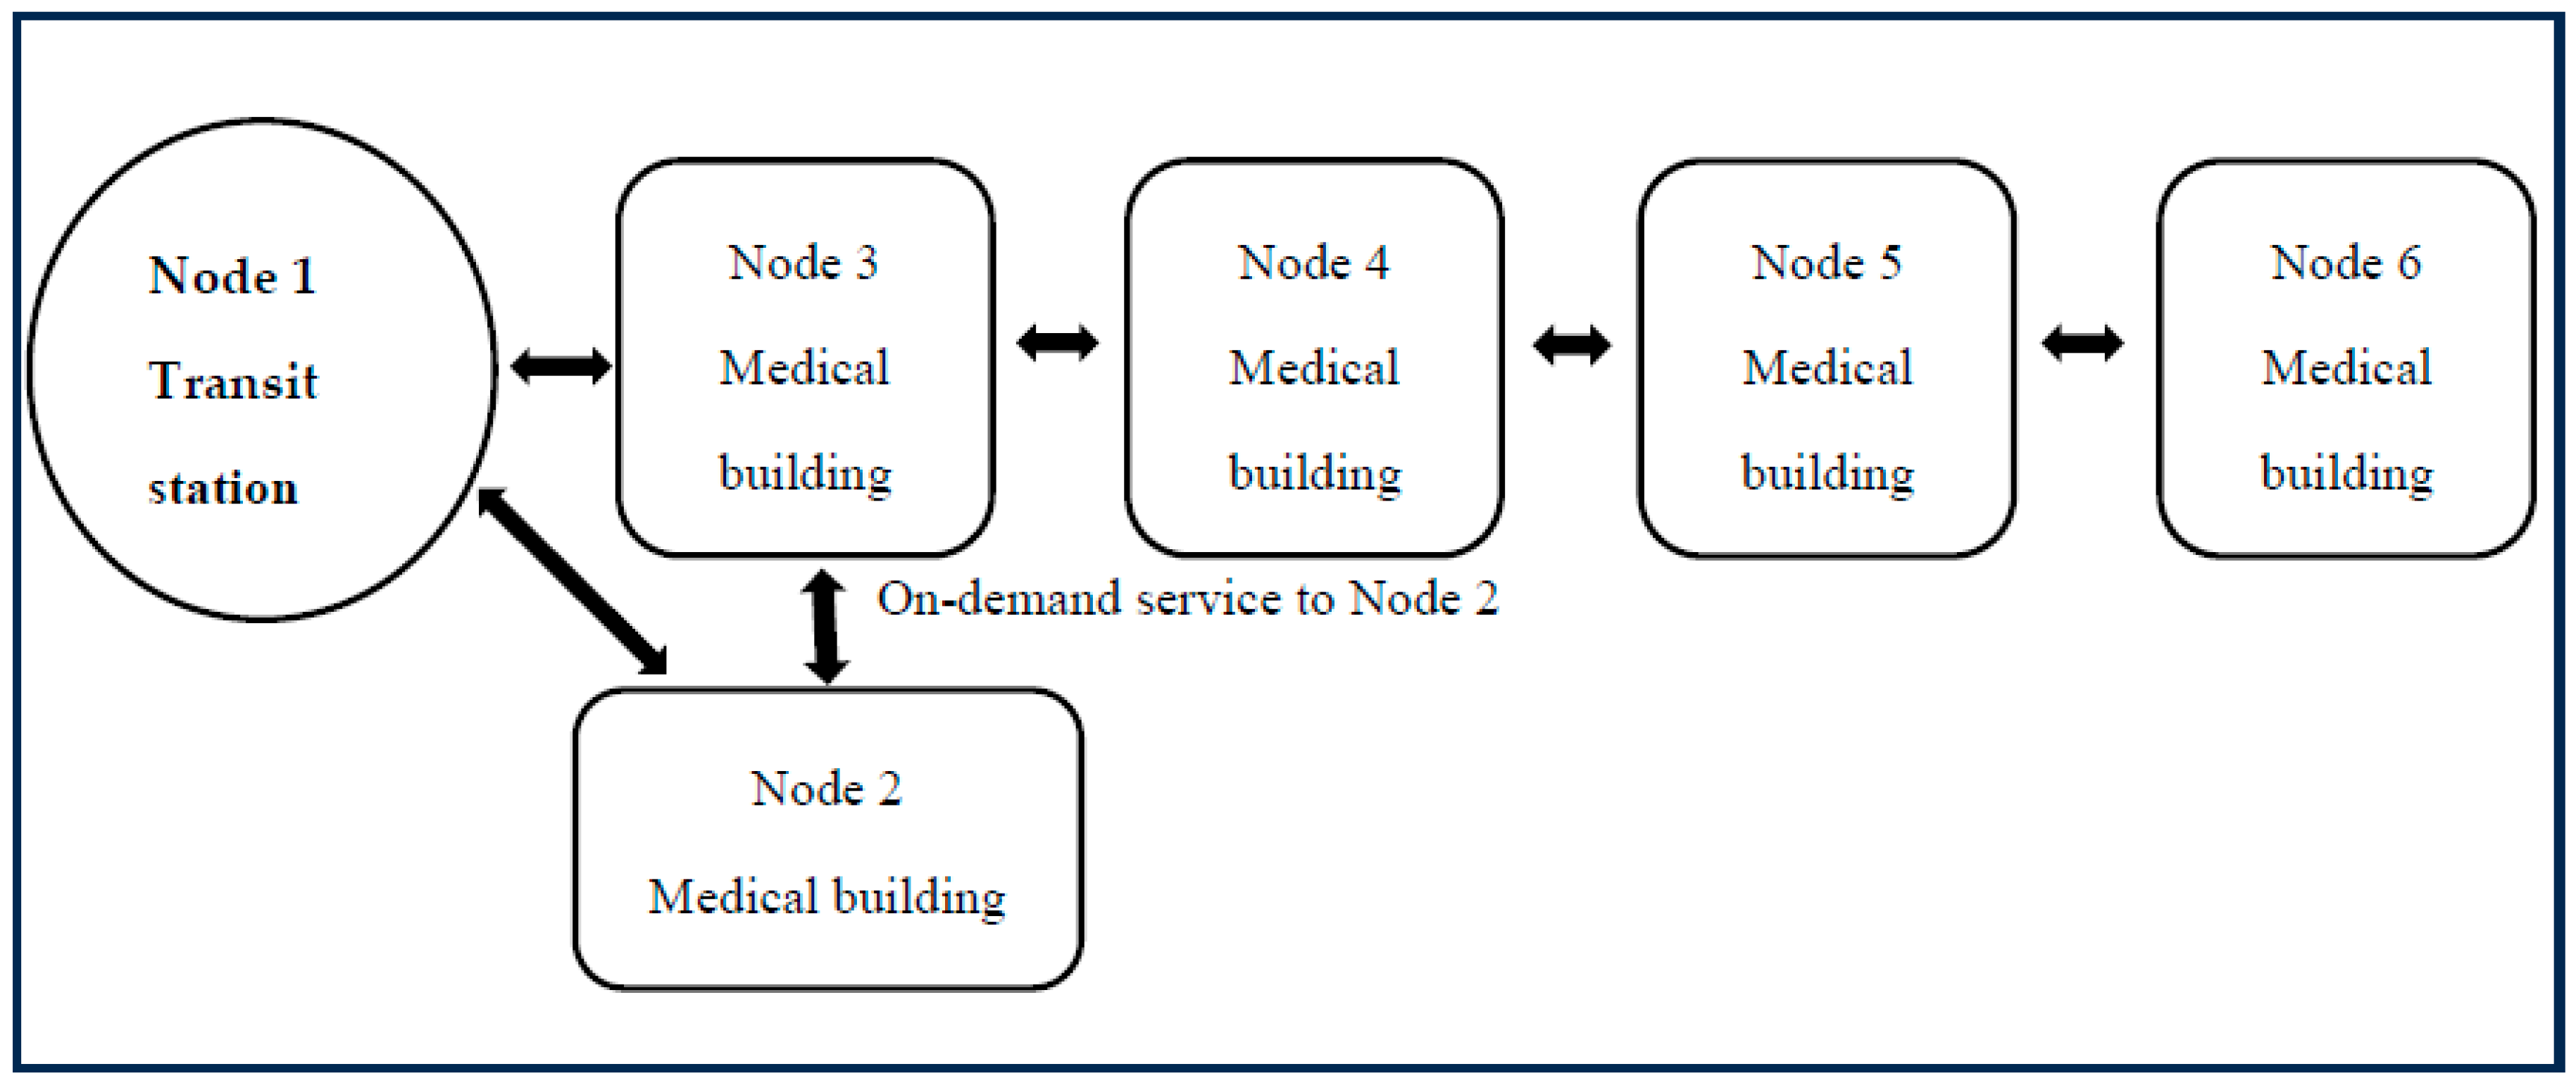
Figure 6.
Stochastic demand at public transit hub station Node 1 (based on uniform probability distribution function) (a=20, b=40).
Figure 6.
Stochastic demand at public transit hub station Node 1 (based on uniform probability distribution function) (a=20, b=40).

Figure 7.
Probability of seat availability (based on uniform probability distribution function a=0, b=15).
Figure 7.
Probability of seat availability (based on uniform probability distribution function a=0, b=15).
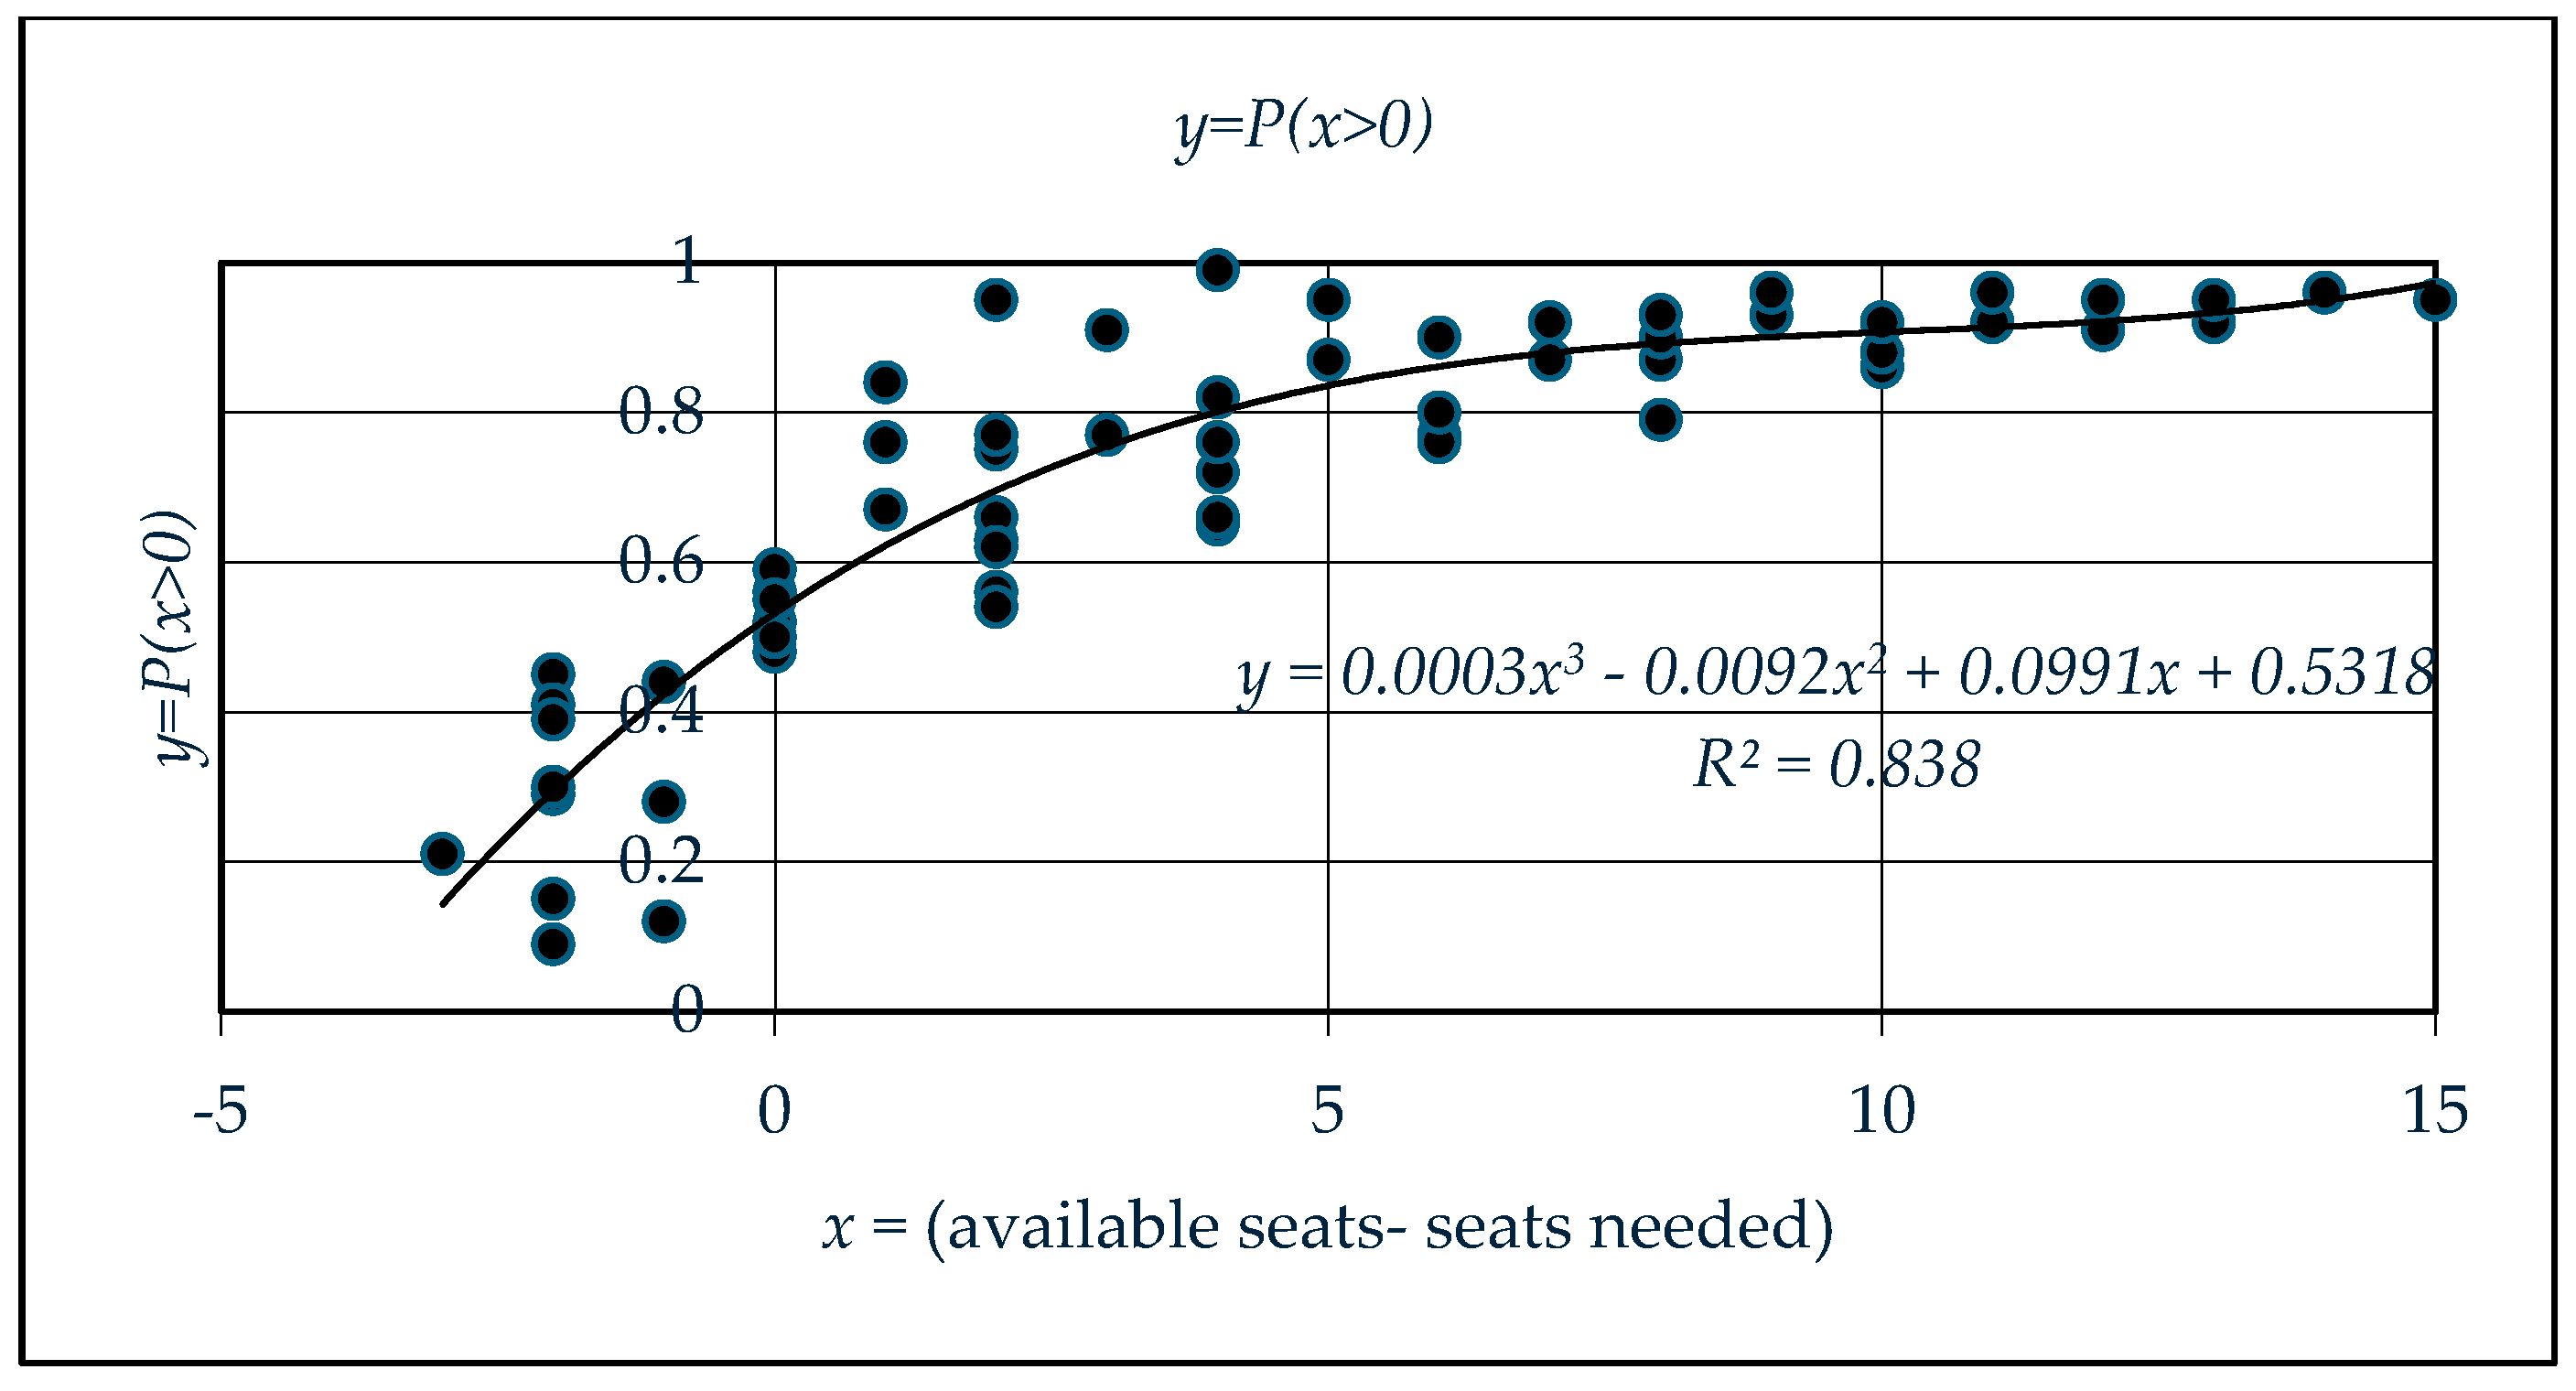
Figure 8.
Party size (based on uniform probability distribution) (a=1, b=4).
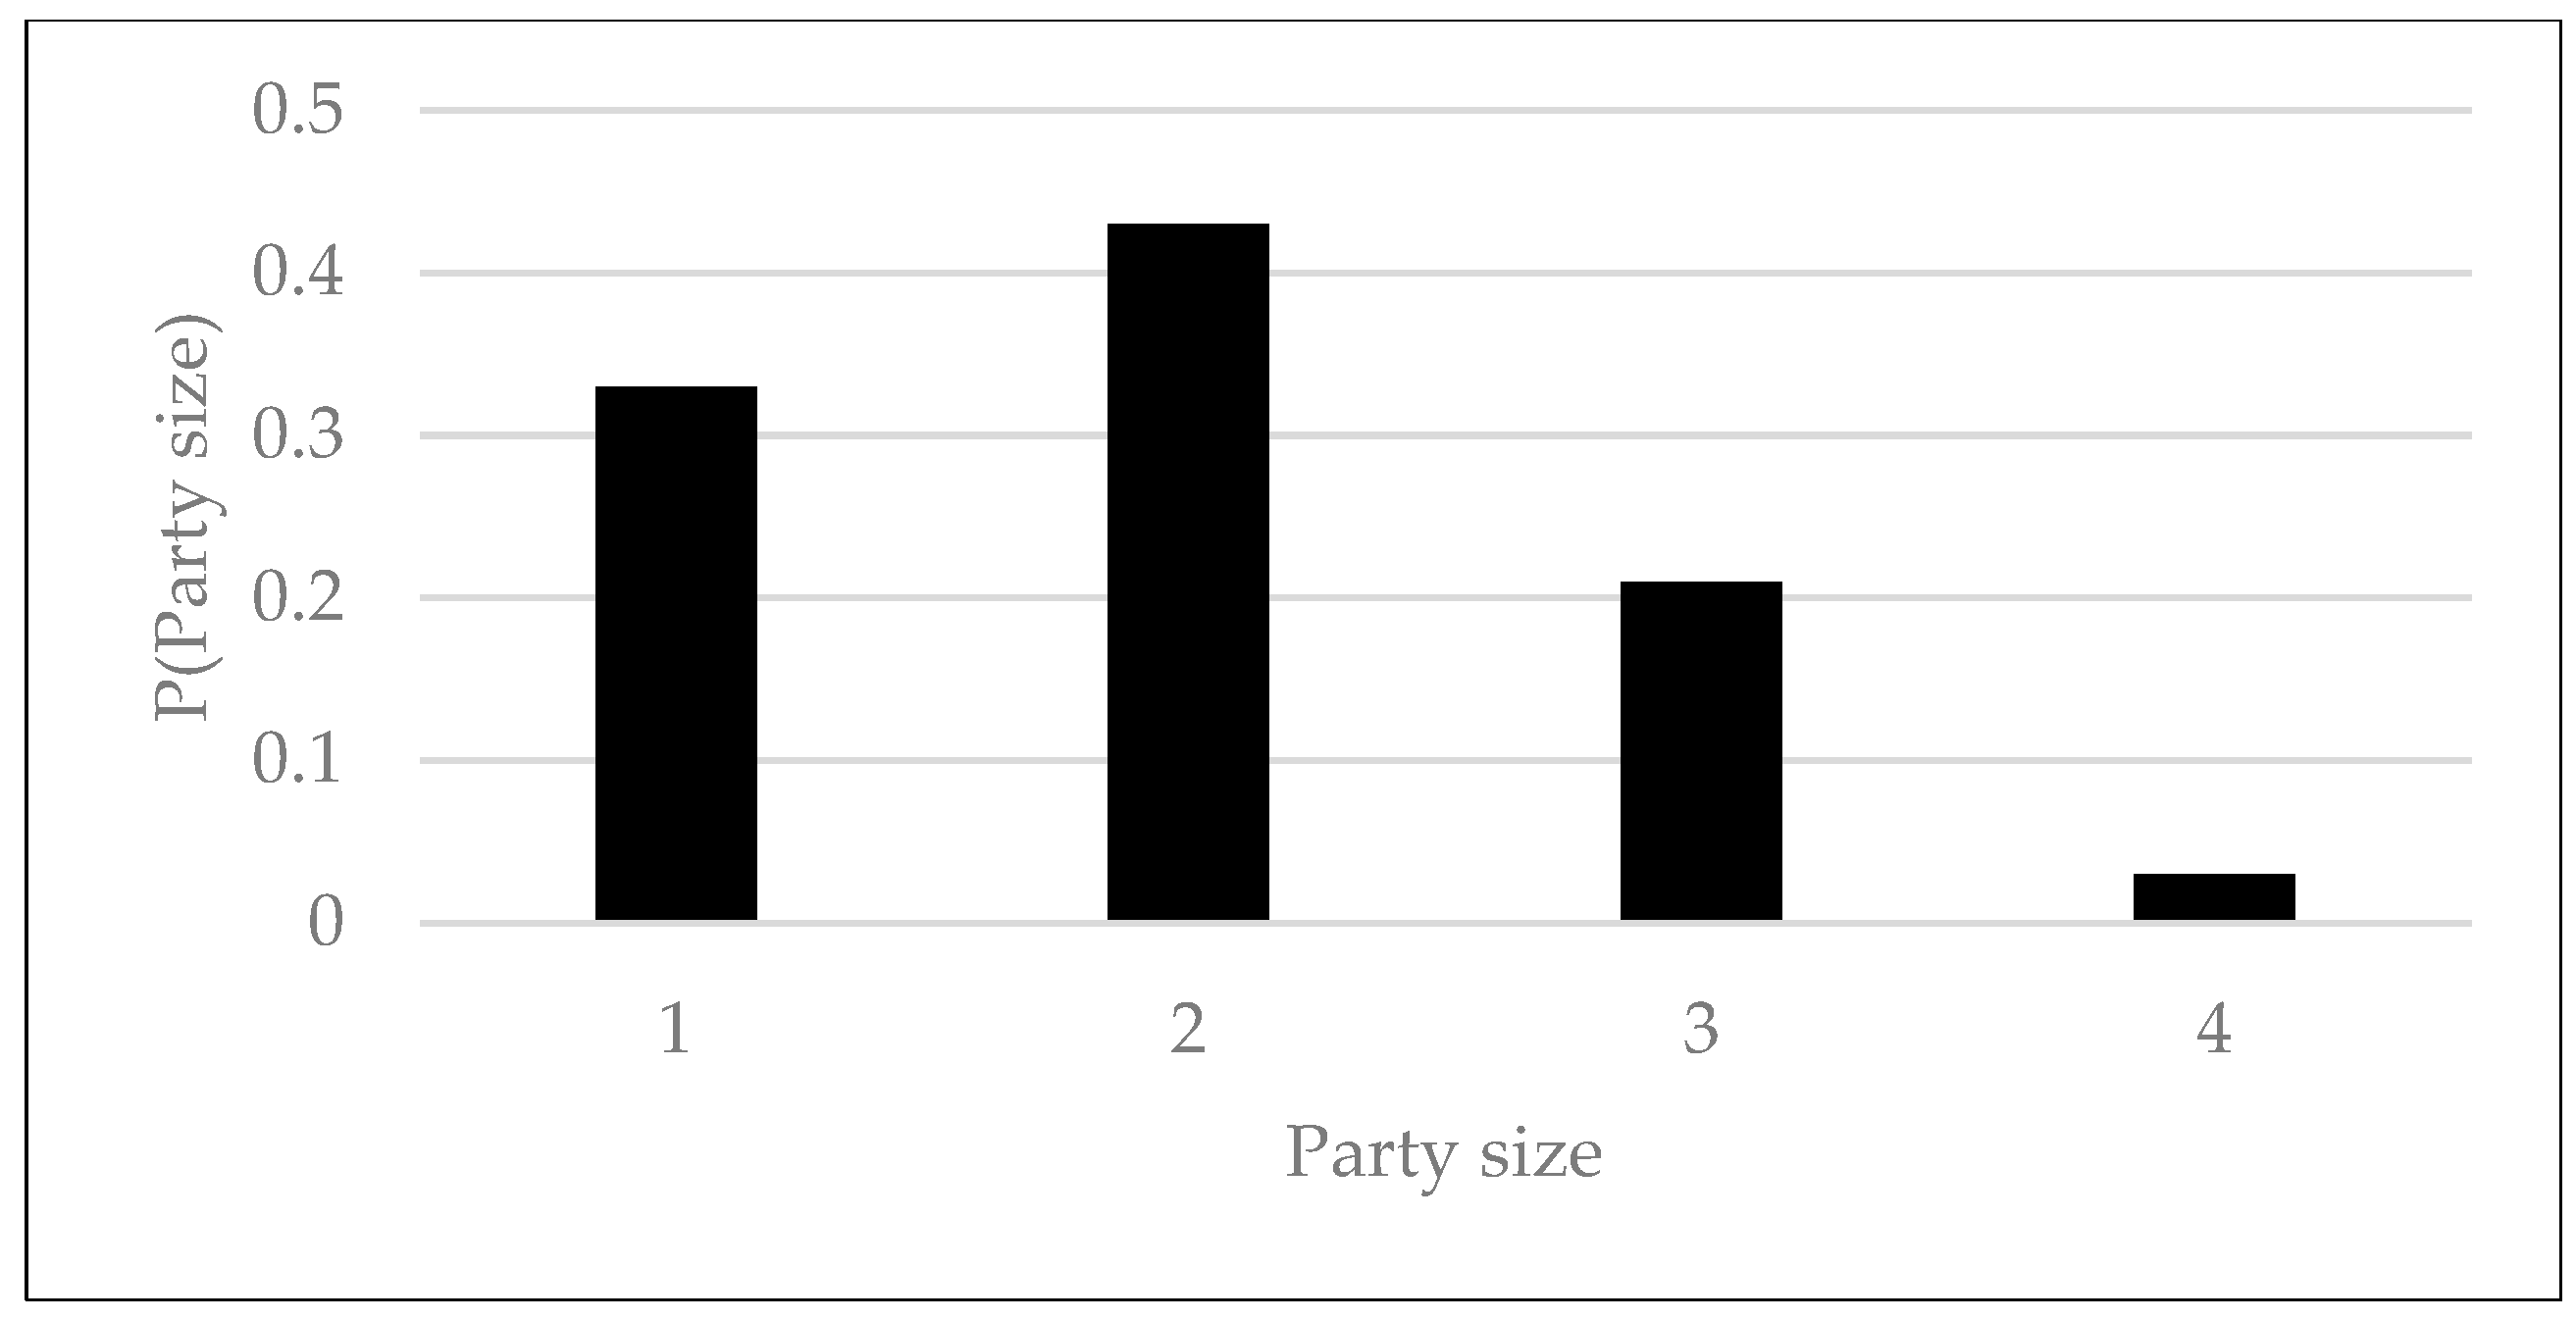
Figure 9.
Vehicle operation, maintenance, and management costs.

Figure 10.
System cost components.
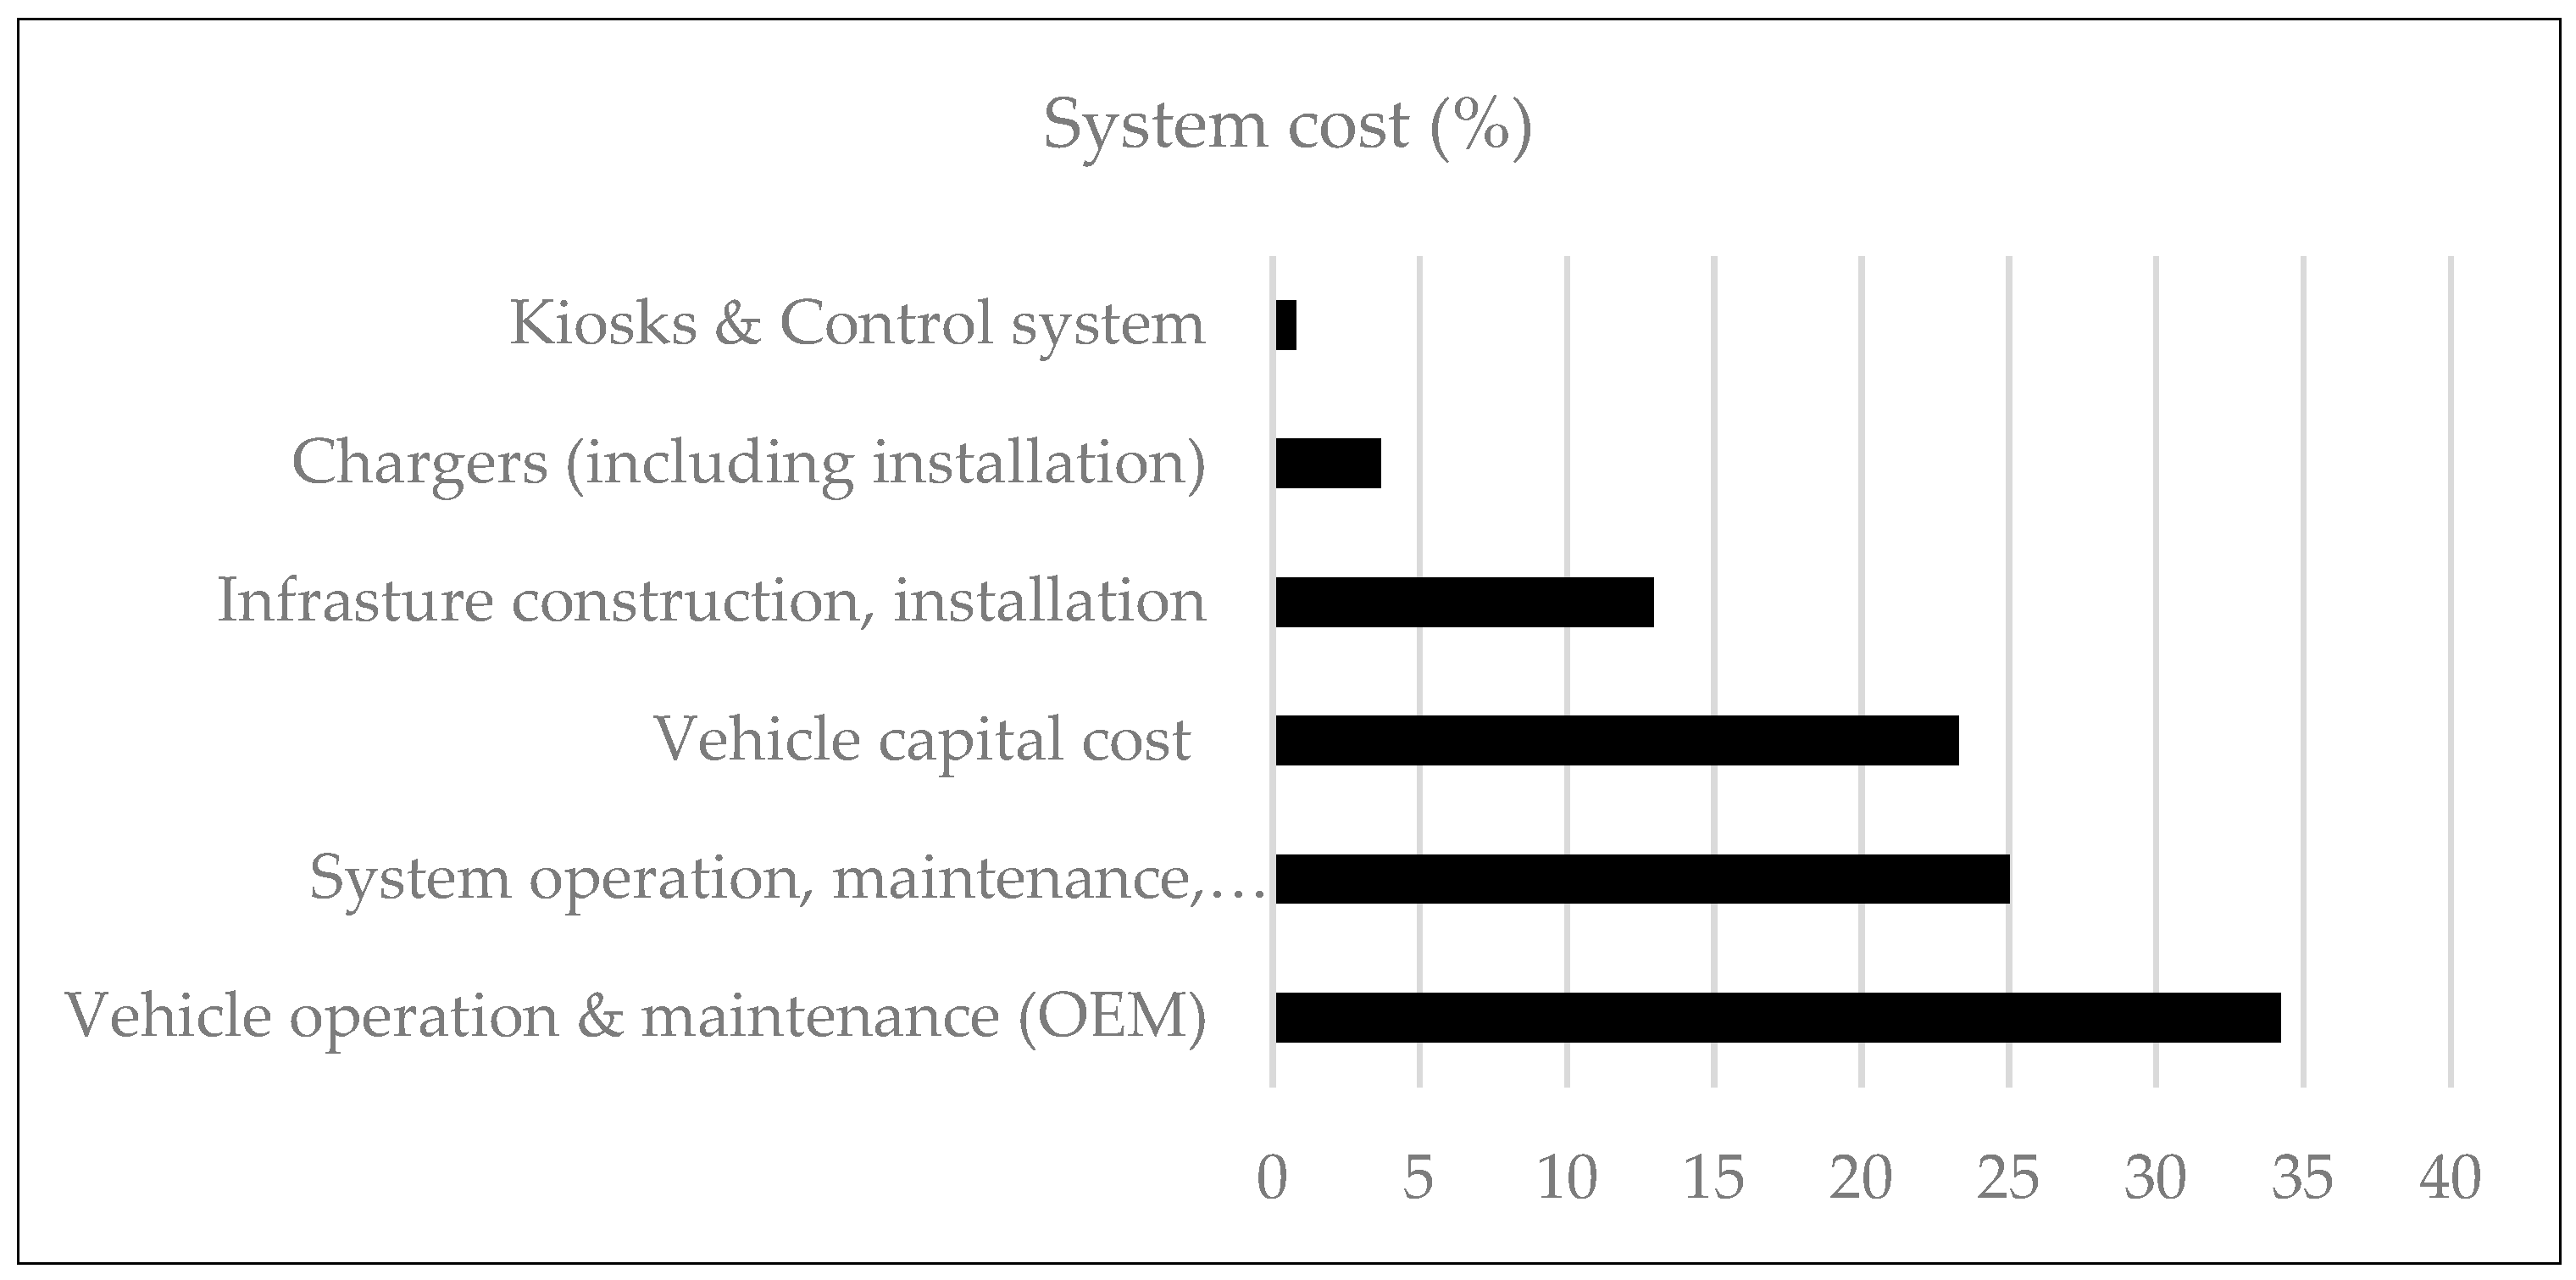
Figure 11.
Public sector service feasibility analysis.
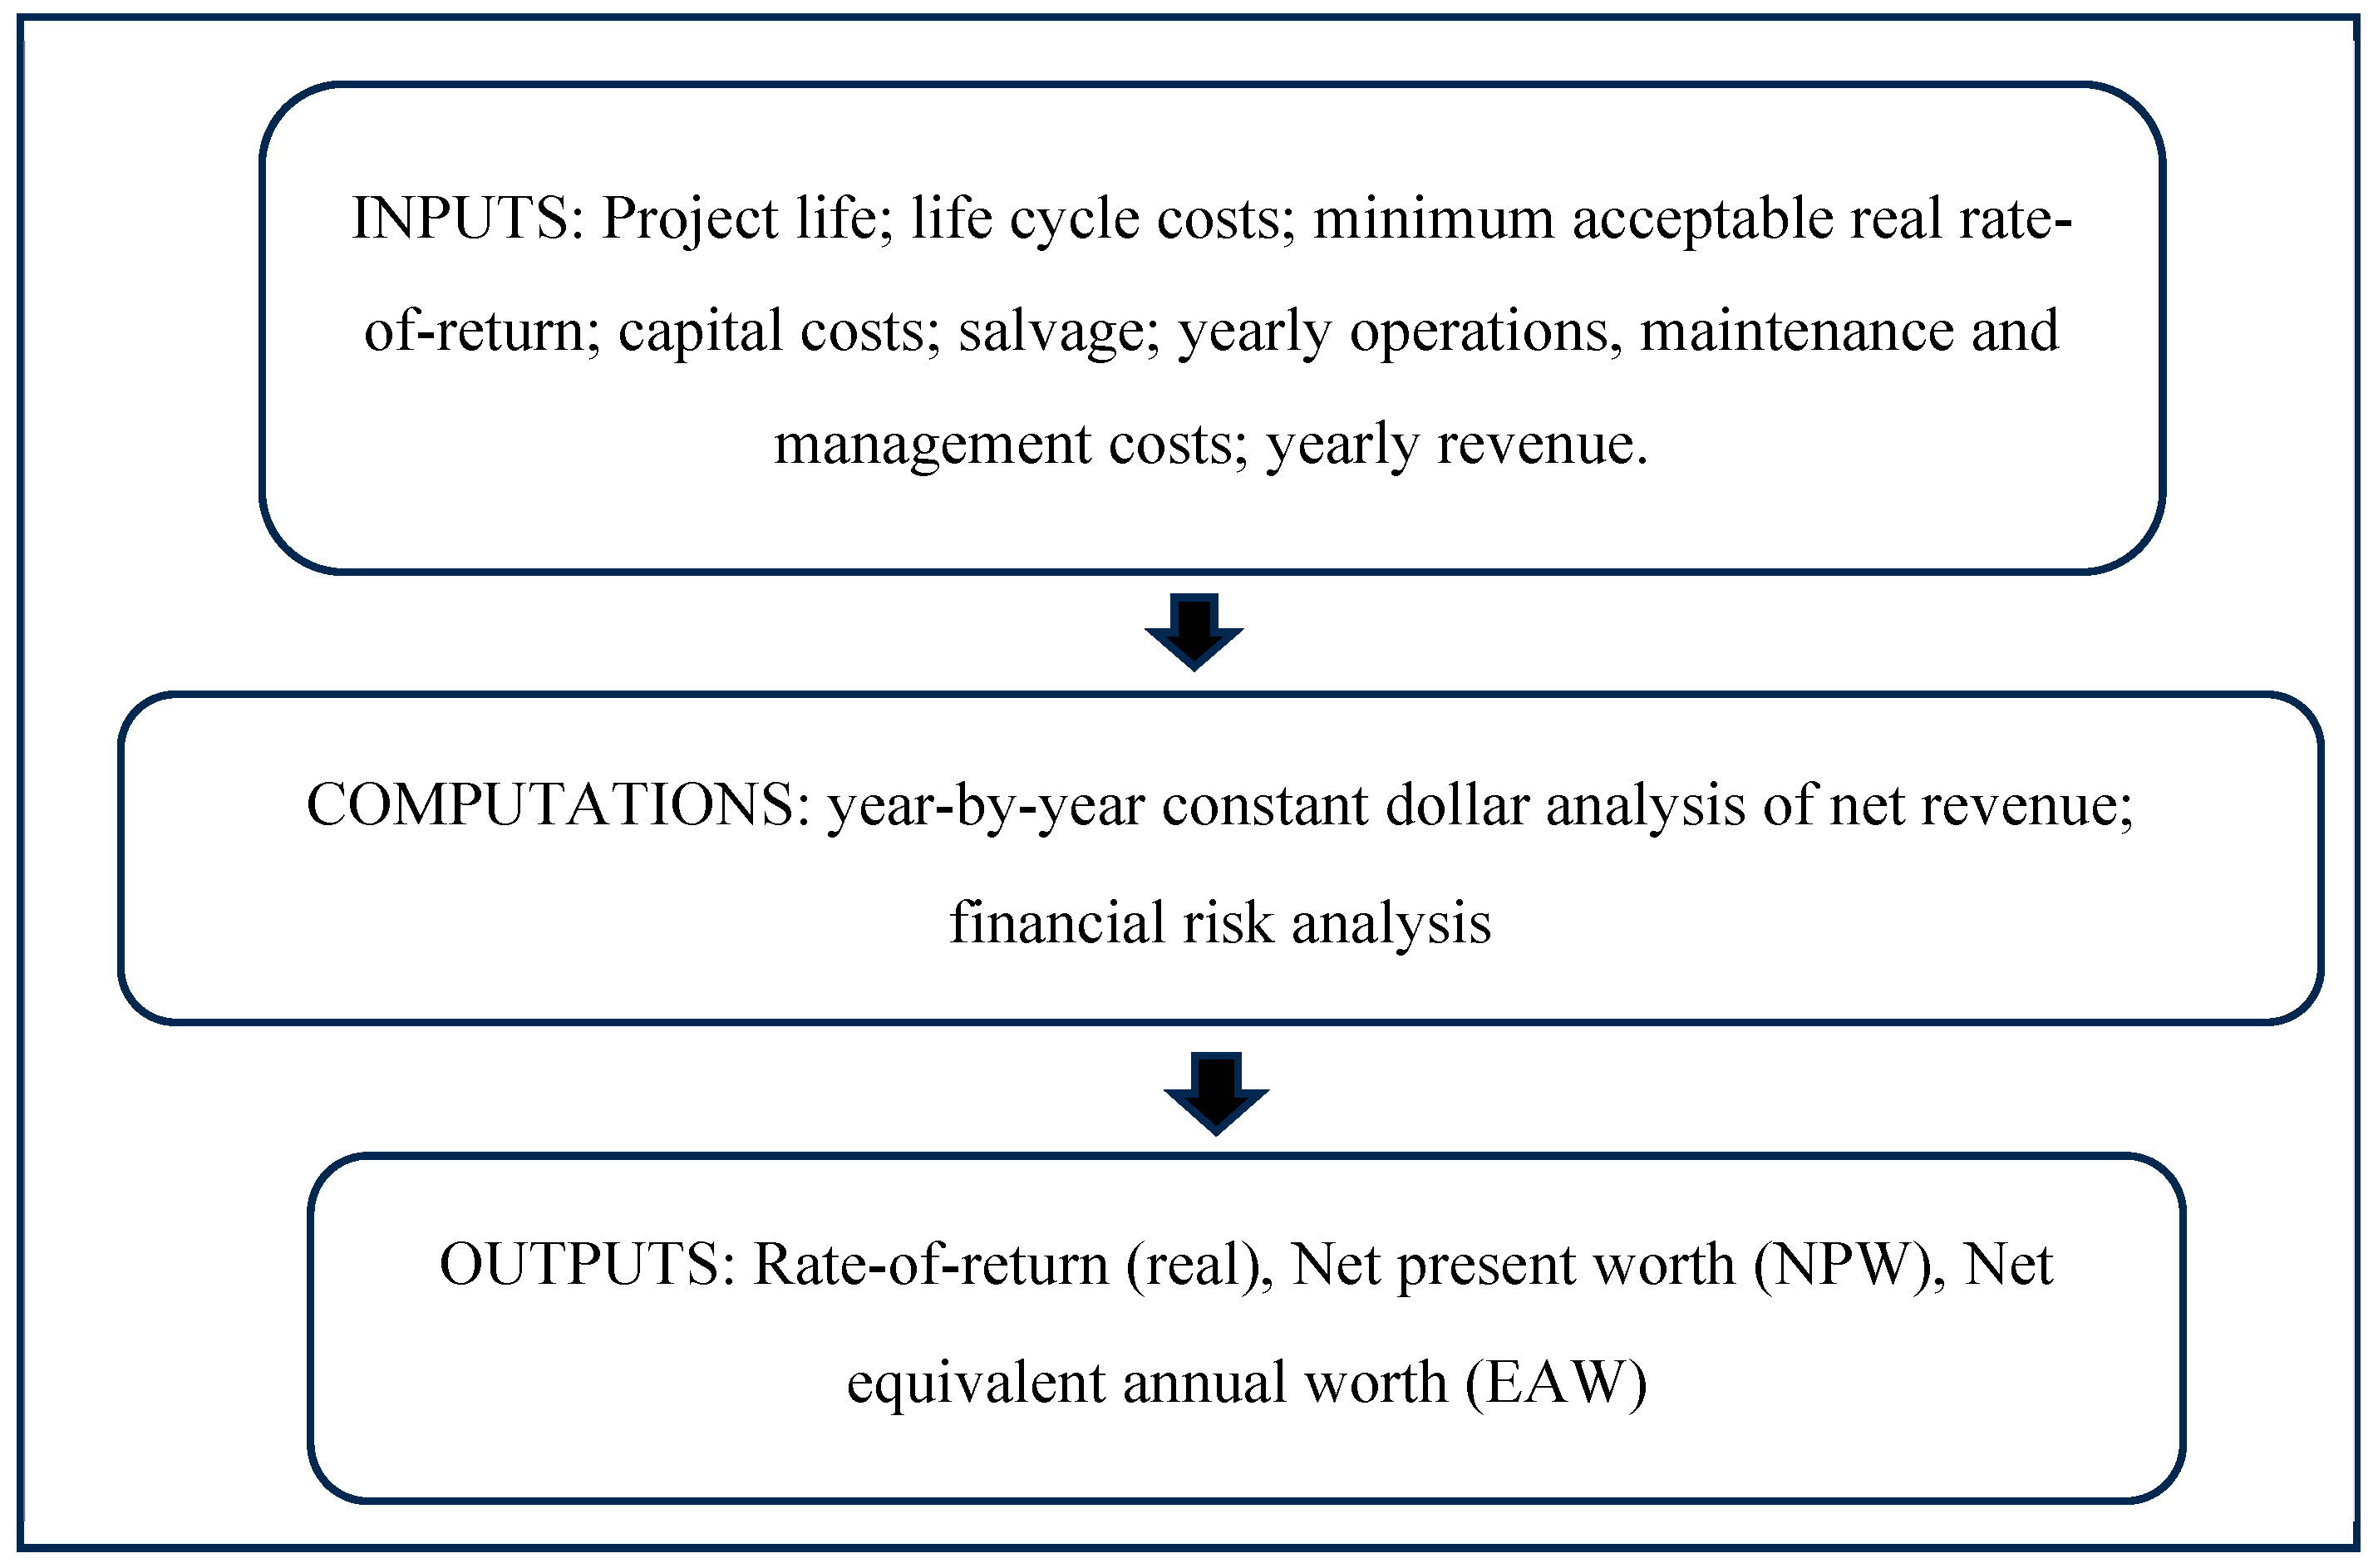
Figure 12.
Private sector investment analysis.
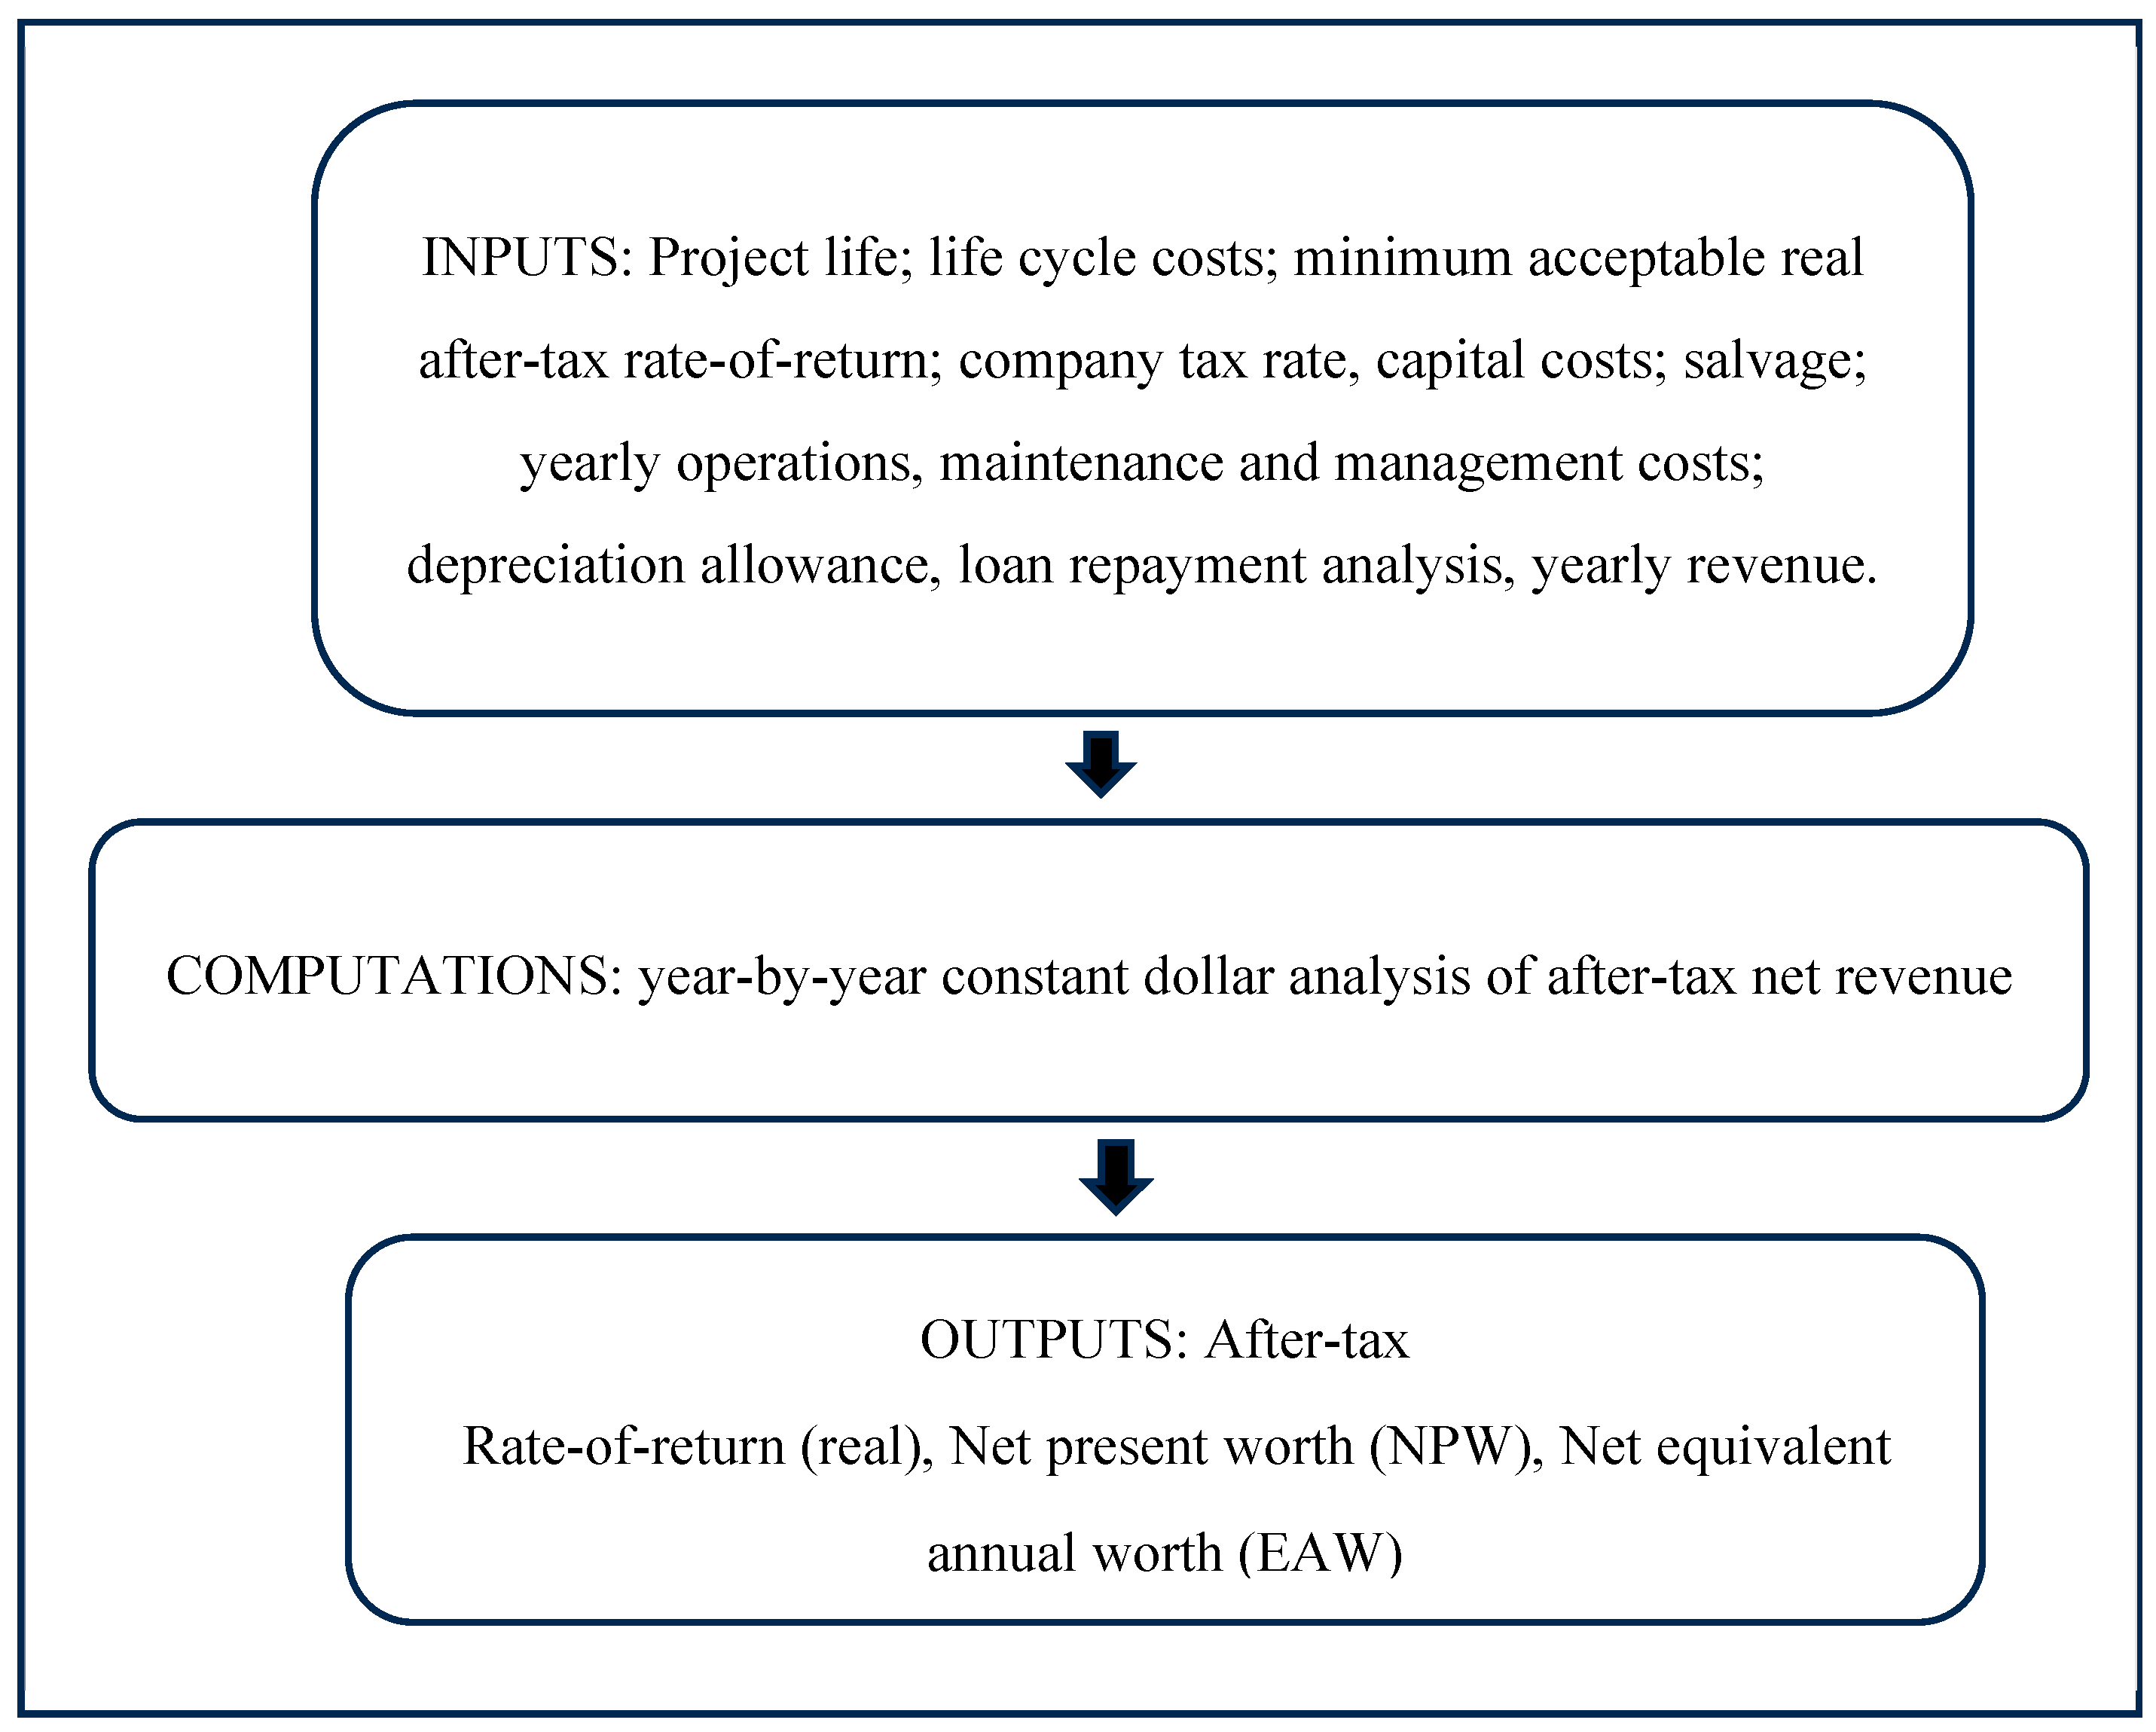

Table 1.
Role of microtransit service.
| Role of service | Description |
|---|---|
| First/last mile travel Service to community hubs and centers New service Replacing low-performing routes Off-peak and weekend service Overnight service Service for specific populations (i.e., seniors, essential workers, etc.) Augmenting paratransit/ non-emergency transport services Regional cross-jurisdictional service Overcoming barriers to service area expansion |
Provide riders with connections to existing fixed-route transit hubs New on-demand transport (ODT) service to community points of interest ODT service serving specific catchment areas where no transit system or service exists Replace a fixed-route service during specific times with ODT service for a specific catchment area Replace fixed route service during specific times with ODT service for a specific catchment area. Provides transit service throughout an urban area during overnight hours when demand is very low and scheduled fixed-route service does not operate New ODT service serving specific populations Providing service to eligible paratransit customers who do not have mobility aids or devices requiring a fully accessible vehicle New ODT service or replacing fixed route service connecting regional hubs across jurisdictions within a larger catchment area (Country or Regional scale). Utilizing ODT to enable the transit agency to expand the transit coverage area where a conventional fixed route service may require additional funding, vehicles, vehicle-kms and operator resources. |
Table 2.
Equivalent annual costs of microtransit service(2023 Canadian dollar).
| Cost item | Equivalent annual cost (2023 CAD) | Percent (%) |
|---|---|---|
| Vehicle O&M System O&M, management Vehicle capital cost Infrastructure construction, installation Chargers (including installation) Kiosks & Control system |
615,600 450,000 419,107 233,108 66,177 14,6341,798,626 |
34.23 25.02 23.3 12.96 3.68 0.81100 |
Table 3.
Public sector investment risk analysis (2023 CAD).
| Analysis case | Capital costs ($) |
Operation, maintenance, management costs ($)/year | Salvage ($) | Minimum revenue for P(NPW>0) ($)/year |
Fare($)/ passenger |
|---|---|---|---|---|---|
|
Public sectorBase case Risk Case 1 Triangular probability distribution Risk Case 2 Uniform probability distribution Risk Case 3 Risk case 4 Triangular probability distribution Risk Case 5 Uniform probability distribution Risk Case 6 |
6,016,921 Low 6,016,921 Mode 6,769,036 High 7,521,151 Low 6,016,921 High 7,521,151 7,521,151 Low 6,016,921 Mode 7,521,151 High 9,025,382 Low 6,016,921 High 9,025,382 9,025,382 |
1,065,600 Low 1,065,600 Mode 1,198,800 High 1,332,000 Low 1,065,600 High 1,332, 000 1,332, 000 Low 1,065,600 Mode 1,332,000 High 1,598,400 Low 1,065,600 High 1,598,400 1,598,400 |
458,561 Low 458,561 Mode 515,880 High 573,201 Low 458,561 High 573,201 573,201 Low 458,561 Mode 573,201 High 687,841 Low 458,561 High 687,841 687,841 |
1,820,145 2,117,800 2,174,000 2,260,452 2,500,000 2,561,000 2,712,542 |
2.05 2.40 2.47 2.57 2.85 2.92 3.10 |
Table 4.
Private sector investment analysis (2023 CAD).
| Analysis case | Capital cost ($) |
Operation, maintenance, management costs ($/year) | Salvage ($) | Revenue ($/year) |
Rate-of-return (ROR real) |
|---|---|---|---|---|---|
|
Public projectBase case (MARR 5% real) Private sector project(After tax MARR 5% real) No loan option Loan of $3M @ 7% (real) interest rate |
Initial 4,438,500 Beginning of year 6 2,014,500 Initial capital 4,438,500 Beginning of year 6 2,014,500 Initial capital 4,438,500 Beginning of year 6 2,014,500 |
1,065,600 1,065,600 1,065,600 |
End of yr 5 201,450 End of yr 10 2,014,500 End of yr 5 201,450 End of yr 10 2,014,500 End of yr 5 201,450 End of yr 10 2,014,500 |
1,820,145 1,820,145 1,820,145 |
5.8% 6.0% 9.3% |
NOTE: Fare/per passenger $2.05 (CAD 2023).
Disclaimer/Publisher’s Note: The statements, opinions and data contained in all publications are solely those of the individual author(s) and contributor(s) and not of MDPI and/or the editor(s). MDPI and/or the editor(s) disclaim responsibility for any injury to people or property resulting from any ideas, methods, instructions or products referred to in the content. |
© 2024 by the authors. Licensee MDPI, Basel, Switzerland. This article is an open access article distributed under the terms and conditions of the Creative Commons Attribution (CC BY) license (http://creativecommons.org/licenses/by/4.0/).
Copyright: This open access article is published under a Creative Commons CC BY 4.0 license, which permit the free download, distribution, and reuse, provided that the author and preprint are cited in any reuse.


