
Submitted:
20 November 2024
Posted:
20 November 2024
You are already at the latest version
Abstract
Hyperspectral technology has become increasingly important in monitoring soil heavy metal pollution, yet hyperspectral data often contain substantial band redundancy, and band selection methods are typically limited to single algorithms or simple combinations. Multi-algorithm combinations for band selection remain underutilized. To address this gap, this study, conducted in Gejiu, Yunnan Province, China, proposes a multi-algorithm band selection method to enable rapid prediction of lead (Pb) contamination levels in soil. To construct a preliminary Pb content prediction model, initial selection of spectral bands utilized methods including CARS (Competitive Adaptive Reweighted Sampling), GA (Genetic Algorithm), MI (Mutual Information), SPA (Successive Projections Algorithm), and WOA (Whale Optimization Algorithm). Results indicated that WOA achieved the highest modeling accuracy. Building on this, a combined WOA-based band selection method was developed, including combinations such as WOA-CARS, WOA-GA, WOA-MI, and WOA-SPA, with multi-level band optimization further refined by MI (e.g., WOA-GA-MI, WOA-CARS-MI, WOA-SPA-MI). Results showed that the WOA-GA-MI model exhibited optimal performance, achieving an average R² of 0.75, with improvements of 0.32, 0.11, and 0.02 over the full-spectrum model, the WOA-selected spectral model, and the WOA-GA model, respectively. Additionally, spectral response analysis identified 22 common bands essential for Pb content inversion. The proposed multi-level combined model not only significantly enhances prediction accuracy but also provides new insights into optimizing hyperspectral band selection, serving as a valuable scientific foundation for assessing soil heavy metal contamination.
Keywords:
Hyperspectral Remote Sensing
; Band Selection
; WOA
; GA
; CARS
; SPA
; MI
1. Introduction
Mining activities can significantly impact the ecological environment, often resulting in elevated levels of heavy metals like Pb, Cd, and Hg within the soil [1, 2]. These heavy metals have the potential to transfer through the food chain and be absorbed by humans, leading to possible health concerns [3, 4]. Pb contamination, in particular, is a key target for monitoring due to its high toxicity and tendency to bioaccumulate. Effective management of this type of pollution requires extensive, dynamic, and large-scale monitoring [5]. Conventional methods for detecting heavy metals in soil primarily rely on laboratory chemical analyses, such as AAS and ICP-OES [6]. Although accurate, these methods demand extensive soil sampling, involve complex pre-processing, and incur significant time and expense [7]. Moreover, they are insufficient for large-scale and high-frequency soil monitoring. This has led to a growing emphasis on developing rapid, non-invasive, cost-effective, and reliable methods for large-scale monitoring of soil heavy metal contamination [8]. Amidst this, hyperspectral remote sensing technology has become an essential approach for assessing heavy metal contamination in soils [9,10]. Hyperspectral sensing offers high spectral resolution, capturing detailed reflectance information across multiple wavelengths. This spectral data can be employed to assess and forecast heavy metal levels in the soil [11,12]. However, hyperspectral data often include hundreds to thousands of bands, many of which are redundant or weakly correlated with soil heavy metals [13,14]. Therefore, identifying relevant bands that correlate strongly with heavy metal content is essential for constructing efficient predictive models [15,16,17].
Currently, various algorithms have been developed for hyperspectral band selection and feature extraction, and these are generally classified into three main types: statistical-based algorithms, evolutionary algorithms, and heuristic optimization algorithms [18]. Statistical-based methods, like CARS, MI, and SPA, determine effective bands by analyzing inter-band correlations [19]. The CARS algorithm uses the weight information from Partial Least Squares (PLS) models to select bands, making it effective for reducing redundancy and isolating key feature bands [20]. MI calculates entropy between bands to assess correlation, emphasizing interdependencies [21], while SPA prioritizes the most representative bands to address multicollinearity [22,23]. In the domain of evolutionary algorithms, GA conducts global search optimization by simulating biological evolution, demonstrating robust search capabilities in complex spaces [12]. In heuristic optimization, WOA, which mimics whale foraging behavior, allows for rapid convergence in complex, high-dimensional spaces, efficiently locating global optima [24]. While each of these algorithms has unique advantages and has shown success in predicting soil heavy metal content, challenges remain in current research approaches. Firstly, most studies focus on single-algorithm band selection methods and their relationships with specific heavy metal elements [25,26]. Single algorithms can be sensitive to noise and data complexity in band selection, which can lead to redundant band inclusion. Additionally, because optimization objectives and strategies differ across algorithms, single algorithms often fall short of meeting the dual needs of both global optimization and effective feature extraction. Secondly, although a few studies explore multiple band selection algorithms, combining two algorithms is more common [27,28]. The use of three algorithms to achieve comprehensive feature extraction remains rare, particularly with a combination that integrates statistical-based, evolutionary, and heuristic algorithms to exploit their unique strengths in band selection. Finally, while there has been substantial analysis of spectral response mechanisms in band extraction [29,30,31], most of this research has centered on single-algorithm applications. There remains a notable gap in in-depth studies focused on joint band extraction across multiple algorithms.
To address the aforementioned issues, we propose a combined optimization method that integrates WOA with other band selection algorithms (CARS, GA, MI, and SPA), following the initial band selection. A multi-level feature band selection model was developed, incorporating MI for refined extraction to further optimize band combinations. Additionally, we conducted a spectral response analysis within the combined algorithm to assess the influence of specific bands on soil Pb content prediction. To evaluate the model’s effectiveness, the optimized bands were applied to predict soil Pb content in Gejiu, Yunnan, China. This study presents new perspectives and valuable references for effective band selection in hyperspectral data and for improving soil heavy metal prediction methodologies.
2. Materials and Methods
2.1. Study Area
This research is conducted in Gejiu City, situated in Yunnan Province, China. The city spans the geographic coordinates from 102°54′E to 103°25′E and from 23°01′N to 23°36′N. The region features a complex terrain characterized by low mountains and hills, along with valleys and plains. Due to its geological structure and mineralization processes, Gejiu is rich in mineral resources, particularly renowned for its tin deposits. Historically, the city has been an important mining area because of its abundant mineral wealth, evolving into a significant non-ferrous metal production base in China during the 20th century [32]. However, ongoing mining activities have introduced heavy metal contamination into the soil, with Pb levels being especially worrisome.
2.2. Data Collection and Content Determination
A total of 68 soil samples were gathered between March 9 and April 6, 2024, from the surface layer at a 0-20 cm depth, with their spatial distribution shown in Figure 1. In the laboratory, collected soil samples were air-dried, with plant residues, gravel, and other impurities carefully removed. The samples were then ground and passed through a 100-mesh sieve. Each was split into two portions: one designated for Pb concentration analysis, and the other reserved for spectral data acquisition. Pb levels were measured using Inductively Coupled Plasma Mass Spectrometry, with summary statistics shown in Table 1. Table 1 indicates that Pb content ranged from a minimum of 34.6 mg/kg to a peak of 9270 mg/kg, showing substantial variation. A coefficient of variation (CV) of 1.65 suggests considerable data dispersion. The skewness was 2.06, indicating a right-skewed distribution, where most samples had relatively low Pb content, but a few samples exhibited much higher concentrations, resulting in outliers. The kurtosis is 3, indicating that the distribution is slightly peaked compared to a normal distribution, which suggests a certain level of concentration. These statistical parameters highlight the considerable spatial variability of Pb content in the soil of this region. To achieve a distribution closer to normal during the inversion process, we applied a logarithmic transformation to the Pb content data.
2.3. Spectral Measurement and Processing
Spectral data were acquired using an ASD FieldSpec spectrometer, which operates within a wavelength range of 350 to 2500 nm and has a spectral resolution of 1 nm. Each sample underwent five measurements, and the average of these readings was used to obtain the final spectral reflectance, ensuring the accuracy and consistency of the results. To reduce noise and minimize unnecessary interference, spectral bands from 350 to 399 nm were excluded, retaining only the 400 to 2500 nm range for further analysis.
Several preprocessing techniques were applied to the raw spectral data, including first derivative (FD), second derivative (SD), standard normal variate (SNV), multiplicative scatter correction (MSC), and logarithmic transformation (log). The Pearson correlation coefficient was calculated to assess which spectral transformation method showed the strongest relationship with the Pb content in the soil. Figure 2 presents the correlation between different spectral preprocessing methods and Pb content. Among these methods, the raw spectral reflectance(R) showed a strong negative relationship with Pb content over several bands, demonstrating less variability and more consistency than the other preprocessing techniques. Consequently, this study selected R as the input data for the model.
2.4. Band Selection and Modeling Methods
2.4.1. Overview of the Research Process
The workflow of this study consists of the following steps: (1) Data Collection: Soil samples were gathered, with spectral information and Pb concentration measured for each sample. (2) Initial Band Selection and Modeling: Five methods—CARS, GA, MI, SPA, and WOA—were employed for band selection. PLS modeling was applied to each selected band to evaluate model accuracy, thereby identifying the most effective band selection method. (3) Secondary Band Combination and Modeling: Based on the preliminary results, the WOA band selection method, which demonstrated the highest accuracy, was utilized to create band combinations including WOA-CARS, WOA-GA, WOA-MI, and WOA-SPA. PLS modeling was subsequently applied to evaluate the accuracy of these combinations. (4) Final Band Combination and Modeling: Building on the secondary combinations, the MI method was further employed to extract bands, resulting in combinations such as WOA-CARS-MI, WOA-GA-MI, and WOA-SPA-MI. These combinations were subjected to PLS inversion and accuracy evaluation to obtain the optimal Pb content estimation results. (5) Common Band Extraction and Spectral Response Analysis: Common bands among the various combinations were extracted, and spectral response analysis was conducted to gain deeper insights into their inversion performance.
2.4.2. Initial Band Selection
(1) CARS
CARS simulates the "survival of the fittest" mechanism found in nature by incrementally removing bands that contribute little to the model [33]. This process effectively reduces feature redundancy and enhances model accuracy [34]. In this study, the main CARS parameters were configured with 50 sampling iterations, an alpha value of 0.95, and an epsilon of 0.01. The alpha value controls the proportion of features retained, while epsilon determines the convergence criterion.
(2) GA
GA is an optimization algorithm inspired by natural selection, designed to improve feature selection through iterative refinement [35]. It optimizes band combinations using selection, crossover, and mutation operations [36]. In this study, the configuration parameters included 50 iterations, a population size of 20, and a mutation probability of 0.1.
(3) MI
MI quantifies the relationship between random variables [37]. In the context of feature selection, MI quantifies the nonlinear correlation between each band and Pb. This study employed MI to calculate the mutual information values between each band and Pb content, allowing for the selection of bands with the highest information richness to improve the model's predictive accuracy. An adaptive threshold mechanism was utilized to determine the optimal number of bands, thus avoiding overfitting.
(4) SPA
SPA is a feature dimensionality reduction algorithm based on sequential forward selection [38]. It selects bands that maximize the reduction of collinearity, ensuring minimal redundancy among the selected features [39]. In this study, the SPA algorithm filtered the most representative bands from the initial set, one by one, until no further improvement was observed. This approach simplifies the data structure while retaining the bands most sensitive to variations in Pb content, thereby enhancing the model's predictive performance.
(5) WOA
By simulating the encircling and spiral feeding behaviors of whales, WOA conducts global optimization of feature bands [40]. For this study, WOA was configured with a maximum of 100 iterations and a population size of 30.
2.4.3. Band Selection Combination
Building upon the preliminary band selection, we applied secondary optimization combinations to the initially selected bands from the WOA, aiming to maximize the advantages of each algorithm. The specific combinations are as follows:
WOA-CARS: This combination refines the feature bands identified by WOA using CARS. Due to WOA’s strong global search capabilities, it can effectively cover a wide feature space and identify potentially significant bands [41]. However, redundancy may exist among these initially selected bands. CARS addresses this by progressively eliminating less important bands and adaptively reweighting the crucial features. This combination ensures that the model simplifies the feature space while maintaining predictive accuracy and enhancing computational efficiency.
WOA-GA: This combination utilizes the genetic operations of GA (selection, crossover, and mutation) to further optimize the feature combinations based on the initial selection from WOA. GA provides good flexibility and exploratory capabilities when handling complex, high-dimensional data, allowing for a finer refinement of the feature space selected by WOA. This process identifies and retains the most explanatory bands while excluding noisy features and irrelevant information.
WOA-MI: Building on the preliminary selection by WOA, MI further extracts bands that are rich in information and highly correlated with Pb content. Incorporating MI enhances the model’s ability to capture nonlinear relationships, compensating for any nonlinear associations that WOA may not have identified during the initial screening.
WOA-SPA: This combination integrates the sequential projection characteristics of SPA to effectively reduce multicollinearity issues among the bands selected by WOA. This ensures that the final selected bands retain globally relevant information while reducing the influence of multicollinearity on the model's performance and stability.
To further optimize the band combinations and enhance the model’s predictive capabilities, we employed MI for fine extraction of bands based on the aforementioned combinations, resulting in multilayer combinations such as WOA-CARS-MI, WOA-GA-MI, and WOA-SPA-MI. This three-stage combination strategy is founded on the following principles: (1) Enhancing Information Content: The band combinations after initial screening may still contain redundancy and irrelevant information; the introduction of MI can effectively extract the most explanatory bands. (2) Improving Nonlinear Capture Capability: MI can identify and retain bands with complex nonlinear relationships to Pb content, thereby improving the model's ability to predict accurately.
2.4.4. PLS Model and Evaluation Metrics
PLS is a statistical method that extracts principal components by maximizing the covariance between feature variables and target variables, thereby establishing effective predictive models [42]. In this study, the PLS method was applied to model the selected band combinations for more precise predictions of the target variable. To assess the model’s performance, we employed several evaluation metrics, including the coefficient of determination (R2), root mean square error (RMSE), and relative predictive deviation (RPD) [43]. R2 measures the extent to which the model can explain the variability in observed data, with values closer to 1 indicating a better fit [44]. Generally, an R2 value greater than 0.7 is considered a good model fit, while a value exceeding 0.9 is regarded as excellent. RMSE quantifies the discrepancy between predicted and actual values, where smaller values denote improved predictive accuracy. RPD quantifies the model's ability to predict relative to the variability in the observed data, with values above 1.4 indicating good predictive performance, and values greater than 2 suggesting excellent performance [45].
3. Results and Discussion
3.1. Initial Selection of Characteristic Bands and Model Development
We conducted initial band selection using the CARS, GA, MI, SPA, and WOA algorithms. Using both the full spectrum and these selected characteristic bands, we built prediction models with the PLS method. For model training, 75% of the 68 samples were randomly assigned to the training set, while the remaining 25% comprised the test set. To ensure result stability, the modeling process was repeated 10 times, and the arithmetic mean of the evaluation metrics from these 10 test runs was taken as the final evaluation metric. The scatter plots of model performance across the test set for each band selection method are shown in Figure 3. The results demonstrate varying degrees of accuracy improvement following feature band selection. The average R2 value for the full-spectrum model was 0.43, while models with bands selected by CARS, GA, MI, SPA, and WOA achieved mean R2 values of 0.57, 0.63, 0.6, 0.58, and 0.64, showing increases of 0.14, 0.2, 0.17, 0.15, and 0.21, respectively, compared to the full-spectrum model. In terms of RMSE, the full-spectrum model yielded a value of 1.1, while the RMSE values for each algorithm were 0.92, 0.86, 0.92, 0.85, and 0.83, showing reductions of 0.18, 0.24, 0.18, 0.25, and 0.27, respectively. For RPD, the full-spectrum model obtained a value of 1.7, while RPD values with each algorithm were 1.91, 2.08, 1.9, 1.91, and 2.16, resulting in improvements of 0.21, 0.38, 0.2, 0.21, and 0.46, respectively. In summary, the WOA algorithm demonstrated superior performance in model development after band selection, achieving the highest overall accuracy among the tested methods.
3.2. Results of Combined Feature Bands and Model Analysis
Following the initial feature band selection, a second band combination was conducted using the WOA algorithm, which yielded the highest accuracy, combined with other algorithms, including WOA-CARS, WOA-GA, WOA-MI, and WOA-SPA. Subsequently, PLS modeling was performed on these combined bands, following the same methodology outlined in Section 3.1. Figure 4 presents scatter plots of test set predictions. Results demonstrate that the combined methods—WOA-CARS, WOA-GA, WOA-MI, and WOA-SPA—improve model accuracy to varying extents compared to the standalone WOA approach. The WOA model achieved an average R2 of 0.64, whereas the combined methods yielded average R2 values of 0.73 for both WOA-CARS and WOA-GA, 0.68 for WOA-MI, and 0.69 for WOA-SPA, showing increases of 0.09, 0.09, 0.04, and 0.05, respectively. Notably, WOA-GA and WOA-CARS provided the most substantial improvements, likely because GA and CARS more effectively optimize band combinations during feature selection, reducing redundancy and better extracting information closely related to Pb content. In comparison, the WOA-MI and WOA-SPA combinations yielded smaller gains, possibly because MI does not fully utilize global information in band selection, while SPA may retain some redundant bands when selecting representative bands. For RMSE, the value for WOA alone was 0.83, while the values for the combined algorithms were 0.77, 0.76, 0.82, and 0.74, respectively, showing reductions of 0.06, 0.07, 0.01, and 0.09. This demonstrates a particular advantage of the WOA-GA and WOA-SPA combinations in reducing model error. A lower RMSE suggests greater prediction accuracy on the test set, which is crucial for real-world soil Pb content prediction and enhances the precision of contamination detection. For RPD, the WOA model had a value of 2.16, while the RPD values for the combined algorithms were 2.42, 2.44, 2.23, and 2.32, reflecting increases of 0.26, 0.28, 0.07, and 0.16, respectively. The increase in RPD indicates enhanced predictive capability, with the WOA-GA combination achieving an RPD value of 2.44, underscoring its superior ability to capture data variability.
In summary, each combination method yielded improvements in model accuracy, error reduction, and data variability explanation to varying degrees. This suggests that further enhancements in predictive performance may be achievable by combining and optimizing bands after initial feature selection. Notably, the WOA-GA band selection method achieved the best modeling performance, demonstrating a significant advantage in effectively selecting bands highly correlated with Pb content. These findings offer valuable insights for future studies focused on Pb prediction in large-scale or more complex soil environments.
3.3. Final Combined Feature Band Results and Analysis
To further investigate the effectiveness of band combinations in enhancing model predictive ability, we applied MI for refined band selection based on previous combinations, forming multi-level combinations: WOA-CARS-MI, WOA-GA-MI, and WOA-SPA-MI. The combined bands were modeled using PLS, with their test set performance displayed in Figure 5. Figure 6 presents a comparison of R2 values for all band combinations and the full-band model.
The results show that the average R2, RMSE, and RPD values for WOA-CARS-MI are 0.74, 0.78, and 2.50, respectively, indicating a slight improvement over WOA-CARS’s 0.73, 0.77, and 2.42. However, outliers can be observed in the box plot of Figure 6, which may indicate that the model's predictive ability is affected in certain cases.
For WOA-GA-MI, the average R2, RMSE, and RPD were 0.75, 0.74, and 2.54, respectively, showing improvements compared to WOA-GA's values of 0.73, 0.76, and 2.44. However, the presence of outliers in WOA-GA-MI suggests performance variability in certain cases.
In the case of WOA-SPA-MI, the average R2, RMSE, and RPD were 0.72, 0.75, and 2.34, which represents limited improvement compared to WOA-SPA’s values of 0.69, 0.74, and 2.32. This indicates that the WOA-SPA-MI feature selection approach did not significantly enhance predictive performance in this optimization.
Overall, while MI application improved certain combinations, the presence of outliers indicates the need to consider potential data anomalies when evaluating model performance. The WOA-GA-MI combination stands out for its notable performance enhancement, suggesting a promising avenue for further exploration in future studies. These results provide a valuable reference for advancing soil Pb contamination prediction research.
3.4. Spectral Response Mechanisms of Sensitive Bands Selected by Different Methods
Different band selection techniques resulted in varying numbers of selected bands: CARS, GA, MI, SPA, WOA, WOA-CARS, WOA-GA, WOA-MI, WOA-SPA, WOA-CARS-MI, WOA-GA-MI, and WOA-SPA-MI selected 304, 1027, 1752, 965, 1018, 173, 502, 850, 306, 166, 469, and 296 bands, respectively (see Figure 7). Significant variations were observed in the wavelength ranges chosen by these methods. For example, the WOA and GA methods tend to prioritize specific bands with strong responses within the spectral region, whereas CARS and MI focus more on characteristic bands that are significantly associated with Pb content. These differences may stem from the unique optimization goals and characteristics of each method.
Next, we identified 22 common bands selected by the WOA-CARS-MI, WOA-GA-MI, and WOA-SPA-MI combinations, including the wavelengths 590, 866, 996, 1115, 1144, 1169, 1494, 1555, 1719, 1770, 1909, 1977, 1992, 2011, 2132, 2165, 2166, 2187, 2353, 2392, 2453, and 2486 nm (see Figure 8). The spectral response characteristics of these bands suggest the following associations with soil constituents influencing Pb distribution: (1) 590 nm and 996 nm are likely linked to oxides, such as iron oxides [46], which affect Pb mobility and distribution, making these bands significant for Pb inversion. (2) 866 nm and 1115 nm correlate with soil moisture and organic matter response [47], where Pb content may vary with changes in these factors. (3) 1144 nm and 1494 nm are associated with soil organic matter, which can form complexes with Pb, affecting the spectral signal. (4) 1555 nm relates to organic matter and clay minerals in soil [48], components that can impact Pb distribution. (5) 1719 nm, 1770 nm, and 1977 nm are linked to hydrated minerals, such as clay minerals containing OH groups [49], which play a role in Pb adsorption. (6) 2165 nm, 2187 nm, 2353 nm, and 2486 nm reflect clay and carbonate mineral responses [49].
4. Conclusions
(1) In this study, we applied CARS, GA, MI, SPA, and WOA algorithms to the original spectrum for initial feature band selection and constructed prediction models for Pb content using the PLS algorithm. Results indicate that models using selected feature bands outperformed the full-spectrum model, with the WOA-based Pb prediction model achieving the highest performance, yielding an average R2 of 0.64 on the test set, an improvement of 0.21 over the full-spectrum model.
(2) To further leverage each algorithm’s strengths based on the initially selected bands, we developed a combined feature band selection method based on WOA with CARS, GA, MI, and SPA algorithms (WOA-CARS, WOA-GA, WOA-MI, WOA-SPA). Models built with these combined band selection methods outperformed those using single algorithms, with the WOA-GA combination achieving the highest average R2 of 0.73, an improvement of 0.09 over WOA alone and 0.3 over the full-spectrum model. This highlights the considerable benefit of using combined algorithms to improve model accuracy.
(3) To further refine band selection and enhance prediction accuracy, the study applied the Mutual Information (MI) algorithm to the above combinations, forming multi-level combined models, including WOA-CARS-MI, WOA-GA-MI, and WOA-SPA-MI. Results show that incorporating MI improved performance in some combined models. However, outliers were observed in the WOA-CARS-MI and WOA-GA-MI models, indicating the need for careful outlier treatment in model evaluation. Notably, the proposed WOA-GA-MI model showed the most significant improvement, achieving an average R2 of 0.73, which is an increase of 0.32, 0.11, and 0.02 compared to the full-spectrum, WOA feature spectrum, and WOA-GA models, respectively.
(4) Based on the band selection results of the above multi-level combined models, 22 common bands were extracted from the WOA-CARS-MI, WOA-GA-MI, and WOA-SPA-MI models, namely: 590, 866, 996, 1115, 1144, 1169, 1494, 1555, 1719, 1770, 1909, 1977, 1992, 2011, 2132, 2165, 2166, 2187, 2353, 2392, 2453, and 2486 nm. Spectral analysis reveals that different bands correspond to distinct spectral features of various soil components. Some wavelengths are linked to the reflectance of soil oxides, such as iron oxides at 590 nm and 996 nm. Others are associated with soil organic matter content, with bands at 1144, 1494, and 1555 nm. Additionally, certain wavelengths are related to the presence of clay minerals or hydroxyl (OH) groups (e.g., 1719, 1770, and 1977 nm), as well as clay and carbonate minerals (e.g., 2353 nm and 2486 nm). These findings provide a basis for a deeper understanding of soil spectral characteristics.
Acknowledgments
The research was supported by the International Research Centre of Big Data for Sustainable Development Goals (CBAS) [Grant No. CBASYX0906], the National Natural Science Foundation of China (42271422) and the key project of sustainable development international cooperation program by NSFC (Grant No.42361144883), the Engineering Center of Yunnan Education Department for Health Geological Survey & Evaluation (9135009009), Science and Technology Innovation Team for Highland Ecological Agriculture Geological Survey and Evaluation of Yunnan Education Department.
References
- Malm, O. , Gold Mining as a Source of Mercury Exposure in the Brazilian Amazon. Environmental Research 1998, 77, 73–78. [Google Scholar] [CrossRef] [PubMed]
- Stamatis, G.; Voudouris, K.; Karefilakis, F. , Groundwater Pollution by Heavy Metals in Historical Mining Area of Lavrio, Attica, Greece. Water, Air, and Soil Pollution 2001, 128, 61–83. [Google Scholar] [CrossRef]
- Yao, X.; Xiao, R.; Ma, Z.; Xie, Y.; Zhang, M.; Yu, F. , Distribution and contamination assessment of heavy metals in soils from tidal flat, oil exploitation zone and restored wetland in the Yellow River Estuary. Wetlands 2016, 36, 153–165. [Google Scholar] [CrossRef]
- Khosravi, V.; Doulati Ardejani, F.; Yousefi, S.; Aryafar, A. , Monitoring soil lead and zinc contents via combination of spectroscopy with extreme learning machine and other data mining methods. Geoderma 2018, 318, 29–41. [Google Scholar] [CrossRef]
- Xie, X.-L.; Pan, X.-Z.; Sun, B. , Visible and Near-Infrared Diffuse Reflectance Spectroscopy for Prediction of Soil Properties near a Copper Smelter. Pedosphere 2012, 22, 351–366. [Google Scholar] [CrossRef]
- Ren, H.-Y.; Zhuang, D.-F.; Singh, A. N.; Pan, J.-J.; Qiu, D.-S.; Shi, R.-H. , Estimation of As and Cu Contamination in Agricultural Soils Around a Mining Area by Reflectance Spectroscopy: A Case Study. Pedosphere 2009, 19, 719–726. [Google Scholar] [CrossRef]
- Huang, F.; Peng, S.; Yang, H.; Cao, H.; Ma, N.; Ma, L. , Development of a novel and fast XRF instrument for large area heavy metal detection integrated with UAV. Environmental Research 2022, 214, 113841. [Google Scholar] [CrossRef]
- Wang, Y.; Zou, B.; Chai, L.; Lin, Z.; Feng, H.; Tang, Y.; Tian, R.; Tu, Y.; Zhang, B.; Zou, H. , Monitoring of soil heavy metals based on hyperspectral remote sensing: A review. Earth-Science Reviews.
- Tan, K.; Ma, W.; Chen, L.; Wang, H.; Du, Q.; Du, P.; Yan, B.; Liu, R.; Li, H. , Estimating the distribution trend of soil heavy metals in mining area from HyMap airborne hyperspectral imagery based on ensemble learning. Journal of Hazardous Materials 2021, 401, 123288. [Google Scholar] [CrossRef]
- Liu, K.; Zhao, D.; Fang, J.-y.; Zhang, X.; Zhang, Q.-y.; Li, X.-k. , Estimation of Heavy-Metal Contamination in Soil Using Remote Sensing Spectroscopy and a Statistical Approach. Journal of the Indian Society of Remote Sensing 2017, 45, 805–813. [Google Scholar] [CrossRef]
- Wang, J.; Cui, L.; Gao, W.; Shi, T.; Chen, Y.; Gao, Y. , Prediction of low heavy metal concentrations in agricultural soils using visible and near-infrared reflectance spectroscopy. Geoderma 2014, 216, 1–9. [Google Scholar] [CrossRef]
- Wang, Y.; Zhang, X.; Sun, W.; Wang, J.; Ding, S.; Liu, S. , Effects of hyperspectral data with different spectral resolutions on the estimation of soil heavy metal content: From ground-based and airborne data to satellite-simulated data. Science of The Total Environment 2022, 838, 156129. [Google Scholar] [CrossRef] [PubMed]
- Shi, T.; Chen, Y.; Liu, Y.; Wu, G. , Visible and near-infrared reflectance spectroscopy—An alternative for monitoring soil contamination by heavy metals. Journal of Hazardous Materials 2014, 265, 166–176. [Google Scholar] [CrossRef] [PubMed]
- Asadzadeh, S.; de Souza Filho, C. R. , A review on spectral processing methods for geological remote sensing. International Journal of Applied Earth Observation and Geoinformation 2016, 47, 69–90. [Google Scholar] [CrossRef]
- Chen, L.; Lai, J.; Tan, K.; Wang, X.; Chen, Y.; Ding, J. , Development of a soil heavy metal estimation method based on a spectral index: Combining fractional-order derivative pretreatment and the absorption mechanism. Science of The Total Environment 2022, 813, 151882. [Google Scholar] [CrossRef]
- Zou, Z.; Wang, Q.; Wu, Q.; Li, M.; Zhen, J.; Yuan, D.; Zhou, M.; Xu, C.; Wang, Y.; Zhao, Y.; Yin, S.; Xu, L. , Inversion of heavy metal content in soil using hyperspectral characteristic bands-based machine learning method. Journal of Environmental Management 2024, 355, 120503. [Google Scholar] [CrossRef]
- Yun, Y.-H.; Li, H.-D.; Deng, B.-C.; Cao, D.-S. , An overview of variable selection methods in multivariate analysis of near-infrared spectra. TrAC Trends in Analytical Chemistry 2019, 113, 102–115. [Google Scholar] [CrossRef]
- Ma, X.; Wang, J.; Zhou, K.; Zhang, W.; Zhang, Z.; Zhou, S.; Bai, Y.; De Maeyer, P.; Van de Voorde, T. , Quantitative evaluation of the impact of band optimization methods on the accuracy of the hyperspectral metal element inversion models. International Journal of Applied Earth Observation and Geoinformation 2024, 132, 104011. [Google Scholar] [CrossRef]
- Chang, N.; Jing, X.; Zeng, W.; Zhang, Y.; Li, Z.; Chen, D.; Jiang, D.; Zhong, X.; Dong, G.; Liu, Q., Soil Organic Carbon Prediction Based on Different Combinations of Hyperspectral Feature Selection and Regression Algorithms. Agronomy 2023, 13, (7).
- Tan, K.; Wang, H.; Zhang, Q.; Jia, X. , An improved estimation model for soil heavy metal(loid) concentration retrieval in mining areas using reflectance spectroscopy. Journal of Soils and Sediments 2018, 18, 2008–2022. [Google Scholar] [CrossRef]
- Zhang, Y.; Li, M.; Zheng, L.; Qin, Q.; Lee, W. S. , Spectral features extraction for estimation of soil total nitrogen content based on modified ant colony optimization algorithm. Geoderma 2019, 333, 23–34. [Google Scholar] [CrossRef]
- Lin, N.; Jiang, R.; Li, G.; Yang, Q.; Li, D.; Yang, X. , Estimating the heavy metal contents in farmland soil from hyperspectral images based on Stacked AdaBoost ensemble learning. Ecological Indicators 2022, 143, 109330. [Google Scholar] [CrossRef]
- Li, F.; Xu, L.; You, T.; Lu, A. , Measurement of potentially toxic elements in the soil through NIR, MIR, and XRF spectral data fusion. Computers and Electronics in Agriculture 2021, 187, 106257. [Google Scholar] [CrossRef]
- Gao, L.; Gong, D.; Cui, N.; Lv, M.; Feng, Y. , Evaluation of bio-inspired optimization algorithms hybrid with artificial neural network for reference crop evapotranspiration estimation. Computers and Electronics in Agriculture 2021, 190, 106466. [Google Scholar] [CrossRef]
- Tu, Y.; Zou, B.; Feng, H.; Zhou, M.; Yang, Z.; Xiong, Y., A Near Standard Soil Samples Spectra Enhanced Modeling Strategy for Cd Concentration Prediction. Remote Sensing 2021, 13, (14).
- Jiang, G.; Zhou, S.; Cui, S.; Chen, T.; Wang, J.; Chen, X.; Liao, S.; Zhou, K. , Exploring the Potential of HySpex Hyperspectral Imagery for Extraction of Copper Content. Sensors 2020, 20, 6325. [Google Scholar] [CrossRef]
- Wei, L.; Yuan, Z.; Zhong, Y.; Yang, L.; Hu, X.; Zhang, Y., An Improved Gradient Boosting Regression Tree Estimation Model for Soil Heavy Metal (Arsenic) Pollution Monitoring Using Hyperspectral Remote Sensing. Applied Sciences 2019, 9, (9).
- Feng, X.; Tian, A.; Fu, C. , Hyperspectral prediction model of soil Cu content based on WOA-SPA algorithm. International Journal of Remote Sensing 2024, 45, 6408–6424. [Google Scholar] [CrossRef]
- Wang, F.; Gao, J.; Zha, Y. , Hyperspectral sensing of heavy metals in soil and vegetation: Feasibility and challenges. ISPRS Journal of Photogrammetry and Remote Sensing 2018, 136, 73–84. [Google Scholar] [CrossRef]
- Rossel, R. A. V.; Behrens, T. , Using data mining to model and interpret soil diffuse reflectance spectra. Geoderma 2010, 158, 46–54. [Google Scholar] [CrossRef]
- Ou, D.; Tan, K.; Lai, J.; Jia, X.; Wang, X.; Chen, Y.; Li, J. , Semi-supervised DNN regression on airborne hyperspectral imagery for improved spatial soil properties prediction. Geoderma 2021, 385, 114875. [Google Scholar] [CrossRef]
- Li, H.; Yao, J.; Min, N.; Duran, R. , Comprehensive assessment of environmental and health risks of metal(loid)s pollution from non-ferrous metal mining and smelting activities. Journal of Cleaner Production 2022, 375. [Google Scholar] [CrossRef]
- Xing, Z.; Du, C.; Shen, Y.; Ma, F.; Zhou, J. , A method combining FTIR-ATR and Raman spectroscopy to determine soil organic matter: Improvement of prediction accuracy using competitive adaptive reweighted sampling (CARS). Computers and Electronics in Agriculture 2021, 191, 106549. [Google Scholar] [CrossRef]
- Li, H.; Liang, Y.; Xu, Q.; Cao, D. , Key wavelengths screening using competitive adaptive reweighted sampling method for multivariate calibration. Analytica Chimica Acta 2009, 648, 77–84. [Google Scholar] [CrossRef]
- Abu Khurma, R.; Aljarah, I.; Sharieh, A.; Abd Elaziz, M.; Damaševičius, R.; Krilavičius, T., A Review of the Modification Strategies of the Nature Inspired Algorithms for Feature Selection Problem. Mathematics 2022, 10, (3).
- Sun, W.; Zhang, X.; Sun, X.; Sun, Y.; Cen, Y. , Predicting nickel concentration in soil using reflectance spectroscopy associated with organic matter and clay minerals. Geoderma 2018, 327, 25–35. [Google Scholar] [CrossRef]
- Zhong, L.; Guo, X.; Ding, M.; Ye, Y.; Jiang, Y.; Zhu, Q.; Li, J. , SHAP values accurately explain the difference in modeling accuracy of convolution neural network between soil full-spectrum and feature-spectrum. Computers and Electronics in Agriculture 2024, 217. [Google Scholar] [CrossRef]
- Soares, S. F. C.; Gomes, A. A.; Araujo, M. C. U.; Filho, A. R. G.; Galvão, R. K. H. , The successive projections algorithm. TrAC Trends in Analytical Chemistry 2013, 42, 84–98. [Google Scholar] [CrossRef]
- Jiachen, H.; Jing, H.; Gang, L.; Weile, L.; Zhe, L.; Zhi, L. , Inversion analysis of soil nitrogen content using hyperspectral images with different preprocessing methods. Ecological Informatics 2023, 78, 102381. [Google Scholar] [CrossRef]
- Mirjalili, S.; Lewis, A. , The Whale Optimization Algorithm. Advances in Engineering Software 2016, 95, 51–67. [Google Scholar] [CrossRef]
- Chakraborty, S.; Kumar Saha, A.; Sharma, S.; Mirjalili, S.; Chakraborty, R. , A novel enhanced whale optimization algorithm for global optimization. Computers & Industrial Engineering 2021, 153, 107086. [Google Scholar]
- Wu, Y.; Chen, J.; Wu, X.; Tian, Q.; Ji, J.; Qin, Z. , Possibilities of reflectance spectroscopy for the assessment of contaminant elements in suburban soils. Applied Geochemistry 2005, 20, 1051–1059. [Google Scholar] [CrossRef]
- Sun, Y.; Chen, S.; Dai, X.; Li, D.; Jiang, H.; Jia, K. , Coupled retrieval of heavy metal nickel concentration in agricultural soil from spaceborne hyperspectral imagery. Journal of Hazardous Materials 2023, 446, 130722. [Google Scholar] [CrossRef] [PubMed]
- Wang, Y.; Zou, B.; Li, S.; Tian, R.; Zhang, B.; Feng, H.; Tang, Y. , A hierarchical residual correction-based hyperspectral inversion method for soil heavy metals considering spatial heterogeneity. Journal of Hazardous Materials 2024, 479, 135699. [Google Scholar] [CrossRef]
- Liu, Y.; Lu, Y.; Chen, D.; Zheng, W.; Ma, Y.; Pan, X. , Simultaneous estimation of multiple soil properties under moist conditions using fractional-order derivative of vis-NIR spectra and deep learning. Geoderma 2023, 438. [Google Scholar] [CrossRef]
- Zhou, M.; Zou, B.; Tu, Y.; Feng, H.; He, C.; Ma, X.; Ning, J. , Spectral response feature bands extracted from near standard soil samples for estimating soil Pb in a mining area. Geocarto International 2022, 37, 13248–13267. [Google Scholar] [CrossRef]
- Rathod, P. H.; Rossiter, D. G.; Noomen, M. F.; van der Meer, F. D. , Proximal Spectral Sensing to Monitor Phytoremediation of Metal-Contaminated Soils. International Journal of Phytoremediation 2013, 15, 405–426. [Google Scholar] [CrossRef] [PubMed]
- Knadel, M.; Viscarra Rossel, R. A.; Deng, F.; Thomsen, A.; Greve, M. H. , Visible–Near Infrared Spectra as a Proxy for Topsoil Texture and Glacial Boundaries. Soil Science Society of America Journal 2013, 77, 568. [Google Scholar] [CrossRef]
- Lu, Q.; Wang, S.; Bai, X.; Liu, F.; Wang, M.; Wang, J.; Tian, S. , Rapid inversion of heavy metal concentration in karst grain producing areas based on hyperspectral bands associated with soil components. Microchemical Journal 2019, 148, 404–411. [Google Scholar] [CrossRef]
Figure 1.
Locations of sampling points in the study area.
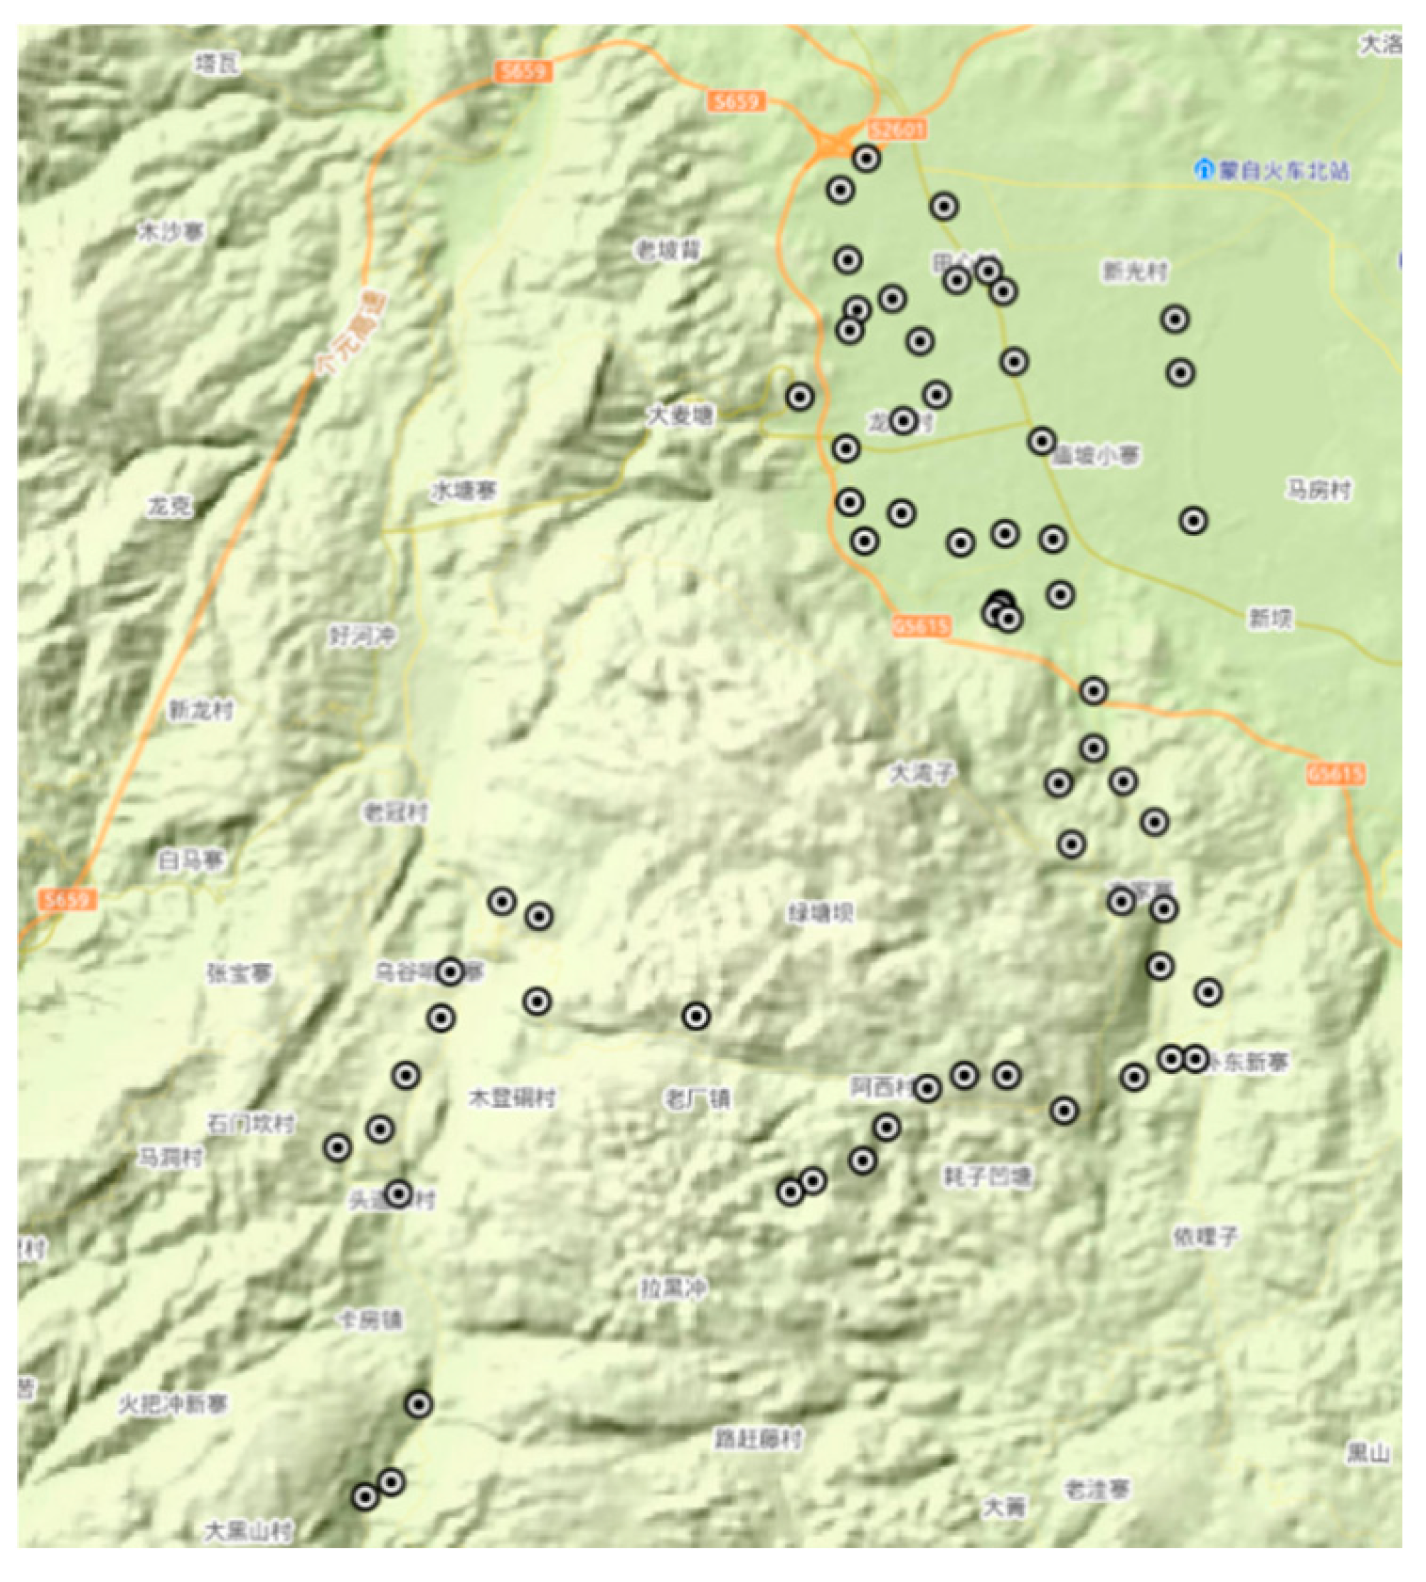
Figure 2.
Correlation curves between different spectral preprocessing methods and soil Pb content.
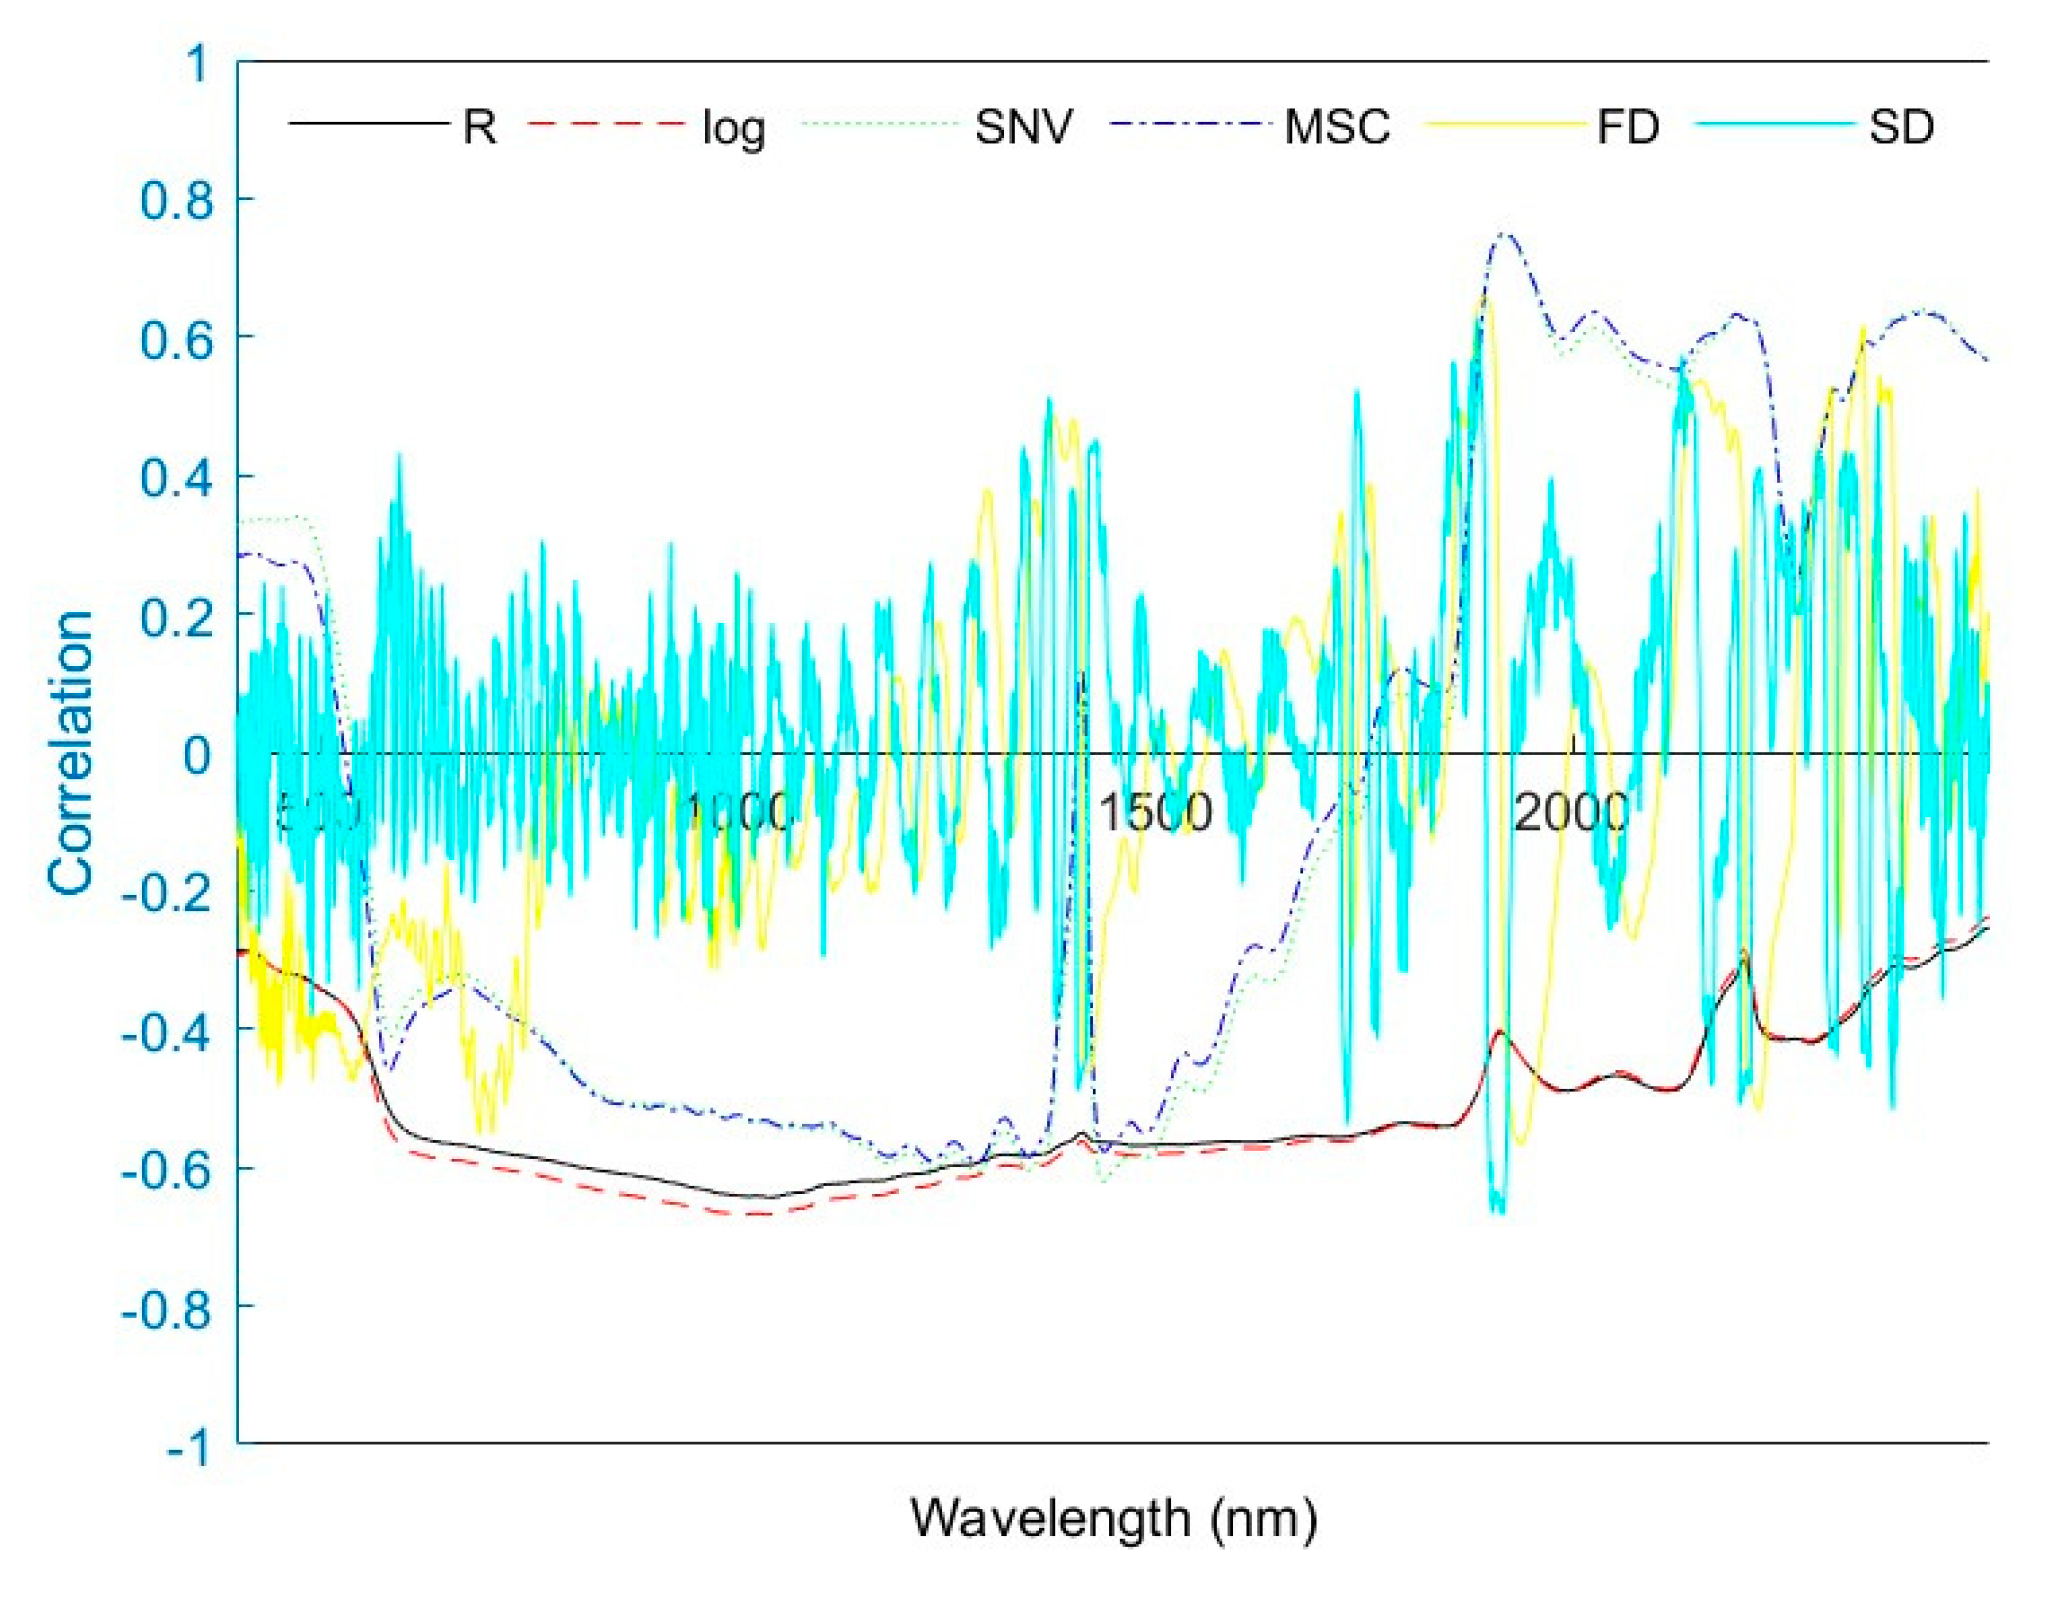
Figure 3.
Scatter plots of the observed vs. predicted values for models based on the full spectrum and different band selection methods: (a) Full spectrum, (b) CARS, (c) GA, (d) MI, (e) SPA, and (f) WOA. Each plot’s upper left corner displays the mean test set evaluation metrics averaged over 10 runs.
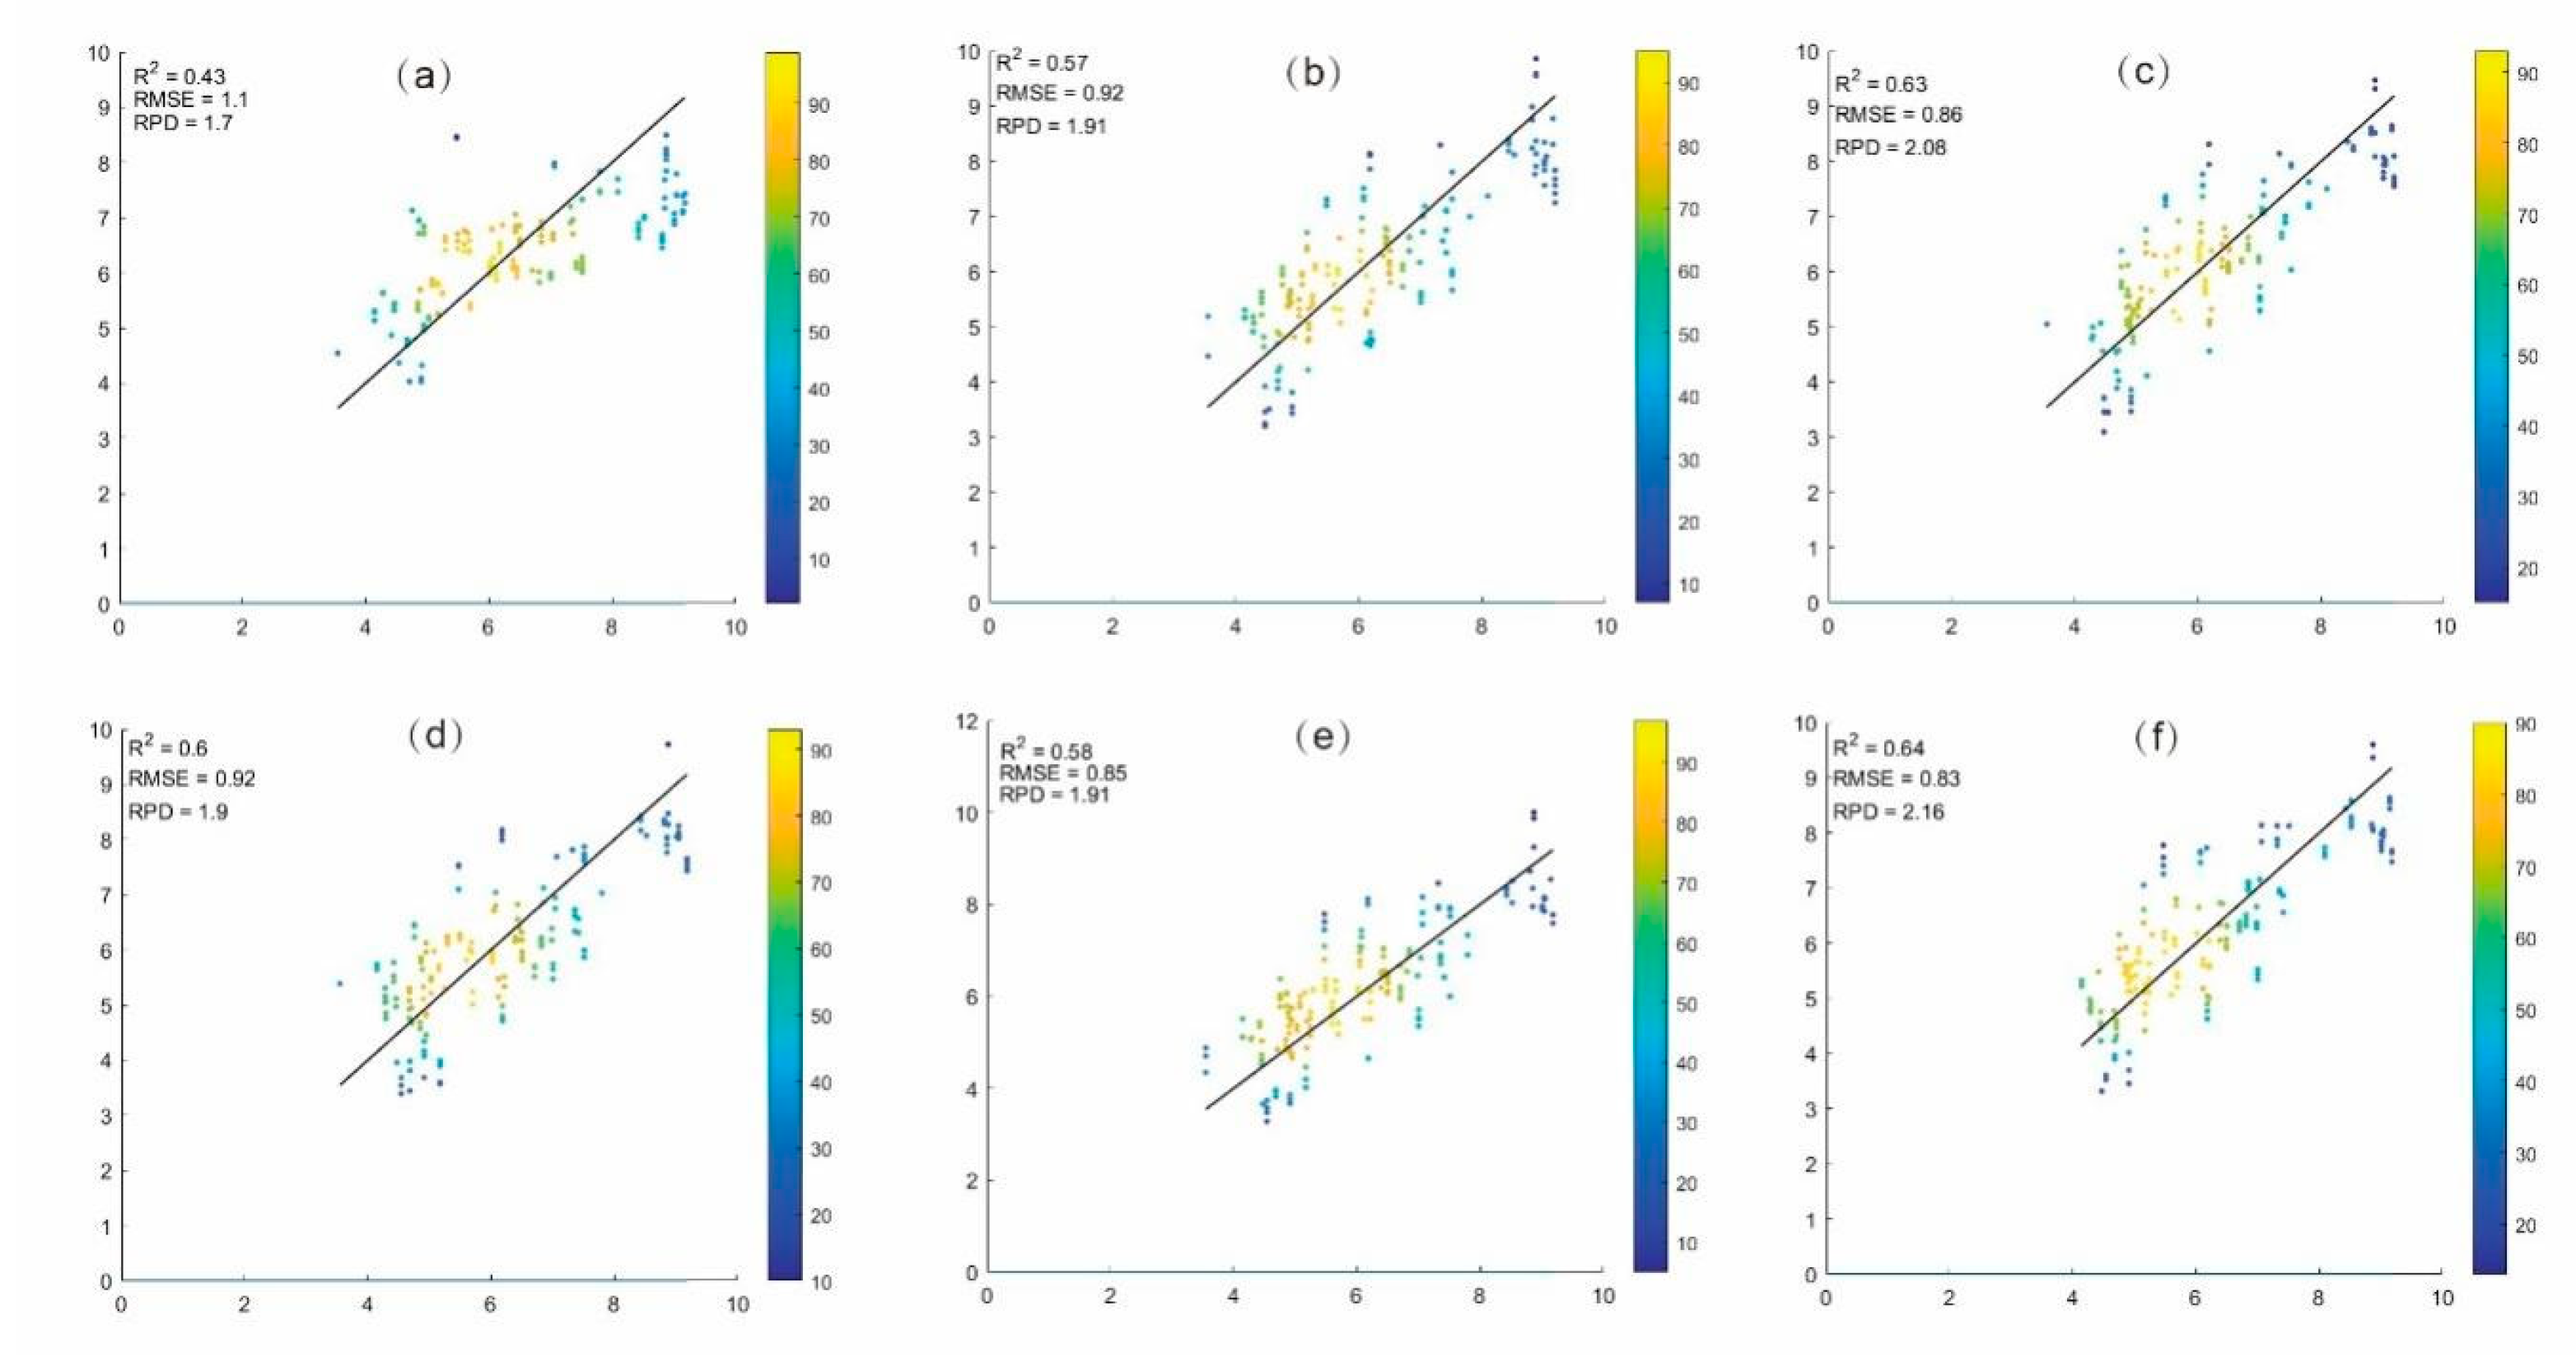
Figure 4.
Scatter plots of real vs. predicted values for combined feature band models on the test set: (a) WOA-CARS, (b) WOA-GA, (c) WOA-MI, and (d) WOA-SPA. Each plot's top-left corner shows the average test set evaluation metrics calculated from 10 runs.
Figure 4.
Scatter plots of real vs. predicted values for combined feature band models on the test set: (a) WOA-CARS, (b) WOA-GA, (c) WOA-MI, and (d) WOA-SPA. Each plot's top-left corner shows the average test set evaluation metrics calculated from 10 runs.
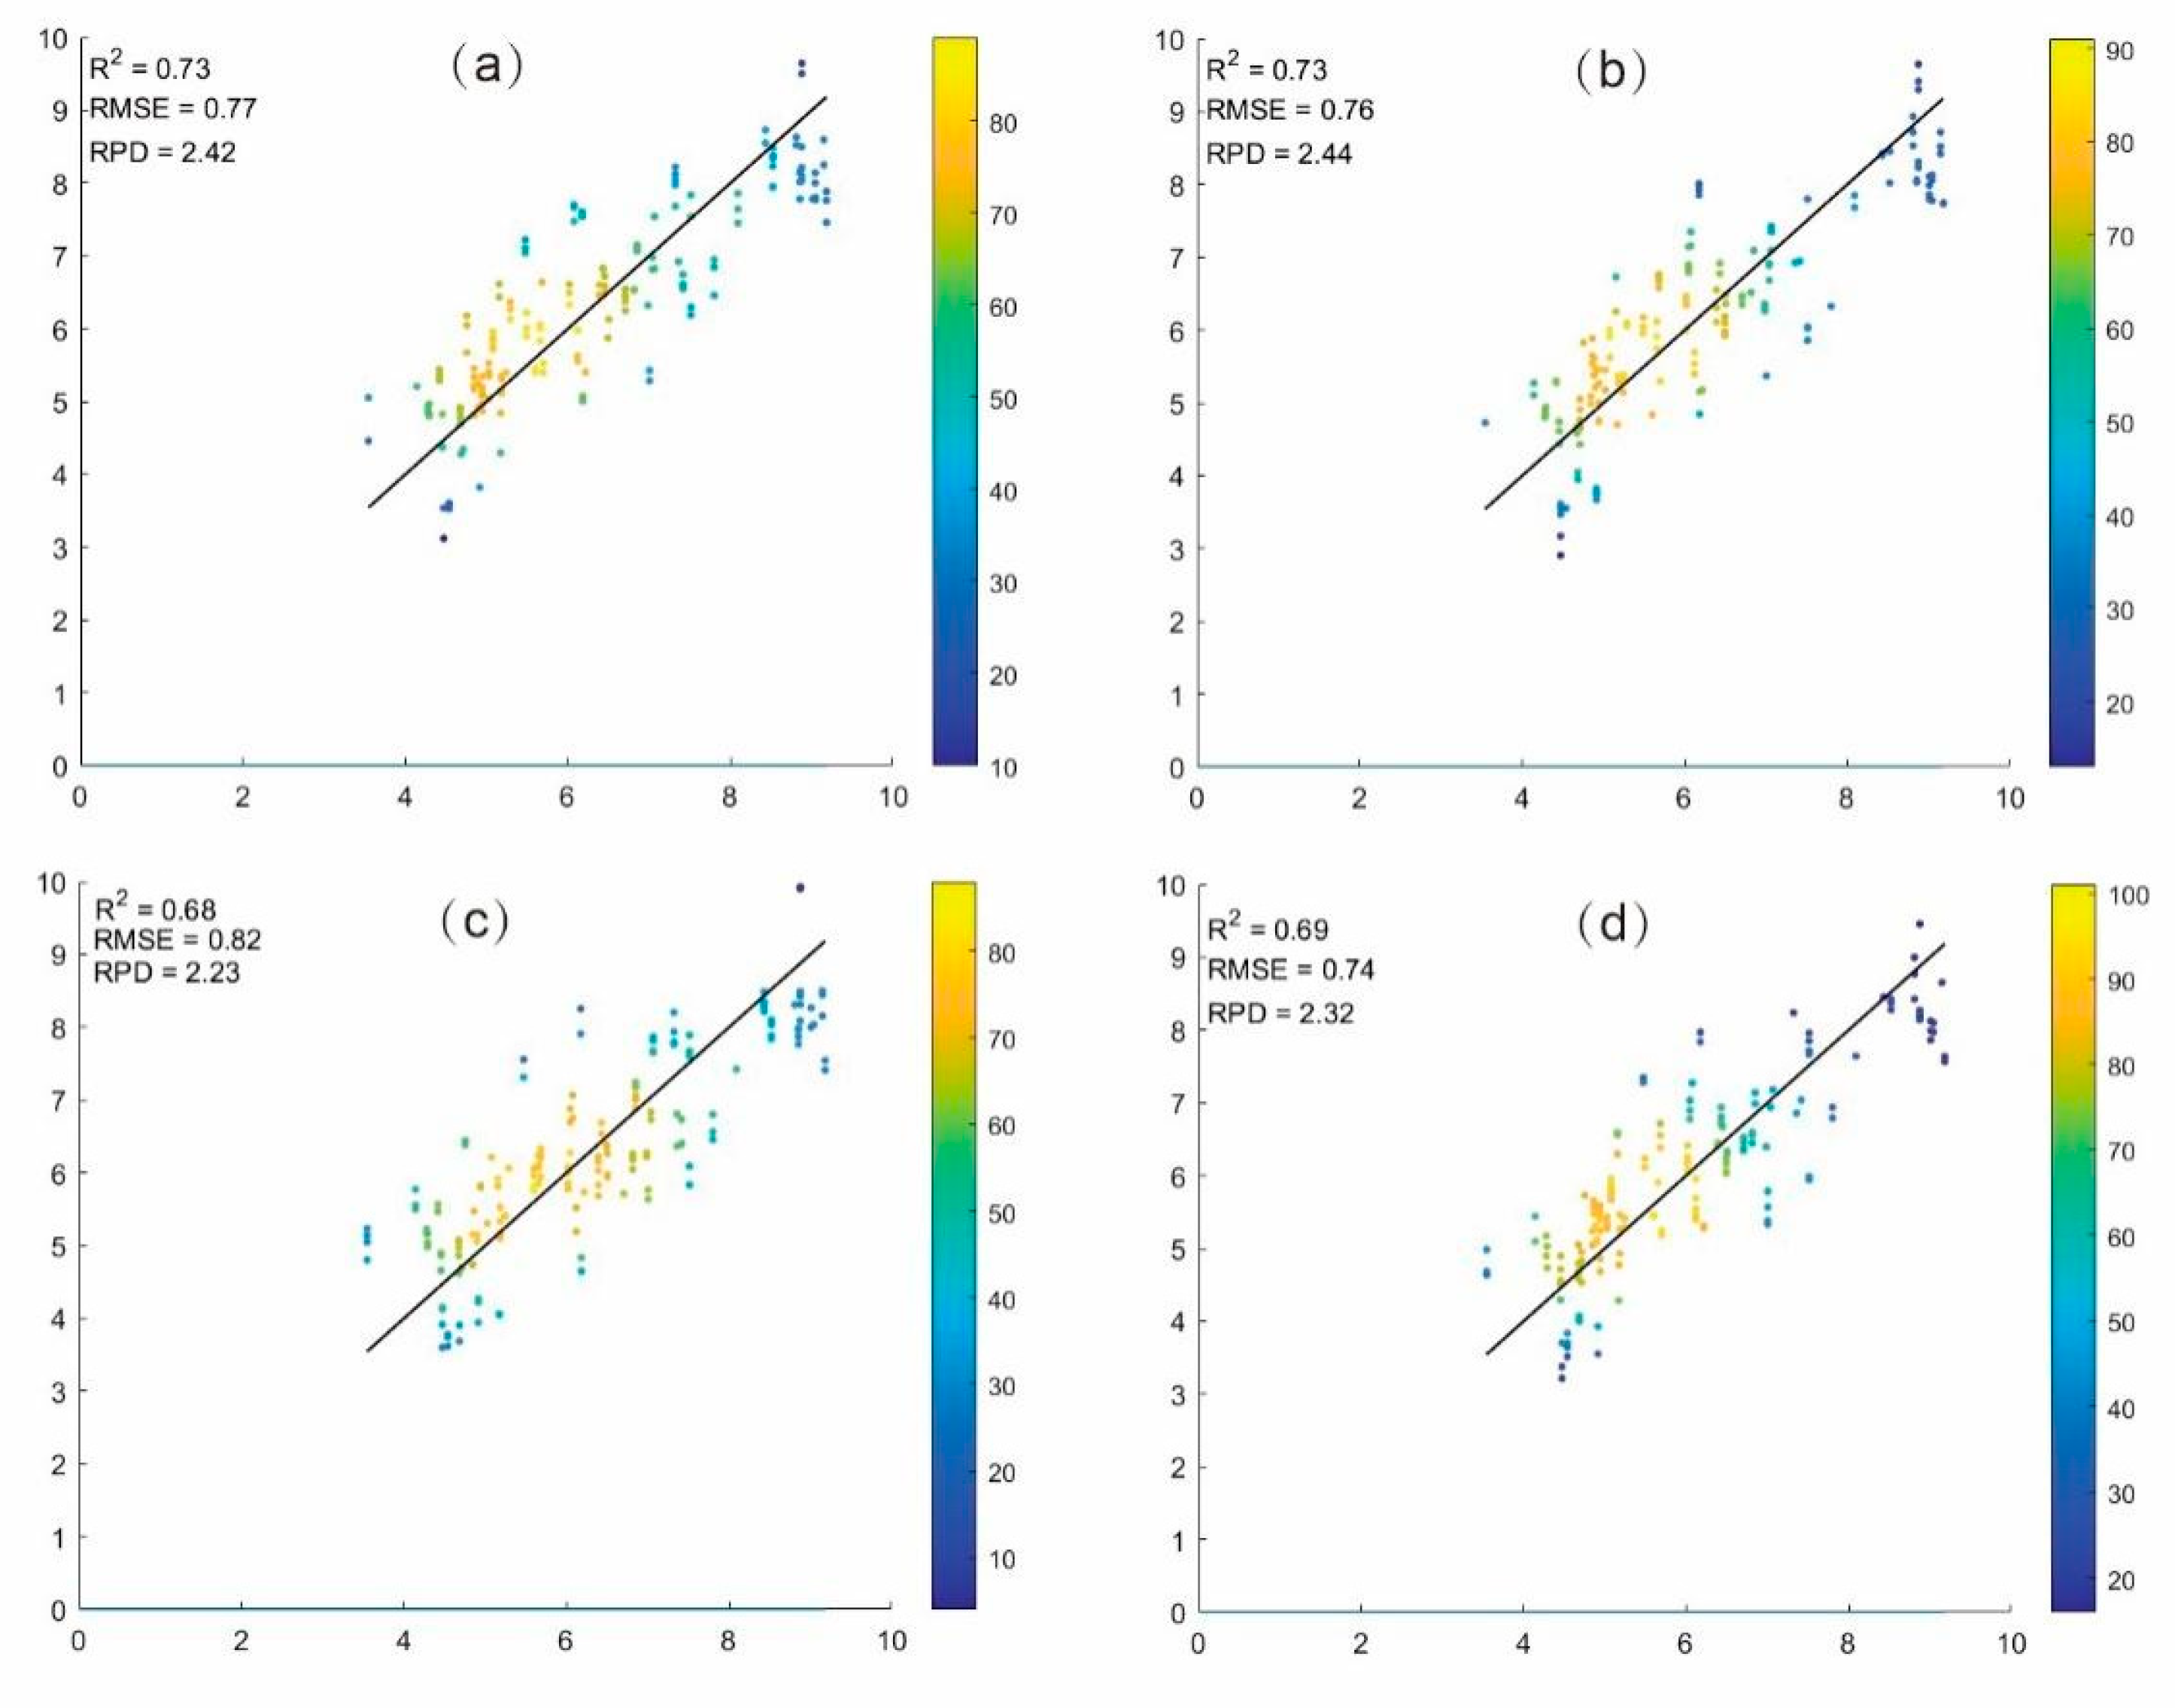
Figure 5.
Scatter plots of final band combination models on the test set: (a) WOA-CARS-MI, (b) WOA-GA-MI, (c) WOA-SPA-MI. Each plot's top-left corner shows the average test set evaluation metrics calculated from 10 runs.
Figure 5.
Scatter plots of final band combination models on the test set: (a) WOA-CARS-MI, (b) WOA-GA-MI, (c) WOA-SPA-MI. Each plot's top-left corner shows the average test set evaluation metrics calculated from 10 runs.
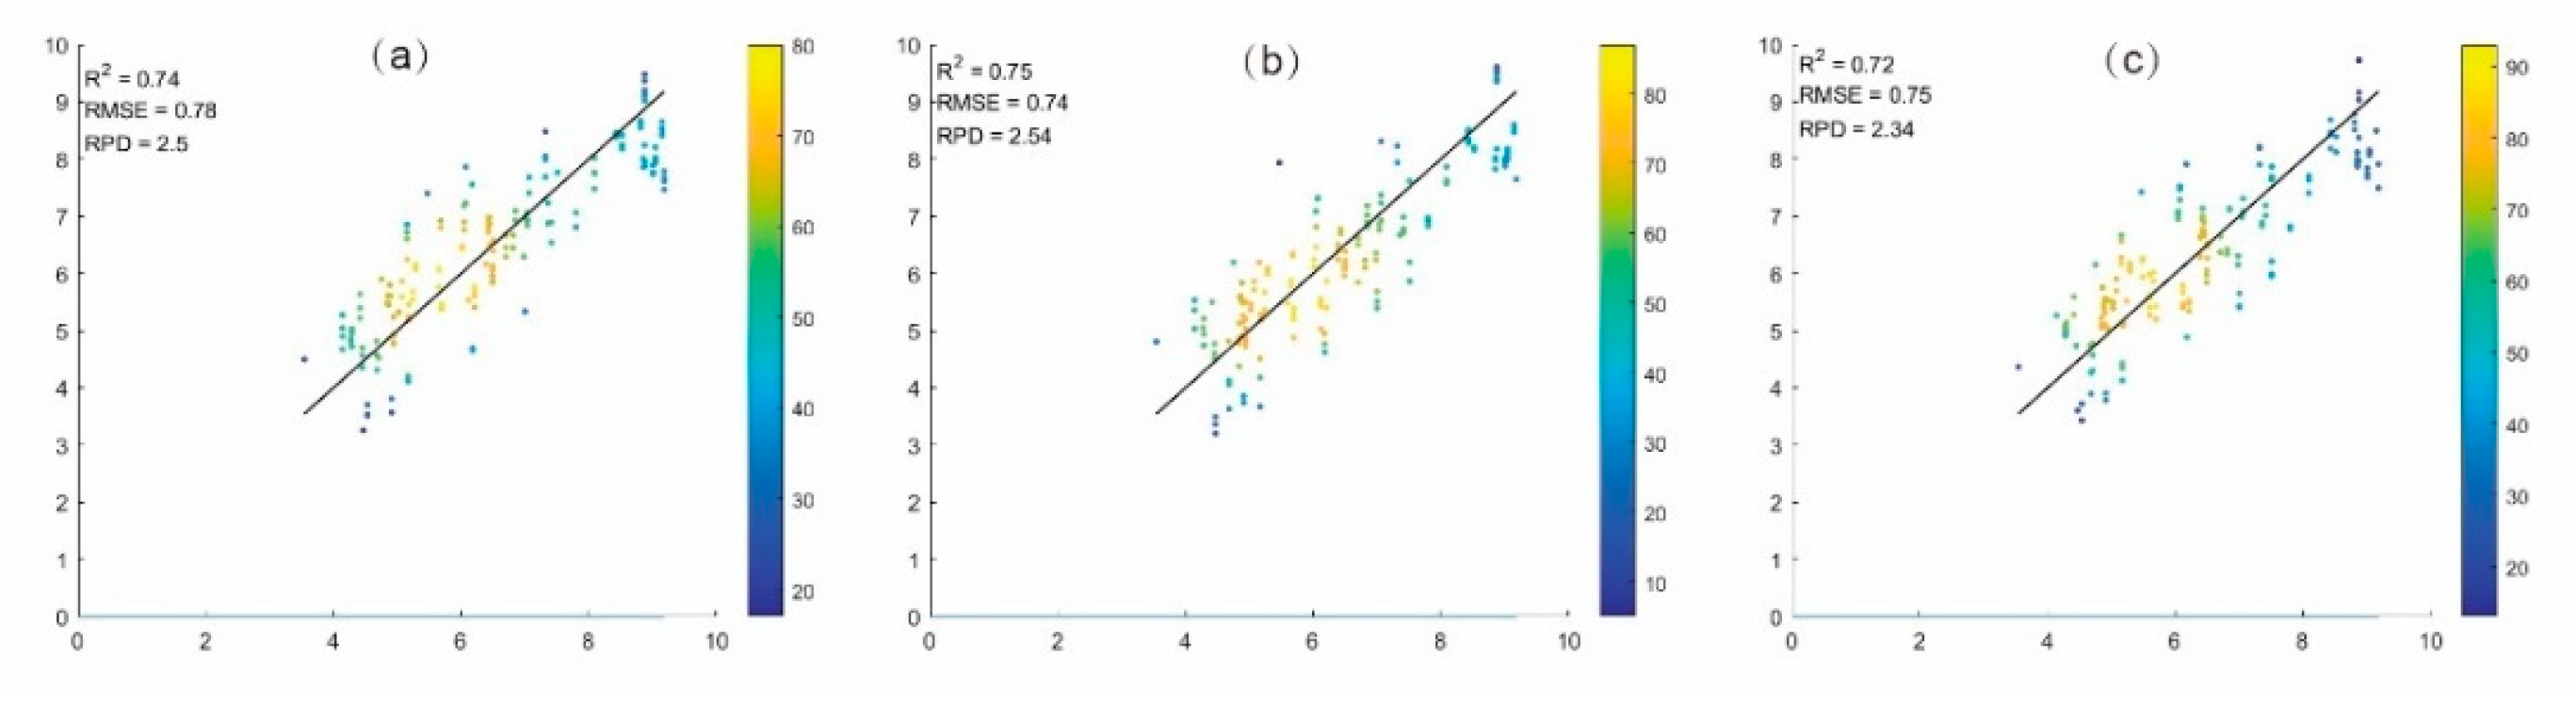
Figure 6.
Comparison of R2 values between full-band modeling and band combination modeling.
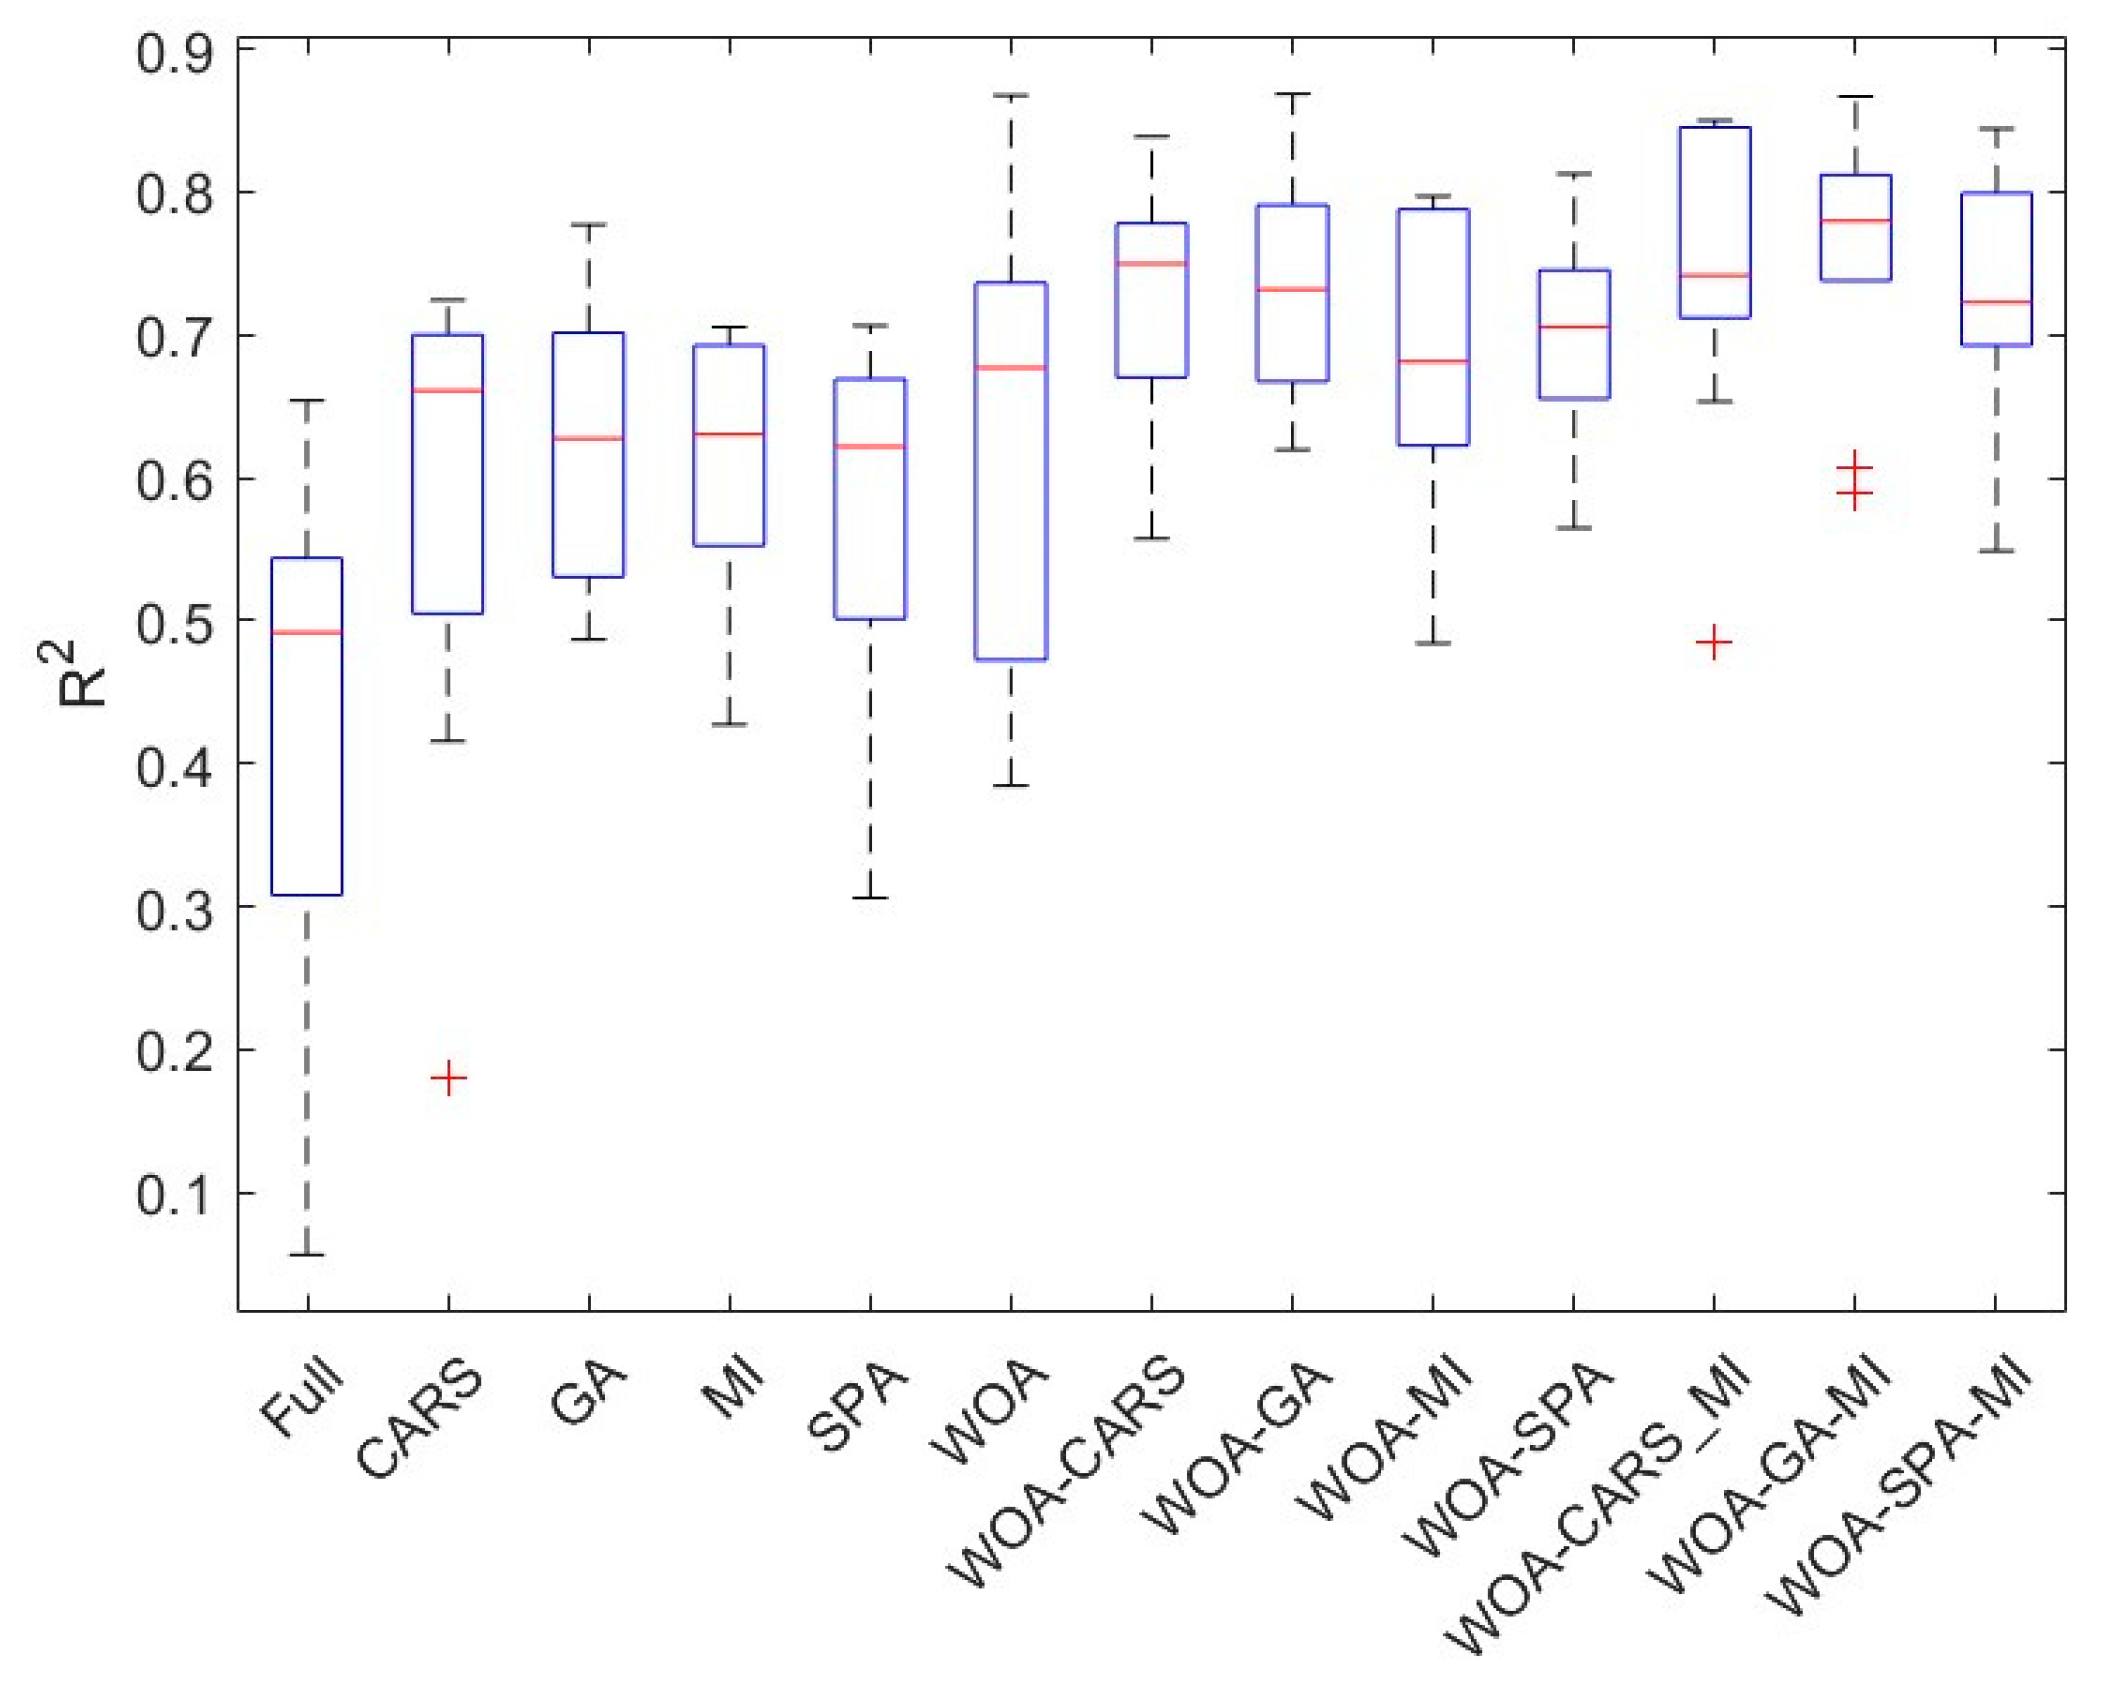
Figure 7.
Comparison of spectral correlation between Pb content and characteristic bands extracted by different band selection methods: (a) CARS, (b) GA, (c) MI, (d) SPA, (e) WOA, (f) WOA-CARS, (g) WOA-GA, (h) WOA-MI, (i) WOA-SPA, (j) WOA-CARS-MI, (k) WOA-GA-MI, (l) WOA-SPA-MI. V Vertical lines indicate the commonly selected bands, and the black line represents the correlation curve between Pb content and spectral response.
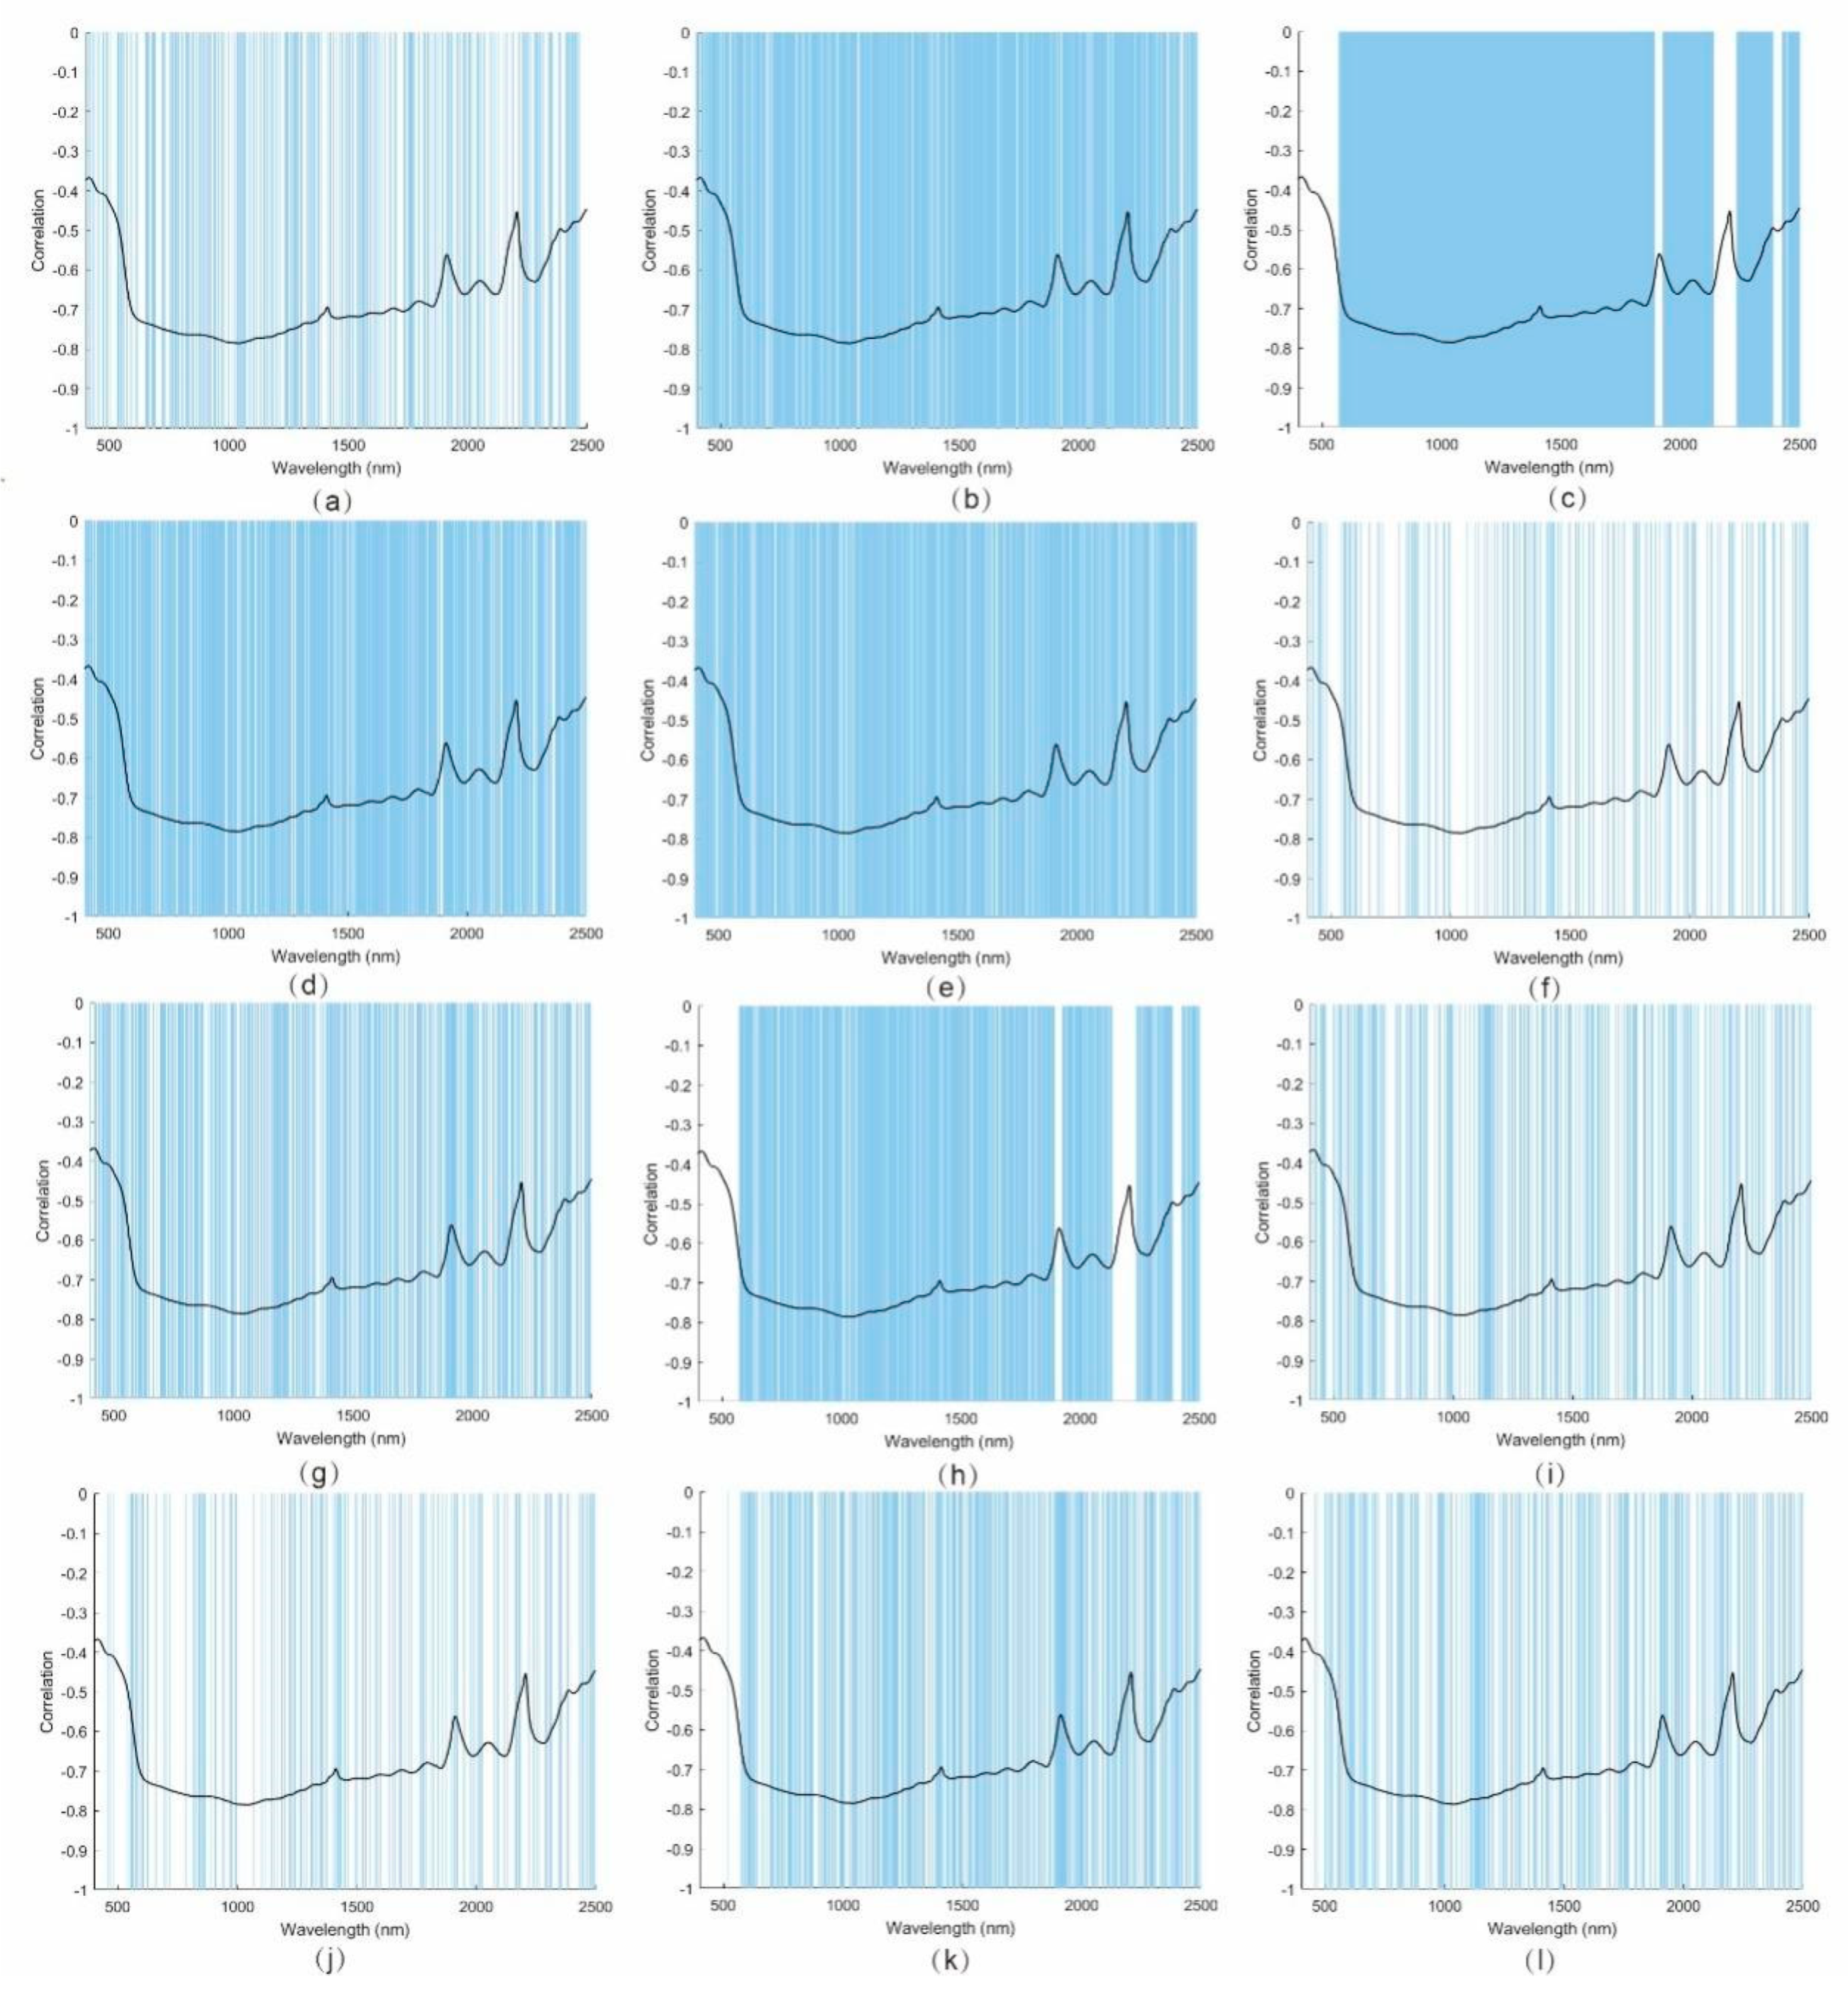
Figure 8.
Spectral correlation between Pb content and the commonly selected bands in the WOA-CARS-MI, WOA-GA-MI, and WOA-SPA-MI combinations. Vertical lines indicate the commonly selected bands, and the black line represents the correlation curve between Pb content and spectral response.
Figure 8.
Spectral correlation between Pb content and the commonly selected bands in the WOA-CARS-MI, WOA-GA-MI, and WOA-SPA-MI combinations. Vertical lines indicate the commonly selected bands, and the black line represents the correlation curve between Pb content and spectral response.
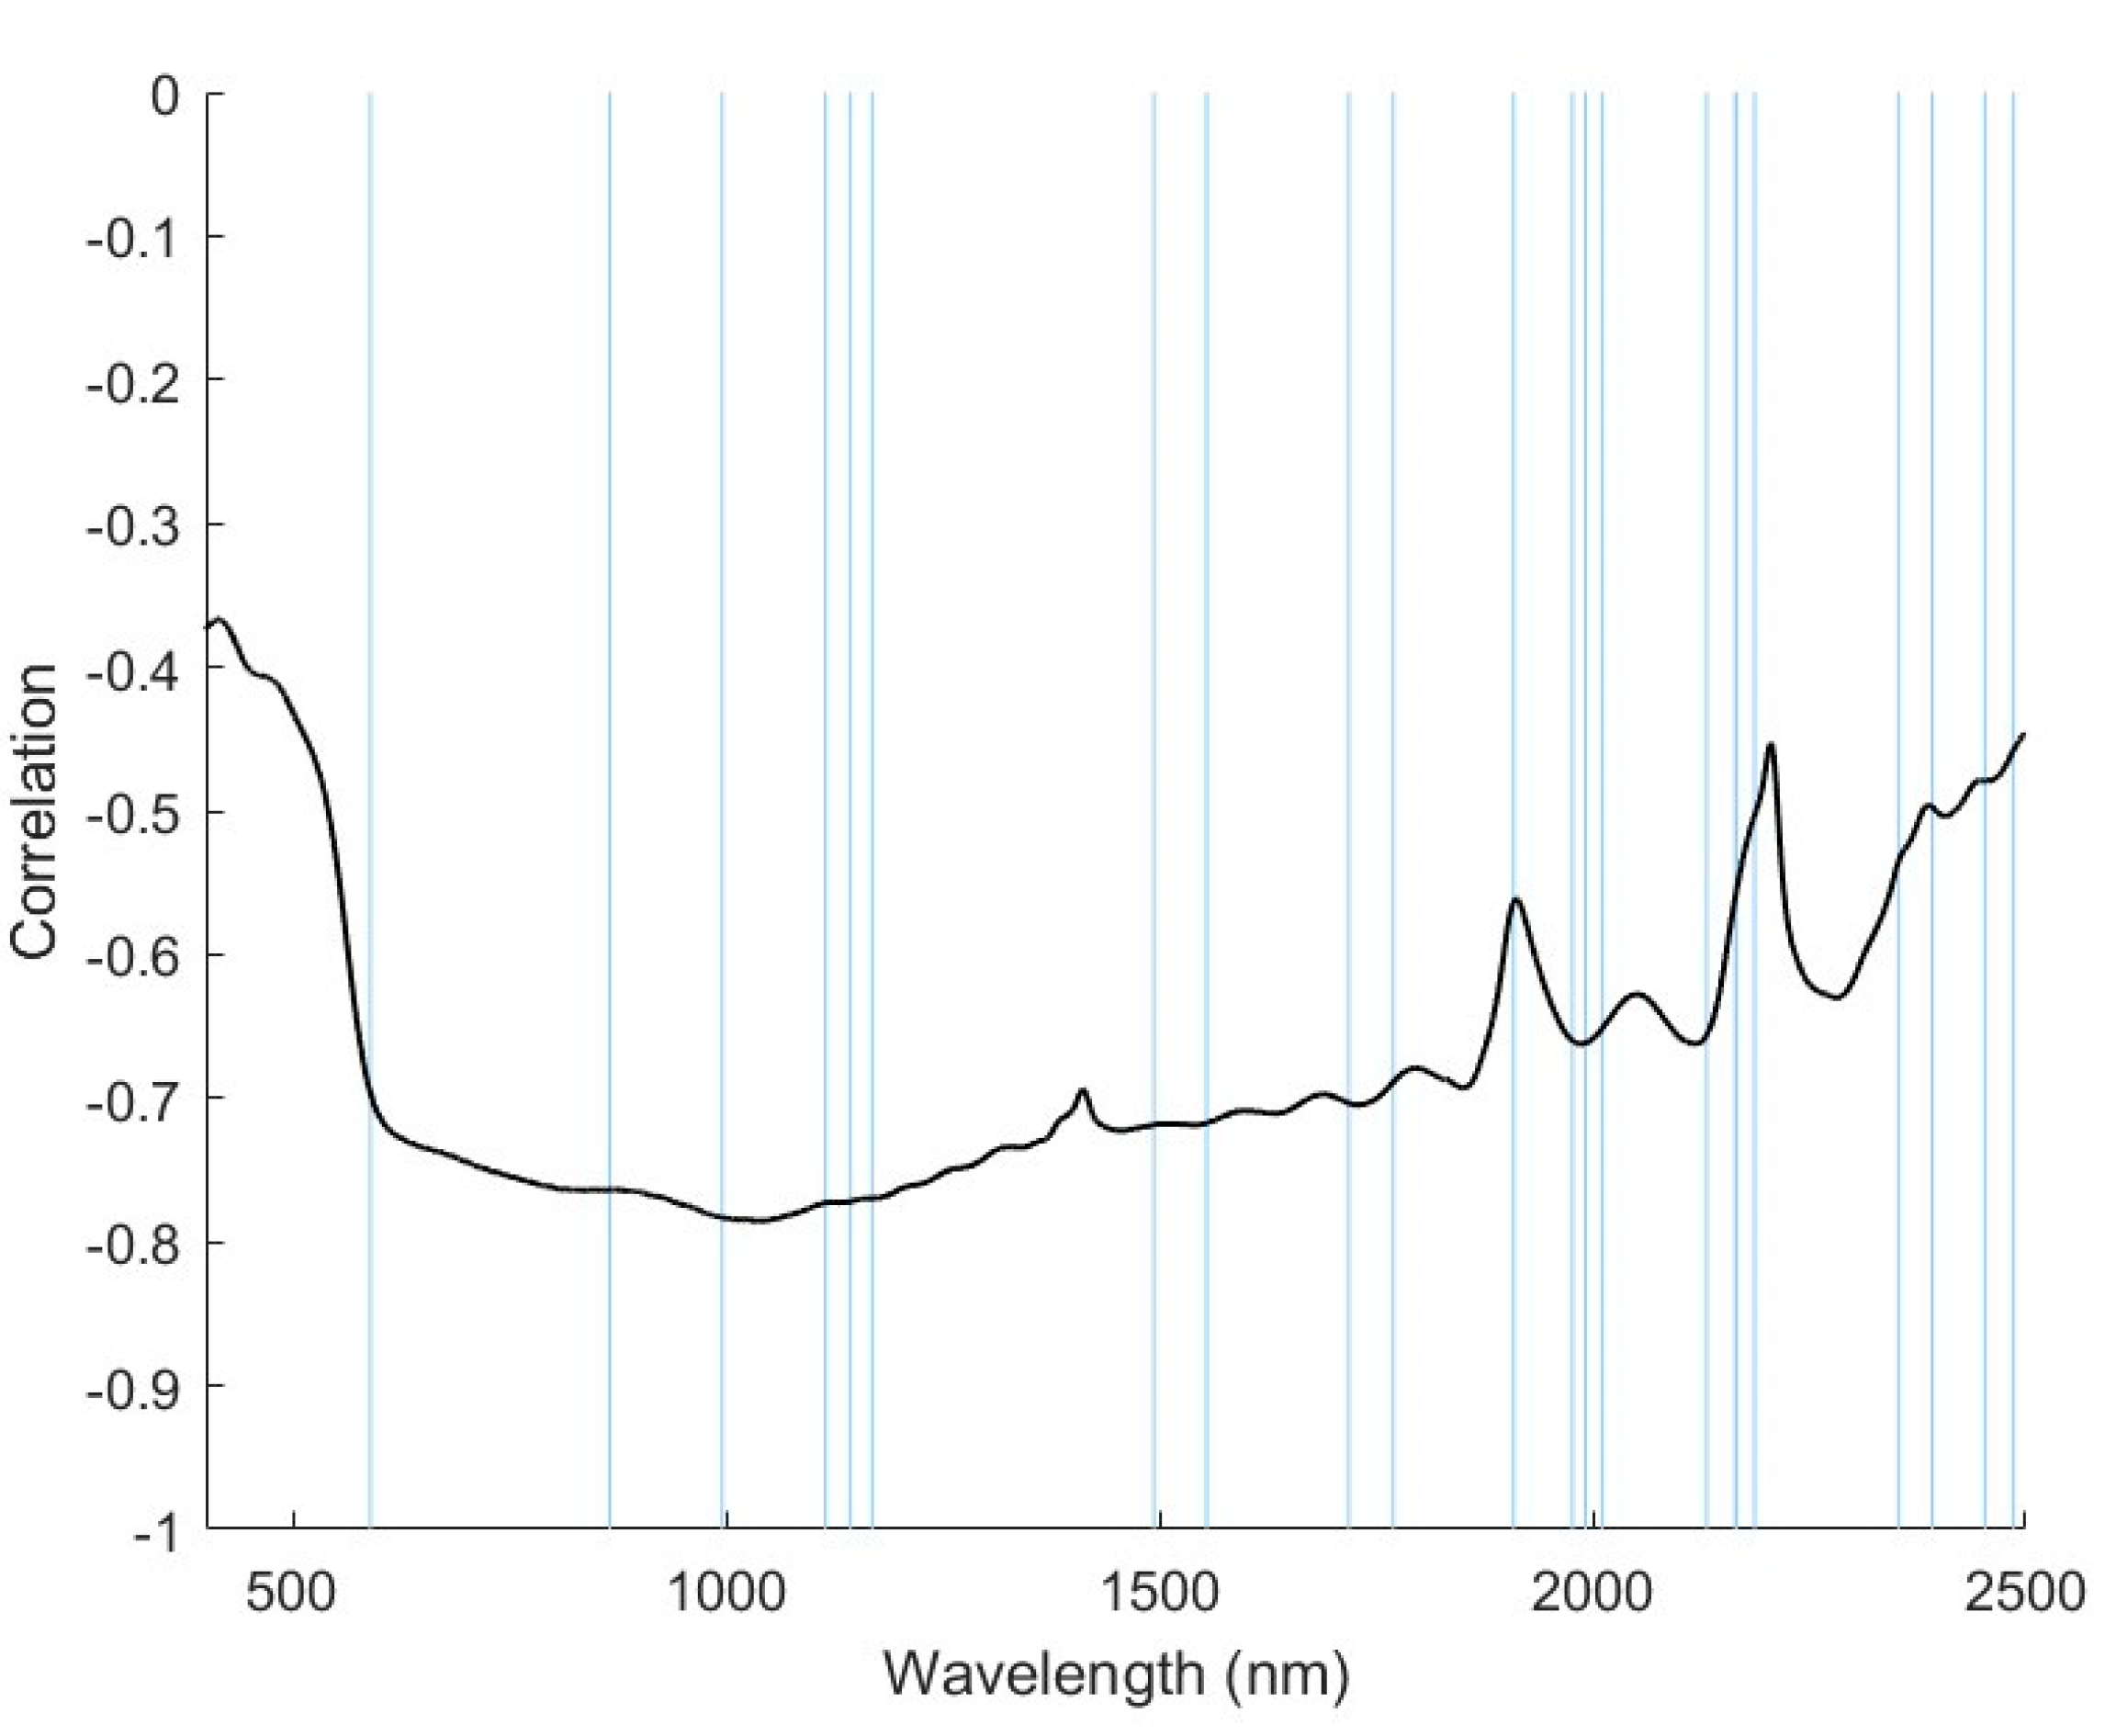

Table 1.
Statistical summary of measured heavy metal Pb content.
| Sample Size | Min* | Max* | Mean* | SD* | CV | Skew | Kurt |
| 68 | 34.6 | 9270 | 1555.93 | 2567.11 | 1.649885 | 2.06 | 3 |
* mg Pb/kg soil.
Disclaimer/Publisher’s Note: The statements, opinions and data contained in all publications are solely those of the individual author(s) and contributor(s) and not of MDPI and/or the editor(s). MDPI and/or the editor(s) disclaim responsibility for any injury to people or property resulting from any ideas, methods, instructions or products referred to in the content. |
© 2024 by the authors. Licensee MDPI, Basel, Switzerland. This article is an open access article distributed under the terms and conditions of the Creative Commons Attribution (CC BY) license (http://creativecommons.org/licenses/by/4.0/).
Copyright: This open access article is published under a Creative Commons CC BY 4.0 license, which permit the free download, distribution, and reuse, provided that the author and preprint are cited in any reuse.


